soil erosion risk assessment using gis and icona: a case
TRANSCRIPT

Gaziosmanpaşa Üniversitesi Ziraat Fakültesi Dergisi Journal of AgriculturalFaculty of GaziosmanpasaUniversity
http://ziraatdergi.gop.edu.tr/
Araştırma Makalesi/ResearchArticle
JAFAG
ISSN: 1300-2910
E-ISSN: 2147-8848
(2017) 34 (1), 64-75
doi:10.13002/jafag4208
Soil Erosion Risk Assessment Using GIS and ICONA: A Case Study in
Kahramanmaras, Turkey
Mahmut REIS1*
Hurem DUTAL1
Nursen BOLAT1
Gamze SAVACI2
1Kahramanmaras Sutcu Imam University, Faculty of Forestry, Department of Forestry Engineering, Kahramanmaras 2Kastamonu University,Faculty of Forestry, Department of Forestry Engineering, Kastamonu
* e-mail: [email protected]
Alındığı tarih (Received): 24.01.2017 Kabul tarihi (Accepted): 17.02.2017
Online Baskı tarihi (Printed Online): 05.04.2017 Yazılı baskı tarihi (Printed): 05.05.2017
Abstract: Turkey is one of the countries that have highest rate of soil erosion due to negative topographic
structure, soil and climate characteristics along with the problems caused by improper land use practices. Besides
other negative effects, soil erosion is the source of sediment that fills reservoirs and thus shortens economic life of
dams. Therefore, this study has been carried out on Haman river basin which deposits sediments into Menzelet
Dam Lake located in north of Kahramanmaras. In this study, ICONA (Institute for the COnservation of the
NAture) model was used to assess soil erosion risk using Geographic Information System (GIS) and Remote
Sensing (RS) techniques. ICONA erosion risk map has been derived by overlaying soil erodibility and soil
conservation maps. NDVI (Normalized Difference Vegetation Index) values were generated from Landsat 5 TM
satellite imagery. According to the results, it was determined that 53.67 % of the study area has very high risk,
38.1 % of the area has high risk, 6.94 % of the area has medium risk, 1.17 % of the area has low risk, and 0.12 %
of the area has very low risk of soil erosion.
Keywords: ICONA, land use, NDVI, soil erosion, topography
ICONA ve GIS Kullanılarak Erozyon Riskinin Değerlendirilmesi: Kahramanmaraş Örneği, Türkiye
Öz: Türkiye, hatalı arazi kullanımından kaynaklanan sorunlarla birlikte olumsuz topoğrafik yapı, toprak ve iklim özellikleri nedeniyle dünyada en çok toprak erozyonuna uğrayan ülkelerden biridir. Toprak erozyonu oluşturduğu pek çok olumsuz sonuçların yanında özellikle barajların dolmasına ve ekonomik ömürlerini öngörülenden daha kısa sürede tamamlamalarına neden olmaktadır. Bu nedenle, araştırma Kahramanmaraş ilinin kuzeyinde yer alan ve Menzelet Barajına sediment taşıyan Haman Deresi yağış havzasında gerçekleştirilmiştir. Araştırmada uzaktan algılama ve coğrafi bilgi sitemleri teknikleri kullanılarak ICONA (Institute for the COnservation of the NAture) modeli ile erozyon risk analizi yapılmıştır. ICONA Erozyon Risk Haritası, Toprak Erodibilitesi ile Toprak Koruma
Haritalarının birbirleriyle çakıştırılması sonucu elde edilmiştir. NDVI (Normalized Difference Vegetation Index) değerleri Landsat 5 TM uydu görüntüsü kullanılarak elde edilmiştir. Araştırmadan elde edilen sonuçlara göre, alanın % 53.67’sinin çok yüksek, % 38.1’inin yüksek, % 6.94’nün orta, % 1.17’sinin düşük ve % 0.12’sinin çok düşük erozyon riskine sahip olduğu tespit edilmiştir.
Anahtar kelimeler: ICONA, arazi kullanımı, NDVI, toprak erozyonu, topoğrafya
1. Introduction
The control of soil erosion processes depends
on appropriate land use and management
planning. The soil erosion tends to alter physical,
chemical and biological properties of soil, due to
undesirably interaction among climate, soil,
topography, and vegetation (Pla 1997). Besides,
the sediment yield due to erosion results in
environmental impacts on water quality and
aquatic habitat (Akay 2005; Akay et al. 2008). In
Turkey, the average altitude is approximately
1250 m and about 60 % of the total land has a
slope over 12 %. Because of the topographic
conditions, soil erosion is one of the most
64

REIS ve ARK. / JAFAG (2017) 34 (1), 64-75
important environmental problems in Turkey
since approximately 73% of the land is subject to
severe and very severe soil erosion (Doğan 1998). In Turkey, over 345 million tons of sediment was
carried into the rivers, lakes, dams, and seas per
year (GDREC 2008). Dams that have a life-span
of 100 years approximately due to soil erosion are
usually filled with sediments before the end of
their planned economical life. As an example,
Çubuk I Dam lost 70 % of its storage capacity in 54 years, Seyhan Dam lost 40 % of its storage
capacity in 37 years, and Kartalkaya Dam lost 30
% of its storage capacity in 25 years due to
sediment accumulation in the reservoirs. The
economic life of these dams will be around 50-60
years as long as current erosion and sedimentation
process continues. Sustainable management and
conservation activities are crucial in dam
watersheds for natural resources and national
economy.
According to the ICONA report (1991),
approximately 20% of the agricultural lands of
European Union (EU) countries had high or very
high water erosion vulnerability. It is estimated
that 51% of the agricultural areas of EU countries
will face serious human-induced land degradation
and increasing soil erosion problems by 2050
based on prevailing soil erosion rates. Fast and
reliable sediment yield and runoff prediction in
Turkish watersheds are very important in terms of
planning and implementation of soil conservation
techniques (Yuksel et al. 2007a). There have been
several models developed to estimate soil loss,
runoff and erosion risks such as RUSLE (Revised
Universal Soil Loss Equation), EPIC (Erosion
Productivity Impact Calculator), ANSWERS
(Areal Nonpoint Source Watershed Environment
Response Simulation), ICONA (Institute for the
COnservation of the NAture), WEPP (Water
Erosion Prediction Project), and CORINE
(COoRdination of INformation on the
Environmet)
(Wischmeier 1976; Beasley et al. 1980; Bayramin
et al. 2003; Flanagan et al. 1995; CORINE 1992).
USLE (Universal Soil Loss Equation) is one of
widely used mathematical models that estimate
the amount of soil loss by erosion. The equation
was developed by Wischmeier and his friends in
1971 to be used in agricultural areas and then
construction sites and rangelands with forests
were included to the model in 1971 and 1972
respectively. Afterwards, the model were revised
in 1987 and renamed as RUSLE (Lal 1994).
EPIC (Erosion Productivity Impact Calculator)
model, on the other hand, determines the effects
of soil and water resource management on soil
fertility and soil erosion. This model requires
some parameters such as weather condition,
nutrient cycle, plant growth, soil temperature, and
environment control of plants during simulation
(Yuksel et al. 2007b).
ANSWERS (Areal Nonpoint Source
Watershed Environment Response Simulation) is
a hydrological model which is generally used to
determine the method to be applied in order to
minimize runoff and sediment yield in agricultural
fields (Beasley et al. 1980).
CORINE (COoRdination of INformation on
the Environment) is a method employed to
determine soil erosion risk (CORINE 1992)
designed based on USLE model (Wischmeier
1976) and developed by European Union (EU).
WEPP (Water Erosion Predicting Project)
erosion model is a continuous simulation
computer program that calculates runoff, soil loss
and sediment deposition on a daily basis. WEPP
model is capable of predicting spatial and
temporal distributions of soil loss in watersheds or
hillslopes. Thus, in terms of application, this
model can be quite useful to determine areas
where soil conservation measures are needed
(Okatan et al. 2007).
ICONA (Institute for COnservation of the
NAture), developed by Spanish Ministry of
Environment (DGCONA), is a soil erosion risk
assessment model (Jordan 2000). The soil erosion
risk assessment can be determined by using land
use/land cover, NDVI, slope, and geologic maps
of the area (Bayramin et al. 2003). Haman Creek
Basin is located in the eastern part of Menzelet
Dam and also forms the downstream of it. As a
result of erosion, soil and sediment are transported
and deposited to the Menzelet Dam via Haman
Creek. This sediment deposition shortens the
65

REIS ve ARK. / JAFAG (2017) 34 (1), 64-75
economic lifespan of the dam due to this high
inflow of sediment.
The main purpose of this study was to
determine the soil erosion risk in Haman
watershed located in the Mediterranean city of
Kahramanmaras in Turkey, by using ICONA
methodology (ICONA 1997). During the analysis
process, the impact of slope, lithofacies, land use
and vegetation cover factors on erosion were
analyzed separately, in order to evaluate the
potential soil erosion risk in the area. The input
files for lithofacies, slope, land use and vegetation
cover were generated as digital data layers using
GIS and RS tools and they are integrated with the
ICONA model to produce erosion risk maps.
2. Material and Methods
2.1. Study Area
Study area is located within the Latitudes and
Longitudes of 37° 40' 50'' - 37° 39' 15'' N and 36° 53' 56'' - 36° 56' 46'' E respectively and 40 km away from Kahramanmaras City Center and
covers an area of 1216.34 ha (Figure 1).
Figure 1: Topographic map and location of the study area over satellite imagery
Şekil 1. Çalışma alanın topografik haritası ve uydu görüntüsü üzerindeki konumu
The altitude of the study area ranges between
600 m and 1870 m and slope changes from 0 % to
34 %. Annual precipitation is above 700 mm and
annual mean, maximum and minimum
temperatures are 16.7 C, 45.2 C and -9.6 C
respectively (DMI 2010). The study area is
dominated by forest ecosystems, bare land,
shrubs, grassland and agricultural land.
C2B3’s2a’ equation was found by Thornthwaite method (Thornthwaite, 1948). According to this,
the study area is classified as semi-humid medium
temperate climate zone which results in large
deficit of water throughout summer. Active
surface erosion is observed in the study area.
In this study, DEM, satellite imagery and
digital geologic maps are employed in order to
determine erosion risk maps using ICONA model.
1/25000 scale digital geologic maps developed by
General Directorate of Mineral Research and
Exploration in Turkey were used to determine
geological characteristics of the study area. Slope
map of the study area was created from DEM in
ArcGIS. Landsat 5 TM satellite imagery acquired
in 20 August 2011 was used to determine
vegetation characteristics of the area with Raster
Calculator tool in ArcGIS. Furthermore, land
use/land cover map of the study area was
generated from satellite imagery by employing
supervised classification technique in Erdas
Imagine 9.1.
The predictive phase of the study mainly
consists of data processing with 7 different steps
as illustrated in Figure 2 below.
Step 1) Generating slope map: Slope map was
produced from DEM and categorized into 5
classes (1- Flat to gentle slopes (0-3 %), 2-
Moderate slope (3-12 %), 3- Steep slope (12-
20%), 4- Very steep (20-35%), 5- Extreme slope
(>35%)).
66

REIS ve ARK. / JAFAG (2017) 34 (1), 64-75
Figure 2. Flow diagram of the ICONA model
Şekil 2. ICONA modelinin akış diyagramı Step 2) Preparing lithofacies map: Lithofacies
layer was generated with the help of digital
geologic maps and categorized into 5 groups
based on geologic formations as shown in Table
1, but since there are no materials of b and c in the
study area, materials a, d and e were used.
Table 1. Lithofacies classes
Çizelge 1. Litofasiyes sınıfları Lithofacies classes Type of material
(a) Non-weathered compact rock, strongly cemented conglomerates or soils, crusts, hard
pans outcrops (massive limestone, highly stony soils, igneous or eruptive rocks,
locally crusted soils).
(b) Fractured and/or medium weathered cohesive rocks or soils.
(c) Slightly to medium compacted sedimentary rocks (slates, schists, compacted marls,
etc.) and/or soils.
(d) Soft/low-resistant or strongly/deeply weathered rocks (marls, gypsum, clayey slates,
etc.) and/or soils.
(e) Loose, non-cohesive sediments/soils and detritic materials.
Step 3) Creating erodibility map: Erodibility
map was created by overlaying the slope map on
top of the lithofacies map. The polygons resulting
from the overlaying of the two reference maps
were classified according to the following matrix
shown in Table 2. Erodibility map was classified
into 5 groups (1. Low (EN), 2. Moderate (EB), 3.
Medium (EM), 4. High (EA), 5. Extreme (EX).
Steps 4 and 5) Generating land use/land cover
and vegetation cover maps: In steps 4 and 5
NDVI calculated from atmospherically and
topographically corrected satellite imageries was
employed in order to determine vegetation
structure and closure. NDVI is formulated as
follows:
NDVI= (Band 4 – Band 3) / (Band 4 + Band 3)
(Erdas 2002). In the equation above, Band 4 and
Band 3 represent NIR and RED bands
respectively. Landsat image was rectified using
1/25000 scaled topographic image nearest
neighbor technique with UTM European Datum
1950 (Türker and Gacemer 2004). The
rectification error was found to be 0.35.
Geometric correction is done because of the
SLOPE LITHOFACIES LAND USE
TYPES
VEGETATION
COVER
SOIL ERODIBILITY SOIL PROTECTION
ICONA
MAP
67

REIS ve ARK. / JAFAG (2017) 34 (1), 64-75
difference image rotation occurred due to
elevation (Baydemir 2008). The image was
classified using supervised classification
technique in Erdas Imagine 9.1. Land use is
categorized into six classes according to ICONA
method: 1) Dry farming (herbaceous),
2) Ligneous crops (olive, almonds, fruit trees, and
vineyards), 3) Irrigation, 4) Forest, 5) Shrub land,
6) Rangeland, but it was determined that there
was no irrigated agricultural land and shrub land
(class 3 and class 5) in the study area.
Table 2. Slope and lithofacies matrix
Çizelge 2. Eğim ve litofasiyes matrisi
Slope Classes Lithofacies classes
1(a) 2(b) 3(c) 4(d) 5(e)
1. 1(EN) 1(EN) 1(EN) 1(EN) 2(EB)
2. 1(EN) 1(EN) 2(EB) 3(EM) 3(EM)
3. 2(EB) 2(EB) 3(EM) 4(EA) 4(EA)
4. 3(EM) 3(EM) 4(EA) 5(EX) 5(EX)
5. 4(EA) 4(EA) 5(EX) 5(EX) 5(EX)
Vegetation cover was also classified into four
groups: 1) 25 % or less, 2) 25 %-50 %, 3) 50 % -
75 % and 4) 75 % or more but it was found that
first two groups of vegetation cover were found in
the study area belongs to first two groups.
Step 6) Creating soil protection map: In this
step, soil protection map was retrieved by
overlaying vegetation cover map and land use
map using ArcGIS 10. By using this map, land
use and vegetation cover matrix was created as
illustrated in Table 3 below.
Table 3. Land use and vegetation cover matrix
Çizelge 3.Arazi kullanım ve bitki örtüsü matrisi
Soil protection map was categorized into five
groups: 1) Very high (MA), 2) High (A), 3)
Medium (M), 4) Low (B), 5) Very low (MB).
Step 7) Creating ICONA erosion risk
evaluation map: The ICONA erosion risk
evaluation map was created by overlaying soil
erodibility map and soil protection map and then
it was classified into 5 groups according to
erosion risk status: 1) Very low, 2) Low, 3)
Moderate, 4) High, 5) Very high.
Finally, erosion status matrix of the study area
was created by using erodibility map and soil
protection map as shown in Table 4 below.
Land Use Vegetation Cover
1 2 3 4
1 5(MB) 5(MB) 4(B) 4(B)
2 5(MB) 5(MB) 4(B) 3(M)
3 3(M) 2(A) 1(MA) 1(MA)
4 4(B) 3(M) 2(A) 1(MA)
5 5(MB) 4(B) 3(M) 2(A)
6 5(MB) 4(B) 3(M) 2(A)
68

REIS ve ARK. / JAFAG (2017) 34 (1), 64-75
Table 4. Erosion status matrix
Çizelge 4. Erozyon durum matrisi
Level of soil Level of
erodibility
Level of soil Level of erodibility
1(EN) 2(EB) 3(EM) 4(EA) 5(EX)
1(MA) 1 1 1 2 2
2(A) 1 1 2 3 4
3(M) 1 2 3 4 4
4(B) 2 3 3 5 5
5(MB) 2 3 4 5 5
3. Results and Discussion
Slope, one of topographic elements, plays an
important role in watershed management not only
for hydrologically but also for water erosion.
Mean slope of watershed is a key parameter for
runoff and peak and shape of hydrograph that
belongs to stream flow. According to the slope
map, which was created from DEM, 88.17 % of
the study area contains very steep and extreme
slope classes (See Figure 3 and Table 5).
This rough topography increases erosion and
sedimentation problems altogether. The
relationship between erosion intensity and slope
differs under diverse precipitation characteristics
and land use conditions.
Figure 3. Slope map of the study area
Şekil 3. Çalışma alanın eğim haritası
Table 5. Slope classes by areal percentage in the study area
Çizelge 5. Çalışma alanının erozyon sınıfları alansal dağılımı Slope Classes Area(ha) Percent (%)
Flat and gentle 0-3 % 15.00 1.23
Moderate 3-12 % 29.56 2.43
Steep 12- 20% 99.34 8.17
Very Steep 20-35 % 478.86 39.36
Extreme > 35 % 593.58 48.81
TOTAL 1216.34 100
For example, it was determined that when
slope increases from 5 % to 10 %, erosion amount
increases 3 times but when slope goes up to 15 %,
erosion increases 5 times (Balcı and Ökten 1987). The steep ground slope potentially accelerates the
surface runoff which dramatically increases
erosion (Lal 1994). Previous studies indicated that
the erosion intensity may increase by 2.3 to 3.5
times when slope increases from 8 % to 45 %
under the same percentage of vegetation cover
(Dinzhong 1996). As Millward and Mersey
(1999) explained, soil erosion has accelerated due
to limited land resources for agricultural practices,
and the more continuous use of steeper lands for
agriculture.
Due to intense and incorrect land use in the
watershed, vegetation cover was destroyed
tremendously and in the meantime soils became
extremely vulnerable to erosion.
Lithofacies map was produced with the help of
geological map of the study area as illustrated in
Figure 4.
69

REIS ve ARK. / JAFAG (2017) 34 (1), 64-75
It shows physical properties such as color,
texture, and sedimentary structure of rocks. More
than half of the study area consists of loose, non-
cohasive sediment and clastic rocks. As well
known, this sediment and bedrockeffect the
magnitude of erosion (See Table 6).
Ozel et al. (1999) investigated the erosion risk
status of Dalaman Basin by using ICONA erosion
model (1997) in Turkey. Figure 4. Lithofacies map of the study area
Şekil 4. Çalışma alanının Litofasiyes haritası
Table 6. The status of Lithofacies classes of the study area
Çizelge 6. Çalışma alanının litofasiyes sınıfları durumu
Litofasiyes Classes Area (ha) Percent (%)
(a) Non weathered compact rock, strongly cemented
conglomerates or soil, crusts, hard pans outcrops
(massive limestone, highly stony soils, igneous or
eruptive rocks, locally crusted soils).
421.43 34.64
(d) Soft/low resistant or strongly/deeply weathered rocks (
marls, gypsum, clayey slates, etc.) and/or soils. 162.38 13.36
(e) Loose, non-cohesive sediments/soils and detritic
materials 632.53 52.00
TOTAL 1216,34 100
According to the lithopedological properties,
the study area consists of loose and sedimentary
rocks that are sensitive to soil erosion and have a
low resistance to weathering. They reported that
the study area has a 17 % low, 23 % moderate and
60 % high level of soil erosion risk.
The soil erodibilty map was produced by
overlaying slope and lithofacies maps as
illustrated in Figure 5 below.
Results indicate that stream bed and flat areas
have low and very low soil erodibility values in
the study area. 17.89 % of the study area has very
low, low and moderate soil erodibility risk while
the rest (82.11 %) has high and very high level of
soil erodibilty risk as shown in Table 7 below.
Erodibility matrix that was created with slope
and lithofacies is illustrated in Table 8. Due to the
fact that more than half of the study area has
slightly compact sedimentary rocks, the study
area is vulnerable to soil erosion.
Figure 5. Erodibility map of study area
Şekil 5. Çalışma alanının erodobilite haritası
70

REIS ve ARK. / JAFAG (2017) 34 (1), 64-75
Table 7. The status of soil erodibility classes in the study area
Çizelge 7. Çalışma alanının toprak erodobilite sınıfları durumu
An accuracy assessment has been carried out
to compare classified land use and vegetation
cover that were retrieved from Landsat 5 TM
satellite imagery with the reference data.
For this purpose, 21 points have been determined
by using random sample method.
According to classification accuracy, overall
accuracy, user’s accuracy, producer’s accuracy and kappa were found to be 85.71 %, 82.95 %,
80.83 %, and 0.79 respectively. Results indicate
that forest has the largest area coverage with
47.37 %, on the other hand, orchards occupy the
least area with 2.47 % in the study area as
illustrated in Figure 6 and Table 9 below.
Table 8. Erodobilite matriks
Çizelge 8. Erodobilite matrisi
Table 9. Analysis of land use classes in the study area
Çizelge 9. Çalışma alanının arazi kullanım dağılımı
Berney et al. (1997) and Ahlcrona (1988)
stated the importance of vegetation cover and its
effect on controlling erosion. NDVI layer was
classified into two groups: less than 25 % and
between 25 % and 50 % in the study area and
vegetation cover was derived from that as shown
in Table 10.
By looking at this table, it can be seen that
more than half of the study area has a canopy
closure that is less than 25 %. Karagül (1994) has
also investigated erosion tendencies under
different landuse soils and found that land use had
serious effects on soil erosion.
The reliable land cover data is very important
in soil erosion models (Oduro 1996). Therefore,
vegetation cover has a crucial importance for the
erosion resistance of surface soil (Dingzhong
1996; Tayebi et al. 2016).
Soil Erodobility Classes Area (ha) Percent (%)
Low (EN) 12.35 1.01
Moderate (EB) 36.33 2.99
Medium (EM) 168.97 13.89
High (EA) 304.84 25.07
Extreme (EX) 693.85 57.04
TOTAL 1216,34 100
Slope
Class
Lithofacies Class
1(a) 2(b) 3(c) 4(d) 5(e)
1 1(EN) - - 1(EN) 2(EB)
2 1(EN) - - 3(EM) 3(EM)
3 2(EB) - - 4(EA) 4(EA)
4 3(EM) - - 5(EX) 5(EX)
5 4(EA) - - 5(EX) 5(EX)
Land Use Classes Area
(ha)
Percent
(%)
Dry Farming 380 31.24
Ligneous Crops ( olive, almonds, fruit, trees, vineyards) 30 2.47
Forest 576.24 47.37
Range, sparse shrub 230.1 18.92
TOTAL 1216.34 100
71
REIS ve ARK. / JAFAG (2017) 34 (1), 64-75
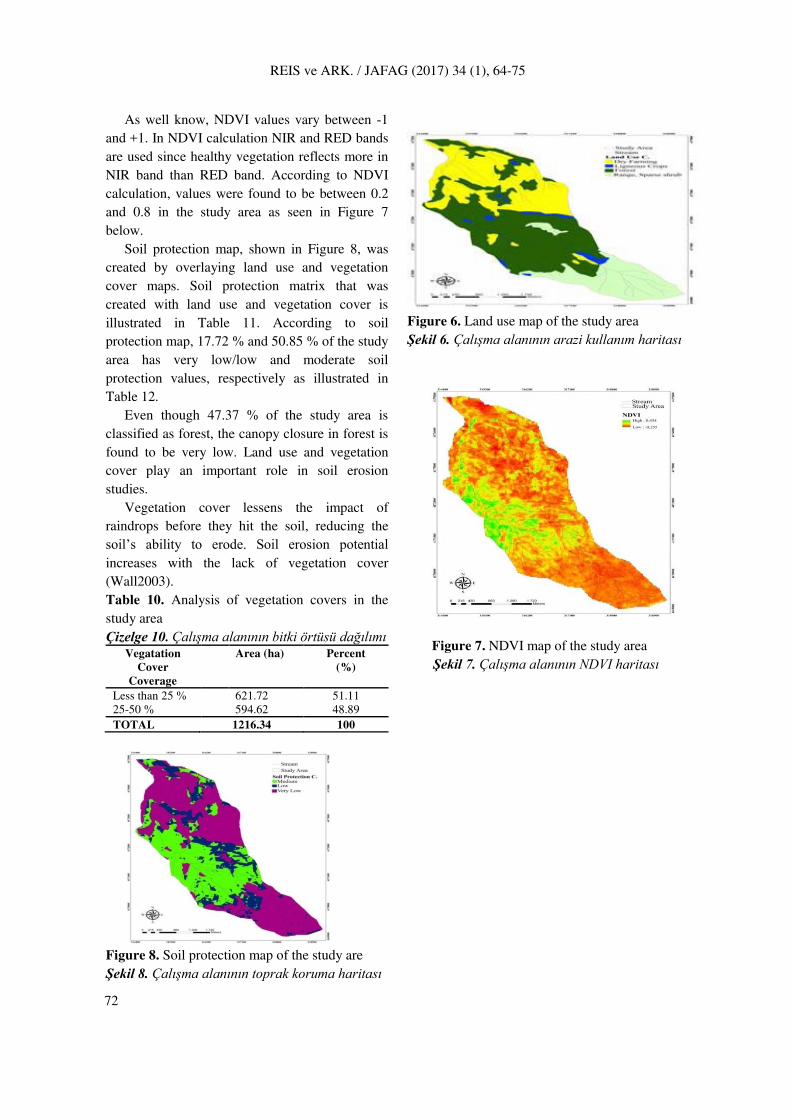
As well know, NDVI values vary between -1
and +1. In NDVI calculation NIR and RED bands
are used since healthy vegetation reflects more in
NIR band than RED band. According to NDVI
calculation, values were found to be between 0.2
and 0.8 in the study area as seen in Figure 7
below.
Soil protection map, shown in Figure 8, was
created by overlaying land use and vegetation
cover maps. Soil protection matrix that was
created with land use and vegetation cover is
illustrated in Table 11. According to soil
protection map, 17.72 % and 50.85 % of the study
area has very low/low and moderate soil
protection values, respectively as illustrated in
Table 12.
Even though 47.37 % of the study area is
classified as forest, the canopy closure in forest is
found to be very low. Land use and vegetation
cover play an important role in soil erosion
studies.
Vegetation cover lessens the impact of
raindrops before they hit the soil, reducing the
soil’s ability to erode. Soil erosion potential increases with the lack of vegetation cover
(Wall2003).
Table 10. Analysis of vegetation covers in the
study area
Çizelge 10. Çalışma alanının bitki örtüsü dağılımı Vegatation
Cover
Coverage
Area (ha) Percent
(%)
Less than 25 % 621.72 51.11
25-50 % 594.62 48.89
TOTAL 1216.34 100
Figure 6. Land use map of the study area
Şekil 6. Çalışma alanının arazi kullanım haritası
Figure 7. NDVI map of the study area
Şekil 7. Çalışma alanının NDVI haritası
Figure 8. Soil protection map of the study are
Şekil 8. Çalışma alanının toprak koruma haritası
72

REIS ve ARK. / JAFAG (2017) 34 (1), 64-75
Table 11. Soil protection matrix
Çizelge 11. Toprak koruma matrisi
Table 12. Soil protection values of the study area
Çizelge 12. Çalışma alanının toprak koruma değerlerinin alansal dağılımı
Having vegetation cover of 25 % or less in the
study area increases the risk of erosion. The
current ICONA erosion risk map was created by
overlaying soil erodibility and soil protection
maps as shown in Figure 9 and the matrix used
was also illustrated in Table 13.
According to these results, it was found that
91.77 % of the study area has very high and high
erosion risk, while 1.29 % of the study area was
found to be very low erosion risk. The
susceptibility of Mediterranean ecosystems to soil
erosion was indicated by Berney et al. (1997).
Similar views stating that semi-arid regions have
higher erosion problems were also presented by
the ICONA report (1991) and RIVM's data
(2000).
Table 13. ICONA erosion matrix
Çizelge 13. ICONA erozyon risk matrisi
Land Use Vegetation Cover
1 2 3 4
1(AH) 5(MB) 5(MB) - -
2(AA) 5(MB) 5(MB) - -
3(AR) - - - -
4(FA) 4(B) 3(M) - -
5(FM) - - -
6(FX) 5(MB) 4(B) - -
Soil Protection Classes Area (ha) Percent (%)
Medium (M) 382.32 31.43
Low (B) 215.55 17.72
Very Low (MB) 618.47 50.85
TOTAL 1216.34 100
Level of Soil
Protection
Level of Erodibility
1(EN) 2(EB) 3(EM) 4(EA) 5(EX)
1(MA) - - - - -
2(A) - - - -
3(M) 1 2 3 4 4
4(B) 2 3 3 5 5
5(MB) 2 3 4 5 5
73

REIS ve ARK. / JAFAG (2017) 34 (1), 64-75
Figure 9. ICONA Erosion Risk map of the study area
Şekil 9. Çalışma alanının ICONA erozyon risk haritası
4. Conclusions
In this study, the high risk of erosion appears
to be the most in highly sloped, rough areas,
rangelands and bare lands. Due to the overgrazing
of rangelands, soils are exposed to erosion more
often thus rangelands must be managed carefully.
Soil erosion is generally influenced by
a considerable number of factors including
vegetation cover, land use, bedrock, topography,
and climate.
Fertile soils in the study area have been carried
by streams to the Menzelet dam. Thus, areas that
are steep, rough and located near the streams
possess high risk for erosion due to sediment
deposition right from top to bottom. As a result,
ICONA model that was developed using GIS and
RS techniques is found to be very effective and
useful to derive erosion risk maps. Model
provides the information of areas to manage the
high risk of erosion potential. Therefore,
watershed managers can locate the problematic
areas in the watershed and implement necessary
precaution measures to minimize or prevent
erosion.
In the higher parts of the watershed, VII. Class
lands that are allocated for forest and rangeland
should not be used for agricultural purposes and
soil loss caused by erosion should be prevented by
afforesting these lands. Since the study area is
located in dam watershed, land classification must
be followed to prevent economic lifespan of the
dam. Furthermore, afforestation should be
undertaken in the forest areas as soon as possible
but priority should be given to broadleaf species.
Because broadleaf trees lose their leaves in
winter, water loss declines to minimum through
interception and water consumption drops to
almost zero through transpiration. In addition to
afforestation efforts, herbaceous plants, which
protect soil with their roots may also be used in
the study area.
References Ahlcrona E (1988). The impact of climate on land
transformation in central Sudan. Unpublished Ph.D.
thesis. Lund University, Lund, Sweden. In: Quantative
representation of land-surface morphology from
digital elevation models (editors: Garry, P. K. &
Harrison, A.R., 1990). Proceedings of 4th
74

REIS ve ARK. / JAFAG (2017) 34 (1), 64-75
International conference on spatial data handling, July
23-27, Zurich, Switzerland, pp: 273-282.
Akay AE, Erdas O, Reis M, Yuksel A (2008). Estimating
sediment yield from a forest road network by using a
sediment prediction model and GIS techniques.
Building and Environment. 43:687-695.
Akay AE, Sessions J (2005).Applying the decision support
system, TRACER, to forest road design, Western.
Journal of Applied Forestry. 20:184-191.
Balcı N, Ökten Y(1987). Sel Kontrolü, KTÜ Basımevi, Trabzon.
Bayramin I(1998). Integrating digital terrain and satellite
image data with soils data for small scale mapping of
soils. Ph.D. Thesis. Purdue University, p:121.
BaydemirAH(2008). Coğrafi bilgi sistemleri ve uzaktan algılama teknikleri yardımıyla toprak haritalarının güncelleştirilmesi. Kahramanmaraş Sütçü İmam Üniversitesi Fen Bilimleri Enstitüsü. Toprak Anabilim Dalı. Kahramanmaraş.
Bayramin I, Dengiz O, Baskan O, Parlak M (2003).Soil
erosion risk assessment with ICONA model; case
study: Beypazarı Area.Turkish Journal of Agriculture
and Forestry.27:105-116.
Beasley DB, Huggings LF, Monke EJ (1980).
ANSWERS: a model for watershed planning, trans. of
the ASAE. 23:938-944.
Berney OF, Gallart JC, Griesbach LR, Serrano JDR,
Sinago and Giordano A(1997). Guidelines for
mapping and measurement of rainfall-induced erosion
processes in the Mediterranean coastal areas. Priority
Actions Programme, Regional Activity Centre, Split,
Croatia.
CORINE (1992). Soil erosion risk and important land
resources in the southeastern regions.
Dingzhong D, Ying T(1996). Soil erosion and sediment
yield in the upper Yangtze River Basin, erosion and
sediment yield: global and regional respectives, IAHS
Publication, Exeter.
DMİ(2010). Devlet Meteoroloji İşleri Gn. Md., K.Maraş Meteoroloji İl Müdürlüğü, K.Maraş meteoroloji istasyonu verileri, 1975-2010. Kahramanmaraş.
Dogan O(1998).Sustainable policies for soil resource
management in Turkey, GDRS Research Institute,
Ankara.
Erdas(2002). Erdas imagine temel yazılım kitabı, s:1-200.
Flanagan DC, Nearing MA(1995). USDA-ARS national
soil erosion research laboratory, NSERL Report No.
10, West Lafayette.
GDREC(2008).General directorate of reforestation and
erosion control, Ankara.
Jordan A, Martınez-Zavala L, Belleinfante N. 2000.
Assesment of the erosion risk in humid mediterranean
areas workshop on technologies for and management
of erosion and desertification control in the
Mediterranean region, priority actions programme,
UNEP, Malta. 1-13.
ICONA(1991). Plan nacional de restauracion hidrologico-
forestal para el control de la erosion. ministrio de
agricultura, Pescay Alimentacion, Madrid.
ICONA(1997). Guidelines for mapping and measurement
of rainfall-induced erosion proceses in the
Mediterranean coastal areas. Priority Action
Programme Regional Activity Centre. ISBN:953-
6429-08-X. Split,Croatia. http://www.pap-
thecoastcentre.org/pdfs/SoilErosioneng.pdf
Karagül R(1994). Trabzon Söğütlüdere havzasında farklı arazi kullanım şartları altındaki toprakların bazı özellikleri ile erozyon eğiliminin araştırılması. Doktora Tezi, Trabzon, 165s (yayınlanmamış). Karadeniz Teknik Üniversitesi Orman Fakültesi. Trabzon.
Lal R(1994). Soil erosion research methods (ed.). St Lucie
Press. Delray Beach FL 33483 USA.
Millward AA and Mersey JE(1999). Adapting the RUSLE
to model soil erosion potential in a mountainous
tropical watershed. Catena.
Oduro-Afriyie K (1996).Rainfall erosivity map for Ghana.
Geoderma. 74:161-166.
Okatan A, Aydın M, Urhan OŞ (2007). Coğrafi bilgi sistemlerinin havza amenajmanında kullanımı ve önemi. TMMOB harita ve kadastro mühendisleri odası ulusal coğrafi bilgi sistemleri kongresi 30 Ekim –02
Kasım 2007. KTÜ, Trabzon. Ozel ME, Dogan O, Kucukcakar N and Yıldırım H(1999).
Dalaman havzası erozyon haritalama pilot projesi, TEMA. Istanbul.
Pla IS(1997). Soil water balance model for monitoring soil
erosion processes and effects on steep lands in the
tropics. Soil Technology, 11:17-30.
RIVM(2000). Technical report on soil degradation. RIVM
report 481505018. Bilthoven.
Tayebi M, Tayebi MH, Sameni A(2016). Soil erosion risk
assessment using GIS and CORINE model: a case
study from western Shiraz, Iran. Archives of
Agronomy and Soil Science. 1476-3567.
Thornthwaite CW (1948). An approach to a rational
classification of climate. Geographical Review 38: 55-
94.
Türker M, Gacemer ÖA(2004). Geometric correction accuracy of IRS-1D PAN imagery using topographic
map versus GPS control points. International Journal
of Remote Sensing. Vol: 25, No:6, p:1095-1104.
WALL OSG(2003). Soil erosion-causes and effects.
Wischmeier WH(1976). The use and misuse of the
universal soil loss equation. Journal of Soil and Water
Conservation.31:5-9.
Yuksel A, Akay AE and Elliot WJ(2007a). Using WEPP:
Road model in estimating sediment yield from the
road network in KSU baskonus research and
application forest in Kahramanmaras, Turkey.
International Mountain Logging and 13th Pacific
Northwest Skyline Symposium; Oregon State
University, Corvallis, Oregon, 1-6 April. USA.
Yuksel A, Akay AE, Reis M and Gundogan R(2007b).
Using the WEPP model to predict sediment yield in a
sample watershed in Kahramanmaras region.
International Congress River BasinManagement. 2:11-
22.
75