soil conservation service - home | nrcs · web viewpotential operational adjustments to reduce...
TRANSCRIPT
NATURAL RESOURCES CONSERVATION SERVICE
EDGE-OF-FIELD WATER QUALITY MONITORING
DATA COLLECTION AND EVALUATION
CONSERVATION ACTIVITY
(Code 201)
DEFINITION
Water quality monitoring and evaluation under this conservation activity standard are the actions and activities, using acceptable tools and protocols, by which a producer will measure the effectiveness of conservation practices and systems. Evaluation of conservation practice effectiveness through edge-of-field monitoring will lead to a better understanding of constituent loading and will assist NRCS and participants in adapting or validating the application of conservation measures.
PURPOSE
Evaluate the effectiveness of a practice or system of practices in reducing concentrations and/or loads of targeted constituents.
Use evaluation techniques to acquire insight about existing land management and where applicable, institute change to achieve a future desired condition.
Collect site specific edge-of-field water quality data to calibrate, validate, and verify predictive models.
CONDITIONS WHERE THE CONSERVATION ACTIVITY APPLIES
This conservation activity applies to all land uses where conservation practices are or will be addressing surface and subsurface drainage water quality, and there is a need to determine the effects and performance of applied conservation practices. The pollutant(s) to be measured at the edge-of-field must be tied to a water quality constituent of concern for the associated receiving stream or water body. This ties the resource concern back to the planning process and promotes a systems approach to conservation.
GENERAL CRITERIA
This document provides criteria for carrying out all phases of Edge-of-Field Water Quality Monitoring and Evaluation with the exception of the system installation. System installation criteria are covered under Edge-of-Field Water Quality Monitoring – System Installation (202). As with all water quality monitoring endeavors, there are a series of elements that need to be in place for successful evaluation; monitoring design, site selection, system design, operational requirements, data management, and quality assurance.
NRCS – October 1, 2012 Page 1

Monitoring Design
To maintain a defensible scientific foundation capable of providing data at the level required for evaluating the effectiveness of a practice or a practice system, a paired field approach or an above and below treatment approach is required.
A paired approach provides for a determination of conservation practice effectiveness by comparing a control field and a treatment field that are similar in terms of soil, slope, vegetation, hydrology, initially receive identical management, and receive the same weather (e.g., precipitation events) (Clausen and Spooner 1993). Monitor both fields (watersheds) under identical crop and management conditions without any new practice implementation during the baseline period. Follow this with monitoring of both fields after conservation practice implementation in the treatment field. The monitoring regime (i.e., sample location, method, and frequency) must remain the same through both baseline and post-implementation periods. Selecting a single field with split drainage areas simplifies the paired approach.
Another appropriate design for certain practices is an in-field above and below approach. In this system, the first station monitors water quality above treatment and a second station monitors water quality below treatment. As with the paired approach, follow the baseline period with a post-treatment monitoring period (USDA-NRCS, 2003).
Site Selection
Identification of a specific, significant in-stream or downstream water-body water quality resource concern(s) linked to an agricultural pollutant (one of the water quality constituents identified in this document) should be the first step in site selection. Additionally, there should be “avoiding”, “controlling”, and “trapping” conservation practices available to address the pollutant(s).
Additional site selection criteria:
Drainage catchments should be no smaller than 3 acres. The difference in drainage area of the control field and the treated field should be ≤ 5 acres. Fields should be adjacent or as close as possible. The fields should not have outside influences such as receiving drainage from other fields or suburban areas.
In fields without drain tile, establish edge-of-field sites by surveying to locate the catchment drainage outlet and to measure the drainage area. The drainage area to the monitoring station should have homogeneous land use, preferably within the field’s natural drainage, provide for wet weather travel access, and the assurance that system will not interfere with normal farming operations or future conservation practice implementation. Berm construction may be necessary to direct runoff to the inlet of the monitoring system.
The participant must have control of the land and its management for the length of the monitoring period.
To the extent possible, field sites should allow the system to blend into the landscape in order to reduce the possibility of vandalism.
NRCS – October 1, 2012 Page 2
System Criteria
System criteria necessary for Quality Assurance Project Plan (QAPP) development is found in Edge-of-Field Water Quality Monitoring – System Installation (201).
Operational Requirements
Water Quality Constituents
Laboratory analysis of water quality samples must use standard protocols outlined in the National Environmental Methods Index (NEMI, 2012). The QAPP must document a detailed description or procedure reference number of the laboratory analysis. It must also document the use of duplicate and blank samples (typically 10 percent of the samples). Instruct laboratories to perform analysis only when there is sufficient volume present in the sample to analyze all water quality constituents.
At a minimum, analyze the following constituents in all samples: NH4-N (Ammonium Nitrogen only required when animal waste is land applied) NO2-N + NO3-N (Nitrite plus Nitrate Nitrogen) TKN (Total Kjeldahl Nitrogen) Soluble Reactive P (Orthophosphate Phosphorus) TP (Total Phosphorus) SSC (Suspended Sediment Concentration) – Preferred TSS (Total Suspended Solids) – When SSC is not available through the lab
Sample Handling
The data collector’s QAPP describes sample handling in detail.
Required Site Visits
System maintenance must be a high priority to ensure meaningful data (USEPA, 1997). A list of monitoring and maintenance items follows:
Visit the site at least once per week or on alternating weeks when sampling events are not anticipated.
Visit all sites as soon as possible (as determined by guidelines listed in the QAPP) after sampling events to retrieve samples, inspect flow measurement and automated sampler function, and make necessary repairs. Excessive delay in retrieving water samples can result in changes to their chemical composition and thus inaccurate representation of actual water quality.
General maintenance tasks:o Commit adequate time to conduct necessary equipment inspection, maintenance,
and repair.o Inspect power sources, stage recorders, pumps, sample tubes, sample intakes, and
desiccant strength.o Check and/or calibrate stage recorders to ensure flow measurement accuracy.
NRCS – October 1, 2012 Page 3
o Retrieve collected data weekly or bi-weekly to limit the amount of data potentially lost due to equipment failure or logger capacity limitations.
o Remove debris, snow, and ice upstream and downstream from the flow control structure. Clean site and assure unimpeded flow through the structure(s).
Monitoring Duration
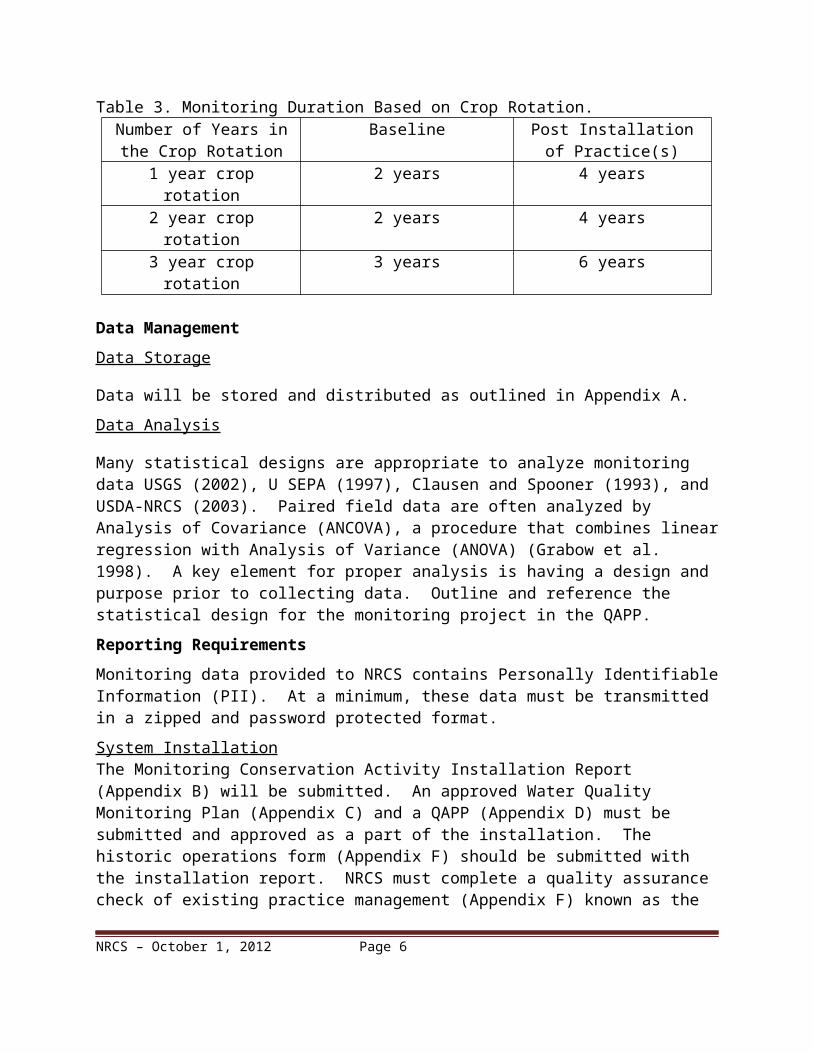
The monitoring duration should be based on the number of years in the crop rotation. The minimum recommended duration is found in Table 3. Typically this is one crop rotation for baseline and two crop rotations for post practice application. If after the second crop rotation statistically significant data have been collected and the effectiveness of the monitored practice(s) is established, the third crop rotation may be used for additional practice implementation. No change can be made in the monitored fields without consultation of the data collector. The participant may request a different monitoring duration in writing (5 year min, 9 year max). The request goes to the state water quality monitoring specialist who will seek approval through the NRCS National Water Quality Specialist.
Table 3. Monitoring Duration Based on Crop Rotation.Number of Years in the
Crop RotationBaseline Post Installation of
Practice(s)1 year crop rotation 2 years 4 years2 year crop rotation 2 years 4 years3 year crop rotation 3 years 6 years
Data Management
Data Storage
Data will be stored and distributed as outlined in Appendix A.
Data Analysis
Many statistical designs are appropriate to analyze monitoring data USGS (2002), U SEPA (1997), Clausen and Spooner (1993), and USDA-NRCS (2003). Paired field data are often analyzed by Analysis of Covariance (ANCOVA), a procedure that combines linear regression with Analysis of Variance (ANOVA) (Grabow et al. 1998). A key element for proper analysis is having a design and purpose prior to collecting data. Outline and reference the statistical design for the monitoring project in the QAPP.
Reporting Requirements
Monitoring data provided to NRCS contains Personally Identifiable Information (PII). At a minimum, these data must be transmitted in a zipped and password protected format.
System InstallationThe Monitoring Conservation Activity Installation Report (Appendix B) will be submitted. An approved Water Quality Monitoring Plan (Appendix C) and a QAPP (Appendix D) must be submitted and approved as a part of the installation. The historic operations form (Appendix F) should be submitted with the installation report. NRCS must complete a quality assurance check
NRCS – October 1, 2012 Page 4
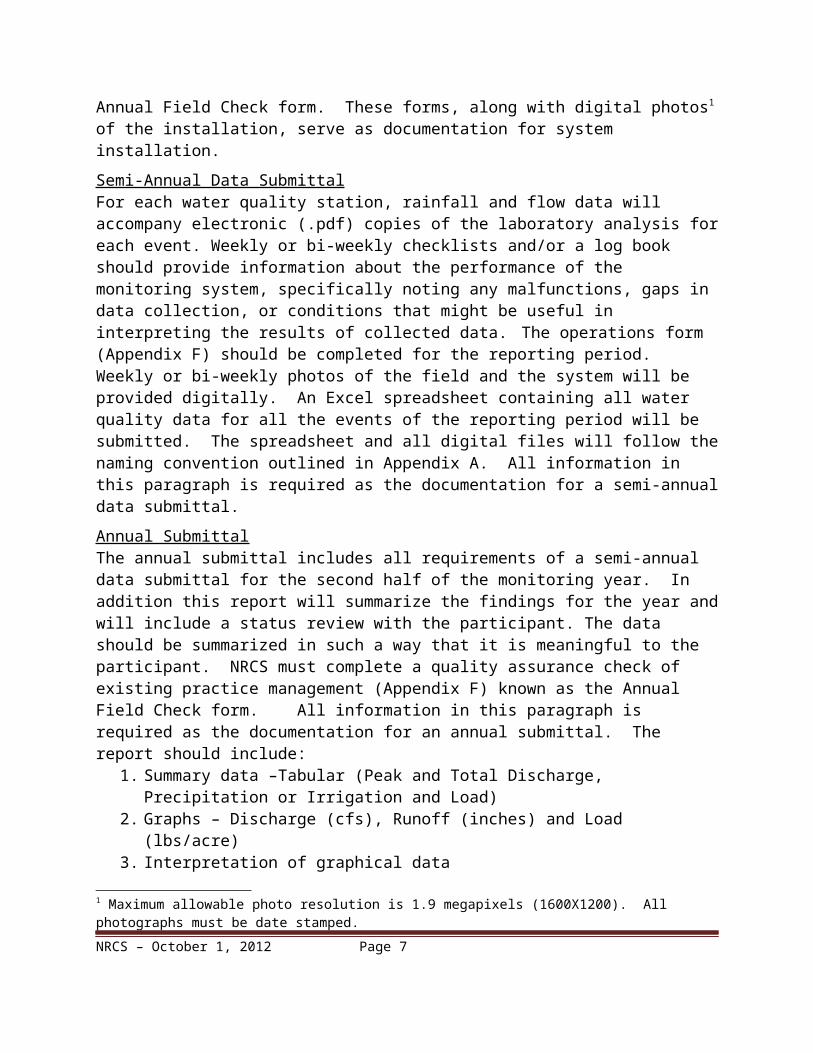
of existing practice management (Appendix F) known as the Annual Field Check form. These forms, along with digital photos1 of the installation, serve as documentation for system installation.
Semi-Annual Data SubmittalFor each water quality station, rainfall and flow data will accompany electronic (.pdf) copies of the laboratory analysis for each event. Weekly or bi-weekly checklists and/or a log book should provide information about the performance of the monitoring system, specifically noting any malfunctions, gaps in data collection, or conditions that might be useful in interpreting the results of collected data. The operations form (Appendix F) should be completed for the reporting period. Weekly or bi-weekly photos of the field and the system will be provided digitally. An Excel spreadsheet containing all water quality data for all the events of the reporting period will be submitted. The spreadsheet and all digital files will follow the naming convention outlined in Appendix A. All information in this paragraph is required as the documentation for a semi-annual data submittal.
Annual SubmittalThe annual submittal includes all requirements of a semi-annual data submittal for the second half of the monitoring year. In addition this report will summarize the findings for the year and will include a status review with the participant. The data should be summarized in such a way that it is meaningful to the participant. NRCS must complete a quality assurance check of existing practice management (Appendix F) known as the Annual Field Check form. All information in this paragraph is required as the documentation for an annual submittal. The report should include:
1. Summary data –Tabular (Peak and Total Discharge, Precipitation or Irrigation and Load) 2. Graphs – Discharge (cfs), Runoff (inches) and Load (lbs/acre) 3. Interpretation of graphical data4. Discuss comparison of control and treatment sites5. Explain Results
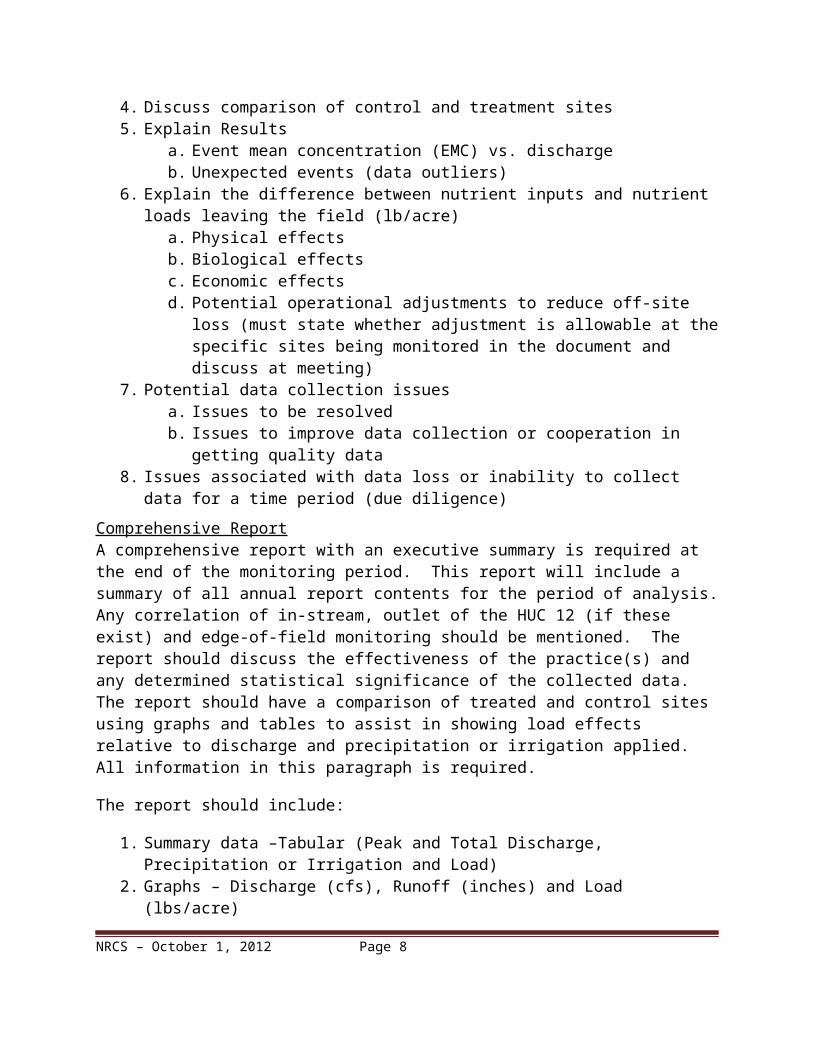
a. Event mean concentration (EMC) vs. dischargeb. Unexpected events (data outliers)
6. Explain the difference between nutrient inputs and nutrient loads leaving the field (lb/acre)
a. Physical effectsb. Biological effectsc. Economic effectsd. Potential operational adjustments to reduce off-site loss (must state whether
adjustment is allowable at the specific sites being monitored in the document and discuss at meeting)
7. Potential data collection issuesa. Issues to be resolvedb. Issues to improve data collection or cooperation in getting quality data
8. Issues associated with data loss or inability to collect data for a time period (due diligence)
1 Maximum allowable photo resolution is 1.9 megapixels (1600X1200). All photographs must be date stamped.
NRCS – October 1, 2012 Page 5
Comprehensive ReportA comprehensive report with an executive summary is required at the end of the monitoring period. This report will include a summary of all annual report contents for the period of analysis. Any correlation of in-stream, outlet of the HUC 12 (if these exist) and edge-of-field monitoring should be mentioned. The report should discuss the effectiveness of the practice(s) and any determined statistical significance of the collected data. The report should have a comparison of treated and control sites using graphs and tables to assist in showing load effects relative to discharge and precipitation or irrigation applied. All information in this paragraph is required.
The report should include:
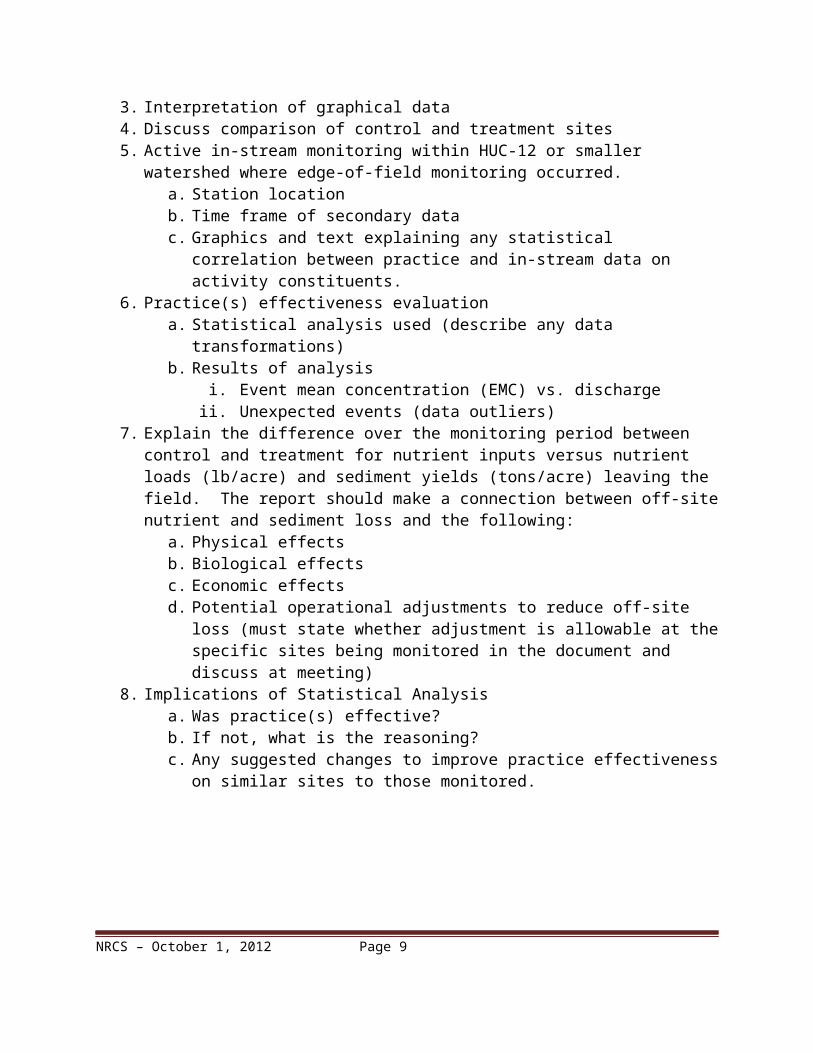
1. Summary data –Tabular (Peak and Total Discharge, Precipitation or Irrigation and Load) 2. Graphs – Discharge (cfs), Runoff (inches) and Load (lbs/acre) 3. Interpretation of graphical data4. Discuss comparison of control and treatment sites5. Active in-stream monitoring within HUC-12 or smaller watershed where edge-of-field
monitoring occurred. a. Station location b. Time frame of secondary data c. Graphics and text explaining any statistical correlation between practice and in-
stream data on activity constituents.6. Practice(s) effectiveness evaluation
a. Statistical analysis used (describe any data transformations)b. Results of analysis
i. Event mean concentration (EMC) vs. dischargeii. Unexpected events (data outliers)
7. Explain the difference over the monitoring period between control and treatment for nutrient inputs versus nutrient loads (lb/acre) and sediment yields (tons/acre) leaving the field. The report should make a connection between off-site nutrient and sediment loss and the following:
a. Physical effectsb. Biological effectsc. Economic effectsd. Potential operational adjustments to reduce off-site loss (must state whether
adjustment is allowable at the specific sites being monitored in the document and discuss at meeting)
8. Implications of Statistical Analysisa. Was practice(s) effective?b. If not, what is the reasoning?c. Any suggested changes to improve practice effectiveness on similar sites to those
monitored.
NRCS – October 1, 2012 Page 6
CONSIDERATIONS
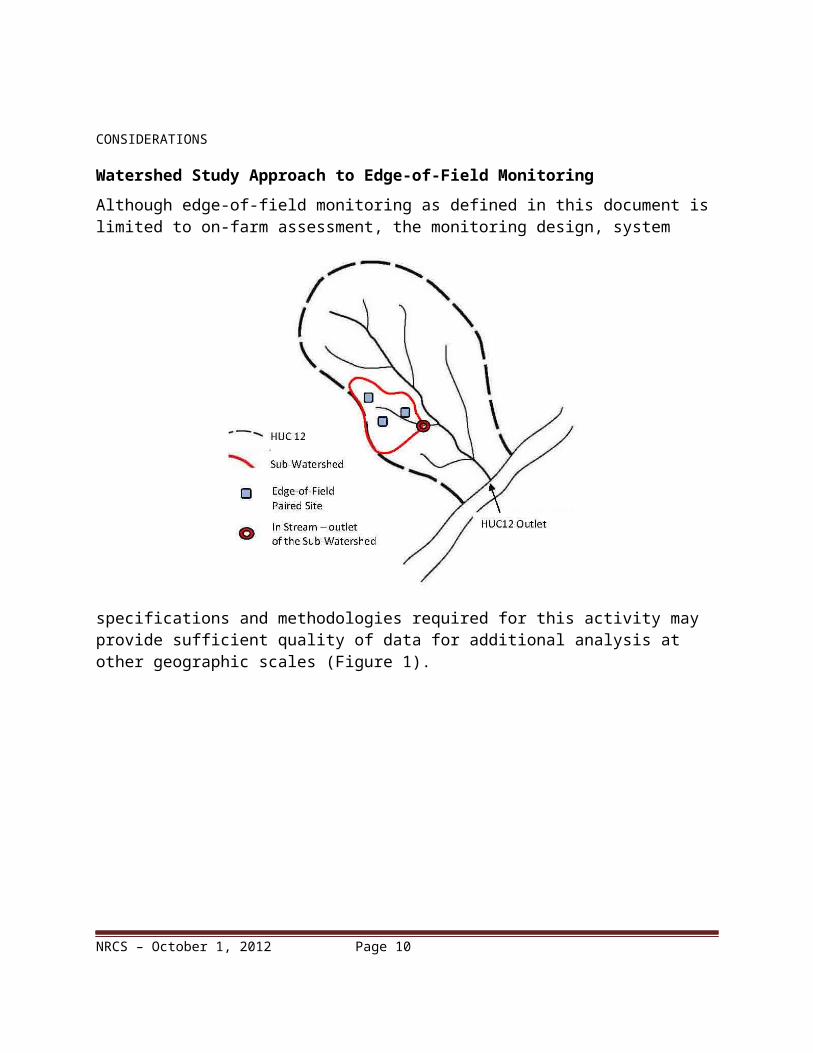
Watershed Study Approach to Edge-of-Field Monitoring
Although edge-of-field monitoring as defined in this document is limited to on-farm assessment, the monitoring design, system specifications and methodologies required for this activity may provide sufficient quality of data for additional analysis at other geographic scales (Figure 1).
For the purposes of this document, sub-watersheds of the HUC12 are those that have drainage areas of approximately 500 – 1,000 acres. Monitoring conducted at the outlet of the sub-watershed is “in-stream” monitoring. Collected data at this point should include continuous flow (discharge) and concentration of the identified agricultural pollutant of concern.
The three levels of monitoring shown in Figure 4; edge-of-field, in-stream and HUC12 outlet (or other water body), should coexist and each station should collect monitoring data of consistent quality. NRCS will support edge-of-field monitoring and will rely on other partners for in-stream monitoring and monitoring at the outlet of the HUC12 (or other water body).
The success of identifying water quality improvements at geographic scales greater than the field level relies heavily on the identification of an agricultural pollutant that is a primary cause of poor water quality. There must also be NRCS conservation practices that do a good job of controlling, avoiding, or trapping the pollutant. Below are some additional considerations:
Monitor practices or suites of practices that are likely to be adopted or have been widely used by producers in the HUC12 or the sub-watershed, to increase the likelihood of detecting water quality improvements through edge-of-field and in-stream monitoring.
NRCS – October 1, 2012 Page 7
Figure 1: Potential Sub-Watershed approach to edge-of-field monitoring.
Edge-of-field sites should represent typical agricultural operational practices and physical features of the HUC12 watershed. Consider physical features such as soil and slope.
Only monitor practices that are atypical in a watershed if they are on sites with typical physical features and the practice(s) would have a widespread impact on the water quality resource concern if widely used throughout the watershed or sub-watershed.
High priority should be given to sites where flow and continuous monitoring of water quality data, particularly the constituent(s) of interest in-stream and at the outlet of the HUC12 is being collected according to USGS or EPA protocol. Where possible, sites should be located upstream of existing in-stream monitoring sites with available historical flow and water quality record (Harmel et al., 2006a).
Correlate In-Stream Sediment Load with Stream Geometry
When sediment is the constituent of concern, it is important to identify a load distribution. The loading associated with stream bank erosion can be the dominant source. USDA-NRCS National Water Management Center (NWMC) is available for assistance using Regional Hydraulic Geometry Curves to estimate in-stream contributions to sediment load.
Adaptive Management
Avoid management changes until securing enough information to establish a statistically significant conclusion concerning the effect of the first new treatment through the paired-watershed analysis. Once established, the information will be used to adapt and plan more effectively those conservation practices or management changes that impact water quality at the field or farm level. No land management change or practice implementation should take place within the monitored field without consulting the data collector.
NRCS – October 1, 2012 Page 8
References
Brakensiek, D.L., H.B. Osborn, and W.J. Rawls, coordinators. 1979. Field Manual for Research in Agricultural Hydrology. Agriculture Handbook No. 224. Washington, D.C.: USDA.
Buchanan, T.J., and W.P. Somers. 1982. Chapter A7: Stage measurement at gaging stations. Techniques of Water-Resources Investigations of the U.S. Geological Survey, Book 3. Washington, D.C.: USGS.
Clausen, J.C. and J. Spooner. 1993. Paired Watershed Study Design. Biological and Agricultural Engineering Department, North Carolina State University, Raleigh, NC. EPA-841-F-93-009.
Federal Interagency Stream Restoration Working Group. 1998. Analysis of Corridor Condition. Stream Corridor Restoration: Principles, Processes, and Practices. Chapter 7, pg. 28-32.
Grabow, G.L., J. Spooner, L.A. Lombardo, D.E. Line, and K.L. Tweedy. 1998. Has Water Quality Improved? Use of SAS for Statistical Analysis of Paired Watershed, Upstream/Downstream, and Before/After Monitoring Designs. Biological and Agricultural Engineering Department, North Carolina State University, Raleigh, NC. USEPA-NCSU-CES Grant No. X825012.
Haan, C.T., B.J. Barfield, and J.C. Hayes. 1994. Design Hydrology and Sedimentology for Small Catchments. New York, N.Y.: Academic Press.
Harmel, R.D., D.R. Smith, K.W. King, and R.M. Slade. 2009. Estimating storm discharge and water quality data uncertainty: A software tool for monitoring and modeling applications. Environ. Modeling Software 24:832-842.
Harmel, R.D., K.W. King, B.E. Haggard, D.G. Wren, and J.M. Sheridan. 2006a. Practical guidance for discharge and water quality data collection on small watersheds. Trans. ASABE 49(4):937-948.
Harmel, R.D., R.J. Cooper, R.M. Slade, R.L. Haney, and J.G. Arnold. 2006b. Cumulative uncertainty in measured streamflow and water quality data for small watersheds. Trans. ASABE 49(3): 689-701.
Harmel R.D., K.W. King, and R.M. Slade. 2003. Automated storm water sampling on small watersheds. Applied Eng. Agric. 19(6): 667-674.
Harmel, R.D., K.W. King, J.E. Wolfe, and H.A. Torbert. 2002. Minimum flow considerations for automated storm sampling on small watersheds. Texas J. Sci. 54(2): 177-188.
NEMI. 2012. National Environmental Methods Index: Methods and Data Comparability Board chartered under the National Water Quality Monitoring Council. Available at: http://www.nemi.gov
Spooner, J. 2011. TechNote: Minimum Detectable Change (MDC) Analysis. USEPA. http://www.bae.ncsu.edu/programs/extension/wqg/319monitoring/TechNotes/technote7_MDC.pdf
NRCS – October 1, 2012 Page 9
USDA-NRCS Handbooks and manuals available at: http://directives.sc.egov.usda.gov/:
USDA NRCS National Agronomy Manual USDA NRCS National Biology Handbook USDA NRCS National Biology Manual USDA NRCS National Engineering Handbook USDA NRCS National Engineering Manual USDA NRCS National Forestry Manual USDA NRCS National Plant Materials Manual USDA NRCS National Range and Pasture Handbook
USDA-NRCS. 1989, revised 1990 and 1991. National Engineering Handbook, Part 650, Engineering Field Handbook, Chapter 2 Estimating Runoff and Peak Discharges. Washington, D.C. (NEH 650.02)
USDA-NRCS. 2003. Part 600: Introduction. National Water Quality Handbook. Washington, D.C. USDA-NRCS.
USEPA. 2012. Guidance for Quality Assurance Project Plans. Available at: http://www.epa.gov/quality/qs-docs/g5-final.pdf
USEPA. 1997. Monitoring guidance for determining the effectiveness of nonpoint-source controls. EPA 841-B-96-004. Washington, D.C.: USEPA.
USGS. 2002. Chapter A3: Statistical Methods in Water Resources. Techniques of Water-Resources Investigations of the United States Geological Survey, Book 4, Hydrologic Analysis and Interpretation, Washington, DC: USGS.
NRCS – October 1, 2012 Page 10
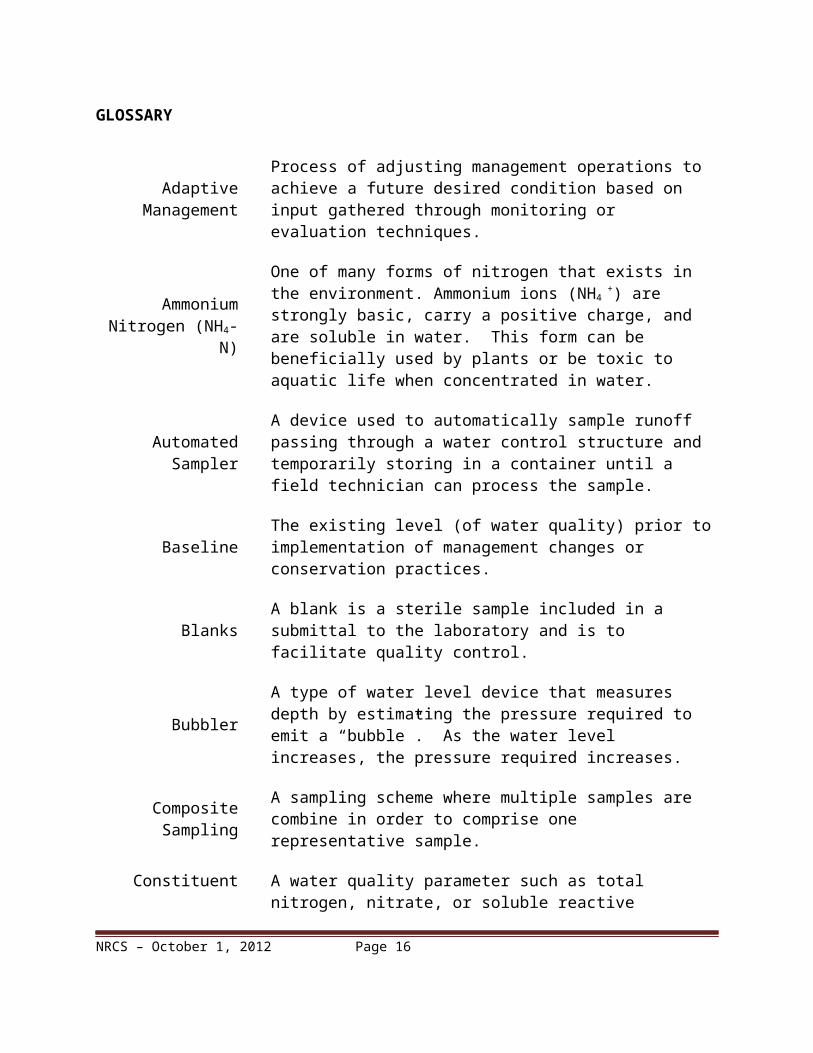
GLOSSARY
Adaptive Management
Process of adjusting management operations to achieve a future desired condition based on input gathered through monitoring or evaluation techniques.
Ammonium Nitrogen (NH4-N)
One of many forms of nitrogen that exists in the environment. Ammonium ions (NH4
+) are strongly basic, carry a positive charge, and are soluble in water. This form can be beneficially used by plants or be toxic to aquatic life when concentrated in water.
Automated SamplerA device used to automatically sample runoff passing through a water control structure and temporarily storing in a container until a field technician can process the sample.
Baseline The existing level (of water quality) prior to implementation of management changes or conservation practices.
Blanks A blank is a sterile sample included in a submittal to the laboratory and is to facilitate quality control.
BubblerA type of water level device that measures depth by estimating the pressure required to emit a “bubble”. As the water level increases, the pressure required increases.
Composite Sampling A sampling scheme where multiple samples are combine in order to comprise one representative sample.
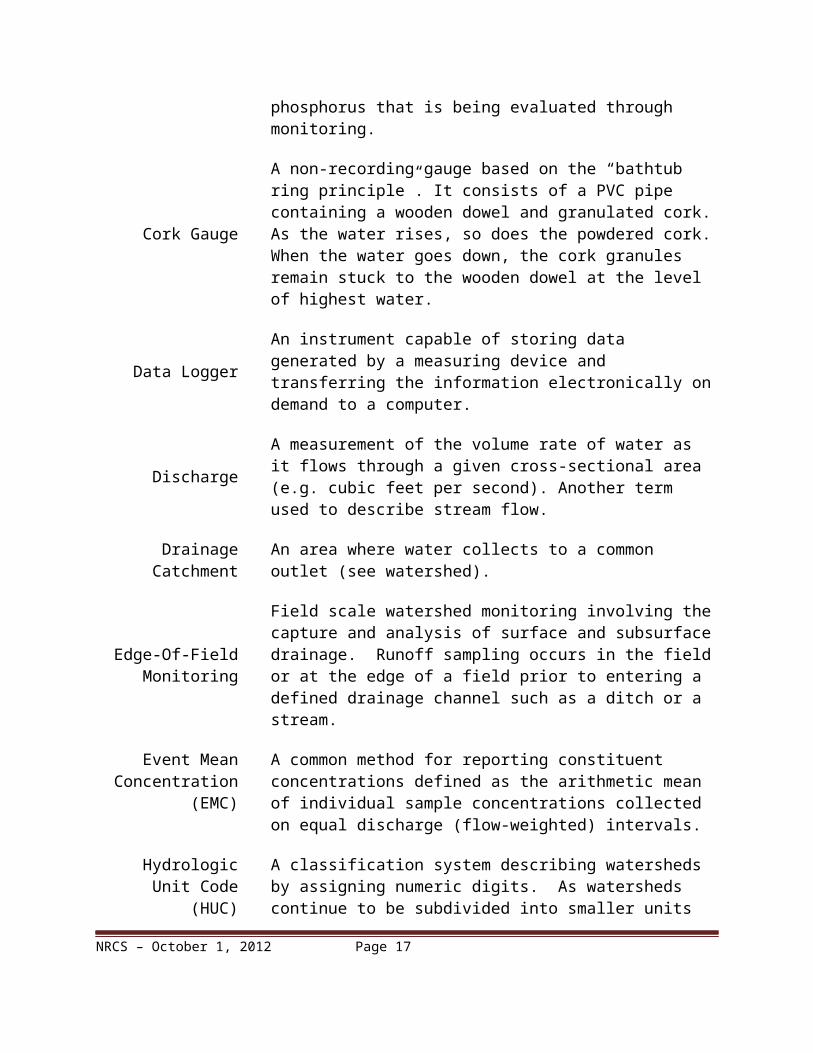
Constituent A water quality parameter such as total nitrogen, nitrate, or soluble reactive phosphorus that is being evaluated through monitoring.
Cork Gauge
A non-recording gauge based on the “bathtub ring principle”. It consists of a PVC pipe containing a wooden dowel and granulated cork. As the water rises, so does the powdered cork. When the water goes down, the cork granules remain stuck to the wooden dowel at the level of highest water.
Data LoggerAn instrument capable of storing data generated by a measuring device and transferring the information electronically on demand to a computer.
DischargeA measurement of the volume rate of water as it flows through a given cross-sectional area (e.g. cubic feet per second). Another term used to describe stream flow.
NRCS – October 1, 2012 Page 11
Drainage Catchment An area where water collects to a common outlet (see watershed).
Edge-Of-Field Monitoring
Field scale watershed monitoring involving the capture and analysis of surface and subsurface drainage. Runoff sampling occurs in the field or at the edge of a field prior to entering a defined drainage channel such as a ditch or a stream.
Event Mean Concentration (EMC)
A common method for reporting constituent concentrations defined as the arithmetic mean of individual sample concentrations collected on equal discharge (flow-weighted) intervals.
Hydrologic Unit Code (HUC)
A classification system describing watersheds by assigning numeric digits. As watersheds continue to be subdivided into smaller units of measure, additional digits are designated to the code.
Hypothesis A preliminary idea that is tested by collecting observations or data in order to support or reject the position.
In-Stream Monitoring Monitoring conducted at the outlet of a HUC12 sub-watershed. (see the definition of sub-watershed)
Load Mass of constituent transported. The EMC multiplied by the total flow volume represents the constituent load.
Model ValidationThe process of verifying, through data collection and analysis, that a mathematical representation of situation approximates reality.
Nitrate Nitrogen (NO3-N)
One of many forms of nitrogen that exists in the environments. Nitrate (NO3
_) are carry a negative charge and are soluble in water. This form can be beneficially used by plants or be harmful to living organisms when concentrated in water.
Nitrite Nitrogen (NO2-N)
A relatively unstable form of nitrogen that quickly converts to nitrate in the presence of oxygen.
Non-Parametric Statistical tests used to test a hypothesis that are valid regardless of whether or not the data are normally distributed.
Normal DistributionData that has a distribution pattern that has a single peak and is symmetrical around a mean. The mean, median, and mode are nearly equal and the data set when graphed illustrates a “bell-shaped” curve.
Parametric Statistical tests frequently used to test a hypothesis when a data set approximates a normal distribution.
Physiographic Region Broad-scale subdivisions of land based on terrain texture, rock type, and geologic structure and history.
NRCS – October 1, 2012 Page 12
Peristaltic Pump A type of pump used in automatic water samplers that pumps water by using a roller on a tube to compress and pump fluid.
Pollutant A contaminant present at a concentration sufficient to cause harm to living organisms.
Pressure Transducer A type of water level device that converts pressure exerted on a mechanical membrane into a electronic signal.
Quality Assurance Project Protocol
(QAPP)
A document that describes the activities of a project involved with the acquisition of environmental information, whether generated from direct measurement activities or collected from other sources.
Recurrence Interval
The historical chance that a particular storm event can produce precipitation or runoff of a given magnitude in a given year. Recurrence interval may be expressed in percent, or in years. For example, a 5 year recurrence interval is equivalent to a 20% chance.
Regional Hydraulic Geometry Curves
Expresses the relationship between bankfull discharge and bankfull channel dimensions (cross sectional area, top width, mean depth, and mean velocity) for specific stream types.
Soluble Reactive Phosphorus (Ortho-P)
A form of phosphorus (PO43-) that is readily soluble in water.
Staff Gauge
A type of ruler used to quickly measure surface level in reservoirs, rivers, streams, irrigation channels, weirs and flumes. When used with granulated cork in a tube, this gauge has the capacity to record the peak stage that occurred during a storm event. (see cork gauge)
Stage The height of the water surface at a location along a stream, river, or as runoff exits the edge of a field through a water control structure.
Standard Rain Gauge
A non-recording gauge is a Standard Rain Gauge. Typically, it is a metal cylinder with a funnel on top and a plastic measuring tube in the middle. The measuring tube can handle up to 2.00 inches of rain before overflowing into the larger outer cylinder. During the winter, the observer removes the funnel and inner tube and allows the snow to collect in the outer tube. The observer then melts the snow and measures it, getting an accurate water equivalent to report.
Stilling WellA type of structure used to measure stage that allows for water levels to equilibrate in an environment with minimal turbulence to improve the accuracy of the stage measurement.
NRCS – October 1, 2012 Page 13
Sub-Watershed Watersheds within the HUC12 that have drainage areas of approximately 500 – 1,000 acres.
Suspended Sediment Concentration
A laboratory procedure made by measuring the dry weight of all the sediment from a known volume of a water-sediment mixture.
Total Kjeldahl Nitrogen (TKN)
A laboratory measurement of the amount of organic and ammonia nitrogen components in a sample.
Total Phosphorus (TP)
A laboratory measurement of all the forms of phosphorus (i.e. organic and inorganic).
Total Suspended Solids (TSS)
Material trapped by a filter paper, including silt, decaying plant and animal matter, or wastes.
Transformation A mathematical procedure used to transform non-normal data distributions to more normal distributions for parametric statistical testing procedures.
NRCS – October 1, 2012 Page 14
APPENDIX A – NAMING CONVENTIONS AND DIRECTORY STRUCTURE
Page A-1
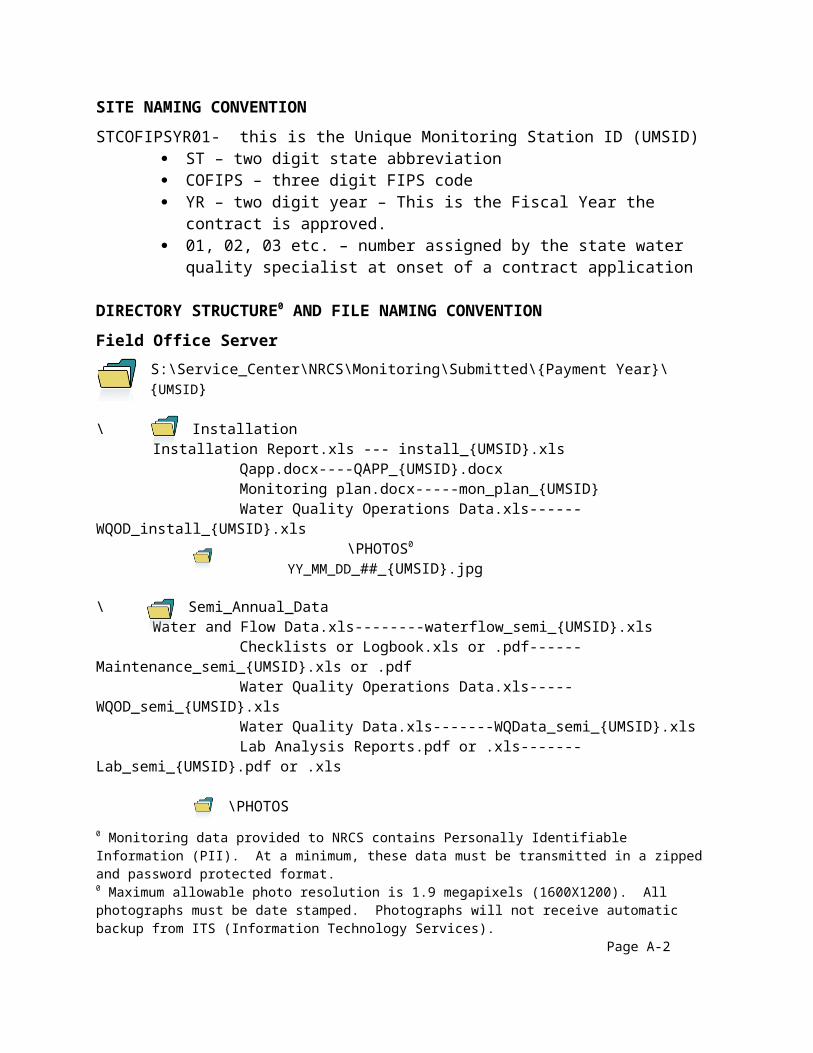
SITE NAMING CONVENTION
STCOFIPSYR01- this is the Unique Monitoring Station ID (UMSID) ST – two digit state abbreviation COFIPS – three digit FIPS code YR – two digit year – This is the Fiscal Year the contract is approved. 01, 02, 03 etc. – number assigned by the state water quality specialist at onset of a
contract application
DIRECTORY STRUCTURE0 AND FILE NAMING CONVENTION
Field Office ServerS:\Service_Center\NRCS\Monitoring\Submitted\{Payment Year}\{UMSID}
\Installation Installation Report.xls --- install_{UMSID}.xls
Qapp.docx----QAPP_{UMSID}.docxMonitoring plan.docx-----mon_plan_{UMSID}Water Quality Operations Data.xls------WQOD_install_{UMSID}.xls
\PHOTOS0
YY_MM_DD_##_{UMSID}.jpg
\ Semi_Annual_Data Water and Flow Data.xls--------waterflow_semi_{UMSID}.xls
Checklists or Logbook.xls or .pdf------Maintenance_semi_{UMSID}.xls or .pdfWater Quality Operations Data.xls----- WQOD_semi_{UMSID}.xlsWater Quality Data.xls-------WQData_semi_{UMSID}.xlsLab Analysis Reports.pdf or .xls-------Lab_semi_{UMSID}.pdf or .xls
\PHOTOSYY_MM_DD_##_{UMSID}.jpg
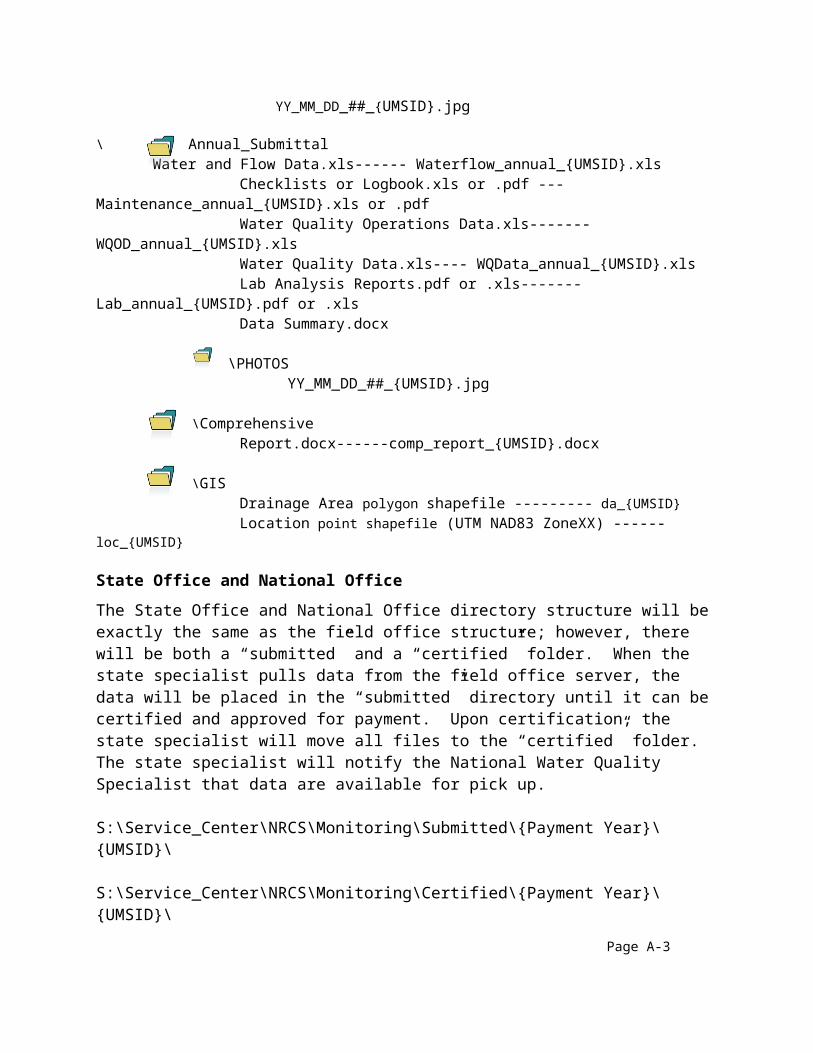
\ Annual_Submittal Water and Flow Data.xls------ Waterflow_annual_{UMSID}.xls
Checklists or Logbook.xls or .pdf ---Maintenance_annual_{UMSID}.xls or .pdfWater Quality Operations Data.xls------- WQOD_annual_{UMSID}.xlsWater Quality Data.xls---- WQData_annual_{UMSID}.xlsLab Analysis Reports.pdf or .xls-------Lab_annual_{UMSID}.pdf or .xlsData Summary.docx
\PHOTOSYY_MM_DD_##_{UMSID}.jpg
\ComprehensiveReport.docx------comp_report_{UMSID}.docx
0 Monitoring data provided to NRCS contains Personally Identifiable Information (PII). At a minimum, these data must be transmitted in a zipped and password protected format. 0 Maximum allowable photo resolution is 1.9 megapixels (1600X1200). All photographs must be date stamped. Photographs will not receive automatic backup from ITS (Information Technology Services).
Page A-2
\GISDrainage Area polygon shapefile --------- da_{UMSID}Location point shapefile (UTM NAD83 ZoneXX) ------ loc_{UMSID}
State Office and National Office
The State Office and National Office directory structure will be exactly the same as the field office structure; however, there will be both a “submitted” and a “certified” folder. When the state specialist pulls data from the field office server, the data will be placed in the “submitted” directory until it can be certified and approved for payment. Upon certification, the state specialist will move all files to the “certified” folder. The state specialist will notify the National Water Quality Specialist that data are available for pick up.
S:\Service_Center\NRCS\Monitoring\Submitted\{Payment Year}\{UMSID}\
S:\Service_Center\NRCS\Monitoring\Certified\{Payment Year}\{UMSID}\
The state specialist will need to submit a permissions request for read and write access to these folders on the service center servers. The national specialist will need to have read write access to the pertinent state servers and folders.
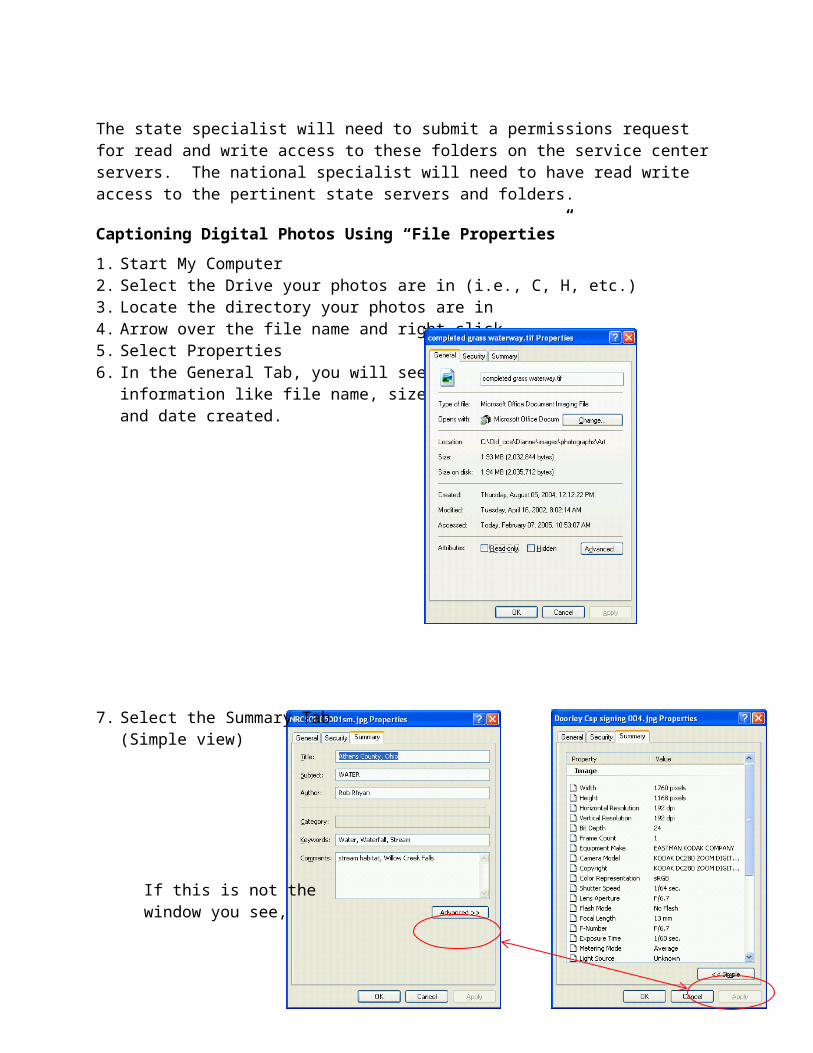
Captioning Digital Photos Using “File Properties”
1. Start My Computer2. Select the Drive your photos are in (i.e., C, H, etc.)3. Locate the directory your photos are in4. Arrow over the file name and right click5. Select Properties6. In the General Tab, you will see
information like file name, size,and date created.
7. Select the Summary Tab
Page A-3
(Simple view)
If this is not the window you see, change to simpleview.
8. This is the area to complete the necessary information.
Title – NRCS Monitoring XX (where XX is the two digit state abbreviation) Subject – Water Quality Author – Your name Keywords – monitoring, water quality, Unique Monitoring Station ID (UMSID) Comments – Details about the picture, date of picture if it is not date stamped
**Note: Be careful not to use any personally identifiable information when captioning the photo. For example do not use farm or tract number and do use participants’ name.***
Page A-4
APPENDIX B – INSTALLATION REPORT FORM
Page B- 1
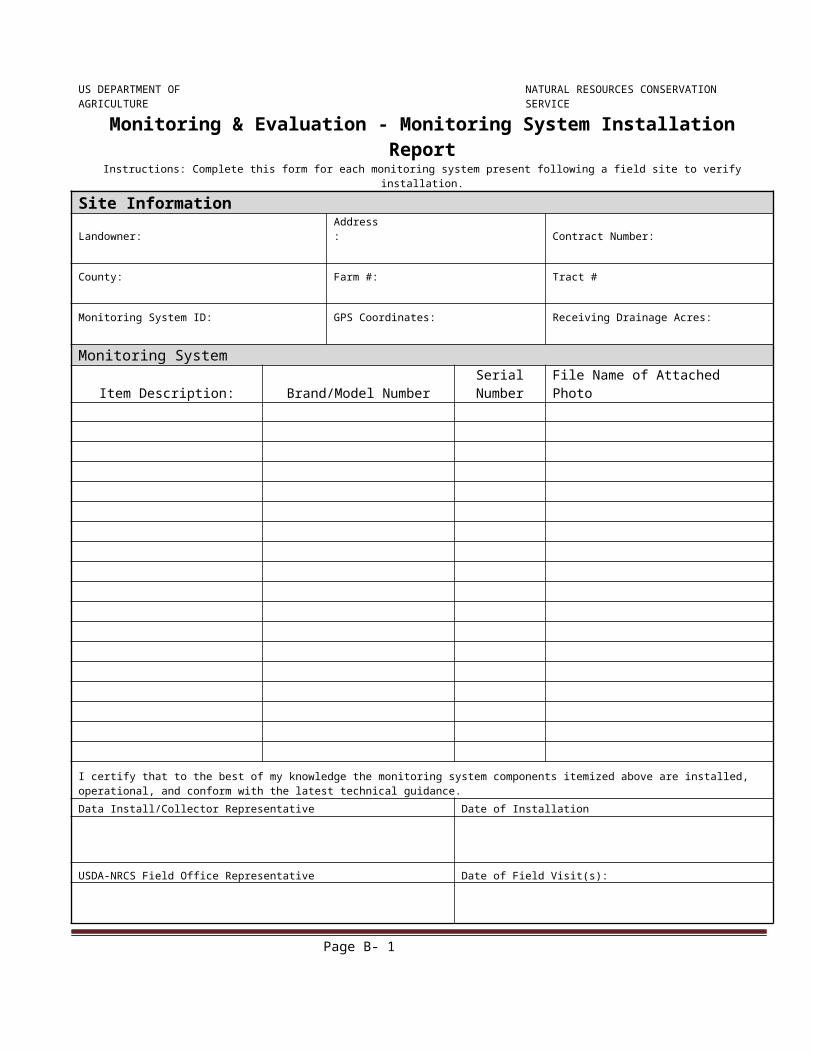
US DEPARTMENT OF AGRICULTURE NATURAL RESOURCES CONSERVATION SERVICE
Monitoring & Evaluation - Monitoring System Installation ReportInstructions: Complete this form for each monitoring system present following a field site to verify installation.
Site InformationLandowner: Address: Contract Number:
County: Farm #: Tract #
Monitoring System ID: GPS Coordinates: Receiving Drainage Acres:
Monitoring System
Item Description: Brand/Model NumberSerial
Number File Name of Attached Photo
I certify that to the best of my knowledge the monitoring system components itemized above are installed, operational, and conform with the latest technical guidance.
Data Install/Collector Representative Date of Installation
USDA-NRCS Field Office Representative Date of Field Visit(s):
Page B- 1
APPENDIX C – MONITORING PLAN TEMPLATE
Water quality monitoring activities benefit from the development of a monitoring plan. A monitoring plan is required for NRCS water quality monitoring. The template in this Appendix must be used as the basis of the monitoring plan. Among others, a monitoring plan describes roles and responsibilities, site description, system, reporting requirements and the monitoring timeline.
Text displayed in black is standard language and must be included; text displayed in red italics identifies the required information to be provided for each section.
Page C-1
Water Quality Monitoring Plan
For
PARTICIPANT NAME
Monitoring Station XXXX: Provide Directions to the site
Monitoring Station XXXX: Provide Directions to the site
Date
Data Collector’s Name
Data Collector’s Address
"The U.S. Department of Agriculture (USDA) prohibits discrimination in all its programs and activities on the basis of race, color, national origin, age, disability, and where applicable, sex, marital status, familial status, parental status, religion, sexual orientation, genetic information, political beliefs, reprisal, or because all or a part of an individual's income is derived from any public assistance program. (Not all prohibited bases apply to all programs.)
Page C-2
Persons with disabilities who require alternative means for communication of program information (Braille, large print, audiotape, etc.) should contact USDA’s TARGET Center at (202) 720-2600 (VOICE AND TDD). To file a complaint of discrimination, write to
USDA, Director, Office of Civil Rights, 1400 Independence Avenue, SW, Washington, DC 20250-9410 or call (800) 795-3272 (voice) or (202) 720-6382 (TDD). USDA is an equal opportunity provider and employer.
ROLES AND RESPONSIBILITIES
The following people have been involved in the development of this water quality monitoring plan:
Participant: CONTACT INFORMATIONData Collector: CONTACT INFORMATIONCertified Planner: CONTACT INFORMATIONDistrict Conservationist: CONTACT INFORMATION
Participant – will follow this plan and ensure the monitoring activity is carried out on the identified field(s). The participant is also responsible for meeting any reporting deadlines and will work closely with the data collector in completing operational forms that outline all management practices completed on the monitored field(s).
Data Collector – is responsible for installing and maintaining monitoring system. In addition, they ensure quality data are obtained by following all aspects of the Quality Assurance Project Plan (QAPP). As outlined in the QAPP, data collection, analysis, storage and reporting are performed by the data collector on behalf of the participant. Another key role of the data collector is to hold a yearly meeting with the participant to review what was learned about constituent loads during the year.
Certified Planner – is responsible for reviewing the Monitoring Plan developed by the data collector to ensure all required elements are present. They are also responsible for ensuring the participant understands all aspects of the monitoring activity including site accessibility and duration of monitoring.
District Conservationist – is responsible for maintaining an awareness of what is taking place on the site to ensure monitoring is moving forward in an acceptable manner. They are also responsible for obtaining all reported information from the participant and forwarding this information to the state monitoring specialist for storage, review and certification
PURPOSE
This monitoring plan identifies the monitoring activities that will be performed on private land controlled by participant within the target Watershed under the Mississippi River Basin Healthy Watershed Initiative or other initiative / program. Monitoring is being performed to insert the specific purpose of water quality monitoring at this site. List the water quality concern, the primary constituent of interest as well as the conservation practice(s) which will be monitored.
Page C-3
SITE DESCRIPTION
Station Identification and Location Map
Identify the station name, the Farm Service Agency(FSA) Farm, Tract and Field numbers, the drainage area of the station, the land use and if this is the control or treatment site. The location map should include a point indicating the GPS coordinates of the station location as well as a polygon outlining the drainage area for the station.
Soils Description
Discuss the soil properties for the drainage area of the monitoring stations. As a part of these discussions, include a table with the following fields: Station ID, Soil Map Unit, Acres, % of Drainage Area and Hydrologic Soil Group.
MONITORING SYSTEM
System Description
Describe the equipment to be used on the site in terms the participant will understand. Pictures of typical equipment should be included if available.
Sampling Protocol
Monitoring will take place year round and the goal of the project is to obtain runoff data from every event. Events include rainfall, snow melt and irrigation. Provide information to help the participant understand how frequently someone will visit the site and what they will be doing when they are there. Specifically cover winter monitoring and how this will take place including any special maintenance or anticipated more frequent visits to the site.
If monitoring includes tile flow or flow from denitrifying bioreactors, include information on obtaining a weekly sample as well as event based samples.
In the case where irrigation is being applied and sample runoff events are anticipated, the source water will be grab sampled for the constituents below at least once at the beginning of the irrigation season.
All runoff event samples will be analyzed for the following constituents:a. NH4-N (Ammonium only required when animal waste is land applied)b. N02-N + N03-N (Nitrate + Nitrite)c. TKN (Total Kjeldahl Nitrogen)d. Soluble Reactive P (Orthophosphate)e. TP (Total Phosphorus)f. SSC (Suspended Sediment Concentration) – Preferredg. TSS (Total Suspended Solids) – When SSC is not available through the labh. Identify any additional voluntary constituents
Page C-4
PARTICIPANT REQUIREMENTS
Miscellaneous Requests for Assistance
List any requests for assistance that will be made of the participant (for example they must call the data collector if they intend to irrigate at a rate that will trigger a sample). Identify any anticipated or required conservation practices to be installed and the required completion date.
Reporting Requirements
Monitoring data provided to NRCS contains Personally Identifiable Information (PII). At a minimum, these data must be transmitted in a zipped and password protected format.
System InstallationThe Monitoring Conservation Activity Installation Report (Appendix B) will be submitted. An approved Water Quality Monitoring Plan and a QAPP must be submitted and approved as a part of the installation. The historic operations form (Appendix F) should be submitted with the installation report. NRCS must complete a quality assurance check of existing practice management (Appendix F) known as the Annual Field Check form. These forms, along with digital photos0 of the installation, serve as the documentation for the system installation.
Semi-Annual Data SubmittalFor each water quality station, rainfall and flow data will accompany electronic (.pdf) copies of the laboratory analysis for each event. Weekly or bi-weekly checklists and/or a log book should provide information about the performance of the monitoring system, specifically noting any malfunctions, gaps in data collection, or conditions that might be useful in interpreting the results of collected data. The operations form (Appendix F) should be completed for the reporting period. Weekly or bi-weekly photos of the field and the system will be provided digitally. An Excel spreadsheet (Appendix A) containing all water quality data for all the events of the reporting period will be submitted. All information in this paragraph is required as the documentation for a semi-annual data submittal.
Annual SubmittalThe annual submittal includes all requirements of a semi-annual data submittal for the second half of the monitoring year. In addition this report will summarize the findings for the year and will include a status review with the participant. The data should be summarized in such a way that it is meaningful to the participant. NRCS must complete a quality assurance check of existing practice management (Appendix F) known as the Annual Field Check form. All information in this paragraph is required as the documentation for an annual submittal. The report should include:
1. Summary data –Tabular (Peak and Total Discharge, Precipitation or Irrigation and Load) 2. Graphs – Discharge (cfs), Runoff (inches) and Load (lbs/acre) 3. Interpretation of graphical data4. Discuss comparison of control and treatment sites5. Explain Results
a. Event mean concentration (EMC) vs. dischargeb. Unexpected events (data outliers)
0 Maximum allowable photo resolution is 1.9 megapixels (1600X1200). All photographs must be date stamped.
Page C-5
6. Explain the difference between nutrient inputs and nutrient loads leaving the field (lb/acre)
a. Physical effectsb. Biological effectsc. Economic effectsd. Potential operational adjustments to reduce off-site loss (must state whether
adjustment is allowable at the specific sites being monitored in the document and discuss at meeting)
7. Potential data collection issuesa. Issues to be resolvedb. Issues to improve data collection or cooperation in getting quality data
8. Issues associated with data loss or inability to collect data for a time period (due diligence)
Comprehensive ReportA comprehensive report with an executive summary is required at the end of the monitoring period. This report will include a summary of all annual report contents for the period of analysis. Any correlation of in-stream, outlet of the HUC 12 (if these exist) and edge-of-field monitoring should be mentioned. The report should discuss the effectiveness of the practice(s) and any determined statistical significance of the collected data. The report should have a comparison of treated and control sites using graphs and tables to assist in showing load effects relative to discharge and precipitation or irrigation applied. All information in this paragraph is required.
The report should include:
1. Summary data –Tabular (Peak and Total Discharge, Precipitation or Irrigation and Load) 2. Graphs – Discharge (cfs), Runoff (inches) and Load (lbs/acre) 3. Interpretation of graphical data4. Discuss comparison of control and treatment sites5. Active in-stream monitoring within HUC-12 or smaller watershed where edge-of-field
monitoring occurred. a. Station location b. Time frame of secondary data c. Graphics and text explaining any statistical correlation between practice and in-
stream data on activity constituents.6. Practice(s) effectiveness evaluation
a. Statistical analysis used (describe any data transformations)b. Results of analysis
i. Event mean concentration (EMC) vs. dischargeii. Unexpected events (data outliers)
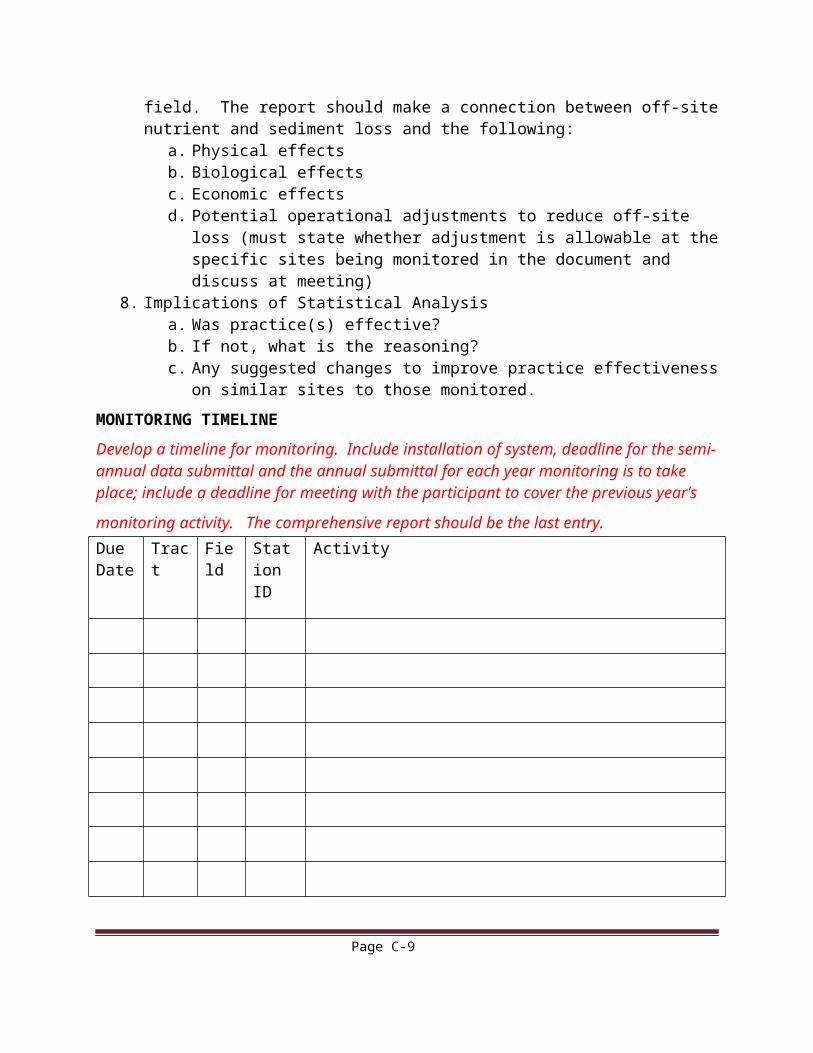
7. Explain the difference over the monitoring period between control and treatment for nutrient inputs versus nutrient loads (lb/acre) and sediment yields (tons/acre) leaving the field. The report should make a connection between off-site nutrient and sediment loss and the following:
a. Physical effects
Page C-6
b. Biological effectsc. Economic effectsd. Potential operational adjustments to reduce off-site loss (must state whether
adjustment is allowable at the specific sites being monitored in the document and discuss at meeting)
8. Implications of Statistical Analysisa. Was practice(s) effective?b. If not, what is the reasoning?c. Any suggested changes to improve practice effectiveness on similar sites to those
monitored.
MONITORING TIMELINE
Develop a timeline for monitoring. Include installation of system, deadline for the semi-annual data submittal and the annual submittal for each year monitoring is to take place; include a deadline for meeting with the participant to cover the previous year’s monitoring activity. The comprehensive report should be the last entry.Due Date
Tract Field Station ID
Activity
Page C-7
Project Identifier
Date
APPENDIX D – NRCS QUALITY ASSURANCE PROJECT PLAN (QAPP) TEMPLATE
Water quality monitoring activities benefit from the development of a Quality Assurance Project Plan (QAPP). A QAPP is required for NRCS-assisted water quality monitoring. The template in this appendix must be used as the basis of the QAPP when NRCS is the lead funding agency.
Among other items, a QAPP will fully describe the process of sample preservation, handling, and processing .The QAPP documents the results of a project’s technical planning process, providing in one place a clear, concise, and complete plan for the environmental data operation and its quality objectives and identifying key project personnel.
Text displayed in black is standard language; text displayed in red italics identifies the information required for the section.
NRCS QAPP Page D-1

Project Identifier
Date
NRCS QUALITY ASSURANCE PROJECT PLAN
Title of Project
Prepared for:
<Enter the contact information including affiliation and physical address>
Prepared by:
<Enter the contact information including affiliation and physical address>
<Enter date>
NRCS QAPP Page D-2
Project Identifier
Date
Table of Contents <TOC must be generated upon completion of QAPP content>
SECTION 1.0 – Project Overview and Objectives...............................................................pg#
SECTION 2.0 – Project Organization and Management......................................................pg#
SECTION 3.0 – Monitoring Approach.................................................................................pg#
SECTION 4.0 – Sample Procedures.....................................................................................pg#
SECTION 5.0 – Testing and Measurement Protocols..........................................................pg#
SECTION 6.0 – Quality Assurance / Quality Control A/QC)...............................................pg#
SECTION 7.0 – Data Handling Procedures.........................................................................pg#
SECTION 8.0 – Assessment and Oversight........................................................................ pg#
NRCS QAPP Page D-3
Project Identifier
Date
Quality Assurance Project Plan (QAPP)
This document provides an outline and description of minimum information required in each section for the QAPP when a project does not use EPA funds. When a project uses EPA funds, an EPA QAPP will be required. The participant will be responsible for the content in the QAPP and approval by EPA.
SECTION 1.0: PROJECT OVERVIEW AND OBJECTIVES
This section should provide sufficient detail to describe the overall project and the long-term anticipated outcome. Discussion on how this project can be related to monitoring at the outlet or in-stream for the HUC12 or other water body should be included if applicable.
SECTION 2.0: PROJECT ORGANIZATION AND MANAGEMENT
2.1 Project Contacts – in tabular format (Table 2.1). Include name, title, phone numbers and email for all involved parties including the participant, the data collector and laboratory contact.
2.2 Project Participants and Responsibilities – in tabular format. If the listed individual holds any particular certification or credentials, please list this with their name in Table 2.2.
Table 2.2 Roles & ResponsibilitiesIndividual(s) Responsible for: Authorized to:
Name Task Task
Action Action
SECTION 3.0: MONITORING APPROACH
This section should include:
1. Monitoring design – paired watershed or above and below approach with both baseline and treatment periods. Length of baseline and treatment periods.
2. Location map(s) that should include points to represent monitoring stations and polygons to represent drainage area. Appropriately label the control and treatment locations.
3. Monitoring duration and frequency.4. Major agricultural pollutant of concern of the HUC12 or water body must match one
of the constituents identified in item 6.5. Irrigation source water quality will be established by analyzing the concentration of
the constituents identified in item 6. This will be accomplished by taking at least one grab sample at the beginning of the irrigation season.
NRCS QAPP Page D-4
Project Identifier
Date
6. Constituents to be monitored at a minimum include:a. NH4-N (Ammonium only required when animal waste is land applied)b. N02-N + N03-N (Nitrate + Nitrite)c. TKN (Total Kjeldahl Nitrogen)d. Soluble Reactive P (Orthophosphate)e. TP (Total Phosphorus)f. SSC (Suspended Sediment Concentration) – Preferredg. TSS (Total Suspended Solids) – When SSC is not available through the lab
7. Practice(s) being monitored and whether these practices target the major agricultural pollutant of concern of the targeted HUC12 or water body
8. Estimated potential adoption and application of the monitored practice(s) within the targeted HUC12 or small watershed (<1,000 acres).
Also important in this section is a discussion of other monitoring efforts that will complement this project. Specifically identify any monitoring by other partners in-stream, at the outlet of the HUC12, and the outlet of the HUC8. Include in this discussion what is being monitored such as flow and constituents and whether these are grab samples or continuous. Describe the history of monitoring at these sites for example, if grab samples are used define how many samples per year and how many years the data has been gathered. If there is a site planned that is not yet operational but is expected to be installed provide a timeline for installation and an expected date for monitoring to initiate.
SECTION 4.0 SAMPLE PROCEDURES
Provide a discussion of the sampling equipment to be used with pictures0 if possible. Include the name brand of any data loggers and sensors. Also discuss any manual equipment such as a rain gauge and/or cork gauge.
Describe and provide samples in the Appendix of any site checklists that will be used for example, pre-event and runoff event checklists.
Describe calibration procedures used to ensure runoff monitoring system will respond as expected during actual events.
Describe the methods for collecting and handling samples include information on standard labeling procedures and where comments for any unusual circumstances surrounding samples will be stored. Include maximum holding times in the machine and preservation.
Provide details about how samples will be transported, which lab(s) will conduct the analysis and the chain of custody process and documentation. Year round monitoring is required. If there is a danger of freezing during the winter months, describe in detail how this will be overcome to ensure quality data collection during these times.
0 Maximum allowable photo resolution is 1.9 megapixels (1600X1200). All photographs must be date stamped. NRCS QAPP Page D-5
Project Identifier
Date
SECTION 5.0 TESTING AND MEASUREMENT PROTOCOLS
In tabular format provide the lab analysis method to be used; field headers should include the constituent, method number, method name, and maximum lab holding time for each constituent. An acceptable NEMI protocol must be followed.
SECTION 6.0 QUALITY ASSURANCE / QUALITY CONTROL (QA/QC)
Field blanks and/or duplicates must be used. Describe the methodology and frequency of use.
If appropriate, describe the calibration technique and potential corrective action(s) to be used for all sensors. If no setting for calibration exists describe the methodology for periodic checks to ensure stage accuracy.
Describe the laboratory calibration procedures employed by the lab(s) conducting analysis. This should include discussions for any equipment used in the analysis of the submitted samples.
Describe the methods to be used after each runoff event to statistically summarize data and observations include discussions on how these summaries will be stored and protected.
SECTION 7.0 DATA HANDLING PROCEDURES
Subsection 7.1 Methods for Data Acquisition and Storage
Monitoring data provided to NRCS contains Personally Identifiable Information (PII). At a minimum, this data must be transmitted in a zipped and password protected format. Describe additional measures taken to protect the participants PII.
Provide the step by step process that will be used to acquire data from the logger. Retrieve collected data weekly or bi-weekly to limit the amount of data potentially lost due to equipment failure or logger capacity limitations.
Explain where the raw data will be stored to ensure it is not lost and follow the naming convention and directory structure outlined in Appendix A.
Water Quality Data (excel spreadsheet) Site visit check lists or log book (.pdf) Laboratory analysis report (.pdf) Historical cultural data (excel spreadsheet) Certification practices are being maintained (excel spreadsheet) Cultural practices throughout the year (excel spreadsheet)
If there are provisions for creating backups of the raw data for archiving purposes explain this.
Subsection 7.2 Methods of Analyses
Discuss the steps leading up to and including discharge, and load and yield calculations. If there are situations that may require editing of the data, describe this in detail. Include how the determination would be made, corrections were needed, and how the corrections would take place.
NRCS QAPP Page D-6
Project Identifier
Date
Discuss data analysis methods used to ensure calibration of the paired basins.
Describe the hypothesis to be tested and the procedures to be used to statistically analyze the data including tests for normality and data transformations. Possible strategies are listed below:
Establishing a hypothesis and setting the desired significance level (α) to compare data. The objectives of loading evaluations may require very conservative statistical analysis (e.g. α = 0.05) to minimize the chance of not detecting an error. Yet, farmers utilizing adaptive management may accept more statistical risk when making management decisions or adjusting farming operations (e.g. α = 0.20).
Frequently, water quality data does not follow a normal distribution. Testing water quality data for normality is important to determine the type of statistical analysis to use (e.g. transformations, parametric, or non-parametric tests).
Analytical value – what will be compared (e.g. annual, monthly or weekly mean, mode, monthly or annual maximum loads, etc.)
For paired or above and below watershed analysis, develop regression relationships during the calibration period between the watersheds, and test to determine if this relationship significantly changes following application of conservation treatment.
SECTION 8.0 ASSESSMENT AND OVERSIGHT
Describe the method for assessing discharge data after a surface water runoff event to determine if corrections are needed. Examples for discussion would include 1) considerable flume tilt or observed ice or debris, 2) the expected outcome of regression analysis results in unusually large residual, or 3) the sample interval needed to capture the storm exceeded the capacity of the system. A method should be provided for documenting all of these situations.
Describe the method for assessing concentration data after a surface water runoff event. Discussions should include documentation methods for recording if samples were analyzed within the allowed holding time, if duplicates tested were within a relative standard deviation of less than 10%, if blanks show potential contamination and if concentrations were consistent when compared to other events.
An internal annual review of the monitoring process should be conducted. A checklist or series of questions should be developed to determine if the methods outlined in the QAPP are being followed for each storm and if not, why.
NRCS QAPP Page D-7
APPENDIX E – DATA DICTIONARY FOR WATER QUALITY DATA
umsid – Unique NRCS monitoring station identifier
mondes – Treated = t; Below = b; Control = c and Above = a
samptype –Monitoring phase associated with sample (e.g. baseline=bl or evaluation=ev)
colectdt – Sample collection date (MM/DD/YY)
colecttime – Military time sample collection initiated
All the constituent measurements below are flow weighted for the composite sample providing the Event Mean Concentration (EMC)
nh4_n – (ammonium N plus ammonia N) (mg N/l)
no2_3_n - (nitrite N plus nitrate N) concentration in (mg N/l)
tkn - Total Kjeldahl Nitrogen (mg/l)
nloss - Total pounds of nitrogen lost (lbs/ac)
srp - Soluble Reactive Phosphorus (Orthophosphate) (mg/l)
tp –total phosphorus (mg/l)
ploss – Total pounds of phosphorus lost (lbs/ac)
ssc - Suspended Sediment Concentration (mg/l)
ssctn - Suspended Sediment Concentration (English short tons) per event
tss - Total Suspended Solids (mg/l)
precip - Rainfall (in)
runoff – Total runoff volume per event (ac-in)
irrigate - Applied water (ac-in) associated with a sampling event. Acceptable values are zero (0) and above.
Page E-1
APPENDIX F – OPERATIONS FORMS
Page F-1
Page F-1
Page F-2

Page F-3
Page F-4
APPENDIX G – SAMPLE SITE VISIT CHECKLIST
Page G-1
Page G-2
US DEPARTMENT OF AGRICULTURE NATURAL RESOURCES CONSERVATION SERVICE
Monitoring & Evaluation Site Visit ChecklistSite LocationLandowner Participant: County, State Watershed Hydrologic Unit Code:
Sample Site Nomenclature: Sampler Serial Number: Arrival Time:Departure Time:
Pre-Event System Service Check (at least bi-monthly)Component Procedure Response
Bubbler Rate Rate of Expulsion #/secondBubbler Tube Tube Free From Obstruction? YES NoStilling Well Free from sediment? YES NoWater Level (Stage) Record Stage feetStage Adjustment Note Any Adjustment +/- feetSample Intake Tube Free From Obstruction? Yes NoBattery Check Battery Voltage each site visit VoltsBattery (monthly) Check battery under load VoltsPump Test (monthly) Verify operation through cycles Pass FailDesiccant Check if desiccant color is blue. Replace if pink. Pass FailPrecipitation Gauge Intake free from debris? Yes NoFlume Free from obstruction? Yes NoRepairs Replacement parts installed? Yes NoList any equipment issues, replacement parts, or problems:
Post Event Sample Collection Checklist Total # of Samples =For Composite Sampling For Sequential Sampling
ID a. IDVolume Collected Volume
b. IDVolume
c. IDVolume
d. IDVolume
Duplicate DuplicateID IDVolume Volume
Appearance AppearanceColor ColorOdor OdorAlgae Algae
Preservative Added Yes No Preservative Added Yes NoData Download Signature BlockPrecipitation Data Loaded Yes No Field Personnel: Date:
Flow Data Loaded Yes No