soil conservation and greenhouse gas emissions - sean
TRANSCRIPT
Soil Conservation and Greenhouse Gas Emissions: The Role of Reduced Tillage and Organic Agriculture in Soil Nitrous
Oxide Production
Sean Bloszies1, Shuijin Hu1, Peyton Ginakes2
North Carolina State University, University of Minnesota

Introduction
• Various farming systems are suggested to provide enhanced ecosystem services– Organic– Conservation / reduced tillage– Unconventional rotations
• In particular, soil carbon (C) sequestration is touted
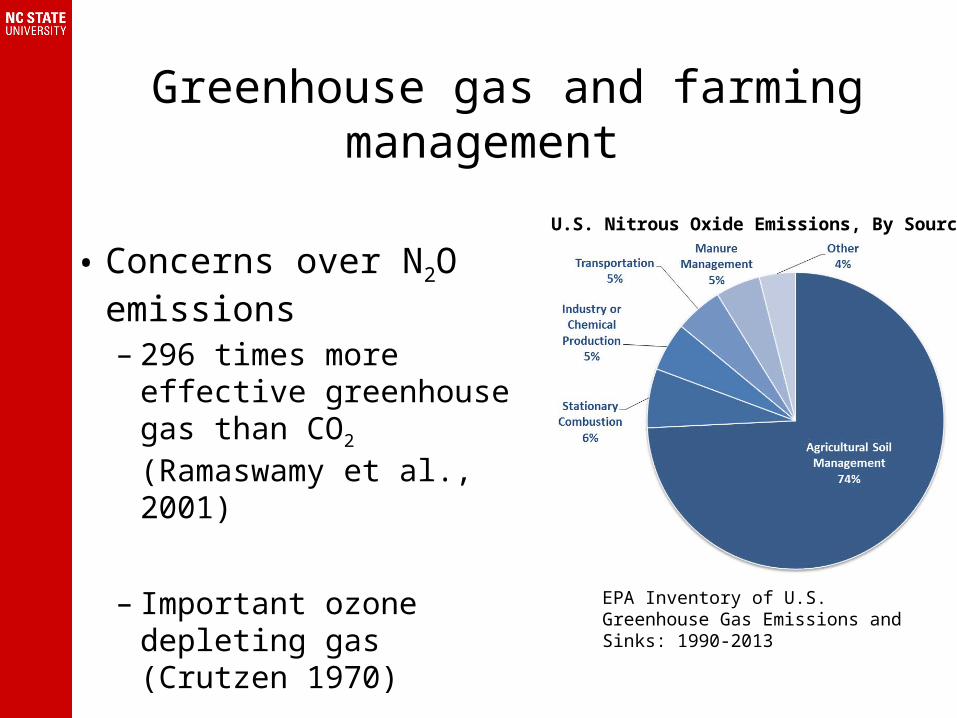
Greenhouse gas and farming management
• Concerns over N2O emissions– 296 times more effective
greenhouse gas than CO2 (Ramaswamy et al., 2001)
– Important ozone depleting gas (Crutzen 1970)
EPA Inventory of U.S. Greenhouse Gas Emissions and Sinks: 1990-2013
U.S. Nitrous Oxide Emissions, By Source
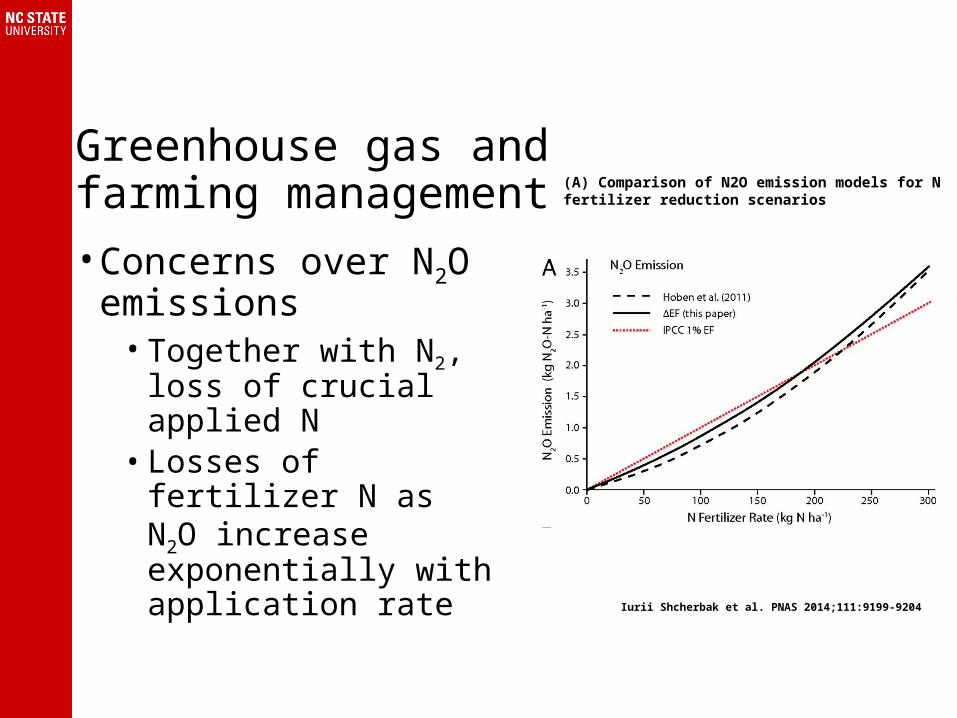
(A) Comparison of N2O emission models for N fertilizer reduction scenarios
Iurii Shcherbak et al. PNAS 2014;111:9199-9204
• Concerns over N2O emissions
• Together with N2, loss of crucial applied N
• Losses of fertilizer N as N2O increase exponentially with application rate
Greenhouse gas and farming management
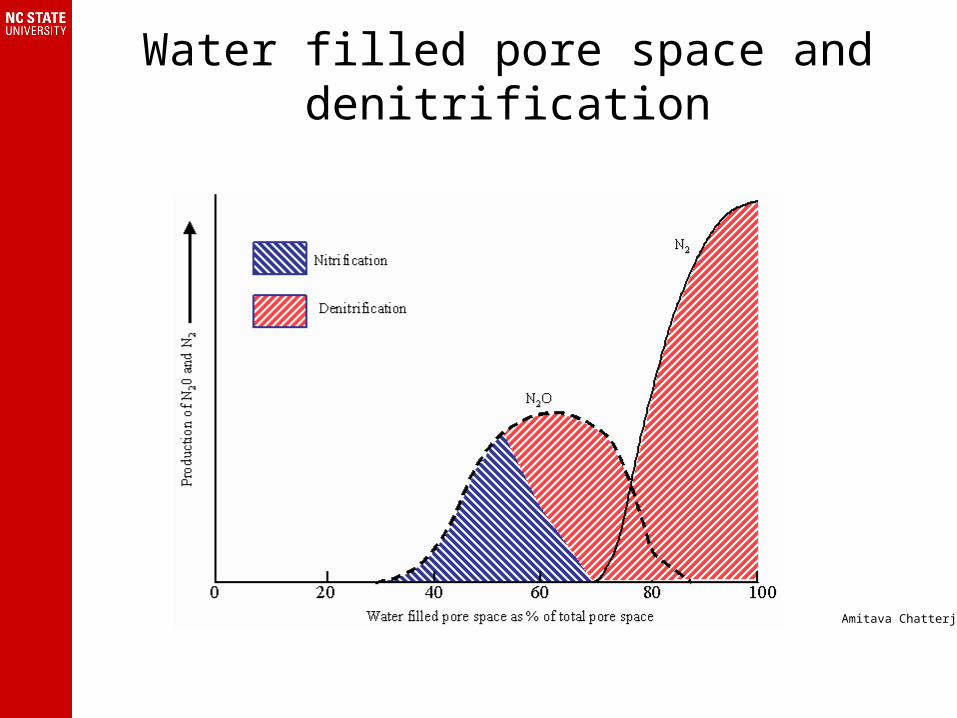
Water filled pore space and denitrification
Amitava Chatterjee
N2O and soil properties
• Things we do know affect N2O:– Water filled pore space– pH– Soil type– Temperature– Management
• Use of nitrification inhibitors, polymer coated fertilizers (Akiyama et al., 2010)
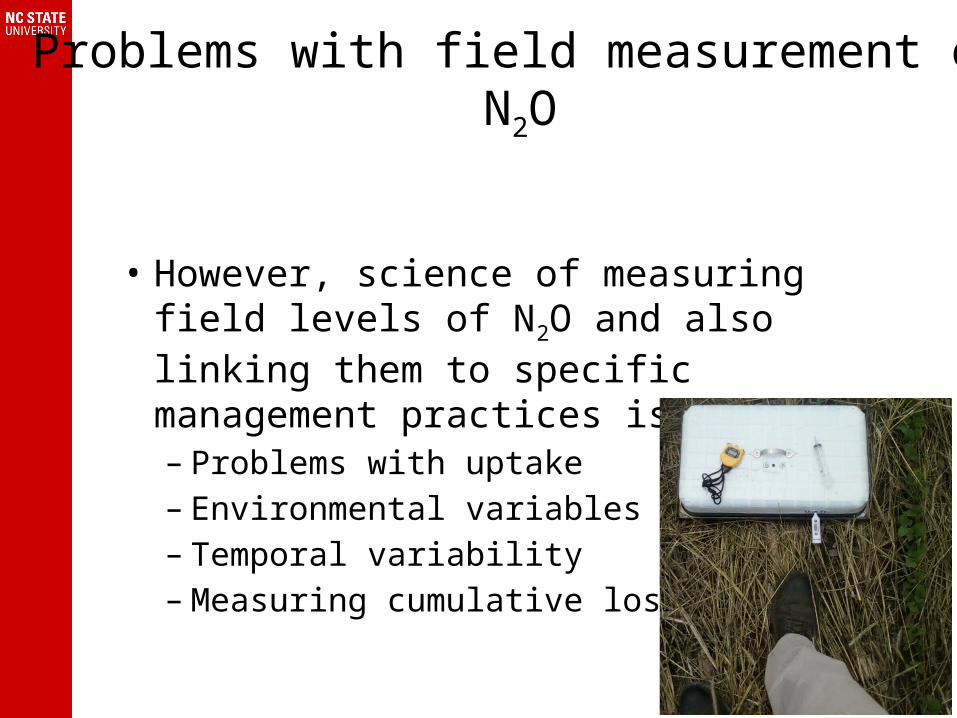
Problems with field measurement of N2O
• However, science of measuring field levels of N2O and also linking them to specific management practices is lacking– Problems with uptake– Environmental variables– Temporal variability– Measuring cumulative losses
Link between N2O emissions and mechanisms
• Mechanistic understanding of drivers of N2O lacking
• Particularly interested in different soil organic matter (OM) pools
Objectives
1. Compare different farming systems’ soils for their N2O emission potential
2. Link those emissions to differences in how these soils cycle N and C
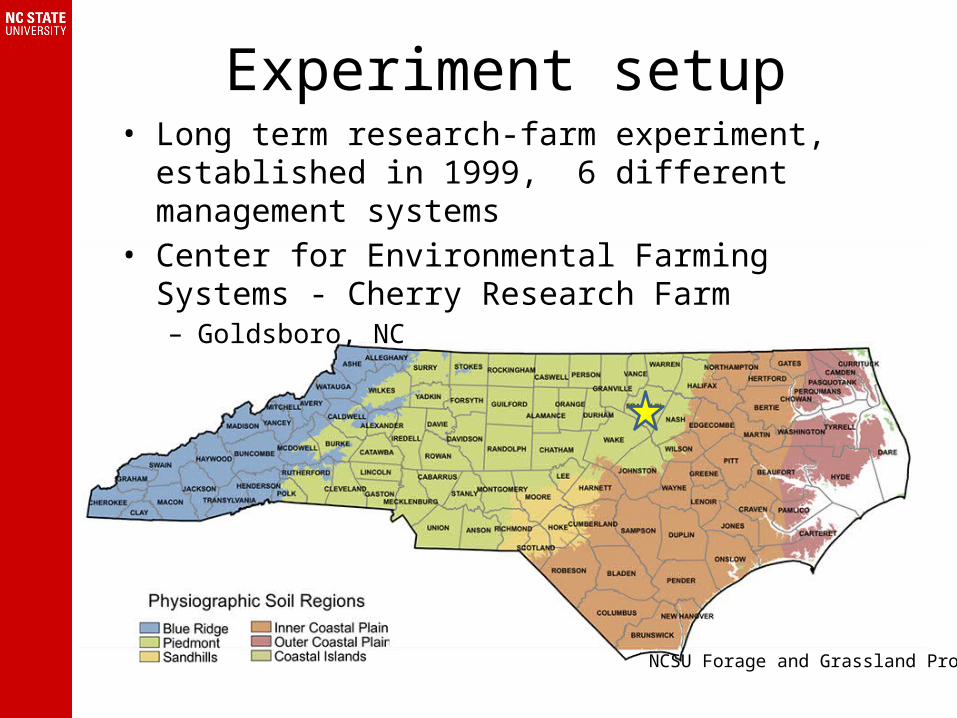
Experiment setup• Long term research-farm experiment, established in
1999, 6 different management systems• Center for Environmental Farming Systems -
Cherry Research Farm– Goldsboro, NC
NCSU Forage and Grassland Program
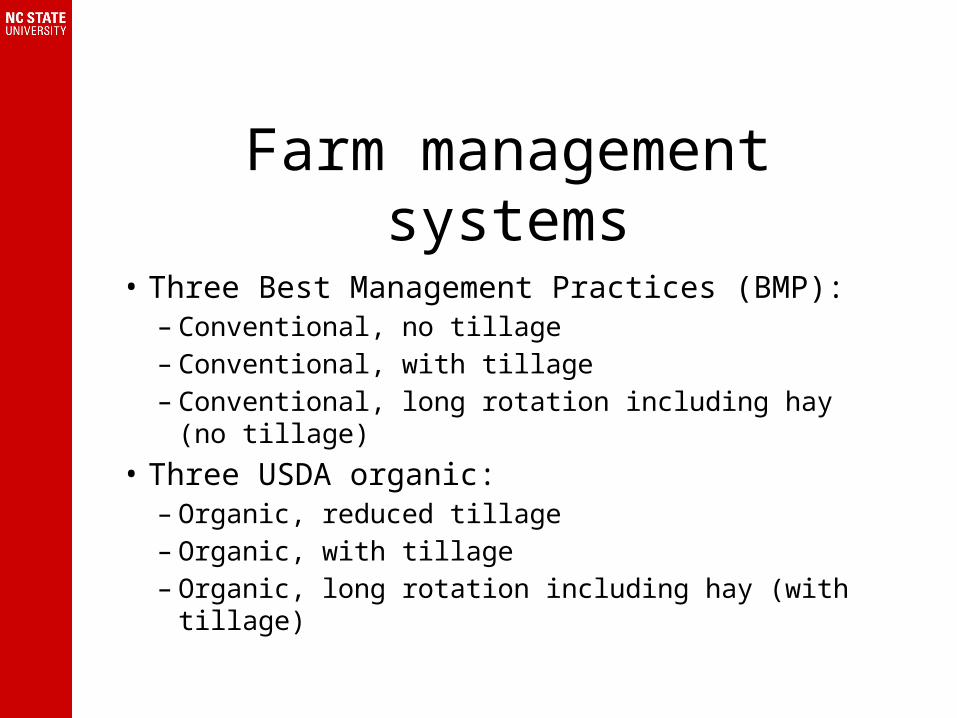
Farm management systems
• Three Best Management Practices (BMP):– Conventional, no tillage – Conventional, with tillage– Conventional, long rotation including hay (no tillage)
• Three USDA organic:– Organic, reduced tillage– Organic, with tillage– Organic, long rotation including hay (with tillage)
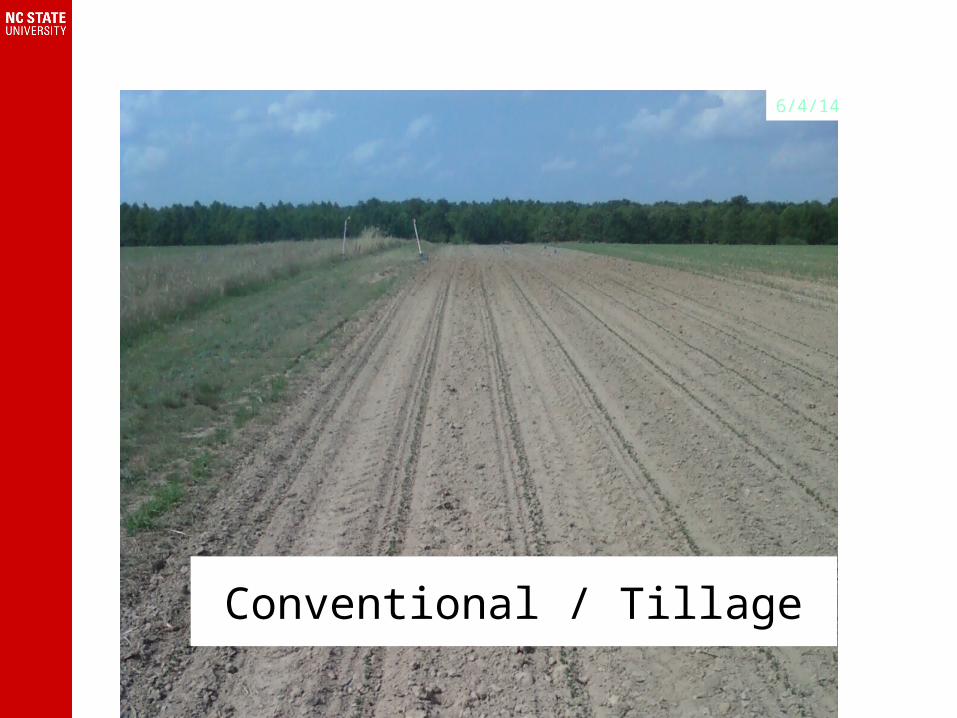
Conventional / Tillage
6/4/14
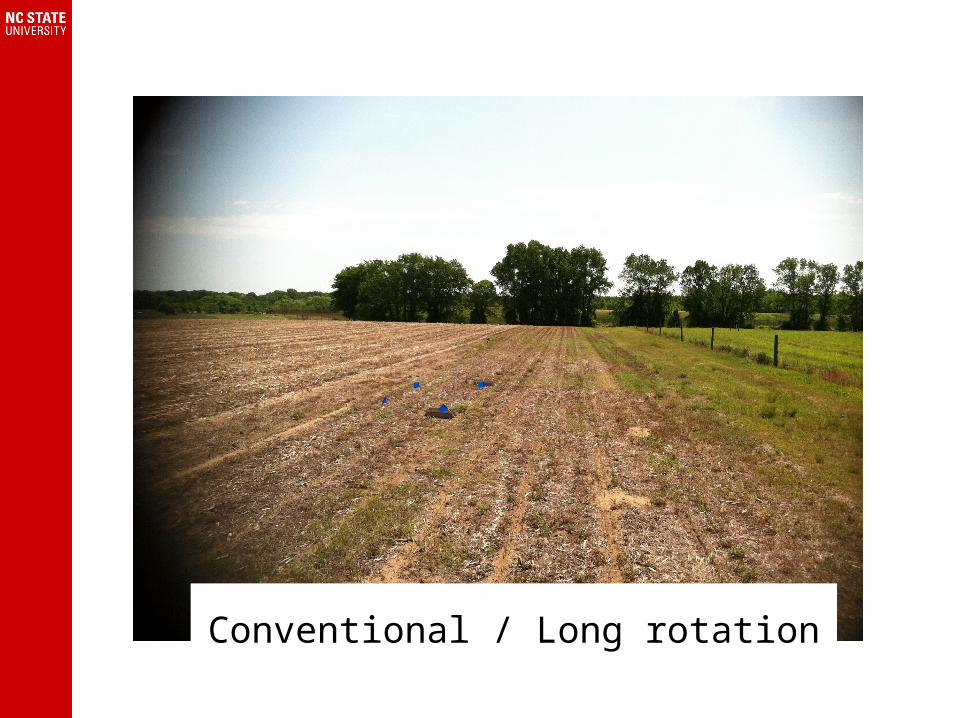
Conventional / Long rotation
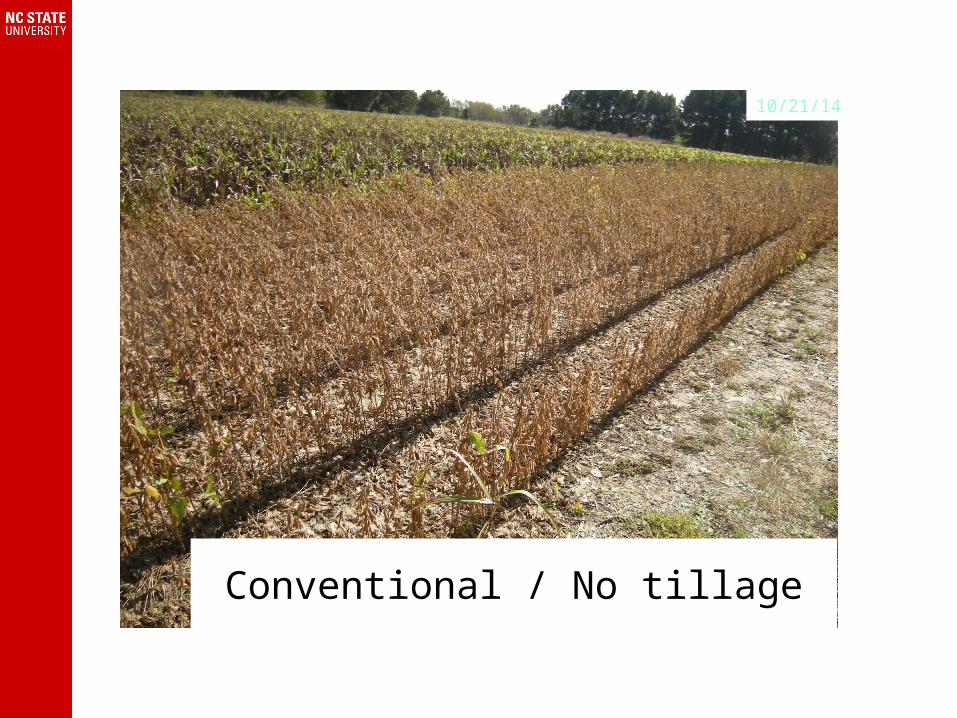
Conventional / No tillage
10/21/14

Organic/ Tillage
10/21/14
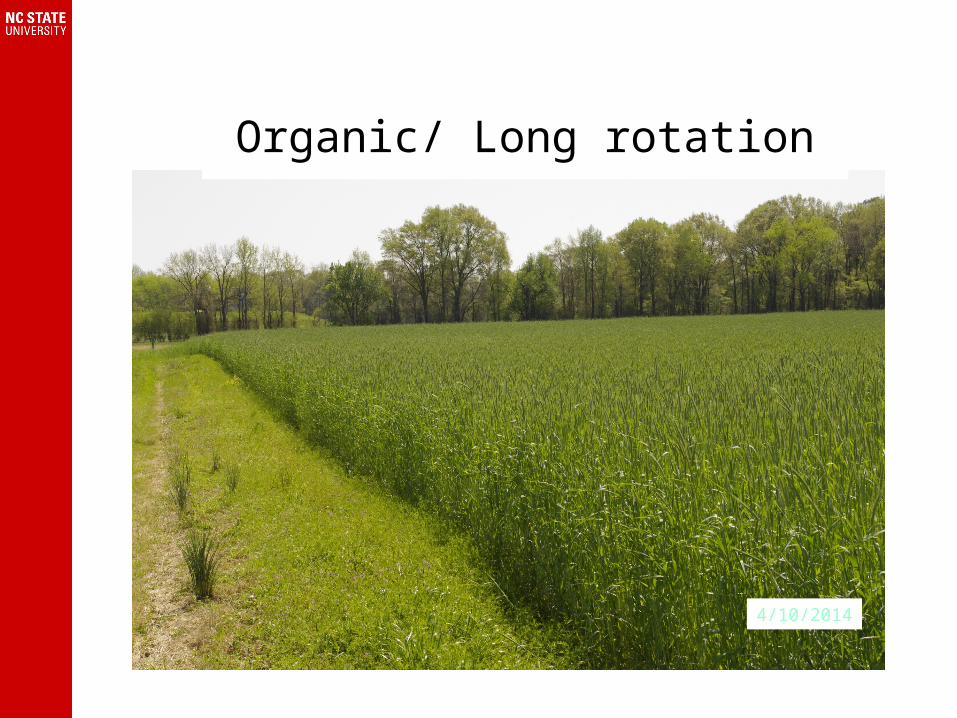
Organic/ Long rotation
4/10/2014

Organic / Reduced till
6/4/14

Organic / Reduced till
10/21/14
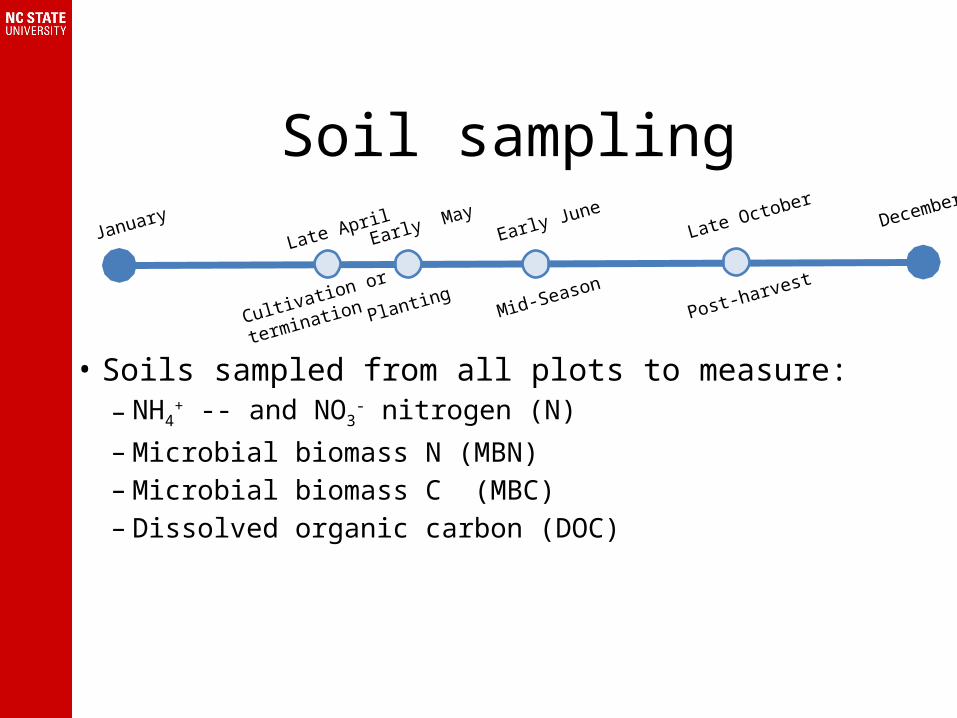
Soil sampling
• Soils sampled from all plots to measure:– NH4
+ -- and NO3- nitrogen (N)
– Microbial biomass N (MBN)– Microbial biomass C (MBC)– Dissolved organic carbon (DOC)
Late AprilEarly May
Early JuneLate October
Post-harvestMid-Season
PlantingCultivation or
termination
January December
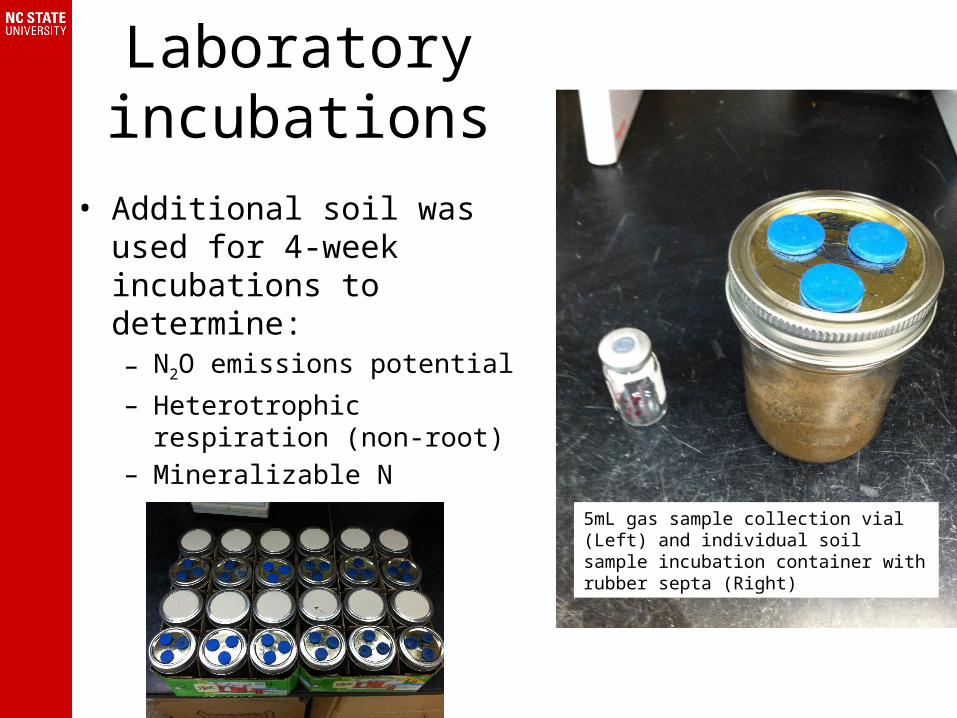
Laboratory incubations
• Additional soil was used for 4-week incubations to determine:– N2O emissions potential– Heterotrophic respiration (non-
root)– Mineralizable N
5mL gas sample collection vial (Left) and individual soil sample incubation container with rubber septa (Right)
Results
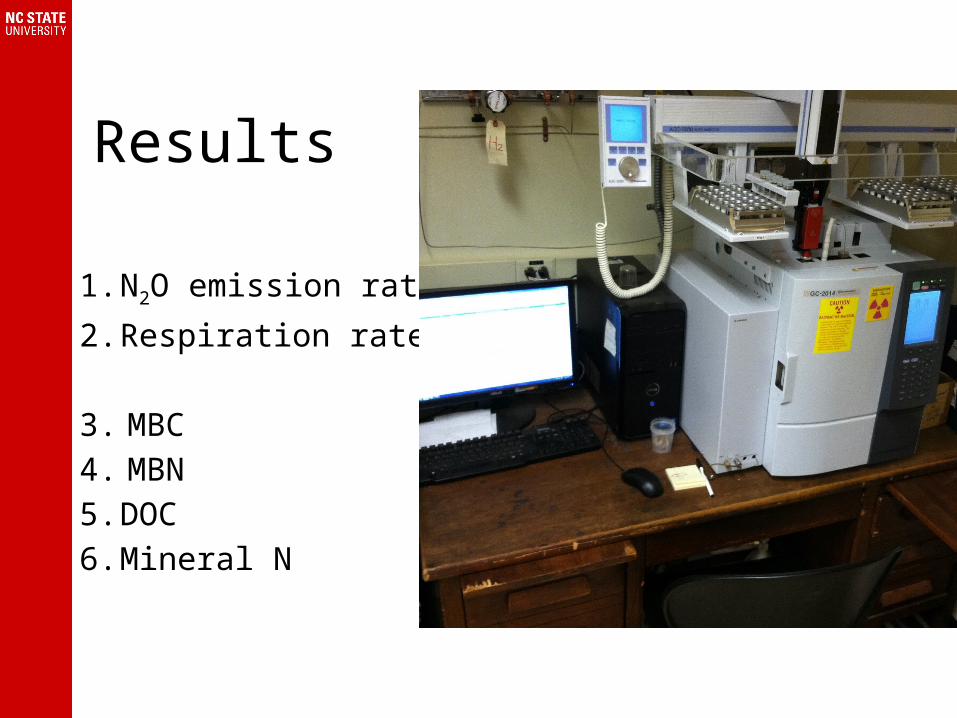
1. N2O emission rate2. Respiration rate.3. MBC4. MBN5. DOC6. Mineral N
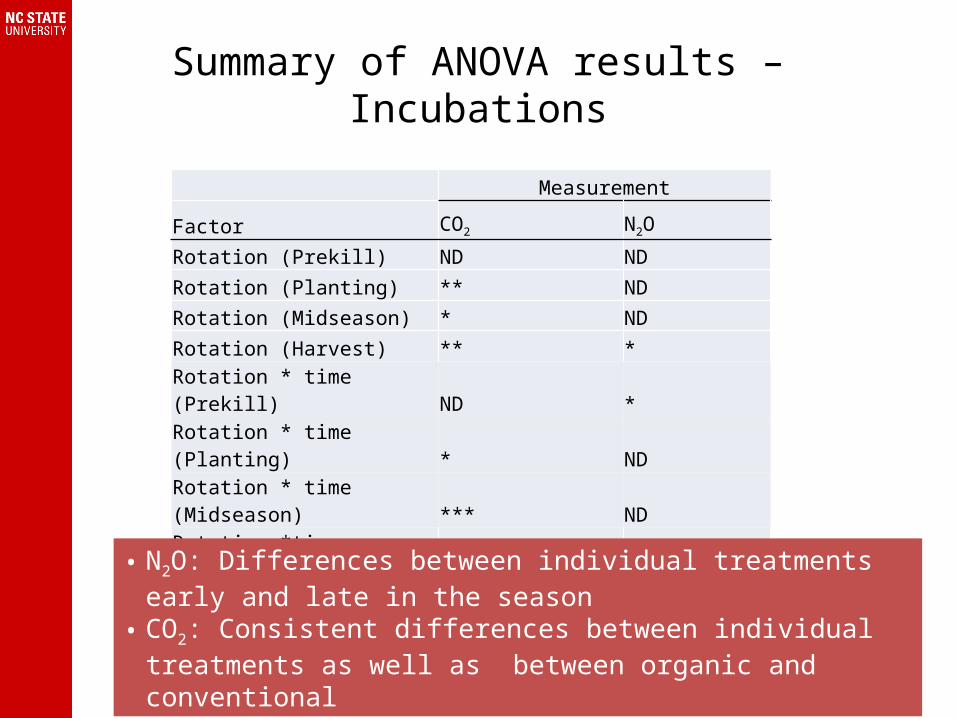
Summary of ANOVA results – Incubations
Measurement
Factor CO2 N2O
Rotation (Prekill) ND NDRotation (Planting) ** NDRotation (Midseason) * NDRotation (Harvest) ** *Rotation * time (Prekill) ND *Rotation * time (Planting) * NDRotation * time (Midseason) *** NDRotation *time (Harvest) ** ***
ND: P > 0.05; * = P <0.05, ** = P < 0.01, *** = P <0.001
• N2O: Differences between individual treatments early and late in the season
• CO2: Consistent differences between individual treatments as well as between organic and conventional
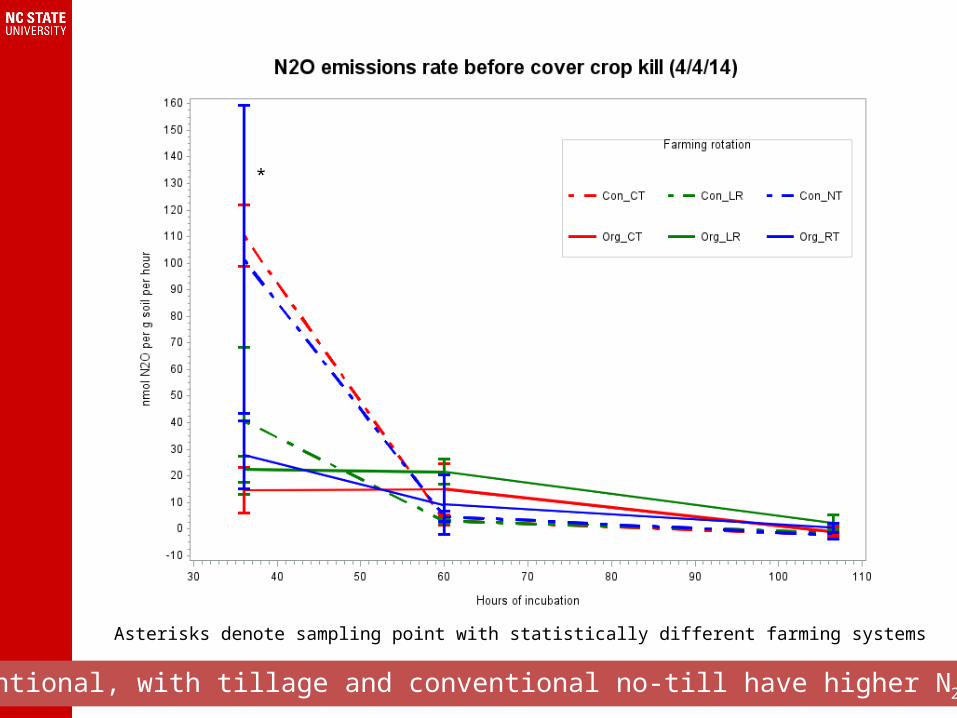
*
• Conventional, with tillage and conventional no-till have higher N2O in April
Asterisks denote sampling point with statistically different farming systems
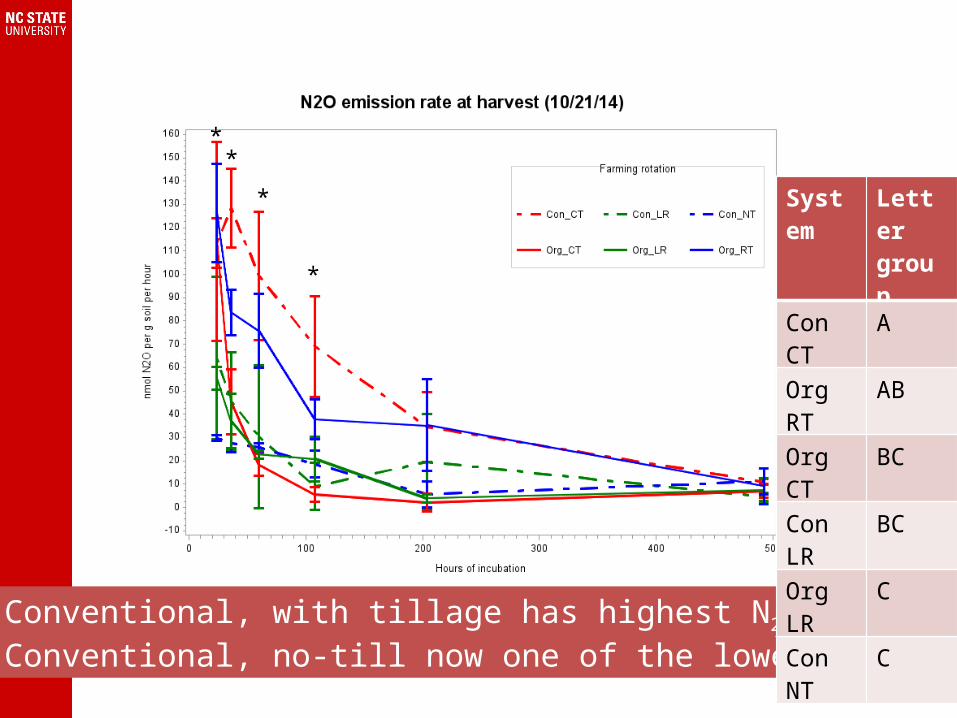
• Conventional, with tillage has highest N2O in October• Conventional, no-till now one of the lowest treatments
*
*
**
System Letter group
Con CT A
Org RT AB
Org CT BC
Con LR BC
Org LR C
Con NT C
CO2
© Nevit Dilmen
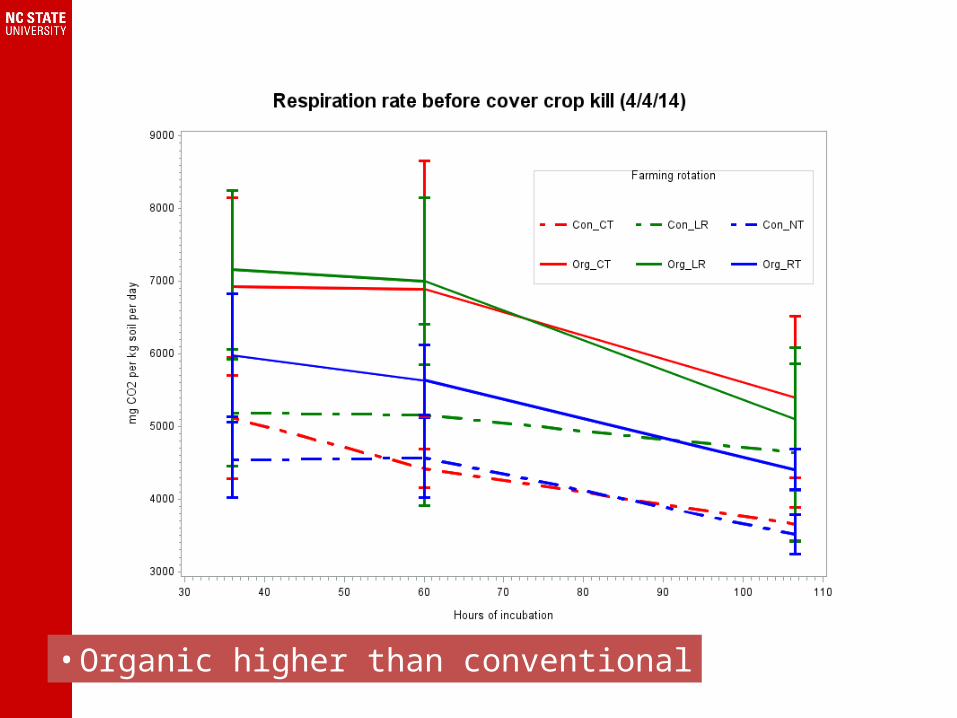
• Organic higher than conventional
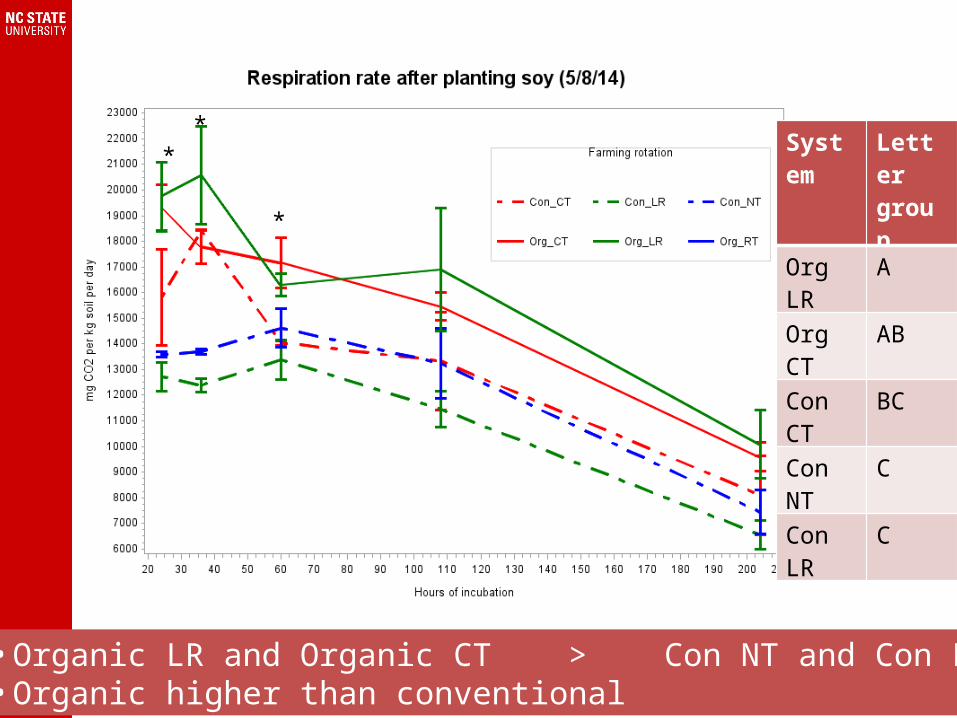
• Organic LR and Organic CT > Con NT and Con LR• Organic higher than conventional
*
**
System Letter group
Org LR A
Org CT AB
Con CT BC
Con NT C
Con LR C
**
*
*
• Organic higher than conventional
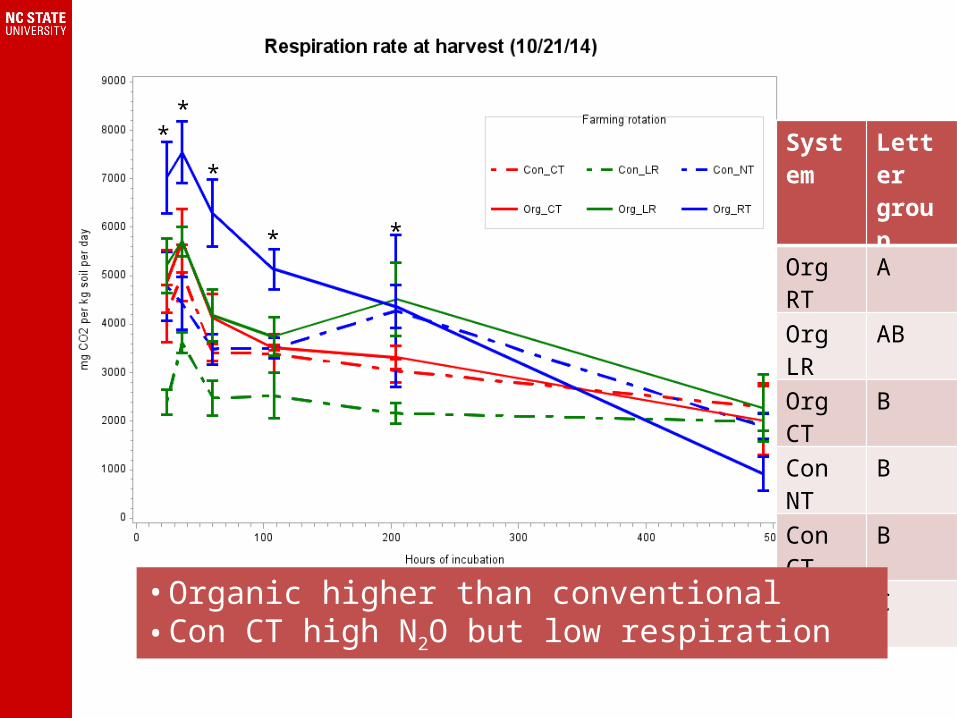
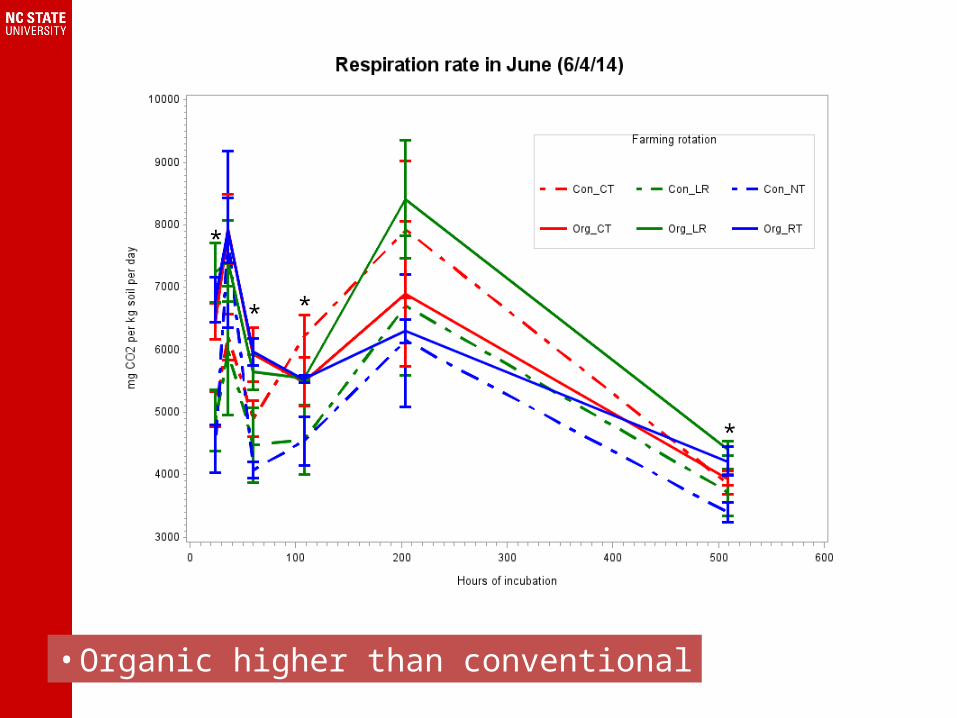
*
**
**
System Letter group
Org RT A
Org LR AB
Org CT B
Con NT B
Con CT B
Con LR C
• Organic higher than conventional • Con CT high N2O but low respiration
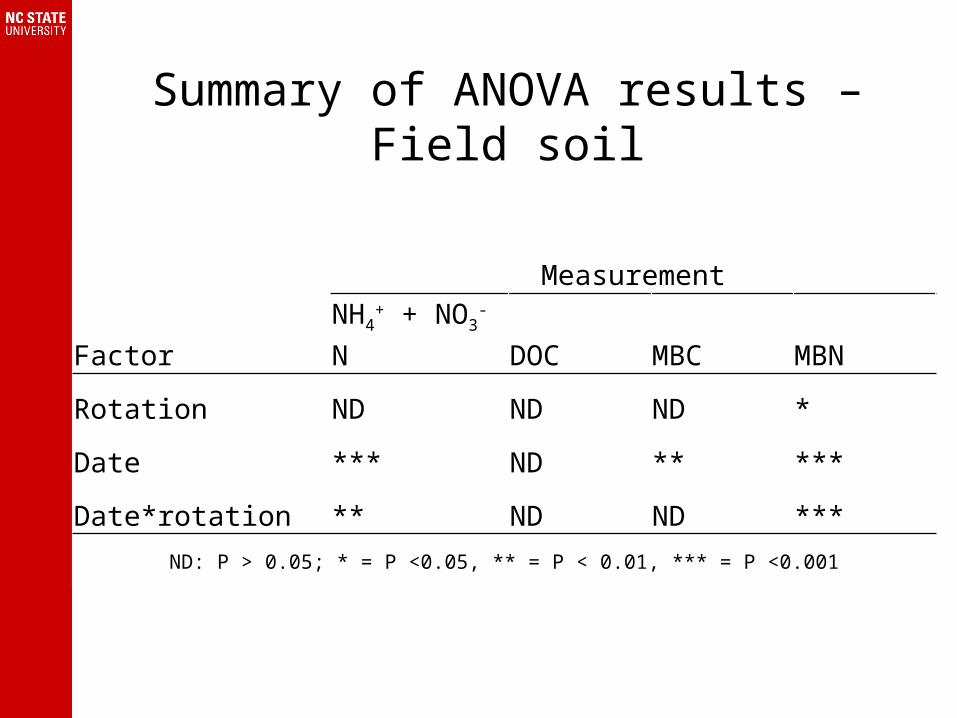
Summary of ANOVA results – Field soil
Measurement
Factor NH4+ + NO3
- N DOC MBC MBN
Rotation ND ND ND *
Date *** ND ** ***
Date*rotation ** ND ND ***ND: P > 0.05; * = P <0.05, ** = P < 0.01, *** = P <0.001
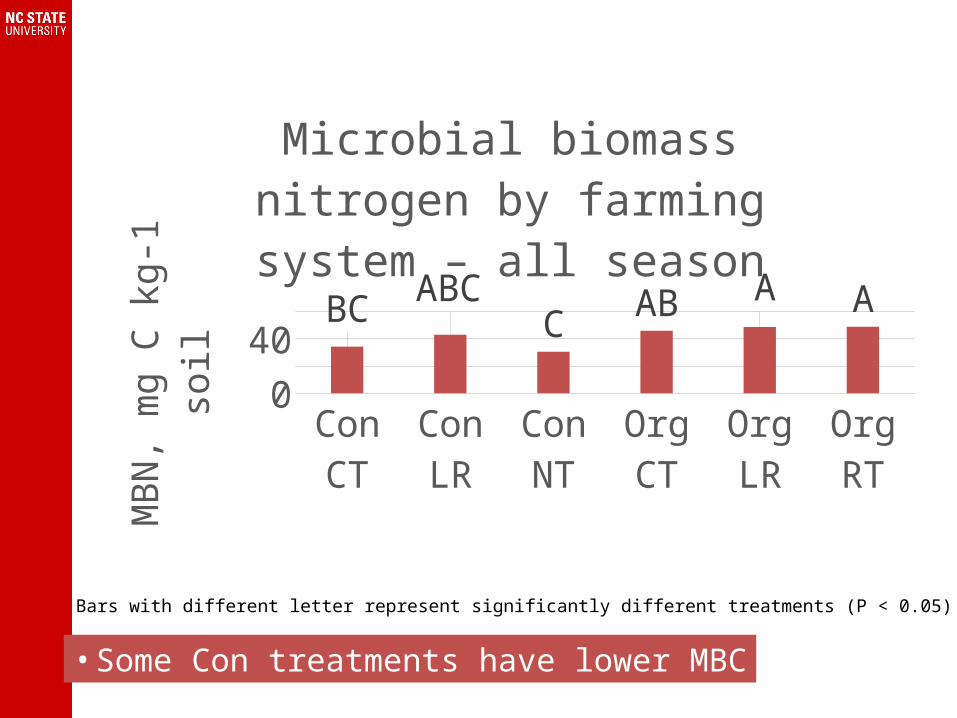
Con CT Con LR Con NT Org CT Org LR Org RT0102030405060
BCABC
C
AB A A
Microbial biomass nitrogen by farming system – all season
MBN
, mg
C kg
-1 so
il
Bars with different letter represent significantly different treatments (P < 0.05)
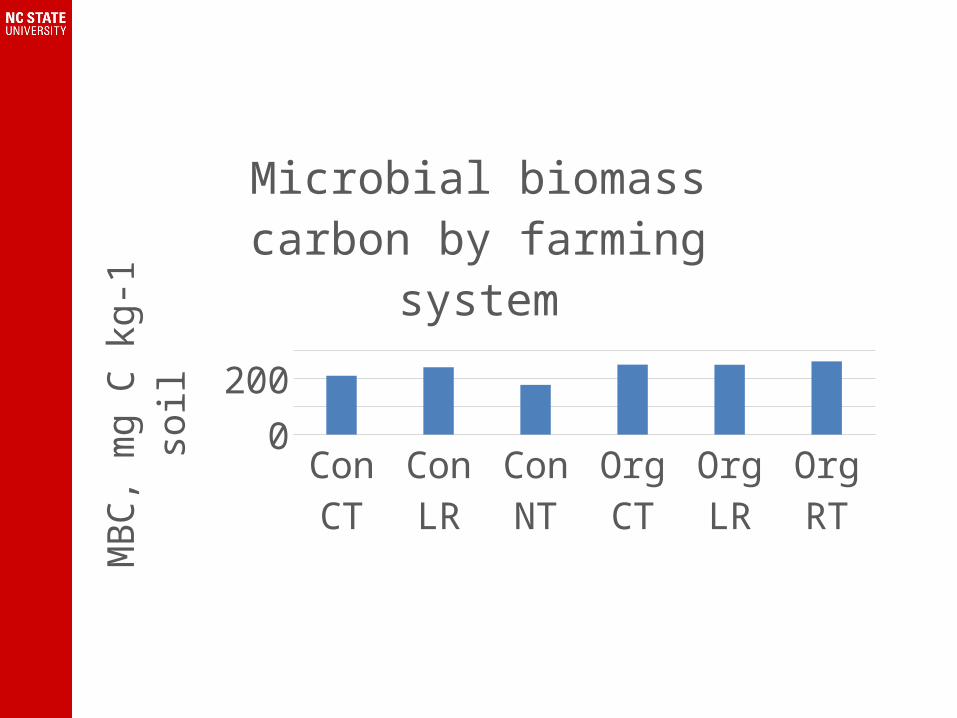
• Some Con treatments have lower MBC

Con CT Con LR Con NT
Org CT Org LR Org RT0
20
40
60
CBC
C
AB AABC
Microbial biomass nitrogen by farming system - April
MBN
, mg
N k
g-1
soil
• Some Con treatments have lower MBC
Con CT Con LR Con NT
Org CT Org LR Org RT0
20
40
60AB
AB
BAB A A
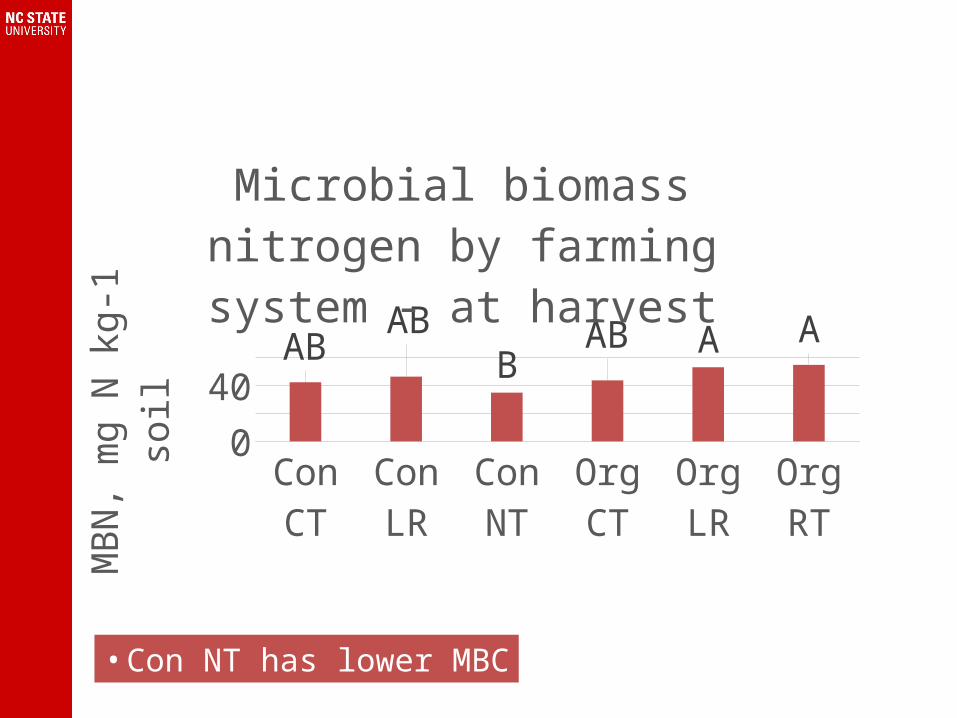
Microbial biomass nitrogen by farming system - at harvest
MBN
, mg
N k
g-1
soil
• Con NT has lower MBC
Con CT
Con LR
Con NT
Org CT Org LR Org RT05
101520
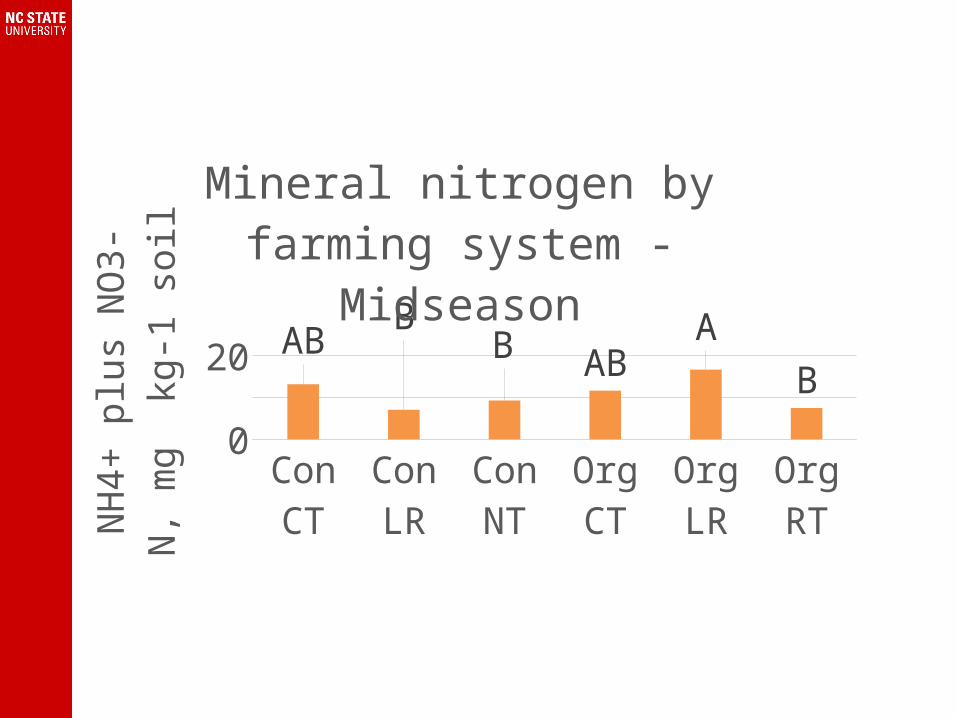
AB B B AB
A
B
Mineral nitrogen by farming system - Midseason
NH4
+ pl
us N
O3-
N, m
g
kg-1
soil
Con CT
Con LR
Con NT
Org CT Org LR Org RT02468
1012
Mineral nitrogen by farming system - At harvest
NH4
+ pl
us N
O3-
N, m
g
kg-1
soil
A
B
Con CT
Con LR Con NT
Org CT Org LR Org RT0
100
200
300
Microbial biomass carbon by farm-ing system
MBC
, mg
C kg
-1 so
il
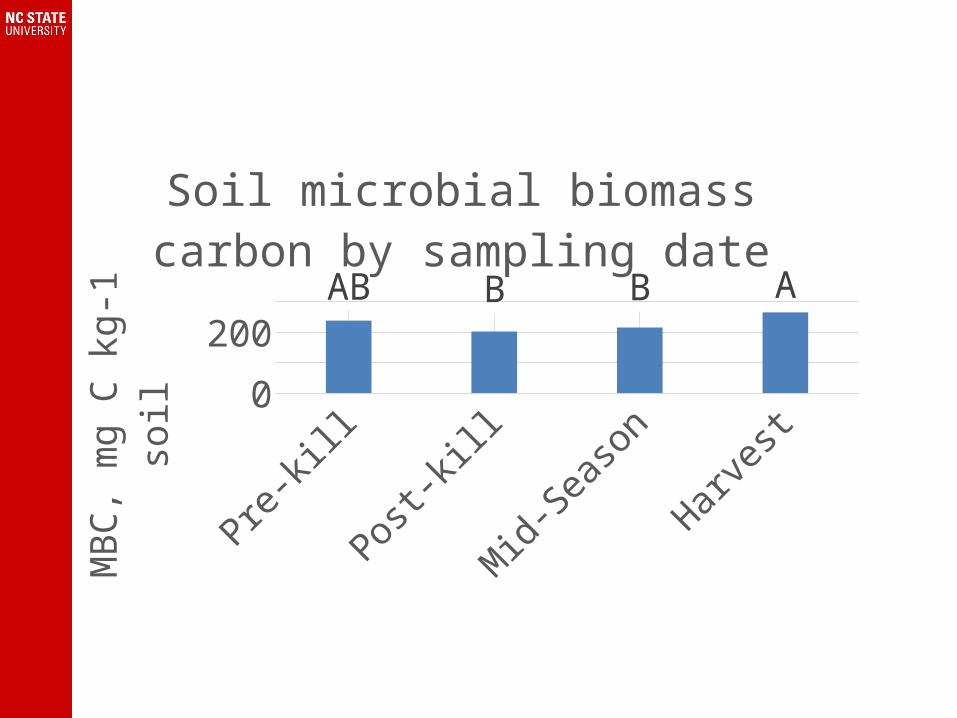
Pre-kill Post-kill Mid-Season Harvest050
100150200250300 AB B B
A
Soil microbial biomass carbon by sampling date
MBC
, mg
C kg
-1 so
il

Summary
• Some indication there is more of a flush in N2O from conventional-CT soil in incubations
• Higher microbial activity early and late in the season
• Possible connection between microbial uptake of N and lower N2O
Thanks also to:USDA-NIFA Organic Transitions
• Some indication there is more of a flush in N2O from conventional-CT soil in incubations
• Higher microbial activity early and late in the season
• Possible connection between microbial uptake of N and lower N2O

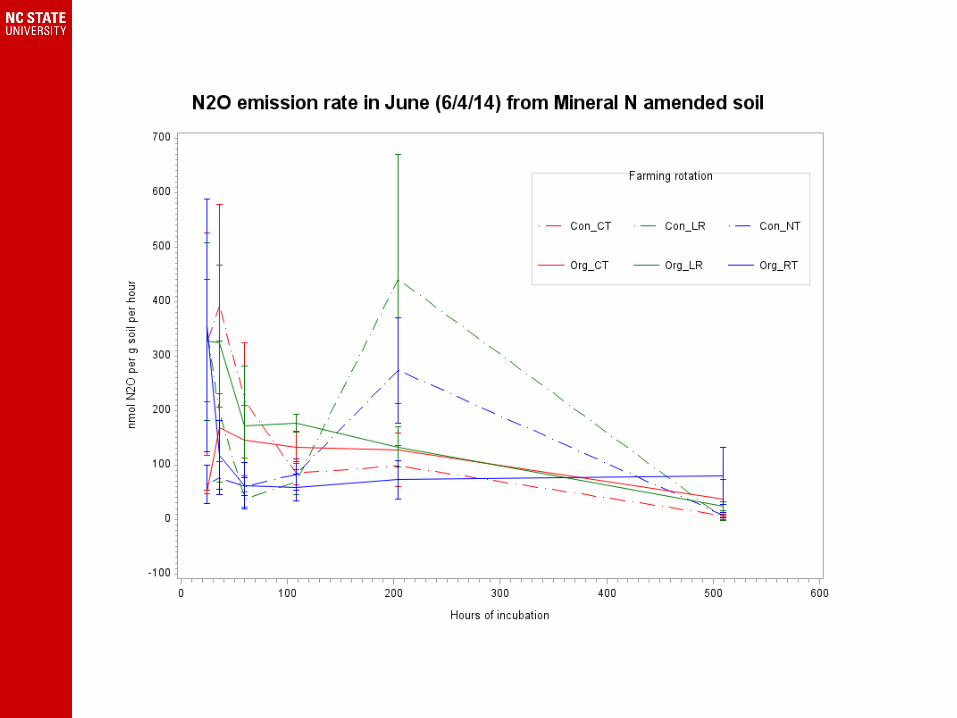
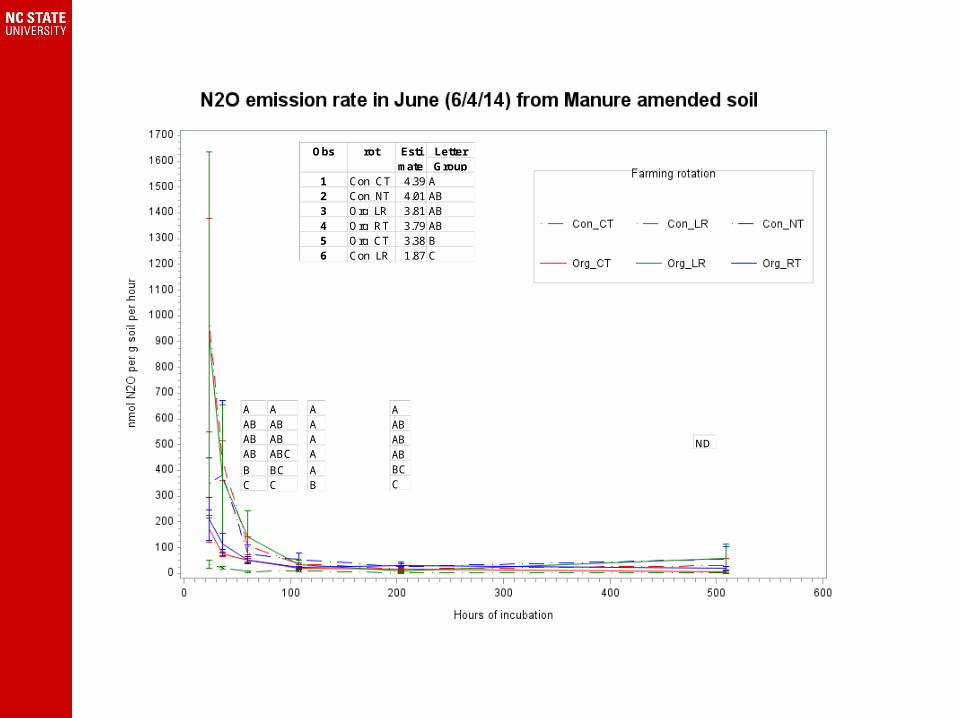
Manure vs mineral N experiment
AABABABBCC
AABABABBC
AABABABCBCC
AAAAAB
LetterGroup
1 Con_CT 4.39 A2 Con_NT 4.01 AB3 Org_LR 3.81 AB4 Org_RT 3.79 AB5 Org_CT 3.38 B6 Con_LR 1.87 C
Obs rot Estimate
ND
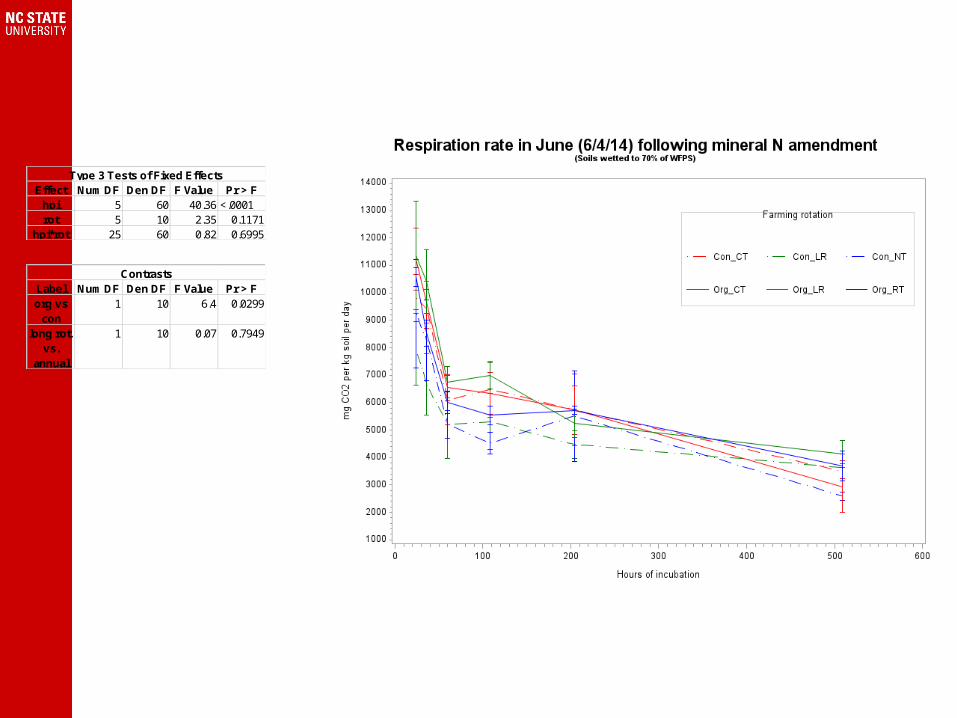
Effect Num DF Den DF F Value Pr > Fhpi 5 60 40.36 <.0001rot 5 10 2.35 0.1171
hpi*rot 25 60 0.82 0.6995
Type 3 Tests of Fixed Effects
Label Num DF Den DF F Value Pr > Forg vs
con1 10 6.4 0.0299
long rot. vs.
annual
1 10 0.07 0.7949
Contrasts

Effect Num DF Den DF F Value Pr > Fhpi 5 60 19.34 <.0001rot 5 10 2.32 0.1205
hpi*rot 25 60 0.74 0.794
Type 3 Tests of Fixed Effects
Label Num DF Den DF F Value Pr > Forg vs
con1 10 7.21 0.0229
long rot. vs.
annual
1 10 3.19 0.1046
Contrasts
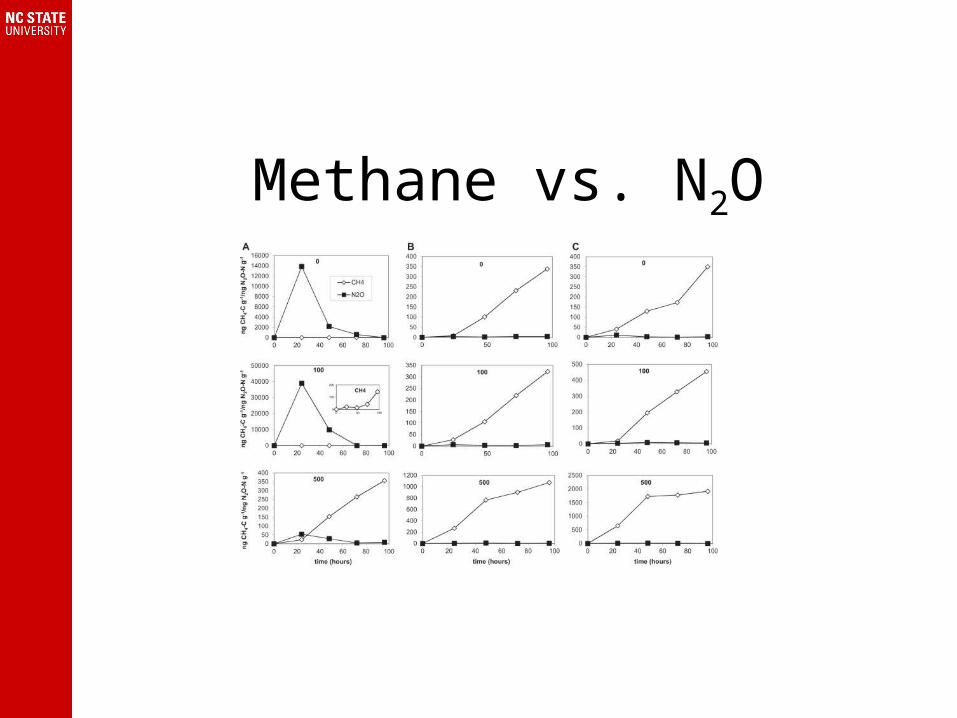
Methane vs. N2O