soil co 2 production and transport in the drought experiment in caxiuana national forest, para,...
TRANSCRIPT
Soil CO2 production and transport in the drought experiment in Caxiuana
National Forest, Para, Brazil.
Eleneide Doff Sotta Antonio Carlos Lola Rosiene Keila da Paixao Edzo Veldkamp Brenda Rocha Guimaraes Patrick Meir Alessandro Rosario Maria de Lourdes RuivoLuitgard Schwendenmann

Purpose of the study
• Estimate soil CO2 production in deep soil
• Test which model of soil gas diffusivity better work for Caxiuana soils
• Show how CO2 production rate varies with seasons and under drought
conditions
Background:
CO2 Transpo
rt
CO2
Emission
Microbial respirati
on
CO2 Diffusion
CO2 concentration
in soil airRoot
respiration
Soil water contentSoil total porositySoil air pore spaceField capacity
Soil water content Soil temperatureLitterfallRadiation
Environmental factors

Drought experiment: site description
Period of the measurements:from Jan to Dec 2002 Bi-weekly and from Jan to Nov 2003 monthly
ControlTreatment
~ 90% water exclusion
Experimental design: 2 plots of 1 ha each• 16 efflux chambers per plot • 4 soil shafts per plot
Localization:Caxiuana National Forest, Para, Brazil
Forest type: Terra firme
Soil type: oxisol and ultisol

Sampling and sample processing
Soil CO2 efflux• PVC rings covered with a lid for 5 min. • Closed dynamic system (LiCor 6262)
Soil air CO2 concentration• 30 mL plastic syringes • 0.5 mL samples injected in a gas chromatograph
Rn measurementsRn concentration:• soil gas samples same depth (Lucas cells)• Impulses counted with a Radon monitor Rn activity:• incubation of soil samples for 4 weeks (wet and dry conditions)
Pits instrumentation
• Stainless steel tubing • Thermocouple T-probes
Depths (cm) : 5 10 25 50100200300
• Soil moisture sensors
(TDR) Depths (cm):0-30 (vertically) 50 100 200 300

1) Calculation of diffusion coefficient through empirical formulas:
Non-aggregated porous media Millington & Quirk (1961)Aggregated porous media Millington & Shaerer (1971)
Parameters given: Total pore space, soil water content, Air pore space, field capacity
Method: CO2 production rates
P CO2 production (mg C m-2 h-
1)
2) Validation of diffusion coefficient with the help of Radon concentration profileNumerical solution of transport for Radon in the soil air
Parameters given: Radon production, diffusion coefficient
PCO2 per layer is calculated from Fick’s first law
Topsoil PCO2 (including litter layer)
PCO2 topsoil = soil CO2 efflux – PCO2 modelled.
0 – 50 cm
50 - 300 cm
PCO2 topsoil
PCO2 modelled
Soil CO2 efflux
d Diffusion coefficient (m2 h-1)
Pi
Fi+1 [Ci+1]
[Ci]
[Ci-1]
Fi
Fi-1
di-1
di
di+1
[C] CO2 concentration in soil air (mg C m-3)
F CO2 flux between layers (mg C m-2 h-1)
i Layers
Davidson & Trumbore (1995)

Simulated vs. measured Radon concentration
A dry season
0
50
100
150
200
250
300
350
400
450
0 10000 20000 30000
222Rn activity (Bq m -3)
so
il d
ep
th (
cm
)
measured Rn concentration
Simulated Rn concentrationnon-aggregated model
aggregated model
B dry season
0
50
100
150
200
250
300
350
400
450
0 10000 20000 30000
222Rn activity (Bq m -3)
soil
dep
th (
cm)
B wet season
0
50
100
150
200
250
300
350
400
450
0 10000 20000 30000
222Rn activity (Bq m -3)
soil
dep
th (
cm)

Results: Soil CO2 concentrationJa
n-02
Feb
-02
Mar
-02
Apr
-02
May
-02
Jun-
02
Jul-0
2
Aug
-02
Sep
-02
Oct
-02
Nov
-02
Dec
-02
Jan-
03
Feb
-03
Mar
-03
Apr
-03
May
-03
Jun-
03
Jul-0
3
Sep
-03
Oct
-03
Nov
-03
0.05
0.10
0.25
0.50
1.00
2.00
3.00
So
il d
epth
(m
)
Control
0-1
1-2
2-3
3-4
4-5
5-6
6-7
CO2 (%)
Jan-
02
Feb
-02
Mar
-02
Apr
-02
May
-02
Jun-
02
Jul-0
2
Aug
-02
Sep
-02
Oct
-02
Nov
-02
Dec
-02
Jan-
03
Feb
-03
Mar
-03
Apr
-03
May
-03
Jun-
03
Jul-0
3
Sep
-03
Oct
-03
Nov
-03
0.05
0.10
0.25
0.50
1.00
2.00
3.00
So
il d
epth
(m
)
Treatment
0-1
1-2
2-3
3-4
4-5
CO2 (%)
SeasonalityBoth plots had higher concentration during wet season
Wet = up to 2.0 % upper layers
Drought effect Treatment plot had lower CO2 concentration
Control = 3.2 %Treatment = 1.0 %

Results: CO2 concentration profile
Control
0
50
100
150
200
250
300
350
0 1 2 3 4 5 6
CO2 concentration in soil air (%)
So
il d
epth
(cm
)
Treatment
0
50
100
150
200
250
300
350
0 1 2 3 4 5 6
CO2 concentration in soil air (%)
So
il d
epth
(cm
)
w et season
dry season
Wet season: Big difference on the first 5 cm depthAlmost no change in [CO2] in the profile
Drought effect: ~50 % lower [CO2] in the profile

Results: estimates of soil CO2 production
Average CO2 production rate:Control = 170.1 ± 4.7 mg C m-2 h-1 Treatment = 137.3 ± 5.8 mg C m-2 h-1
No difference during wet season
0
50
100
150
200
250
Jan-02 Mar-02 May-02 Jul-02 Sep-02 Oct-02 Dec-02 Feb-03 Apr-03 Jun-03 Aug-03 Oct-03 Dec-03
CO
2 p
rod
uc
tio
n (
mg
C m
-2 h
-1)
Control 0 - 0.5 m Control 0.5 - 3.0 m
Treatment 0 - 0.5 m Treatment 0.5 - 3.0 m
dry seasonwet season dry seasonwet season
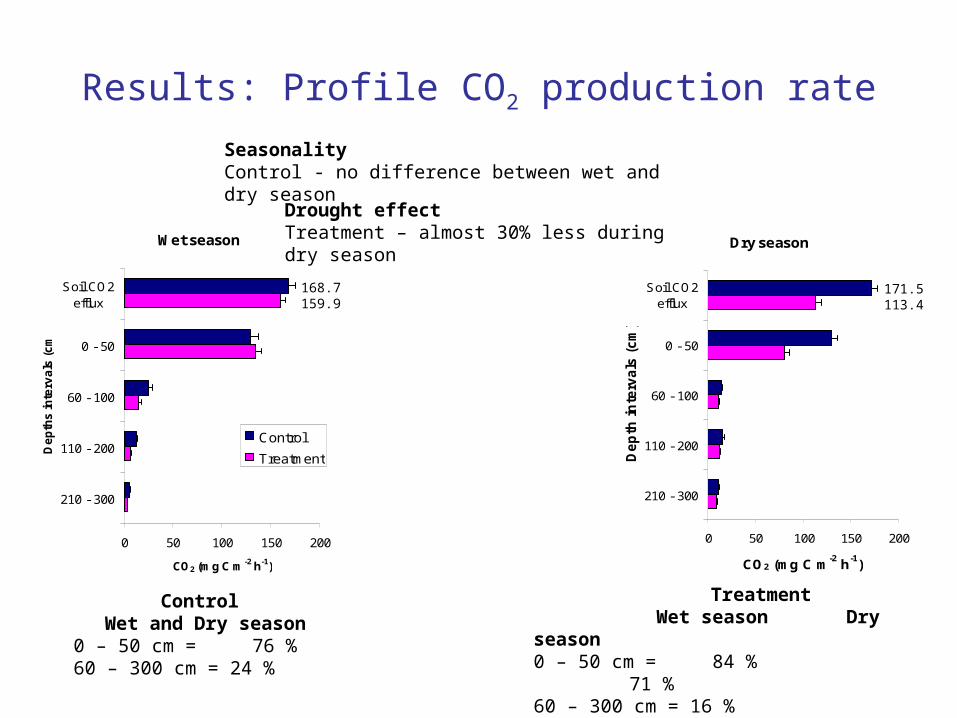
Results: Profile CO2 production rate
Wet season
0 50 100 150 200
Soil CO2efflux
0 - 50
60 - 100
110 - 200
210 - 300
De
pth
s in
terv
als
(c
m)
CO2 (mg C m-2 h-1)
Control
Treatment
SeasonalityControl - no difference between wet and dry season
Control Wet and Dry season
0 – 50 cm = 76 %60 – 300 cm = 24 %
Treatment Wet season Dry season0 – 50 cm = 84 % 71 %60 – 300 cm = 16 % 29 %
168.7159.9
Dry season
0 50 100 150 200
Soil CO2efflux
0 - 50
60 - 100
110 - 200
210 - 300
De
pth
in
terv
als
(c
m)
CO2 (mg C m-2 h-1)
171.5113.4
Drought effect Treatment – almost 30% less during dry season

Correlations: PCO2 and environmental factors
PCO2
SoilMoistur
e
SoilTemperatu
re
AirTemperatu
reRadiatio
nRainfal
l
Litter (1 month lag)
Soil depth Total Leaves Flowers Twigs
0 - 0.5 m
-0.23n.s. 0.33n.s. -0.16n.s. -0.08n.s.
-0.21n.s.
0.23n.s.
-0.04n.s.
0.59* 0.47n.s.
0.6 - 1 m
0.82** -0.60** -0.22n.s. 0.63**
-0.14n.s.
-0.61** -0.55*
-0.28n.s.
-0.24n.s.
1.1 – 2 m
-0.12n.s. 0.24n.s. 0.72** -0.51* 0.72**
-0.37n.s.
-0.16n.s.
-0.68**
-0.06n.s.
2.1 – 3 m -0.55** 0.47* 0.81** -0.81** 0.66** 0.11n.s. 0.34n.s. -0.58* 0.03n.s.
PCO2
Soil Moisture
SoilTemperatur
e
AirTemperatu
reRadiatio
nRainfal
l
Litter (without lag)
Soil depth Total Leaves Flowers Twigs
0 - 0.5 m
0.76** -0.41n.s. -0.70** 0.84** -0.73**
-0.37n.s.
-0.62* 0.52* 0.67**
0.6 - 1 m
0.57** -0.47* -0.26n.s. 0.59**
-0.35n.s.
0.14n.s.
-0.05n.s.
0.65** 0.00n.s.
1.1 – 2 m
-0.43* 0.47* 0.81** -0.67** 0.71** 0.63* 0.68**
-0.10n.s.
-0.35n.s.
2.1 – 3 m
-0.53* 0.45n.s. 0.91** -0.76** 0.78** 0.45n.s. 0.60*
-0.33n.s.
-0.45n.s.
(a) Control plot
(b) Treatment plot
** P < 0.01* P < 0.05n.s. no significance

Conclusions
1. There was seasonality in [CO2] in soil profile
2. [CO2] was lower in drought conditions
3. The cumulative PCO2 in topsoil was affected by drought but not by season
4. ~76 % of the PCO2 happened in the topsoil
5. During the dry season in the drought plot the deep soil compensated for the CO2 production.
6. Apparently the capacity of water storage is limited, which makes the forest more susceptible to drought. The PCO2 in deep soil may not recover during the wet season.
7. A lower soil respiration can be expected during El Nino due to the limited capacity of compensation of the deep soil.