soil classes default only one soil type “d” modified district key earthquake loss estimation for...
TRANSCRIPT

Soil Classes
defaultOnly one soil type “D”
modified
Hard RockRockDense Soil/Soft RockSoft SoilsSpecial Soils
District KeyDistrict # Neighborhoods
1Financial District, Tribeca, Battery Park City, Seaport
2Soho, Greenwich Village, Chinatown, Little Italy, Noho
3East Village, Lower East Side, Tompkins Square
4 Chelsea, Clinton5 Flatiron, Midtown
6Gramercy, Murray Hill, Turtle Bay, Tudor City
7Lincoln Square, Upper West Side, Manhattan Valley
8Upper East Side, Yorkville, Carnegie Hill, lenox Hill
9Morningside Heights, Hamilton Heights, Manhattanville
10 Central Harlem, Polo Grounds
11 East Harlem
12 Washington Heights, Inwood
EARTHQUAKE LOSS ESTIMATION FOR THE NEW YORK CITY AREAPrinceton NYCEM Research Group
Recent Results

Square footage distribution
Under 4,000
Above 45,000
16,000
32,000
Distribution ofSquare Footage
District Key
#Total Square
Footage (thousands)
Percentage of Total
Neighborhoods
1 219,047 9.9%Financial District, Tribeca, Battery Park City, Seaport
2 128,511 5.8%Soho, Greenwich Village, Chinatown, Little Italy, Noho
3 104,646 4.7%East Village, Lower East Side, Tompkins Square
4 172,803 7.8% Chelsea, Clinton5 414,024 18.7% Flatiron, Midtown
6 286,292 12.9%Gramercy, Murray Hill, Turtle Bay, Tudor City
7 189,741 8.5%Lincoln Square, Upper West Side, Manhattan Valley
8 354,126 16.0%Upper East Side, Yorkville, Carnegie Hill, lenox Hill
9 64,407 2.9%Morningside Heights, Hamilton Heights, Manhattanville
10 63,365 2.9% Central Harlem, Polo Grounds
11 113,794 5.1% East Harlem
12 108,748 4.9% Washington Heights, Inwood
All 2,219,504 100%
EARTHQUAKE LOSS ESTIMATION FOR THE NEW YORK CITY AREAPrinceton NYCEM Research Group
Recent Results

Average number of stories of buildings
Under 2
Above 30
10
20
Average Number of Stories
#Average
Number of Stories
Neighborhoods
1 10.1Financial District, Tribeca, Battery Park City, Seaport
2 5.2Soho, Greenwich Village, Chinatown, Little Italy, Noho
3 5.9East Village, Lower East Side, Tompkins Square
4 5.8 Chelsea, Clinton5 11.2 Flatiron, Midtown
6 8.7Gramercy, Murray Hill, Turtle Bay, Tudor City
7 7.0Lincoln Square, Upper West Side, Manhattan Valley
8 7.1Upper East Side, Yorkville, Carnegie Hill, lenox Hill
9 5.6Morningside Heights, Hamilton Heights, Manhattanville
10 4.6 Central Harlem, Polo Grounds
11 5.2 East Harlem
12 4.5 Washington Heights, Inwood
All 6.7
District Key
EARTHQUAKE LOSS ESTIMATION FOR THE NEW YORK CITY AREAPrinceton NYCEM Research Group
Recent Results
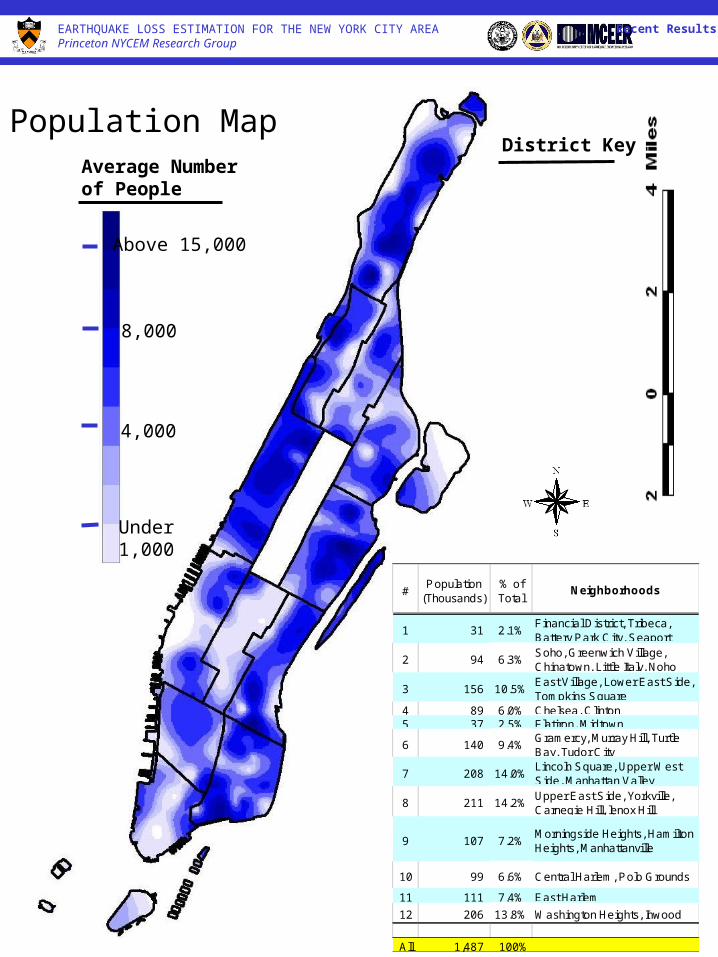
Population Map
Above 15,000
Under 1,000
8,000
4,000
Average Number of People
#Population
(Thousands)% of Total
Neighborhoods
1 31 2.1%Financial District, Tribeca, Battery Park City, Seaport
2 94 6.3%Soho, Greenwich Village, Chinatown, Little Italy, Noho
3 156 10.5%East Village, Lower East Side, Tompkins Square
4 89 6.0% Chelsea, Clinton5 37 2.5% Flatiron, Midtown
6 140 9.4%Gramercy, Murray Hill, Turtle Bay, Tudor City
7 208 14.0%Lincoln Square, Upper West Side, Manhattan Valley
8 211 14.2%Upper East Side, Yorkville, Carnegie Hill, lenox Hill
9 107 7.2%Morningside Heights, Hamilton Heights, Manhattanville
10 99 6.6% Central Harlem, Polo Grounds
11 111 7.4% East Harlem
12 206 13.8% Washington Heights, Inwood
All 1,487 100%
District Key
EARTHQUAKE LOSS ESTIMATION FOR THE NEW YORK CITY AREAPrinceton NYCEM Research Group
Recent Results
District Key
EARTHQUAKE LOSS ESTIMATION FOR THE NEW YORK CITY AREAPrinceton NYCEM Research Group
Recent Results
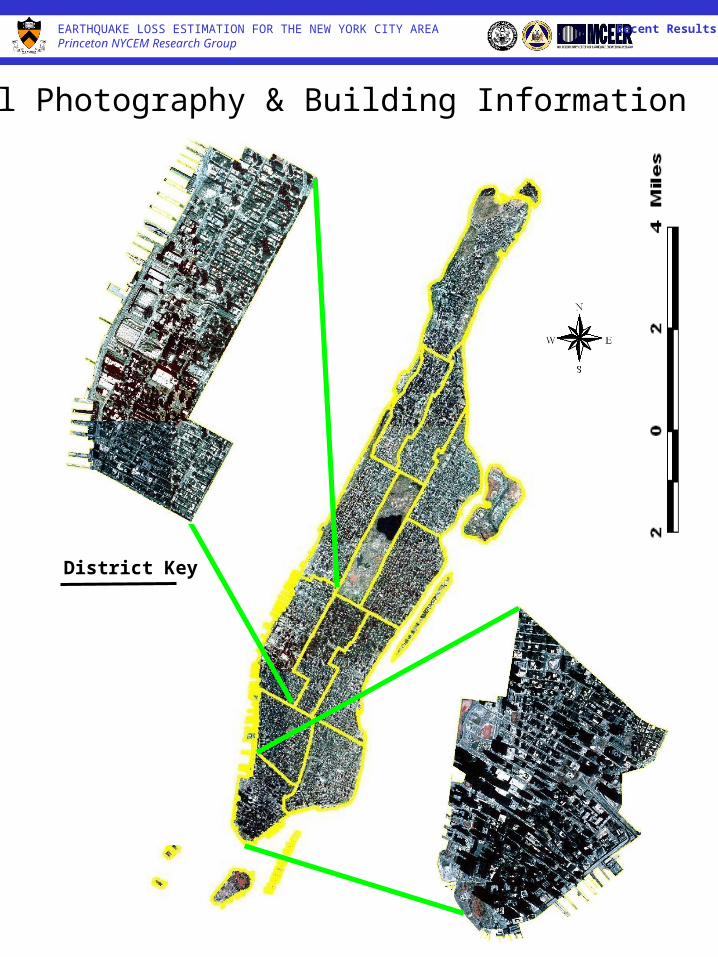
Aerial Photography & Building Information

EARTHQUAKE LOSS ESTIMATION FOR THE NEW YORK CITY AREAPrinceton NYCEM Research Group
Recent Results
Above 400
Under 100
300
200
Average Numberof Buildings
Information on Every Building For Risk Assessment

Number of buildings by Count
Above 400
Under 100
300
200
Average Numberof Buildings
#Number of Buildings
Neighborhoods
1 1,674 Financial District, Tribeca, Battery Park City, Seaport
2 4,537 Soho, Greenwich Village, Chinatown, Little Italy, Noho
3 3,731 East Village, Lower East Side, Tompkins Square
4 3,279 Chelsea, Clinton5 3,091 Flatiron, Midtown
6 3,220 Gramercy, Murray Hill, Turtle Bay, Tudor City
7 3,873 Lincoln Square, Upper West Side, Manhattan Valley
8 4,753 Upper East Side, Yorkville, Carnegie Hill, lenox Hill
9 1,881 Morningside Heights, Hamilton Heights, Manhattanville
10 2,700 Central Harlem, Polo Grounds
11 2,069 East Harlem
12 2,127 Washington Heights, Inwood
All 3,078
District Key