soil chemistry how oxidation and dissolution in diabase
TRANSCRIPT
Soil Science Society of America Journal
Soil Sci. Soc. Am. J. 79:55–73 doi:10.2136/sssaj2014.04.0135 Received 6 Apr. 2014. *Corresponding author ([email protected]). © Soil Science Society of America, 5585 Guilford Rd., Madison WI 53711 USA All rights reserved. No part of this periodical may be reproduced or transmitted in any form or by any means, electronic or mechanical, including photocopying, recording, or any information storage and retrieval system, without permission in writing from the publisher. Permission for printing and for reprinting the material contained herein has been obtained by the publisher.
how oxidation and dissolution in diabase and Granite Control porosity during Weathering
Soil Chemistry
Weathering extends to shallower depths on diabase than granite ridgetops despite similar climate and geomorphological regimes of denudation in the Virginia (united States) piedmont. deeper weathering has been attributed to advective transport of solutes in granitic rock compared to diffusive transport in diabase. We use neutron scattering (nS) techniques to quantify the total and connected submillimeter porosity (nominal diameters between 1 nm and 10 mm) and specific surface area (SSa) during weathering. The internal sur-face of each unweathered rock is characterized as both a mass fractal and a surface fractal. The mass fractal describes the distribution of pores (~300 nm to ~5 mm) along grain boundaries and triple junctions. The surface frac-tal is interpreted as the distribution of smaller features (1–300 nm), that is, the bumps (or irregularities) at the grain–pore interface. The earliest poros-ity development in the granite is driven by microfracturing of biotite, which leads to the introduction of fluids that initiate dissolution of other silicates. once plagioclase weathering begins, porosity increases significantly and the mass + surface fractal typical for unweathered granite transforms to a surface fractal as infiltration of fluids continues. in contrast, the mass + surface frac-tal does not transform to a surface fractal during weathering of the diabase, perhaps consistent with the interpretation that solute transport is dominated by diffusion in that rock. The difference in regolith thickness between gran-ite and diabase is likely due to the different mechanisms of solute transport across the primary silicate reaction front.
Abbreviations: FIB, focused ion beam; NS, neutron scattering; RZ, reaction zone; SANS, small-angle neutron scattering; SAP, saprolite zone; SEM-EDS, scanning electron microscopy with energy dispersive spectrometer; SLD, scattering length density; SSA, specific surface area; USANS, ultra-small-angle neutron scattering; UWR, unweathered rock; WR, weathered rock; m-CT, microcomputed X-ray tomography.
Weathering, the transformation of intact rock into soil through physical and chemical reactions, is a key process that affects the CO2 cycle, soil formation, and nutrient uptake into ecosystems. Upon reaction with
meteoric fluids, pristine parent rocks transform from relatively nonporous mate-rial to porous weathered material (soil and saprolite), which we term here regolith (Brantley and White, 2009; Buol and Weed, 1991; Pavich et al., 1989). The earliest weathering-related mineral-fluid interactions are thought to be largely controlled by the distribution of the connected porosity and the topography of the pore interface at the nanometer scale (Hochella and Banfield, 1995). When interconnected, these pores likely allow solute transport only by diffusion in relatively pristine, low-po-rosity crystalline rocks. For instance, in unweathered granite rocks with low poros-ity, microcracks and elongated voids can be the most important pathways of solute transport (Sausse et al., 2001). During weathering and rock disaggregation, solute
ekaterina bazilevskaya* Earth and Environmental Systems Inst. Penn State Univ. University Park, PA 16802
Gernot RotherGeochemistry and Interfacial Sciences Group Chemical Sciences Division Oak Ridge National Laboratory Oak Ridge, TN 37831
david F.R. mildnerNIST Center for Neutron ResearchNational Inst. of Standards and TechnologyGaithersburg, MD, 20899
milan pavichU.S. Geological Survey Eastern Geology and Paleoclimate Science Center 12201 Sunrise Valley Drive MS 926a Reston, VA 20192
david ColeSchool of Earth Science Ohio State Univ. Columbus, OH 43219
maya p. bhattCentral Dep. of Environmental Science Tribhuvan Univ. Kathmandu, Nepal
lixin JinDep. of Geological Sciences Univ. of Texas El Paso, TX 79968
Carl i. SteefelEarth Sciences Division Lawrence Berkeley National Laboratory 1 Cyclotron Road Berkeley, CA 94720
Susan l. brantleyEarth and Environmental Systems Inst. Penn State Univ. University Park, PA 16802
Published January 13, 2015
56 Soil Science Society of America Journal
transport by diffusion eventually is outcompeted by transport by advection as fractures interconnect and larger micrometer-sized pores form from smaller pores. However, this transformation from a regime dominated by diffusion to one dominated by advective transport and the role of pore-scale reactions on rock weathering are not well understood (Navarre-Sitchler et al., 2013; Rossi and Graham, 2010; Nahon, 1991).
In our previous work, we investigated aspects of the rela-tionship between mineral reaction and porosity in two crystal-line rocks weathering in the same climate at similar erosion rates (Bazilevskaya et al., 2013; Brantley et al., 2014). These two rocks, a diabase and a granitic rock, had been previously cored and stud-ied by workers in the 1990s (Pavich et al., 1989). Both rocks are dominated by plagioclase (58% Ca-rich feldspar in diabase; 52% Na-rich feldspar in granitic rock). Although the diabase con-tained the more fast-dissolving plagioclase composition (An60), it was characterized by a much thinner weathering profile: the regolith was only about 1 m thick. In contrast, the granitic par-ent contained the more slow-dissolving plagioclase (An06) but had developed a much deeper regolith (20 m). Bazilevskaya et al. (2013) suggested that oxidation of biotite occurred between the 22- and 20-m depth in the granite, causing fracturing of the rock that allowed advection at depth. The advection controlled the solute transport and resulted in formation of deep regolith; in turn, permeability in the deep regolith was maintained by the high concentration of quartz grains in the granitic rock. Similar fracturing was not observed in the diabase profile, and the lack of quartz further precluded maintenance of high permeability. Furthermore, by inspection of a compilation of regolith depths as a function of lithology, Bazilevskaya et al. (2013) concluded that regolith depth was commonly thicker on granitic mate-rial compared to diabase when observed at ridgetop locations in many locations worldwide. Brantley et al. (2014) explored this idea further and pointed out that the high ferrous Fe content of rocks such as diabase could deplete downward percolating fluids of O2 before depletion of CO2 when they weathered in ridgetop locations. In contrast, in felsic granites, CO2 is likely to be de-pleted before O2 due to the high content of weatherable base cations but low content of Fe(II). Those authors inferred that the relative depths of the oxidation vs. the silicate dissolution fronts in a crystalline rock may predict whether oxidation-related frac-turing occurs during weathering.
Building on our previous work on the Virginia rocks de-scribed above, this study focuses specifically on nano- to mi-crometer-scale changes in the pore network that occur during weathering reactions in the diabase and granite. We use small-angle neutron scattering (SANS) and ultra-small-angle neutron scattering (USANS) to quantify porosity and surface features ranging in size from 1 nm to 5 mm in crystalline and sedimentary rocks (Wenk, 2012; Anovitz et al., 2009; Radlinski, 2006). We complement the neutron data with microcomputed X-ray to-mography (m-CT) to quantify porosity at the 3 to 500 mm scale, defined in this work as mesoporosity. Microcomputed tomog-raphy provides the opportunity to observe and quantify sample
porosity without sample destruction. In addition, we use energy dispersive X-ray scanning electron microscopy (SEM-EDS) to elucidate the mineralogy, chemical composition, and grain dis-tribution, as well as the shape and grain contact morphology of the different mineral phases and pores.
deSCRipTion oF The WeaTheRinG pRoFileSThe weathering profiles on granitic and diabase rocks that
we study here have developed on hilltops in the Piedmont prov-ince in Fairfax County, VA (Fig. 1a) as described in previous publications (Bazilevskaya et al., 2013; Brantley et al., 2014; Pavich et al., 1989). To summarize, the Piedmont province is a rolling upland plain developed on diverse underlying meta-morphic and igneous rocks. The province is characterized by minor relief, moderate elevation (90–200 m), and mature de-ciduous forest cover. In this region, the summers are generally warm and humid, and the winters are mild with mean average temperature equal to 10°C. Summer temperatures reach 38°C, and the minimum winter temperature can be lower than −20°C. The maximum rainfall intensity occurs in summer with average rainfall of 1040 mm yr−1. The longest drought period generally occurs during fall. Most groundwater storage in the Piedmont is within the regolith (especially within the saprolite), but minor storage also occurs in joints and fractures in fresh rock (Pavich et al., 1989). The stable erosion rates have been estimated from cosmogenic isotopes, exposure time, and elevation to equal 4 to 8 m per 1 ´ 106 yr (Bacon et al., 2012; Price et al., 2008; Pavich et al., 1985). Residual weathering profiles have developed over the parent rocks. As a result, Alfisol soils, Kelly (fine, vermiculitic, mesic Aquic Hapludalfs) and Jackland (fine, smectitic, mesic Aquic Hapludalfs) series, are present on the granitic and diabase rocks, respectively.
We report analyses of cores of diabase that were taken from a ridge top (elevation ~91 m asl) adjacent to a diabase quarry in the Triassic Culpepper basin in the western Piedmont prov-ince by Pavich and colleagues (Pavich et al., 1989). Samples of the granitic rocks were collected in the highest upland (elevation ~135 m asl) immediately north of the Occoquan River as contin-uous cores from surface to unweathered rock. The granitic rock is a metamorphosed quartz monzonite (adamellite) (Seiders et al., 1975). The weathering profiles of both rocks grade upward from fresh bedrock to the soil surface (Pavich et al., 1989). The profiles include unweathered rock (UWR, i.e., bedrock), weathered rock (WR), overlying saprolite (SAP), and soil (referred to as SOIL in diagrams; Fig. 1b).
In the unweathered diabase, no alteration was visible ex-cept for Fe hydroxide stains along joint planes. The diabase consists of 54.0 v/v plagioclase feldspar (labradorite, An60) and 36.2 v/v pyroxene with minor orthoclase, ilmenite, and mag-netite (Bazilevskaya et al., 2013). The WR zone is comprised of intact diabase with slightly altered pyroxene and less altered plagioclase. In the SAP zone, that is, the soil Cr horizon, the saprolite consists of altered fragments (1–5 mm in diameter) of diabase, and the material is easily crushable by hand due to the

www.soils.org/publications/sssaj 57
loss of mechanical strength and density, but with the structure still preserved. The clay fraction (<2 mm particle size) comprises 15 to 25% and up to 55% in SAP and SOIL zones, respectively. The major secondary clay mineral in the SAP zone is expandable smectite. Smectite alters to nonexpandable vermiculate higher in the SOIL zone.
The weathering profile of the granitic rock is 20´ deeper than that of the diabase (Fig. 1b). The unweathered granitic par-ent rock is characterized by low to medium permeability, no Fe stains along joints and no weathering of feldspar and micas. In the UWR zone, the unaltered granite consists of 40.5 v/v quartz, 32.0 v/v plagioclase (An6), 20.1 v/v orthoclase, 3.4 v/v musco-vite, and 3.7 v/v biotite (Bazilevskaya et al., 2013). Fresh granitic rock (UWR) gradually transforms into hard and moderately WR and then to firm (but less dense and highly altered) SAP. The overlying weathered rock zone has medium to high perme-ability and exhibits alteration of feldspars and mafic minerals (Pavich et al., 1989). The granular granitic saprolite is composed of hard, resistant fragments of quartz 1 to 5 mm diam. and cor-responds to a Cr-horizon in the soil profile. The original struc-
ture and texture are preserved in the SAP, but feldspar has sig-nificantly altered. The clay fraction comprises <10% in saprolite, <25% in the lower part of the soil zone, but reaches up to 45% in the upper 0.5 m of soil. Kaolinite is a dominant constituent, and muscovite is a minor constituent of the clay fraction in the saprolite shallower than the 14.9-m depth as reported previously by (Pavich et al., 1989).
mineral Reactions in Granite and diabase profilesIn our previous publications (Bazilevskaya et al., 2013;
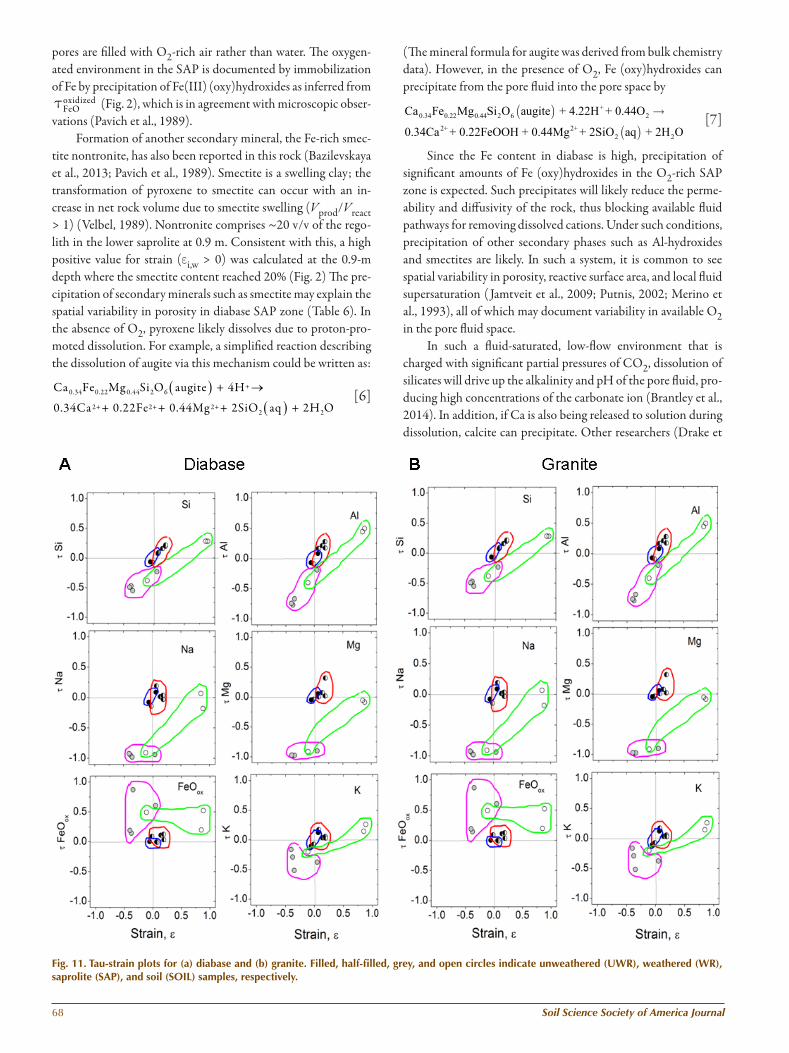
Brantley et al., 2014), we studied mineral weathering reactions in terms of changes in bulk elemental concentrations using the mass transfer coefficient (tj) (see Fig. 2 caption for the equation). Since plagioclase was the most abundant and easily weathered mineral in the granite while plagioclase and pyroxene together were the most abundant and easily weathered minerals in the di-abase, we used Na as a proxy for plagioclase and Mg and Ca as a proxy for pyroxene to follow the corresponding mineral dissolu-tion reactions in weathering profiles (Fig. 2) (note that in diabase Ca was contained both in plagioclase [An60] and pyroxene).
Fig. 1. (a) physiographic divisions of Fairfax County, Va (after Pavich et al., 1989) and diabase (F18, F19) and granite (F11) sites location. (b) diabase and granite weathering profiles developed on diabase and granite. asterisk denotes samples chosen for neutron scattering measurements. Zone notation: Sap, saprolite; Soil, soil; uWR, unweathered rock; WR, weathered rock.
Fig. 2. mass transfer coefficient (tj) plots for na (circles), Feo (triangles), Feooxidized (spheres), and strain (blue triangles) for (a) diabase, and (b) granite profiles. data from pavich et al., 1989 and this study. The tj values
were calculated using the following equation (brimhall and dietrich,
1987; anderson et al., 2002):
j,w i,pj
i,p i,w
1C CC C
t×
= −× . here Cj,w and Cj,p are
concentrations of mobile element j in weathered zone (subscript w)
and parent (p) rock, respectively, and Ci,w and Ci,p are concentrations of immobile element i in weathered zone and parent rock, respectively. negative ti,j values indicate depletion of j in regolith with respect to j in the parent, for example, t = −1 indicates that element contained in parent rock was completely depleted during the weathering process. Values of zero indicate no change of the element of interest with respect to the parent, and ti,j > 0 indicate enrichment of the element of interest j in weathered material compared to parent concentration. parent
rock composition for both diabase and granite was taken as an average composition of the two deepest rocks in each profile where no changes in chemistry or bulk density were observed. Figure is reproduced from bazilevskaya et al., 2013; brantley et al., 2014). Sap, saprolite; Soil, soil; uWR, unweathered rock; WR, weathered rock.

58 Soil Science Society of America Journal
From our previous findings, we concluded that Na com-prised a fully developed weathering profile, that is, the profile varied from parent concentration at depth (t = 0) to completely depleted (t = −1) at the surface in both the granite and diabase (Fig. 2). Sodium depletion occurred in the SAP zone alone in the diabase, while about 50% of the Na was lost in the WR zone of the granite profile. In the diabase, Ca and Mg also showed deple-tion (like Na) in the SAP zone. All three elements were com-pletely (100%) depleted at the land surface. Thus, according to the bulk chemistry, plagioclase began to dissolve in the WR zone in the granite, but pyroxene + plagioclase both began to dissolve higher in the profile (in the SAP zone) in the diabase.
The fraction of Fe(II) depleted from the profiles, tFeO, was calculated using bulk FeO concentrations. Although some of the ferrous Fe was leached from the weathering profile, Fe was also reprecipitated as Fe(III) (oxy)hydroxides. For each profile, we compared the initial concentration of Fe(II) and Fe(III) in the parent to the concentration after weathering to calculate how much of the ferrous Fe was oxidized and retained in the rock, referred to here as “FeOoxidized,” that is, FeOoxidized = CFe2O3,w − CFe2O3,p. To assess this component, we calculated a mass transfer coefficient (found in Eq. [1]), to express the fraction of Fe(II) in the parent material that accumulated as an Fe(III) oxide in regolith (Fig. 2).
( )2 3 2 3Fe O ,w Fe O ,p Ti,poxidizedFeO
FeO,p Ti,w
2 C C C
C Ct
−= [1]
Here, subscripts p and w denote concentrations in parent and weathered material, respectively; all concentrations are ex-pressed in mol kg−1.
Iron behavior during weathering reflected the presence of O2 in the soil atmosphere and the depths at which oxidation re-actions took place. In granite, much of the ferrous Fe was con-tained in biotite (~3.7 v/v), whereas in the diabase the ferrous Fe was present in pyroxene (36.2%). In the granite, depletion of FeO started in the UWR zone where it was accompanied by increases in FeOoxidized beneath the plagioclase reaction zone (located be-tween the 20- and 22-m depth). These changes were attributed to biotite oxidation and Fe(III) (oxy)hydroxide precipitation, re-spectively. These Fe reactions were the first weathering reactions observed in the granite profile (Bazilevskaya et al., 2013).
In contrast, for the diabase, the most significant depletion of FeO was not observed until the SAP zone. Thus, Fe oxida-tion (resulting in FeO depletion) occurred across the same depth interval as plagioclase and pyroxene dissolution, and most of this FeO depletion near the land surface was accompanied by Fe(III) precipitation. Deeper in the system, FeO depletion with-out Fe(III) precipitation took place to a very small extent in the WR just below the interface with the SAP. Loss of ferrous Fe at depth was attributed to weathering in a low-O2 atmosphere. Apparently, just above the WR-SAP interface, O2 was present, but it became depleted in the WR (Fig. 2).
In this paper, we examine in greater detail how porosity and mineral surface properties have developed in these rocks using new neutron scattering analysis and complementary imaging methods. We hypothesize that nanoporosity plays a vital role in weathering reactions in diabase and granite profiles
meThodSChemical Characterization of Weathering profilesmajor element Concentrations
Bulk chemical composition for major elements for the sam-ples used for neutron scattering were analyzed by inductively coupled plasma optical emission spectrometer (ICP–OES) at a commercial geochemical laboratory (SGS Canada Inc., method ICP95A). Additional chemical data were also reported previ-ously (Pavich et al., 1989).
Sulfur ConcentrationsTotal sulfur concentrations in the granitic and diabase sam-
ples were measured by LECO Sulfur Analyzer Coulometer at the Material Characterization Laboratory, Penn State. This instru-ment measures the amount of 0.1 M KIO3 required to titrate the SO2 formed as a result of combustion of each sulfur-containing sample. To complete the analysis, ~500 mg of powdered sample were added along with granular Sn metal and Fe chips to ceramic crucibles and capped with ceramic lids following LECO proto-col. Tin and Fe beads, supplied by the LECO Corporation, were added to the samples to aid combustion (Jones and Isaac, 1972). The amount of KIO3 is proportional to the SO2 evolved from the sample which, in turn, is proportional to the %S in the sample:
3 3
3
KIO KIO
KIO sample
1%S 100%0.001
3 S
C VM m
M
= [2]
Here, CKIO3 represents the concentration of potassium io-dide in the titrant (g L−1), VKIO3 is the volume of potassium iodide added to restore the color (L), MKIO3 and MS are the molecular weights of KIO3 and S, respectively, and msample is the mass of the sample (mg). In this equation, 3 equals the number of moles of SO2 needed to neutralize1 mole of KIO3, and 0.001 is the conversion factor from grams to milligrams. A sulfur standard provided by LECO (a 1000-mg metal ring that contains 0.0288% ± 0.001 S) was also analyzed. Blank crucibles were analyzed at the beginning and end of each run. A total of 17 standards were measured and the average over multiple days was (0.0254 ± 0.0025)%. The accuracy for this standard was thus ±0.0034% (= 0.0288–0.0254) absolute error and 11.8% relative error (equal to 0.0034/0.0288). For the samples with no organic matter (UWR and WR and deep SAP), it was assumed that total S is equal to inorganic sulfur in sulfides.
Carbonate ConcentrationCarbonates (inorganic carbon) were measured using a
modified version of a published procedure (White et al., 1999). Samples measuring 1 to 2 g were ground to pass a 100-mesh
www.soils.org/publications/sssaj 59
(<150 mm) sieve, placed in serum bottles, and sealed. Next, air was evacuated from the bottles by flushing high purity N2 gas, then 5 mL of 1 N HCl were injected through the rubber stop-per using a needle syringe. After HCl reacted with carbonates in the sample, CO2 was released into the bottle headspace accord-ing to the reaction, CaCO3 + H+ = Ca2+ + CO2 + H2O. After 24 h of shaking to ensure the reaction was complete, samples were analyzed by LI-COR CO2–H2O Analyzer (LI-7000) in the Biogeochemistry Laboratory, Department of Crop and Soil Sciences, Penn State. Headspace concentrations of CO2 were converted to mg C kg−1 using atmospheric pressure, air tempera-ture, jar volume, subsample volume, and sample weight. A series of blank samples (air) were also measured, and the average blank value of C was subtracted from the measured C concentrations to obtain carbonate content in rock samples. The calibration curve was created by injecting known amounts of CO2 into the instru-ment from gas tanks with either 970 or 10,010 mL L−1 CO2. We used calibration curve standards to estimate accuracy and relative error. Each of the four standards (2.5, 5, 10, and 25 mL L−1) was measured four times over multiple days to obtain 2.30 ± 0.18, 4.57 ± 0.52, 9.01 ± 0.46, and 25.53 ± 2.075 mL L−1. Thus, the average relative error was 5.8%.
porosity Characterizationneutron Scattering
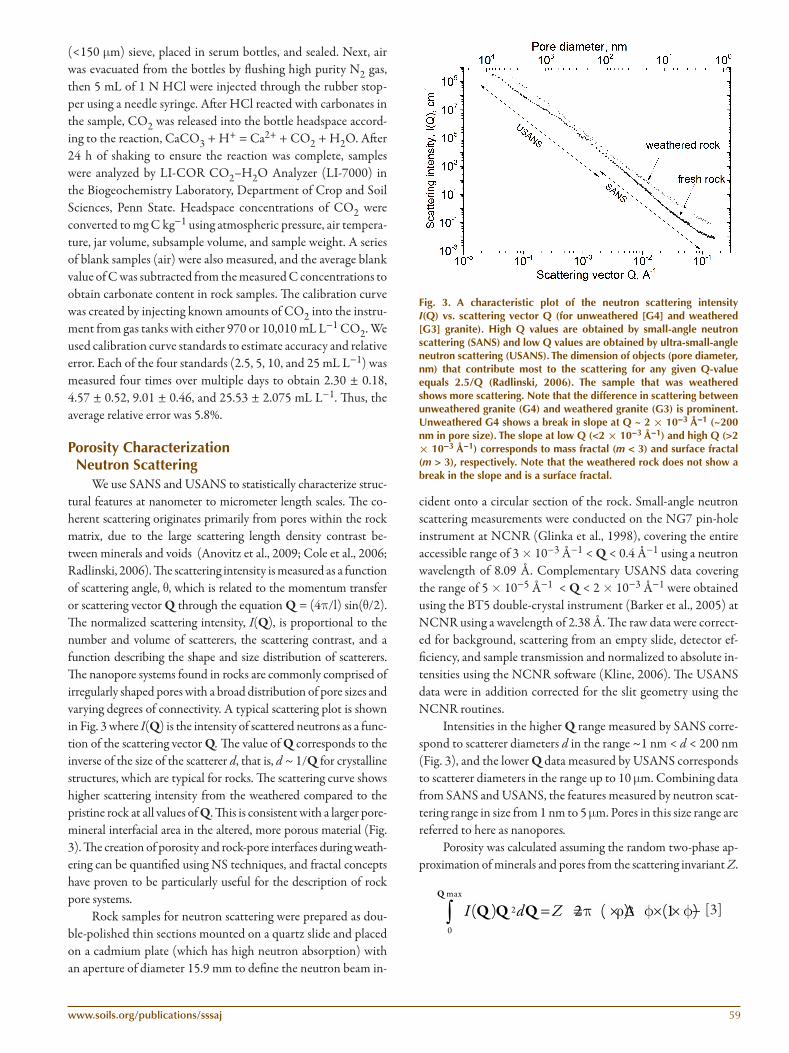
We use SANS and USANS to statistically characterize struc-tural features at nanometer to micrometer length scales. The co-herent scattering originates primarily from pores within the rock matrix, due to the large scattering length density contrast be-tween minerals and voids (Anovitz et al., 2009; Cole et al., 2006; Radlinski, 2006). The scattering intensity is measured as a function of scattering angle, q, which is related to the momentum transfer or scattering vector Q through the equation Q = (4p/l) sin(q/2). The normalized scattering intensity, I(Q), is proportional to the number and volume of scatterers, the scattering contrast, and a function describing the shape and size distribution of scatterers. The nanopore systems found in rocks are commonly comprised of irregularly shaped pores with a broad distribution of pore sizes and varying degrees of connectivity. A typical scattering plot is shown in Fig. 3 where I(Q) is the intensity of scattered neutrons as a func-tion of the scattering vector Q. The value of Q corresponds to the inverse of the size of the scatterer d, that is, d ~ 1/Q for crystalline structures, which are typical for rocks. The scattering curve shows higher scattering intensity from the weathered compared to the pristine rock at all values of Q. This is consistent with a larger pore-mineral interfacial area in the altered, more porous material (Fig. 3). The creation of porosity and rock-pore interfaces during weath-ering can be quantified using NS techniques, and fractal concepts have proven to be particularly useful for the description of rock pore systems.
Rock samples for neutron scattering were prepared as dou-ble-polished thin sections mounted on a quartz slide and placed on a cadmium plate (which has high neutron absorption) with an aperture of diameter 15.9 mm to define the neutron beam in-
cident onto a circular section of the rock. Small-angle neutron scattering measurements were conducted on the NG7 pin-hole instrument at NCNR (Glinka et al., 1998), covering the entire accessible range of 3 ´ 10−3 Å−1 < Q < 0.4 Å−1 using a neutron wavelength of 8.09 Å. Complementary USANS data covering the range of 5 ´ 10−5 Å−1 < Q < 2 ´ 10−3 Å−1 were obtained using the BT5 double-crystal instrument (Barker et al., 2005) at NCNR using a wavelength of 2.38 Å. The raw data were correct-ed for background, scattering from an empty slide, detector ef-ficiency, and sample transmission and normalized to absolute in-tensities using the NCNR software (Kline, 2006). The USANS data were in addition corrected for the slit geometry using the NCNR routines.
Intensities in the higher Q range measured by SANS corre-spond to scatterer diameters d in the range ~1 nm < d < 200 nm (Fig. 3), and the lower Q data measured by USANS corresponds to scatterer diameters in the range up to 10 mm. Combining data from SANS and USANS, the features measured by neutron scat-tering range in size from 1 nm to 5 mm. Pores in this size range are referred to here as nanopores.
Porosity was calculated assuming the random two-phase ap-proximation of minerals and pores from the scattering invariant Z.
max
2 2
0
( ) 2 ( ) (1 )I d Z p r f f= = × ∆ × × −∫Q
Q Q Q [3]
Fig. 3. a characteristic plot of the neutron scattering intensity I(Q) vs. scattering vector Q (for unweathered [G4] and weathered [G3] granite). high Q values are obtained by small-angle neutron scattering (SanS) and low Q values are obtained by ultra-small-angle neutron scattering (uSanS). The dimension of objects (pore diameter, nm) that contribute most to the scattering for any given Q-value equals 2.5/Q (Radlinski, 2006). The sample that was weathered shows more scattering. note that the difference in scattering between unweathered granite (G4) and weathered granite (G3) is prominent. unweathered G4 shows a break in slope at Q ~ 2 ´ 10−3 Å−1 (~200 nm in pore size). The slope at low Q (<2 ´ 10−3 Å−1) and high Q (>2 ´ 10−3 Å−1) corresponds to mass fractal (m < 3) and surface fractal (m > 3), respectively. note that the weathered rock does not show a break in the slope and is a surface fractal.

60 Soil Science Society of America Journal
where Dr is the coherent neutron scattering length density con-trast between the rock matrix and the pores (voids) and f is the volume fraction of pores in the rock.
To determine the neutron coherent scattering length den-sity (SLD) of the rock matrix, the chemical composition (bulk chemistry data) and pycnometric density for each sample were measured. These generalized chemical formulas and grain densi-ties were then used to calculate SLDs of the rock phases using the NIST SLD calculator (www.ncnr.nist.gov/resources/sldcalc.html, accessed 13 Oct. 2014).
To determine the fraction of interconnected nanopores, the samples were immersed for 3 d in a suitable D2O–H2O mixture that was mixed to be contrast-matched with the sample grains. Specifically, a D2O mass fraction of 0.67 yielded a liquid with a similar SLD as the mineral matrix (4 ́ 10−6Å−2). To ensure that the sample remained water-saturated during the scattering, it was placed between two glass plates and sealed with a rubber gasket, while immersed in a small amount of contrast-matched water. Saturation of the connected pore fraction with contrast-matched water via capillary forces leads to zero scattering contrast between the nanopores and the rock; therefore, only unconnected pores scatter in contrast-matched samples. The difference in scattering intensities between dry and wet samples was determined and at-tributed to scattering from connected pores.
The PRINSAS software (Hinde, 2004) was used to calcu-late SSA of the mineral-pore interface. The distribution of pore sizes and shapes is approximated using the polydisperse hard sphere model. The SSA is calculated from the pore size distribu-tion as the sum of surface areas of all pores with radius larger than r, S(r), divided by the sample volume, V (Radlinski, 2006):
max
v rr
( )SSA ( )RS r n A f r dr
V= = ò [4]
where nv is the average number of pores per unit volume, and Ar equals 4pr2 minus the pore area. This latter expression is based on the representation of the independent spherical pores with distribution f(r) where r is pore radius.
Small-angle neutron scattering/USANS measurements were completed on four diabase samples derived from two cores from boreholes drilled ~25 km apart (Pavich et al., 1989): D1 (sample from core F18 at the interface between WR and SAP), D2 (from WR in F18), D3 (at the interface between WR and UWR in F19), and D4 (from UWR in core F19) (Fig. 1b, left).
Four granite samples were selected from the F11 core: G1 (from SAP), G2 (from the interface of SAP and WR), G3 (at the interface between WR and UWR), and G4 (from UWR) (Fig. 1b, right). Samples G1 and G2 are powdery saprolites with a quartz-rich matrix (Pavich et al., 1989). The primary structure was less preserved in G1 than G2. Sample G3 is a firm rock in which original structure and textures are preserved. Sample G4 is a relatively fresh rock with minor Fe staining on joint planes.
microcomputed TomographyThe entire set of samples used for neutron scattering plus
two additional samples from the diabase SAP zone were char-acterized with m-CT. Small bedrock chips (~1 mm diam., 4–5 mm in length) were measured by synchrotron X-ray-based 3D m-CT (Beamline 8.3.2 at the Advanced Light Source at Lawrence Berkeley National Laboratory) to obtain images with a 0.8-mm pixel size. Samples were mounted on a specifically de-signed sample holder and illuminated by X-rays of 25 keV. These X-rays penetrate the sample and are attenuated as a function of density of the material with lower density material (pores) at-tenuating X-rays to a lesser degree. This method is a nondestruc-tive technique to image and measure sample porosity for pores of diameter >3 mm. Filtered back-projection tomographic recon-struction was performed using Octopus software (Dierick et al., 2004). Further image analysis—including anisotropic diffusion filtering, threshold-based segmentation, connected component analysis, and skeleton analysis—were performed using Avizo Fire software (Peth, 2010). Porosity was quantified for several subsamples, each with an average volume of 0.08 ± 0.03 mm3. Porosity from m-CT is referred to here as mesoporosity.
SpectroscopyThe size and composition of primary and secondary min-
erals and pore shape and distribution were measured by FEI Quanta 200 Environmental SEM coupled with EDS using a backscatter electron detector at the Materials Characterization Laboratory, Penn State. Compositions of major minerals were detected with repetitive measurements on several grains of the same mineral. Complementary transmission electron micros-copy was completed on a JEOL 2010F TEM to study nanopores in the diabase. Samples were prepared for TEM using a focused ion beam (FIB) to produce thin (100 nm) foils of diabase. Foils were prepared on a Hitachi S-3500N FIB-secondary electron microscope at the Materials Research Institute, Penn State, and observed under TEM.
ReSulTSChemistry of diabase and Granite
The bulk chemical composition for granite and diabase samples selected for NS measurements are shown in Table 1. The averaged composition obtained from the two deepest sam-ples was defined as a parent rock composition for both diabase and granite profiles and was used to plot t vs. depth (Fig. 2). As discussed in the next section, the weathered rock was always a stronger scatterer of neutrons than the parent rock because of its higher porosity (Fig. 3).
Carbonates and S concentrations are shown in Table 2. Although the data points are limited in number, carbonates were enriched in the diabase WR at the location where pyroxene be-gins to dissolve (see later discussion of Fig. 5), and in the SAP where plagioclase begins to dissolve (compare Na data in Fig. 2); similarly, carbonate was enriched in the granite WR zone in the plagioclase reaction front (compare Fig. 4 and Fig. 2). Such car-

www.soils.org/publications/sssaj 61
bonate enrichment could contribute to some extent to the more than 4 to 5´ increase of the LOI in WR and SAP compared to the granite UWR rock (Tables 1 and 2).
In diabase, the total S in the 13 WR and SAP samples av-eraged 0.0038 ± 0.0035%. In contrast, the four UWR samples averaged 0.0078 ± 0.0020. Although the very limited number of S measurements for the granite performed in this study yielded highly variable concentrations, the highest S concentrations were also measured in the UWR and WR (Fig. 4).
nanoporosity in diabaseanisotropy of Scattering patterns
Figure 5a shows the two-dimensional patterns of scattered neutron intensity that were observed on the area detector for the diabase protolith (UWR) and weathered samples. The colors
range from black (low intensity of scattered neutrons) to white (high intensity). Note that iso-intensity contours are radially isotropic only for UWR: scattering is equally intense in all direc-tions for that sample. This is consistent with scattering from ran-domly-oriented scatterers. In contrast, all WR diabase samples show anisotropic scattering patterns. Anisotropy indicates pres-ence of anisotropically-shaped pores with preferred orientation. In samples from the same depths observed under CT, TEM, and SEM, we observed elongated pores (~20–100 nm ´ ~500–900 nm) distributed along boundaries between exsolution lamellae in pyroxene grains (Fig. 5b).
nanoporosity and Specific Surface areaAlthough samples from UWR and WR diabase located
within only 1 m of each other showed pronounced differences
Table 1. bulk chemical composition of diabase and granite samples used in neutron scattering measurements.Sample depth al2o3 Cao Cr2o3 Fe2o3(t) K2o mgo mno na2o p2o5 Sio2 Tio2 Zr loi
M ––––––––––––––––––––––––––––––%–––––––––––––––––––––––––––––– mL L−1 %Diabase†
D1 (WR) 1.03 13.8 10.8 0.03 11.3 0.55 7.19 0.17 2.1 0.06 49.1 1.11 80 < 0.01
D2 (WR) 1.8 15.7 11.1 0.03 10.4 0.62 6.68 0.16 2.6 0.12 52 0.99 90 0.25
D3 (WR) 2 14.7 11.1 0.03 11.3 0.6 7.09 0.18 2.4 0.13 51.6 1 90 < 0.01
D4 (UWR) 2.75 14.3 11.2 0.03 12 0.54 7.25 0.19 2.3 0.2 50.8 1.13 90 0.90
Granite
G1 (SAP) 6.8 16.5 0.04 0.01 2.34 2.84 0.49 0.03 < 0.1 < 0.01 69.7 0.3 160 5.89
G2 (SAP) 11.3 14.7 0.05 0.01 2.04 3.52 0.35 0.05 < 0.1 0.01 73.3 0.24 150 4.18
G3 (WR) 19.7 14.5 1.4 0.04 2.88 3.68 0.52 0.11 2 0.06 71.7 0.31 160 2.53G4 (UWR) 22.2 12.7 1.93 0.03 1.8 3.73 0.37 0.02 2.6 0.04 78.7 0.23 130 0.38† SAP, saprolite; UWR, unweathered rock; WR, weathered rock.
Table 2. Results of sulfur and carbonate analyses.
profile zone†
diabaSe profile zone
GRaniTe
depth sulfur, wt. % calcite, % depth sulfur, wt. % calcite, %
0.35 SOIL 0.00647 ± 0.00664 0.03818 ± 0.00409 6.8 SAP (G1) 0.00156 ± 0.001060.5 SOIL 0.08069 ± 0.00370 11.3 SAP (G2) 0.00074 ± 0.00058 0.07270 ± 0.00220
0.75 SAP 0.00613 ± 0.00184 0.32374 ± 0.03035 19.7 WR (G3) 0.00109 ± 0.00077 0.13936 ± 0.00860
0.9 SAP 0.00091 ± 0.00061 2.25532 ± 0.05383 20.3 WR 0.00029 ± 0.00126
1 WR 0.00000 ± 0.00000 21.3 UWR 0.00750 ± 0.00000
1 WR 0.00135 ± 0.00000 22.2 UWR (G4) 0.00324 ± 0.00071 0.01093 ± 0.00082
1.03 WR (D1) 0.00152 ± 0.00121 0.03283 ± 0.00110 Parent‡ 0.00537 ± 0.00050 0.01093 ± 0.00082
1.1 WR 0.00030 ± 0.00012
1.2 WR 0.00030 ± 0.00000
1.4 WR 0.00790 ± 0.00000
1.5 WR 0.00812 ± 0.00098
1.7 WR 0.00097 ± 0.00031
1.8 WR (D2) 0.00704 ± 0.00079 0.08469 ± 0.00295
1.8 WR 0.00633 ± 0.00420
1.9 WR 0.00887 ± 0.00012
2 UWR (D3) 0.00786 ± 0.00105 0.02032 ± 0.00094
2.3 UWR 0.00921 ± 0.00000
2.6 UWR 0.00633 ± 0.00030
2.75 UWR(D4) 0.00456 ± 0.00271 0.03087 ± 0.00118Parent§ 0.00699 ± 0.00200 0.02560 ± 0.00017
† SAP, saprolite; SOIL, soil; UWR, unweathered rock; WR, weathered rock.‡ Parent composition for granite is the two deepest samples (21.3 and 22.2 m) for S data. For calcite data, parent composition is assumed to be the
same as the deepest sample (at 22.2 m).§ Parent composition for diabase was calculated as the average of the four deepest samples (from the depth interval from 2 to 2.75 m).

62 Soil Science Society of America Journal
in scattering patterns, the calculated total nanoporosity differed only slightly: from 1.5% in UWR to 2.2 ± 0.5% (average in WR) (Table 3). In addition, as shown in Table 3, little difference was observed between the fractions of total and unconnected porosi-ties in the two zones. Specifically, in the diabase UWR and WR, more than 50% of nanopores were connected.
Similarly, SSA remained the same within error between the UWR and WR (Table 3). Therefore, despite the development of pores attributed to the weathering, no differences in either po-rosity or SSA between UWR and WR were calculated (Fig. 6a). Apparently, 2D scattering patterns are more sensitive to spatial distribution of pores than the quantification of total porosity and SSA.
porod exponents and Fractal dimensionsLog-log plots of scattering intensity (I) vs. scattering vector
(Q) for diabase samples are shown in Fig. 7a. The negative slope of the linear portion of a log(I)-log(Q) plot is called the Porod exponent, m. If the plot is linear over several orders of magnitude, m can be used to determine the fractal nature of the distribution of scattering objects (Radlinski, 2006). Specifically, when 3 < m < 4, the distribution of scatterers is described as a surface fractal. In rocks, such a surface fractal can sometimes be attributed to sur-face irregularities and other roughness features at the grain–pore interface (Navarre-Sitchler et al., 2013; Jin et al., 2011; Mildner
and Hall, 1986). In contrast, values of the slope between 2 and 3 charac-terize a mass fractal (Anovitz et al., 2009). The fractal dimension for a surface fractal is equal to Ds = 6 − m, and for a mass fractal Dm = m. According to the definition of these fractals, a rock cube of edge-length L is a surface fractal if its surface area scales as LDs where 2 < Ds < 3, while the cube is a mass fractal if its mass scales as LDm where 2 < Dm < 3. When scattering from an igneous rock documents a mass fractal, scat-terers have been inferred to be pores distributed on grain boundaries and triple junctions (Navarre-Sitchler et al., 2013).
For unweathered and weath-ered diabase samples, the log-log plots of I vs. Q revealed ranges in the data that are linear over at least 2 or-ders of magnitude, that is, indicative of a fractal. However, we observed a break in slope at Q ~ 10−3 Å−1 that correlates with a change from a mass fractal at low Q (larger scatter-ers) to surface fractal (smaller scat-terers) at high Q (Fig. 7a, Table 4).
Fig. 4. mass transfer coefficient (tj) plots for carbonates-(squares), total sulfur (stars) for (a) diabase and (b) granite profiles. Sap, saprolite; Soil, soil; uWR, unweathered rock; WR, weathered rock.
Fig. 5. (a) images showing the intensity of scattering on the small-angle neutron scattering (SanS) two-dimensional detector for diabase for four samples (i.e., weathered d1, d2, d3, and unweathered d4). The distance from the center of each image is proportional to scattering vector Q. The color bar shows the relative scattering intensity (purple: lowest intensity; yellow: highest intensity). The unweathered diabase shows an isotropic scattering intensity pattern indicating that pores in these samples have no preferred direction. in contrast, all weathered diabase samples exhibit an “asterisk” pattern of scattering intensity, which is possibly due to development of anisotropic directional pore network. (b) Scanning electron microscopy (Sem) image of weathered diabase d3 showing porosity development on pyroxene exsolution lamellae (top). bottom image shows Tem photomicrograph exhibiting elongated pores developed in pyroxene, sample d3. uWR, unweathered rock; WR, weathered rock.

www.soils.org/publications/sssaj 63
This behavior is exhibited in both the diabase unweathered and weathered samples: the break in slope occurs at approximately Q = 10−3 Å−1. Above this value of Q (small scatterers), m = ~3.4, and the network of scatterers is a surface fractal, but below this Q (large scatterers), the network is a mass fractal (m = ~2.9). Furthermore, across the transition from UWR to WR in the dia-base, both the values for Dm (= 2.9) and Ds (= 2.6) remain rela-tively unchanged. Therefore, early alteration of the diabase does not change the fractal nature of the rock. In addition, not only is the total porosity (Table 4, Fig. 7b, left) characterized by two fractals, but the D2O/H2O experiment revealed that uncon-nected pores (Fig. 7b, right) are also characterized by two frac-tals: a mass fractal with dimension between 2.9 and 3.0 and a surface fractal with dimen-sion between 2.5 and 2.6.
Such breaks in slope in log I − log Q plots were observed previously for other unweath-ered igneous rocks (Table 5). In those other sys-tems, once again the surface and the mass frac-tals were related to smaller and larger features, respectively (Buss et al., 2013; Navarre-Sitchler et al., 2013). In contrast, no break in slope was observed for scattering from unweathered shale ( Jin et al., 2013; Jin et al., 2011; Hall et al., 1986). Apparently, this indicates that scattering from pores and bumps on surfaces in the shale is not different in terms of fractal dimension; that is, the pores are distributed similarly to the surface irregularities for shale where the parti-cle size is generally less than a few micrometers.
pore Size distributionIn unweathered diabase the volume-
weighted pore size distribution showed a peak for diameters of pores of 10 to 20 nm (Fig. 6b). Some 30- to 70-nm pores were also present. In
WR diabase, the peak pore size increased, as did the prevalence of larger pores (100–500 nm).
In summary, neutron measurements show that for the dia-base (i) an anisotropic nanopore network develops in the WR; (ii) total nanoporosities, SSA of the nanoporosity, and con-nected nanoporosities in the UWR and WR show no significant differences; (iii) pore sizes in the WR are larger than those in the UWR; and (iv) the pore-grain surface inside both weathered and unweathered diabase is characterized as a surface fractal at high Q (i.e., with scatterer dimensions of 1–300 nm) and as a mass fractal at low Q (with scatterer dimensions from ~300 nm to ~1 mm).
Table 3. Results of neutron experiments.
Sample name (profile zone)†
nanoporosity, % SSa§, m2 g−1
depth density neutron Sld‡ Total Connected unconnected Total Connected unconnected
m g cm−3 1010cm−2
Diabase
D1 (WR) 1.03 2.98 4.200 1.96 1.06 0.90 0.46 0.21 0.25
D2 (WR) 1.8 3.00 4.170 2.74 2.03 0.72 0.42 0.13 0.29
D3 (WR) 2.0 3.00 4.186 1.96 0.59 1.37 0.48 0.11 0.38
D4 (UWR) 2.75 3.00 4.185 1.54 0.72 0.82 0.57 0.42 0.15
Granite
G1 (SAP) 6.8 1.51 3.995 7.96 1.16 6.80 13.34 4.71 8.63
G2 (SAP) 11.3 1.69 3.995 5.64 1.23 4.41 9.47 0.79 8.68
G3 (WR) 19.7 2.00 3.958 9.47 1.65 7.82 5.44 5.35 0.09G4 (UWR) 22.2 2.60 3.991 2.06 0.62 1.44 0.54 0.22 0.31† SAP, saprolite; SOIL, soil; UWR, unweathered rock; WR, weathered rock.‡ SLD, scattering length density.§ SSA, specific surface area.
Fig. 6. (a) Connected (yellow circles) and isolated (black circles) porosity and surface area of diabase determined from small-angle neutron scattering (SanS)–ultra-small-angle neutron scattering (uSanS). (b) Volume weighted pore size distribution, f(r), for total pores in diabase. it is defined as the number of pores within the narrow size (diameter) interval between r and r + dr, N(r,r + dr), divided by the total number of pores, N: f(r) = N(r,r + dr)/N. in simple terms, f(r) is the proportion of pores of diameter within a narrow band centered on r within the total population of pores. The pore size distribution, f(r), was computed from SanS–uSanS data for each sample using the standard Spherical pore approximation procedure (Radlinski, 2006). The Q-range for pore size distribution fitting was from 3.1 ´ 10−5 Å−1 to 0.13 Å−1. Sap, saprolite; Soil, soil; SSa, specific surface area; uWR, unweathered rock; WR, weathered rock.

64 Soil Science Society of America Journal
nanopoRoSiTy in GRaniTeisotropy of distribution of Scatterers
Unlike the diabase, the two-dimensional patterns of scat-tered intensity observed for all granite samples (not shown here) were isotropic: scattering was equally intense in all azi-muthal directions similar to UWR diabase pattern (Fig. 5a). Thus, in the granite, scatterers were either shaped or distrib-uted in an isotropic fashion throughout the weathered rock.
nanoporosity and Specific Surface areaIn contrast to the diabase where little change in nanopo-
rosity was observed from UWR to WR, the total nanoporos-ity in the granite sharply increased from 1.5% in the UWR to 9.5% in the WR. However, the porosity decreased in the granite SAP (Table 3) (note that no sample of diabase SAP was measured with NS).
The granite was similar to the diabase in that the con-nected porosity in the WR and SAP increased only slightly compared to the UWR: connected porosity remains <2% as weathering progresses (Fig. 8a, left). In fact, the fraction of connected–total porosity in unweathered samples (0.3) de-creased to 0.17 for at the WR–UWR interface, 0.22 at the SAP–UWR interface, and 0.15 in the SAP.
The total SSA in the granite increased upward toward the surface: the SSA of unweathered granite was three to four times smaller than that of SAP samples. Furthermore, whereas most of the SSA in the diabase WR was not measured on con-nected pores, most of the SSA in the granite WR was mea-sured on connected pores. In contrast, most of the SSA in the granite SAP zone was unconnected (Fig. 8a, right).
pore Size distributionIn the unweathered granite (G4-UWR), most of the
pores are unconnected; the scattering from unconnected pores was slightly lower than scattering from all pores when inspected over the whole Q-range (Fig. 8b). This discrepancy was particularly large for scattering in the mid-Q range (2 ´ 10−4 < Q < 2 ´ 10−3 Å−1). This is consistent with a small con-
Fig. 7. (a) The log-log plots of intensity (I) vs. scattering vector (Q) for diabase samples. plots are offset for better presentation. both unweathered (uWR) and weathered (WR) diabase show a change in slope (porod exponent, m) around Q ~ 1 ´ 10−3 Å−1, which corresponds to scatterer size of ~300 nm. (b) porod exponent m vs. depth for dry samples (left plot) and wet samples (right plot). dry samples represent scattering from the total mineral–pore interface while wet samples account only for the scattering from unconnected pores (see methods section). high (1 ´ 10−3 to 1 ´ 10−1 Å−1) and low (3 ´ 10−5 to 1 ´ 10−3 Å−1) Q regions were selected visually based on the scatterings curves in Fig. 4a. a surface fractal is defined by a porod exponent: 3 < m < 4, a mass fractal by 2 < m < 3. The error on m is determined from regression analysis of the log-log curve [log (I) = A – m log (Q) after background subtraction] using origin software.
Table 4. porod exponents and surface fractals for total porosity (dry experiment).
Sample name (profile zone)†
low Q (3 ´ 10−5 < Q < 1 ´ 10−3 Å−1)
high (1 ´ 10-3 < Q < 1 ´ 10−1 Å−1)
Whole Q range
porod exponent, m Fractal Dm porod exponent, m Fractal Ds porod exponent, m Fractal Ds
DiabaseD1 (WR) 3.00 ± 0.02‡ 3.00 ± 0.02 3.43 ± 0.04 2.57 ± 0.04 – –
D2 (WR) 2.93 ± 0.02 2.93 ± 0.02 3.47 ± 0.02 2.53 ± 0.02 – –
D3 (WR) 2.98 ± 0.01 2.98 ± 0.01 3.37 ± 0.03 2.63 ± 0.03 – –
D4 (UWR) 2.94 ± 0.02 2.94 ± 0.02 3.41 ± 0.01 2.59 ± 0.01 – –
Granite
G1 (SAP) – – – – 3.21 ± 0.01 2.79 ± 0.01
G2 (SAP) – – – – 3.22 ± 0.01 2.78 ± 0.01
G3 (WR) – – – 3.34 ± 0.01 2.66 ± 0.01G4 (UWR) 2.86 ± 0.02 2.9 ± 0.02 3.39 ± 0.02 2.61 ± 0.02 –† SAP, saprolite; UWR, unweathered rock; WR, weathered rock.‡ The scattering intensity is given by I = A Q−m + B, thus the errors on m are determined from regression analysis of the log-log curve. log(I − B) =
log A − m log Q.

www.soils.org/publications/sssaj 65
tribution from connected pores throughout the whole Q-range but especially for pores in the range of 300 to 1200 nm. However in the WR zone, these connected mid-Q pores start to close up at the same time that smaller 3- to 10-nm pores become more connected (Fig. 8b). As weathering progressed upward from G4 to G3, this trend of losing large-pore connected porosity con-tinues; larger pores (10–100 nm) disappear from the material while smaller pores (3–10 nm) persist (Fig. 8c). It is important, however, to note here that large pores could disappear either by (i) infilling or (ii) growth into larger pores, which are no longer detectable with neutron scattering (i.e., larger than 10 mm).
In contrast to the observations for total porosity in the WR, the unconnected porosity distribution lacks the peak at 5 to 6 nm (Fig. 8c). The observations from scattering curves (Fig. 8b) and porosity distributions (Fig. 8c) are consistent with con-nectivity only for the smallest pores (<10 nm) in the WR zone. These small pores are not abundant enough to contribute signifi-cantly to the total porosity (Fig. 8a, left). However, due to their small size, they comprise the majority of the total SSA (Fig. 8a, right, Table 3).
porod exponents and Fractal dimensionsThe log-log plots of I vs. Q for granite samples are shown in
Fig. 9a. Similar to the unweathered diabase, the UWR granite also exhibited a break in slope at Q ~ 1 ´ 10−3 Å−1. In addition, the scatterer network was characterized as a mass fractal at low Q and a surface fractal at higher Q. After weathering, in contrast, all the granite samples (WR and SAP) were surface fractals (m > 3) over the whole Q-range (i.e., no break in slope [Fig. 9a]). Furthermore, the surface fractal dimensions do not change sig-nificantly with depth: Ds varies from 2.6 in the UWR to 2.7 in WR to 2.8 in SAP (Table 3).
Summarizing these findings for granite, we observe (i) the nanopore-grain interface inside the granite always scatters iso-tropically; (ii) both the total nanoporosity and the SSA of this porosity increases greatly from UWR to WR; (iii) the connected
nanoporosity is comprised dominantly of pores <10 nm diam.; and (iv) scattering occurs both from mass and surface fractals in the unweathered parent material but only from a surface fractal in weathered material.
Table 5. Fractal dimensions of different rock types, measured by neutron scattering.
Rock type/sample type Fractal dimensions† Reference
Low Q High Q1. Quartz diorite corestone/Individual sections cut from rindlets at different distance from the core
Unweathered 2.98 ± 0.04 2.49 ± 0.04Navarre-Sitchler et al., 2013Weathered 2.80 ± 0.07 2.57 ± 0.17
2. Basaltic andesite/clast with weathering ring Unweathered 2.90 ± 0.07 2.72 ± 0.05Navarre-Sitchler et al., 2013Weathered 2.78 ± 0.15 2.64 ± 0.11
3. Rose Hill shale Whole Q range Jin et al., 2011
Drill cores Unweathered 2.93 ± 0.02
Shale chips in soil profile SSRT Weathered 2.82 ± 0.04; 2.77‡ ± 0.00
Shale chips in soil profile SPRT Weathered 2.87 ± 0.00; 2.83 ± 0.01
Whole Q range
4. Marcellus shale (Oakta Creek member)/Shale chips in soil profile Weathered 2.81 ± 0.12 Jin et al., 2013
5. Bisley volcanisclastics corestones, Puerto-Rico/clast with weathering ring
Unweathered 2.97 ± 0.03 2.67 ± 0.2Bazilevskaya, unpublished data, 2013 See samples description in Buss et al. (2013)
Weathered 2.76 ± 0.08 2.70 ± 0.06
† Surface fractals are shown in italic; all others are mass fractals.‡ Surface fractals are observed at the top of both soil profiles (SSRT and SPRT). SSRT, south swale ridge top; SPRT, south planar ridge top (Jin et al., 2011).
Fig. 8. a. Connected (yellow circles) and isolated (black circles) porosity and surface area of granite determined from small-angle neutron scattering (SanS)–ultra-small-angle neutron scattering (uSanS). (b) SanS–uSanS scattering curves for uWR and WR granite. black line: dry measurements (total porosity); grey line: wet measurements (unconnected pores). The difference between the two curves how connected porosity. (c) Volume weighted pore size distribution, f(r), for total (dry) and isolated (wet) pores in diabase. Sap, saprolite; Soil, soil; uWR, unweathered rock; WR, weathered rock.

66 Soil Science Society of America Journal
meSopoRoSiTy and STRain in GRaniTe and diabaSe
Measurements of mesoporosity (3 mm < d < 0.5 mm), that is, porosity quantified from m-CT images for diabase and granite, are presented in Table 6. In the UWR diabase, the total mesoporosity was very low, and pores were imaged to be generally equant. However, the mesoporosity measured on separate pyroxene grains (1.5%) was observed to be larger than for individual plagioclase grains (0.05%). In the WR zone, the pyroxene mesoporosity increased to 6 to 7%. This value was not observed to vary significantly with depth below the SAP zone. The large standard deviation in mesoporosity reflects the large variations observed for different subareas, presumably due to variation in pyroxene content. Plagioclase porosity also increases from UWR to WR zone; however, py-roxene porosity is larger than that in plagioclase in all samples in the WR zone. These observations are consistent with the conclusion that pyroxene weathering initiates before plagio-clase dissolution in the WR—a conclusion also reached based on microscopy (Fig. 5b). Although the pyroxene contains Fe (see discussion below), no Fe-hydroxide precipitation was observed. The total mesoporosity—low in both the diabase UWR and WR—increased to ~25% in the lower saprolite at 0.9 m (sample F19–2C). Then it decreased to ~12% at 0.75 m (sample F19-2A), (Table 6).
For granite, total mesoporosity includes both equant pores and fractures. This mesoporosity was low in the UWR granite (~2%). Where mesofractures were observed under m-CT, they were mostly associated with biotite grains (Fig. 10). Mesoporosity increased markedly to ~30% in WR zone but then decreased in the SAP zone (Table 6). Overall, granite saprolite showed more variability in mesoporosity (i.e., both high and low porosity regions were observed) than was ob-served in the WR.
Fig. 9. (a) The log-log plots of intensity (I) vs. scattering vector (Q) for granite samples. plots are offset for better presentation. unweathered (uWR) granite has change in slope m at Q ~ 1 ´ 10−3 Å−1, which corresponds to scatterer size of ~300 nm. in contrast, all weathered granite samples do not show a change in slope. (b) porod exponent m vs. depth for dry samples (left plot) and wet samples (right plot). Sap, saprolite; WR, weathered rock.
Table 6. mesoporosity (3 mm < d < 1 mm) in diabase and granite as determined from microcomputed tomography.
element depletionSample name (profile zone)† depth, m mesoporosity, v/v Na Mg Fe
DiabaseF19-2A (SAP) 0.75 11.8 ± 4.3 −0.90 −0.91 −0.93
F19-2C (SAP) 0.9 25.5 ± 6.9 −0.05 −0.07 −0.38
D1 (WR) 1.03 1.3 ± 0.5% (Pl), 7.3 ± 5.2 (Pyr)‡ No depletion No depletion −0.18
D1 (WR) 1.8 1.8 ± 1.5% (Pl), 5.9 ± 4.2 (Pyr) No depletion No depletion −0.04
D3 (WR) 2 1.0 ± 0.7% (Pl), 6.2 ± 3.8 (Pyr) No depletion No depletion No depletion
D4 (UWR) 2.75 0.05 ± 0.01% (Pl), 1.5 ± 0.8 (Pyr) No depletion No depletion No depletion
Granite
G1 (SAP) 6.8 12.5 ± 4.9 −0.97 −0.10 −0.76
G2 (SAP) 11.3 18.4 ± 6.3 −0.98 −0.09 −0.83
G3 (WR) 19.7 30.4 ± 0.2 −0.44 −0.04 −0.84G4 (UWR) 22.2 1.9 ± 0.7§ No depletion No depletion No depletion† SAP, saprolite; UWR, unweathered rock; WR, weathered rock.‡ For diabase WR and UWR zone porosity was determined separately on plagioclase (Pl) and pyroxene (Pyr). At least 5 measurements were taken
for each mineral§ For G4 (UWR) mesoporosity includes both round-like pores and fractures.

www.soils.org/publications/sssaj 67
StrainTrends in porosity may be related to volume changes in
the rock during weathering. The strain is defined as the extent of change of volume of weathered material (Vw) with respect to the original volume, Vp (Brimhall and Dietrich, 1987; Egli and Fitze, 2000):
w p p Ti,pTi,w
p w Ti,w
1V V C
V Cr
er
−= = − [5]
where Ci,w and Ci,p are concentrations of an element i in weath-ered and parent material, respectively. Here, CTi,p and CTi,w are concentrations of an immobile element (here, Ti), and rp and rw are densities in weathered (subscript w) and parent (subscript p) material, respectively. In strain calculations for both diabase and granite, we considered the average of the densities of the two deepest samples as the density of parent material (samples D4 and D3 for diabase, and samples G4 and F-11-I, see Tables AI and AII in Bazilevskaya et al., 2013). Negative strain values indicate that the volume of the original protolith decreases in weathered material and positive values indicate expansion in volume (isovolumetric weathering means strain = 0). Changes in volume due to compaction or expansion from chemical and physical weathering, addition of organic matter, or bioturbation can be significant (Schaetzl and Anderson, 2005).
In both diabase and granite profiles, strain was positive in the lower saprolite zone (expansion), then decreased to 0 in the upper SAP. In the SOIL, strain decreased to <0 (compaction) (Fig. 2; Fig. 11). The increase in volume in the diabase SAP coin-cides with the increase in mesoporosity, with onset of plagioclase dissolution (Table 6, Fig. 2) and formation of expandable clays such as smectite (Pavich et al., 1989). Similarly, the volume in-crease in the granite is also observed within the plagioclase reac-tion front (Table 5, Fig. 2b).
diSCuSSionmechanism of Weathering Reactions in diabase
The first weathering reaction in the diabase (observed in the WR zone) was pyroxene dissolution. This reaction was docu-mented both by SANS and USANS (anisotropy of scattering pattern) and microscopy (Fig. 5). Eventually, plagioclase dissolu-tion initiates and in the transition from WR to SAP, the meso-porosity of plagioclase and pyroxene grains increase at least two-fold, although this porosity still remains below 5 to 6% (Table 5). From UWR to WR, the nanoporosity, both total and connect-ed, and SSA increase slightly (Table 3) even though no signifi-cant element depletion or oxidation of Fe are observed. The only chemical change that was detected was loss of ferrous Fe (tFeO = 0.18) and S, documented at the top of the WR zone (Table 6, Fig. 4). Thus, even before bulk element composition changes measurably, nanoporosity opens in the diabase as the ferrous Fe-containing phase, pyroxene, begins to dissolve. Pyrite dissolution (as indicated by the decrease tS at the WR-SAP interface, Fig. 4) could also contribute to nanoporosity development, but to a
lesser extent than pyroxene because of the low pyrite content in the rock.
Even as the pyroxene and plagioclase dissolve, the WR re-mains a mass + surface fractal like the UWR (Table 4, Fig. 7b). The lack of change in the fractal nature of the diabase between the UWR and the WR indicates that the structure was preserved during this initial stage of weathering. All these observations for the WR diabase (i.e., no major element depletion, no oxidation of ferrous Fe, low porosity, and intact rock structure) are consis-tent with no change in the dominant transport mechanism be-tween the UWR and the WR since the results imply that oxygen was not able to penetrate into this portion of the rock. In other words, the transport mechanism for solutes in the UWR is likely the same as in the samples up to the WR-SAP boundary that were investigated with neutron scattering—and given the low porosity, this mechanism is likely diffusion rather than pore fluid advection. Finally, all these samples are likely to have weathered mostly beneath the water table, which has been reported to lie within the saprolite zone in this region (Bazilevskaya et al., 2013; Cleaves, 1993; Pavich et al., 1989)
A sharp increase in mesoporosity in the SAP zone com-pared to the UWR and WR zones (Table 5, Fig. 12a) coincides with onset of more significant plagioclase and pyroxene dis-solution. This dissolution proceeds until Na, Mg, and FeO are almost completely depleted within 0.75 m of the surface (Fig. 3, Table 5). Here, the reaction front (i.e., the depth zone over which reaction occurs) is very narrow (0.25 m = 1 m − 0.75 m). Since diffusion of O2 is fast in air-filled pores but very slow in water-filled pores below the water table (Bornstein et al., 1980), nonoxidative dissolution of pyroxene likely took place beneath the water table in the WR. In contrast, oxidative dissolution appears to have dominated above the groundwater table where
Fig. 10. The m-CT image of G4 (unweathered, uWR) sample. dark grey: plagioclase; light grey: biotite.
68 Soil Science Society of America Journal
pores are filled with O2-rich air rather than water. The oxygen-ated environment in the SAP is documented by immobilization of Fe by precipitation of Fe(III) (oxy)hydroxides as inferred from
oxidizedFeOt (Fig. 2), which is in agreement with microscopic obser-
vations (Pavich et al., 1989).Formation of another secondary mineral, the Fe-rich smec-
tite nontronite, has also been reported in this rock (Bazilevskaya et al., 2013; Pavich et al., 1989). Smectite is a swelling clay; the transformation of pyroxene to smectite can occur with an in-crease in net rock volume due to smectite swelling (Vprod/Vreact > 1) (Velbel, 1989). Nontronite comprises ~20 v/v of the rego-lith in the lower saprolite at 0.9 m. Consistent with this, a high positive value for strain (ei,w > 0) was calculated at the 0.9-m depth where the smectite content reached 20% (Fig. 2) The pre-cipitation of secondary minerals such as smectite may explain the spatial variability in porosity in diabase SAP zone (Table 6). In the absence of O2, pyroxene likely dissolves due to proton-pro-moted dissolution. For example, a simplified reaction describing the dissolution of augite via this mechanism could be written as:
( )( )
+0.34 0.22 0.44 2 6
2+ 2+ 2+2 2
Ca Fe Mg Si O augite + 4H
0.34Ca + 0.22Fe + 0.44Mg + 2SiO aq + 2H O
→ [6]
(The mineral formula for augite was derived from bulk chemistry data). However, in the presence of O2, Fe (oxy)hydroxides can precipitate from the pore fluid into the pore space by
( )( )
+0.34 0.22 0.44 2 6 2
2+ 2+2 2
Ca Fe Mg Si O augite + 4.22H + 0.44O
0.34Ca + 0.22FeOOH + 0.44Mg + 2SiO aq + 2H O
® [7]
Since the Fe content in diabase is high, precipitation of significant amounts of Fe (oxy)hydroxides in the O2-rich SAP zone is expected. Such precipitates will likely reduce the perme-ability and diffusivity of the rock, thus blocking available fluid pathways for removing dissolved cations. Under such conditions, precipitation of other secondary phases such as Al-hydroxides and smectites are likely. In such a system, it is common to see spatial variability in porosity, reactive surface area, and local fluid supersaturation ( Jamtveit et al., 2009; Putnis, 2002; Merino et al., 1993), all of which may document variability in available O2 in the pore fluid space.
In such a fluid-saturated, low-flow environment that is charged with significant partial pressures of CO2, dissolution of silicates will drive up the alkalinity and pH of the pore fluid, pro-ducing high concentrations of the carbonate ion (Brantley et al., 2014). In addition, if Ca is also being released to solution during dissolution, calcite can precipitate. Other researchers (Drake et
Fig. 11. Tau-strain plots for (a) diabase and (b) granite. Filled, half-filled, grey, and open circles indicate unweathered (uWR), weathered (WR), saprolite (Sap), and soil (Soil) samples, respectively.

www.soils.org/publications/sssaj 69
al., 2008), for example, reported calcite precipitation at depth in granites above a zone of oxidation that presumably released Ca ions to solution. Consistent with this, calcite enrichment is ob-served in the SAP zone (Fig. 4a, note the break in the range plot-ted in the x axis) in the diabase profile. Carbonate precipitation is attributed to dissolution of plagioclase and pyroxene and the release of Ca and Mg ions under conditions of minimally flow-ing CO2-charged fluid under fluid-saturated conditions, that is, consumption of CO2 drives pH to elevated values in microenvi-ronments. A simplified reaction for calcite precipitation under neutral or slightly alkaline conditions can be written as follows:
2+3 3 2 2Ca + 2HCO CaCO + CO + H O−⇔ [8]
According to this reaction, at high values of pH where bicar-bonate ions predominate, a decrease in pCO2 favors calcite forma-tion. Calcite precipitation higher in the profile is likely hindered because CO2-charged fluids advect in the soil because of the in-crease in weathering-induced porosity, thus maintaining a more nearly constant and lower pH. As the porosity (and by inference, permeability) decreases with depth, advection slows and CO2 dissolved in water is consumed by silicate dissolution. According to this argument, calcite pre-cipitation may in some cases document the depth where the mechanism of solute transport changes from advection to diffusion (this is also the zone [or depth] where depletion of CO2 and O2 begins).
In summary, the interplay of porosity and min-eral reactions for diabase is shown in Fig. 12. The connected nanoporosity and SSA of the nanoporos-ity documents the dissolution of the first mineral: pyroxene. This dissolution is anisotropic with respect to scattering and is due to dissolution of exolution lamellae (Fig. 5). The loss of S in this zone could indi-cate that pyrite is dissolving oxidatively, using up the low concentration of O2, which diffuses in, produc-ing slightly acidic fluids that initiate the weathering of pyroxene. Early dissolution of pyroxene proceeds be-neath the water table in the absence of O2 most likely via a proton-promoted mechanism, as indicated by the lack of Fe(III) oxide precipitation in this zone. These reactions are followed by dissolution of plagio-clase within the WR, resulting in a slight increase in mesoporosity. Such weathering can occur deep in the rock because there are connected nanopores present in the UWR (Fig. 6).
Oxygen is depleted in the downward percolat-ing waters presumably via the oxidative reactions oc-curring higher in the saprolite. The diabase is a mas-sive rock with only limited fractures; thus, the main mechanism of solute transport within this zone is molecular diffusion rather than flow. Consistent with both of these, the diabase starts and remains a mass + surface fractal throughout the WR zone.
This is consistent with the results of numerical modeling of the diabase profile presented by Bazilevskaya et al. (2013) where sol-ute transport during weathering was assumed to be dominated by diffusion. The reaction zone for plagioclase and pyroxene are both very thin, that is, 0.5 m, consistent with diffusive rather than advective transport of reactants. In addition, the WR zone lies below the water table (Pavich et al., 1989) where O2 diffu-sion in water-saturated pores is expected to be very slow. As a result, the final consumption of O2, as indicated by the zone of pyrite oxidation, lies higher than the zone of proton depletion (pyroxene dissolution). In contrast, in the SAP, a series of disso-lution- precipitation reactions takes place that lead to a dramatic increase in mesoporosity, which in turn results in advection of pore fluids into or through this zone. The large variations in mes-oporosity within the SAP zone are likely due to precipitation of secondary minerals as observed by Pavich et al. (1989).
Sequence of Weathering in the GraniteIt is known that the first mineral to weather in granite is
often biotite (Buss et al., 2008; Cassiaux et al., 2006; Fletcher
Fig. 12. Summary of regolith-forming reactions in (a) diabase and (b) granite profiles.

70 Soil Science Society of America Journal
et al., 2006; Sardini et al., 2006; Robert et al., 2003; Graham and Francovizcaino, 1992; Eggler et al., 1969). Indeed, it has long been known that oxidation or cation exchange reactions in biotite during weathering can cause expansion and fracturing in crystalline rocks (Bisdom et al., 1982; Rodgers and Rodgers, 1848). In the Piedmont granite, we observed fractures induced by biotite oxidation in the UWR zone (Bazilevskaya et al., 2013). Formation of these fractures is likely to increase the permeability, which favors advection of reactive fluids containing O2 and CO2 into the granite UWR, well below the groundwater table, which has been inferred to lie in the saprolite (Cleaves, 1993; Pavich, 1986; Sowers, 1963). This conceptual model is consistent with the depth of the first two reactions observed in the granite-FeO depletion and immobilization as Fe(III) hydroxide in UWR zone as deep as 21 m below the surface (Fig. 2).
Such biotite-driven microfracturing could likely lead to an increase in the granite permeability, and, therefore, to the increased plagioclase dissolution in the WR (Fig. 2). This dis-solution is documented by increases in both nano and mesopo-rosities (Fig. 8a; Fig. 12b). Furthermore, the intact granite UWR transformed from a mass + surface fractal to a surface fractal in WR and SAP zones (Fig. 9b). For a surface fractal, a Porod ex-ponent m of 3 (Ds = 3) is consistent with a very rough surface while m = 4 indicates a very smooth surface (Ds = 2) (Radlinski et al., 1999). For the granite, the Porod exponent m decreased from 3.4 in the UWR zone to 3.2 in the SAP zone (Table 4, Fig. 9b). In other words, the surface became rougher as weathering progressed in the SAP.
Interestingly, although mesoporosity was higher in the unweathered granite than in the UWR diabase (Table 6), the nanopores in the weathered granite are less connected than in the WR diabase. Also, although nanoporosity increased signifi-cantly in the WR zone compared to the UWR, presumably due to biotite-caused fracturing and plagioclase dissolution (Fig. 10), only pores <10 nm were connected (Fig. 8b and 8c). We may conclude that because of limited connectivity, most of the nanopores played only a minor role in the weathering reactions except for their role in allowing O2 to enter via diffusion, thus resulting in the oxidation and fracturing of biotite. It is then these fractures that allow water to infiltrate through the meso-pores without changing the nanopores significantly. Thus, the nanoporosity is effectively bypassed. Indeed, the reaction front for silicates in the granite lies higher than the reaction front for oxidation (Brantley et al., 2014). Numerical modeling suggested that advective transport dominated in granite (Bazilevskaya et al., 2013), thus creating a very thick reaction zone for plagioclase (Fig. 2b) and thick weathering profile.
main Factors affecting diabase and Granite Weathering in the piedmont
In general, deep weathering is controlled by (i) character-istics of the rock (e.g., mineral and chemical composition, grain size, porosity), (ii) properties of the reactive fluid (e.g., compo-sition, ionic strength, acidity, temperature), and (iii) the flow
characteristics of the fluid. All these factors are related to each other so that any variation in one of them leads to changes in the others. We summarize some of the important features below.
Rock CharacteristicsMineral composition and texture of a parent rock greatly
affect its reaction with fluid. With respect to rock composition, diabase and granite have minerals with different degrees of “alter-ability.” Fast-reacting Fe-Mg-bearing minerals are more abundant in a diabase than granite. In fact, in the granite, the quartz and K-feldspar do not contribute to the formation of clay minerals (quartz) or are relatively resistant to chemical weathering (quartz and K-spar). Parent rock composition also controls the forma-tion of secondary minerals. For example, clay production, that is, the amount of clays produced in the weathered zone, depends on the MgO content of the parent rock (Velde and Meunier, 2008). This could be related to the enhancing effect of Mg ions for nucleation and growth of clay minerals (Grauby et al., 1993; Grauby et al., 1994). In granite, plagioclase weathers to kaolin-ite and in diabase, plagioclase weathers to smectite. The extent of accumulation of secondary phases is thus controlled by pore fluid chemistry and its velocity. The lower fluid velocity in the unfractured diabase leads to higher cation concentrations in pore water, which obviously favors secondary clay formation. Indeed, more clays form on diabase than on granite (Pavich et al., 1989).
In comparison to composition, the grain size and pore net-work structure apparently are even more important because they control the mechanism of reactive fluid transport. According to several authors (Ballesteros et al., 2010; Meunier et al., 2007), three systems of weathering have been identified: (i) contact mi-crosystems (pore dimensions on the order of Å or nanometers), (ii) plasmic microsystems (pore dimensions nanometers–mi-crometers), and (iii) fissure systems (pore dimensions microm-eters–centimeters). In contact and plasmic microsystems, diffu-sion is the primary mechanism of solute transport (Brady and Weil, 2007; Nahon, 1991).
These three systems are exemplified here in our observa-tions. The neutron scattering from the diabase documented both a surface fractal at high Q (pore diameter 1–300 nm) and mass fractal at low Q (~300 nm to ~ 5 mm). In the unweathered rocks, the mass fractal is comprised of scatterers of dimension of 1 to 300 nm, that is, similar to contact microsystems. In contrast, the surface fractal consists of scatterers of dimensions from 300 nm to ~ 5 mm, that is, consistent with plasmic microsystems. Our observations are consistent with the conclusion that, when a low-porosity rock retains both the mass + surface fractals dur-ing weathering, that is, it still preserves its initial structure, solute transport is mostly by diffusion. In contrast, when there is trans-formation from mass + surface to surface fractal, the mechanism of reactive transport changes from diffusion to advection. This transformation occurred in the transition from the UWR to the WR in the granite and was characterized by a wide reaction front for plagioclase, consistent with solute transport by advection.

www.soils.org/publications/sssaj 71
properties of the Reactive FluidWeathering occurs as rocks dissolve to neutralize and re-
duce the carbonated, oxidizing fluids found at Earth’s surface ( Jamtveit and Hammer, 2012; Brantley, 2010; Graham et al., 2010; Drever and Stillings, 1997). These surficial fluids are acidic and oxidizing because they equilibrate with CO2 and O2 in the atmosphere. Rocks consume CO2 and O2 to different extents because of both their chemical composition as well as physical properties, such as porosity and permeability. We clearly demon-strate this for the two Virginia weathering profiles. For example, fractures in the protolith and microfractures developed as a re-sult of biotite dissolution in UWR presumably allow pore fluids to infiltrate deep into the granitic material. Even beneath the wa-ter table, connected nanopores in the granite allow O2 access to biotite grains, which in turn causes the oxidation and fracturing, allowing further infiltration of water. The sequence of primary weathering reactions described above is consistent with the fact that the reaction front for plagioclase dissolution (consumption of protons) lies higher than the reaction front for FeO oxidation (consumption of O2) (Fig. 2).
In contrast, the dense, massive, and impermeable diabase lacked fractures (Bazilevskaya et al., 2013). In addition, although well-connected anisotropic nanopores are present in the diabase parent rock, O2 apparently did not permeate significantly into the rock because loss of Fe(II) occurred without precipitation of ferric oxides. Oxygen likely became depleted relatively high in the system because of the high ferrous Fe content of the rock. Thus, even though nanopores are present in this case, little to no O2 is able to penetrate the rock beneath the point of pyrite disso-lution. The argument, therefore, is that oxidation-driven fractur-ing did not occur in the diabase because the oxidation front lies higher than the silicate dissolution front and volume increases never occurred at depth to fracture the rock (Fig. 2).
Brantley et al. (2014) have hypothesized that these observa-tions may be generally true for weathering of crystalline rocks. Where the initial concentrations of ferrous oxides are higher than the concentrations of alkalis and alkaline earths, O2 be-comes depleted at shallower depths than CO2 is depleted, and no deep microfracturing occurs. In such rocks—that is, more mafic rocks—deep regolith profiles tend not to form. In con-trast, where the starting concentrations of ferrous oxides are low compared to alkalis and alkaline earths, CO2 becomes depleted at shallower depths than O2, and deep microfracturing occurs, driving deep infiltration of meteoric fluids and a correspondingly deep regolith. Bazilevskaya et al. (2013) showed that for 27 pro-files studied worldwide from ridgetop settings, regolith on gran-ite was deeper than on diabase, consistent with these inferences.
ConCluSionSIn the plagioclase reaction zone in both lithologies, meso-
porosity (3 mm < d < 0.5 mm), calculated from m-CT scans, comprised a larger total volume fraction than the nanoporosity. This midscale porosity increased dramatically in the zone of pla-gioclase dissolution in both rocks; however, in both rocks this
porosity significantly decreases towards the surface due to pre-cipitation of secondary clays. The initial increase in mesoporosity in the diabase was driven by coalescence of small pores into larger pores, while the increase in porosity (and by inference, perme-ability) in the granite was driven by growth of fractures.
Neutron scattering patterns showed that the diabase devel-oped an anisotropic pore network in the weathered rock before disaggregation and before loss of major elements. These anisotro-pic pores were attributed to dissolution of pyroxene along dissolv-ing exsolution lamellae, the first weathering reaction in the deep diabase. However, even with this dissolution, increases in total nanoporosity and SSA were not detectable when weathered dia-base and its protolith (unweathered rock) are compared. In con-trast, the deepest reaction observed in granite was oxidation and microfracturing around biotite, which was accompanied by sec-ondary precipitation. Above this early microfracturing, isotropic nanopores increased in concentration to 10% as plagioclase dis-solved in the feldspar reaction zone (RZ). In the RZ, larger frac-tures were also imaged. Most of the SSA in this plagioclase RZ consisted of very small connected nanopores (<10 nm diam.). In contrast, in the upper part of the weathering profile, only a small volume fraction of the nanopores in the granite was connected.
Unlike diabase, granite showed a drastic change in scatter-ing across the plagioclase reaction front, which was recorded by a large increase in both porosity and the mineral–pore interface, and a transition from mass + surface fractals in UWR granite to surface fractal only in WR. However, nanopores in granite had limited connectivity and played a secondary role in triggering dissolution reactions. In contrast, mesopores, particularly frac-tures developed as a result of biotite oxidation, increased granite permeability to the O2-rich advective fluid, accelerating plagio-clase dissolution below the groundwater table. Connectivity of nanoporosity in diabase was high (>50% connected), but the rock lacked larger mesopores that could have enhanced fluid flow. The slow O2 diffusion in water-saturated diabase below the groundwater table is another effect that limits pyroxene and pla-gioclase dissolution.
Neutron scattering also revealed the fractal nature of the granite and diabase porosity. The internal surface of both un-weathered rocks was characterized as both a mass fractal for the larger features, that is, scattering from pores along grain boundar-ies and triple junctions, and a surface fractal for smaller features, that is, scattering from the bumps at the grain–pore interface. For example, the neutron scattering from the diabase document-ed both a surface fractal at high Q (pore diameter 1–300 nm) and mass fractal at low Q (~300 nm to ~5 mm). The delineation between mass and surface fractals occurred at features of ~200 nm in the unweathered granite. In contrast, as weathering and fracturing occurred in the granite in the plagioclase RZ, scat-tering documented only surface fractals. The observed surface fractals are consistent with fracturing and disaggregation of the initial granite structure into smaller subunits. The transforma-tion from a mass + surface to a surface fractal in granite sug-gests transformation from a regime where the bulk of the solute

72 Soil Science Society of America Journal
transport is by diffusion to a regime where the transport is domi-nantly advective. The silicate dissolution front was documented at greater depths than the oxidation front in the diabase, whereas the reverse was true in the granitic rock. For the granite, the low ferrous content of the rock likely allowed deep penetration of O2 in nanopores deep into unweathered rock, driving oxidation and microfracturing of biotite. As fractures opened, O2-rich fluids penetrated the rock via advection even below the groundwater table, driving both biotite and plagioclase dissolution. In con-trast, the diabase had similar nanoporosity, but did not oxidize at depth or fracture, presumably because O2 was depleted high in the profile of this Fe-rich lithology. Therefore, we attribute the difference in regolith thickness between granite and diabase mainly to the difference in the dominant mode of solute trans-port which, in turn, depends on different balances in CO2 and O2 consumption. This work documents the importance of fluid flow mechanisms and the consumption of oxygen in controlling the depth of regolith formation.
aCKnoWledGmenTSThis project was funded by DOE Grant DE-FG02-05ER15675. The research of GR was sponsored by the Division of Chemical Sciences, Geosciences, and Biosciences, Office of Basic Energy Sciences, U.S. Department of Energy. DRC was supported by the Department of Energy Office of Basic Energy Sciences as part of an Energy Frontier Research Center, “Nanoscale Control of Geologic CO2” led by Lawrence Berkeley National Laboratory. The Advanced Light Source is supported by the Director, Office of Science, Office of Basic Energy Sciences, of the U.S. Department of Energy under Contract DE-AC02-05CH11231. We specifically acknowledge Duluth Parkinson for the help with tomography imaging at beamline 8.3.2 at the Advanced Light Source at Lawrence Berkeley National Laboratory. The small-angle neutron scattering at the National Institute of Standards and Technology, U.S. Department of Commerce, was supported in part by the National Science Foundation under Agreement DMR-0944772. Transmission electron microscopy and SEM work was done at Materials Research Institute, Penn State. The identification of commercial instruments in this paper does not imply recommendation or endorsement by the National Institute of Standards and Technology, nor does it imply that the equipment used are necessarily the best available for the purpose.
ReFeRenCeSAnderson, S.P., W.E. Dietrich, and G.H. Brimhall. 2002. Weathering profiles,
mass-balance analysis, and rates of solute loss: Linkages between weathering and erosion in a small, steep catchment. Geol. Soc. Am. Bull. 114(9):1143–1158.
Anovitz, L.M., D.R. Cole, and L.R. Riciputi. 2009. Low-temperature isotopic exchange in obsidian: Implications for diffusive mechanisms. Geochim. Cosmochim. Acta 73:3795–3806. doi:10.1016/j.gca.2009.02.035
Bacon, A.R., D.D. Richter, P.R. Bierman, and D.H. Rood. 2012. Coupling meteoric Be-10 with pedogenic losses of Be-9 to improve soil residence time estimates on an ancient North American interfluve. Geology 40:847–850. doi:10.1130/G33449.1
Ballesteros, E.M., M.M. Martin, and J.G. Talegon. 2010. Role of porosity in rock weathering processes: A theoretical approach. In: J.R.V. Romani, editor, Cadernos Do Laboratorio Xeoloxico De Laxe. Vol. 35. Edicios do Castro, Sada, Spain. p. 147–162.
Barker, J.G., C.J. Glinka, J.J. Moyer, M.H. Kim, A.R. Drews, and M. Agamalian. 2005. Design and performance of a thermal neutron double-crystal diffractometer for USANS at NIST. J. Appl. Cryst. 38:1004–1011. doi:10.1107/S0021889805032103
Bazilevskaya, E., M. Lebedeva, M. Pavich, G. Rother, D.Y. Parkinson, D. Cole,
and S.L. Brantley. 2013. Where fast weathering creates thin regolith and slow weathering creates thick regolith. Earth Surf. Processes Landforms 38:847–858. doi:10.1002/esp.3369
Bisdom, E. B. A., G. Stoops, J. Delvigne, P. Curmi, and H.J. Altemuller. 1982. Micromorphology of weathering of biotite and its secondary products. Pedologie. 32:225–252.
Bornstein, J., W.E. Hedstrom, and F.R. Scott. 1980. Oxygen diffusion rate relationships under three soil conditions. Life Sciences and Agriculture Experiment Stn. Tech. Bull. 98. Maine Agricultural and Forest Experiment Station, Orono.
Brady, N.C., and R.R. Weil. 2007. The nature and properties of soils. 14th ed. Prentice Hall, Upper Saddle River, NJ.
Brantley, S. 2010. Weathering: Rock to regolith. Nat. Geosci. 3:305–306. doi:10.1038/ngeo858
Brantley, S.L., M. Lebedeva, and E. Bazilevskaya. 2014. Relating weathering fronts for acid neutralization and oxidation to pCO2 and pO2. In: H.D. Holland and K.K. Turekian, editors, Treatise on geochemistry. 2nd ed. Elsevier, Oxford. p. 327–352.
Brantley, S.L., and A.F. White. 2009. Approaches to modeling weathered regolith. In: E. Oelkers and J. Schott, editors, Thermodynamics and kinetics of water-rock interaction. Mineralogical Society of America, Chantilly, VA. p. 435–484.
Brimhall, G.H., and W.E. Dietrich. 1987. Constitutive mass balance relations between chemical composition, volume, density, porosity, and strain in metasomatic hydrochemical systems: Results on weathering and pedogenesis. Geochim. Cosmochim. Acta 51:567–587. doi:10.1016/0016-7037(87)90070-6
Buol, S.W., and S.B. Weed. 1991. Saprolite-soil transformations in the Piedmont and mountains of North Carolina. Geoderma 51:15–28. doi:10.1016/0016-7061(91)90064-Z
Buss H.L., S.L. Brantley, F.N. Scatena, E. Bazilievskaya, A. Blum, M. Schulz, R. Jiminez, and A.F. White. 2013. Probing the deep critical zone beneath the Luquillo Experimental Forest, Puerto Rico. Earth Surf. Processes Landforms 38:1170–1186.
Buss, H.L., P. Sak, R.M. Webb, and S. Brantley. 2008. Weathering of the Rio Blanco quartz diorite, Luquillo Mountains, Puerto Rico: Coupling oxidation, dissolution and fracturing. Geochim. Cosmochim. Acta 72:4488–4507. doi:10.1016/j.gca.2008.06.020
Cassiaux, M., D. Proust, M. Siitari-Kauppi, P. Sardini, and Y. Leutsch. 2006. Clay minerals formed during propylitic alteration of a granite and their influence on primary porosity: A multi-scale approach. Clays Clay Miner. 54:541–554. doi:10.1346/CCMN.2006.0540502</jrn>
Cleaves, E.T. 1993. Climatic impact on isovolumetric weathering of a coarse-grained schist in the northern Piedmont Province of the central Atlantic states. Geomophology 8:191–198. doi:10.1016/0169-555X(93)90037-3
Cole, D.R., K.W. Herwig, E. Mamontov, and J.Z. Larese. 2006. Neutron scattering and diffraction studies of fluids and fluid-solid interactions. In: H.-R. Wenk, editor, Neutron scattering in earth sciences. Vol. 63. Mineralogical Society of America, Chantilly, VA. p. 313–362.
Dierick, M., B. Masschaele, and L. Van Hoorebeke. 2004. Octopus, a fast and user-friendly tomographic reconstruction package developed in LabView (R). Meas. Sci. Technol. 15:1366–1370. doi:10.1088/0957-0233/15/7/020
Drake, H., E.-L. Tullborg, and H. Annersten. 2008. Red-staining of the wall rock and its influence on the reducing capacity around water conducting fractures. Appl. Geochem. 23:1898–1920. doi:10.1016/j.apgeochem.2008.02.017
Drever, J.I., and L. Stillings. 1997. The role of organic acids in mineral weathering. Colloids Surf. 120:167–181. doi:10.1016/S0927-7757(96)03720-X
Eggler, D.H., E.E. Larson, and W.C. Bradley. 1969. Granites, grusses, and the Sherman erosion surface, southern Laramie Range, Colorado-Wyoming. Am. J. Sci. 267:510–522. doi:10.2475/ajs.267.4.510
Egli, M., and P. Fitze. 2000. Formulation of pedogenic mass balance based on immobile elements: A revision. Soil Sci. 165:437–443. doi:10.1097/00010694-200005000-00008
Fletcher, R.C., H.L. Buss, and S.L. Brantley. 2006. A spheroidal weathering model coupling porewater chemistry to soil thicknesses during steady-state denudation. Earth Planet. Sci. Lett. 244:444–457. doi:10.1016/j.epsl.2006.01.055
Glinka, C.J., J.G. Barker, B. Hammouda, S. Krueger, J. Moyers, and W.J. Orts. 1998. The 30 m small-angle neutron scattering instruments at the National Institute of Standards and Technology. J. Appl. Cryst. 31:430–445. doi:10.1107/S0021889897017020
Graham, R.C., and E. Francovizcaino. 1992. Soils on igneous and metavolcanic

www.soils.org/publications/sssaj 73
rocks in the Sonogran desert of Baja-California, Mexico. Geoderma 54:1–21. doi:10.1016/0016-7061(92)90095-O
Graham, R.C., A.M. Rossi, and R. Hubbert. 2010. Rock to regolith conversion: Producing hospitable substrates for terrestrial ecosystems. GSA Today 20:4–9. doi:10.1130/GSAT57A.1
Grauby, O., S. Petit, A. Decarreau, and A. Baronnet. 1993. Beidellite-saponite series: Experimental approach. Eur. J. Mineral. 5:623–635. doi:10.1127/ejm/5/4/0623
Grauby, O., S. Petit, A. Decarreau, and A. Baronnet. 1994. The nontronite-saponite series: Experimental approach. Eur. J. Mineral. 6:99–112. doi:10.1127/ejm/6/1/0099
Hall, P.L., D.F.R. Mildner, and R.L. Borst. 1986. Small-angle scattering studies of the pore spaces of shaly rocks. J. Geophys. Res. 91:2183–2192. doi:10.1029/JB091iB02p02183
Hinde, A.L. 2004. PRINSAS: A windows-based computer program for the processing and interpretation of small-angle scattering data tailored to the analysis of sedimentary rocks. J. Appl. Cryst. 37:1020–1024. doi:10.1107/S0021889804021260
Hochella, M.F.J., and J.F. Banfield. 1995. Chemical weathering of silicates in nature: A microscopic perspective with theoretical considerations. In: A.F. White and S.L. Brantley, editors, Chemical weathering rates of silicate minerals. Vol. 31. Mineralogical Society of America, Chantilly, VA. p. 353–406.
Jamtveit, B., and O. Hammer. 2012. Sculpting of rocks by reactive fluids. Geochem. Perspectives 1:341–481. doi:10.7185/geochempersp.1.3
Jamtveit, B., C. Putnis, and A. Malthe-Sorenssen. 2009. Reaction induced fracturing during replacement processes. Contrib. Mineral. Petrol. 157:127–133. doi:10.1007/s00410-008-0324-y
Jin, L., R. Mathur, G. Rother, D.R. Cole, E. Bazilevskaya, J. Williams, A. Carone, and S.L. Brantley. 2013. Porosity and chemical fingerprints of a black shale (Marcellus formation) as it weathers at the land surface. Chem. Geol. 356:50–63. doi:10.1016/j.chemgeo.2013.07.012
Jin, L., G. Rother, D. Cole, D. Mildner, C. Duffy, and S.L. Brantley. 2011. Characterization of deep weathering and nanoporosity development in shale: A neutron study. Am. Mineral. 96:498–512. doi:10.2138/am.2011.3598
Jones, J.B., and R.A. Isaac. 1972. Determination of sulfur in plant material using a Leco sulfur analyzer. J. Agric. Food Chem. 20:1292–1294. doi:10.1021/jf60184a027
Kline, S.R. 2006. Reduction and analysis of SANS and USANS data using Igor Pro. J. Appl. Cryst. 39:895–900. doi:10.1107/S0021889806035059
Merino, E., D. Nahon, and Y. Wang. 1993. Kinetics and mass transfer of pseudomorphic replacement: Application to replacement of parent minerals and kaolinite by Al, Fe, and Mn oxides during weathering. Am. J. Sci. 293:135–155. doi:10.2475/ajs.293.2.135
Meunier, A., P. Sardini, J.C. Robinet, and D. Pret. 2007. The petrography of weathering processes: Facts and outlooks. Clay Miner. 42:415–435. doi:10.1180/claymin.2007.042.4.01
Mildner, D.F.R., and P.L. Hall. 1986. Small-angle scattering from porous solids with fractal geometry. J. Phys. D: Appl. Phys. 19:1535–1545. doi:10.1088/0022-3727/19/8/021
Nahon, D. 1991. Introduction to the petrology of soils and chemical weathering. John Wiley & Sons, New York.
Navarre-Sitchler, A.K., D.R. Cole, G. Rother, L.X. Jin, H.L. Buss, and S.L. Brantley. 2013. Porosity and surface area evolution during weathering of two igneous rocks. Geochim. Cosmochim. Acta 109:400–413. doi:10.1016/j.gca.2013.02.012
Pavich, M.J. 1986. Processes and rates of saprolite production and erosion on a foliated granitic rock of the Virginia Piedmont. In: S.M. Colman and D.P. Dethier, editors, Rates of chemical weathering of rocks and minerals. Academic Press, Orlando, FL. p. 551–590.
Pavich, M.J., L. Brown, J.N. Valette-Silver, J. Klein, and R. Middleton. 1985. 10Be
analysis of a quaternary weathering profile in the Virginia Piedmont. Geology 13:39–41. doi:10.1130/0091-7613(1985)13<39:BAOAQW>2.0.CO;2
Pavich, M., G.W. Leo, S.F. Obermeier, and J.R. Estabrook. 1989. Investigations of the characteristics, origin, and residence time of the upland residual mantle of the Piedmont of Fairfax County, Virginia. Vol. 1352. U.S. Geological Survey, Orlando, FL. p. 1–58.
Peth, S. 2010. Applications of microtomography in soils and sediments. In: S. Singh and M. Grafe, editors, Synchrotron-based techniques in soils and sediments. Vol. 34. Elsevier, Heidelberg. p. 73–101.
Price, J.R., N. Heitmann, J. Hull, and D. Szymanski. 2008. Long-term average mineral weathering rates from watershed geochemical mass balance methods: Using mineral modal abundances to solve more equations in more unknowns. Chem. Geol. 254:36–51. doi:10.1016/j.chemgeo.2008.05.012
Putnis, A. 2002. Mineral replacement reactions: From macroscopic observations to microscopic mechanisms. Mineral. Mag. 66:689–708. doi:10.1180/0026461026650056
Radlinski, A.P. 2006. Small-angle neutron scattering and the microstructure of rocks. In: H.-R. Wenk, editor, Neutron scattering in the earth sciences. Vol. 31. Mineralogical Society of America, Chantilly, VA. p. 363–397.
Radlinski, A.P., E.Z. Radlinska, M. Agamalian, G.D. Wignall, P. Lindner, and O.G. Randl. 1999. Fractal geometry of rocks. Phys. Rev. Lett. 82:3078–3081. doi:10.1103/PhysRevLett.82.3078
Robert, R., P. Sardini, Sammartino, C. Dubois, L. Guillot, M. Rossy, P. Gaviglio, and M. Siitari-Kauppi. 2003. Porosity changes in a granite close to quarry faces: Identification from C-14-PMMA autoradiographs and mineralogical cartographies. Eur. Phys. J. Appl. Phys. 21:127–136. doi:10.1051/epjap:2002108
Rodgers, W.B., and R.E. Rodgers. 1848. On the decomposition and partial solution of minerals and rocks by pure water and water charged with carbonic acid. Vol. 5. American Journal of Science, New Haven, CT.
Rossi, A.M., and R.C. Graham. 2010. Weathering and Porosity formation in subsoil granitic clasts, Bishop Creek Moraines, California. Soil Sci. Soc. Am. J. 74:172–185. doi:10.2136/sssaj2009.0146
Sardini, P., M. Siitari-Kauppi, D. Beaufort, and K.H. Hellmuth. 2006. On the connected porosity of mineral aggregates in crystalline rocks. Am. Mineral. 91:1069–1080. doi:10.2138/am.2006.1939
Sausse, J., E. Jacquot, B. Fritz, J. Leroy, and M. Lespinasse. 2001. Evolution of crack permeability during fluid-rock interaction. Example of the Brezouard granite (Vosges, France). Tectonophysics 336:199–214. doi:10.1016/S0040-1951(01)00102-0
Schaetzl, R.J., and S. Anderson. 2005. Soils: Genesis and geomorphology. Cambridge University Press, New York.
Seiders, V.M., R.B. Mixon, T.W. Stern, M.F. Newell, and C.B. Thomas. 1975. Age of plutonism and tectonism and a new minimum age limit on the Glenarm series in the Northeast Piedmont near Occoquan. Am. J. Sci. 275:481–511. doi:10.2475/ajs.275.5.481
Sowers, G.F. 1963. Engineering properties of residual soils derived from igneous and metamorphic rocks. Proceedings of the Second Panamerican Conference on Soil Mechanics. Brazilian Association of Soil Mechanics and Geotechnical Engineering, Sao Paulo, Brazil. p. 39–62.
Velbel, M.A. 1989. Weathering of hornblende to ferruginous products by a dissolution-reprecipitation mechanism: Petrography and stoichiometry. Clays Clay Miner. 37:515–524. doi:10.1346/CCMN.1989.0370603
Velde, B., and A. Meunier. 2008. The origin of clay minerals in soils and weathered rocks. Springer-Verlag, Berlin.
Wenk, H.R. 2012. Application of neutron scattering in earth sciences. J. Minerals 64:127–137. doi:10.1007/s11837-011-0223-y
White, A.F., T.D. Bullen, D.V. Vivit, M.S. Schulz, and D.W. Clow. 1999. The role of disseminated calcite in the chemical weathering of granitoid rocks. Geochim. Cosmochim. Acta 63:1939–1953. doi:10.1016/S0016-7037(99)00082-4