soil characteristics and landforms elationship in …
TRANSCRIPT
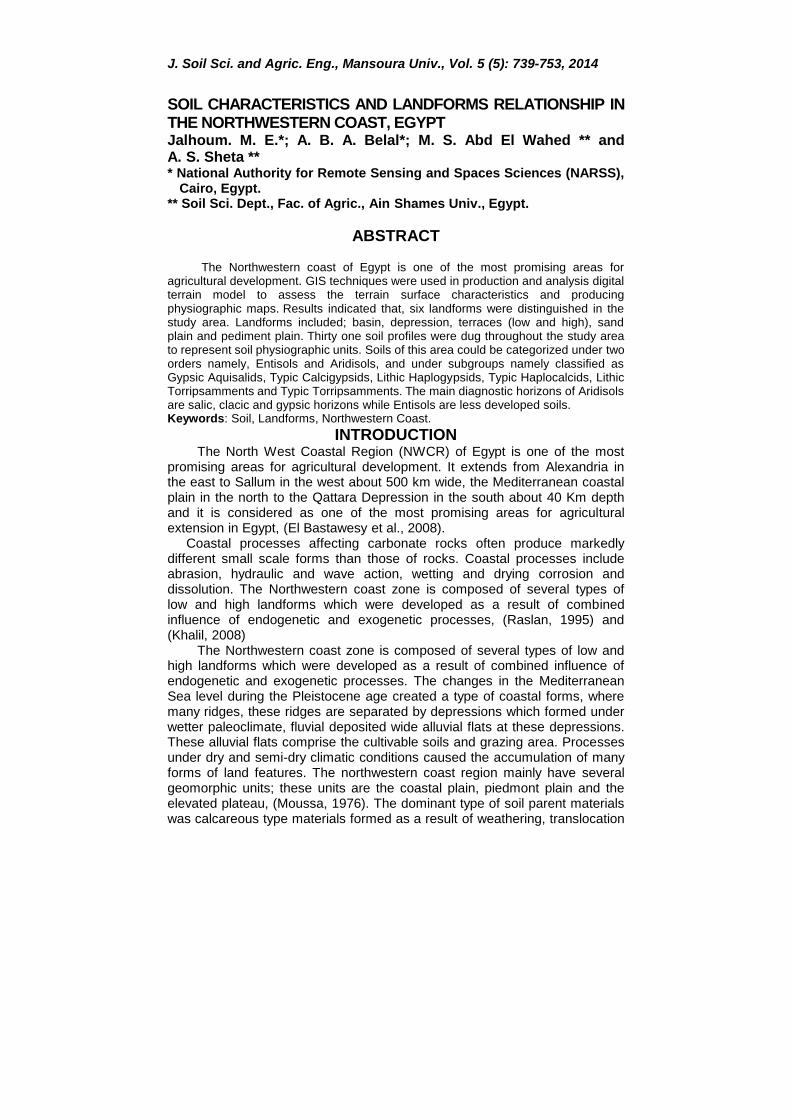
J. Soil Sci. and Agric. Eng., Mansoura Univ., Vol. 5 (5): 739-753, 2014
SOIL CHARACTERISTICS AND LANDFORMS RELATIONSHIP IN THE NORTHWESTERN COAST, EGYPT Jalhoum. M. E.*; A. B. A. Belal*; M. S. Abd El Wahed ** and A. S. Sheta ** * National Authority for Remote Sensing and Spaces Sciences (NARSS),
Cairo, Egypt. ** Soil Sci. Dept., Fac. of Agric., Ain Shames Univ., Egypt.
ABSTRACT
The Northwestern coast of Egypt is one of the most promising areas for
agricultural development. GIS techniques were used in production and analysis digital terrain model to assess the terrain surface characteristics and producing physiographic maps. Results indicated that, six landforms were distinguished in the study area. Landforms included; basin, depression, terraces (low and high), sand plain and pediment plain. Thirty one soil profiles were dug throughout the study area to represent soil physiographic units. Soils of this area could be categorized under two orders namely, Entisols and Aridisols, and under subgroups namely classified as Gypsic Aquisalids, Typic Calcigypsids, Lithic Haplogypsids, Typic Haplocalcids, Lithic Torripsamments and Typic Torripsamments. The main diagnostic horizons of Aridisols are salic, clacic and gypsic horizons while Entisols are less developed soils. Keywords: Soil, Landforms, Northwestern Coast.
INTRODUCTION
The North West Coastal Region (NWCR) of Egypt is one of the most promising areas for agricultural development. It extends from Alexandria in the east to Sallum in the west about 500 km wide, the Mediterranean coastal plain in the north to the Qattara Depression in the south about 40 Km depth and it is considered as one of the most promising areas for agricultural extension in Egypt, (El Bastawesy et al., 2008).
Coastal processes affecting carbonate rocks often produce markedly different small scale forms than those of rocks. Coastal processes include abrasion, hydraulic and wave action, wetting and drying corrosion and dissolution. The Northwestern coast zone is composed of several types of low and high landforms which were developed as a result of combined influence of endogenetic and exogenetic processes, (Raslan, 1995) and (Khalil, 2008)
The Northwestern coast zone is composed of several types of low and high landforms which were developed as a result of combined influence of endogenetic and exogenetic processes. The changes in the Mediterranean Sea level during the Pleistocene age created a type of coastal forms, where many ridges, these ridges are separated by depressions which formed under wetter paleoclimate, fluvial deposited wide alluvial flats at these depressions. These alluvial flats comprise the cultivable soils and grazing area. Processes under dry and semi-dry climatic conditions caused the accumulation of many forms of land features. The northwestern coast region mainly have several geomorphic units; these units are the coastal plain, piedmont plain and the elevated plateau, (Moussa, 1976). The dominant type of soil parent materials was calcareous type materials formed as a result of weathering, translocation
Jalhoum. M. E. et al.
740
and deposition processes under the arid climatic conditions. The position of profiles in the landform have direct bearing on the type of horizon as it controls the evaporation or percolation of the received rain water. In general Hammad and Abdel Salam (1968) reported that the postion of soil profile in the landform affected the formation, postion, thickness and type of Calcic horizon. Emadi et al (2008) stated that calcium carbonate content and landscape physiography indicated that the lower physiography conditions, less to deeper the calcium carbonate accumulation in soils.
The main objective of this study is to examine the relationship and effects of landforms on the physical, chemical and morphological characteristics of soils in the Northwestern coast of Egypt as well as the environmental variables including physiographic features.
MATERIALS AND METHODS Study Area Description:
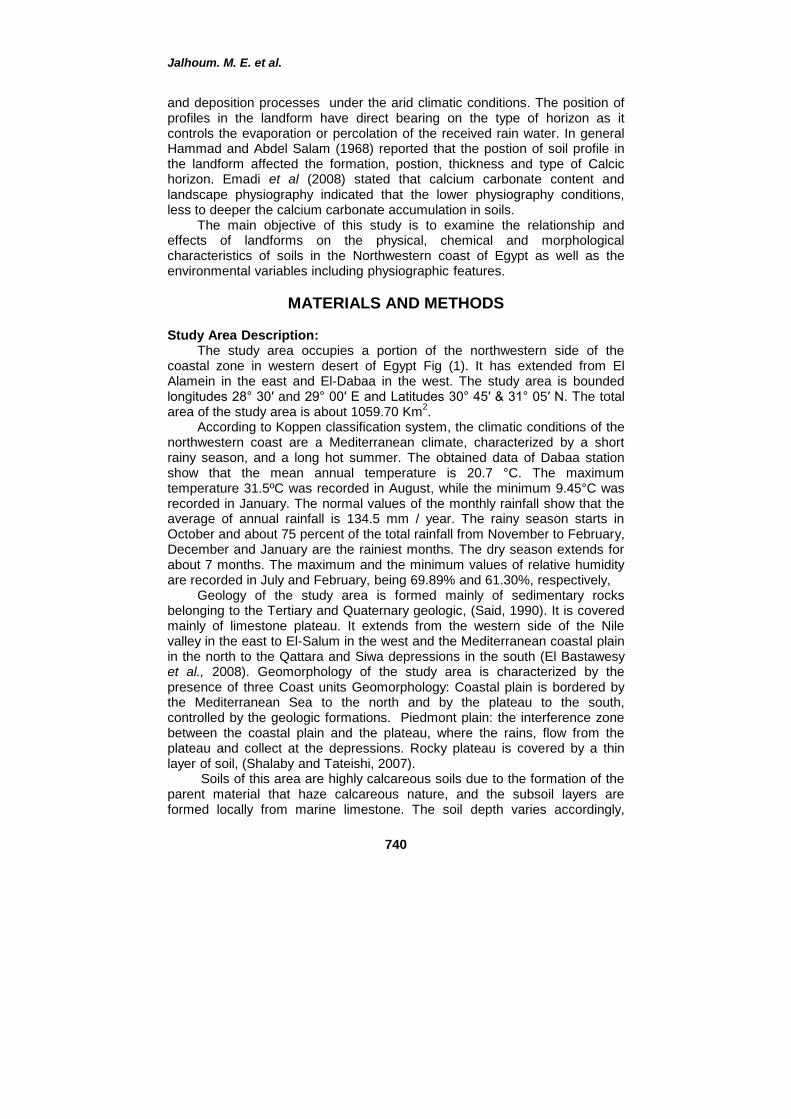
The study area occupies a portion of the northwestern side of the coastal zone in western desert of Egypt Fig (1). It has extended from El Alamein in the east and El-Dabaa in the west. The study area is bounded longitudes 28° 30′ and 29° 00′ E and Latitudes 30° 45′ & 31° 05′ N. The total area of the study area is about 1059.70 Km
2.
According to Koppen classification system, the climatic conditions of the northwestern coast are a Mediterranean climate, characterized by a short rainy season, and a long hot summer. The obtained data of Dabaa station show that the mean annual temperature is 20.7 °C. The maximum temperature 31.5ºC was recorded in August, while the minimum 9.45°C was recorded in January. The normal values of the monthly rainfall show that the average of annual rainfall is 134.5 mm / year. The rainy season starts in October and about 75 percent of the total rainfall from November to February, December and January are the rainiest months. The dry season extends for about 7 months. The maximum and the minimum values of relative humidity are recorded in July and February, being 69.89% and 61.30%, respectively,
Geology of the study area is formed mainly of sedimentary rocks belonging to the Tertiary and Quaternary geologic, (Said, 1990). It is covered mainly of limestone plateau. It extends from the western side of the Nile valley in the east to El-Salum in the west and the Mediterranean coastal plain in the north to the Qattara and Siwa depressions in the south (El Bastawesy et al., 2008). Geomorphology of the study area is characterized by the presence of three Coast units Geomorphology: Coastal plain is bordered by the Mediterranean Sea to the north and by the plateau to the south, controlled by the geologic formations. Piedmont plain: the interference zone between the coastal plain and the plateau, where the rains, flow from the plateau and collect at the depressions. Rocky plateau is covered by a thin layer of soil, (Shalaby and Tateishi, 2007).
Soils of this area are highly calcareous soils due to the formation of the parent material that haze calcareous nature, and the subsoil layers are formed locally from marine limestone. The soil depth varies accordingly,
J. Soil Sci. and Agric. Eng., Mansoura Univ., Vol. 5 (5), May, 2014
741
being shallow in the sloping plateau and deep in the coastal plain the soil of the study area contains two Order of soil classification; the Entisols, which includes Psamments suborders, and the Aridisols, which include Salids and Calids suborders (Sayed, 2013).
Fig. (1): Location map of the study area
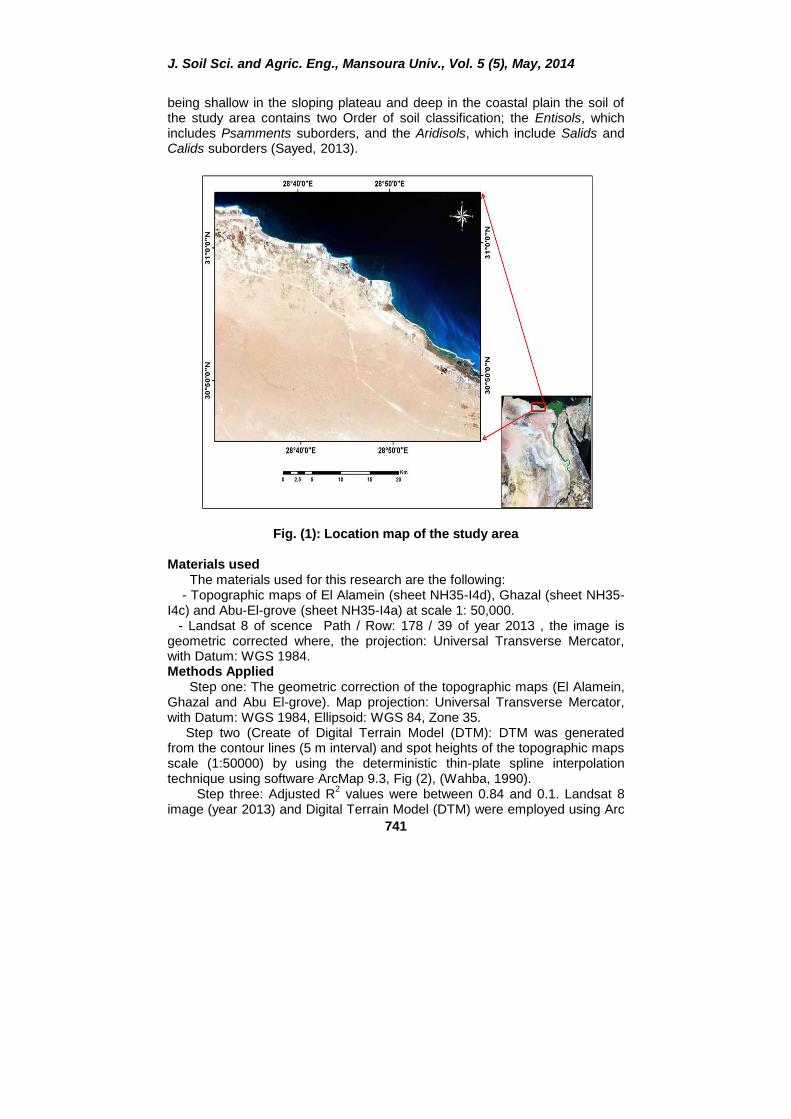
Materials used The materials used for this research are the following: - Topographic maps of El Alamein (sheet NH35-I4d), Ghazal (sheet NH35-I4c) and Abu-El-grove (sheet NH35-I4a) at scale 1: 50,000. - Landsat 8 of scence Path / Row: 178 / 39 of year 2013 , the image is geometric corrected where, the projection: Universal Transverse Mercator, with Datum: WGS 1984. Methods Applied Step one: The geometric correction of the topographic maps (El Alamein, Ghazal and Abu El-grove). Map projection: Universal Transverse Mercator, with Datum: WGS 1984, Ellipsoid: WGS 84, Zone 35. Step two (Create of Digital Terrain Model (DTM): DTM was generated from the contour lines (5 m interval) and spot heights of the topographic maps scale (1:50000) by using the deterministic thin-plate spline interpolation technique using software ArcMap 9.3, Fig (2), (Wahba, 1990). Step three: Adjusted R
2 values were between 0.84 and 0.1. Landsat 8
image (year 2013) and Digital Terrain Model (DTM) were employed using Arc
Jalhoum. M. E. et al.
742
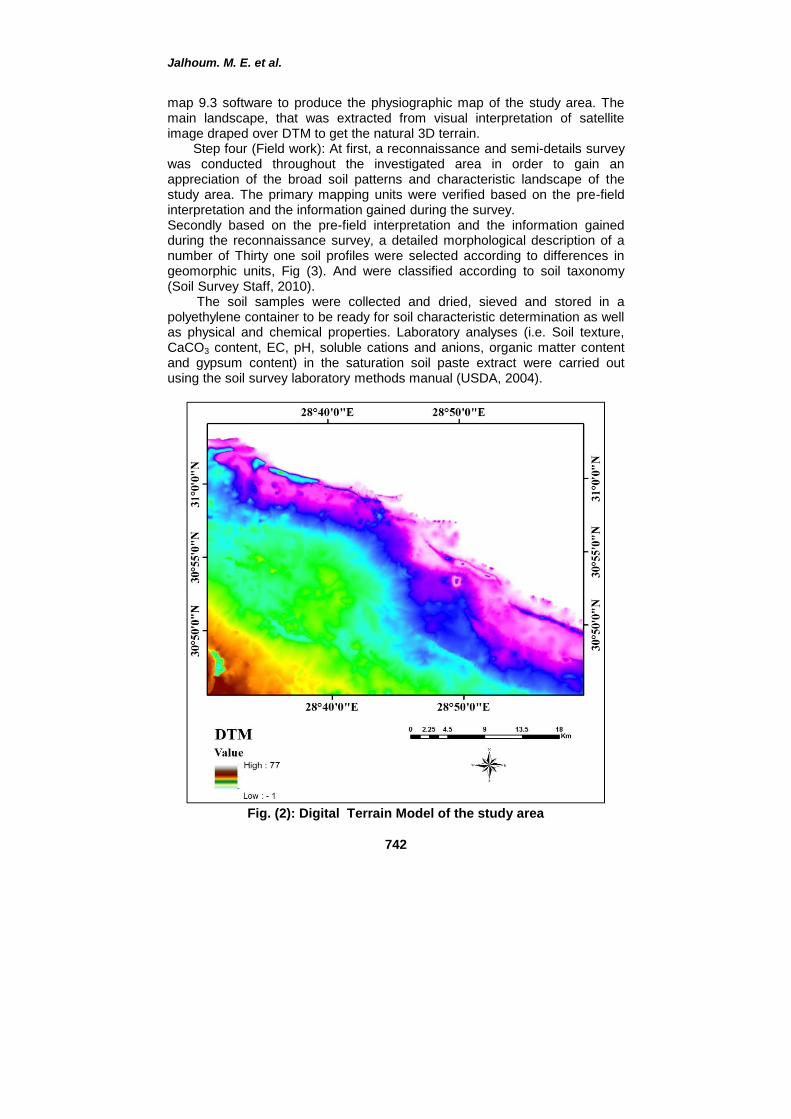
map 9.3 software to produce the physiographic map of the study area. The main landscape, that was extracted from visual interpretation of satellite image draped over DTM to get the natural 3D terrain. Step four (Field work): At first, a reconnaissance and semi-details survey was conducted throughout the investigated area in order to gain an appreciation of the broad soil patterns and characteristic landscape of the study area. The primary mapping units were verified based on the pre-field interpretation and the information gained during the survey. Secondly based on the pre-field interpretation and the information gained during the reconnaissance survey, a detailed morphological description of a number of Thirty one soil profiles were selected according to differences in geomorphic units, Fig (3). And were classified according to soil taxonomy (Soil Survey Staff, 2010). The soil samples were collected and dried, sieved and stored in a polyethylene container to be ready for soil characteristic determination as well as physical and chemical properties. Laboratory analyses (i.e. Soil texture, CaCO3 content, EC, pH, soluble cations and anions, organic matter content and gypsum content) in the saturation soil paste extract were carried out using the soil survey laboratory methods manual (USDA, 2004).
Fig. (2): Digital Terrain Model of the study area
J. Soil Sci. and Agric. Eng., Mansoura Univ., Vol. 5 (5), May, 2014
743
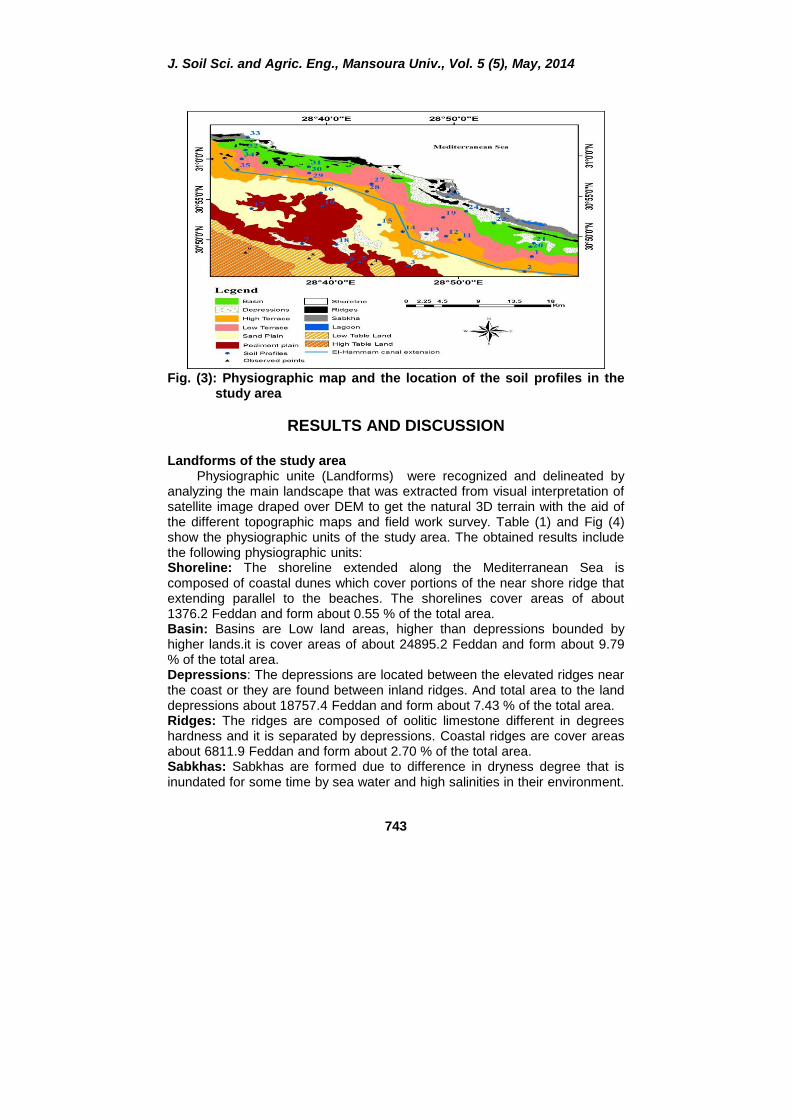
Fig. (3): Physiographic map and the location of the soil profiles in the
study area
RESULTS AND DISCUSSION
Landforms of the study area Physiographic unite (Landforms) were recognized and delineated by analyzing the main landscape that was extracted from visual interpretation of satellite image draped over DEM to get the natural 3D terrain with the aid of the different topographic maps and field work survey. Table (1) and Fig (4) show the physiographic units of the study area. The obtained results include the following physiographic units: Shoreline: The shoreline extended along the Mediterranean Sea is composed of coastal dunes which cover portions of the near shore ridge that extending parallel to the beaches. The shorelines cover areas of about 1376.2 Feddan and form about 0.55 % of the total area. Basin: Basins are Low land areas, higher than depressions bounded by higher lands.it is cover areas of about 24895.2 Feddan and form about 9.79 % of the total area. Depressions: The depressions are located between the elevated ridges near the coast or they are found between inland ridges. And total area to the land depressions about 18757.4 Feddan and form about 7.43 % of the total area. Ridges: The ridges are composed of oolitic limestone different in degrees hardness and it is separated by depressions. Coastal ridges are cover areas about 6811.9 Feddan and form about 2.70 % of the total area. Sabkhas: Sabkhas are formed due to difference in dryness degree that is inundated for some time by sea water and high salinities in their environment.
Jalhoum. M. E. et al.
744
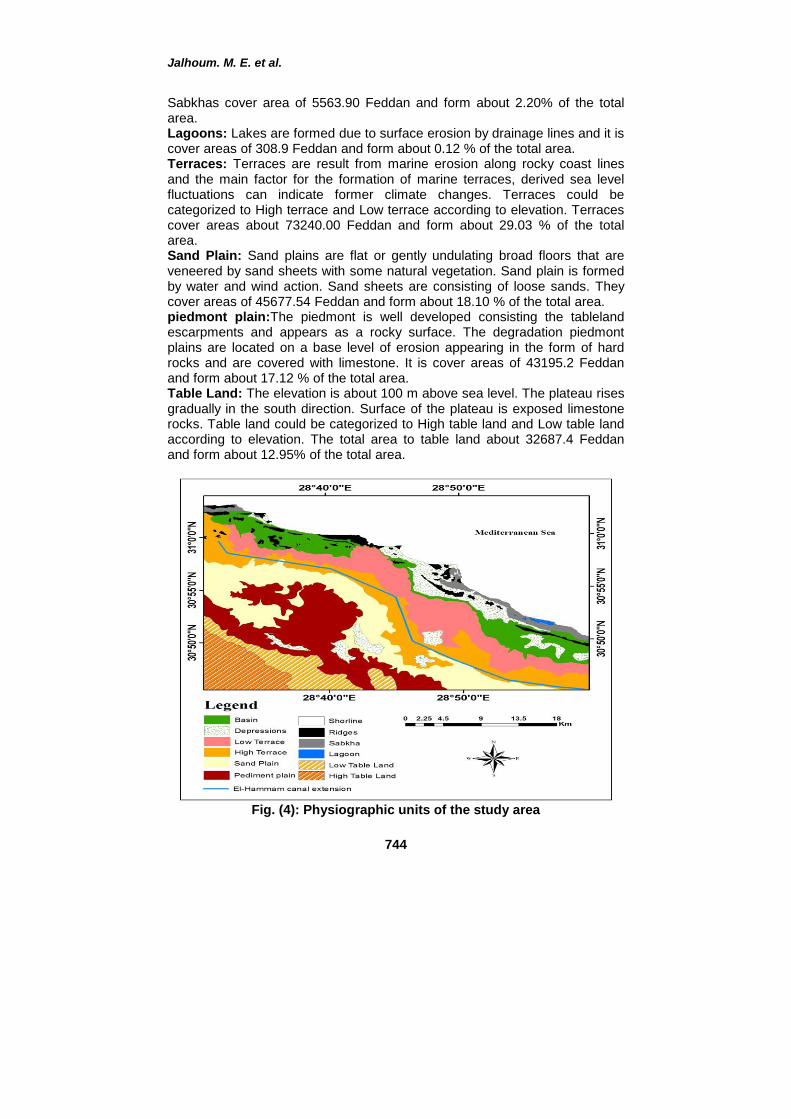
Sabkhas cover area of 5563.90 Feddan and form about 2.20% of the total area. Lagoons: Lakes are formed due to surface erosion by drainage lines and it is cover areas of 308.9 Feddan and form about 0.12 % of the total area. Terraces: Terraces are result from marine erosion along rocky coast lines and the main factor for the formation of marine terraces, derived sea level fluctuations can indicate former climate changes. Terraces could be categorized to High terrace and Low terrace according to elevation. Terraces cover areas about 73240.00 Feddan and form about 29.03 % of the total area. Sand Plain: Sand plains are flat or gently undulating broad floors that are veneered by sand sheets with some natural vegetation. Sand plain is formed by water and wind action. Sand sheets are consisting of loose sands. They cover areas of 45677.54 Feddan and form about 18.10 % of the total area. piedmont plain:The piedmont is well developed consisting the tableland escarpments and appears as a rocky surface. The degradation piedmont plains are located on a base level of erosion appearing in the form of hard rocks and are covered with limestone. It is cover areas of 43195.2 Feddan and form about 17.12 % of the total area. Table Land: The elevation is about 100 m above sea level. The plateau rises gradually in the south direction. Surface of the plateau is exposed limestone rocks. Table land could be categorized to High table land and Low table land according to elevation. The total area to table land about 32687.4 Feddan and form about 12.95% of the total area.
Fig. (4): Physiographic units of the study area
J. Soil Sci. and Agric. Eng., Mansoura Univ., Vol. 5 (5), May, 2014
745
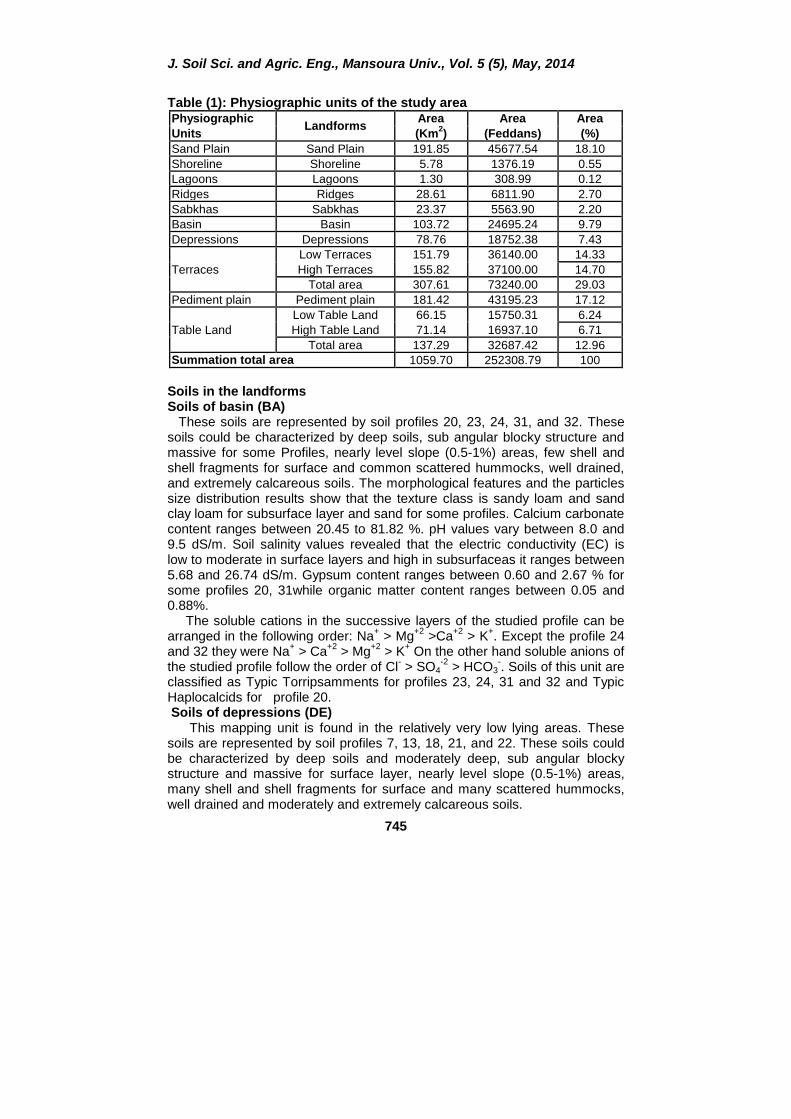
Table (1): Physiographic units of the study area Physiographic
Landforms Area Area Area
Units (Km2) (Feddans) (%)
Sand Plain Sand Plain 191.85 45677.54 18.10
Shoreline Shoreline 5.78 1376.19 0.55
Lagoons Lagoons 1.30 308.99 0.12
Ridges Ridges 28.61 6811.90 2.70
Sabkhas Sabkhas 23.37 5563.90 2.20
Basin Basin 103.72 24695.24 9.79
Depressions Depressions 78.76 18752.38 7.43
Terraces
Low Terraces 151.79 36140.00 14.33
High Terraces 155.82 37100.00 14.70
Total area 307.61 73240.00 29.03
Pediment plain Pediment plain 181.42 43195.23 17.12
Table Land
Low Table Land 66.15 15750.31 6.24
High Table Land 71.14 16937.10 6.71
Total area 137.29 32687.42 12.96
Summation total area 1059.70 252308.79 100
Soils in the landforms Soils of basin (BA) These soils are represented by soil profiles 20, 23, 24, 31, and 32. These soils could be characterized by deep soils, sub angular blocky structure and massive for some Profiles, nearly level slope (0.5-1%) areas, few shell and shell fragments for surface and common scattered hummocks, well drained, and extremely calcareous soils. The morphological features and the particles size distribution results show that the texture class is sandy loam and sand clay loam for subsurface layer and sand for some profiles. Calcium carbonate content ranges between 20.45 to 81.82 %. pH values vary between 8.0 and 9.5 dS/m. Soil salinity values revealed that the electric conductivity (EC) is low to moderate in surface layers and high in subsurfaceas it ranges between 5.68 and 26.74 dS/m. Gypsum content ranges between 0.60 and 2.67 % for some profiles 20, 31while organic matter content ranges between 0.05 and 0.88%. The soluble cations in the successive layers of the studied profile can be arranged in the following order: Na
+ > Mg
+2 >Ca
+2 > K
+. Except the profile 24
and 32 they were Na+ > Ca
+2 > Mg
+2 > K
+ On the other hand soluble anions of
the studied profile follow the order of Cl- > SO4
-2 > HCO3
-. Soils of this unit are
classified as Typic Torripsamments for profiles 23, 24, 31 and 32 and Typic Haplocalcids for profile 20. Soils of depressions (DE) This mapping unit is found in the relatively very low lying areas. These soils are represented by soil profiles 7, 13, 18, 21, and 22. These soils could be characterized by deep soils and moderately deep, sub angular blocky structure and massive for surface layer, nearly level slope (0.5-1%) areas, many shell and shell fragments for surface and many scattered hummocks, well drained and moderately and extremely calcareous soils.
Jalhoum. M. E. et al.
746
The morphological features and the particles size distribution results show that the texture class is sandy loam and sand for some surface layer. Calcium carbonate content ranges between 22.16 to 63.07 %. pH values vary between 8.12 and 9.5. Soil salinity values revealed that, the electric conductivity (EC) is low to moderate in surface layers and high in some subsurfaceas it ranges between 0.58 and 13.33 dS/mwhile organicmatter content ranges between 0.10 and 0.77%. The soluble cations in the successive layers of the studied profile can be arranged in the following order: Na
+ > Ca
+2 > Mg
+2 > K
+. On the other hand
soluble anions of the studied profile follow the order of Cl- > SO4
-2 > HCO3
-.
Soils of this unit are classified as Typic Haplocalcids for profiles 7, 13 and 18 and Typic Torripsamments for profiles 21 and 22. Soils of sabkhas (SK) These soils are represented by soil profiles 26 and 33. These soils could be characterized by moderately deep soils (50-80 cm), sub angular blocky structure and very friable for surface layer for the profile 33, level slope (0.2-0.5 %) areas, no evidence of coarse surface fragments, no evidence of rock fragments, having sometimes thin salt crust on surface, moderately deep water table, and slightly too moderately calcareous soils. The morphological features and the particles size distribution results show that the texture class is sandy loam and sandy clay loam. Calcium carbonate content ranges between 10.2 to 16.2 % up to 39.5 in the layers of the profile 33. pH values vary between 8.15 and 8.78. Soil salinity values revealed that, the electric conductivity (EC) is very high as it ranges between 30.2 and 178 dS/m and content on subsurfacelayer from salt crystals in the profile 26. Gypsum content high ranges between 8.69 and 15.91%while organicmatter content ranges between 0.02 and 1.2%. The soluble cations in the successive layers of the studied profiles can be arranged in the following order: Na
+ > Ca
+2 > Mg
+2 > K
+ in all layers. On the
other hand soluble anions of the studied profiles follow the order of Cl- > SO4
-
2 > HCO3
- in all layersand soils of this unit are classified as Gypsic Aquisalids.
Soils of terraces (TE) The soils of this unit are formed by marine erosion along rocky coast lines. This unit is subdivided into two sub-units i.e. high terrace, low terrace according to elevation. Soils of low terrace (LTE) These soils are represented by soil profiles 1, 12, 19, 27, 30 and 34. These soils could be characterized by deep soils and moderately deep. Except the profiles 12 and 19 they were shallow due to they content layer rock at a distance of 30 cm, sub angular blocky structure and massive for surface layer, nearly level slope (0.5-1%) areas, many shell and shell fragments for surface and few coarse gravel, poorly drained and extremely calcareous soils. The morphological features and the particles size distribution results show that, the texture class is sand and sandy loam for subsurfacelayer for profiles 12, 19 and 27. While texture class is sandy loam for profiles 30 and 34 and loam for subsurfacelayer for profile 1. Calcium carbonate content ranges between 33 to 75 % up to 95% for subsurfacelayer for profile 27. pH values
J. Soil Sci. and Agric. Eng., Mansoura Univ., Vol. 5 (5), May, 2014
747
vary between 8.10 and 9.64. Soil salinity values revealed that, the electric conductivity (EC) is low to moderate in surface layers and high in some subsurface as it ranges between 0.95 and 8.29 dS/m up to 19.2 dS/m for subsurfacelayer for profile 1. Gypsum content ranges between 1.29 and 7.05 % while organic matter content ranges between 0.03 and 0.95%. The soluble cations in the successive layers of the studied profile can be arranged in the following order: Na
+ > Ca
+2 > Mg
+2 > K
+. On the other hand
soluble anions of the studied profile follow the order of Cl- > SO4
-2 > HCO3
-.
Soils of this unit are classified as Typic Calcigypsids for profiles 1, Lithic Haplogypsids for profile 12, Lithic Torripsamments for profile 19, Typic Haplocalcids for profile 27 and Typic Torripsamments for profiles 30 and 34. Soils of high terrace (LTE) These soils are represented by soil profiles 2, 11, 14, 28, 29 and 35. These soils could be characterized by shallow and moderately deep due to it is content layer rock at a distance between 30 to 60 cm. Except the profile 29, 35 they were deep soil, sub angular blocky structure and massive for surface layer, nearly level slope (0.5-1%) areas, few shell and shell fragments for surface and few medium gravel, poorly drained and well drained the profile 29 and 35, extremely calcareous soils. The morphological features and the particles size distribution results show that the texture class is sandy loam and sand for some surface layer for profiles 11, 29 and 35. Calcium carbonate content ranges between 30.7 to 68.2 %. pH values vary between 8.10 and 9.10. Soil salinity values revealed that, the electric conductivity (EC) is low to moderate in surface layers and high in some subsurfaceas it ranges between 0.63 and 6.55 dS/m. except the profile 35 they were between 7.60 to 24.2dS/mwhile organicmatter content ranges between 0.07 and 0.66%. The soluble cations in the successive layers of the studied profile can be arranged in the following order: Na
+ > Ca
+2 > Mg
+2 > K
+. On the other hand
soluble anions of the studied profile follow the order of Cl- > SO4
-2 > HCO3
-.
Soils of this unit are classified as Lithic Torripsamments for profiles 2, 11 and 14, Lithic Haplogypsids for profile 28, Typic Haplocalcids for profile 29 and Typic Torripsamments for profile 35. Soils of sand plain (SP) These soils are represented by soil profiles 15, 16 and 17. These soils could be characterized by deep soils, sub angular blocky structure and single grain for surface layer, level and very gently slope (0.5-2%) areas, many shell and shell fragments for surface and common scattered hummocks, well drained and extremely calcareous soils. The morphological features and the particles size distribution results show that, the texture class is sandy loam and sand for surface layer. Except the profile 16 are Loamy and sandy clay loam in surface layer due to the impact of agricultural service. Calcium carbonate content ranges between 30.7 to 57 % up to 75.2 to 85.23% for the profile 17. pH values vary between 8.2 and 9.3. The electric conductivity (EC) is low to moderate in surface layers and high in some subsurfaceas it ranges between 0.55 and 8.10 dS/mwhile organicmatter content ranges between 0.10 and 0.80%.
Jalhoum. M. E. et al.
748
The soluble cations in the successive layers of the studied profile can be arranged in the following order: Na
+ > Ca
+2 > Mg
+2 > K
+. On the other hand
soluble anions of the studied profile follow the order of Cl- > SO4
-2 > HCO3
-.
Soils of this unit are classified as Typic Torripsamments for profiles 15 and 16 and Typic Haplocalcids for profile 17. Soils of piedmont plain (PE) These soils are represented by soil profiles 3, 5, 6 and 10. These soils could be characterized by very shallow and moderately deep for the profile 5, sub angular blocky structure and single grain for surface layer, nearly level and very gently slope (0.5-2%) areas, many coarse gravel and common scattered hummocks, very poorly drained and extremely calcareous soils. The morphological features and the particles size distribution results show that the texture class is sandy loam and sand for surface layer. Calcium carbonate content ranges between 25.5 to 54.56 % and pH values vary between 8.1 and 8.62. Soil salinity values revealed that, the electric conductivity (EC) is low to moderate in surface layers but high in some subsurfaceas it ranges between 0.84 and 14.4 dS/m up to 32.34 ds/m for the profile 10while organicmatter content ranges between 0.10 and 0.22%. The soluble cations in the successive layers of the studied profile can be arranged in the following order: Na
+ > Mg
+2 > Ca
+2 > K
+ while the soluble
anions of the studied profile follow the order of Cl- > SO4
-2 > HCO3
- and soils
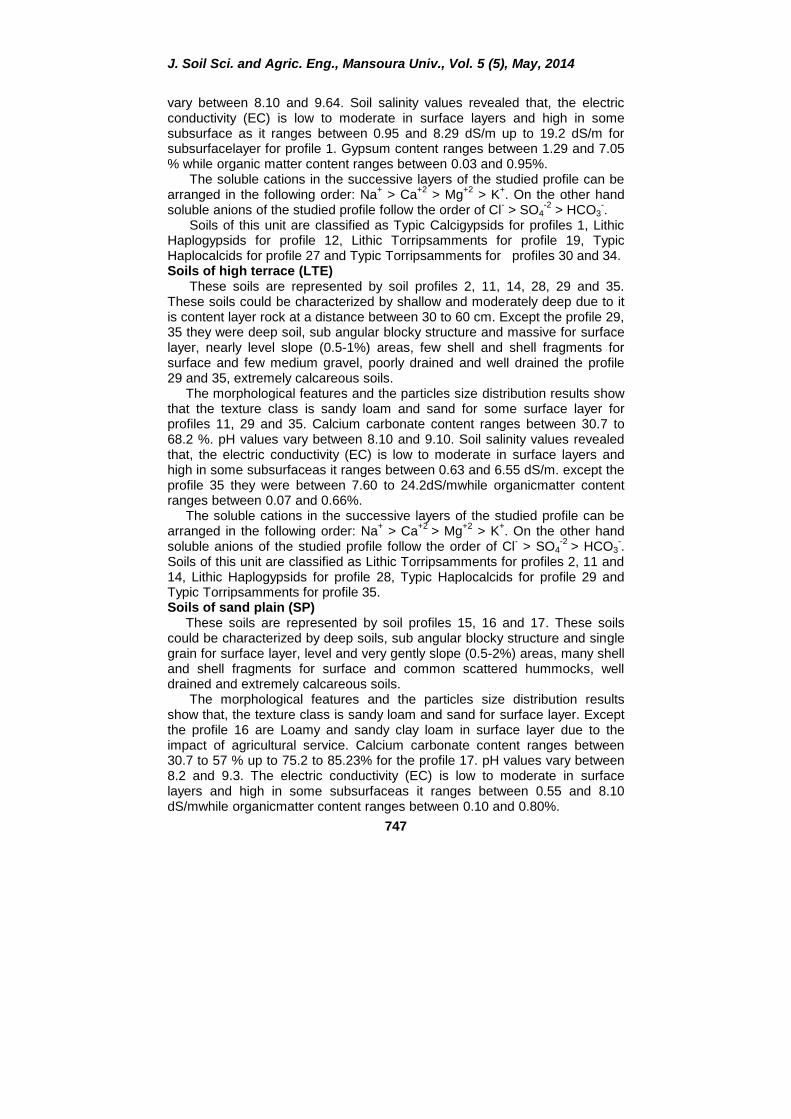
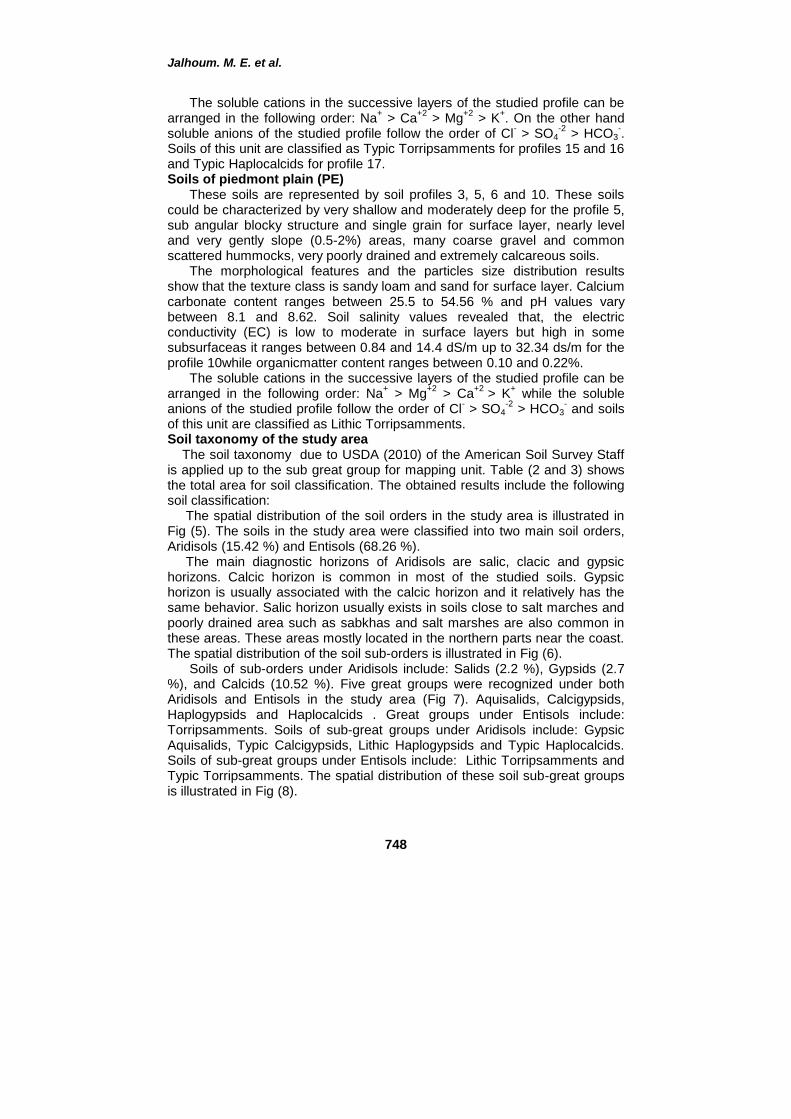
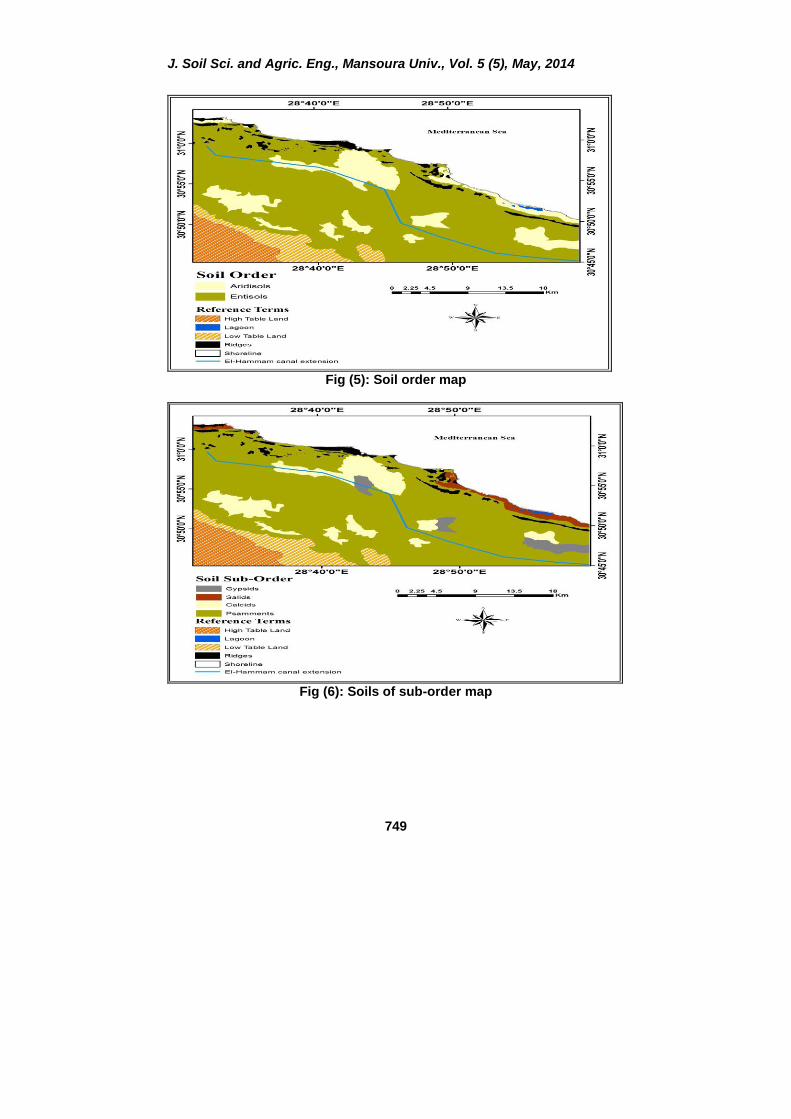
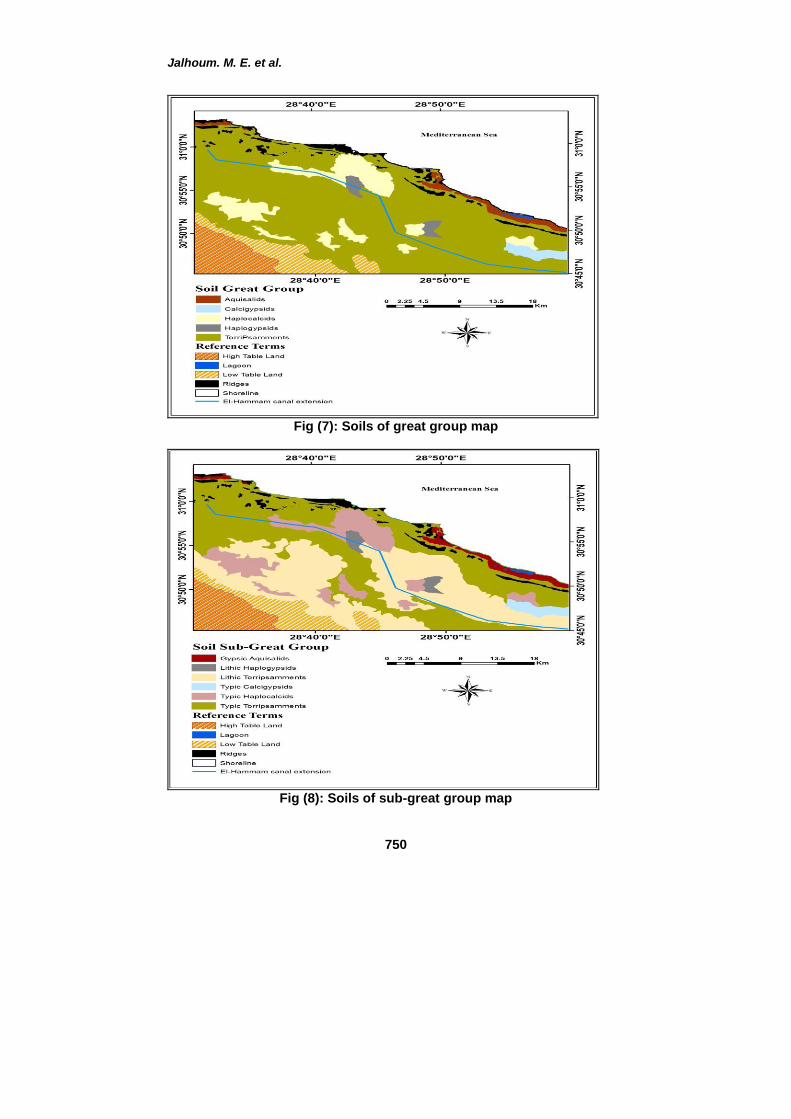
of this unit are classified as Lithic Torripsamments. Soil taxonomy of the study area The soil taxonomy due to USDA (2010) of the American Soil Survey Staff is applied up to the sub great group for mapping unit. Table (2 and 3) shows the total area for soil classification. The obtained results include the following soil classification: The spatial distribution of the soil orders in the study area is illustrated in Fig (5). The soils in the study area were classified into two main soil orders, Aridisols (15.42 %) and Entisols (68.26 %). The main diagnostic horizons of Aridisols are salic, clacic and gypsic horizons. Calcic horizon is common in most of the studied soils. Gypsic horizon is usually associated with the calcic horizon and it relatively has the same behavior. Salic horizon usually exists in soils close to salt marches and poorly drained area such as sabkhas and salt marshes are also common in these areas. These areas mostly located in the northern parts near the coast. The spatial distribution of the soil sub-orders is illustrated in Fig (6). Soils of sub-orders under Aridisols include: Salids (2.2 %), Gypsids (2.7 %), and Calcids (10.52 %). Five great groups were recognized under both Aridisols and Entisols in the study area (Fig 7). Aquisalids, Calcigypsids, Haplogypsids and Haplocalcids . Great groups under Entisols include: Torripsamments. Soils of sub-great groups under Aridisols include: Gypsic Aquisalids, Typic Calcigypsids, Lithic Haplogypsids and Typic Haplocalcids. Soils of sub-great groups under Entisols include: Lithic Torripsamments and Typic Torripsamments. The spatial distribution of these soil sub-great groups is illustrated in Fig (8).
J. Soil Sci. and Agric. Eng., Mansoura Univ., Vol. 5 (5), May, 2014
749
Fig (5): Soil order map
Fig (6): Soils of sub-order map
Jalhoum. M. E. et al.
750
Fig (7): Soils of great group map
Fig (8): Soils of sub-great group map

J. Soil Sci. and Agric. Eng., Mansoura Univ., Vol. 5 (5), May, 2014
751
Table (2): Soil classification for the study area Landforms Ordar Sub_ordar Great_group Sub-great group Profile(s)
Basin Aridisols Calcids Haplocalcids Typic Haplocalcids 20
Entisols Psamments TorriPsamments Typic Torripsamments 23, 24, 31, 32
Depressions Aridisols Calcids Haplocalcids Typic Haplocalcids 7, 13, 18
Entisols Psamments TorriPsamments Typic Torripsamments 21, 22
High Terrace
Aridisols Gypsids
Haplogypsids Lithic Haplogypsids 28
Calcids Typic Haplocalcids 29
Entisols Psamments TorriPsamments Lithic Torripsamments 2, 11, 14
Typic Torripsamments 35
Low Terrace
Aridisols Gypsids
Haplogypsids Lithic Haplogypsids 12
Calcigypsids Typic Calcigypsids 1
Calcids Haplocalcids Typic Haplocalcids 27
Entisols Psamments TorriPsamments Typic Torripsamments 30, 34
Lithic Torripsamments 19
Pediment plain Entisols Psamments TorriPsamments Lithic Torripsamments 3, 5, 6, 10
Sand Plain Aridisols Calcids Haplocalcids Typic Haplocalcids 17
Entisols Psamments TorriPsamments Typic Torripsamments 15, 16
Sabkha Aridisols Salids Aquisalids Gypsic Aquisalids 26, 33
Table (3): Total area for Soil classification in the study area Soil Soil Soil Total Soil Total Profile(s)
order sub-order great group area % sub-great group area % No.
Aridisols
Salids Aquisalids 2.2 Gypsic Aquisalids 2.2 26, 33
Gypsids Calcigypsids 1.45 Typic Calcigypsids 1.45 1
Haplogypsids 1.24 Lithic Haplogypsids 1.24 12, 28
Calcids Haplocalcids 10.52 Typic Haplocalcids 10.52 7, 13, 17
18, 20, 27, 29
Entisols Psamments Torripsamments 68.25
Lithic Torripsamments 32.76 2, 3, 5, 6
10, 11, 14, 19
Typic Torripsamments 35.48
15, 16, 21, 22
23, 24, 30, 31
32, 34, 35
CONCLUSION
Recognizing land forms helped in understanding of the relationship between morphological, physical and chemical characteristics of soil attributes in different of the landforms. Some physical and chemical characteristics of the soils were affected by location on landforms. The differences in physical and chemical properties of the soils were reflecting the conditions of the landforms. Varying degrees of pedogenic features are tied to the relationship between the soil and age of the landform. Most of the examined soil profiles are derived from the clayey and sandy members of coastal formations, and a different in soil depth. The high CaCO3 content of some profiles were associated with calcareous parent material.
Jalhoum. M. E. et al.
752
REFERENCES
El Bastawesy, M. A.; Ali, R.R. and Nasr, A. H. (2008). The Use of Remote Sensing and GIS for Catchments Delineation in Northwestern Coast of Egypt: An Assessment of Water Resources and Soil Potential. Egypt. J. Remote Sensing & Space Sci., V.11, PP. 3-16.
Emadi, M.; Baghernejad M.; Memarian, H.; Saffari, M. and Fathi, H. (2008). Genesis and Clay Mineralogical Investigation of Highly Calcareous Soils in Semi-Arid Regions of Southern Iran. Journal of Applied Sciences, 8 (2): 288-294.
Hammad, m. A. and Abdel Salam, M. A. (1968). The genesis and formation of Calcic horizons of the soils of the western coast of U. A. R. Egypt. J. Soil Sci., 10: 11 – 17.
Khalil, M. M., (2008). Origin, Genesis, Formation and classification of Sidi Barrani soils, Northwestern coastal zone, M. Sc. Thesis, Fac. of Agric., Zagazig Univ., Cairo, Egypt.
Moussa, B. M., (1976). Geomorphology and subsurface geology of the area between El-Alamein and Qattara Depression, northern western desert, Egypt. M. Sc. Thesis, Fac. of Agric., Ain-shams Univ., Cairo, Egypt.
Raslan, S.M., (1995). Geomorpholiogical and hydrogeological studies on some localities along the Northwestern Coast of Egypt, Menofia, Egypt.
Said, R. (1990). “The Geology of Egypt,” A. A. Balkema /Rotterdam /Brookfield.
Sayed, A. S. (2013). Evaluation of the land resources for agricultural development- case study: El-Hammam Canal and its extension, NW Coast of Egypt. Ph .D. Thesis, Hamburg Univ., Germany.
Shalaby, A. and R. Tateishi (2007). Remote sensing and GIS for mapping and monitoring land cover and land-use changes in the Northwestern coastal zone of Egypt. Applied Geography, 27(1): 28-41.
Soil Survey Staff (2010). Keys to Soil Taxonomy. 11th edition, Natural Resources Conservation Service, USDA, USA.
USDA (2004). "Soil Survey Laboratory Methods Manual" Soil Survey Investigation Report No. 42 Version 4.0.
Wahba, G. (1990). Spline models for observational data. CNMS-NSF Regional conference series in applied mathematics, 59, SIAM, Philadelphia, Pennsylvania.
J. Soil Sci. and Agric. Eng., Mansoura Univ., Vol. 5 (5), May, 2014
753
رضية فى الساحل الشمالى الغربى ,مصرعلاقة خصائص التربة والوحدات الأ ،*عبدددددددد الل يددددددد بدددددددلال عبدددددددد الم لددددددد بدددددددلال ،*جلهدددددددو محمدددددددد مدددددددد السددددددديدمح
**عبدالل ي سلد شتا ** و محمد سيف عبد الواحد الهيئة القومية للإستشلار من البلد وعلو الفضاء *
جاملة عين شمس–كلية ال راعة -راضىقس الأ **
إستخدمت الواعدة للتنمية الزراعية. كثر المناطقأواحد من الساحل الشمالى الغربى لمصر هو لتقيىيم خصىا س سىط تقنيات نظم المعلومات الجغرافية فى إنتاج وتحليل نموذج التضاريس الرقمىى
رضىىية. شىىملت . تتميىىز منطقىىة الدراسىىة بسىىتة مىىن الوحىىدات الأالأرض وإنتىىاج الخىىرا ط الطبويرافيىىةالوحىىدات اضرضىىية التاليىىة ض الحىىوض والمنخشضىىات والشىىرفات فمرتشعىىة ومنخشضىىة وسىى ل الرمىىال
حشرت إحدى وثلاثين قطاع تربة في جميع أنحاء منطقىة الدراسىة لتمثيىل الوحىدات وس ل البيدمونت. Gypsic Aquisalids, Typic التاليىة ض عنىواتحىت الأيمكىن تصىنيا التربىة .زيوجغرافيىةيالش
Calcigypsids, Lithic Haplogypsids, Typic Haplocalcids, Lithic Torripsamments and Typic Torripsamments . وكانىت الأفىاق التشخيصىية الر يسىية
. قل نمواكانت الأ Entisols ما رتبةأ salic, clacicهى Aridesolsلرتبة