soil biology & biochemistry greenhouse gas emissions from ... · soil biology &...
TRANSCRIPT

Soil Science Society of America Journal
Soil Sci. Soc. Am. J. 81:537–545 doi:10.2136/sssaj2016.08.0254 Received 11 Aug. 2016. Accepted 21 Dec. 2016. *Corresponding author ([email protected]). © Soil Science Society of America, 5585 Guilford Rd., Madison WI 53711 USA. All Rights reserved.
Greenhouse Gas Emissions from an Irrigated Dairy Forage Rotation as Influenced by
Fertilizer and Manure Applications
Soil Biology & Biochemistry
Information is needed regarding the effect of n source on greenhouse gas (ghg) emissions from irrigated semiarid agricultural soils. We report n2O, CO2, and Ch4 emissions from a silage corn (Zea mays l.) (2013)–barley (Hordeum vulgare l.) (2014)–alfalfa (Medicago sativa l.) (2015) rotation under conventional tillage and sprinkler irrigation. We evaluated the effec-tiveness of an enhanced-efficiency fertilizer (Superu, a stabilized granular urea with urease and nitrification inhibitors) to reduce n2O emissions com-pared with granular urea and to determine ghg emissions from fall-applied dairy manure or composted dairy manure and spring-applied dairy manure. nitrogen was applied during the first 2 yr of the study. Superu plots emit-ted 53% less n2O than urea with corn, whereas no emission reductions occurred in 2014 with barley. The n2O-n emission losses as a percentage of total n applied were 0.21 and 0.04% for urea and Superu in 2013, respec-tively, with losses of 0.05% from both urea fertilizers in 2014. On average, n2O fluxes from fall and spring manure were statistically similar and greater than the other n treatments in 2014 and a lasting manure treatment effect on emissions occurred under alfalfa. Carbon dioxide fluxes were greatest from fall- and spring-applied manure during the first 2 yr. methane fluxes were negative, indicating microbial oxidation, and no differences occurred among the treatments. Corn, barley, and alfalfa yields were similar among all n treatments. This work demonstrates that Superu can reduce n2O emissions from irrigated cropping systems in the semiarid western united States with-out affecting yields.
Abbreviations: DOY, day of the year; GHG, greenhouse gas; IPCC, Intergovernmental Panel on Climate Change; VWC, volumetric water content.
Fertilization and irrigation make intensive agricultural production pos-sible in many arid regions. Although application of N to soils is associated with increased N2O emissions, very few reports have addressed the effects
of fertilizer and manure applications on N2O emissions from irrigated cropping systems in semiarid regions (Haile-Mariam et al., 2008; Halvorson et al., 2016). According to the USEPA (2016), agricultural soil management (i.e., fertilizer ap-plication and other cropping practices) accounts for 4.6% of total US GHG emis-sions and 77% of total US N2O emissions from anthropogenic activities. Nitrous oxide is produced naturally in soils through nitrification and denitrification pro-cesses (Robertson and Groffman, 2007). As a GHG, N2O has a global warming potential 298 times that of CO2 over a 100-yr timescale (Solomon et al., 2007). As a result of continuing concerns over impacts from agricultural GHGs on glob-al climate change, there is a need for improved emissions inventories (Eve et al., 2014; USEPA, 2016). Currently, the Intergovernmental Panel on Climate Change (IPCC) methodology for determining direct N2O emissions from fertilizer (i.e.,
robert S. dungan* April B. leytem david d. Tarkalson
USDA-ARS Northwest Irrigation and Soils Research Laboratory 3793 North 3600 East Kimberly, ID 83341
James A. IppolitoColorado State Univ. College of Agricultural Sciences 307 University Ave Fort Collins, CO 80523
david l. BjornebergUSDA-ARS Northwest Irrigation and Soils Research Laboratory 3793 North 3600 East Kimberly, ID 83341
Core Ideas
• urea formulated with urease and nitrification inhibitors can reduce n2O emissions.
• nitrous oxide-n emission losses as a percentage of total n applied were ≤0.21%.
• Timing of manure application did not affect n2O, CO2, and Ch4 fluxes.
• Soil was a Ch4 sink and emissions were not influenced by n source.
Published online June 30, 2017
538 Soil Science Society of America Journal
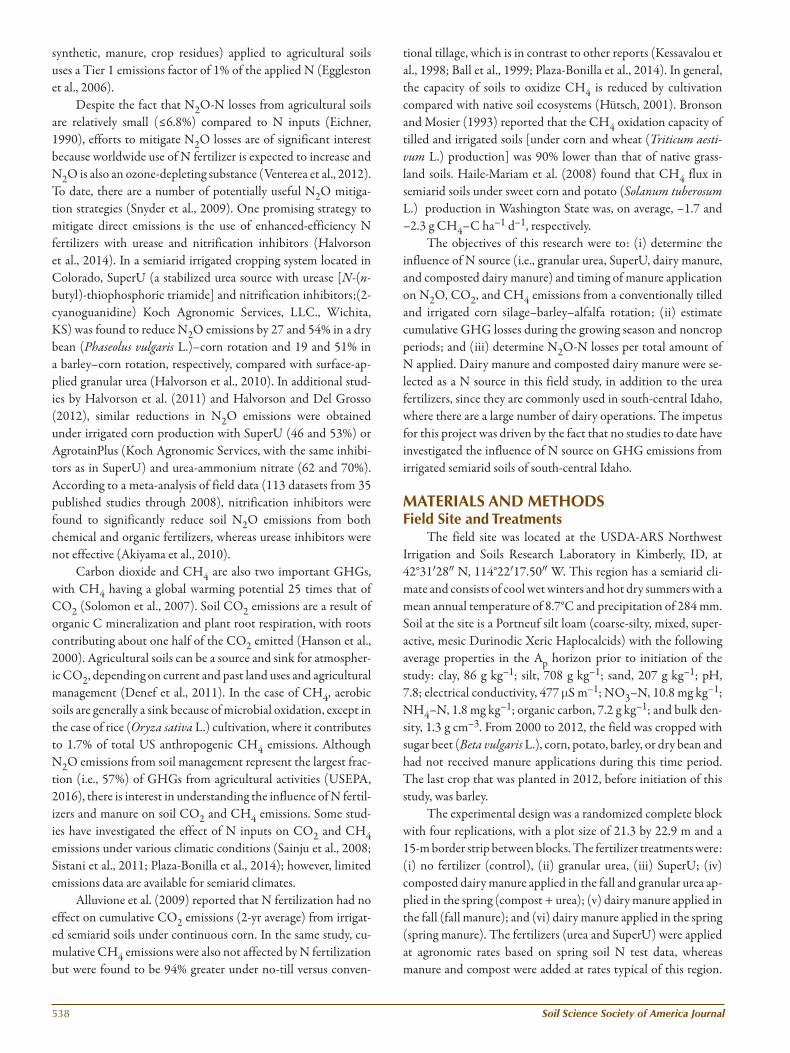
synthetic, manure, crop residues) applied to agricultural soils uses a Tier 1 emissions factor of 1% of the applied N (Eggleston et al., 2006).
Despite the fact that N2O-N losses from agricultural soils are relatively small (≤6.8%) compared to N inputs (Eichner, 1990), efforts to mitigate N2O losses are of significant interest because worldwide use of N fertilizer is expected to increase and N2O is also an ozone-depleting substance (Venterea et al., 2012). To date, there are a number of potentially useful N2O mitiga-tion strategies (Snyder et al., 2009). One promising strategy to mitigate direct emissions is the use of enhanced-efficiency N fertilizers with urease and nitrification inhibitors (Halvorson et al., 2014). In a semiarid irrigated cropping system located in Colorado, SuperU (a stabilized urea source with urease [N-(n-butyl)-thiophosphoric triamide] and nitrification inhibitors;(2-cyanoguanidine) Koch Agronomic Services, LLC., Wichita, KS) was found to reduce N2O emissions by 27 and 54% in a dry bean (Phaseolus vulgaris L.)–corn rotation and 19 and 51% in a barley–corn rotation, respectively, compared with surface-ap-plied granular urea (Halvorson et al., 2010). In additional stud-ies by Halvorson et al. (2011) and Halvorson and Del Grosso (2012), similar reductions in N2O emissions were obtained under irrigated corn production with SuperU (46 and 53%) or AgrotainPlus (Koch Agronomic Services, with the same inhibi-tors as in SuperU) and urea-ammonium nitrate (62 and 70%). According to a meta-analysis of field data (113 datasets from 35 published studies through 2008), nitrification inhibitors were found to significantly reduce soil N2O emissions from both chemical and organic fertilizers, whereas urease inhibitors were not effective (Akiyama et al., 2010).
Carbon dioxide and CH4 are also two important GHGs, with CH4 having a global warming potential 25 times that of CO2 (Solomon et al., 2007). Soil CO2 emissions are a result of organic C mineralization and plant root respiration, with roots contributing about one half of the CO2 emitted (Hanson et al., 2000). Agricultural soils can be a source and sink for atmospher-ic CO2, depending on current and past land uses and agricultural management (Denef et al., 2011). In the case of CH4, aerobic soils are generally a sink because of microbial oxidation, except in the case of rice (Oryza sativa L.) cultivation, where it contributes to 1.7% of total US anthropogenic CH4 emissions. Although N2O emissions from soil management represent the largest frac-tion (i.e., 57%) of GHGs from agricultural activities (USEPA, 2016), there is interest in understanding the influence of N fertil-izers and manure on soil CO2 and CH4 emissions. Some stud-ies have investigated the effect of N inputs on CO2 and CH4 emissions under various climatic conditions (Sainju et al., 2008; Sistani et al., 2011; Plaza-Bonilla et al., 2014); however, limited emissions data are available for semiarid climates.
Alluvione et al. (2009) reported that N fertilization had no effect on cumulative CO2 emissions (2-yr average) from irrigat-ed semiarid soils under continuous corn. In the same study, cu-mulative CH4 emissions were also not affected by N fertilization but were found to be 94% greater under no-till versus conven-
tional tillage, which is in contrast to other reports (Kessavalou et al., 1998; Ball et al., 1999; Plaza-Bonilla et al., 2014). In general, the capacity of soils to oxidize CH4 is reduced by cultivation compared with native soil ecosystems (Hütsch, 2001). Bronson and Mosier (1993) reported that the CH4 oxidation capacity of tilled and irrigated soils [under corn and wheat (Triticum aesti-vum L.) production] was 90% lower than that of native grass-land soils. Haile-Mariam et al. (2008) found that CH4 flux in semiarid soils under sweet corn and potato (Solanum tuberosum L.) production in Washington State was, on average, –1.7 and –2.3 g CH4–C ha–1 d–1, respectively.
The objectives of this research were to: (i) determine the influence of N source (i.e., granular urea, SuperU, dairy manure, and composted dairy manure) and timing of manure application on N2O, CO2, and CH4 emissions from a conventionally tilled and irrigated corn silage–barley–alfalfa rotation; (ii) estimate cumulative GHG losses during the growing season and noncrop periods; and (iii) determine N2O-N losses per total amount of N applied. Dairy manure and composted dairy manure were se-lected as a N source in this field study, in addition to the urea fertilizers, since they are commonly used in south-central Idaho, where there are a large number of dairy operations. The impetus for this project was driven by the fact that no studies to date have investigated the influence of N source on GHG emissions from irrigated semiarid soils of south-central Idaho.
mATerIAlS And meThOdSfield Site and Treatments
The field site was located at the USDA-ARS Northwest Irrigation and Soils Research Laboratory in Kimberly, ID, at 42°31¢28² N, 114°22¢17.50² W. This region has a semiarid cli-mate and consists of cool wet winters and hot dry summers with a mean annual temperature of 8.7°C and precipitation of 284 mm. Soil at the site is a Portneuf silt loam (coarse-silty, mixed, super-active, mesic Durinodic Xeric Haplocalcids) with the following average properties in the Ap horizon prior to initiation of the study: clay, 86 g kg–1; silt, 708 g kg–1; sand, 207 g kg–1; pH, 7.8; electrical conductivity, 477 mS m–1; NO3–N, 10.8 mg kg–1; NH4–N, 1.8 mg kg–1; organic carbon, 7.2 g kg–1; and bulk den-sity, 1.3 g cm–3. From 2000 to 2012, the field was cropped with sugar beet (Beta vulgaris L.), corn, potato, barley, or dry bean and had not received manure applications during this time period. The last crop that was planted in 2012, before initiation of this study, was barley.
The experimental design was a randomized complete block with four replications, with a plot size of 21.3 by 22.9 m and a 15-m border strip between blocks. The fertilizer treatments were: (i) no fertilizer (control), (ii) granular urea, (iii) SuperU; (iv) composted dairy manure applied in the fall and granular urea ap-plied in the spring (compost + urea); (v) dairy manure applied in the fall (fall manure); and (vi) dairy manure applied in the spring (spring manure). The fertilizers (urea and SuperU) were applied at agronomic rates based on spring soil N test data, whereas manure and compost were added at rates typical of this region.
www.soils.org/publications/sssaj 539
Table 1 summarizes the quan-tity of N and C applied for each treatment and the timing of the applications. The average annual compost and manure application rates were 28 and 112 Mg ha–1 (wet wt. basis), respectively. Prior to silage corn planting in spring 2013, P (as monoammonium phosphate) was applied to the urea and SuperU treatments at a rate of 34 kg P ha–1, based on soil test data and University of Idaho recommendations (Brown et al., 2010). The N applied in the monoammonium phosphate was accounted for in the total N applied in the urea and SuperU treatments (Table 1). After broadcasting, the treatments were incorporated into the soil us-ing a tandem disk within 24 h. The control plots were also disked. No treatments were applied to alfalfa in 2015 because there was sufficient soil inorganic N for alfalfa establishment, with the subsequent year’s N requirements being met by plant–rhizobia symbiotic N fixation. Selected physical and chemical properties of the dairy manure and compost are presented in Table 2. The moisture content of the manure ranged from 48 to 61%, whereas the respective values for compost were 7 and 15% in 2012 and 2013. The C/N ratios ranged from a low of 9.9 for compost to 14.8 for manure.
Silage corn (‘P925HR HX1’, Pioneer), barley (‘Moravian 69’, MillerCoors), and alfalfa (‘Grandstand’, Dyna-Gro) were planted on 16 May 2013 [day of the year (DOY): 136], 9 Apr. 2014 (DOY: 99), and 16 Apr. 2015 (DOY: 106), respec-tively. The respective seeding rates were 32, 124, and 34 kg seed ha–1 (approximately equal to 8.6 × 10⁴, 4.1 × 10⁶, and 1.5 × 10⁷ seeds ha–1). Herbicide applications at label rates for corn occurred on 5 [generic glyphosate (N-[phosphonomethyl]glycine)] and 26 [glyphosate and Status (BASF Corporation, Research Triangle Park, NC)] June 2013 (DOY: 156 and 177), those for barley [Colt + Sword (Loveland Products, Inc., Loveland, CO) and Affinity BroadSpec (Dupont Crop Protection, Wilmington, DE)] on 28 May 2014 (DOY: 148), and that for alfalfa (Raptor, BASF Corporation) on 18 June 2015 (DOY: 169). The active ingredients in Status are sodium salt of diflufenzopyr [2-(1-[([3,5-difluorophenylamino] carbonyl)-hydrazono]ethyl)-3-pyridinecarboxylic acid] and dicamba (3,6-dichloro-2-methoxybenzoic acid), those for Colt =+ Sword are fluroxypyr 1-methylheptyl ester (4-amino-3,5-dichloro-6-fluoro-2-pyridyloxyacetic acid, 1-methylheptyl ester) and methyl phenoxy ester (2-methyl-4-chlorophen-oxyacetic acid, 2-ethylhexyl ester), those for Broadspec are thifensulfuron-methyl [Methyl 3-([([(4-methoxy-6-meth-yl-1,3,5-triazin-2-yl) amino]carbonyl)amino]sulfonyl)-2-thiophenecarboxylate] and tribenuron-methyl [methyl 2-([([N-(4-methoxy-6-methyl-1,3,5-triazin-2-yl)methyl-
amino]carbonyl) amino]sulfonyl)benzoate], and that for Raptor is ammonium salt of imazamox [2-(4,5-dihydro-4-methyl-4-[1-methylethyl]-5-oxo-1H-imidazol-2-yl)-5-(methoxymethyl)-3-pyridinecarboxylic acid].
Crop harvest dates were 12 Sept. 2013 (DOY: 255) for si-lage corn, 20 Aug. 2014 (DOY: 232) for barley, and 15 July and 8 Sept. 2015 (DOY: 199 and 251) for alfalfa. Silage corn was removed from the field the same day it was chopped, barley straw was baled and removed after grain harvest, and alfalfa was baled about 1 wk after it was windrowed. Plant subsamples were col-lected and weighed, then dried in a constant-temperature forced-draft oven for 48 h at 60°C and reweighed to determine the dry matter fraction. Yields on a dry matter basis were determined by multiplying the weight of harvested material by the dry matter fraction (Table 3).
An onsite weather station (Campbell Scientific, Inc., Logan, UT) was placed at the northwest corner of the field in a control plot with soil temperature measured at 6 cm. Soil volumetric water content (VWC) at 0 to 15 cm was measured at the time
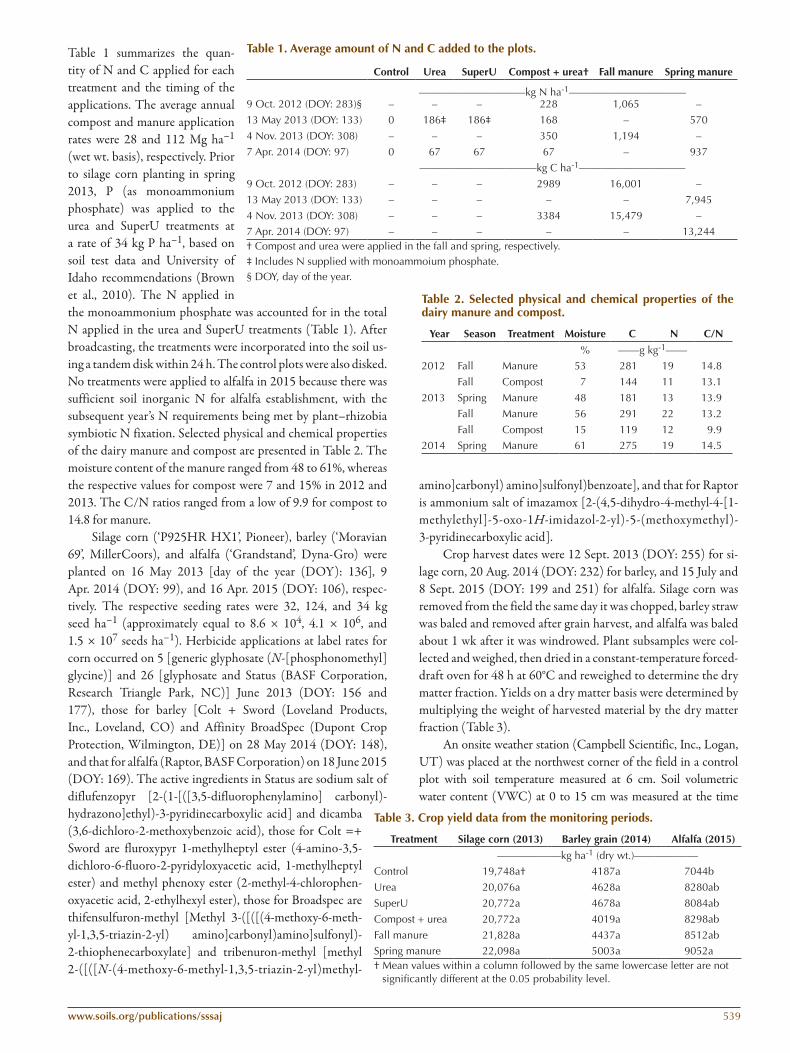
Table 1. Average amount of n and C added to the plots.
Control urea Superu Compost + urea† fall manure Spring manure
——————————kg N ha-1———————————9 Oct. 2012 (DOY: 283)§ – – – 228 1,065 –
13 May 2013 (DOY: 133) 0 186‡ 186‡ 168 – 570
4 Nov. 2013 (DOY: 308) – – – 350 1,194 –
7 Apr. 2014 (DOY: 97) 0 67 67 67 – 937
———————————kg C ha-1——————————
9 Oct. 2012 (DOY: 283) – – – 2989 16,001 –
13 May 2013 (DOY: 133) – – – – – 7,945
4 Nov. 2013 (DOY: 308) – – – 3384 15,479 –7 Apr. 2014 (DOY: 97) – – – – – 13,244† Compost and urea were applied in the fall and spring, respectively.‡ Includes N supplied with monoammoium phosphate.§ DOY, day of the year.
Table 2. Selected physical and chemical properties of the dairy manure and compost.
Year Season Treatment moisture C n C/n
% ——g kg-1——2012 Fall Manure 53 281 19 14.8
Fall Compost 7 144 11 13.1
2013 Spring Manure 48 181 13 13.9
Fall Manure 56 291 22 13.2
Fall Compost 15 119 12 9.92014 Spring Manure 61 275 19 14.5
Table 3. Crop yield data from the monitoring periods.
Treatment Silage corn (2013) Barley grain (2014) Alfalfa (2015)
——————kg ha-1 (dry wt.)——————Control 19,748a† 4187a 7044b
Urea 20,076a 4628a 8280ab
SuperU 20,772a 4678a 8084ab
Compost + urea 20,772a 4019a 8298ab
Fall manure 21,828a 4437a 8512abSpring manure 22,098a 5003a 9052a† Mean values within a column followed by the same lowercase letter are not
significantly different at the 0.05 probability level.
540 Soil Science Society of America Journal
of gas sampling by manually placing a CS630-L Time Domain Reflectometry probe (Campbell Scientific, Inc., Logan, UT) into the soil just outside the gas flux measurement area. Precipitation data were obtained from the Twin Falls (Kimberly) Idaho AgriMet weather station, which is 3.8 km northeast of the field site (http://www.usbr.gov/pn/agrimet/agrimetmap/twfida.html, accessed 30 Mar. 2017). Irrigation water (Snake River water from a canal system) was applied using a lateral-move irrigation system. Approximately 20 mm were applied two or three times per week to meet crop water needs based on the AgriMet data.
gas flux measurementsNitrous oxide, CO2, and CH4 flux measurements were con-
ducted using a vented, non-steady-state, closed chamber tech-nique. The gas chambers were built according to USDA-ARS GRACEnet sampling protocols (Parkin and Venterea, 2010). In brief, a rectangular chamber (78.5 by 40.5 by 10 cm) was manu-factured from an aluminum sheet 3.2 mm thick and fitted with a sampling port and vent on the top. To insulate the chamber, a layer of corkboard was applied to the surface, which was then coated with a layer of Mylar tape. In the field, each chamber was placed onto an aluminum anchor that was set 10 cm into the soil and sealed using a water channel. Duplicate anchors were placed about 1 m apart in each plot and were set parallel to the crop row to cover the row and inter-row space (76.2 cm for corn, 17.8 cm for barley, and 19.1 cm for alfalfa row spacing). In the case of corn, the anchor was centered over one row and covered only one half of each adjacent inter-row space. The anchors were tem-porarily removed during soil tillage, fertilizer application, and harvest but otherwise remained in the plots at all times. Corn, barley, and alfalfa within the anchor area were cut so that they did not extend above the water channel.
An air sample from within the chamber was collected at 0, 15, and 30 min using a 30-mL polypropylene syringe with a stopcock. Afterward, the syringes were stored in a cooler (with-out ice) until transported to the laboratory. Twenty-five-mL air samples were then injected into evacuated 12-mL Exetainer vials
with gray butyl rubber septa (Labco Limited, Lampeter, UK), which were then analyzed via gas chromatography. The gas chro-matograph (model 7890A, Agilent Technologies, Santa Clara, CA) was equipped with a GC 120 autosampler and electron capture, thermal conductivity, and flame ionization detectors to quantify N2O, CO2, and CH4, respectively. Gas fluxes were determined from a linear or nonlinear increase in the concentra-tion within the chamber headspace over time (Hutchinson and Mosier, 1981). Estimates of daily gas emissions between sam-pling days were generated using the adjacent sampling dates and the FORECAST function in Microsoft Excel 2010 (Microsoft Corporation, Redmond, WA).
Gas samples were collected during the following periods each year: 2013: 20 May to 30 Oct. (DOY: 140–303); 2014: 5 Mar. to 10 Dec. (DOY: 64–344); and 2015: 8 Jan. to 10 Nov. (DOY: 8–314). Gas samples were collected two to three times weekly during the spring, summer, and fall and on an irregular basis during the winter when temperatures were above freezing.
Statistical AnalysisEstimated cumulative N2O, CO2, and CH4 emissions; av-
erage fluxes; and crop yield data were statistically analyzed using a factorial ANOVA in SAS (SAS Institute Inc., Cary, NC). All ANOVA data were checked for normality and were log-trans-formed when necessary. Mean comparisons were performed us-ing the Ryan–Einot–Gabriel–Welsch multiple range test at an a level of 0.05. Statements of statistical significance were based on P < 0.05.
reSulTS And dISCuSSIOnenvironmental Conditions
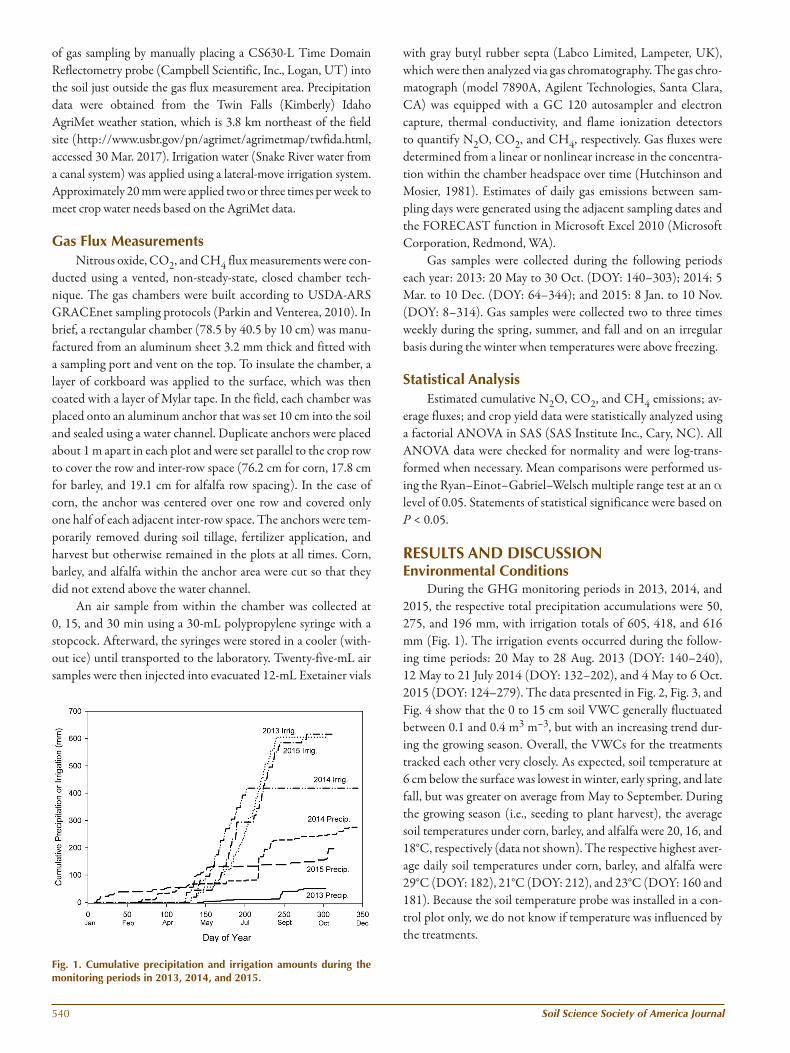
During the GHG monitoring periods in 2013, 2014, and 2015, the respective total precipitation accumulations were 50, 275, and 196 mm, with irrigation totals of 605, 418, and 616 mm (Fig. 1). The irrigation events occurred during the follow-ing time periods: 20 May to 28 Aug. 2013 (DOY: 140–240), 12 May to 21 July 2014 (DOY: 132–202), and 4 May to 6 Oct. 2015 (DOY: 124–279). The data presented in Fig. 2, Fig. 3, and Fig. 4 show that the 0 to 15 cm soil VWC generally fluctuated between 0.1 and 0.4 m3 m–3, but with an increasing trend dur-ing the growing season. Overall, the VWCs for the treatments tracked each other very closely. As expected, soil temperature at 6 cm below the surface was lowest in winter, early spring, and late fall, but was greater on average from May to September. During the growing season (i.e., seeding to plant harvest), the average soil temperatures under corn, barley, and alfalfa were 20, 16, and 18°C, respectively (data not shown). The respective highest aver-age daily soil temperatures under corn, barley, and alfalfa were 29°C (DOY: 182), 21°C (DOY: 212), and 23°C (DOY: 160 and 181). Because the soil temperature probe was installed in a con-trol plot only, we do not know if temperature was influenced by the treatments.
fig. 1. Cumulative precipitation and irrigation amounts during the monitoring periods in 2013, 2014, and 2015.

www.soils.org/publications/sssaj 541
Crop YieldsSilage corn and barley grain yields were statistically simi-
lar among the N treatments (P > 0.34; Table 3). Additionally, biomass yields in the controls (i.e., no N) were similar to the N-treated plots for corn (P > 0.65) and barley (P > 0.69), indi-cating that the control soils produced sufficient plant-available N during the monitoring periods. The high N mineralization potential of the aridisols in south-central Idaho is a commonly observed trait (Stanford et al., 1977; Westermann and Crothers, 1980). Alfalfa yields, based on two cuttings, were similar among the N treatments and controls (P > 0.21), except in the case of spring manure versus the control (P < 0.04). Once again for clari-fication, no N was applied in the fall and spring before the alfalfa was planted in 2015.
nitrous Oxide fluxesGreenhouse gas measurements commenced prior to N ap-
plications and irrigation to determine baseline emissions and en-
sure that maximum N2O fluxes were captured. Under silage corn (2013), the maximum measured N2O-N flux from SuperU and spring manure occurred on Days 140 (15 g ha–1 d–1) and 142 (22 g ha–1 d–1), respectively, then from urea and compost + urea on Day 156 (31 g ha–1 d–1), followed by a decline to background levels (Fig. 2). During the same period, N2O emissions from fall manure were also elevated, although these fluxes were lower than those from compost + urea and spring manure. Starting on Day 182, N2O emissions increased again slightly from fall and spring manure, reaching maximum flux on Day 190. This short-term increase corresponds with the highest average daily soil tempera-ture of 29°C during the monitoring period.
In 2014, N2O fluxes were about 45-fold greater on average from fall manure versus the other treatments in the beginning of the monitoring period (DOY: 64–84) before the N inputs oc-curred and barley was planted (Fig. 3). This is because the labile N that was not used by the soil microorganisms over the fall and winter was actively metabolized when the soils began to warm in early March. Within a few days of spring fertilizer and manure
fig. 2. Average n2O, CO2, and Ch4 fluxes for the control, urea, Superu, compost + urea, fall manure, and spring manure treatments and volumetric water content (vWC) and soil temperature during the monitoring period in 2013 with silage corn as the crop. Soil temperature after day 248 was not available because of a probe malfunction.
fig. 3. Average n2O, CO2, and Ch4 fluxes for the control, urea, Superu, compost + urea, fall manure, and spring manure treatments and volumetric water content (vWC) and soil temperature during the monitoring period in 2014 with barley as the crop.
542 Soil Science Society of America Journal
application on Day 97, the N2O-N emissions began to increase from all treatments; however, the magnitude was greatest from spring manure on Day 111 (43 g ha–1 d–1). When irrigation water was applied for the first time on Day 132, the emissions began to increase slightly, with another large N2O-N flux occur-ring from spring manure on Day 140 (20 g ha–1 d–1). Thereafter, N2O emissions from the fall and spring manure peaked on Day 180, then generally tracked the other treatments at near back-ground rates.
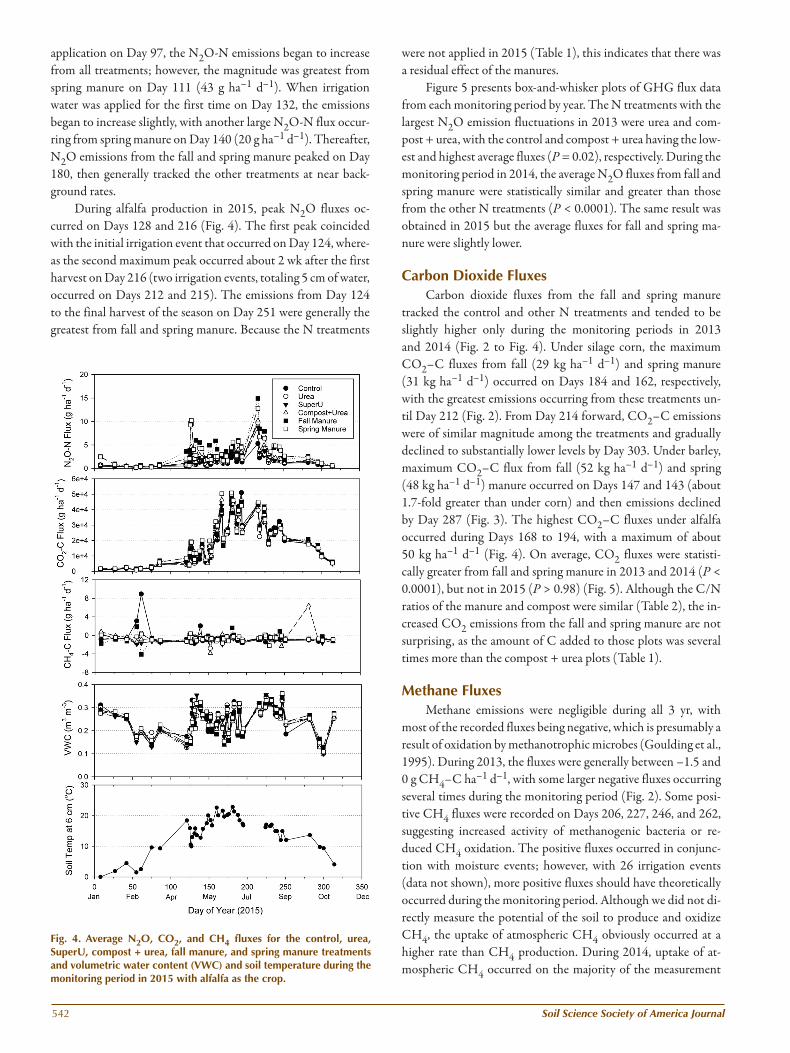
During alfalfa production in 2015, peak N2O fluxes oc-curred on Days 128 and 216 (Fig. 4). The first peak coincided with the initial irrigation event that occurred on Day 124, where-as the second maximum peak occurred about 2 wk after the first harvest on Day 216 (two irrigation events, totaling 5 cm of water, occurred on Days 212 and 215). The emissions from Day 124 to the final harvest of the season on Day 251 were generally the greatest from fall and spring manure. Because the N treatments
were not applied in 2015 (Table 1), this indicates that there was a residual effect of the manures.
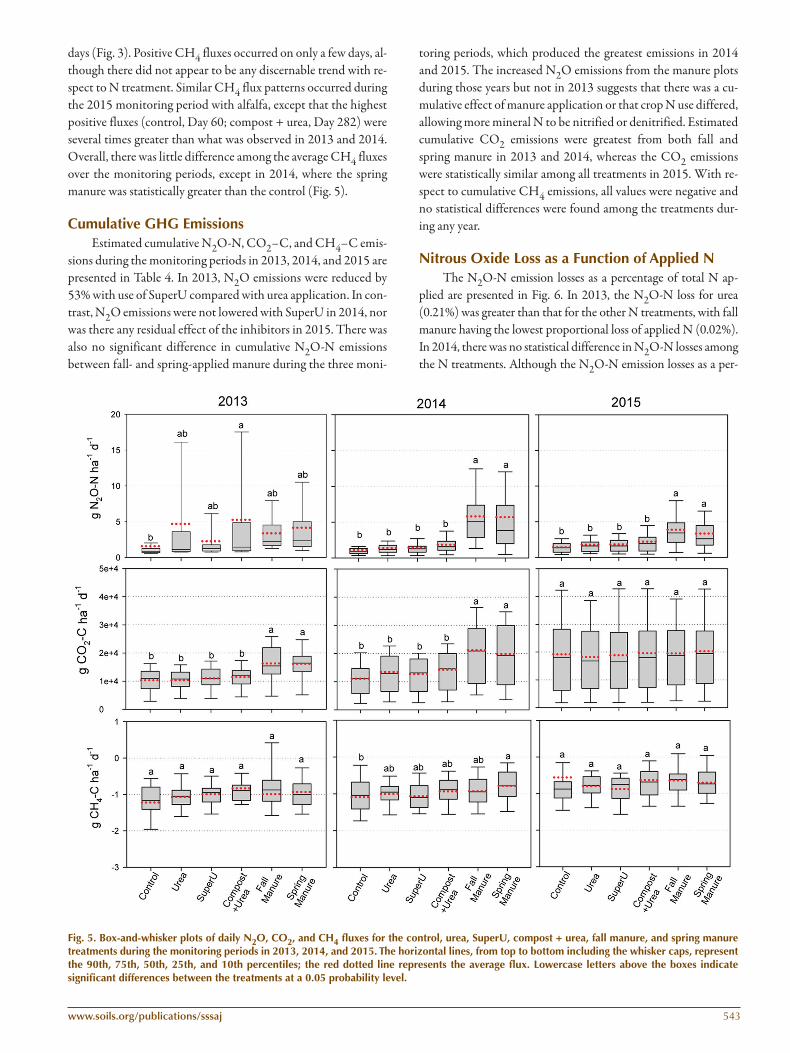
Figure 5 presents box-and-whisker plots of GHG flux data from each monitoring period by year. The N treatments with the largest N2O emission fluctuations in 2013 were urea and com-post + urea, with the control and compost + urea having the low-est and highest average fluxes (P = 0.02), respectively. During the monitoring period in 2014, the average N2O fluxes from fall and spring manure were statistically similar and greater than those from the other N treatments (P < 0.0001). The same result was obtained in 2015 but the average fluxes for fall and spring ma-nure were slightly lower.
Carbon dioxide fluxesCarbon dioxide fluxes from the fall and spring manure
tracked the control and other N treatments and tended to be slightly higher only during the monitoring periods in 2013 and 2014 (Fig. 2 to Fig. 4). Under silage corn, the maximum CO2–C fluxes from fall (29 kg ha–1 d–1) and spring manure (31 kg ha–1 d–1) occurred on Days 184 and 162, respectively, with the greatest emissions occurring from these treatments un-til Day 212 (Fig. 2). From Day 214 forward, CO2–C emissions were of similar magnitude among the treatments and gradually declined to substantially lower levels by Day 303. Under barley, maximum CO2–C flux from fall (52 kg ha–1 d–1) and spring (48 kg ha–1 d–1) manure occurred on Days 147 and 143 (about 1.7-fold greater than under corn) and then emissions declined by Day 287 (Fig. 3). The highest CO2–C fluxes under alfalfa occurred during Days 168 to 194, with a maximum of about 50 kg ha–1 d–1 (Fig. 4). On average, CO2 fluxes were statisti-cally greater from fall and spring manure in 2013 and 2014 (P < 0.0001), but not in 2015 (P > 0.98) (Fig. 5). Although the C/N ratios of the manure and compost were similar (Table 2), the in-creased CO2 emissions from the fall and spring manure are not surprising, as the amount of C added to those plots was several times more than the compost + urea plots (Table 1).
methane fluxesMethane emissions were negligible during all 3 yr, with
most of the recorded fluxes being negative, which is presumably a result of oxidation by methanotrophic microbes (Goulding et al., 1995). During 2013, the fluxes were generally between –1.5 and 0 g CH4–C ha–1 d–1, with some larger negative fluxes occurring several times during the monitoring period (Fig. 2). Some posi-tive CH4 fluxes were recorded on Days 206, 227, 246, and 262, suggesting increased activity of methanogenic bacteria or re-duced CH4 oxidation. The positive fluxes occurred in conjunc-tion with moisture events; however, with 26 irrigation events (data not shown), more positive fluxes should have theoretically occurred during the monitoring period. Although we did not di-rectly measure the potential of the soil to produce and oxidize CH4, the uptake of atmospheric CH4 obviously occurred at a higher rate than CH4 production. During 2014, uptake of at-mospheric CH4 occurred on the majority of the measurement
fig. 4. Average n2O, CO2, and Ch4 fluxes for the control, urea, Superu, compost + urea, fall manure, and spring manure treatments and volumetric water content (vWC) and soil temperature during the monitoring period in 2015 with alfalfa as the crop.
www.soils.org/publications/sssaj 543
days (Fig. 3). Positive CH4 fluxes occurred on only a few days, al-though there did not appear to be any discernable trend with re-spect to N treatment. Similar CH4 flux patterns occurred during the 2015 monitoring period with alfalfa, except that the highest positive fluxes (control, Day 60; compost + urea, Day 282) were several times greater than what was observed in 2013 and 2014. Overall, there was little difference among the average CH4 fluxes over the monitoring periods, except in 2014, where the spring manure was statistically greater than the control (Fig. 5).
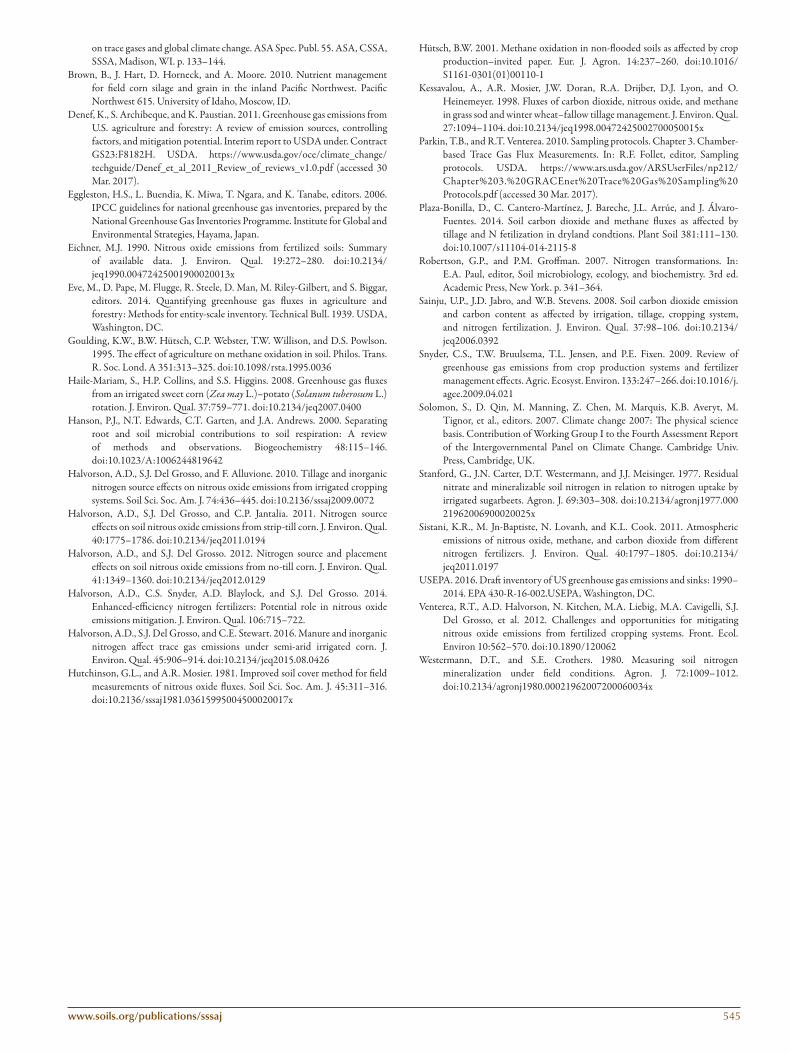
Cumulative ghg emissionsEstimated cumulative N2O-N, CO2–C, and CH4–C emis-
sions during the monitoring periods in 2013, 2014, and 2015 are presented in Table 4. In 2013, N2O emissions were reduced by 53% with use of SuperU compared with urea application. In con-trast, N2O emissions were not lowered with SuperU in 2014, nor was there any residual effect of the inhibitors in 2015. There was also no significant difference in cumulative N2O-N emissions between fall- and spring-applied manure during the three moni-
toring periods, which produced the greatest emissions in 2014 and 2015. The increased N2O emissions from the manure plots during those years but not in 2013 suggests that there was a cu-mulative effect of manure application or that crop N use differed, allowing more mineral N to be nitrified or denitrified. Estimated cumulative CO2 emissions were greatest from both fall and spring manure in 2013 and 2014, whereas the CO2 emissions were statistically similar among all treatments in 2015. With re-spect to cumulative CH4 emissions, all values were negative and no statistical differences were found among the treatments dur-ing any year.
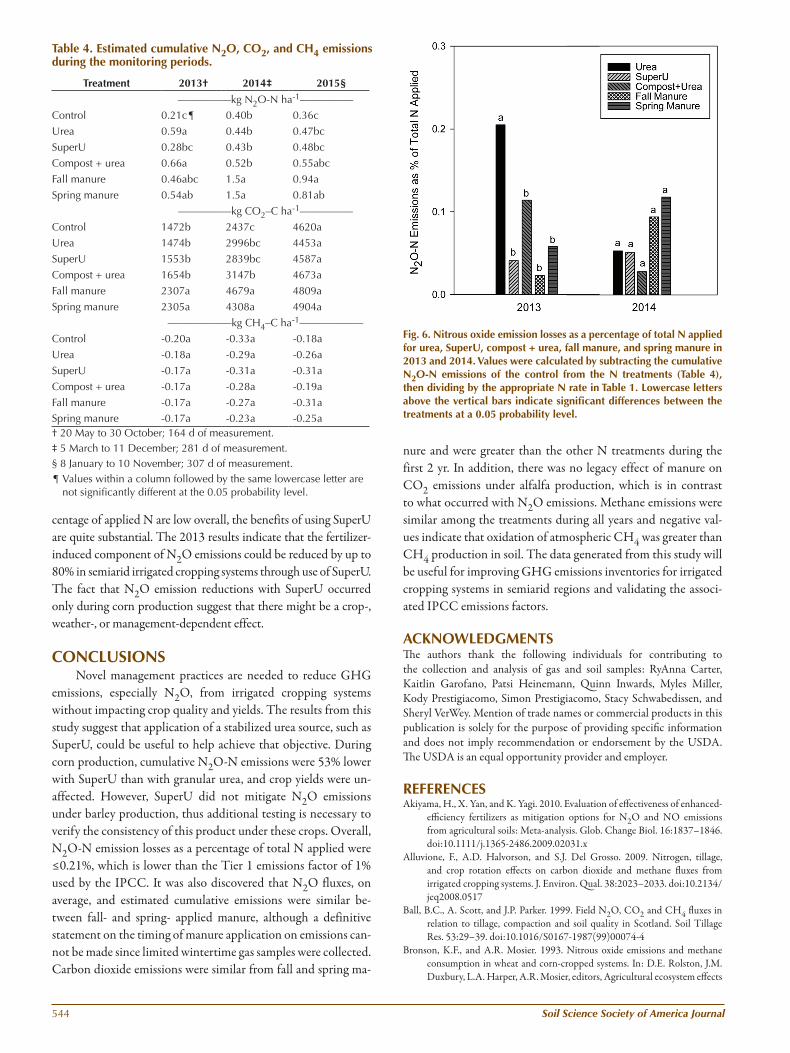
nitrous Oxide loss as a function of Applied nThe N2O-N emission losses as a percentage of total N ap-
plied are presented in Fig. 6. In 2013, the N2O-N loss for urea (0.21%) was greater than that for the other N treatments, with fall manure having the lowest proportional loss of applied N (0.02%). In 2014, there was no statistical difference in N2O-N losses among the N treatments. Although the N2O-N emission losses as a per-
fig. 5. Box-and-whisker plots of daily n2O, CO2, and Ch4 fluxes for the control, urea, Superu, compost + urea, fall manure, and spring manure treatments during the monitoring periods in 2013, 2014, and 2015. The horizontal lines, from top to bottom including the whisker caps, represent the 90th, 75th, 50th, 25th, and 10th percentiles; the red dotted line represents the average flux. lowercase letters above the boxes indicate significant differences between the treatments at a 0.05 probability level.
544 Soil Science Society of America Journal
centage of applied N are low overall, the benefits of using SuperU are quite substantial. The 2013 results indicate that the fertilizer-induced component of N2O emissions could be reduced by up to 80% in semiarid irrigated cropping systems through use of SuperU. The fact that N2O emission reductions with SuperU occurred only during corn production suggest that there might be a crop-, weather-, or management-dependent effect.
COnCluSIOnSNovel management practices are needed to reduce GHG
emissions, especially N2O, from irrigated cropping systems without impacting crop quality and yields. The results from this study suggest that application of a stabilized urea source, such as SuperU, could be useful to help achieve that objective. During corn production, cumulative N2O-N emissions were 53% lower with SuperU than with granular urea, and crop yields were un-affected. However, SuperU did not mitigate N2O emissions under barley production, thus additional testing is necessary to verify the consistency of this product under these crops. Overall, N2O-N emission losses as a percentage of total N applied were ≤0.21%, which is lower than the Tier 1 emissions factor of 1% used by the IPCC. It was also discovered that N2O fluxes, on average, and estimated cumulative emissions were similar be-tween fall- and spring- applied manure, although a definitive statement on the timing of manure application on emissions can-not be made since limited wintertime gas samples were collected. Carbon dioxide emissions were similar from fall and spring ma-
nure and were greater than the other N treatments during the first 2 yr. In addition, there was no legacy effect of manure on CO2 emissions under alfalfa production, which is in contrast to what occurred with N2O emissions. Methane emissions were similar among the treatments during all years and negative val-ues indicate that oxidation of atmospheric CH4 was greater than CH4 production in soil. The data generated from this study will be useful for improving GHG emissions inventories for irrigated cropping systems in semiarid regions and validating the associ-ated IPCC emissions factors.
ACknOWledgmenTSThe authors thank the following individuals for contributing to the collection and analysis of gas and soil samples: RyAnna Carter, Kaitlin Garofano, Patsi Heinemann, Quinn Inwards, Myles Miller, Kody Prestigiacomo, Simon Prestigiacomo, Stacy Schwabedissen, and Sheryl VerWey. Mention of trade names or commercial products in this publication is solely for the purpose of providing specific information and does not imply recommendation or endorsement by the USDA. The USDA is an equal opportunity provider and employer.
referenCeSAkiyama, H., X. Yan, and K. Yagi. 2010. Evaluation of effectiveness of enhanced-
efficiency fertilizers as mitigation options for N2O and NO emissions from agricultural soils: Meta-analysis. Glob. Change Biol. 16:1837–1846. doi:10.1111/j.1365-2486.2009.02031.x
Alluvione, F., A.D. Halvorson, and S.J. Del Grosso. 2009. Nitrogen, tillage, and crop rotation effects on carbon dioxide and methane fluxes from irrigated cropping systems. J. Environ. Qual. 38:2023–2033. doi:10.2134/jeq2008.0517
Ball, B.C., A. Scott, and J.P. Parker. 1999. Field N2O, CO2 and CH4 fluxes in relation to tillage, compaction and soil quality in Scotland. Soil Tillage Res. 53:29–39. doi:10.1016/S0167-1987(99)00074-4
Bronson, K.F., and A.R. Mosier. 1993. Nitrous oxide emissions and methane consumption in wheat and corn-cropped systems. In: D.E. Rolston, J.M. Duxbury, L.A. Harper, A.R. Mosier, editors, Agricultural ecosystem effects
fig. 6. nitrous oxide emission losses as a percentage of total n applied for urea, Superu, compost + urea, fall manure, and spring manure in 2013 and 2014. values were calculated by subtracting the cumulative n2O-n emissions of the control from the n treatments (Table 4), then dividing by the appropriate n rate in Table 1. lowercase letters above the vertical bars indicate significant differences between the treatments at a 0.05 probability level.
Table 4. estimated cumulative n2O, CO2, and Ch4 emissions during the monitoring periods.
Treatment 2013† 2014‡ 2015§
—————kg N2O-N ha-1—————Control 0.21c¶ 0.40b 0.36c
Urea 0.59a 0.44b 0.47bc
SuperU 0.28bc 0.43b 0.48bc
Compost + urea 0.66a 0.52b 0.55abc
Fall manure 0.46abc 1.5a 0.94a
Spring manure 0.54ab 1.5a 0.81ab
—————kg CO2–C ha-1—————
Control 1472b 2437c 4620a
Urea 1474b 2996bc 4453a
SuperU 1553b 2839bc 4587a
Compost + urea 1654b 3147b 4673a
Fall manure 2307a 4679a 4809a
Spring manure 2305a 4308a 4904a
——————kg CH4–C ha-1——————
Control -0.20a -0.33a -0.18a
Urea -0.18a -0.29a -0.26a
SuperU -0.17a -0.31a -0.31a
Compost + urea -0.17a -0.28a -0.19a
Fall manure -0.17a -0.27a -0.31aSpring manure -0.17a -0.23a -0.25a† 20 May to 30 October; 164 d of measurement.‡ 5 March to 11 December; 281 d of measurement.§ 8 January to 10 November; 307 d of measurement.¶ Values within a column followed by the same lowercase letter are
not significantly different at the 0.05 probability level.
www.soils.org/publications/sssaj 545
on trace gases and global climate change. ASA Spec. Publ. 55. ASA, CSSA, SSSA, Madison, WI. p. 133–144.
Brown, B., J. Hart, D. Horneck, and A. Moore. 2010. Nutrient management for field corn silage and grain in the inland Pacific Northwest. Pacific Northwest 615. University of Idaho, Moscow, ID.
Denef, K., S. Archibeque, and K. Paustian. 2011. Greenhouse gas emissions from U.S. agriculture and forestry: A review of emission sources, controlling factors, and mitigation potential. Interim report to USDA under. Contract GS23:F8182H. USDA. https://www.usda.gov/oce/climate_change/techguide/Denef_et_al_2011_Review_of_reviews_v1.0.pdf (accessed 30 Mar. 2017).
Eggleston, H.S., L. Buendia, K. Miwa, T. Ngara, and K. Tanabe, editors. 2006. IPCC guidelines for national greenhouse gas inventories, prepared by the National Greenhouse Gas Inventories Programme. Institute for Global and Environmental Strategies, Hayama, Japan.
Eichner, M.J. 1990. Nitrous oxide emissions from fertilized soils: Summary of available data. J. Environ. Qual. 19:272–280. doi:10.2134/jeq1990.00472425001900020013x
Eve, M., D. Pape, M. Flugge, R. Steele, D. Man, M. Riley-Gilbert, and S. Biggar, editors. 2014. Quantifying greenhouse gas fluxes in agriculture and forestry: Methods for entity-scale inventory. Technical Bull. 1939. USDA, Washington, DC.
Goulding, K.W., B.W. Hütsch, C.P. Webster, T.W. Willison, and D.S. Powlson. 1995. The effect of agriculture on methane oxidation in soil. Philos. Trans. R. Soc. Lond. A 351:313–325. doi:10.1098/rsta.1995.0036
Haile-Mariam, S., H.P. Collins, and S.S. Higgins. 2008. Greenhouse gas fluxes from an irrigated sweet corn (Zea may L.)–potato (Solanum tuberosum L.) rotation. J. Environ. Qual. 37:759–771. doi:10.2134/jeq2007.0400
Hanson, P.J., N.T. Edwards, C.T. Garten, and J.A. Andrews. 2000. Separating root and soil microbial contributions to soil respiration: A review of methods and observations. Biogeochemistry 48:115–146. doi:10.1023/A:1006244819642
Halvorson, A.D., S.J. Del Grosso, and F. Alluvione. 2010. Tillage and inorganic nitrogen source effects on nitrous oxide emissions from irrigated cropping systems. Soil Sci. Soc. Am. J. 74:436–445. doi:10.2136/sssaj2009.0072
Halvorson, A.D., S.J. Del Grosso, and C.P. Jantalia. 2011. Nitrogen source effects on soil nitrous oxide emissions from strip-till corn. J. Environ. Qual. 40:1775–1786. doi:10.2134/jeq2011.0194
Halvorson, A.D., and S.J. Del Grosso. 2012. Nitrogen source and placement effects on soil nitrous oxide emissions from no-till corn. J. Environ. Qual. 41:1349–1360. doi:10.2134/jeq2012.0129
Halvorson, A.D., C.S. Snyder, A.D. Blaylock, and S.J. Del Grosso. 2014. Enhanced-efficiency nitrogen fertilizers: Potential role in nitrous oxide emissions mitigation. J. Environ. Qual. 106:715–722.
Halvorson, A.D., S.J. Del Grosso, and C.E. Stewart. 2016. Manure and inorganic nitrogen affect trace gas emissions under semi-arid irrigated corn. J. Environ. Qual. 45:906–914. doi:10.2134/jeq2015.08.0426
Hutchinson, G.L., and A.R. Mosier. 1981. Improved soil cover method for field measurements of nitrous oxide fluxes. Soil Sci. Soc. Am. J. 45:311–316. doi:10.2136/sssaj1981.03615995004500020017x
Hütsch, B.W. 2001. Methane oxidation in non-flooded soils as affected by crop production–invited paper. Eur. J. Agron. 14:237–260. doi:10.1016/S1161-0301(01)00110-1
Kessavalou, A., A.R. Mosier, J.W. Doran, R.A. Drijber, D.J. Lyon, and O. Heinemeyer. 1998. Fluxes of carbon dioxide, nitrous oxide, and methane in grass sod and winter wheat–fallow tillage management. J. Environ. Qual. 27:1094–1104. doi:10.2134/jeq1998.00472425002700050015x
Parkin, T.B., and R.T. Venterea. 2010. Sampling protocols. Chapter 3. Chamber-based Trace Gas Flux Measurements. In: R.F. Follet, editor, Sampling protocols. USDA. https://www.ars.usda.gov/ARSUserFiles/np212/Chapter%203.%20GRACEnet%20Trace%20Gas%20Sampling%20Protocols.pdf (accessed 30 Mar. 2017).
Plaza-Bonilla, D., C. Cantero-Martínez, J. Bareche, J.L. Arrúe, and J. Álvaro-Fuentes. 2014. Soil carbon dioxide and methane fluxes as affected by tillage and N fetilization in dryland condtions. Plant Soil 381:111–130. doi:10.1007/s11104-014-2115-8
Robertson, G.P., and P.M. Groffman. 2007. Nitrogen transformations. In: E.A. Paul, editor, Soil microbiology, ecology, and biochemistry. 3rd ed. Academic Press, New York. p. 341–364.
Sainju, U.P., J.D. Jabro, and W.B. Stevens. 2008. Soil carbon dioxide emission and carbon content as affected by irrigation, tillage, cropping system, and nitrogen fertilization. J. Environ. Qual. 37:98–106. doi:10.2134/jeq2006.0392
Snyder, C.S., T.W. Bruulsema, T.L. Jensen, and P.E. Fixen. 2009. Review of greenhouse gas emissions from crop production systems and fertilizer management effects. Agric. Ecosyst. Environ. 133:247–266. doi:10.1016/j.agee.2009.04.021
Solomon, S., D. Qin, M. Manning, Z. Chen, M. Marquis, K.B. Averyt, M. Tignor, et al., editors. 2007. Climate change 2007: The physical science basis. Contribution of Working Group I to the Fourth Assessment Report of the Intergovernmental Panel on Climate Change. Cambridge Univ. Press, Cambridge, UK.
Stanford, G., J.N. Carter, D.T. Westermann, and J.J. Meisinger. 1977. Residual nitrate and mineralizable soil nitrogen in relation to nitrogen uptake by irrigated sugarbeets. Agron. J. 69:303–308. doi:10.2134/agronj1977.00021962006900020025x
Sistani, K.R., M. Jn-Baptiste, N. Lovanh, and K.L. Cook. 2011. Atmospheric emissions of nitrous oxide, methane, and carbon dioxide from different nitrogen fertilizers. J. Environ. Qual. 40:1797–1805. doi:10.2134/jeq2011.0197
USEPA. 2016. Draft inventory of US greenhouse gas emissions and sinks: 1990–2014. EPA 430-R-16-002.USEPA, Washington, DC.
Venterea, R.T., A.D. Halvorson, N. Kitchen, M.A. Liebig, M.A. Cavigelli, S.J. Del Grosso, et al. 2012. Challenges and opportunities for mitigating nitrous oxide emissions from fertilized cropping systems. Front. Ecol. Environ 10:562–570. doi:10.1890/120062
Westermann, D.T., and S.E. Crothers. 1980. Measuring soil nitrogen mineralization under field conditions. Agron. J. 72:1009–1012. doi:10.2134/agronj1980.00021962007200060034x