soil aggregate and crust density prediction
TRANSCRIPT

DIVISION S-6 NOTES
SOIL AGGREGATE AND CRUST DENSITYPREDICTION
ALI SALEH*
AbstractAggregate and crust density measurements by existing methods are
usually time consuming and difficult. This study was conducted todevelop and verify a simple procedure to predict soil aggregate andcrust density from soil physical properties. A predictive equation basedon saturated water content and clay content of seven soils was devel-oped. Soil textures ranged from fine sandy loam to clay with organicmatter contents of 4.7 to 64.6 g kg-1. Bulk densities of aggregates andcrusts of 10 soils were predicted using the procedure developed in thisstudy and were measured by the clod method. Soil aggregate and crusttextures ranged from loamy fine sand to clay with organic mattercontent of 4.7 to 47.4 g kg-1. Predicted and measured aggregate den-sities had similar values. However, the predicted crust densities werelower than those measured. Results of this study indicate that theprocedure developed in this study can be used as a relatively simple,fast, and reliable technique to predict aggregate densities in similarsoils.
THE SOIL SURFACE plays an important role in soilwater and wind erosion. For instance, nonerodi-
ble soil aggregates often reduce soil erosion by shel-tering credible particles (Chepil, 1951). A soil crustcan reduce infiltration rates (Saleh and Hanks, 1989;Morin et al., 1989; Ben-Hur et al., 1987). For betterevaluation of the effects of aggregates and crusts, theirphysical and chemical characteristics must be known.
Bulk density (g cm-3) is an important physicalproperty of aggregates and crusts. Saleh and Hanks(1989) demonstrated that soil crusts with higher ^have lower infiltration rates. Most current methods ofmeasuring aggregate and crust density are time con-suming, expensive, or both. The clod method (Blakeand Hartge, 1986, p. 371-373) is among the mostaccepted methods for aggregate and crust density de-termination. Soil volume is determined by coating anaggregate or crust of a known weight with a water-repellent substance and weighing the sample in air andin a liquid of known density (such as water), makinguse of Archimedes' principle. Although the clod methodworks well, it takes considerable time. Haines (1923)developed a Hg displacement technique to measuresoil aggregate or crust density by calculating the dis-placed volume of water and air by replacing it withHg. Others, including Olson (1987) and Olsen andZobeck (1989), improved Haines's method by reduc-ing the intrusion of Hg into the intraaggregate porevolume of the soil sample. The Hg displacement methodrequires special equipment, considerable time, and atrained technician.
USDA-ARS, Conservation Systems Research Lab., P.O. Box 909,Big Spring, TX 79721-0900. Received 20 Feb. 1992. *Corre-sponding author.
Published in Soil Sci. Soc. Am. J. 57:524-526 (1993).
This study was conducted to develop a simple pro-cedure to predict soil aggregate and crust densities.
Methods and MaterialsIn the first part of this study, p,, and 0ms of seven soils were
determined. Selected physical and chemical properties and thelocations from which these soils were collected are presentedin Table 1 (Soils 1-7). Textures of these soils ranged fromfine sandy loam to clay. Particle-size distribution was mea-sured by the pipette method and organic matter by acid-di-chromate digestion (Soil Survey Staff, 1984). Each soil wasair dried, crushed, passed through a 2-mm sieve, and ovendried at 110 °C for 24 h before each test.
Dry soils first were compacted in a cylinder with a knownvolume at different densities and then were saturated frombelow for 0ms determination. Saturation in packed cores wasdetermined when a thin layer of water film formed on the soilsurface. This process would sometimes take up to 8 h, de-pending on the soil texture and compaction level. At least 18levels of Pb were determined for each soil. The natural logs ofthe measured densities were regressed on the natural logs ofthe 0ms and clay fraction of seven original soils. This was doneto generate a simple equation from which p,, could be pre-dicted.
In the second part of this study, aggregates of 10- to 25-mm diameter and crusts of 3- to 7-mm thickness from 10 soils(Soils 3-12, Table 1) that included five of the original sevensoils were collected and randomly divided in two groups. Soilcrust presence was determined visually. Soil textures rangedfrom fine sandy loam to clay. Selected physical and chemicalcharacteristics of these soils were obtained by procedures sim-ilar to those used for the seven original soils (Table 1). Eachgroup included 15 aggregate and 15 crust samples from eachsoil.
Bulk density of the first group of samples was determinedusing the equation developed in the first part of this study. Tomeasure 0ms, each soil aggregate or crust was wrapped in aporous aluminum foil and gradually saturated from below. Aprocedure similar to that used to determine when saturationoccurred in wetting packed cores was followed for aggregatesand crusts. However, it took considerably less time (up to 5min) for aggregates and crusts to saturate.
The density of the second set of samples was determined bythe clod method (Blake and Hartge, 1986, p. 371-373) Eachaggregate and crust was suspended by a thread, weighed, anddipped in saran solution until the sample became waterproof.The saran-coated samples were then weighed once in the airand once in water. Aggregate and crust densities were calcu-lated using
Pb = (where:
Pw
rspw + Wpa - [1]
density of water, g cm~3;oven-dry mass of sample, g;net mass of sample in the air, g;net mass of the sample and saran in the water, g;mass of saran coating in the air, g; andbulk density of the saran, g/cm3.
Abbreviations: p,,, bulk density; 0ms, saturated water content ona mass basis; AV> density of water; W^*, oven-dry mass of soil;W,,, net mass of soil in the air; Wpa, mass of saran coating in theair; ps, bulk density of the saran.
524
NOTES 525
Table 1. Selected physical and chemical characteristics of the soils used in this study
1
2
3
4
5
6
7
8
9
10
11
12
Soil series andlocation
Acuff fine sandy loamHoward County, TXBearden loamStevens County, MNBarnes clay loamPolk County, MNAmarillo fine sandy loamHoward County, TXAmarillo fine sandy loamHoward County, TXReagan silty clay loamReagan County, TXRoscoe clayHoward County, TXStellar silty loamDona Ana County, NMPortales fine sandy loamHoward County, TXAmarillo loamy fine sandHoward County, TXDrake fine sandy loamHoward County, TXTalco silt loamTitus County, TX
Sand(2-0.05
mm)
74.1
39.9
26.3
75.8
67.1
22.0
17.6
25.3
69.5
79.8
77.3
29.3
Silt(0.05-0.002mm)
——— % ——13.7
29.6
42.1
12.9
18.1
48.6
33.2
51.9
17.6
11.7
11.5
60.1
Clay(< 0.002
mm)
12.2
30.5
31.6
11.3
14.8
29.4
49.2
22.8
12.9
8.5
11.2
10.6
Organicmatter
concen-tration
gkg-1
8.6
64.6
47.4
5.6
4.7
20.2
22.3
19.6
3.2
3.4
5.7
8.5
Taxonomicclassification
fine-loamy, mixed, thermic Aridic Paleustoll
fine-silty, frigid Aerie Calciustoll
fine-loamy, mixed, thermic Udic Haploboroll
fine-loamy, mixed, thermic Ardic Paleustalf
fine-loamy, mixed, thermic Aridic Paleustalf
fine-silty, mixed, thermic Ustollic Calciorthid
fine, montmorillonitic, thermic Typic Pellustert
fine, mixed, thermic Ustollic Haplargid
fine-loamy, mixed, thermic Aridic Calciustoll
fine-loamy, mixed, thermic Aridic Paleustalf
fine-loamy, mixed (calcareous), thermic TypicUstorthentfine-silty, mixed, thermic Aerie Glossaqualf
1.80T
1.601
1.40-
1.20-
1.00-
0.800.20
•>-*»_» Soil 4°.P_QJ1P Soil 1ooooo Soil 5• •••• Soil 6• •-•.•• Soil 2•*.*_£<L<r Soil 3
-Q$ Soil 7
0.30i i i 1 1 1 i0.40 0.50 0.60 0.70
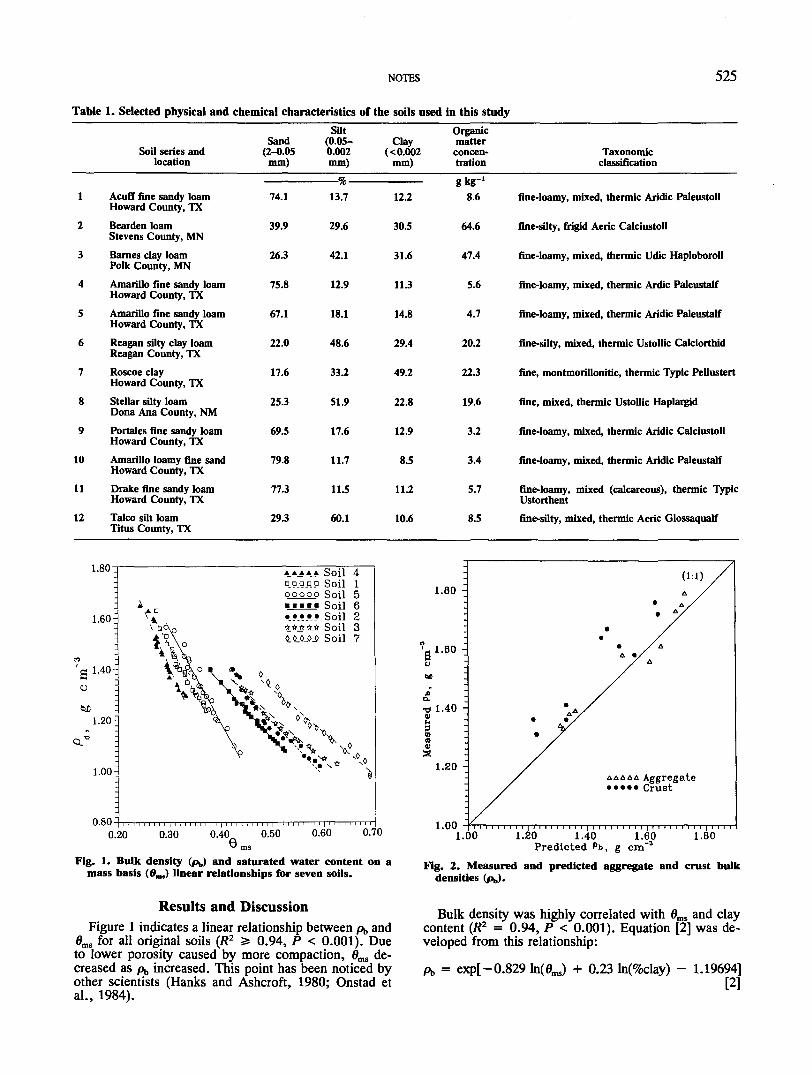
Fig. 1. Bulk density (p,,) and saturated water content on amass basis (0m,) linear relationships for seven soils.
1.80 -
1.40 -
1.20 -
1.00
(1:1)
Aggregate••••• Crust
1.00 1.20 1.40 1.60Predicted Pb, g cm"3
1.80
Fig. 2. Measured and predicted aggregate and crust bulkdensities (pb).
Results and DiscussionFigure 1 indicates a linear relationship between p,, and
0ms for all original soils (R2 ^ 0.94, P < 0.001). Dueto lower porosity caused by more compaction, 0ms de-creased as p,, increased. This point has been noticed byother scientists (Hanks and Ashcroft, 1980; Onstad etal., 1984).
Bulk density was highly correlated with 0ms and claycontent (R2 = 0.94, P < 0.001). Equation [2] was de-veloped from this relationship:
A, = exp[- 0.829^1(0^) + 0.23 ln(%clay) - 1.19694][2]

526 SOIL SCI. SOC. AM. J., VOL. 57, MARCH-APRIL 1993
Table 2. Average saturated water content on a mass basis (0mJ, bulk density estimated by Eq. [1] (bl), and bulk density measuredby the clod method (62) of aggregates and crusts.
Soilf
1012H4195867
»™ko ku-'Kg "g
0.230.330.250.240.270.290.260.390.420.50
Aggregatebl
——————— g cm-3—1.70(0.09)$1.32(0.03)1.65(0.05)1.73(0.09)1.61(0.08)1.52(0.15)1.72(0.06)1.36(0.12)1.34(0.08)1.31(0.09)
62
1.73(0.06)1.33(0.01)1.61(0.10)1.79(0.10)1.56(0.18)1.58(0.02)1.75(0.12)1.39(0.14)1.38(0.04)1.34(0.08)
»™N5 Ke
0.240.360.290.260.290.280.320.430.430.49
Crust61
—————— g cm-3 -1.64(0.10)1.22(0.09)1.47(0.08)1.63(0.11)1.51(0.10)1.56(0.12)1.45(0.15)1.23(0.09)1.33(0.05)1.33(0.11)
62
1.72(0.07)1.36(0.07)1.67(0.04)1.76(0.09)1.61(0.08)1.58(0.10)1.64(0.13)1.31(0.05)1.41(0.07)1.36(0.90)
fSee Table 1 for soil descriptions.^Standard deviation among 10 replications shown in parentheses
where:
0ms = mass-basis saturation water content, kg kg"1;and
%clay = clay fraction of the soil, %.
Table 2 and Fig. 2 show that the average aggregatedensities obtained from Eq. [1] are very close to thosepredicted using Eq. [2]. Small standard deviations in-dicate low variation among replicates (Table 2).
However, the results of predicted and calculated crustdensities were not as close. Table 2 and Fig. 2 show thatpredicted crust densities were lower than those mea-sured. Soil crusts are often thin and fragile, making itdifficult to measure 0ms. This may cause an inaccurateOms measurement, which ultimately influences the crustdensity prediction by Eq. [2]. This emphasizes the im-portance of correct measurement of 0ms when Eq. [2] isused. On the other hand, soil crusts are not as uniformlyacked as aggregates. This could be a reason why Eq.
cannot predict the crust density as well as for aggre-gates. Tisdall (1951) evaluated different method of de-termining the density of soils, and concluded that theclod method usually gives higher bulk density valuesthan other methods. One reason is that the clod methoddoes not take the interclod spaces into account. Table 2and Fig. 2 show that the aggregate densities obtained bythe clod method are also slightly (up to 0.06 g m-')higher than those estimated by Eq. [2] for most soils.
Our experiences was that the suggested procedure tookabout one-third of the time that the clod method took.
Summary and ConclusionA predictive equation was developed from regression
of p(, on 0ms and clay content of seven soils (R2 = 0.94,P < 0.001). Aggregate and crust densities of 10 soilswere predicted using this equation and measured by the
pac[2]
clod method (Blake and Hartge, 1986). The predictedand measured values for aggregate densities were ex-tremely close. However, predicted crust densities werelower than those measured by the clod method. This wasprobably due to the tendency of the suggested procedureto underestimate crust densities or the tendency of theclod method to overestimate crust densities (Tisdall, 1951).
The results of this study suggest that the proceduredeveloped in this study can provide an easy, fast, andreliable technique to predict bulk density of aggregatesin a mineral soil.