softwood biomass to ethanol feasibility study - nrel · softwood biomass to ethanol feasibility...
TRANSCRIPT
August 2004 • NREL/SR-510-27310
Merrick & Company Aurora, Colorado
Softwood Biomass to Ethanol Feasibility Study Final Report: June 14, 1999
National Renewable Energy Laboratory 1617 Cole Boulevard, Golden, Colorado 80401-3393 303-275-3000 • www.nrel.gov
Operated for the U.S. Department of Energy Office of Energy Efficiency and Renewable Energy by Midwest Research Institute • Battelle
Contract No. DE-AC36-99-GO10337
August 2004 • NREL/SR-510-27310
Softwood Biomass to Ethanol Feasibility Study Final Report: June 14, 1999
Merrick & Company Aurora, Colorado
NREL Technical Monitor: K. Kadam Prepared under Subcontract No. AXE-8-18020-01
National Renewable Energy Laboratory 1617 Cole Boulevard, Golden, Colorado 80401-3393 303-275-3000 • www.nrel.gov
Operated for the U.S. Department of Energy Office of Energy Efficiency and Renewable Energy by Midwest Research Institute • Battelle
Contract No. DE-AC36-99-GO10337
This publication was reproduced from the best available copy Submitted by the subcontractor and received no editorial review at NREL
NOTICE
This report was prepared as an account of work sponsored by an agency of the United States government. Neither the United States government nor any agency thereof, nor any of their employees, makes any warranty, express or implied, or assumes any legal liability or responsibility for the accuracy, completeness, or usefulness of any information, apparatus, product, or process disclosed, or represents that its use would not infringe privately owned rights. Reference herein to any specific commercial product, process, or service by trade name, trademark, manufacturer, or otherwise does not necessarily constitute or imply its endorsement, recommendation, or favoring by the United States government or any agency thereof. The views and opinions of authors expressed herein do not necessarily state or reflect those of the United States government or any agency thereof.
Available electronically at http://www.osti.gov/bridge
Available for a processing fee to U.S. Department of Energy and its contractors, in paper, from:
U.S. Department of Energy Office of Scientific and Technical Information P.O. Box 62 Oak Ridge, TN 37831-0062 phone: 865.576.8401 fax: 865.576.5728 email: mailto:[email protected]
Available for sale to the public, in paper, from: U.S. Department of Commerce National Technical Information Service 5285 Port Royal Road Springfield, VA 22161 phone: 800.553.6847 fax: 703.605.6900 email: [email protected] online ordering: http://www.ntis.gov/ordering.htm
Printed on paper containing at least 50% wastepaper, including 20% postconsumer waste
Acknowledgments
This work was funded by the Bioconversion Element of the office of Fuels Development of the U S . Department of Energy. As indicated below, this was a team effort with many individuals contributing to the endeavor.
Overall Pro i ect Management
Project Manager: Fran Femaro, Merrick & Co.
Technical Monitor: Kiran Kadam, National Renewable Energy Laboratory (NREL)
Team Compositions
Compositions of teams making a contribution to various parts of the report are listed below:
Merrick & Co. (2450 S. Peoria Street, Aurora, CO 80014) Fran Ferraro, Mike Kraft, Kurt Penka (Simons Engineering-a consultant to Merrick), Jim Sharpe, and Dick Voiles
NREL ( I 4 1 7 Cole Boulevard, Golden, CO 8040 1 -3 3 93)
Softwood Team Kiran Kadam, Fred Keller, Quang Nguyen, Fannie Posey-Eddy, and Me1 Tucker
Process Engineering Team Andy Aden and Bob Wooley
Industrial Partnership Development Team Mark Yancey
Wheelabrator Martell Inc. (Highway 49 & Ridge Road, Martell, CA 95654) Eric Selya
3
TABLE OF CONTENTS
Volume One
1. Executive Summary
2. Introduction a. Work Scope b. Assembly of Work Products C. Engineering d. Estimates e. Future Work
3. Process Description a. Block Flow Diagram b. C. 1 st Stage Prehydrolysis d. 1 st Stage Hydrolysis e. f. Znd Stage Prehydrolysis g. Znd Stage Hydrolysis h. 1.
j. Znd Stage Fermentation k. 1. Dehydration m. n. Boiler and Power Generation
Wood Chip Preparation and Feed
lst Stage Flash and Separation
2nd Stage Flash and Separation 1 st Stage Neutralization and Fermentation
Dis t i 11 at ion
Lignin Separation and Water Handling
4. Capital and Operating Cost a. Summary b. Pro Forma including:
Capital Cost Operating Cost Economic analysis
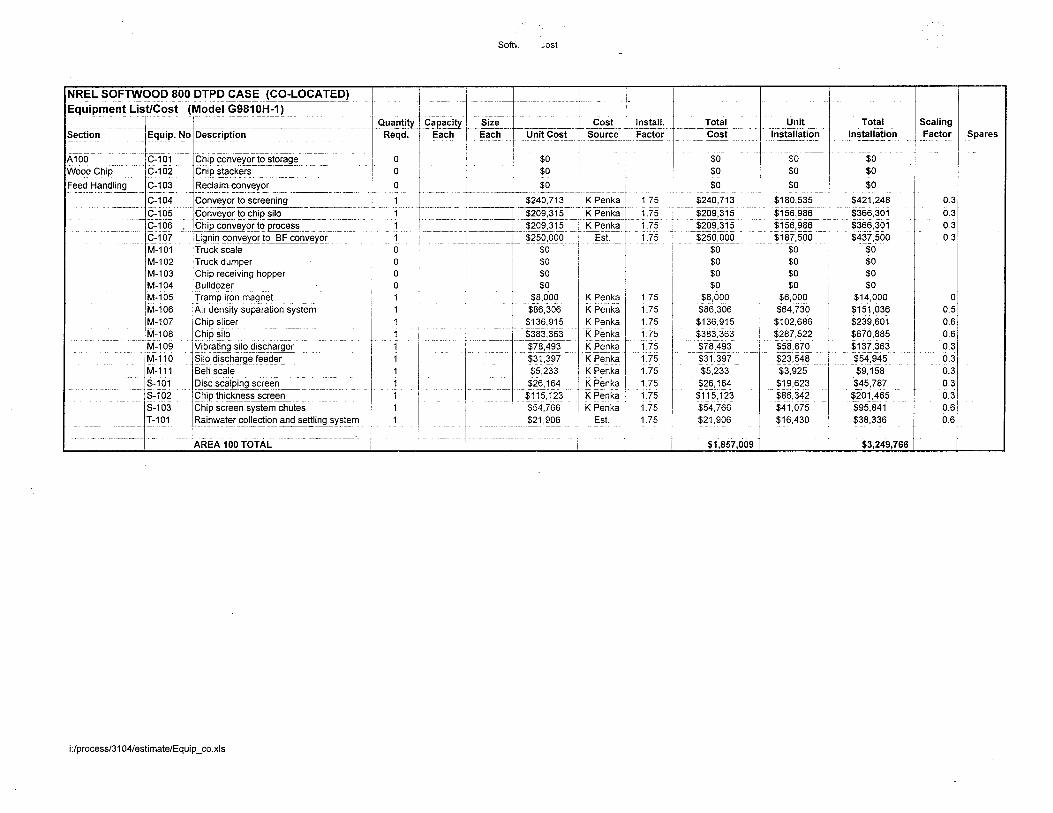
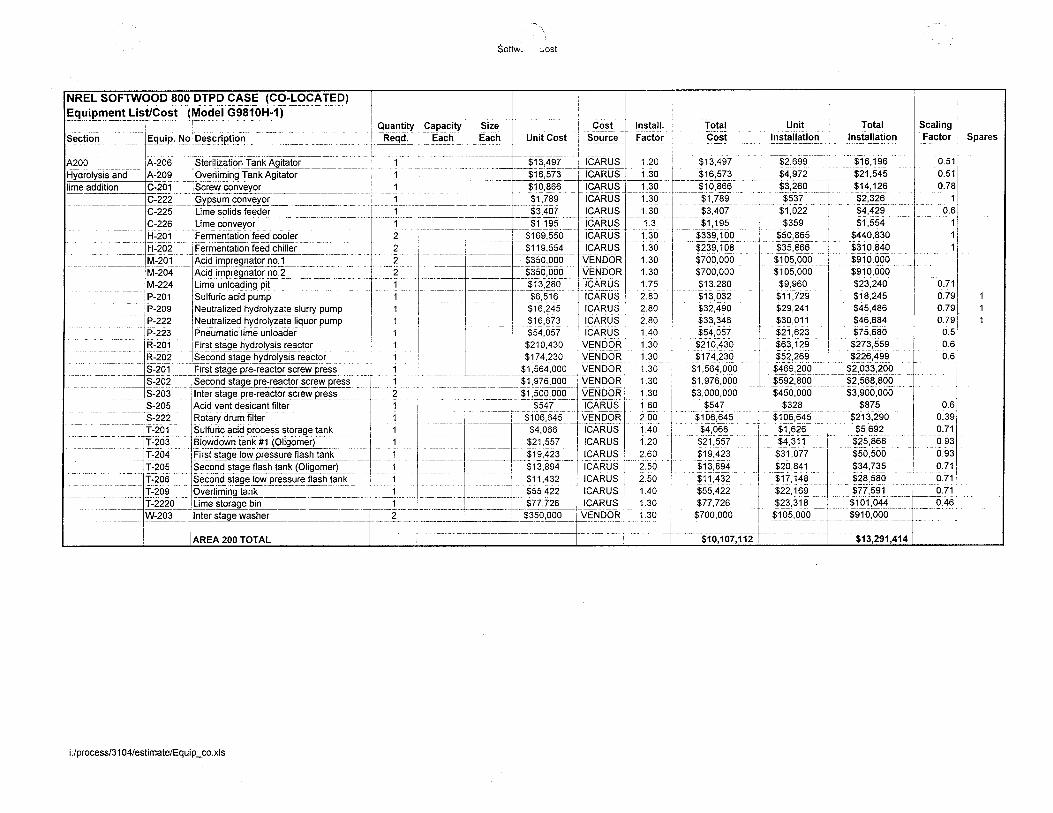
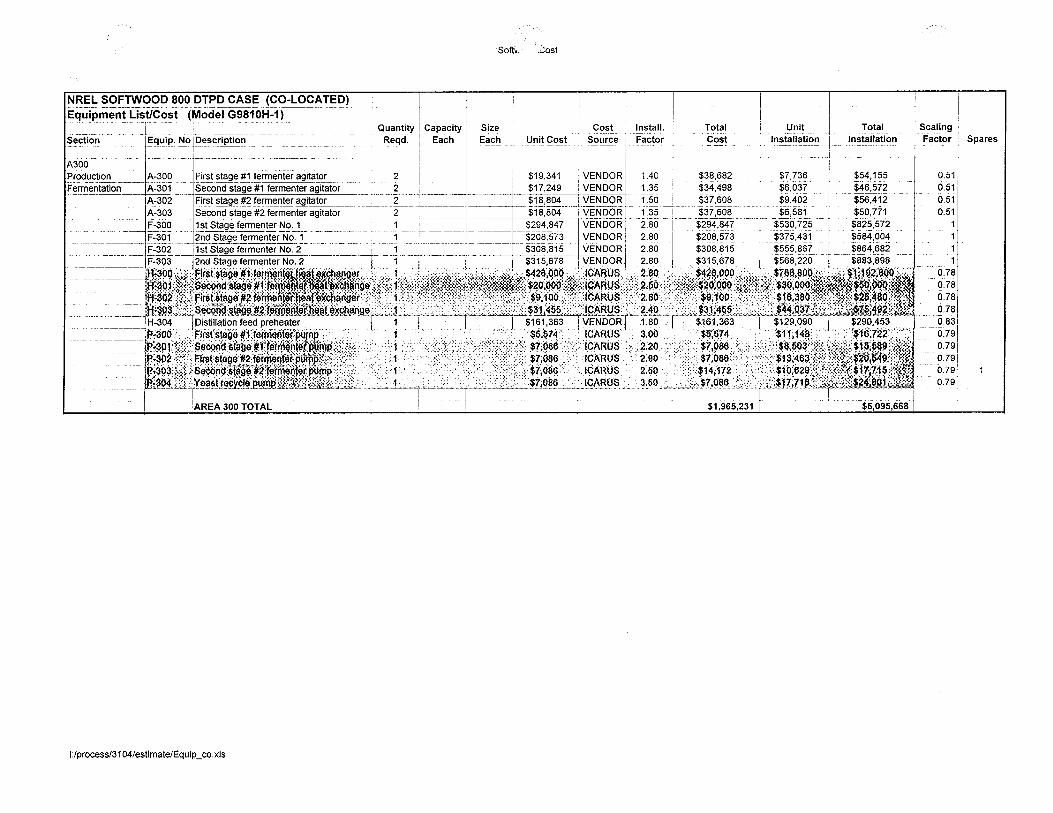
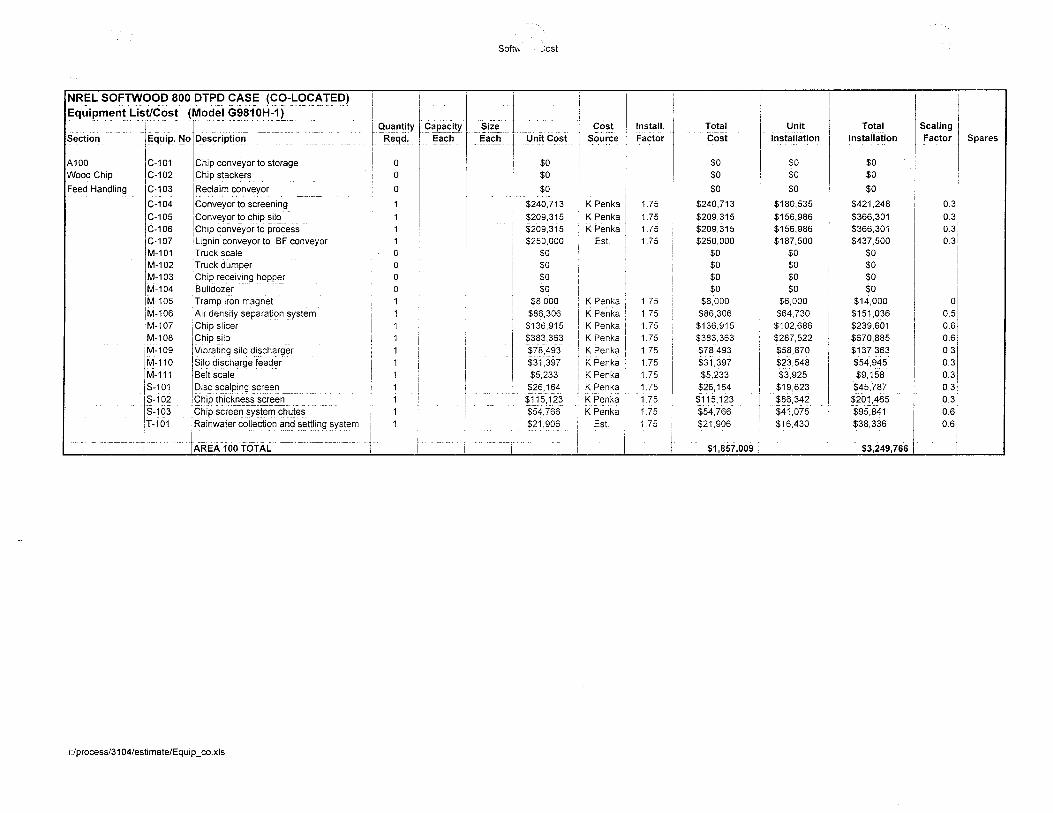
Equipment List with Costs including: Unit equipment costs
Installation factors
c.
d Scaling factors
4
Appendices:
A. Heat Optimization
B. Trip Reports 1. High Plains C o p , York, NE 2. Sierra Pacific, Martell, CA
C. Plot Plans and Process Flow Diagrams
D. Delta-T Report
5
I. EXECUTIVE SUMMARY
Merrick & Company has evaluated the economic potential for a Softwood Biomass to Ethanol Facility. A conceptual ethanol plant located in Martell California is economically attractive, particularly when co-located with an existing power generating facility. The plant, sized for an expected feed capacity of 800 dry tons per day converts the carbohydrates in forest product waste materials to ethanol and uses the lignin and residual carbohydrates to generate steam and elect r i city .
This report documents the results of design and project evaluation work sponsored by the National Renewable Energy Laboratory (NREL) and performed by Merrick & Company, Architects and Engineers (Merrick), between March, 1998 and March, 1999. This project is a continuation of an effort begun in 1998 to study various aspects of ethanol related projects. Merrick has used NREL data and guidance to further develop cost estimates for the two stage dilute acid hydrolysis process for the production of ethanol from softwood.
The Softwood to Ethanol Feasibility Study discussed in this report is an extension of previous, generic, softwood to ethanol studies. The co-located case is applied to a specific site owned by Wheelabrator near Martell, California. A large amount of potential feed material is available in the area and the site contains an existing solid waste fired boiler and power generating equipment.
The evaluation of a specific site allowed better definition of a realistic installation and project. Staff consultations and site visits led to the selection of the portions of the Martell site for evaluation and the determination of which equipment was available and suitable.
Project Evaluation
The work accomplished during this project includes: process designs, heat and material balances, process flow diagrams, equipment selection, , capital and operating cost estimates, and market assessments for the ethanol product. The specific co-located plant at Martell was evaluated to identify specific modifications required to the equipment to fit the existing plant requirements. Similar processes developed for other types of biomass to ethanol conversion were relied upon for reference and guidance. Also, plants were visited to witness similar operations and the equipment selected for similar service. Resulting economic analyses, detailed in the remaining sections of this report, conclude that the conceptual ethanol plant at Martell is economically attractive.
Process flow diagrams, feed composition and preparation, and each of the unit operations, from 1 st stage prehydrolysis through dehydration of the ethanol/water azeotrope, are described in detail in the report.
6
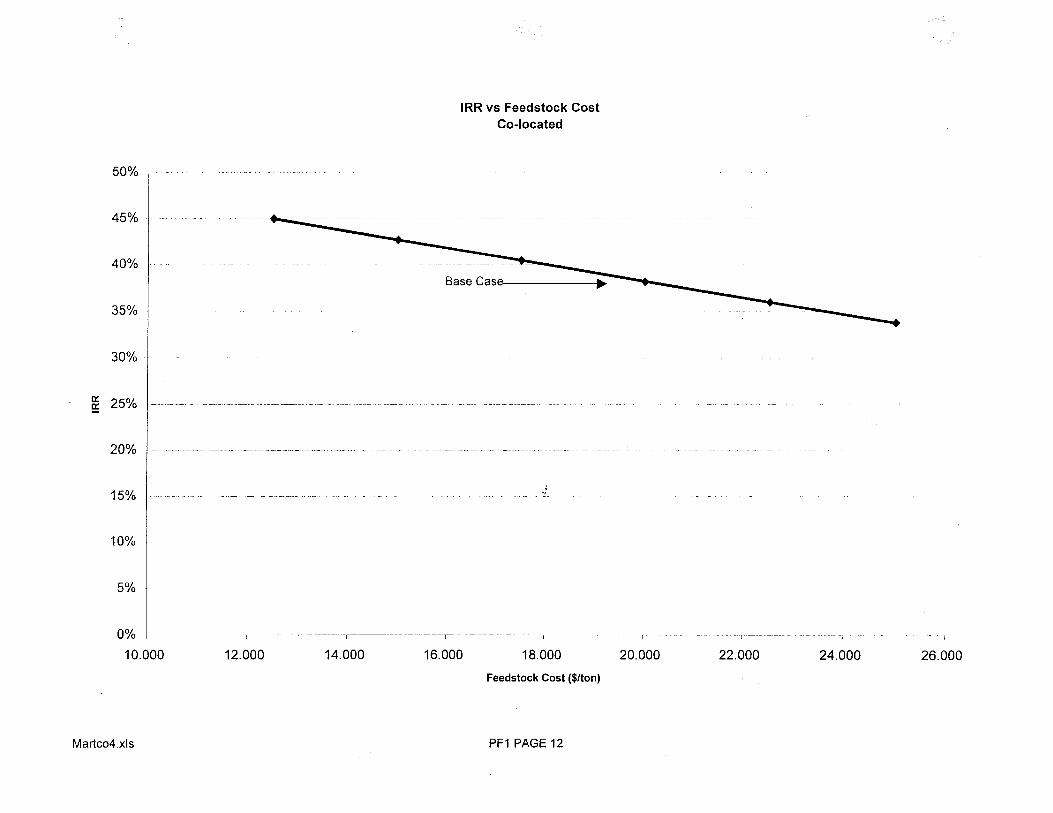
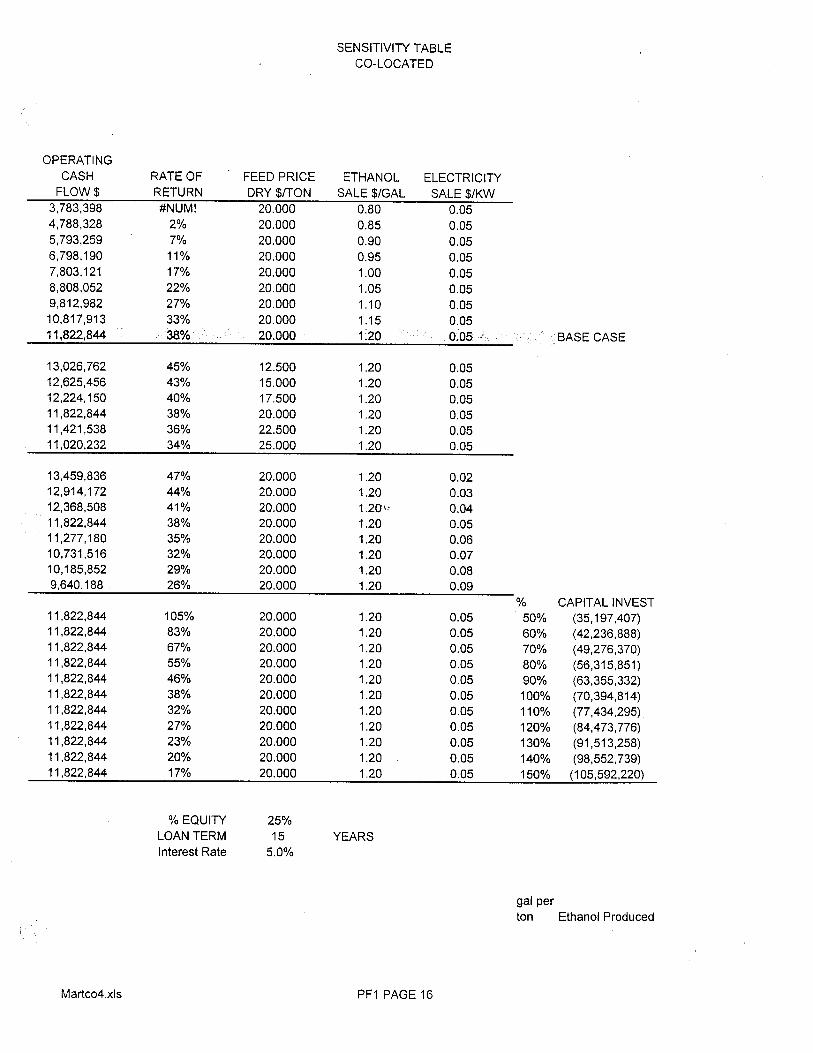
Both capital and operating/maintenance costs were developed for the Martell site. The costs and anticipated revenues are presented as pro forma financial statements, with accompanying sensitivity analyses for varying feedstock prices.
Additionally, capital and operating cost estimates were developed for a stand- alone, green field plant utilizing the same feed stock. The results are reported for Comparison purposes.
Conclusions and Recommendations
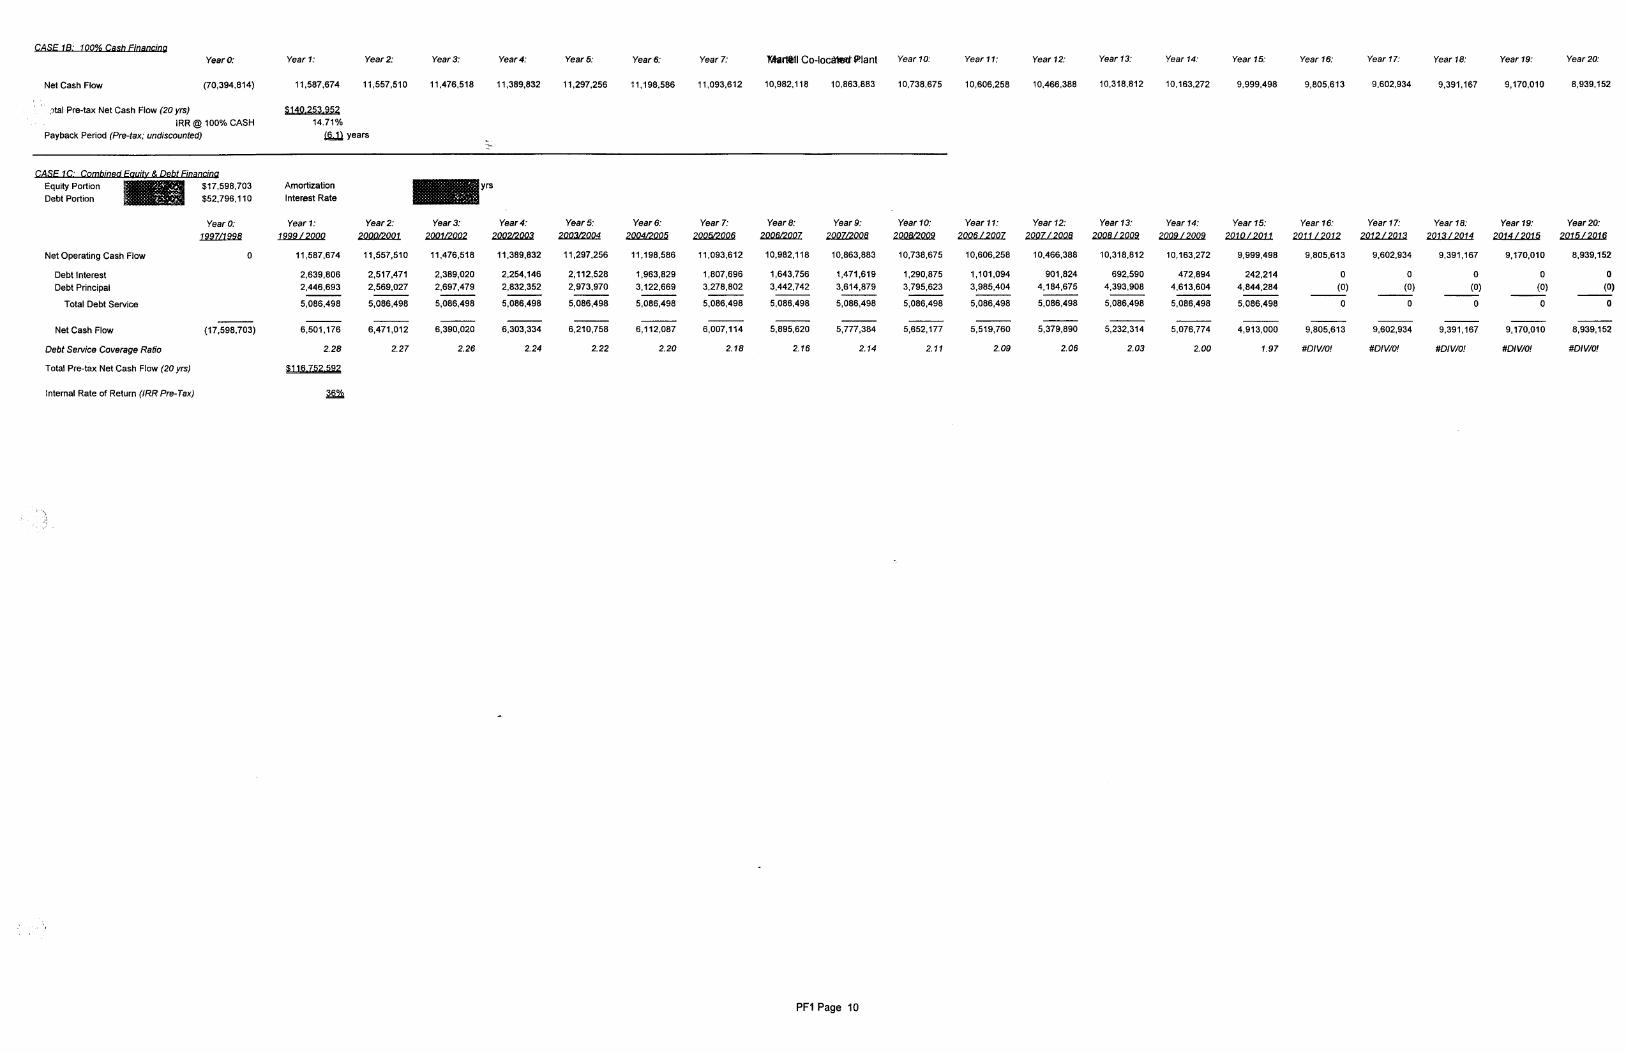
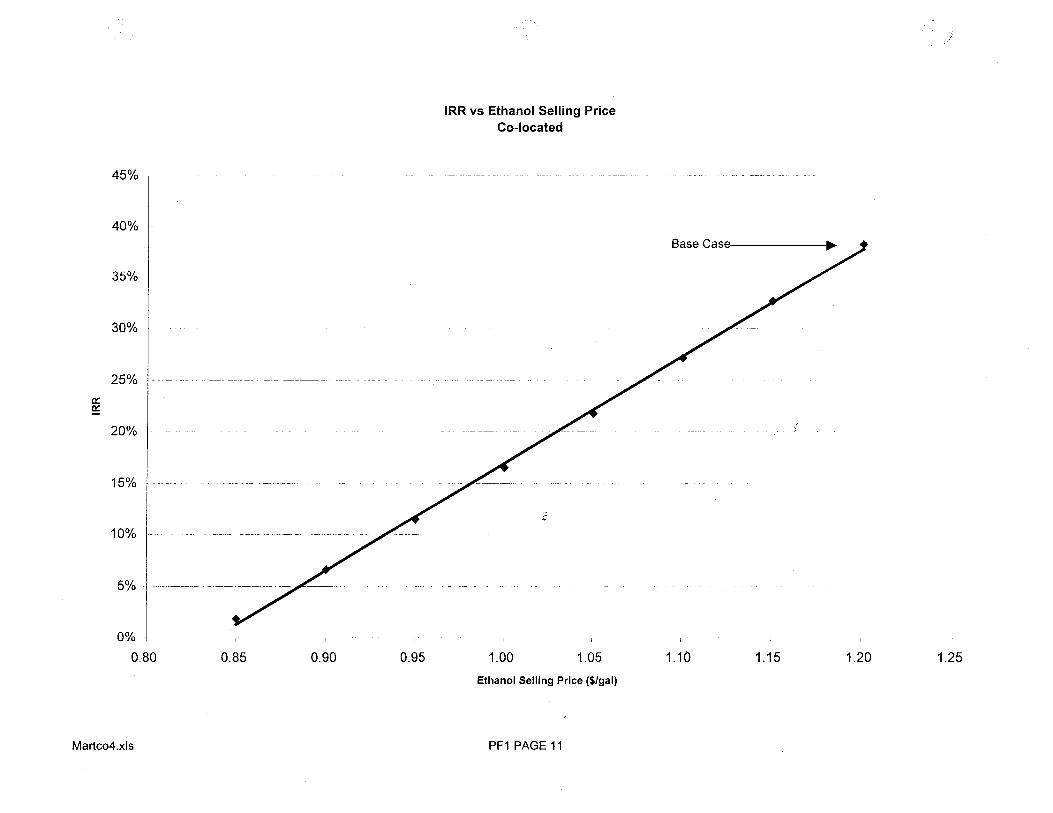
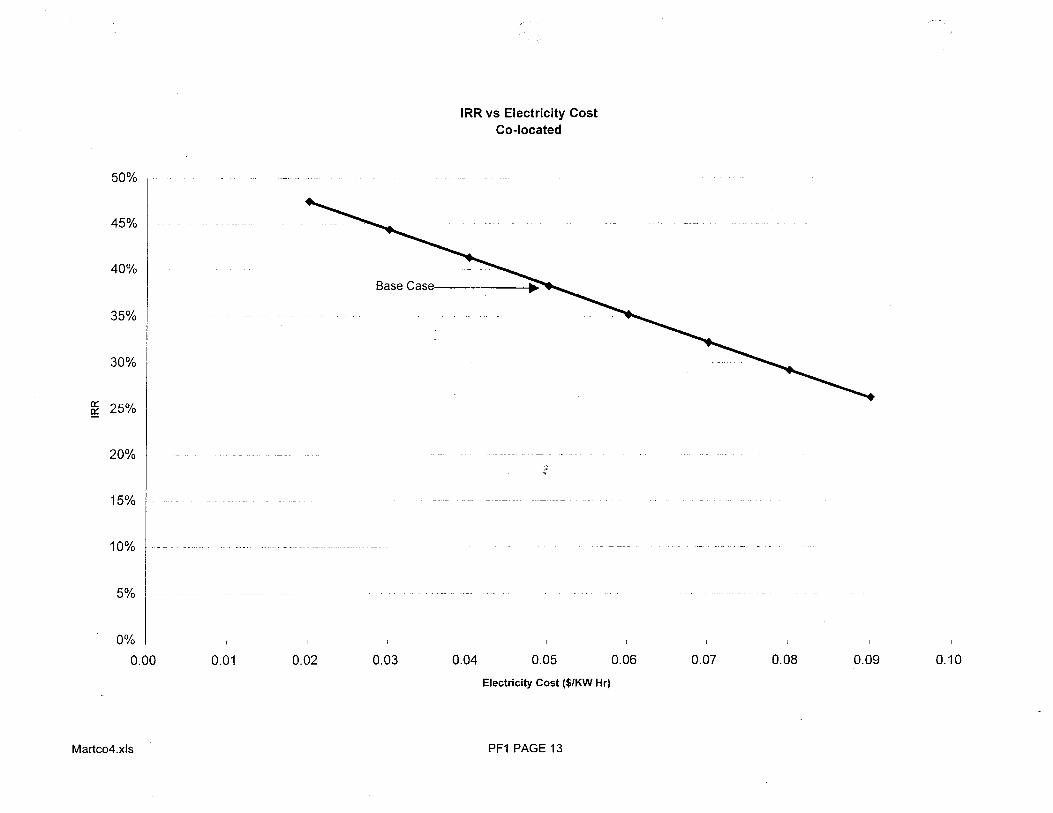
A co-located softwood to ethanol plant in the Martell area is an economically attractive concept. The plant will be constructed for a total capital investment of approximately $65 million. The economics are based on a total ethanol selling price of $1.20 per gallon, after incorporating the various tax credits and discounts associated with long term market relationships. To minimize market risk, long-term contractual relationships must be established regarding the sale of the ethanol. This appears to be reasonable.
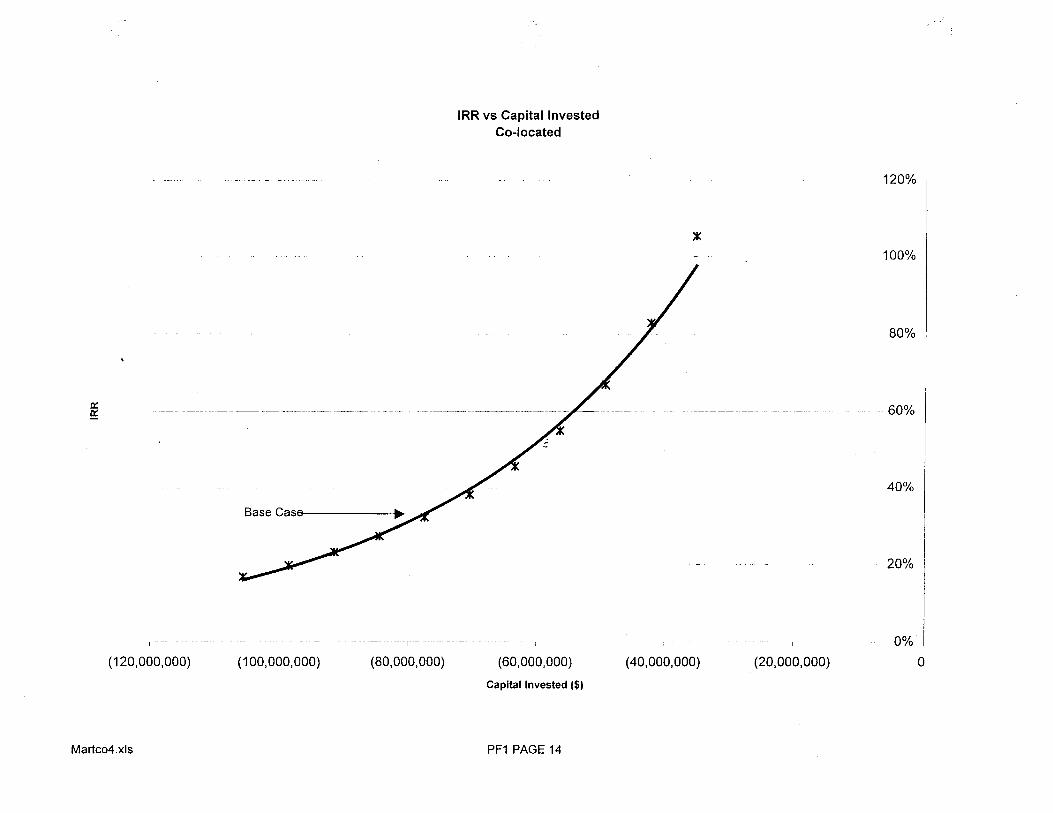
Incorporating depreciation results in annual project net revenues of approximately $1 I .5 million. The resulting before-tax internal rate of return (IRR) is about 36% at 25% equity and 5% loan rate; the loan rate is lower than normal because of a subsidy available from the state of California.
Merrick recommends the following “next steps” in the development of this project:
Establish a feedstock supply plan, exploring feedstock contracts and residue contracts. Establish an owner/operator organization for the ethanol facility to carry out further project development. Establish an updated project specification including more detailed and accurate feedstock composition and more definitive reuse of existing facilities. Update the project economic analysis: and Establish the financial basis regarding the project to ensure the economic evaluation is reasonable; and Set up market relationships that establish a contract basis for ethanol sales; and Confirm the utility cost to ensure the long term viability.
7
2. INTRODUCTION
a. SCOPE OF WOFtK This report covers work performed during the period of May, 1998 through March, 1999. The objective of this work was to produce process designs, heat & material balances, process flow diagrams and capital & operating costs for two biomass to ethanol conversion plants. The biomass is assumed to be softwood forest thinning s.
One plant is stand-alone. That is, the lignin produced in the process is burned in a boiler which is a part of the plant design and produces the necessary power for the plant and sells excess power to the local grid. The cost of the boiler and turbine generator set are included in the cost estimate, as is the operating cost for this equipment. The boiler and turbine generator set are specifically sized to accommodate the lignin produced by the conversion plant.
The other plant considered is a plant located next to an existing Wheelabrator boiler and power generation facility that could easily be made capable of burning the lignin produced in the conversion process. The existing plant’s boiler and generators are assumed to be adequate for burning the lignin residue. The existing forest waste feed system is partially diverted through the ethanol plant and returned as lignin residue to be mixed with the remaining forest waste feed stream. The capital and operating cost of the boiler and generator are not included in the estimate.
Additionally, the work scope included revising ASPEN PLUS models fkom previous NREL ethanol plant designs to conform with the softwood forest waste to ethanol designs. NREL developed the experimental data using softwood forest thinnings fiom the Quincy, CA area.
b. ASSEMBLY OF WORK PRODUCTS This report collects the work of several organizations and individuals into coherent designs and cost estimates. Primary is the NREL work that established the basis and provided general processing methods.
Contributing organizations and individuals were: Ethanol handling and distillation - Fred Varani Water treating and feed water treating - Bob Hamilton Fermentation and associated processing - Joe Ruocco Solids conveying and handling - Kurt Penka Materials of construction - Bruce Craig Aspen Plus simulation - Vicky Putsche Heavy industrial practices and practicality - Merrick & Company
8
Merrick & Company coordinated the overall effort subject to NREL review and direction.
c. ENGINEERING Based on the information and guidance supplied by MEL, a process was modeled for the conversion of softwood biomass to ethanol.
NREL provided a block flow diagram of the previous process model. The new process development areas, prehydrolysis through fermentation were developed by NREL with Heavy Industrial (equipment selection and process heat integration) experience input by Memck. NREL fbrnished Updated Process Flow Diagrams and an ASPEN PLUS model for the plant. The process areas other than hydrolysis and fermentation were used “as is” from the previous model.
Within this framework various alternatives were considered and appropriate selections were made. For example three large, decanting centrihges (beer column bottoms centrifbge 5-60 1) were selected over multiple small centrifbges because it was felt that the maintenance and operating ease were optimized. In many cases several types of equipment could feasibly perform the necessary fbnctisn and decisions had to be taken as to the type of equipment to be used for the estimate basis. Reliability and proven performance in sirdar service were considered the fbndamental criteria for equipment selection with cost, ease of operation and similar factors also considered.
Similar processes developed for other types of biomass to ethanol conversion were relied upon for reference and guidance. Also, plants were visited to witness similar operations (Please see the trip reports in the appendix).
Equipment reliability was considered very important throughout the process development. The startup and operation of any first generation plant is extremely difficult and subject to schedule delays. If equipment is selected which has been proven in similar service, weeks of time can be saved in achieving design flow rates.
Similar thinking was applied to the overall plant efficiency. It is clearly necessary to demonstrate optimized plant efficiency in the design so that the economics will truly reflect achievable results. But even here it was felt that plant operability and reliability were paramount. If, for example, heat integration is taken to its limits the plant start up sequence may become cumbersome. Also, exchanger design might push the experience limits of manufacturers. A balance of efficiency and practical design was pursued in process development.
9
Considerable process evolution occurred in the chip washing, acid impregnation and hydrolysis area during the course of the project. This report includes the cost for hydrolysis equipment supplied in NREL Report TP-580-26157 [by Wooley, R., M. Ruth, J. Sheehan, H. Majdeski and A. Galvez (1999). Lignocellulosic Biomass to Ethanol Process Design and Economics, Utilizing Co-current Dilute Acid Prehydrolysis and Enzymatic Hydrolysis: Current and Futuristic Scenarios., National Renewable Energy Laboratory, Golden, Colorado.], and specific equipment pricing gathered by Merrick (see attached back-up data).
The plant design is based on 800 dtpd of biomass feed. Scaling of this design to other rates is practical if the rate is not too far different from the base rate. As the difference increases the associated risk of estimate inaccuracy increases. However, since the design is for commercial operation using equipment within the manufacturer’s norrnal range of supply, the scaling risk is not exorbitant. Principal is the risk that a second (parallel) train of equipment will need to be added in some areas of the plant as the feed rate increases beyond the normal equipment size. The most appropriate equation for the scaling of costs to different throughputs was input to the estimated cost on an equipment-service by equipment-service basis based on flow rates provided by the Aspen PlusTM model.
When an appropriate site is located, firm price equipment quotations should be obtained to confirm the current estimated pricing.
d. COST ESTIMATES
Estimates for the equipment are based on selected vendor quotations and scaled equipment costs from previous plant models. The previous Aspen Plu+ plant models were a compilation of vendor quotations (for more specialized and complex equipment), and the ICARUS Process Evaluator program estimates (for common types of equipment, i.e., pumps, agitators, conveyors). The Aspen PlusTM model determines the flow rates of the various process flow streams. The cost of the equipment is determined using a selected scaling stream mass flow rate. Scaling exponents are selected for equipment and the scaled cost is calculated using an NREL developed spreadsheet.
Section 4 contains complete pro formas for both the co-located and stand alone cases. Co-location has very decided cost advantages both in capital and operating costs.
10
e. FUTUREWORK
During the course of the investigation many items were encountered which deserve further definition and evaluation. Among the most important of those are:
The means of physically moving a slurry of acid impregnated wood chips and water into the hydrolyzers should be evaluated further. Although there are manufacturers who will design a screw press to do this, the hydrolyzer pressure must be held by the plug of moist solids in the barrel of the press. One manufacturer indicated that the liabilities involved with a plug failure are too great and they will not manufacture this equipment item. Other manufacturers will include a blast shield around the press to deflect any sudden pressure releases. It is felt that a system similar to an air lock system but using steam rather than compressed air may have safety and reliability advantages while still sufficiently approximating a continuous flow system. Similar digester feeders are currently used in the paper and pulp industries with good results so this is a workable system that needs further study. NREL is currently investigating this operation and any modifications necessary will be incorporated in future designs.
Simplification of the second stage hydrolysis equipment may be possible. In- line steam injection (steam gun), followed by a holding tank for residence time, may possibly replace the expensive second stage hydrolyzer. Heat distribution through the slurry is a potential problem.
Consideration should be given to other potential host sites for a co-located plant.
The transport of lignin from the centrifuges to the combustion chamber is deserving of further work as it is not yet defined in detail. One thought was to mix the wet lignin with wood chips so that the dewatering screw presses would be more effective.
The cost estimate includes a chilled water system allowing fermentor operation at 30°C (86°F) even on hot summer days. A benefit evaluation of this system should be done to see if the few weeks of use each year justifies its cost.
11
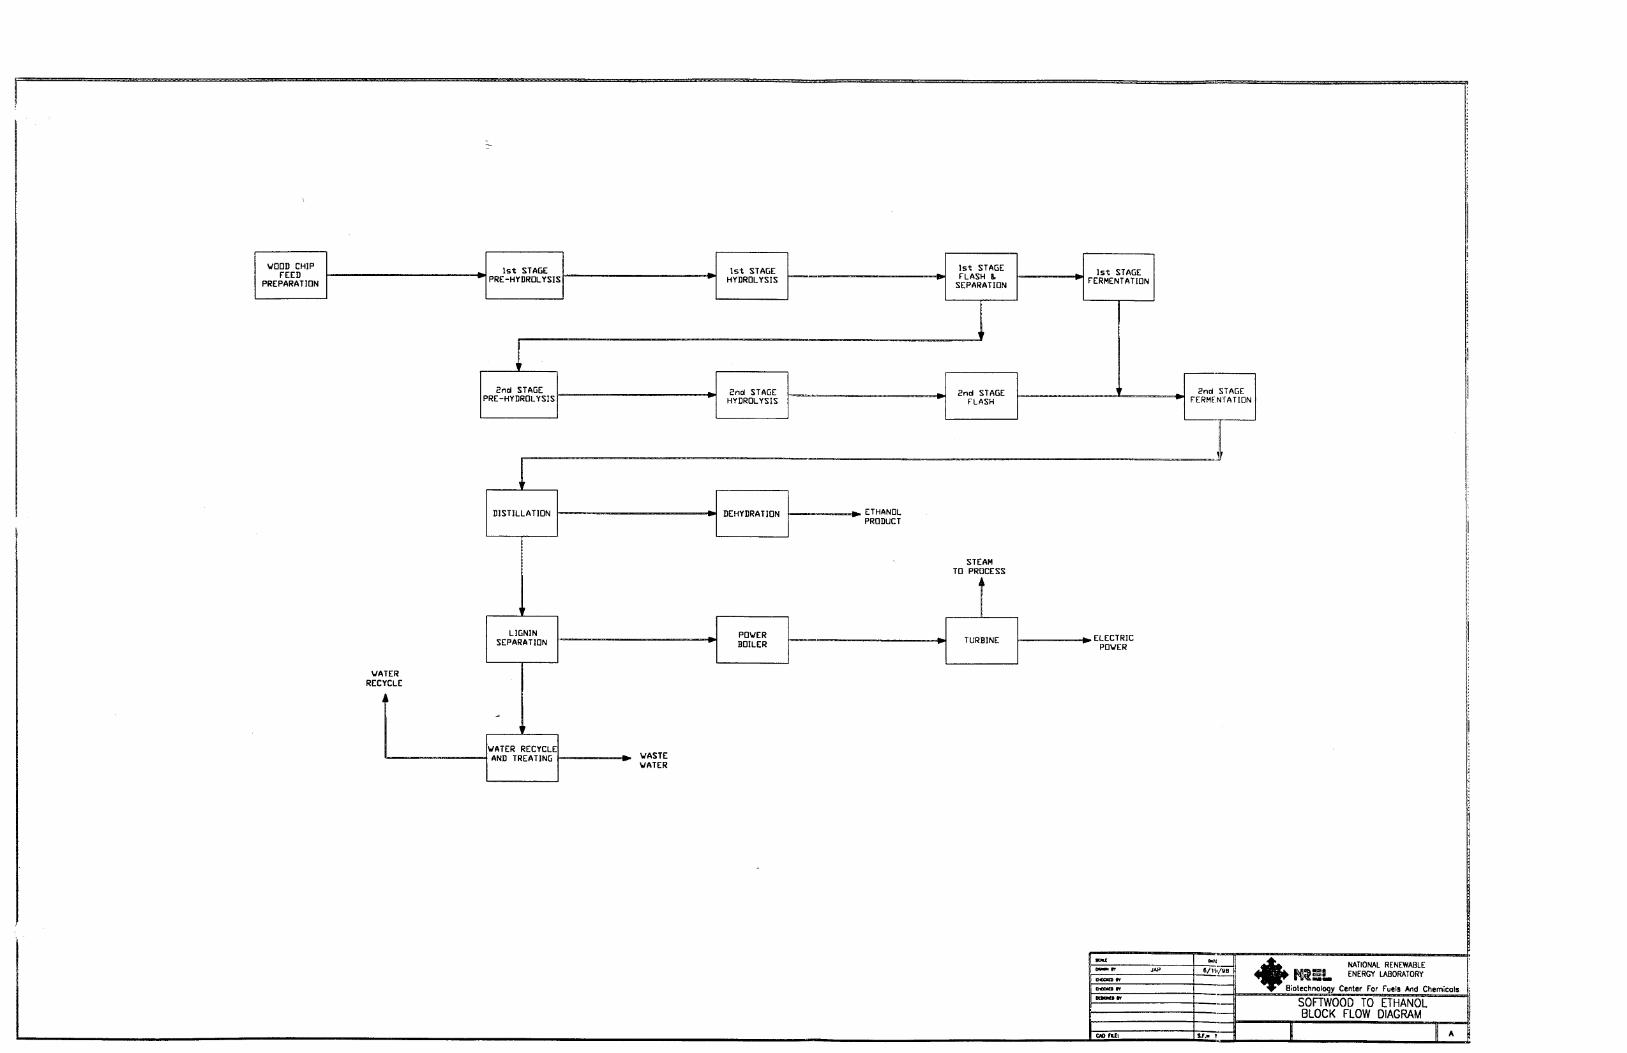
3. PROCESS DESCRIPTION
a. BLOCK FLOW DIAGRAM Following this section is a block flow diagram which illustrates the major processing steps and flow paths in the plant. It may be a usefhl reference drawing, along with the Process Flow Diagrams, when reading the process description.
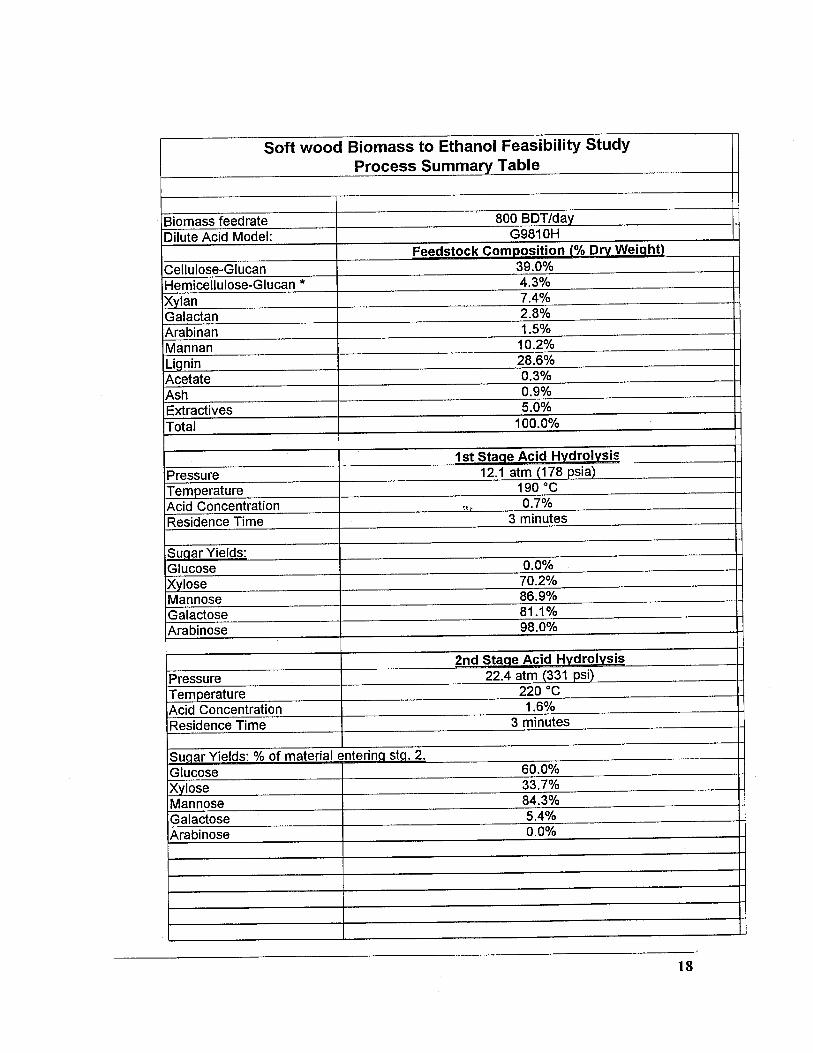
b. WOOD CHIP PREPARATION The selected design feed rate for the plant is 800 dtpd softwood biomass. The design feed is milled wood chips, generally with a 1/2 inch maximum dimension but containing some slivers that are 2 to 3 inches long.
Wood chips arrive at the site by truck and semi-trailer. Vehicles will be weighed with and without load on an above ground platform scale with a capacity of 100 tons. The vehicles are unloaded on a back-on type hydraulic dumper which can lift both truck and trailer to dump the load into a receiving hopper. The chips are metered out of the hopper onto a belt conveyor which in turn discharges to one of two stacker conveyors.
The stackers deliver the chips to the storage pile. The unloading system is designed to operate 12 hours a day, 5 to 7 days per week
Bulldozers move the chips to form a 40 foot high pile with an area of approximately 150,000 square feet which is equal to a 30 day supply for the processing plant. A second pile of equal dimensions, with additional stacker and reclaim conveyors, would be required to provide a 2 months supply. Two bulldozers are included regardless of inventory to allow for peak delivery periods, to provide for proper pile rotation and maintenance. It is anticipated that two operators may be required during trucking hours and one during other times.
The dozers are used also to push chips into and over one of two reclaim chain conveyors. Using one conveyor at a time chips are reclaimed and fed to the screening system by beit conveyor. A tramp iron magnet is provided to catch stray magnetic metal and a scalping screen removes gross oversize and foreign material ahead of the screening process.
The initial process step in producing ethanol from biomass benefits from raw material particles being fairly thin. Wood chips should be in the order of 3 to 5 millimeter thick or less so as to allow the process chemicals to penetrate the fibers quickly. Such thin chips result when wood is cut into relatively short lengths along the grain, or no more than 12 millimeter long. Wood species, seasonal factors, moisture content and other variables influence chip thickness. It has been
12
assumed that most incoming chips will be acceptable in thickness and do not require reprocessing.
All chips will pass over a thickness screen to screen out over-thick material. A roll screen with specially profiled roll surfaces is proposed for this step. Material rejected by the .screen passes first through an air density separator which is a system that separates material by specific gravity. This eliminates any stones and other foreign objects which would damage downstream equipment. The over- thick chips are then introduced into a special chip slicer which cuts chips along the grain to a preset thickness. An alternate machine is a chip crusher which compresses chips to create fissures which allow more rapid penetration of the fiber by the process chemicals. The chip reclaim and screening system are designed to operate more or less continuously, or at least 20 hours per day.
In order to allow for equipment maintenance and to guard against breakdowns a storage silo is provided. The silo will hold approx. 55,000 cu.fi. of screened chips which is equal to 8 hours of plant operation. Chips are metered and conveyed to the process plant on a continuous, 24 hour basis.
Several process alternatives were considered. A fully automated chip storage and reclaim system was discussed which would not require either bulldozers or operators. Such a system can provide full inventory control and material turn-over and eliminates material break-down due to bulldozer action. Fiber loss and operating cost savings are the main advantages. Because of high capital cost this option was not pursued. Alternatives for fiber preparation were also considered. As a substitute for screening and slicing of chips the use of hammemills was discussed. Running all chips through such equipment would require high energy input and would unnecessarily degrade the material. However, hammermills could be further evaluated for use after screening and to replace a slicer.
c. let STAGE PIIEHYDROLYSIS
Chips enter the Acid Impregnator (M-201) along with sulfbric acid, recycle water and acidic recycle water from screw press S-201. The impregnator is a mechanical flight mixerkonveyor. The control point for this device is approximately 1% acid by weight leaving the impregnator. It operates at 20-50°C and atmospheric pressure.
Following the Impregnator is a Plug Screw Feeder (5-201), possibly of the Sunds type. An evaluation of similar devices which require less energy or have a better safety history is indicated. The screw press feeder compresses the wood chip mass to form a plug at the Hydrolyzer (R-201) inlet. The plug can withstand the 12
13
atmosphere pressure in the hydrolyzer vessel. The plug is split upon entry into the Hydrolyzer by a lance which also actuates to check back flow should the plug fail. Liquids from the Plug Screw Feeder are recycled to the Acid Impregnator. The plug entering the Hydrolyzer contains about 60% water.
d. lst STAGE HYDROLYSIS
In the Hydrolyzer the pressure is increased to approximately 12 atmospheres. Steam is directly injected into the process so that the process temperature approaches the saturated steam temperature at processing pressure (1 9OOC). A residence time of 3 minutes is required at these conditions to achieve the necessary reaction and prevent loss of carbohydrate by over-reaction. NREL developed the experimental data for the acid hydrolysis process using the QLG feedstock.
e. 1'' STAGE FLASH AND SEPARATION Hydrolyzer product enters a flash tank for cooling and conversion of oligomers to monomers. The First Stage Oligomer Flash Tank Reactor (T-203) will operate at 135°C and 3.0 atm. A residence time of one hour is required. Because the pressure in the Flash Tank is lower than in the Hydrolyzer, steam will be generated (flashed) in the tank. Approximately 9,000 kg/hr. of low pressure steam will be produced which can be used for other process heating requirements. Please refer to Appendix A. 1.
Liquid from the lst Stage Flash Tank is sent to the ISt Stage Low Pressure Flash Tank (T-204) which operates at one atmosphere and approximately 10 1 "C. Only 10 to 15 minutes of residence time is required in this Flash Tank.
Following the flash steps a hot counter-current washer (Interstage Washer, W- 203) recovers hemicellulosic sugars.
After washing, a screw press (S-203) reduces the water content to approximately 60% and this material is sent to the second stage of hydrolysis. The liquid stream from this press is recycled to the Interstage Washer.
f. 2nd STAGE PREHYDROLYSIS
The 40% solids stream from the screw press downstream of the Interstage Washer is feed for the 2"d Stage of the hydrolysis section. The material is fed directly to the Znd Stage Acid Impregnator (M-204) which has nearly the same specification as the 1" Stage. However, acid concentration is increased to result in approximately 1.6 % in the Znd Stage Hydrolyzer. The operating temperature is 50°C. Following the Impregnator is a Plug Screw Feeder (S-202 for the 2nd Stage
14
Hydrolyzer (R-202). This Feeder must raise the pressure to 22.5 atmospheres. Liquids from the Plug Screw Feeder recycle to the 2"d Stage Acid Impregnator. The solids rich stream (40%) proceeds to Hydrolysis.
g. 2nd STAGE HYDROLYSIS
In the ZRd Stage Hydrolyzer (R-202) the pressure is increased to approximately 22.5 atmospheres. Steam is directly injected into the process so that the process temperature approaches the saturated steam temperature at processing pressure (220°C). A residence time of 3 minutes is required at these conditions to achieve the necessaxy reaction.
h. 2"d STAGE FLASH Hydrolyzer product enters the 2"d Stage Oligomer Flash Tank Reactor (T-205) for cooling and conversion of oligomers to monomers. The Flash Tank will operate at 135°C and 3.0 atm. A residence time of one hour is required. Because the pressure in T-205 is lower than the Hydrolyzer pressure, steam will be generated (flashed) in the tank. Approximately 11,000 kg/hr. of low pressure steam will be produced which can be used for other process heating requirements. Please refer to Appendix A. 1.
Liquid from T-205 is sent to the 2"d Stage Low Pressure Flash Tank (T-206) which operates at just over atmospheric pressure and approximately 10 I "C. T-206 is equipped with an agitator. Only 10 to 15 minutes of residence time is required in this Flash Tank. Lime is added in the Td Stage Low Pressure Flash Tank.
From T-206 material proceeds directly to cooling and fermentation.
i. IS* STAGE NEUTRALIZATION AND FERMENTATION First stage liquor from the Interstage Washer goes to the Neutralization Tank (T- 209) where lime is added to raise the pH of the liquor to 4.5 pH. From T-209 liquor goes to S-222, Rotary Drum Filter for the removal of precipitates (gypsum, calcium oxalate, etc.) and other solids. This filter is a vacuum rotary drum type filter. Liquid from the filter is pumped (P-222 NS) to H-201, Cooling Water Cooler and H-202, Chilled Water Cooler prior to entering the fermentors. Filtered solids are sent to offsite disposal.
Fermentation was assumed to consume the majority of the C5 and (26 sugars to produce ethanol. Commercial yeast with the ability to convert both C5 and C6 sugars should be available within the construction period of the facility.
15
All fermentors in the plant are large, low pressure, stainless steel vessels with conical bottoms and slow speed agitators. The lSt Stage Fermentors (F-300 & F301) operate in series. Temperature is controlled to 30°C with chilled water in external exchangers (H-300 & H-30 1) with continuous recirculation.
In the first fermentor yeast is propagated by air and corn steep liquor (CSL) injection. The yeast is adapted to the inhibitors in the liquor via a recycling loop in the first-stage fermentors. Enough yeast is produced to supply the needs of the second fermentor which does not have CSL or air injection.
Each fermentor has a residence time of 8 hours or a total of 16 hours for the 1'' Stage.
j. 2"d STAGE FERMENTATION
The material leaving T-206, Td Stage Low Pressure Flash Tank, enters a chilled flight screw conveyor (C-201). The Chilled Slurry Screw Conveyor uses chilled water for the cooling medium. Temperature of the slurry will be 30°C leaving this conveyor which is the operating temperature of the fermentors. The cooled material is mixed with the fermentation product from the lst Stage in the 2"d Stage Fermentors (F-302 & F-303). Sufficient yeast carries over from the first stage and there is no provision for CSL or air addition.
Second Stage fermentation consists of two continuous fermentors in series. Both fermentors are continuously agitated with slow speed mechanical mixers. Temperature is controlled with chilled water in external exchangers (H-302 & H3 03) with continuous recirculation. The recirculation pumps, P-3 02 & P-3 03 are of the progressive cavity type because of the high solids concentration.
Each fermentor has a residence time of 8 hours or a total of 16 hours for the 2nd Stage.
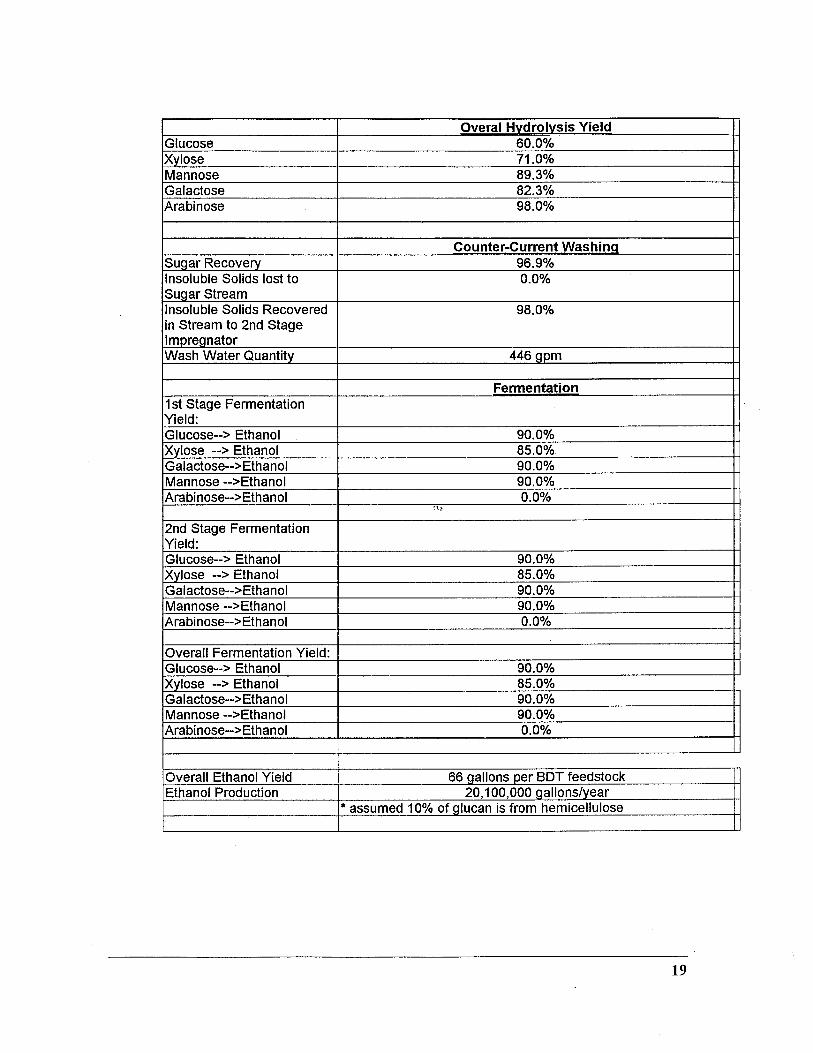
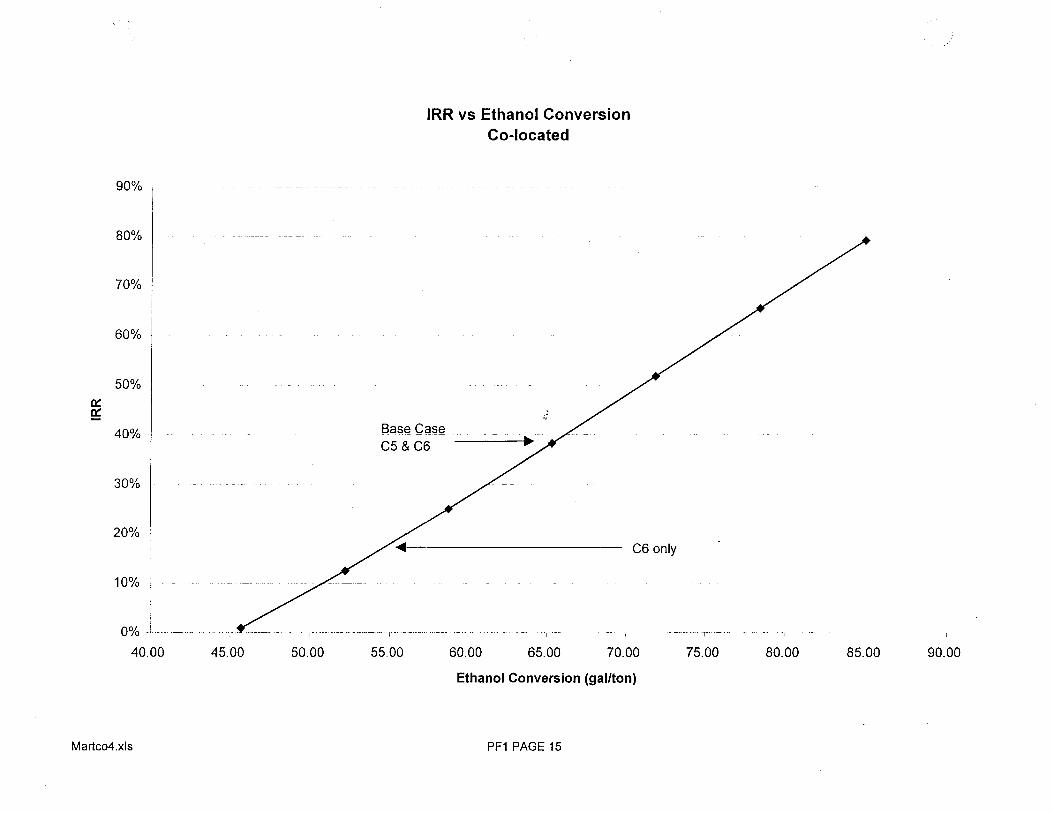
Overall ethanol yield from in the lSt stage fermentors and Znd stage combined is 90% of the six-carbon sugars entering the fermentors. Ethanol is also produced from the five-carbon sugars at 85% (in the near future it is assumed that a genetically engineered yeast or bacteria will be available commercially to ferment both the five and six carbon sugars) already mentioned earlier and on the next page. Both conversions are included in this model.
Off gas from all four fermentors is combined and washed in a counter-current water column, (T-512) before being vented to the atmosphere. The off gas is washed to recover ethanol and is not washed for air emissions control.
16
k. DISTILLATION
Distillation was addressed by NREL in a recent report. Refer to NREL Report TP-58026157 [by Wooley, R., M. Ruth, J. Sheehan, H. Majdeski and A. Galvez (1 999). Lignocellulosic Biomass to Ethanol Process Design and Economics, Utilizing Co-current Dilute Acid Prehydrolysis and Enzymatic Hydrolysis: Current and Futuristic Scenarios,, National Renewable Energy Laboratory, Golden, Colorado.]
1. DEHYDRATION
Dehydration was addressed by NREL in a recent report. Refer to NREL Report TP-580-26157 [by Wooley, R., M. Ruth, J. Sheehan, H. Majdeski and A. Galvez (1 999). Lignocellulosic Biomass to Ethanol Process Design and Economics, Utilizing Co-current Dilute Acid Prehydroly sis and Enzymatic Hydrolysis: Current and Futuristic Scenarios., National Renewable Energy Laboratory, Golden, Colorado.]
m. LIGNIN SEPARATION AND WATER HANDLING
Water recirculation and waste water treatment are addressed in a separate report, titled “ Waste Water Treatment Options for the Biomass-to-Ethanol Process”, October 22, 1998 by Merrick & Co.
Lignin separation is accomplished in three, large, solid bowl, decanting centri~ges. The lignin is further dewatered in a screw press. Additional work should done in this area to optimize the process performance.
n. BOILER AND POWER GENERATION
The lignin powered boiler, steam turbine and power generator were addressed in a previous report “Biomass To-Ethanol. Total Energy Cycle Analysis”, NREL Subcontract RCN 2 1 3 - 1 8 5-0 1 -00 final report, Radian Corporation, Austin, Tx, November 22,199 1.
It was assumed that the lignin to be burned will be 50% solids and 50% water.
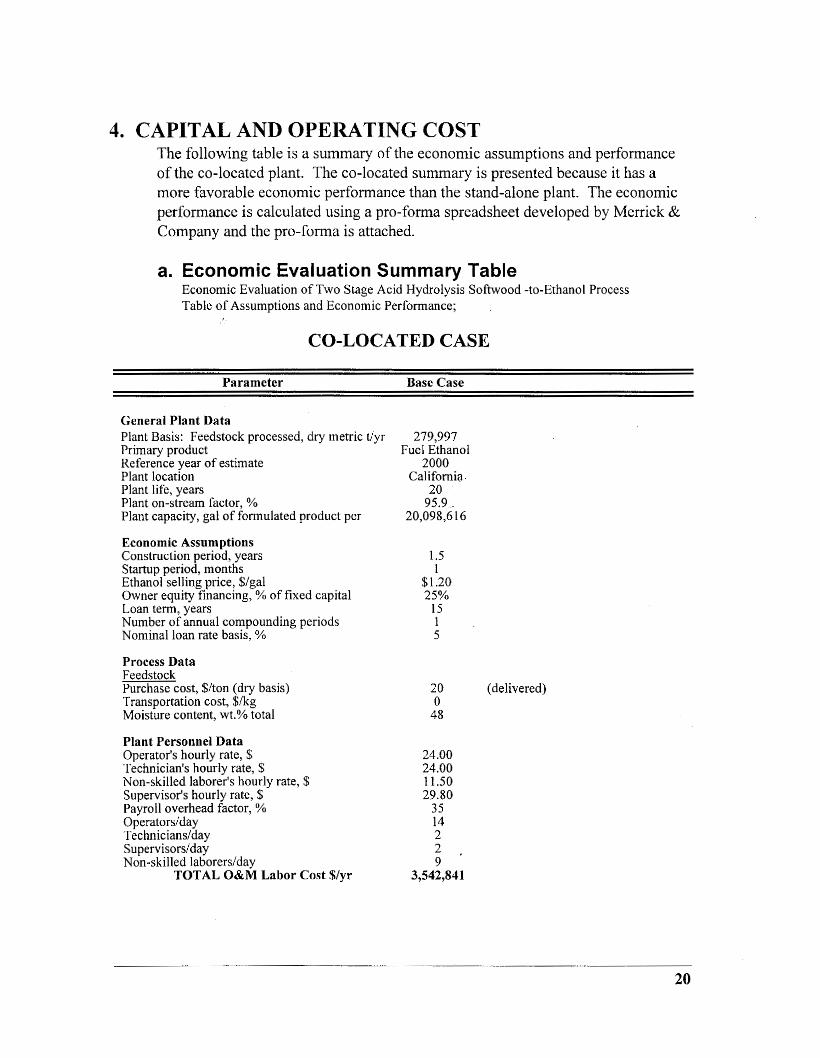
4. CAPITAL AND OPERATING COST The following table is a summary of the economic assumptions and performance of the co-located plant. The co-located summary is presented because it has a more favorable economic performance than the stand-alone plant. The economic performance is calculated using a pro-forma spreadsheet developed by Merrick & Company and the pro-forma is attached.
a. Economic Evaluation Summary Table Economic Evaluation of Two Stage Acid Hydrolysis Softwood -to-Ethanol Process Table of Assumptions and Economic Performance;
CO-LOCATED CASE
Parameter Rase Case
General Plant Data Plant Basis: Feedstock processed, dry metric t/yr 279.997 . - Primary product Reference year of estimate Plant location Plant life, years Plant on-stream factor, YO Plant capacity, gal of formulated product per
Economic Assumptions Construction period, years Startup period, months Ethanol selling price, $/gal Owner equity financing, % of fixed capital Loan term, years Number of annual compounding periods Nominal loan rate basis, %
Process Data Feedstock Purchase cost, $/ton (dry basis) Transportation cost, $/kg Moisture content, wt.% total
Plant Personnel Data Operator's hourly rate, $ Technician's hourly rate, $ Non-skilled laborer's hourly rate, $ Supervisor's hourly rate, $ Payroll overhead factor, % Operatordday Technic ian s/day Supervisors/day Non-skilled laboredday
TOTAL O&M Labor Cost $/yr
" Fuel Ethanol 2000
California. 20
95.9 ~
20,098,6 16
1.5 1
$1.20 25%
15 1 5
20 (delivered) 0
48
24.00 24,OO 11.50 29.80 35 14 2
9 3,542,841
2 ,
20
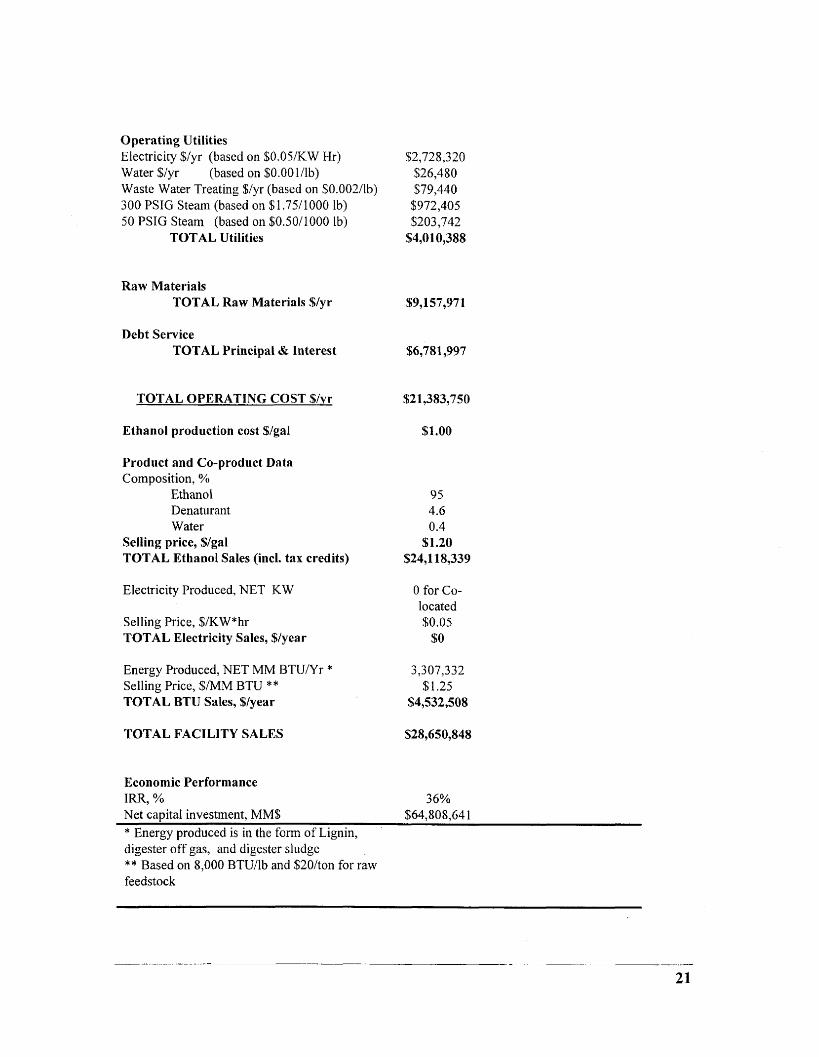
Operating Utilities Electricity $/yr (based on $O.OS/KW Hr) Water $/yr (based on $O.OOl/lb) Waste Water Treating $/yr (based on $0.002/lb) 300 PSIG Steam (based on $1.75/1000 lb) 50 PSIG Steam (based on $0.50/1000 lb)
TOTAL Utilities
Raw Materials TOTAL Raw Materials $/yr
Debt Service TOTAL Principal & Interest
TOTAL OPERATING COST $/yr
Ethanol production cost $/gal
Product and Co-product Data Composition, YO
Ethanol Denaturant Water
Selling price, $/gal TOTAL Ethanol Sales (incl. tax credits)
Electricity Produced, NET KW
Selling Price, $/KW*hr TOTAL Electricity Sales, $/year
Energy Produced, NET MM BTU/Yr * Selling Price, $/MM BTU ** TOTAL BTU Sales, $/year
TOTAL FACILITY SALES
Economic Performance IRR, Yo Net capital investment, MM$
$2,728,320 $26,480 $79,440 $972,405 $203,742
$4,010,388
$9,157,97 1
$6,78 1,997
$21,383,750
$1.00
95 4.6 0.4
$1.20 $24,118,339
0 for Co- located $0.05
$0
3,307,332 $1.25
$4,532,508
$28,650,848
36% $64,808,64 1
* Energy produced is in the form of Lignin, '
digester off gas, and digester sludge ** Based on 8,000 BTU/lb and $20/ton for raw feedstock
21
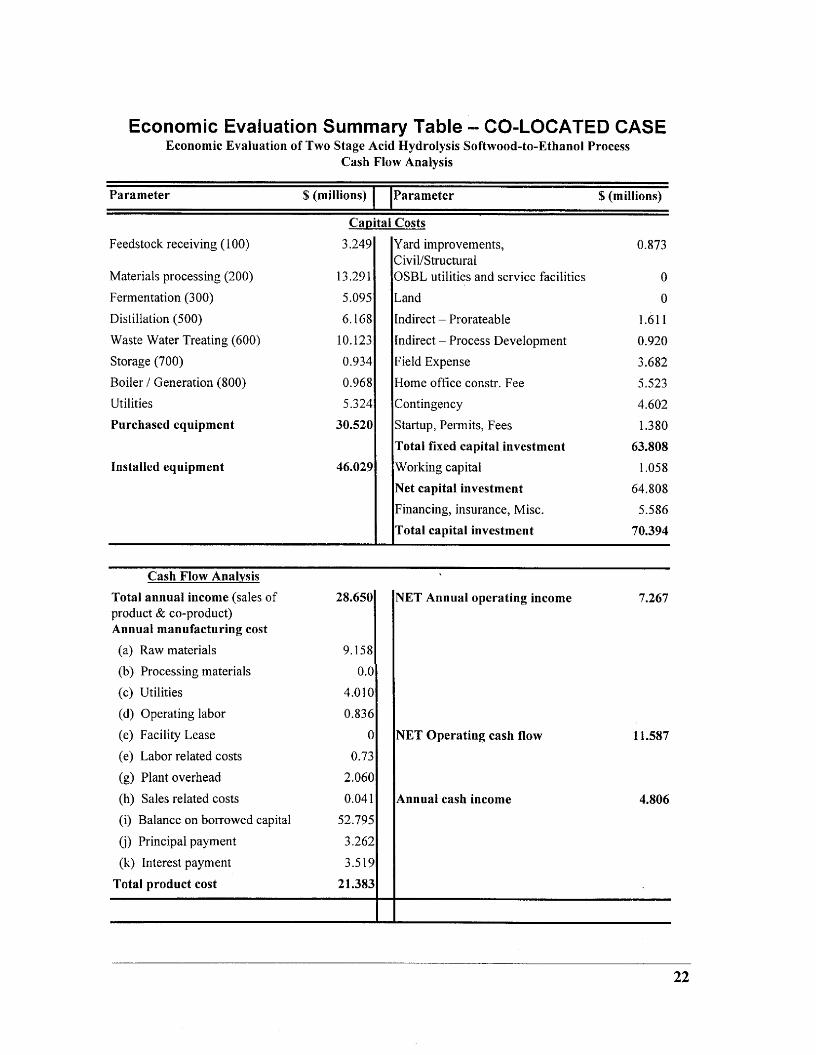
Economic Evaluation Summary Table - CO-LOCATED CASE Economic Evaluation of Two Stage Acid Hydrolysis Softwood-to-Ethanol Process
Cash Flow Analysis
Parameter $ (millions) 1 IParameter $ (millions)
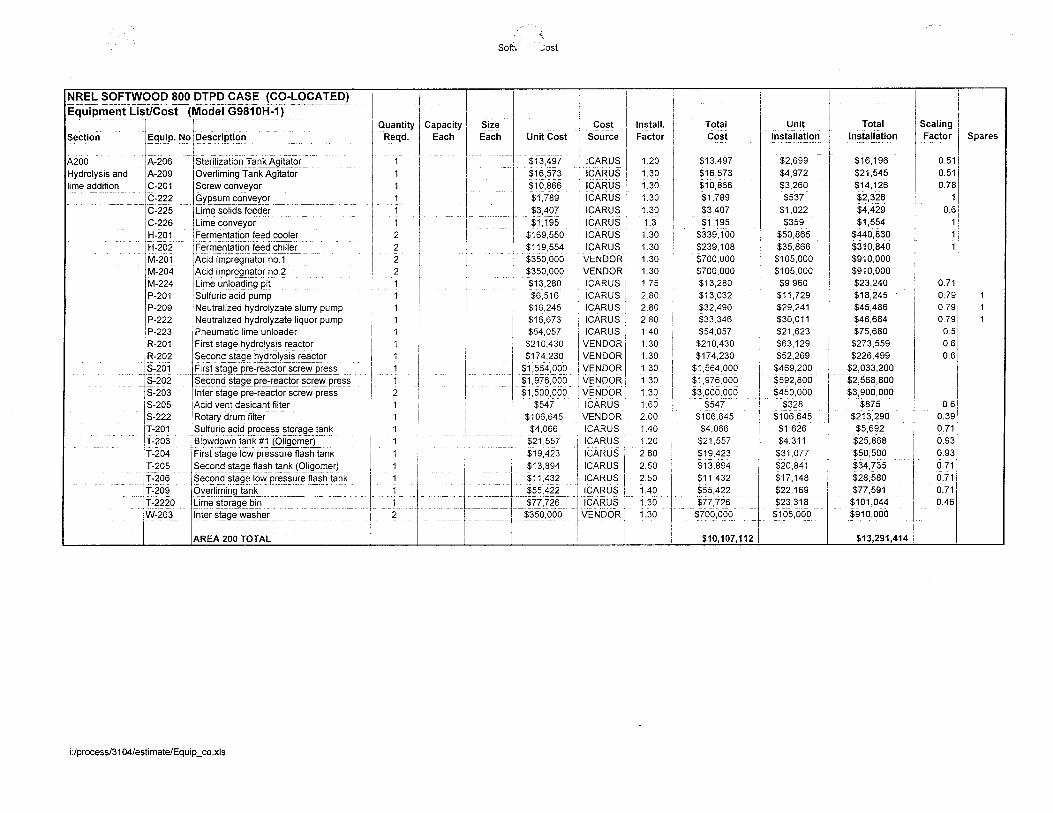
Feedstock receiving ( 100)
Materials processing (200)
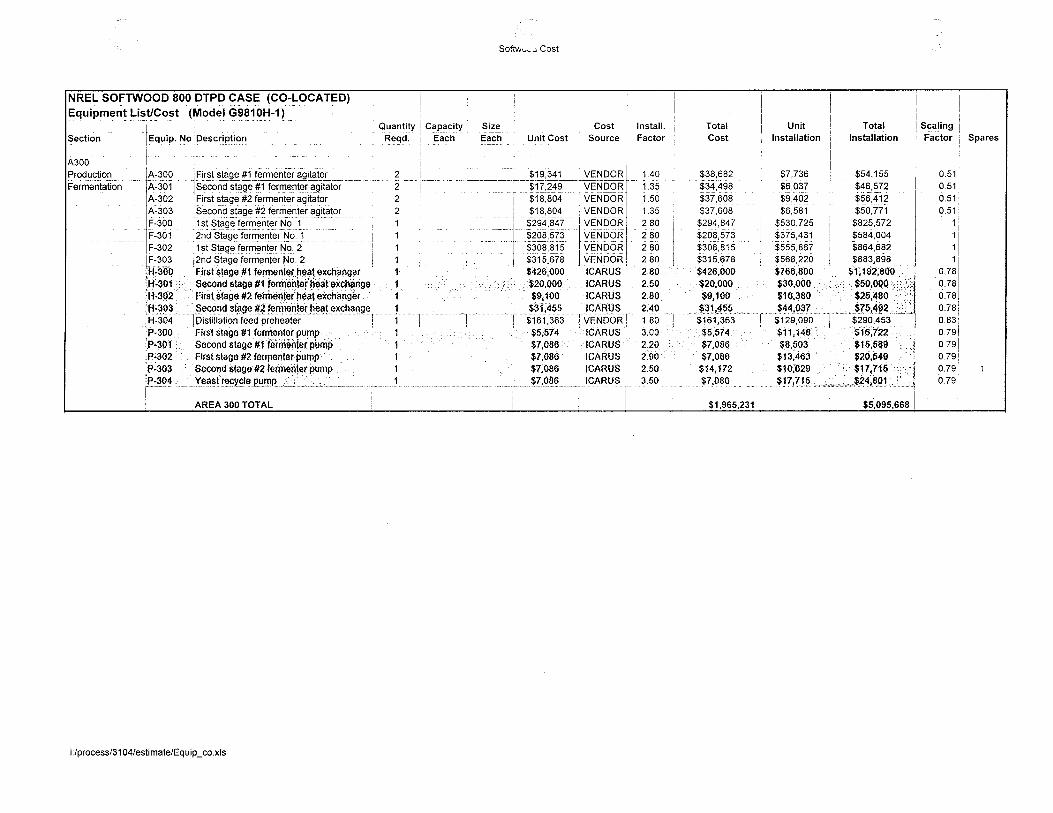
Fermentation (3 00)
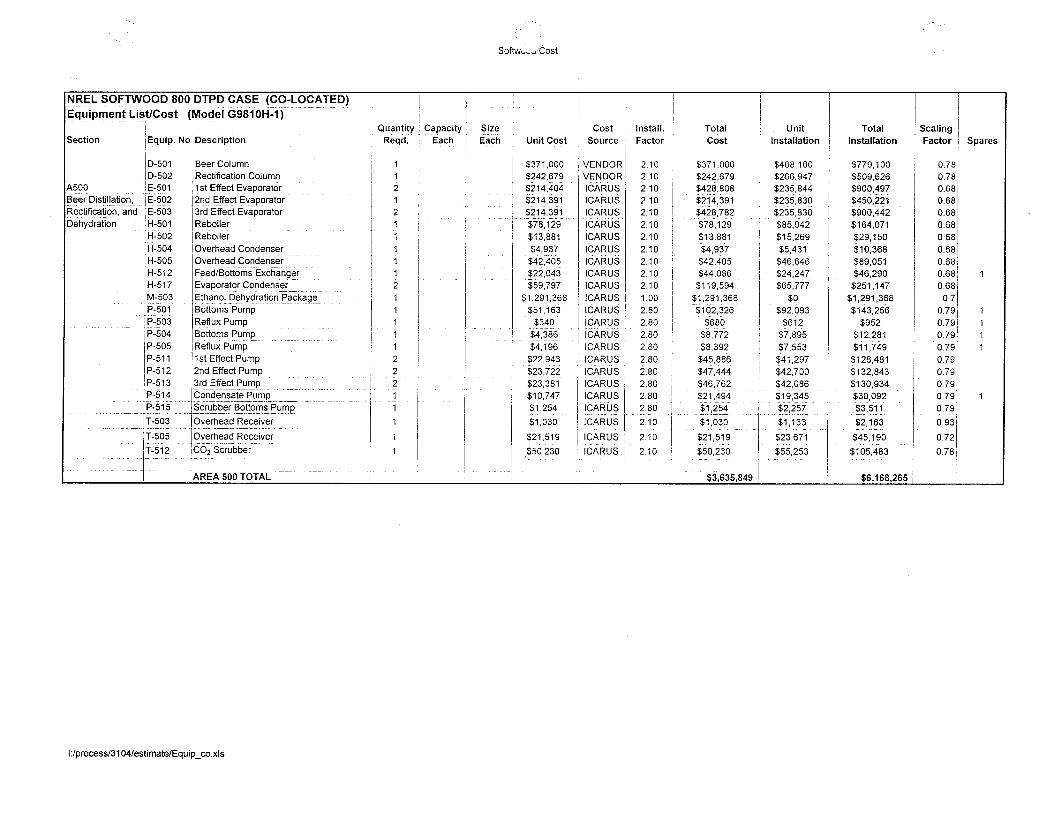
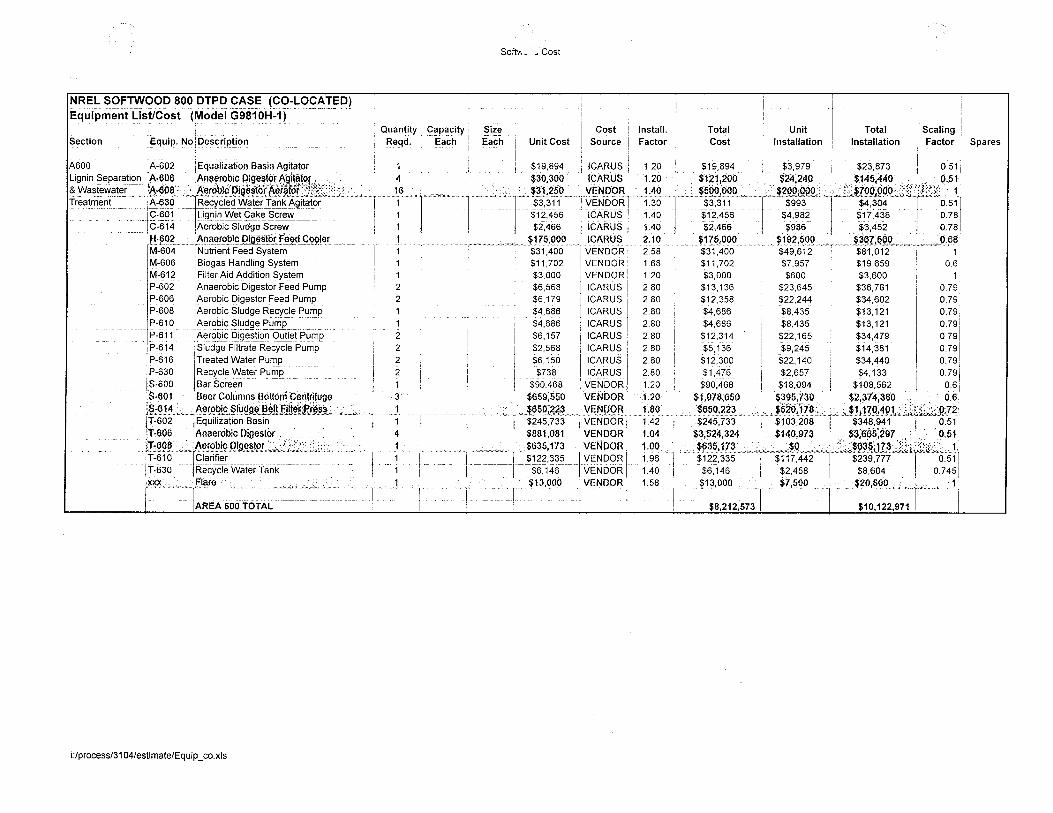
Distillation (500) Waste Water Treating (600) Storage (700) Boiler / Generation (800) Utilities Purchased equipment
Installed equipment
Capital Costs
3.249
13.291 5.095 6.168
10.123 0.934
0.968 5.324
30.520
46.029
Yard improvements, CiviVStructural OSBL utilities and service facilities
Land Indirect - Prorateable
indirect - Process Development Field Expense
Home office constr. Fee Contingency Startup, Permits, Fees Total fixed capital investment Working capital Net capital investment Financing, insurance, Mix . Total capital investment
0.873
0
0
1.611 0.920
3.682 5.523
4.602 1.380
63.808 1.058
64.808 5.586
70.394
Cash Flow Analvsis Total annual income (sales of product & co-product) Annual manufacturing cost
28.650
(a) Raw materials 9.158
(b) Processing materials 0.0 (c) Utilities 4.010
(d) Operating labor 0.836
(e) Facility Lease 0 (e) Labor related costs 0.73
(g) Plant overhead 2.060 (h) Sales related costs 0.04 1
(i) Balance on borrowed capital 52.795
(i) Principal payment 3 -262
(k) Interest payment 3.519 Total product cost 2 1.383
VET Annual operating income 7.267
NET Operating cash flow
Annual cash income
1 1.587
4.806
22
b. ProForma
The co-located facility assunies that a single owner would own and operate the ethanol facility and the bio-mass power plant.
The Martell California co-located site would be arranged as shown on the plot plan in relative close proximity to the current Wheelabrator 18 MW biomass power plant. The Ethanol plant would be located north and west of the chip pile - conveyor - boiler buildings. The current chip conveyor would be diverted/interrupted to allow a separate chip stream to the ethanol processing unit. The processed lignin would return to this conveyor for transport to the boiler facility. It is our understanding that the lignin could be processed in the existing boiler with minor modifications.
A major advantage of co-location is the use of existing facilities and processes. These particular advantages for the Martell site are;
1. Decrease the capital expenditure of the ethanol plant. The Martell site will allow use of the existing chip handling equipment and surge piles (area 100).
2. Decrease the capital expenditure of the ethanol plant. The Martell site will allow use of the existing boiler equipment, condensate equipment and boiler feed water chemical treatment (area 800) to produce steam.
3. Decrease in operator/security/maintenance personnel as the combined sites can utilize some of the same work force. The Martell power facility is assumed to provide a majority of these personell.
4. Shared chemical and utility costs will allow more aggressive negotiation with utility companies and suppliers. The utility costs were estimated to be half of the selling price of electricity and steam. The co-located facility would allow shared pricing of the steam and electricity costs with the boiler facility because the “sale” of the utilities would be an internal cost between the Martell facility and the wholly/majority owned Biomass to Ethanol facility .
5. Reduced management and administration labor costs.
6. Shared maintenance personnel and facilities.
23
The pro forrna utility prices have been discussed with the personnel at Martell and these costs should be accurate for a minimum of a year.
Indirect construction costs were modeled as a percentage of the capital equipment costs based on similar type of projects and engineering experience. The indirect portion of the capital construction costs is estimated based on the experience Merrick has gathered on similar size projects. The indirect costs are defined as follows:
Prorated - Includes fringe benefits, insurance, bonding, and overhead burdens. The prorated costs are adjusted to include the prorated costs of skid mounting equipment in a nearby industrial center.
specialized portions of the process that may require additional study or research. Field Expenses - Normally this includes consumables, equip. rental, field services, temporary facilities, and supervision. The co- located site will have existing facilities that would be used for construction. The co-located site also has services (water, sewer, electric, phones, roadways, etc.) that would be used for construction. The co-located field expense was reduced since facilities and services are available. Home Office Construction Fee - Includes detail engineering of the plant, purchasing of the equipment and bulks, and field construction support. Contingency - Is an allowance for expected but undefined costs.
construction permits and fees. NOTE: Indirect costs that are not included in the capital costs include; rn Owner supervisory personnel for engineering, construction
and start-up. Engineering/Construction overtime pay.
a OwnedEngineering scope changes.
0 Process Development - Includes final development of the
0
0
0 Start-up, Permits, and Fees - Includes plant commissioning,
rn
24
c. Estimate Assumptions
Co-located
1. 2.
3.
4.
5 . 6.
There are no land acquisition costs included. There are no off site costs included (e.g. public road improvements, extension of power, water, telephone services) There is a swrce of qualified construction personnel within daily driving distance of the site. There exists adequate roads, rail roads, ship docks to allow equipment deliveries. The costs of obtaining air and water permits is not included. Soils are adequate for conventional foundation design.
S t a d - alone
1. There are no land acquisition costs included. 2. There are no off site costs included (e.g. public road improvements,
extension of power, water, telephone services) 3. There is a source of qualified construction personnel within daily
driving distance of the site. 4. There exists adequate roads, rail roads, ship docks to allow equipment
deliveries. 5. The costs of obtaining air and water permits is not included. 6. Soils are adequate for conventional foundation design.
25
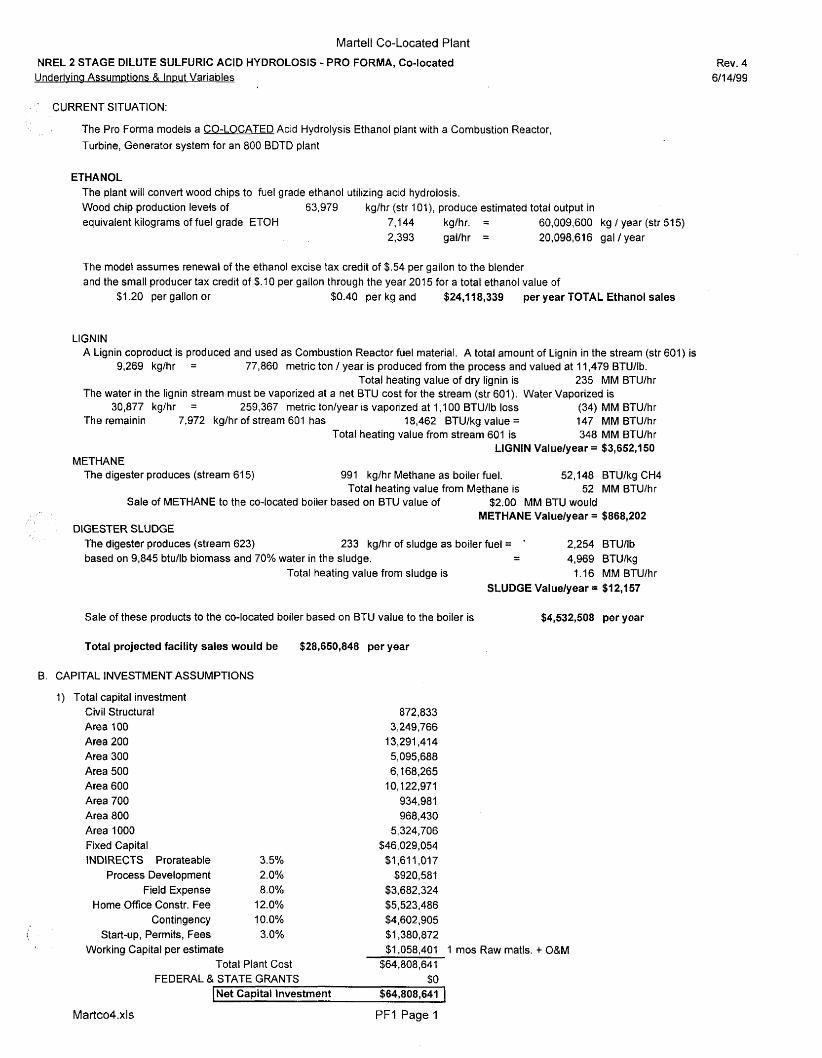
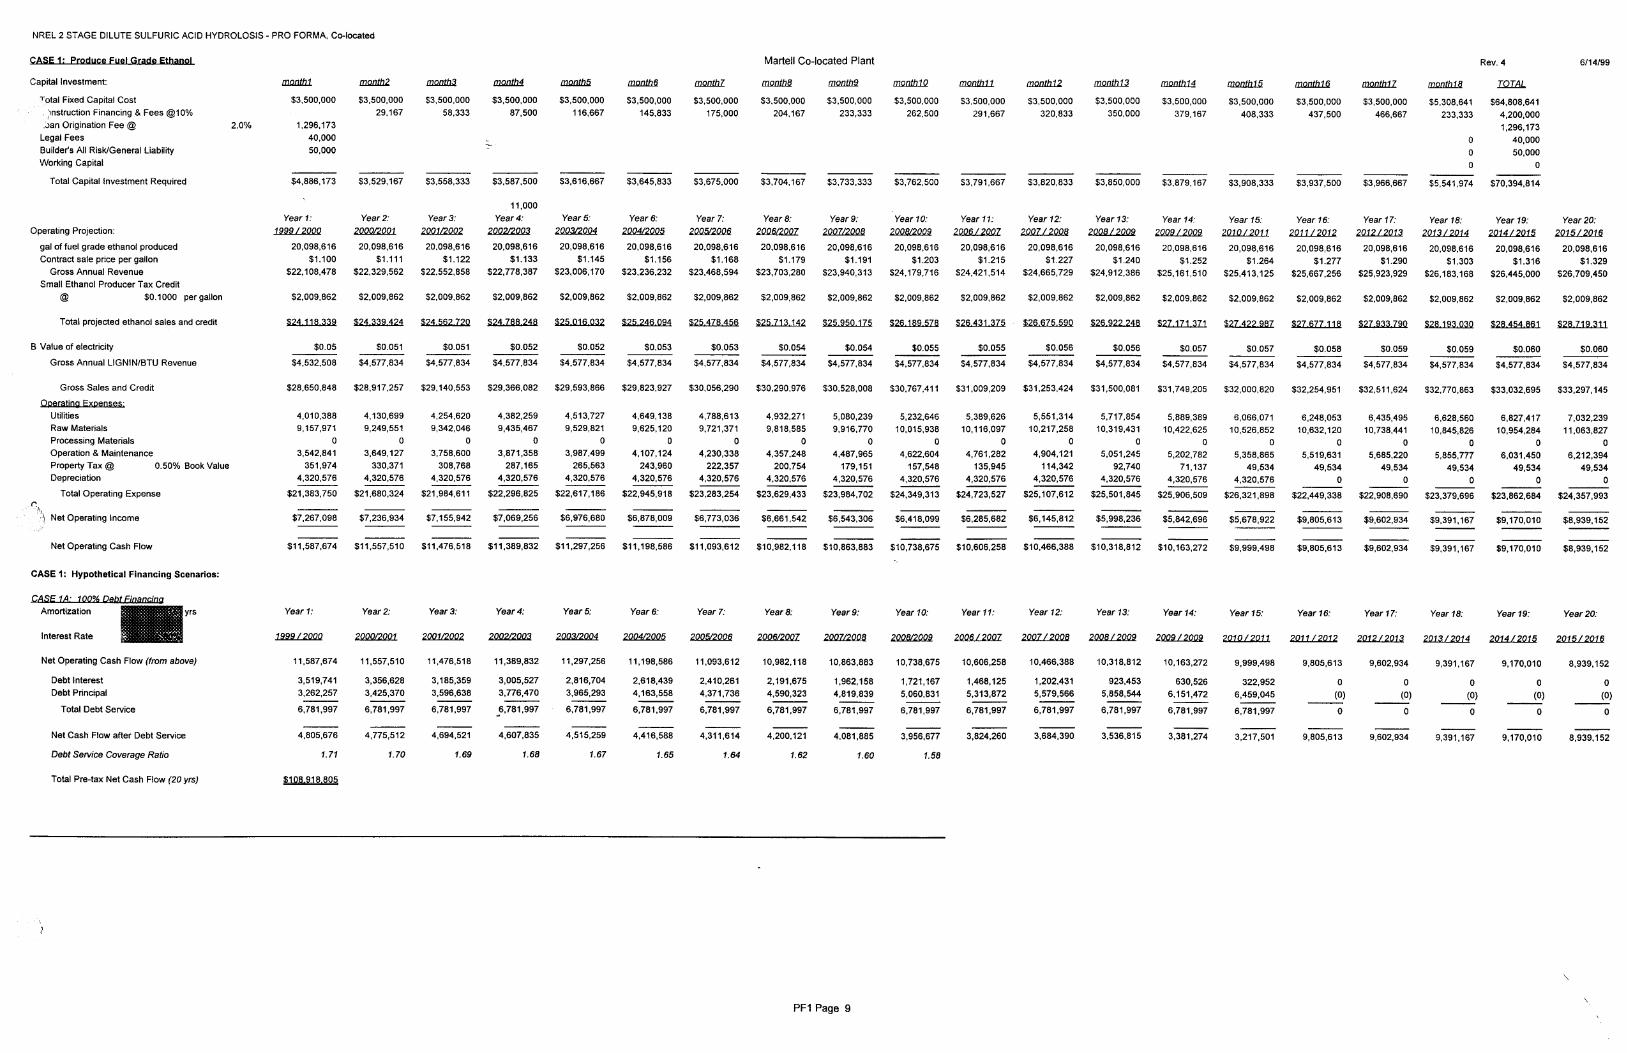
Martelt Co-Located Plant
NREL 2 STAG€ DILUTE SULFURIC ACID HYDROLOSIS - PRO FORMA, Co-located Underlving Assumptions & InDut Variables
’ CURRENT SITUATION:
The Pro Forma models a CO-LOCATED Acid Hydrolysis Ethanol plant with a Combustion Reactor, Turbine, Generator system for an 800 BDTD plant
ETHANOL The plant will convert wood chips to fuel grade ethanol utilizing acid hydrolosis. Wood chip production levels of equivalent kilograms of fuel grade ETOH 7,144 kg/hr. = 60,009,600 kg / year (str 51 5)
63,979 kg/hr (str lo’!), produce estimated total output in
2,393 gal/hr = 20,098,616 gal / year
The model assumes renewal of the ethanol excise tax credit of $.54 per gallon to the blender and the small producer tax credit of $.lo per gallon through the year 2015 for a total ethanol value of
$1.20 per gallon or $0.40 per kg and $24,418,339 per year TOTAL Ethanol sales
LlGNlN A Lignin coproduct is produced and used as Combustion Reactor fuel material. A total amount of Lignin in the stream (str 601) is
9,269 kg/hr = 77,860 metric ton / year is produced from the process and valued at 1 1,479 BTU/tb. Total heating value of dry lignin is 235 MM BTU/hr
The water in the lignin stream must be vaporized at a net BTU cost for the stream (str 601). Water Vaporized is 30,877 kg/hr = 259,367 metric tonlyear IS vaporized at 1,100 BTU/lb loss (34) MM BTU/hr
The remainin 7,972 kg/hr of stream 601 has 18,462 BTU/kg value = 147 MM BTU/hr 348 MM BTU/hr
LIGNIN Value/year = $3,652,150 Total heating value from stream 601 is
METHANE The digester produces (stream 61 5) 991 kg/hr Methane as boiler fuel. 52,148 BTU/kg CH4
Total heating value from Methane is 52 MM BTU/hr Sale of METHANE to the co-located boiier based on BTU value of $2.00 MM BTU would
METHANE Valuelyear = $868,202 DIGESTER SLUDGE
The digester produces (stream 623) 233 kg/hr of sludge as boiler fuel = ’ 2,254 BTUllb - based on 9,845 btu/lb biomass and 70% water in the sludge. - 4,969 BTU/kg
Total heating value from sludge is 1.16 MM BTU/hr SLUDGE Valuelyear = $12,157
Sale of these products to the co-located boiler based on BTU value to the boiler is $4,532,508 per year
Total projected facility sales would be $28,650,848 per year
B. CAPITAL INVESTMENT ASSUMPTIONS
1) Total capital investment Civil Structurat Area 100 Area 200 Area 300 Area 500 Area 600 Area 700 Area 800 Area 1000 Fixed Capital INDIRECTS Prorateable 3.5%
Process Development 2.0% Field Expense 8.0%
Home Office Constr. Fee 12.0%
Start-up, Permits, Fees 3.0% Contingency 10.0%
Working Capital per estimate Total Plant Cost
872,833 3,249,766
13,291,414 5,095,688 6,168,265
10,122,971 934,981 968,430
5,324,706 $46,029,054
$1,61l,OI7 $920,581
$3,682,324 $5,523,486 $4,602,905 $1,380,872 $1,058,401 1 mos Raw matls. + 0&M
$64,808,64 1 FEDERAL & STATE GRANTS $0
[Net Capital investment $64,808,641 1
Rev. 4 6/14/99
Martco4.xls PFI Page 1
Martell Co-Located Plant
NREL 2 STAGE DILUTE SULFURIC ACID HYDROLOSIS - PRO FORMA Rev. 4 611 4/99
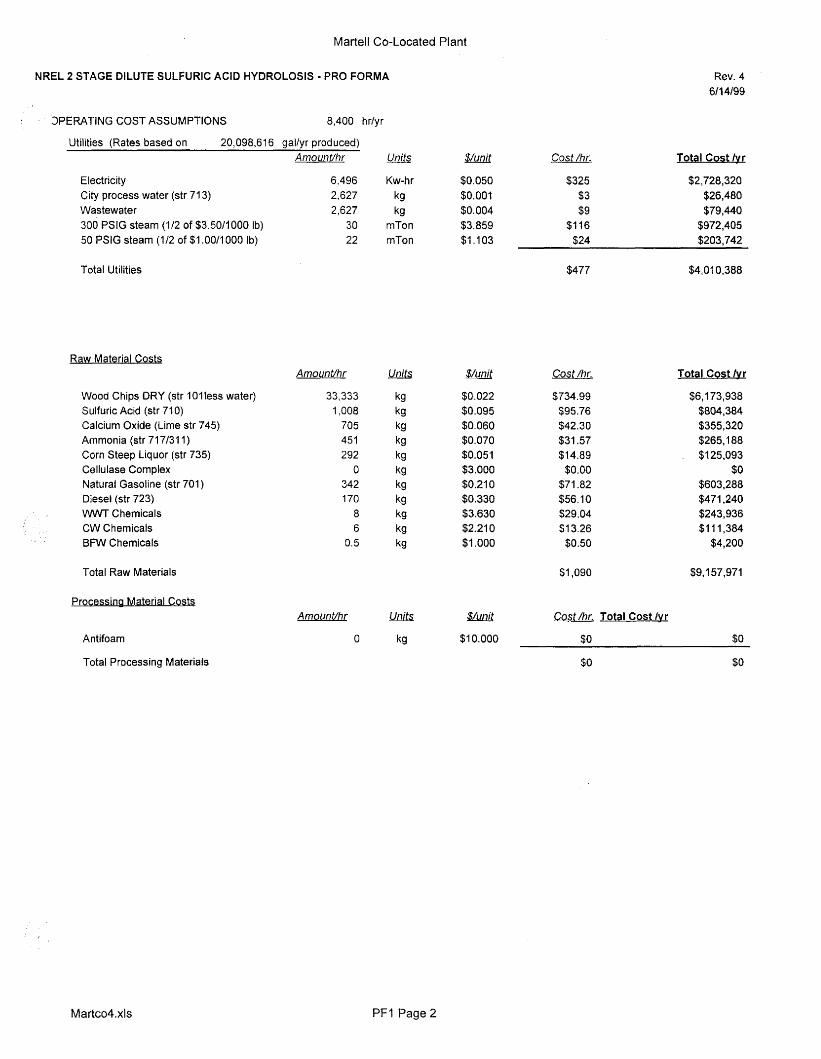
* 3PERATING COST ASSUMPTIONS 8,400 h r/y r
Utilities (Rates based on 20,098,616 gallyr produced) Amounffhr m $/unit
Electricity 6,496 Kw-hr $0.050 City process water (str 71 3) 2,627 kg $0.001 Wastewater 2,627 kg $0.004 300 PSlG steam (1/2 of $3.50/1000 Ib) 30 mTon $3.859 50 PSlG steam (112 of $1.00/1000 Ib) 22 mTon $1.103
Cost /hr. Total Cost /vr
$325 $2,728,320 $3 $26,480 $9 $79,440
$1 16 $972,405 $24 $203,742
Total Utilities $477 $4,010,388
Raw Material Costs $/unit Cost /hr. Amounffhr Total Cost /vr
Wood Chips DRY (str 10lless water) Sulfuric Acid (str 710) Calcium Oxide (Lime str 745) Ammonia (str 71 7/31 1) Corn Steep Liquor (str 735) Cellulase Complex Natural Gasoline (str 701) Diesel (str 723) WWT Chemicals CW Chemicals BFW Chemicals
33,333 1,008
705 451 292
0 342 170 8 6
0.5
$0.022 $0.095 $0.060 $0.070 $0.051 $3.000 $0.21 0 $0.330 $3.630 $2.21 0 $1 .ooo
$734.99 $95.76 $42.30 $31.57 $14.89
$0.00
$56.10 $29.04 $1 3.26 $0.50
$71 .a2
$6,173,938 $804,384 $355,320 $265,188 $125,093
$0 $603,288 $471,240 $243,936 $1 11,384 $4,200
Total Raw Materials $1,090 $9,157,971
Processina Material Cost5 $/unit
$1 0.000
AmounVhr
0
Cost /hr. Total Cost /vr
Antifoam $0 $0
$0 $0 Total Processing Materials
Martco4.xls PFI Page2
Martell Co-Located Plant
Rev. 4 611 4199
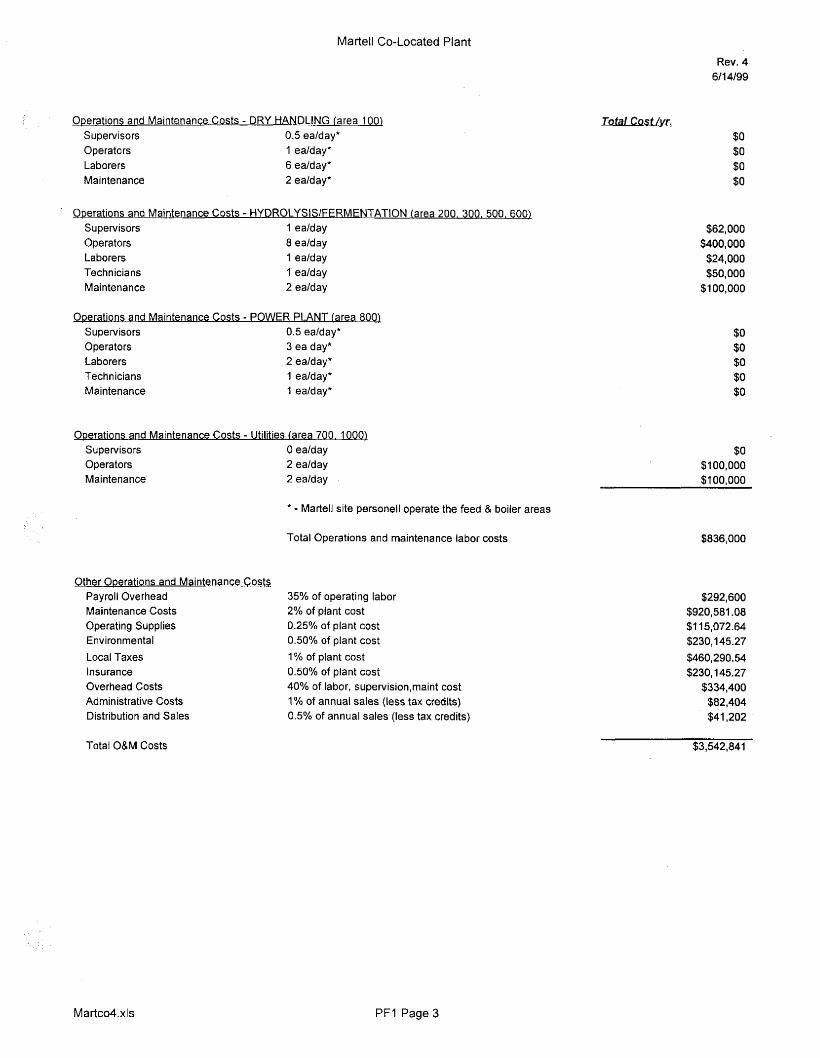
Operations and Maintenance Cos ts - DRY HANDLING (area 100) Supervisors 0.5 ealday* Operators 1 ealday* Laborers 6 ealday* Maintenance 2 ealday*
'
Onerations and Maintenance Costs - HYDROLYSISIFERMENTATION (area 200. 300. 500. 600) Supervisors I ealday Operators 8 ealday Laborers 1 ealday Tech n icia n s 1' ealday Maintenance 2 ealday
Operations and Maintenance Costs - POWER PLANT (area 800) Supervisors 0.5 ealday* 0 pe ra to rs 3 ea day* Laborers 2 ealday* Technicians 1 ealday* Maintenance 1 ealday*
Operations and Maintenance Costs - Utilities (area 700, 1000) Supervisors Operators Maintenance
Other Ope rations and Maintenance Costs Payroll Overhead Maintenance Costs Operating Supplies Environmental Local Taxes Insurance Overhead Costs Administrative Costs Distribution and Sales
0 ealday 2 ealday 2 ealday
* - Martell site personell operate the feed & boiler areas
Total Operations and maintenance labor costs
35% of operating labor 2% of plant cost 0.25% of plant cost 0.50% of plant cost 1% of plant cost 0.50% of plant cost 40% of labor, supervision,maint cost 1% of annual sales (less tax credits) 0.5% of annual sales (less tax credits)
$0 $0 $0 $0
$62,000 $400,000 $24,000 $50,000
$1 00,000
$0 $0 $0 $0 $0
$0 $l00,000 $100,000
$836,000
$292,600 $920,581.08 $1 15,072.64 $230,145.27 $460,290.54 $230,145.27 $334,400 $82,404 $41,202
Total O&M Costs $3,542 , 84 I
M artco4.xls PFI Page3
Martell Co-Located Plant
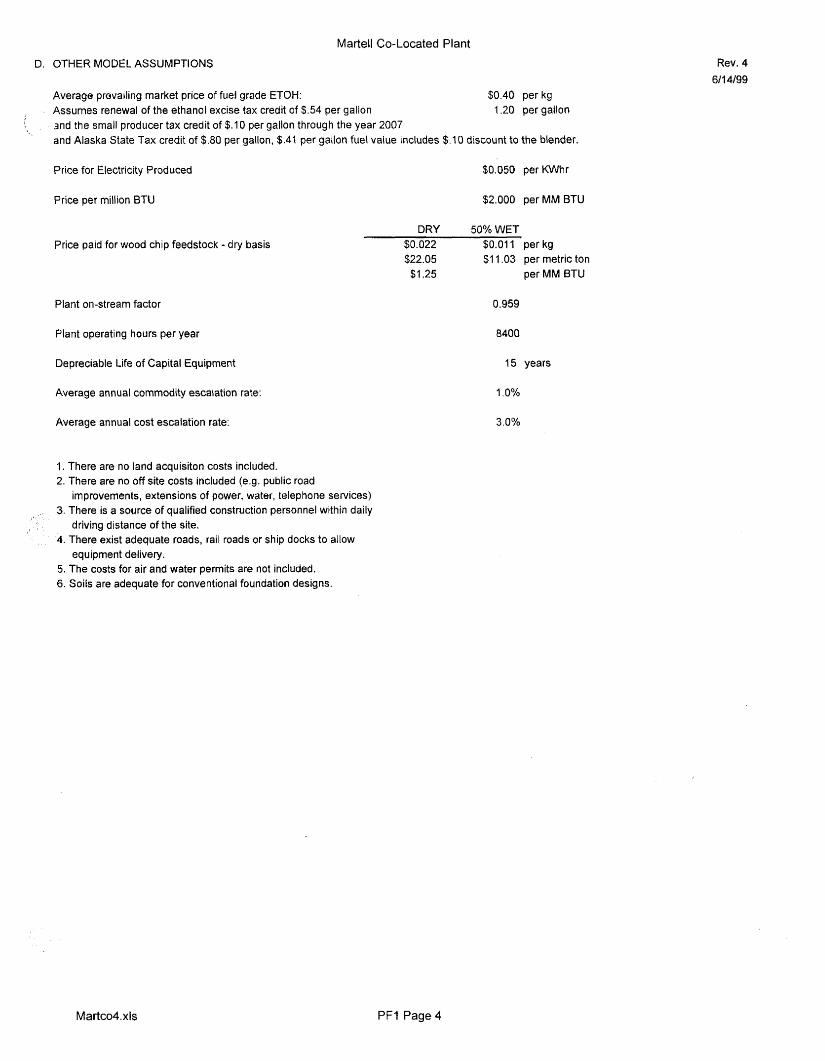
D. OTHER MODEL ASSUMPTIONS Rev. 4 611 4/99
Average prevailing market price of fuel grade ETOH: $0.40 perkg Assumes renewal of the ethanol excise tax credit of $.54 per gallon and the small producer tax credit of $10 per gallon through the year 2007 and Alaska State Tax credit of $.80 per gallon, $41 per gallon fuel value includes $.I0 discount to the blender.
1.20 per gallon
!,
$0.050 per W h r Price for Electricity Produced
Price per million BTU $2.000 per MM BTU
Price paid for wood chip feedstock - dry basis
Plant on-stream factor
Plant operating hours per year
Depreciable Life of Capital Equipment
Average annual commodity escalation rate:
Average annual cost escalation rate:
1. There are no land acquisiton costs included. 2. There are no off site costs included (e.9. public road
improvements, extensions of power, water, telephone services) 3. There is a source of qualified construction personnel within daily
driving distance of the site. 4. There exist adequate roads, rail roads or ship docks to allow
equipment delivery. 5. The costs for air and water permits are not included. 6. Soils are adequate for conventional foundation designs.
DRY 50%WET $0.022 $0.011 perkg $22.05 $1 1.03 per metric ton
$1.25 per MM BTU
0.959
8400
15 years
1 .O%
3.0%
Martco4. XIS PF1 Page4
co-located usunits
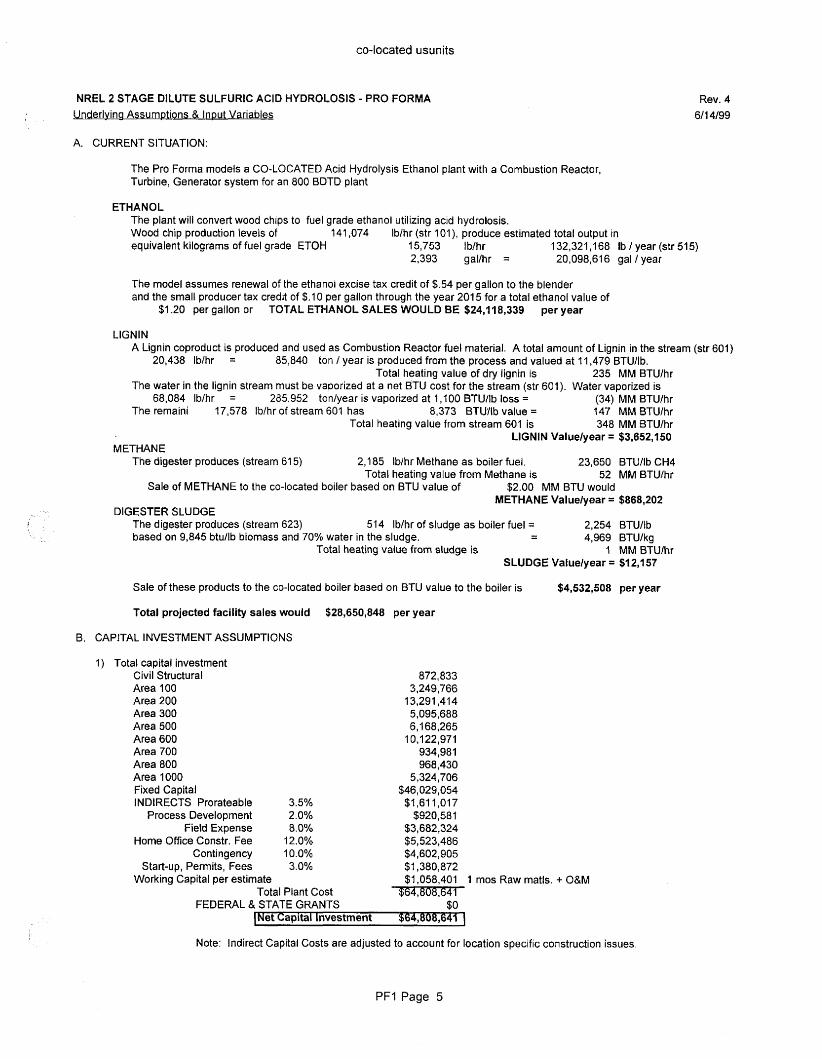
NREL 2 STAGE DILUTE SULFURIC ACID HYDROLOSIS - PRO FORMA Underlyino Assumpt ions & Input Variables
Rev. 4 6/14/99
A. CURRENT SITUATION:
The Pro Forma models a CO-LOCATED Acid Hydrolysis Ethanol plant with a Combustion Reactor, Turbine, Generator system for an 800 BDTD plant
ETHANOL The plant will convert wood chips to fuel grade ethanol utilizing acid hydrolosis. Wood chip production levels of equivalent kilograms of fuel grade ETOH 15,753 Ib/hr 132,321,168 Ib / year (str 515)
141,074 lblhr (str IOI), produce estimated total output in
2,393 gaVhr = 20,098,616 gal I year
The model assumes renewal of the ethanol excise tax credit of $54 per gallon to the blender and the small producer tax credit of $.I 0 per gallon through the year 201 5 for a total ethanol value of
$1.20 per gallon or TOTAL ETHANOL SALES WOULD BE $24,’l18,339 per year
LlGNlN A Lignin coproduct is produced and used as Combustion Reactor fuel material. A total amount of Lignin in the stream (str 601)
20,438 lblhr = 85,840 ton / year is produced from the process and valued at t 1,479 BTU/lb. Total heating value of dry lignin is 235 MM BTU/hr
The water in the lignin stream must be vaporized at a net BTU cost for the stream (str 601). Water vaporized is 68,084 lblhr = 285.952 ton/year is vaporized at 1,100 BTU/lb loss = (34) MM BTU/hr
The remaini 17,578 IWhr of stream 601 has 8,373 BTUllb value = 147 MM BTU/hr 348 MM BTU/hr
LlGNlN Valuelyear = $3,652,150
The digester produces (stream 61 5) 2,185 lblhr Methane as boiler fuel. 23,650 BTU/lb CH4 Total heating value from Methane is 52 MM BTU/hr
Total heating value from stream 601 is
METHANE
Sale of METHANE to the co-located boiler based on BTU value of $2.00 MM BTU would METHANE Valuelyear = $868,202
DIGESTER SLUDGE The digester produces (stream 623) 514 Ib/hr of sludge as boiler fuel = 2,254 BTU/tb - based on 9,845 btu/lb biomass and 70% water in the sludge. - 4,969 BTU/kg
Total heating value from sludge is 1 MM BTUlhr SLUDGE Vatuelyear = $12,157
Sale of these products to the co-located boiler based on BTU value to the boiler is $4,532,508 per year
Total projected facility sales would $28,650,848 per year
B. CAPITAL INVESTMENT ASSUMPTIONS
I ) Total capital investment Civil Structural Area 100 Area 200 Area 300 Area 500 Area 600 Area 700 Area 800 Area 1000 Fixed Capital INDIRECTS Prorateable 3.5%
Process Development 2.0% Field Expense 8.0%
Home Office Constr. Fee 12.0% Contingency 10.0%
Start-up, Permits, Fees 3.0% Working Capital per estimate
Total Plant Cost FEDERAL & STATE GRANTS
872,833 3,249 , 766
13,291,414 5,095,688 6,168,265
1 0,122,97 1 934,981 968,430
5,324,706 $46,029,054
$?,6? 1,017 $920,58 t
$3,682,324 $5,523,486 $4,602,905 $1,380,872 $1,058,401 1 mos Raw matls. + O&M
$0 I ,
~~
Net Capital Investment
Note: Indirect Capital Costs are adjusted to account for location specific construction issues.
PFI Page 5
co-located usu ni t s
NREL 2 STAGE DILUTE SULFURIC ACID HYDROLOSIS - PRO FORMA Rev. 4 6/14/99
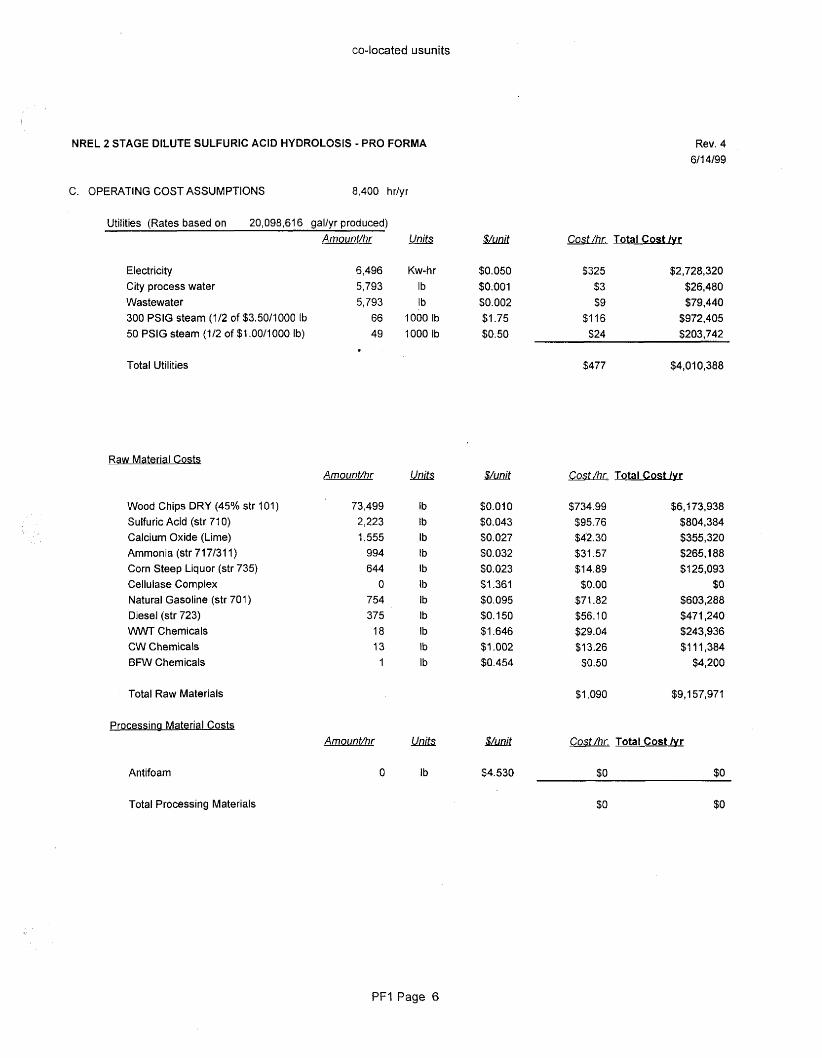
C. OPERATlNG COST ASSUMPTIONS 8,400 hr/yr
Utilities (Rates based on 20,098,616 gal/yr produced) AmounVhr Units $/unit Cost /hr. Total Cost lvr
Electricity 6,496 Kw-hr $0.050 $325 $2,728,320 City process water 5,793 Ib $0.001 $3 $26,480 Wastewater 5,793 Ib $0.002 $9 $79,440 300 PSlG steam (1/2 of $3.50/1000 Ib 66 1000 Ib $1.75 $1 16 $972,405
$203,742
Total Utilities $477 $4,010,388
50 PSlG steam (112 of $1.00/1000 Ib) 49 1000 Ib $0.50 $24 .
Raw Material Costs
Wood Chips DRY (45% str 101) Sulfuric Acid (str 71 0) Calcium Oxide (Lime) Ammonia (str 717131 1) Corn Steep Liquor (str 735) Cellulase Complex Natural Gasoline (str 701) Diesel (str 723) WVVT Chemicals CW Chemicals BFW Chemicals
Total Raw Materials
Processina Material Costs
Antifoam
AmounVhr
73,499 2,223 1,555
994 644
0 754 375
18 13 1
AmounVhr
0
Ib Ib lb tb Ib ib Ib Ib Ib Ib Ib
units
Ib
$/unit
$0.01 0 $0.043 $0.027 $0.032 $0.023 $1.361 $0.095 $0.150 $1.646 $1.002 $0.454
Cost/hr. Total Cost lvr
$734.99 $95.76 $4'2.30 $31.57 $1 4.89
$0.00 $71.82 $56.10 $29.04 $1 3.26
$0.50
$6,173,938 $804,384 $355,320 $265,188 $125,093
$0 $603,288 $471,240 $243,936 $1 11,384
$4,200
$1,090 $9,157,971
$/mil Costhr. Total Cost lvr
$4.530 $0 $0
Total Processing Materials $0 $0
PFI Page 6
co-located usunits
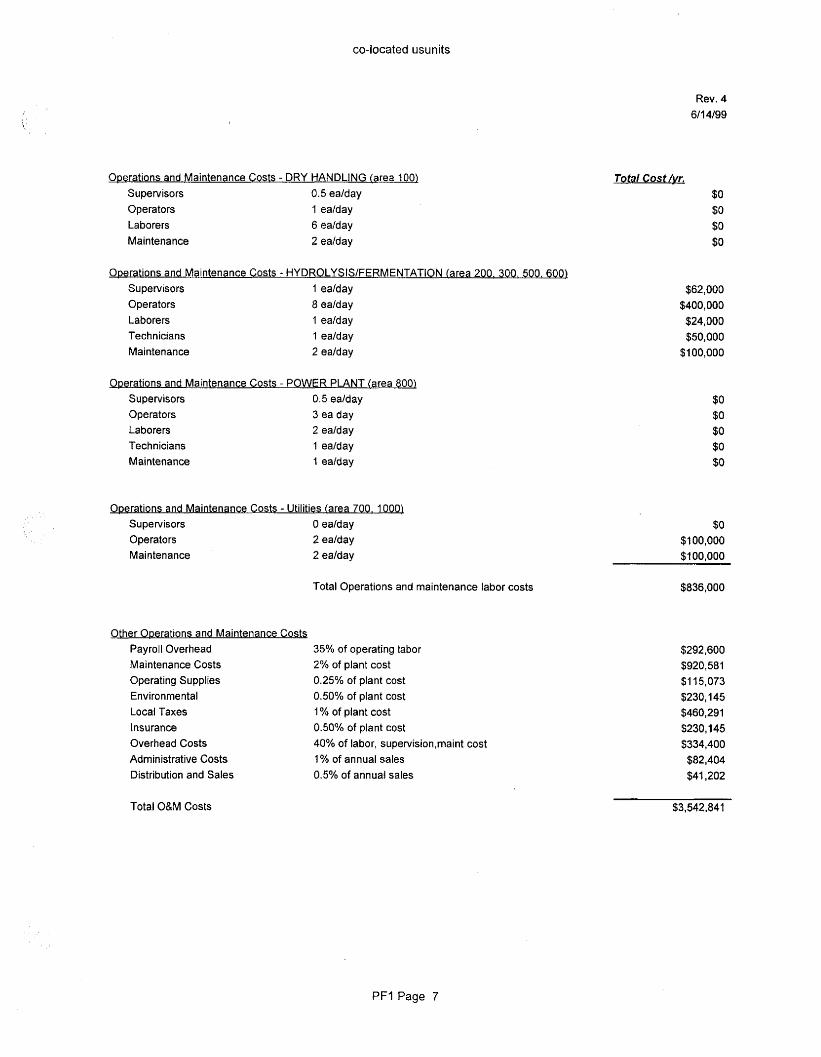
Rev. 4 611 4/99
Operations and Maintenance Costs - DRY HANDLING (area 100) Supervisors 0.5 ealday Operators 1 ea/day Laborers 6 ea/day Main ten a nce 2 ealday
Operations and Maintenance Costs - HYDROLYSlSlFERMENTATION (area 200. 300. 500,600) Supervisors 1 ea/day Operators 8 ealday Laborers 1 ealday Technicians 1 ealday Maintenance 2 ealday
Operations and Maintenance Costs - POWER PLANT (area 8001 Supervisors 0.5 ea/day Operators 3 ea day Laborers 2 ealday Technicians 1 ealday Maintenance 1 ealday
Ogerations and Maintenance Costs - Utilities (area 700. 1000) Supervisors 0 ealday Operators 2 ealday Maintenance 2 ealday
Total Operations and maintenance labor costs
Other Otmations and Maintenance Costs Payroll Overhead 35% of operating tabor Maintenance Costs 2% of plant cost Operating Supplies 0.25% of plant cost Environmental 0.50% of plant cost Local Taxes 1 % of plant cost Insurance 0.50% of plant cost Overhead Costs 40% of labor, supervision,maint cost Administrative Costs 1 % of annual sales Distribution and Sales 0.5% of annual sales
$0 $0 $0 $0
$62,000 $400,000 $24,000 $50,000 $1 00,000
$0 $0 $0 $0 $0
$0 $1 00,000 $1 00.000
$836,000
$292,600 $920,581 $1 15,073 $230,145 $460,291 $230,145 $334,400
$82,404 $41,202
Total O&M Costs
PFI Page 7
$3,542,84 1
co-located usunits
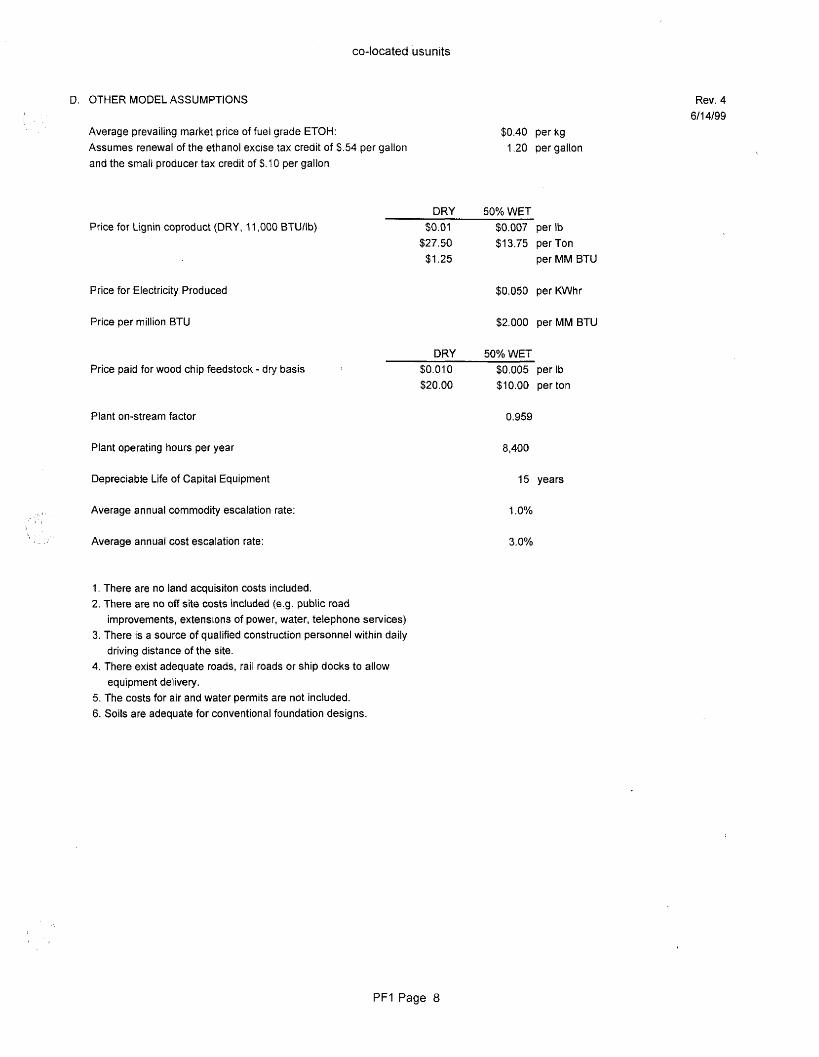
D. OTHER MODEL ASSUMPTIONS
Average prevailing market price of fuel grade ETOH: Assumes renewal of the ethanol excise tax credit of $234 per gallon and the small producer tax credit of $.I0 per gallon
Price for Lignin coproduct (DRY, 11,000 BTUllb)
Price for Electricity Produced
Price per million BTU
Price paid for wood chip feedstock - dry basis
Plant on-stream factor
Plant operating hours per year
Depreciable Life of Capital Equipment
Average annual commodity escalation rate:
, Average annual cost escalation rate:
Rev. 4 6/ 1 4/99
$0.40 perkg 1.20 per gallon
DRY 50%WET $0.01 $0.007 per Ib
$27.50 $1 3.75 per Ton $1.25 per MM BTU
$0.050 per KWhr
$2.000 per MM BTU
DRY 50%WET $0.010 $0.005 per Ib $20.00 $10.00 per ton
1. There are no land acquisiton costs inciuded. 2. There are no off site costs included (e.g. public road
improvements, extensions of power, water, telephone services) 3. There is a source of qualified construction personnel within daily
driving distance of the site. 4. There exist adequate roads, rail roads or ship docks to allow
equipment delivery. 5. The costs for air and water permits are not included. 6. Soils are adequate for conventional foundation designs.
0.959
8,400
15 years
1 .Q%
3.0%
PFI Page 8
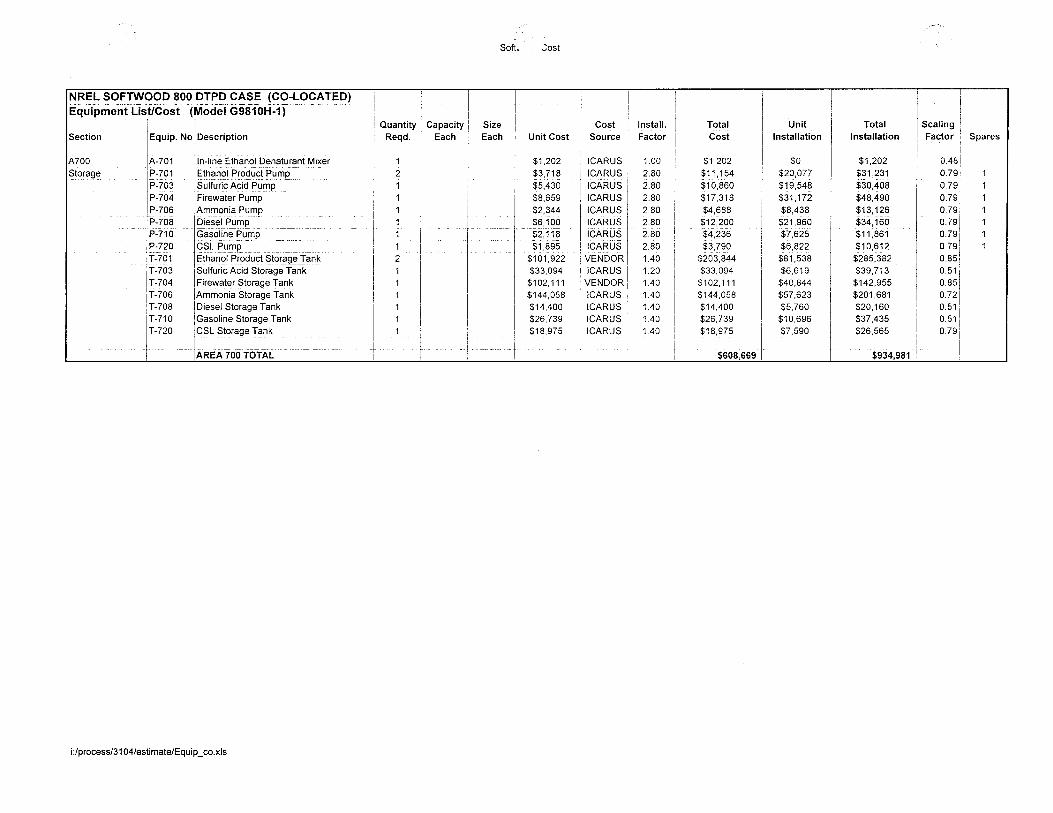
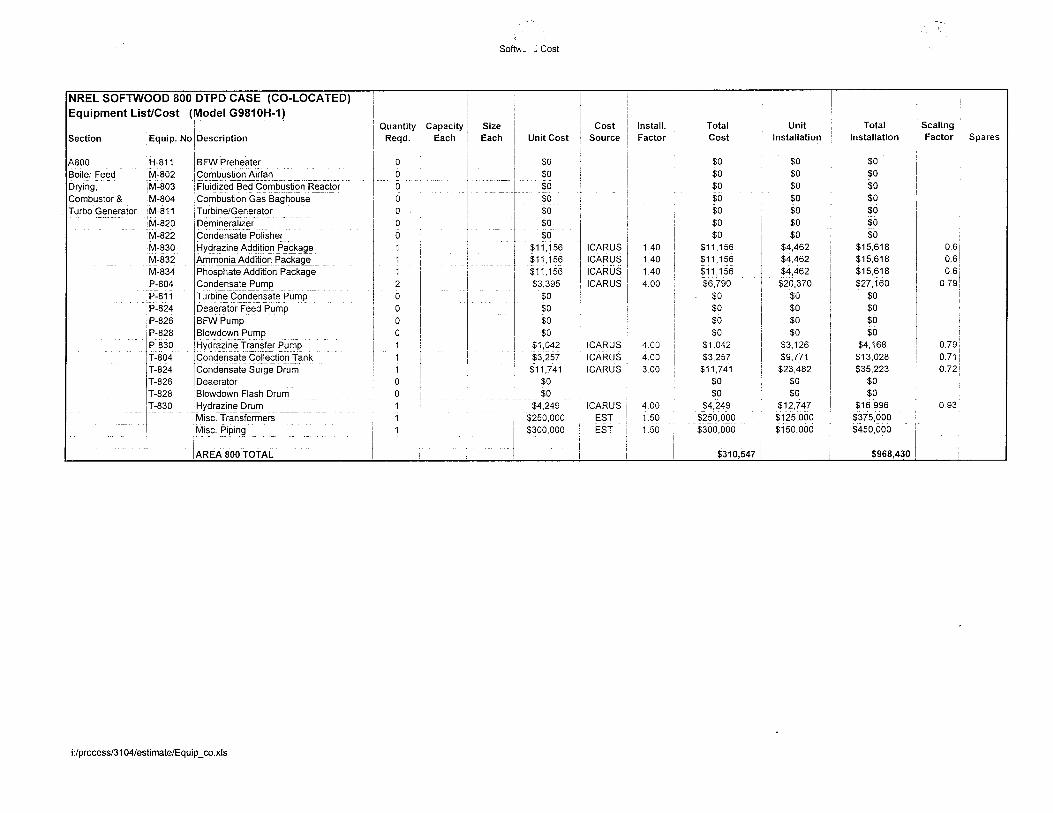
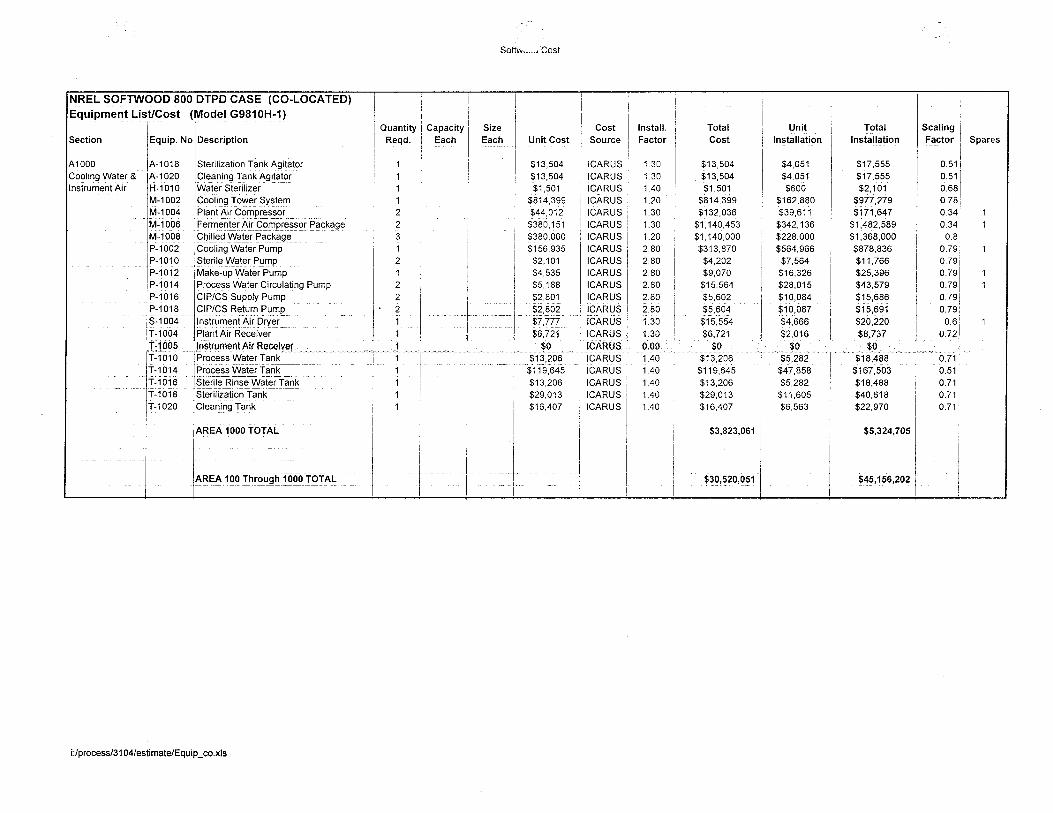
c. Equipment List
Please see the following pages.
26
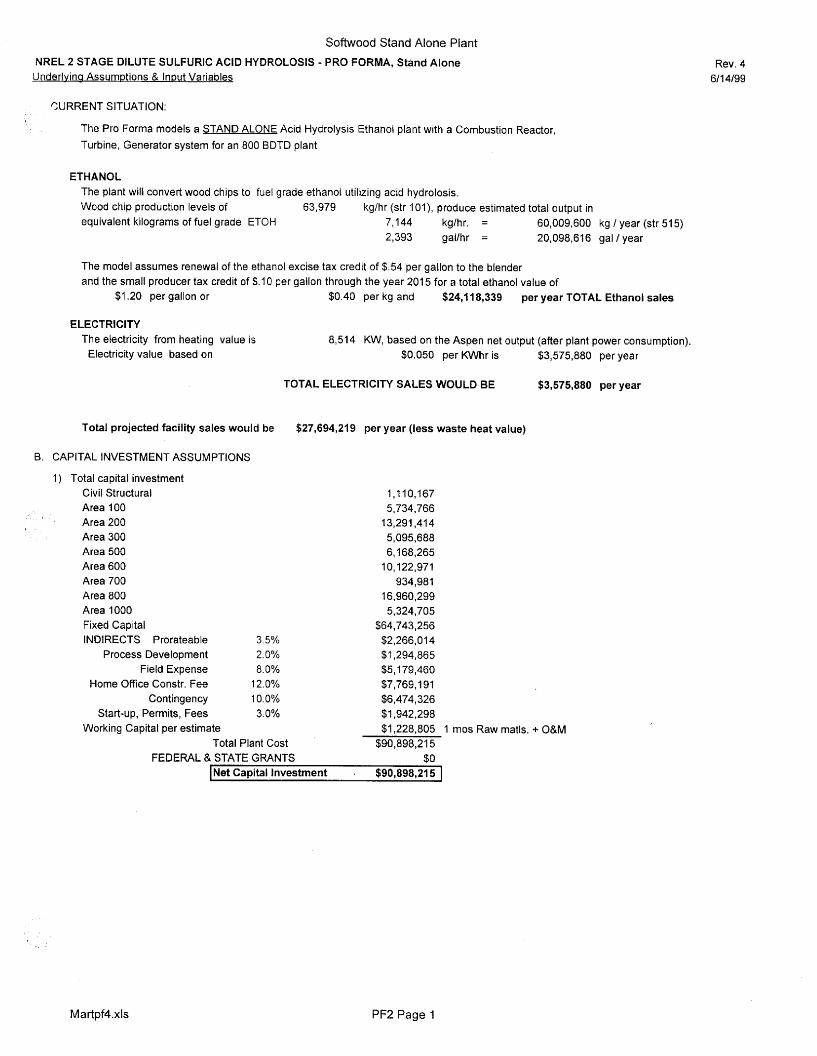
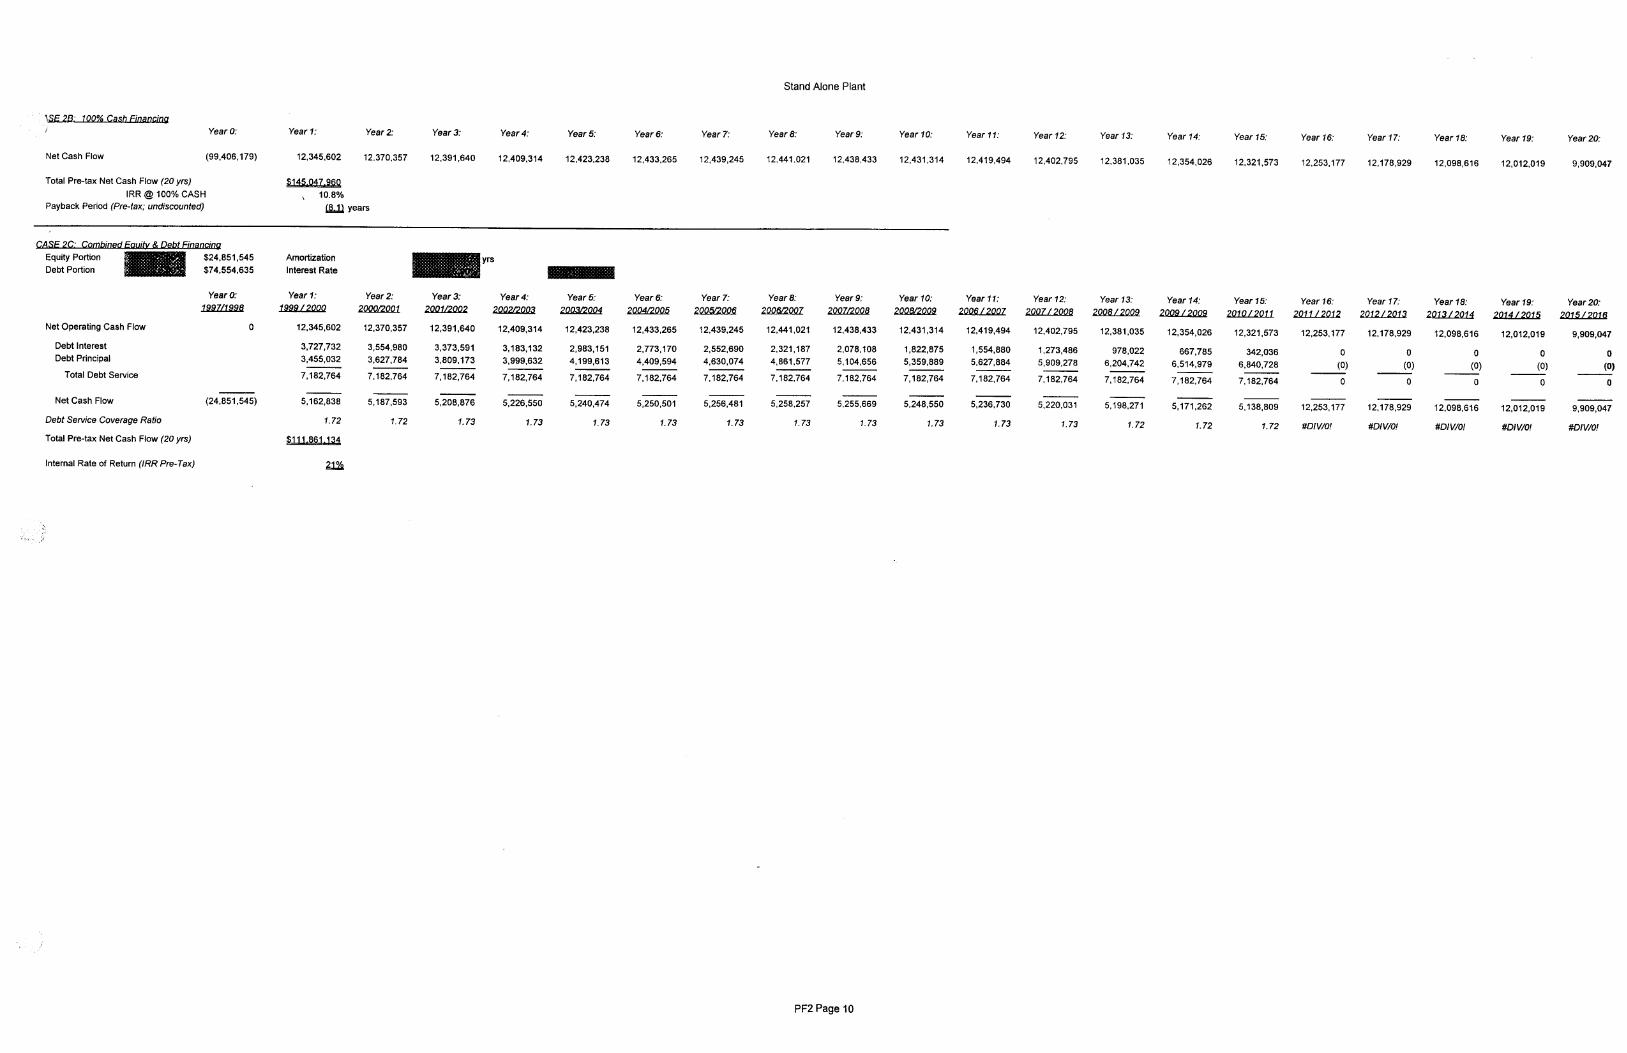
Softwood Stand Alone Plant
NREL 2 STAGE DILUTE SULFURIC ACID HYDROLOSIS - PRO FORMA, StAnd Alone Underlvina AssumDtions & Input Variables
CURRENT SITUATION:
The Fro Forma models a STAND ALONE Acid Hydrolysis Ethanol plant with a Combustion Reactor, Turbine, Generator system for an 800 BDTD plant
ETHANOL The plant will convert wood chips to fuel grade ethanol utilizing acid hydrolosis. Wood chip production levels of equivalent kilograms of fuel grade ETOH 7,144 kglhr. = 60,009,600 kg I year (str 51 5)
63,979 kghr (str IOI), produce estimated total output in
2,393 gallhr = 20,098,616 gal / year
The model assumes renewal of the ethanol excise tax credit of $1.54 per gallon to the biender and the small producer tax credit of $10 per gallon through the year 2015 for a total ethanol value of
$1.20 per gallon or $0.40 per kg and $24,118,339 per year TOTAL Ethanol sales
ELECTRICITY The electricity from heating value is 8,514 KW, based on the Aspen net output (after plant power consumption).
Electricity value based on $0.050 per KWhr is $3,575,880 per year
TOTAL ELECTRICITY SALES WOULD BE $3,575,880 per year
Total projected facility sales would be $27,694,219 per year (less waste heat value)
B. CAPITAL INVESTMENT ASSUMPTIONS
1) Total capital investment Civil Structural Area 100 Area 200 Area 300 Area 500 Area 600 Area 700 Area 800 Area 1000 Fixed Capital INDIRECTS Prorateable
Process Development Field Expense
Home Office Constr. Fee Contingency
Start-up, Permits, Fees
3.5% 2.0% 8.0%
12.0% 10.0% 3.0%
1 , 1 1 0,167 5,734,766
13,291,414 5,095,688 6,168,265
10,122,971 934,981
16,960,299 5,324,705
$64,743,256 $2,266,014 $? ,294,865 $5,179,460 $7,769,191 $6,474,326 $1,942,298
Working Capital per estimate $1,228,805 1 mos Raw matls. + O&M Total Plant Cost $90,898,215
FEDERAL 8 STATE GRANTS $0
Rev. 4 611 4/99
lNet Capital Investment I $90,898,215 I
Martpf4.xls PF2 Page 1
Softwood Stand Alone Plant
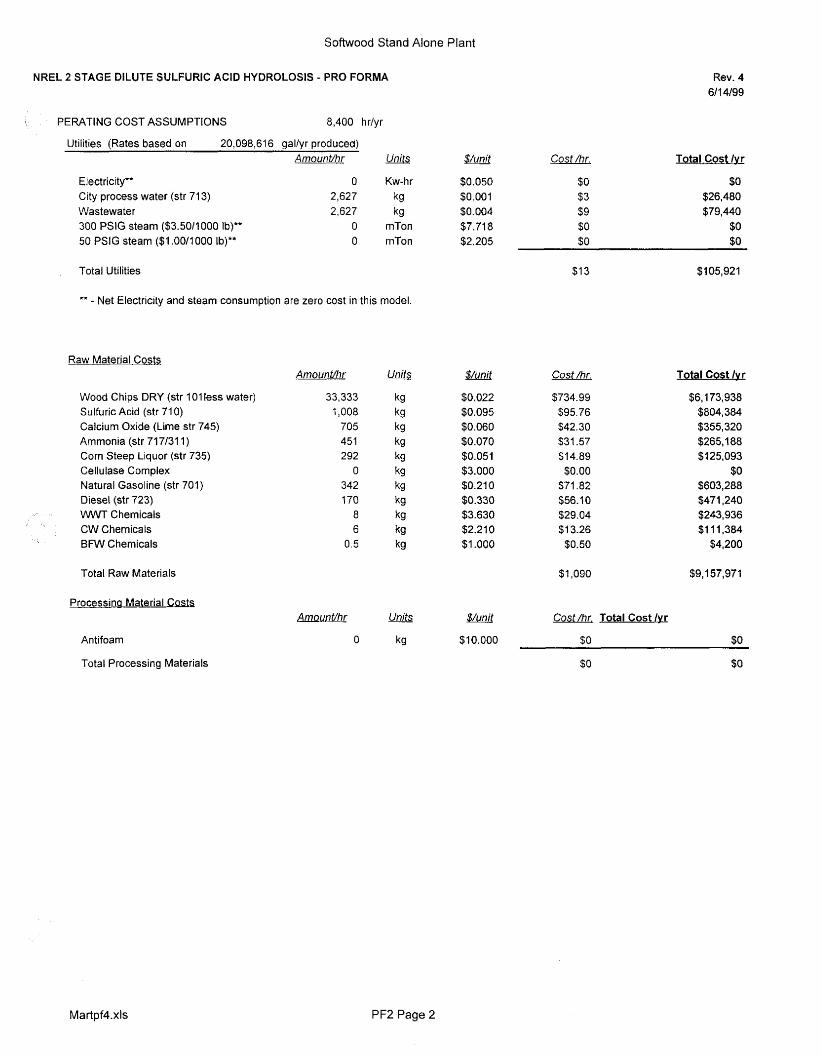
NREL 2 STAGE DILUTE SULFURIC ACID HYDROLOSIS - PRO FORMA Rev. 4 611 4/99
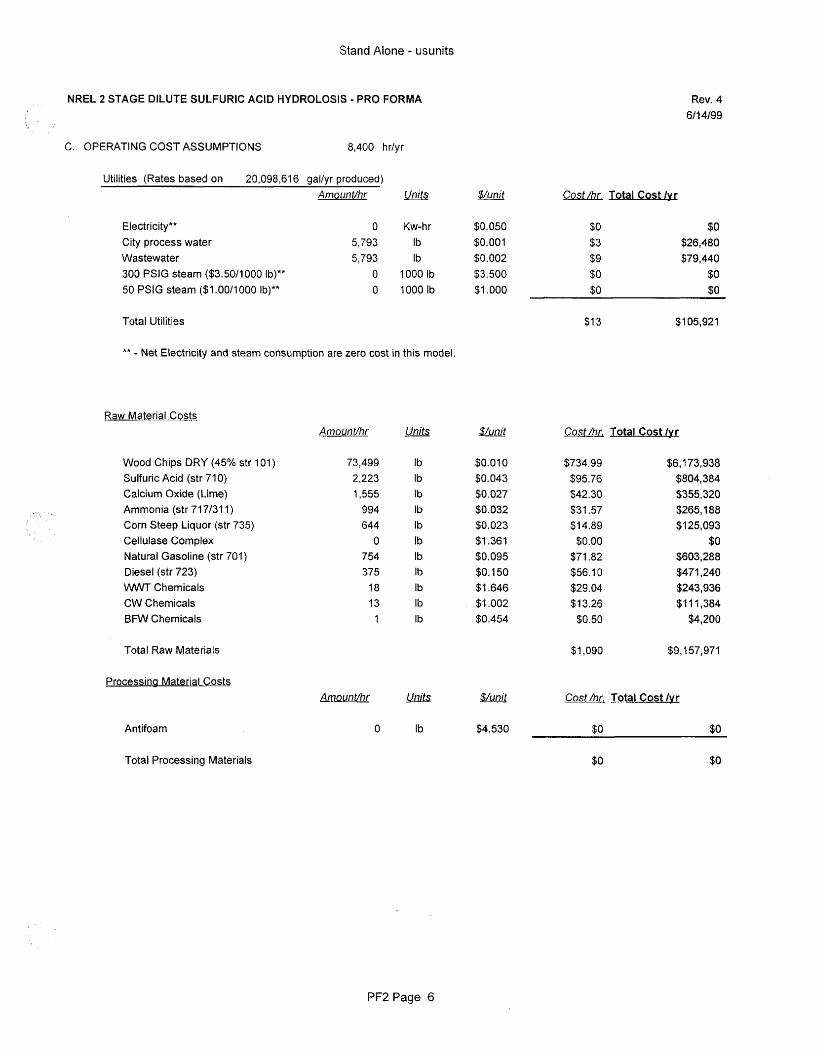
1, PERATING COST ASSUMPTIONS 8,400 hr/yr
Utilities (Rates based on 20,098,616 gal/yr produced) A moun t/hr Units $/unit Cost /hr. Total Cost Ivr
Electricity** City process water (str 71 3) Wastewater 300 PSlG steam ($3.5011000 I,)** 50 PSlG steam ($1.00/1000 Ib)**
0 Kw-hr $0.050 2,627 kg $0.001 2,627 kg $0.004
0 mTon $7.71 8 0 mTon $2,205
$0 $3 $9 $0 $0
$0 $26,480 $79,440
$0 $0
Total Utilities $1 3 $1 05,921
** - Net Electricity and steam consumption are zero cost in this model
Raw Material Costs Units $/unit
$0.022 $0.095 $0.060 $0.070 $0.051 $3.000 $0.21 0 $0.330 $3.630 $2.21 0 $1 .ooo
Cost /hr. AmounUhr Total Cost Ivr
$6,173,938 $804,384 $355,320 $265,188 $1 25,093
$0 $603,288 $471,240 $243,936 $1 1 1,384
$4,200
Wood Chips DRY (str 101 less water) Sulfuric Acid (str 71 0) Calcium Oxide (Lime str 745) Ammonia (str 717131 1) Corn Steep Liquor (str 735) Cellulase Complex Natural Gasoline (str 701) Dieset (str 723) W Chemicals CW Chemicals BFW Chemicals
33,333
705 451 292
0 342 170
8 6
0.5
i ,008 $734.99
$95.76 $42.30 $31.57
$0.00 $71.82 $56.10 $29.04 $1 3.26 $0.50
$1 4 8 9
Total Raw Materials $1,090 $9,157,971
Processina Material Costs $/unit
$lO.OOO
ArnounVhr
0
Cost/hr. Total Cost /vr
Ant ifoam $0 $0
$0 $0 Total Processing Materials
Martpf4.xls PF2 Page 2
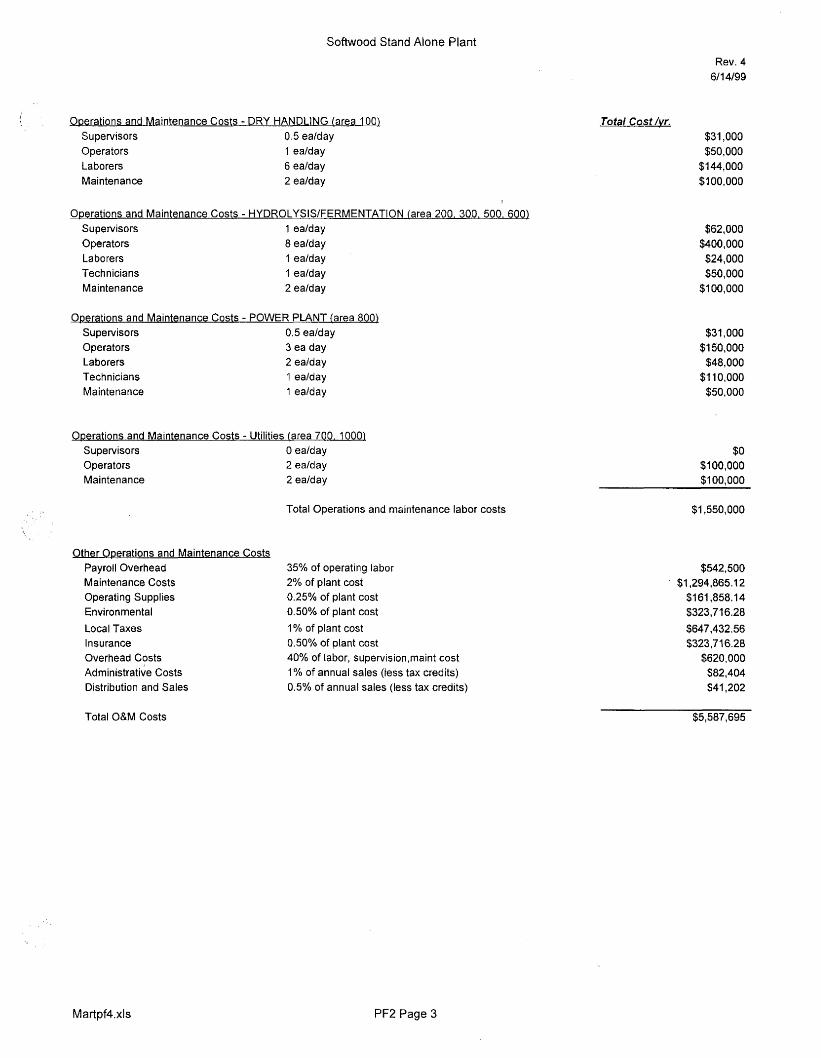
Softwood Stand Alone Plant Rev. 4 611 4/99
1 Ooerations and Maintenance Costs - DRY HANDLING [area 100) Supervisors 0.5 ealday 0 pe rato rs 1 ealday Laborers 6 ealday M ain ten an ce 2 ealday
Total Cost /vr. $31,000 $50,000 $1 44,000 $1 00,000
Operations and Maintenance Costs - HYDROLYSISIFERMENTATION (area 200. 300. 500, 6001 Supervisors 1 ealday Operators 8 ealday Laborers 1 ealday Technicians 1 ealday Maintenance 2 ealday
Operations and Maintenance Costs - POWER PLANT (area 800) Supervisors 0.5 ealday Operators 3 ea day Laborers 2 ealday Technicians 1 ealday Maintenance 1 ealday
ODerations and Maintenance Costs - Utilities (area 700. 1 O O O l Supervisors 0 ealday Operators 2 eaiday Main ten an ce 2 ealday
Total Operations and maintenance labor costs
Other Operations and Maintenance Costs Payroll Overhead Maintenance Costs Operating Supplies Environmental Local Taxes Insurance Overhead Costs Administrative Costs Distribution and Sales
35% of operating labor 2% of plant cost 0.25% of plant cost 0.50% of plant cost 1% of plant cost 0.50% of plant cost 40% of labor, supervision,rnaint cost 1 % of annual sales (less tax credits) 0.5% of annual sales (less tax credits)
$62,000 $400,000 $24,000 $50,000
$1 00,000
$31,000 $150,000 $48,000
$1 10,000 $50,000
$0 $100,000 $100.000
$1,550,000
$542,500 $1,294,865.12 $161,858.14 $323,716.28 $647,432.56 $323,716.28
$620,000 $82,404 $41,202
Total 0 8 M Costs $5,587,695
Martpf4,xls PF2 Page 3
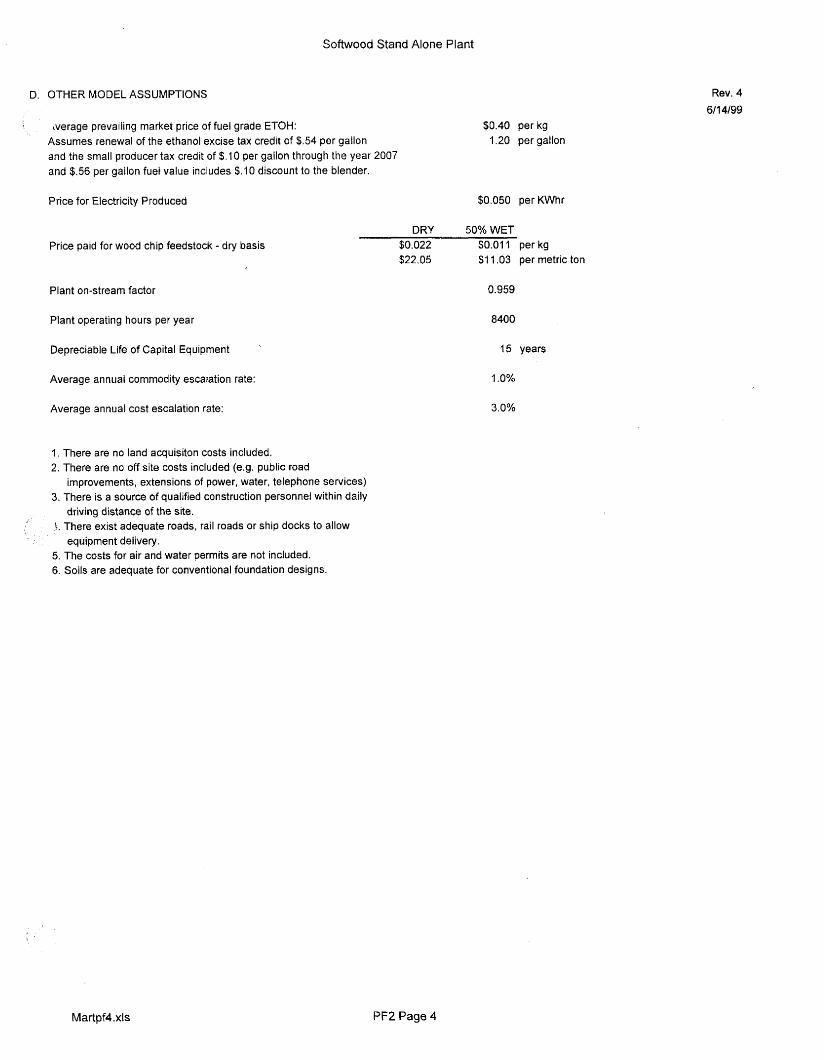
Softwood Stand Alone Plant
D. OTHER MODEL ASSUMPTIONS
% tverage prevailing market price of fuel grade ETOH: Assumes renewal of the ethanol excise tax credit of $.54 per gallon and the small producer tax credit of $.I0 per gallon through the year 2007 and $.56 per gallon fuel value includes $.I0 discount to the blender.
Price for Electricity Produced
Price paid for wood chip feedstock - dry basis
Plant on-stream factor
Plant operating hours per year
Depreciable Life of Capital Equipment ~
Average annual commodity escalation rate:
Average annual cast escalation rate:
Rev. 4 6/14/99
$0.40 per kg 1.20 per gallon
$0.050 per KWhr
DRY 50%WET $0.022 $0.011 perkg $22.05 $1 1.03 per metric ton
0.959
8400
15 years
1 .O%
3.0%
1. There are no land acquisiton costs included. 2. There are no off site costs included (e.g. public road
improvements, extensions of power, water, telephone services) 3. There is a source of qualified construction personnel within daily
driving distance of the site. 1. There exist adequate roads, rail roads or ship docks to allow
equipment delivery. 5. The costs for air and water permits are not included. 6. Soils are adequate for conventional foundation designs.
’
Martpf4 .XIS PF2 Page 4
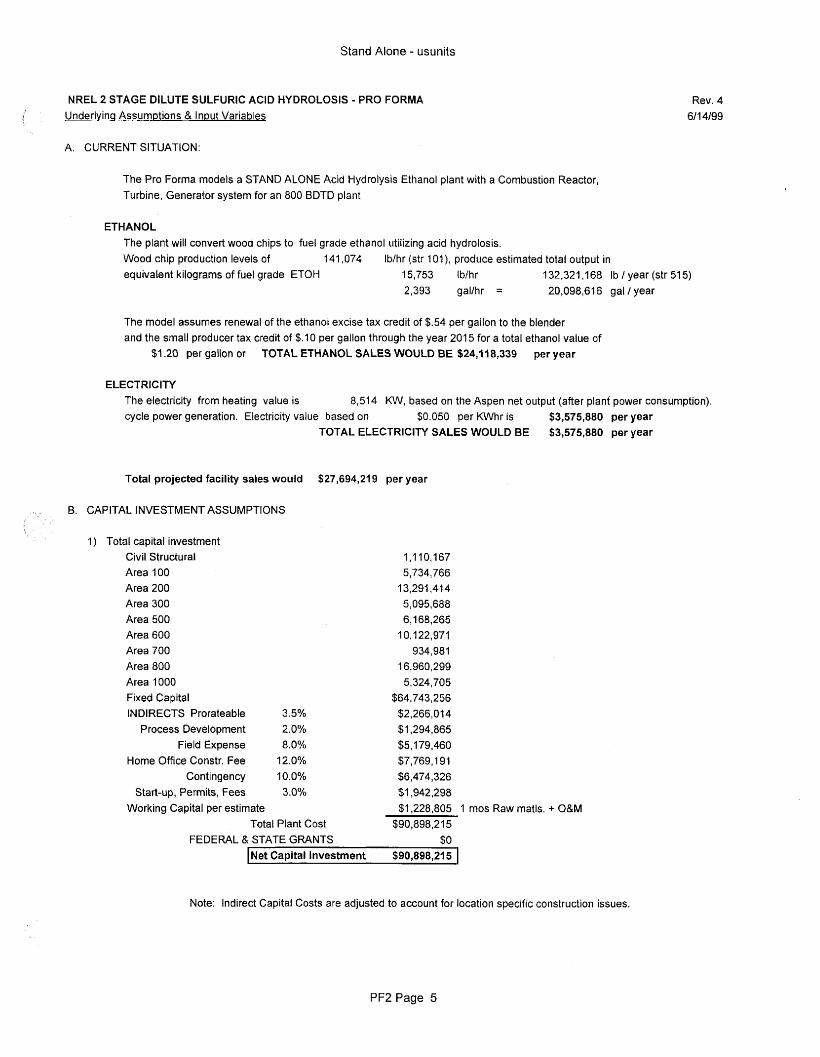
Stand Alone - usunits
NREL 2 STAGE DILUTE SULFURIC ACID HYDROLOSIS - PRO FORMA 1 Underlyincl AssumDtions & Input Variables
A. CURRENT SITUATION:
Rev. 4 611 4/99
The Pro Forma models a STAND ALONE Acid Hydrolysis Ethanol plant with a Combustion Reactor, Turbine, Generator system for an 800 BDTD plant
ETHANOL The plant will convert wood chips to fuel grade ethanol utilizing acid hydrolosis. Wood chip production levels of equivalent kilograms of fuel grade ETOH 15,753 Ib/hr 132,321,168 Ib /year (str 515)
141,074 Ib/hr (str I O I ) , produce estimated total output in
2,393 gallhr = 20,098,616 gal / year
The model assumes renewal of the ethanol excise tax credit of $.54 per gallon to the blender and the small producer tax credit of $.lo per gallon through the year 2015 for a total ethanol value of
$1.20 per gallon or TOTAL ETHANOL SALES WOULD BE $24,118,339 per year
ELECTRICITY The electricity from heating value is cycle power generation. Electricity value based on $0.050 per KWhr is $3,575,880 per year
TOTAL ELECTRICITY SALES WOULD BE $3,575,880 per year
8,514 KW, based on the Aspen net output (after plant power consumption).
Total projected facility sales would $27,694,219 per year
, B. CAPITAL INVESTMENT ASSUMPTIONS
1) Total capital investment Civil Structural Area 100 Area 200
1,110,167 5,734,766
13,291,414 Area 300 5,095,688 Area 500 6,168,265 Area 600 10,122,971 Area 700 934,981 Area 800 Area 1000 Fixed Capital INDIRECTS Prorateable
Process Development Field Expense
Home Office Constr. Fee Contingency
Start-up, Permits, Fees
3.5% 2.0% 8.0%
12.0% 10.0% 3.0%
16,960,299 5,324,705
$64,743,256 $2,266,014 $1,294,865 $5,179,460 $7,769,191 $6,474,326 $1,942,298
Working Capital per estimate $1,228,805 1 mos Raw matls. + O&M Total Plant Cost $90,898,215
FEDERAL & STATE GRANTS $0 I Net Capital Investment $90,898.2151
Note: Indirect Capital Costs are adjusted to account for location specific construction issues.
PF2Page 5
Stand Alone - usunits
NREL 2 STAGE DILUTE SULFURIC ACID HYDROLOSIS - PRO FORMA
C. OPERATING COST ASSUMPTIONS 8,400 h rly r
Utilities (Rates based on 20,098,616 gallyr produced) AmounVhr units
0 Kw-hr Electricity** City process water 5,793 Ib Wastewater 5,793 Ib 300 PSlG steam ($3.50/1000 I,)** 0 1000 Ib 50 PSlG steam ($1.0011 000 I,)** 0 1000 Ib
Total Utilities
** - Net Electricity and steam consumption are zero cost in this model.
Raw Material Costs
Wood Chips DRY (45% str 101) Sulfuric Acid (str 71 0) Calcium Oxide (Lime) Ammonia (str 71 7/31 1) Corn Steep Liquor (str 735) Cellulase Complex Natural Gasoline (str 701) Diesel (str 723) WWT Chemicals CW Chemicals BR/V Chemicals
Total Raw Materiats
Processina Material Costs
Antifoam
Total Processing Materials
AmounWhr
73,499 2,223 1,555
994 644
0 754 375
18 13
1
Units
Ib Ib Ib Ib Ib Ib Ib Ib Ib Ib Ib
Amoun Whr m
0 Ib
$/unit
$0.050 $0.001 $0.002 $3.500 $1 .ooo
Rev. 4 6/14/99
Cost/hr. Total Cost Ivr
$0 $0 $3 $26,480 $9 $79,440 $0 $0 $0 $0
$/unit
$0.01 0 $0.043 $0.027 $0.032 $0.023 $1.361 $0.095 $0.1 50 $1.646 $1.002 $0.454
$1 3 $1 05,921
Cost /hr. Total Cost Ivr
$734.99 $95.76 $42.30 $31.57 $14.89 $0.00
$71.82 $56.10 $29.04 $1 3.26 $0.50
$6,173,938 $804,384 $355,320 $265,188 $1 25,093
$0 $603,288 $471,240 $243,936 $1 1 f ,384
$4,200
$1,090 $9,157,971
$/unit Cost /br. Total Cost Ivr
$4.530 $0 $0
$0 $0
PF2Page 6
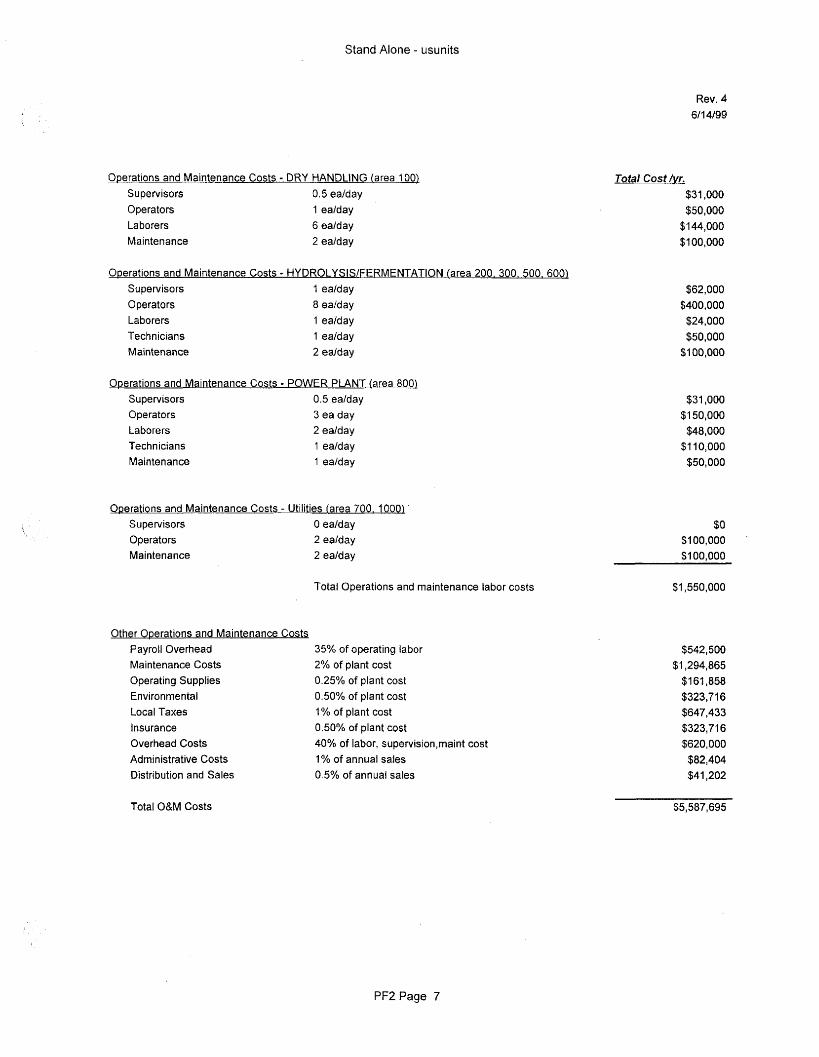
Stand Alone - usunits
Rev. 4 611 4/99
Operations and Maintenance Costs - DRY HANDLING (area 100) Supervisors 0.5 ea/day Operators 1 ea/day La borers 6 ealday Maintenance 2 ea/day
Operations and Maintenance Costs - HYDROLYSlSlFERMENTATION (area 200. 300, 500. 600) Supervisors 1 ealday 0 perators 8 ealday Laborers 1 ealday Technicians 1 ealday Maintenance 2 ealday
Operations and Maintenance Costs - POWER PLANT (area 800) Supervisors 0.5 ealday Operators 3 ea day Laborers 2 ealday Technicians 1 ea/day Maintenance 1 ealday
Operations and Maintenance Costs - Utilities (area 700. 10001' Supervisors 0 ealday Operators 2 ealday Maintenance 2 ealday
Total Operations and maintenance labor costs
Other Operations and Maintenance Costs Payroll Overhead 35% of operating labor Maintenance Costs 2% of plant cost Operating Supplies 0.25% of plant cost Environmental 0.50% of plant cost Local Taxes 1% of plant cost Insurance 0.50% of plant cost Overhead Costs 40% of labor, supervision,maint cost Administrative Costs 1 % of annual sales Distribution and Sales 0.5% of annual sales
Total Cost /vr. $31,000 $50,000
$1 44,000 $1 00,000
$62,000 $400,000 $24,000 $50,000
$1 00,000
$31,000 $1 50,000 $48,000
$1 10,000 $50,000
$Q $1 00,000 $1 00.000
$1,550,000
$542,500 $1,294,865
$1 61,858 $323,716 $647,433 $323,716 $620,000 $82,404 $41,202
Total O&M Costs $5 , 587,695
PFZPage 7
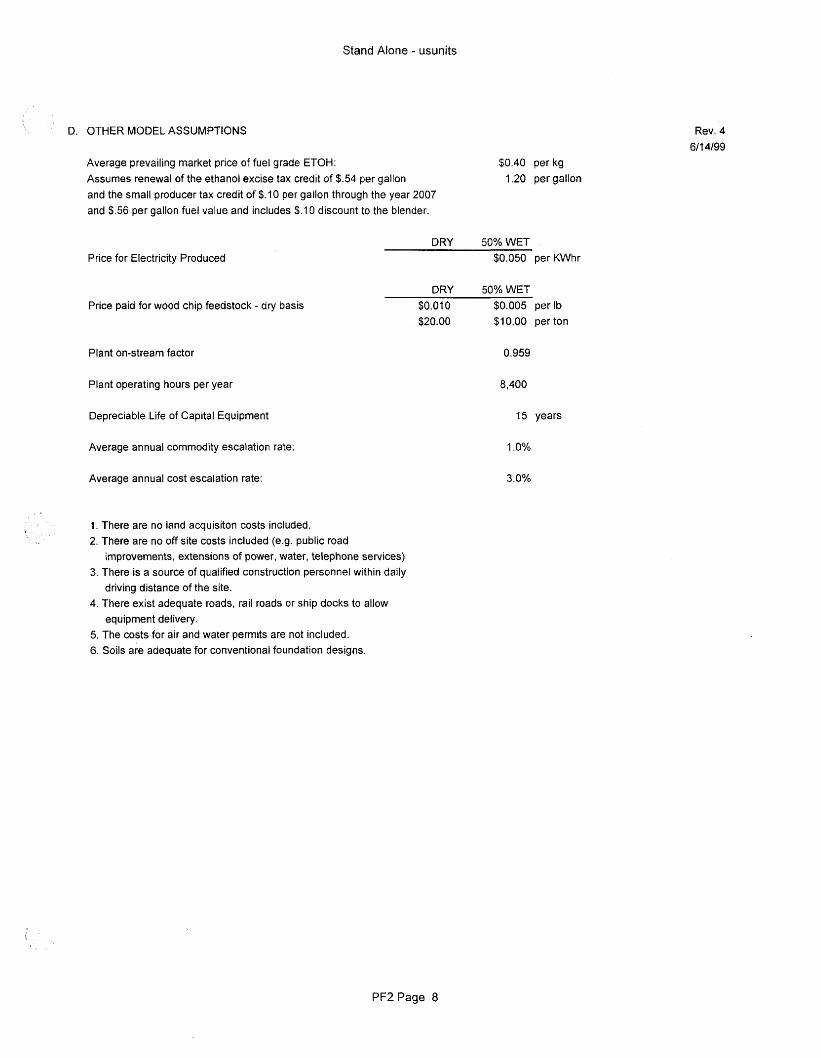
Stand Alone - usunits
D. OTHER MODEL ASSUMPTIONS
Average prevailing market price of fuel grade ETOH: Assumes renewal of the ethanol excise tax credit of $ 3 4 per gallon and the small producer tax credit of $.I0 per gallon through the year 2007 and $.56 per gallon fuel value and includes $.lo discount to the blender.
Price for Electricity Produced
Price paid for wood chip feedstock - dry basis
Plant on-stream factor
Plant operating hours per year
Depreciable Life of Capital Equipment
Average annual commodity escalation rate:
Average annual cost escalation rate:
Rev, 4 6/ 14/99
$0.40 per kg 1.20 per gallon
DRY 50%WET $0.050 per KWhr
DRY 50%WET
1. There are no land acquisiton costs included. 2. There are no off site costs included (e.g. public road
improvements, extensions of power, water, telephone services) 3. There is a source of qualified construction personnel within daily
driving distance of the site. 4. There exist adequate roads, rail roads or ship docks to allow
equipment delivery. 5. The costs for air and water permits are not included. 6. Soils are adequate for conventional foundation designs.
,
$0.01 0 $0.005 per Ib $20.00 $10.00 per ton
0.959
8,400
15 years
1 .O%
3.0%
i
PF2Page 8
APPENDIX A
HEAT OPTIMIZATION
HEAT OPTIMIZATION OBJECTIVE
The softwood, biomass to ethanol process requires a great deal of heat transfer. In prehydrolysis and hydrolysis heat is added to the process. In flash and fermentation heat is withdrawn from the process. In distillation both heating and cooling are needed. In some cases heat transfer can be directly from process stream to process stream thus minimizing the amount of utility heating and cooling required.
Obviously much thought must be given to energy efficiency of the process and the amount of heat exchange equipment required. An evaluation of the potential for heat integration and efficiency was made to identify the probable need for the utility systems required to maintain heat balance.
DESCRIPTION
Heating and cooling requirements were calculated based on the Aspen model flow rates, temperatures and pressures with certain simplifying assumptions. These heat duties were compared in size and temperature level in order to find heat exchange matches which could enhance the energy efficiency of the process. Assumptions that were taken are: 1. 2.
3.
4.
5. 6.
Stream composition was simplified to “water” and “other than water.” Liquid water heat capacity was taken as 1.0 BTU/lb.- O F at all temperature levels in the process. The heat capacity of “Other than water” was taken to be 0.3 BTU/lb.- O F at all temperature levels within the process. All steam was considered to be saturated and steam tables were used to establish energy content. Heat losses to the atmosphere due to insulation inadequacies were ignored. Heat exchange equipment along with transfer coefficients were not defined at this stage.
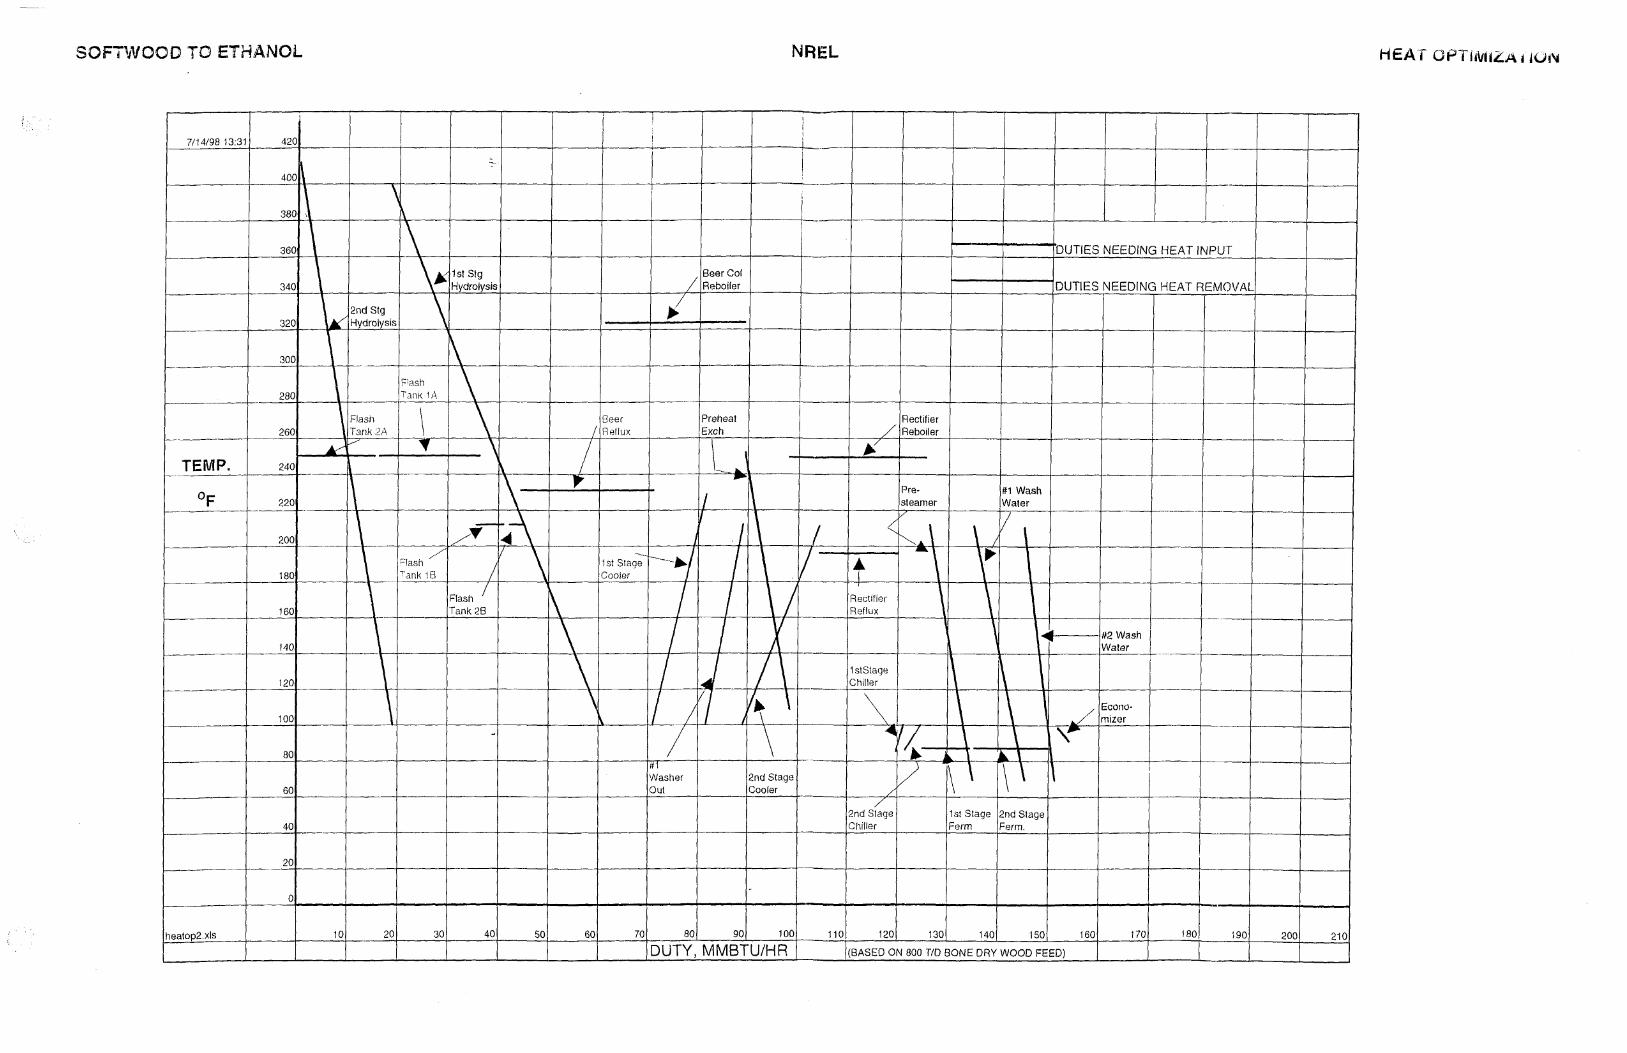
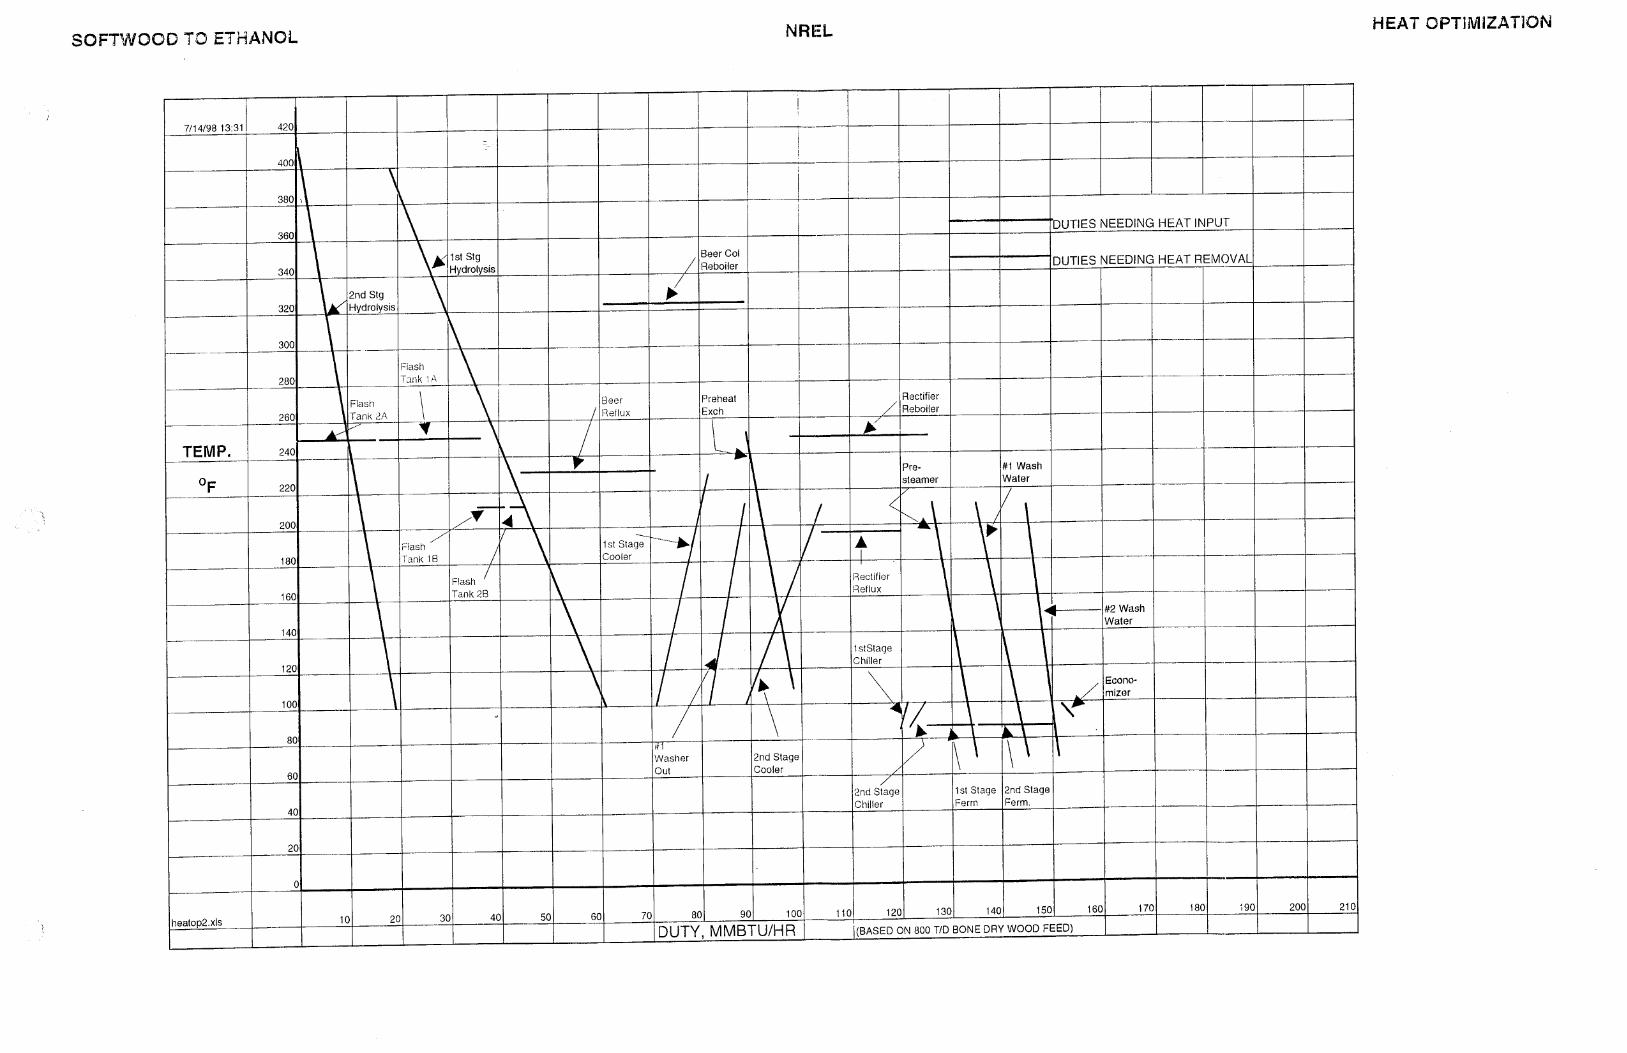
Calculation results are graphically presented on the attached sheet.
29
CONCLUSIONS
Although the amount of heating required by the process and the amount of cooling required by the process are nearly the same, the temperature levels limit the amount of heat integration that can be accomplished. Major heat transfer duties are discussed below:
1’‘ and Znd Stage Hydrolysis Hydrolysis requires the input of heat at a high temperature level. The temperature requirement exceeds the temperature of any of the process streams needing heat removal. Additionally, heat input at the Hydrolyzers is by the direct injection of steam. Hydrolysis heat must be supplied by high pressure steam.
Beer Column Reboiler Similarly, this reboiler requires heat at a high temperature level and must therefore use high pressure steam for the heat source.
Preheat Exchanger and Rectifier Reboiler Flash steam from Flash Tanks 1A and 2A contain nearly enough heat for these services and at nearly a high enough temperature level. It is believed that the flash steam can be supplemented with high pressure steam in order to make it usable in these services.
At least two methods of accompiishing the high pressure steam supplement are foreseen. First, there is the traditional method of using all the flash steam heat in one exchanger(s) and following this with a separate “trim” exchanger using high pressure steam.
A second method which may save significant exchanger cost is to use high pressure steam as motive steam in an ejector that takes suction on the flash steam. The discharge steam would be fixed at a pressure high enough to provide a thermal driving force for the required heat exchange. This method saves exchanger cost but is less flexible. Turn down situations would need to be evaluated during detail engineering.
Pre-steamer (note that the prehydrolysis system has been simpliped and there is no longer a presteamer in the process) Flash steam from Flash Tanks IB and 2B, if supplemented with high pressure steam (as described above) could effectively suppiy this service. Since the Pre- steamer uses direct heat injection the heat source must be steam.
30
#l Washer It is recommended that a feeddischarge exchanger be used to heat wash water supply and cool wash water discharge. Additional heating of the supply may be necessary.
Additional integration of heat usage can certainly be done but will need to be carefully evaluated as multiple exchangers may be required. Increased capital cost will need to be justified by the utility savings.
It may be prudent to consider air cooled exchangers rather than water cooled for the Rectifier reflux and possibly the Beer Column reflux (if suspended solids can be adequately handled in the header boxes).
The first and second stage coolers, upstream of the fernentors, are large cooling loads that currently are supplied by cooling water.
The fernentors have large cooling loads which are shown on the flow diagrams as being supplied by chilled water. It may be best to continue this design as it provides good control and reliability of cooling for the fermentors.
31

APPENDIX B
TRIP REPORTS
31
1. HIGH PLAIN§ CORPORATION, YORK, NE
DATE: May 1,1998 PROJECT: NREL Softwood to Ethanol PROJ. NO.: 19013104 LOCATION: ATTENDEES: Kiran Kadam NREL
Quang Nguyen NREL
High Plains Corp. Ethanol Plant - York, Nebraska
Joe Ruocco Merrick Fran Ferraro Merrick Dick Voiles Merrick Rochelle Dageforde High Plains
The plant is a 100,000 gal/day design for the production of ethanol from corn or milo. Feed grain is delivered to the plant via truck. Of the approximately 40 million gallonsiyear production capability, up to 18 million gallons can be treated to Industrial Grade ethanol. The plant employs about 65 people:
less than 40 people in operations about 20 people in maintenance
5 people in administration
High Plains has the capability to store up to 4.5 days of feed in 4 silos. They also use a single day bin to feed 3 hammermills that grind up to 45,000 busheldday. The mills have dust control cyclones and a baghouse with pulse-jet cleaning of the bags. Recovered dust is added to the ground feed and travels with it. There are one Champion mill and two Schutte mills, each with screens on the outlet to control particle size of the grind. The grind is to a coarse flour. This is conveyed in an elevated screw conveyor system at the top of the pipe rack with access walkway on one side of the conveyor(s). Their conveyors were made by Caldwell of Kearney, NE. Following milling, recycle water from multiple sources (backset), ammonia for pH control and an a-amylase are added in a slurry tank which operates at about 150 O F . Next this slurry is pumped and mixed with steam in an eductor to bring the temperature to 225-250'F. The eductor discharges to the top of the cook tube or hydroheater which has a 20 minute residence time. The slurry is then pumped to the Flash Tank and flashed at a slight vacuum (the source of the vacuum is the Rectifier Tower overhead vacuum system) and the temperature falls to 190'F.
Glucoamylase is added to the slurry which is then held in liquifaction tanks (horizontal tanks having three mixers in each tank) and fed to the presaturator where sulfuric acid is added. There is a flash going into the second liquifaction tank and the presaturator operates at 150 O F . A side stream is taken for the production of yeast in a separate vessel.
32
Yeast is propagated for 8 hours and is used for two life cycles. The consumption of purchased yeast is only about 5 boxes per month ( a box looked to be about 30 to 40 lbs.). They changed from Red Star yeast to Alltech All Yeast Super Start recently. Propagator yeast strength is 300 to 400 million cells per liter. From the Presaturator the mixture proceeds to the Sat Tank where it has a 20 minute residence time. From the Sat tank material goes through spiral heat exchangers (Scrolls) to reduce the temperature from 150 to 85’F. There are actually 9 spiral exchangers - three parallel trains having three exchangers in series in each train.
The fermentors are 50 feet in diameter by30 feet tall and have a 720,000 gal working volume in each. Fermentors go through a 60 hour cycle - 20 hours to fill, 20 hours residence and 20 hours to empty and CIP. During filling, at 10% hll and 50% full, yeast is added from the yeast propagators. Fermentors have 64 loops of cooling coils in each. A batch normally is fermented to 13% alcohol. At about 14% alcohol the yeast dies in the fermentation. Gas evolved from the fermentors is scrubbed (counter-current) with water to remove particulates and soluble emissions and then vented to the atmosphere. The tanks upstream of the fermentors have atmospheric vents and do not require scrubbing.
A fermentor can become “hung” because, typically, the temperature got too high and killed the yeast. The fermentor is still pumped to the distillation section but it is high in sugar content and low in alcohol. When this material is recycled to the start of the process, the operators will reduce the amount of feed grain to compensate for the sugar already in the stream.
Fermentors can become contaminated with lactobacillus or acetobacter. If this happens (and it is experienced up to a few times per year) the fermentor is shocked with penicillin or virginmycin.
There are three fermentors and a fourth 720,000 gal vessel which functions as a surge vessel between fermentation and distillation. This surge vessel is called the Beer Well once its contents are about 13% alcohol.
Distillation is conventional having a Beer or Stripping Column with water and alcohol overhead and solids and water out the bottom. Stripper overhead feeds the middle of the Rectifier.
Rectifier overhead goes to mol sieve dryers (3 operating and one regen.) having an 8 min. cycle time. Changes in feed stock to the plant tend to affect the quantity of fuse1 oils produced but not the place where they concentrate in the tower.
This plant also has an industrial alcohol distillation unit which produces higher purity alcohol than required for fuels. It is fed with a stream taken from the second or third tray
33

in the top of the Rectifier. Water is added as a wasldstripping agent and the alcohol re- distilled and dried.
Slurry from the Beer column bottoms is fed to evaporators which concentrate the stream to a syrup. The syrup feeds Sharples horizontal decanter type centrifuges and then goes to gas fired rotary dryers (kiln type). Solid product is used for animal feed. When a fermentor becomes hung it is still sent to the beer column and the bottoms becomes richer in sugars. Since the stillage is recycled to the slurry tank these sugars are recovered. During this time the grain is cut back in the fementors because of the additional sugars in the recycle. It is necessary to disinfect the syrup tank with sodium bisulfite after one of these episodes.
Condensate from the evaporators having 1500 to 2000 mg/iiter COD is feed to anaerobic digestion. Anaerobic digestion (methanators) consists of 4 - 3 0,000 gal. fiberglass vessels, in parallel, which provide 6 hours of residence time. Methanators are sized for 2 gallsq.ft./min. of liquid flow. They are designed for 90 % COD reduction to less than 200 mg/liter COD and have only 3% sludge in the treated water. They operate at 95*F and use caustic for pH control. The patented or proprietary devices in methantors are the devices in the top which allow gas and liquid out but retain the beads. Nutrients must be added to the methanators. A feedeffluent plate and frame exchanger cools the feed from 140'F to 1 lO'F before a trim cooler (water cooled plate and frame exchanger) cools it to the 9 5 O F operating temperature.
Methanator liquid output goes to aeration ponds, then a pump, clarifier and into the city sewage system. The clarifier is a conventional circular, cone bottomed type with scrapers on the cone. Bottoms are returned to the aeration pond and water goes over a weir to the city sewer.
General plant items: The three highest maintenance items in the plant are:
1. The mixers on the liquifaction tanks. If pH or enzyme concentration gets out of range, there is a sharp rise in viscosity which leads to mixer bushing failures, motor/drive overload and other problems. These mixers have bottom (steady) bushings.
2. The centrifuges due to normal wear. 3. The dryers and conveyors.
* Cooling tower bIowdown is not treated but goes directly to the city sewers. Chilled water is provided by York self contained mechanical refrigeration machines. They are only needed in the summer. Normal chilled water temperature is 55'F. Total water usage (recycle and fresh) is 20 gal/bushel of feed. Most is for cooling tower makeup. The control system is Johnson - Yokogawa.
34
The centrifuges and most centrifugal pumps are driven by variable speed electric motors. Seven streams feed water to the Recycle Tank - 25% of the evaporator condensate, most of the stillage (Beer Column Bottoms) and all of the Rectifier Column Bottoms go to this tank. From the Recycle Tank water is sent to the evaporators or to the Cook Tube.
35
2. S I E m PACIFIC INDUSTRY, MARTELL, CA
DATE: Mav 19,3998 PROJECT: NREL Softwood to Ethanol PROJ. NO.: 19013q04 LOCATION: Martell Cogeneration Plant - Martell, California ATTE N D EES : Kiran Kadam NREL
Mark Yancev NREL Fran Ferraro Merrick Bob Hamilton Merrick Eric SelVa Wheelabrator Martell Inc. Alan Jacobson TSS Consultants, Inc. Matt Turner Dick Maqnum Amador County Frank Jerautd Conservation District
Pin n acle E nvi ron menta I So I u tio ns
The Martell site is located at the Sierra Pacific Industry lumber mill in Martell, California. The generating station produces 18 MW of electricity while burning variable amounts of agricultural wastes, municipal wastes, and forest trimmings with an average moisture content of 4045%. The lignin residue from an ethanol plant could be burned in the boiler if the moisture content were similar. It is possible to obtain 11,500 BTU/dry LB lignin. The generating station capacity y is 140,000 dry tons per year of biomass and the station pays $15-$25 per DTPD for biomass delivered to the site. They receive an average of I 7 DTPD per truck and 50 trucks per day. This translates into A40,OOO dry tons per year and could be increased to 45,000 acres per year at I 0 tons per acre. -There are existing utilities and infrastructure available at the Martell site that could potentially benefit an adjacent ethanol plant.
Steam. The boiler generates 200,000 Ibs/hr of steam at 900 psig. Extraction steam is available at 180-200 psig and 85-100 psig. Currently the power generating station supplies 20,000 Ibs/hr at 180-200 psig to an adjacent particleboard plant. More export steam is available. The generating station has condensate polishers to remove corrosion products from the return condensate. It was estimated the cost of steam would be $2 4 4 /I000 Ibs (use $4 for 200# and $2 for 50#). The generating station has two 5-day scheduled outages during the year. A few emergency outages are expected. - This translates to 93% to 94% availability. A small package-type boiler may be necessary to ensure an uninterrupted steam supply for an ethanol plant. This plant is looking to modify a backup of gas firing for the boilers in the future. The generating station currently sells power to the grid at $0.05 /kW-hr. Further investigation would be necessary to determine if a power purchase agreement could be developed for an adjacent ethanol plant. During is off
36

peak electric time, the plant sends steam for evaporation. Greenpower warrants $0.01 per kWh more than brown power. Cooling Water, The generating station utilizes a cooling tower for heat rejection operating at about 4 cycles of concentration. Summer operation includes use for dust suppression. This system could provide cooling water to an adjacent ethanol plant. The match would be good since there is less load on the coofing towers when steam is exported. The cooling tower is sized for turbogenerator operation at up to 18 MW of power generation without steam export (full condensing). Demineralized Water. Boiler makeup at the generating station is produced in parallel cation/anion demineralizers. There is some excess capacity in these units to provide demineralized water to an adjacent plant. However, additional storage would be required to altow production and storage of demineralized water during off-peak generating periods. Fire Protection. An perimeter loop is used for fire protection at the Martell site. This loop could be extended to an ethanol plant. There are minor fires that occur in the fuel pile therefore hose and water cannons are available and the chip storage is manned 24 hours per day. Site Security. Security in the area has not been a problem. However, the site is fenced and protected with a gated entrance. This same security could be extended to an adjacent facility. Rail Car Access. Rail car access is available at the Martell site and could serve an ethanol plant located there. Feed Receiving and Handling. This plant has the ability to handle a temporary fluctuation in the feed to 50% greater than normal feed without any modifications. If it is desired to operate at 75 - 100% over the normal feed, the hours would have to be extended and a second dump could be used. Fuel Preparation. Fuel to the power generating station is ground/milled to minus 3-inch. An ethanol plant would need minus %-inch. However, it may be possible for the power generating station to provide feed stock to an ethanol plant by selectively sorting and screening the biomass. This plant does not have any fines problem with wood. They only have silt problems. Agricultural wastes such as prunings and nut shells are used as fuel along with urban pellets, sander dust, saw dust and forest thinnings. These fuels are made up of approximately 40-45% moisture. A two to three week excess supply of fuel is stored before summer. Water Supply. Ditch water is supplied to the power generating station in a 6- inch main through Sierra Pacific. Storage is in a hoIding pond. Although specific quantities were not discussed, adequate water for an ethanol plant was judged to be available. A 2 inch potable water system (from Johnson City) is in place as well. There is currently 75 GPM treatment capacity for makeup water.
37

Wastewater Treatment. The power generating station has no large-scale wastewater treatment. Cooling tower blowdown, boiler blowdown, and neutralized demineralzer wastes are mixed in a (settling) pond prior to discharge. Any process wastewater generated by an ethanol plant would have to be treated separately. However, the existing rainfall runoffldetention pond system for the power generating station could probably be expanded to accommodate an adjacent ethanol plant. Siting. Sierra Pacific owns the power generating station site and the surrounding property. There has been industrial activity on the property for decades. Except for the typical California permitting procedures, no unusual siting problems are anticipated. Air Emissions. Multiple cyclones and electrostatic precipitator(s) are used on the exhaust to control particulate matter. NOx control is achieved by controlling the combustion air. The plant is currently monitored over a 3 hour average window. A 24 hour window is presently requested. This is due to the fact that the water cooled stationary grate must be cleaned 1-3 times per shift to remove the slag and sand in the process. When it is cleaned, air is allowed into the process and thereby causes inefficiencies and problems. Transfer of Wood from Piles to Site. Currently an underground conveyor is used to transport the wood from the piles which lie below a large overhead conveyor. This conveyor is 45 feet above the ground. The whole process is able to “store” up to 90 days worth of fuel on 5.38 acres. An underground recovery system wilt soon be changed to an overpile recovery system. This is due to the fact that it takes I2 hours to remove wood from the underground svstem so that it can be repaired if anv Problems occur.
38

APPENDIX C
PROCESS FLOW DIAGFUMS
39
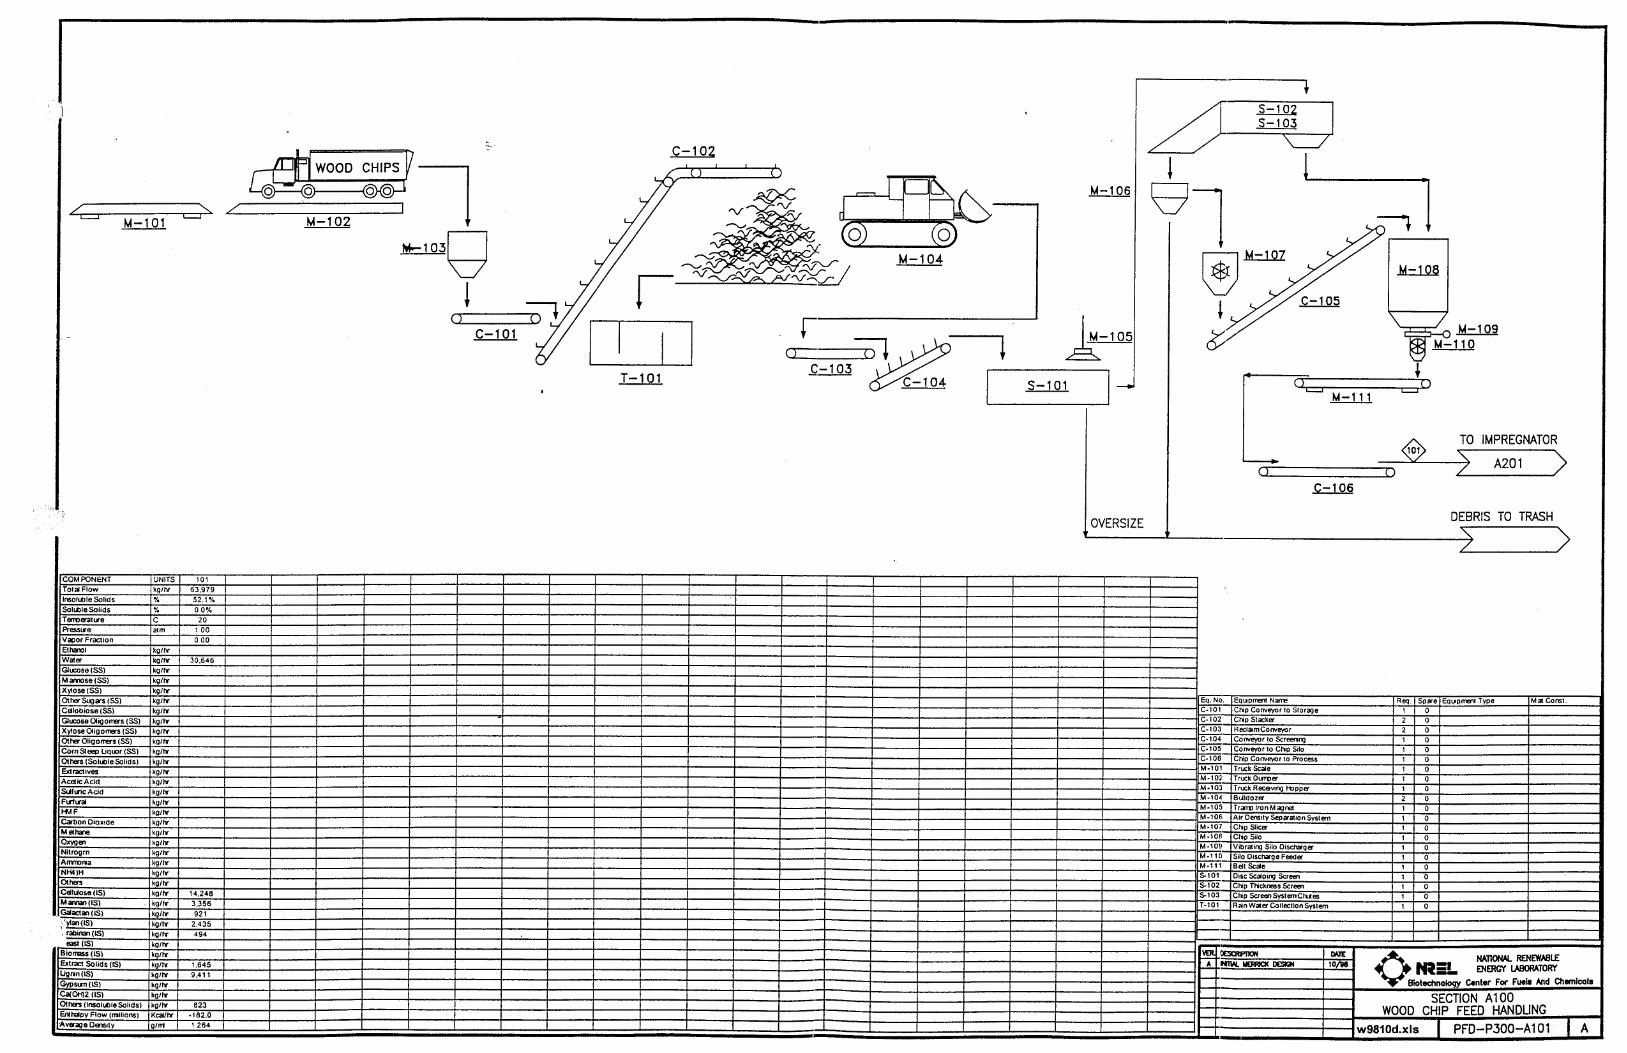
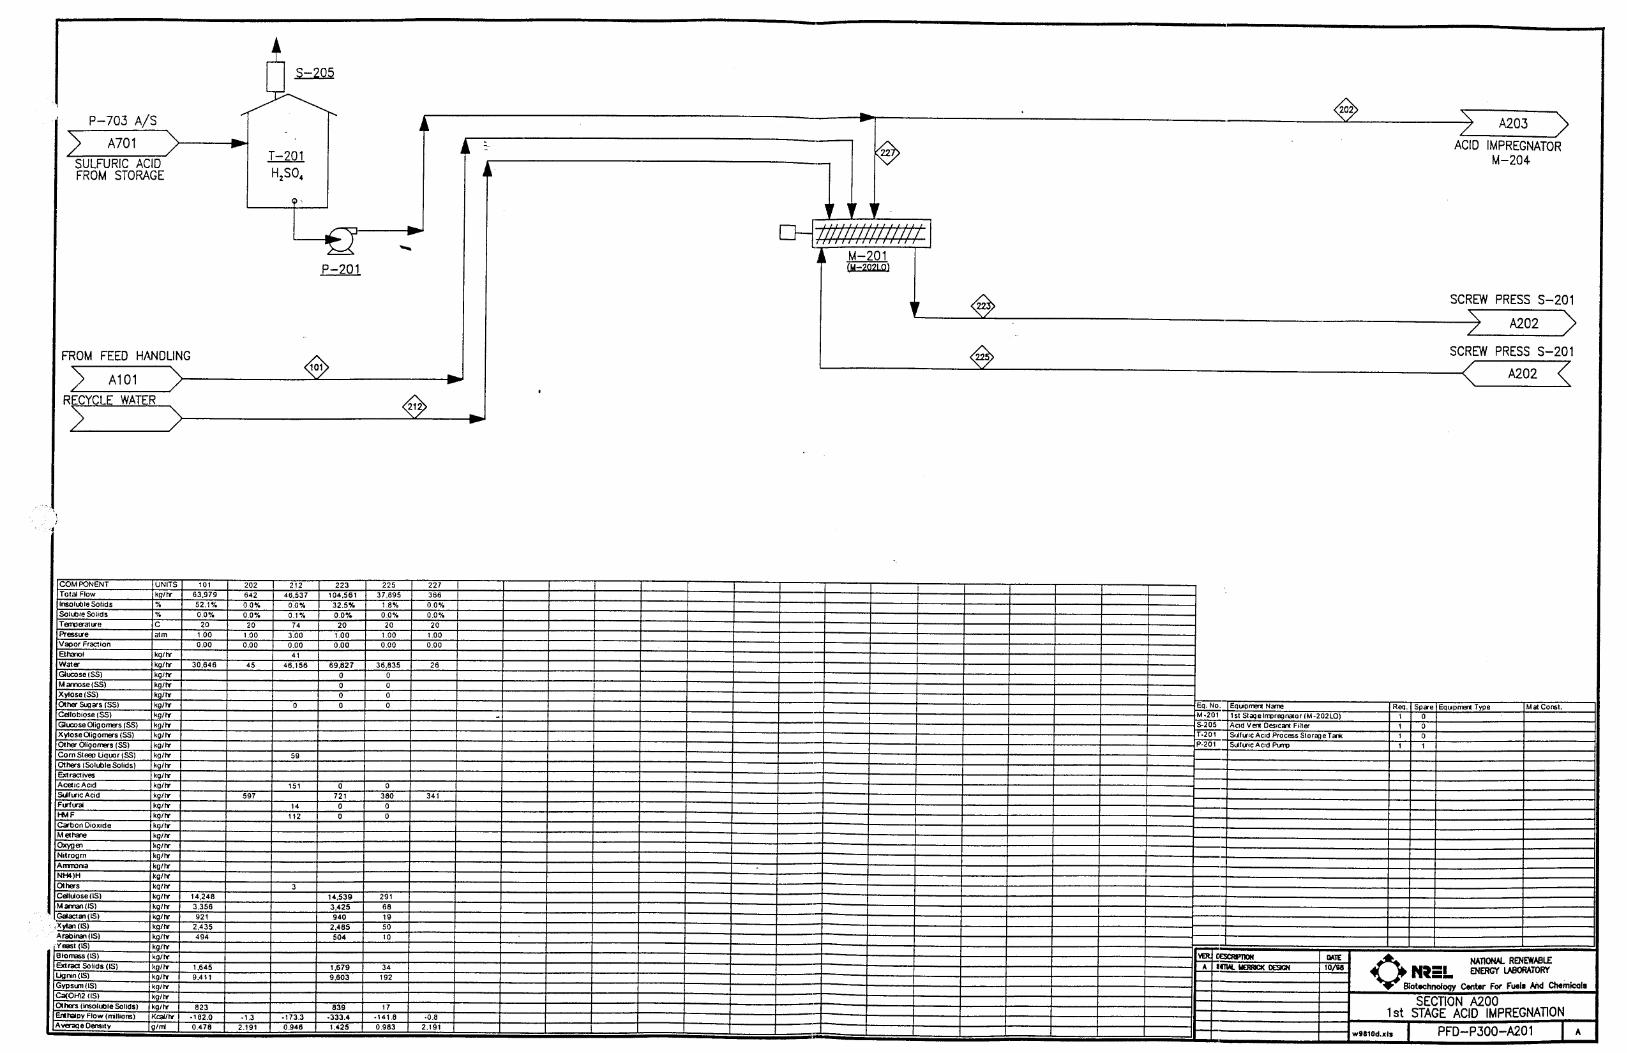
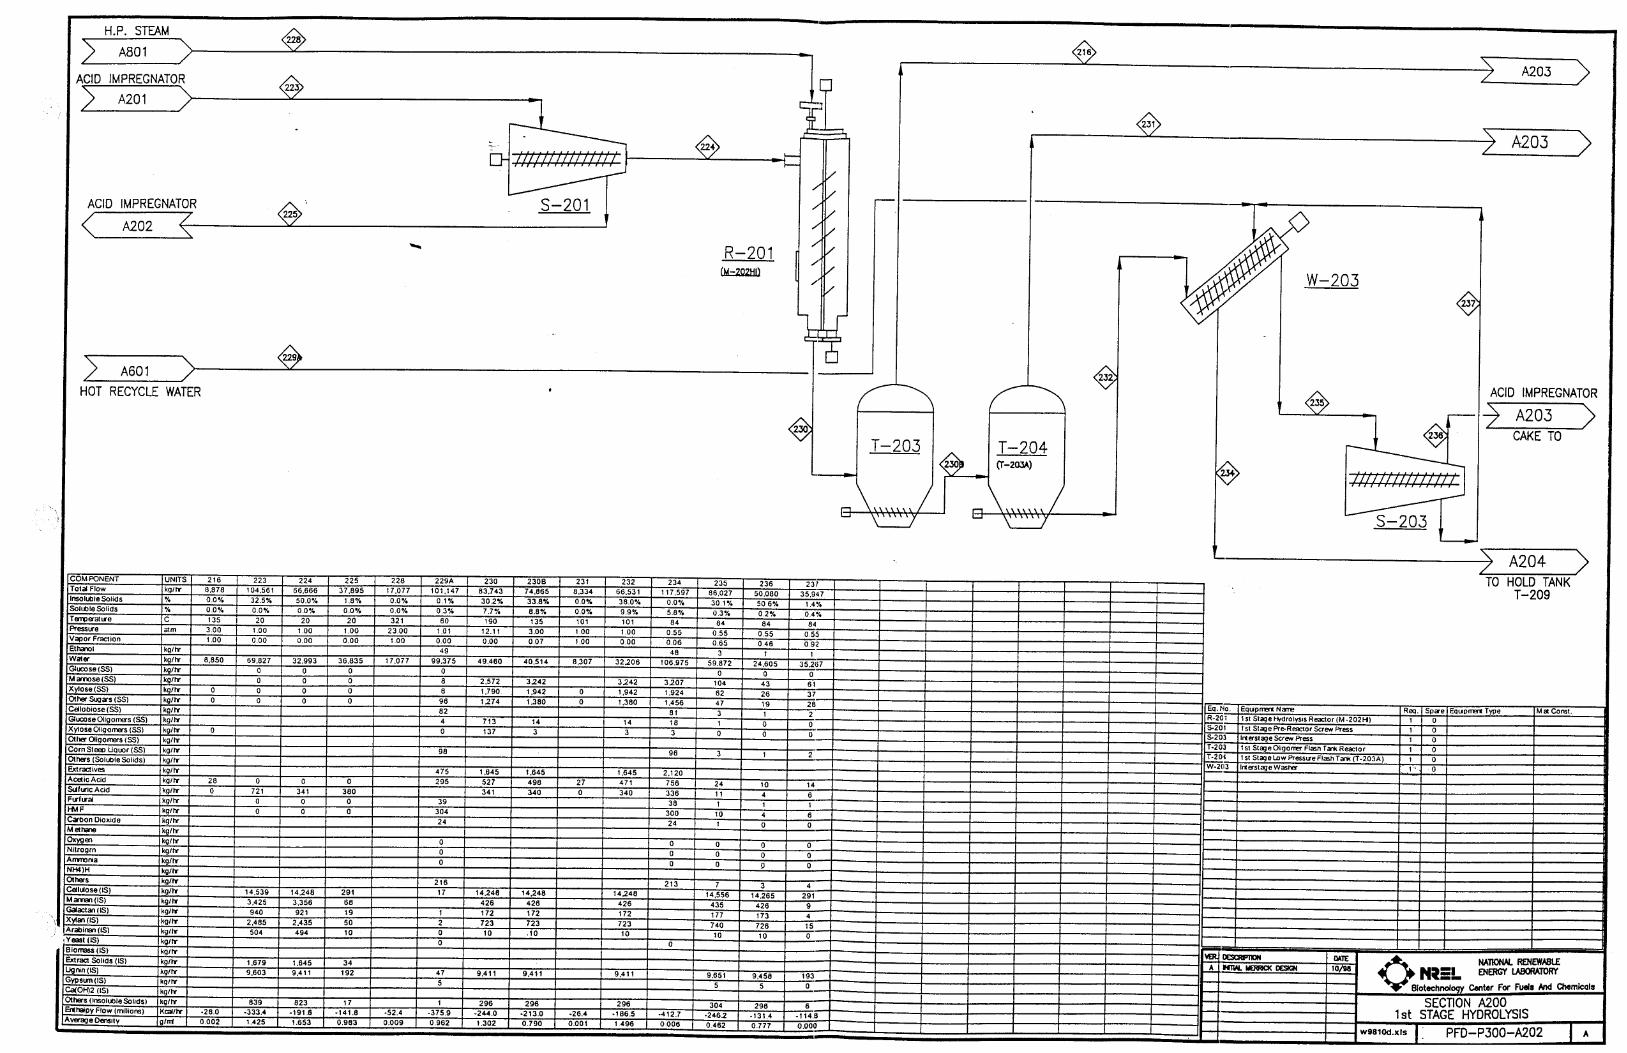
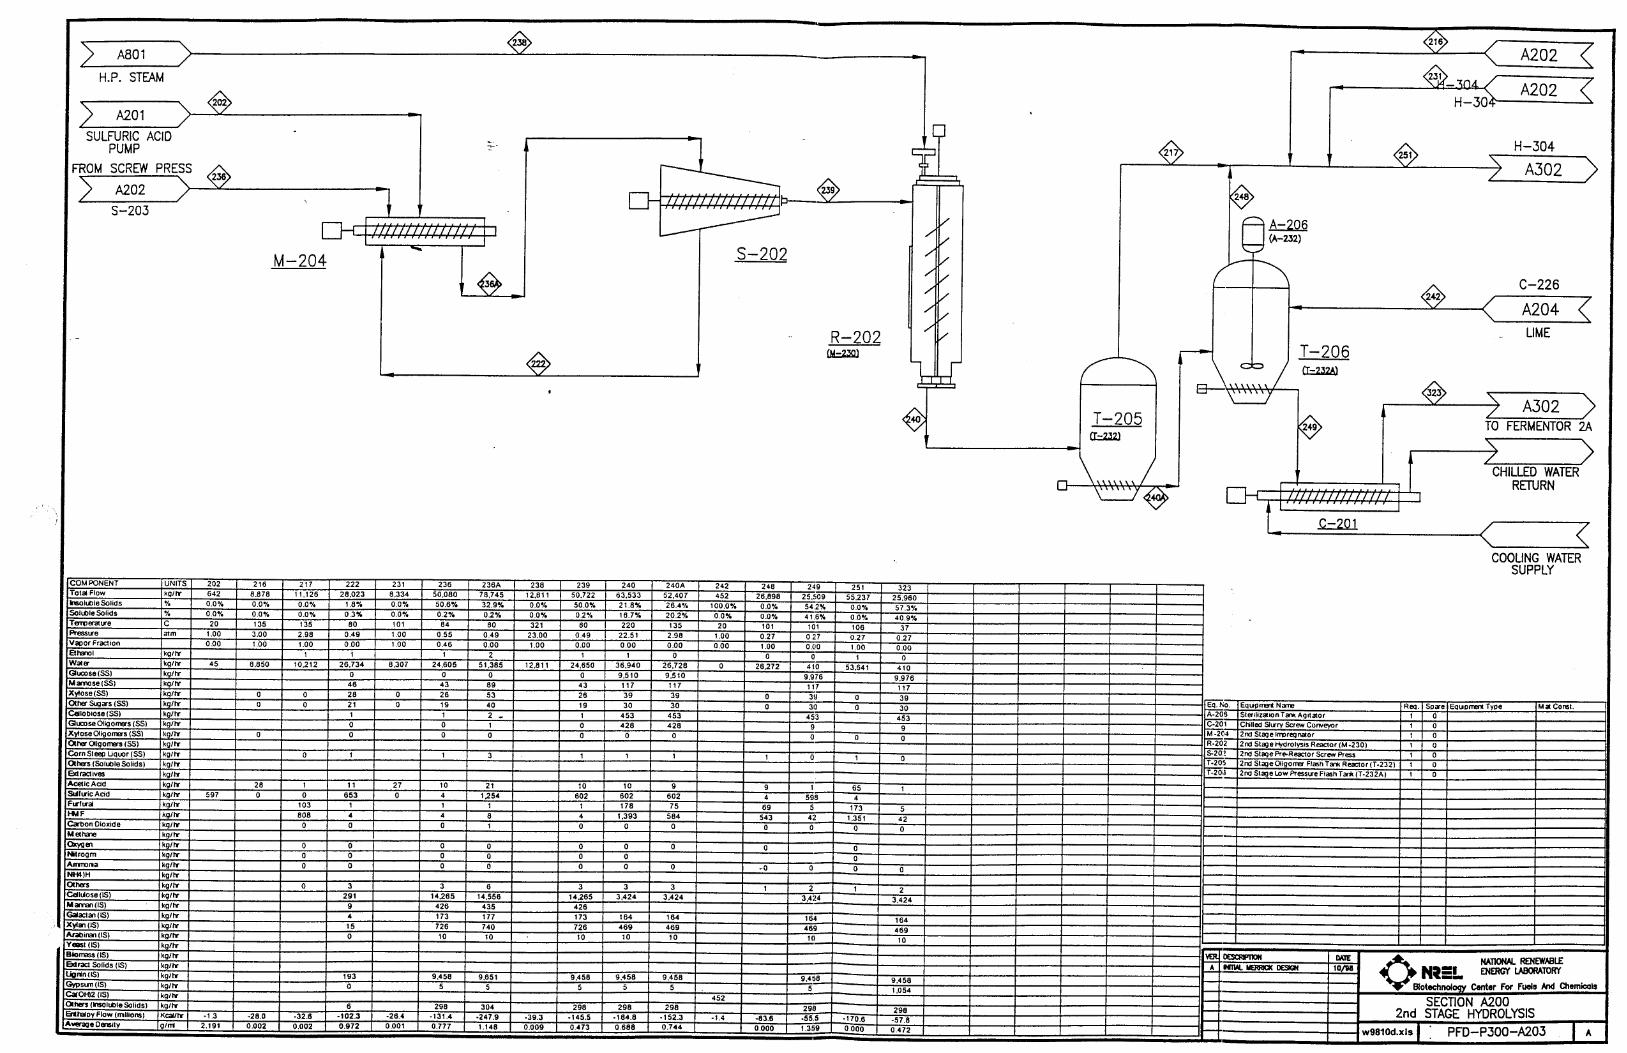
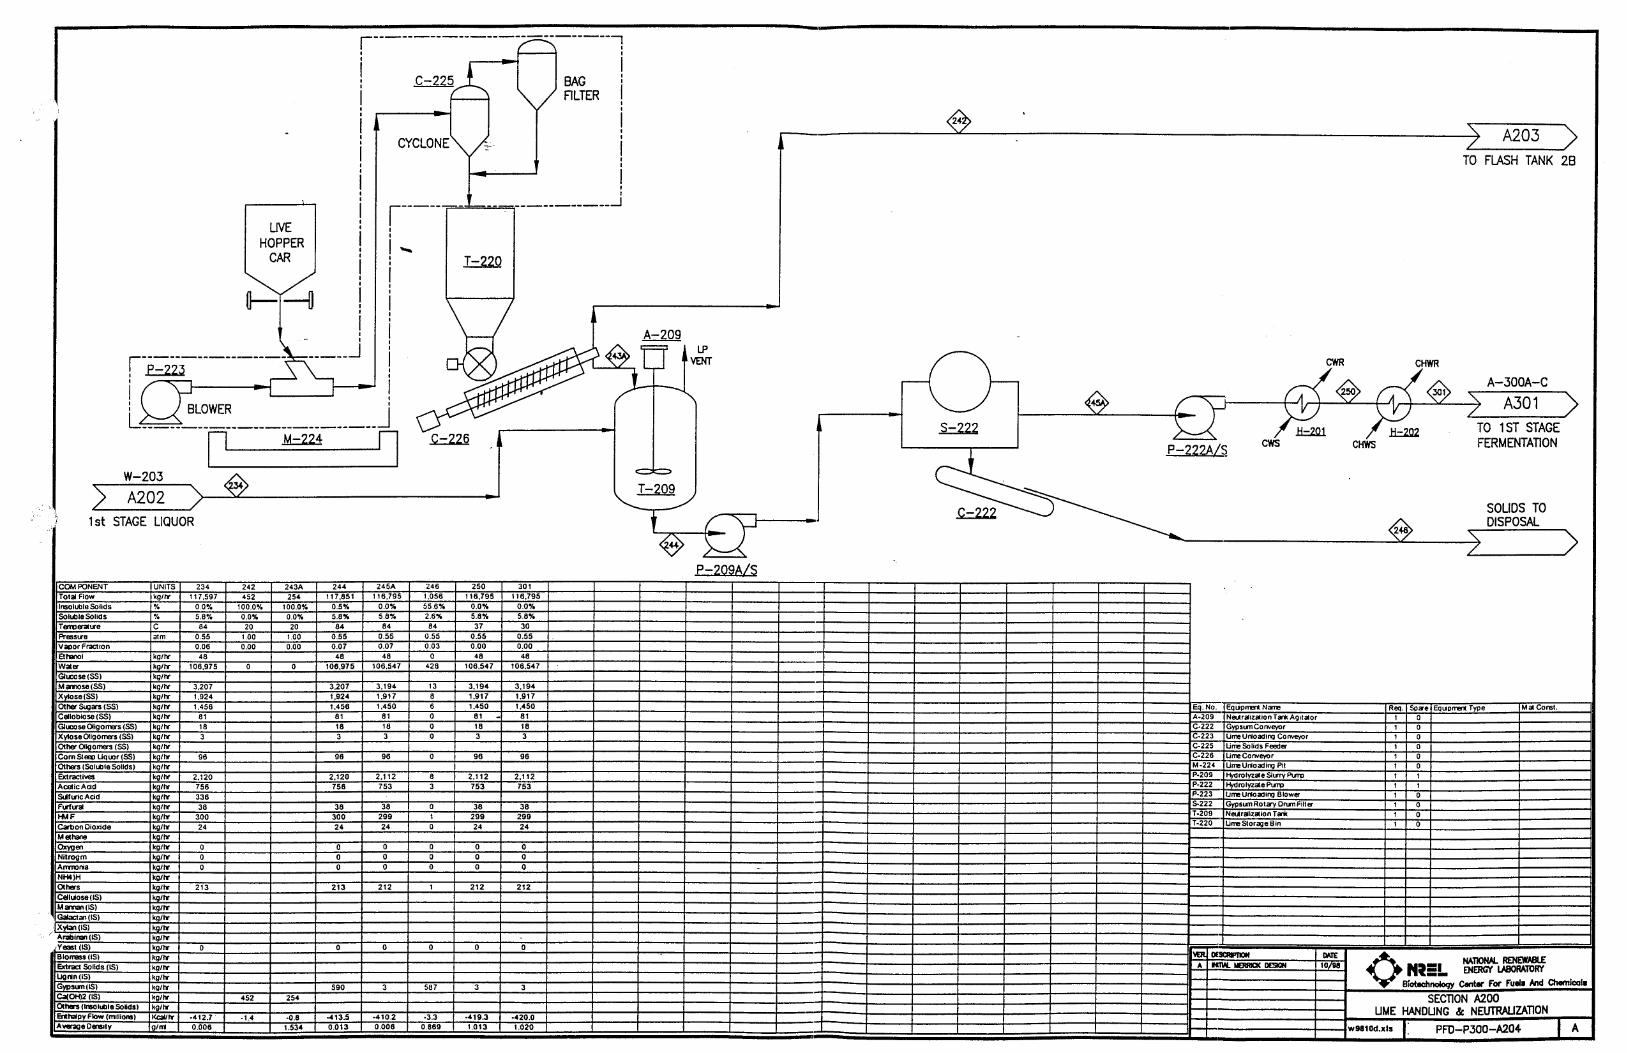
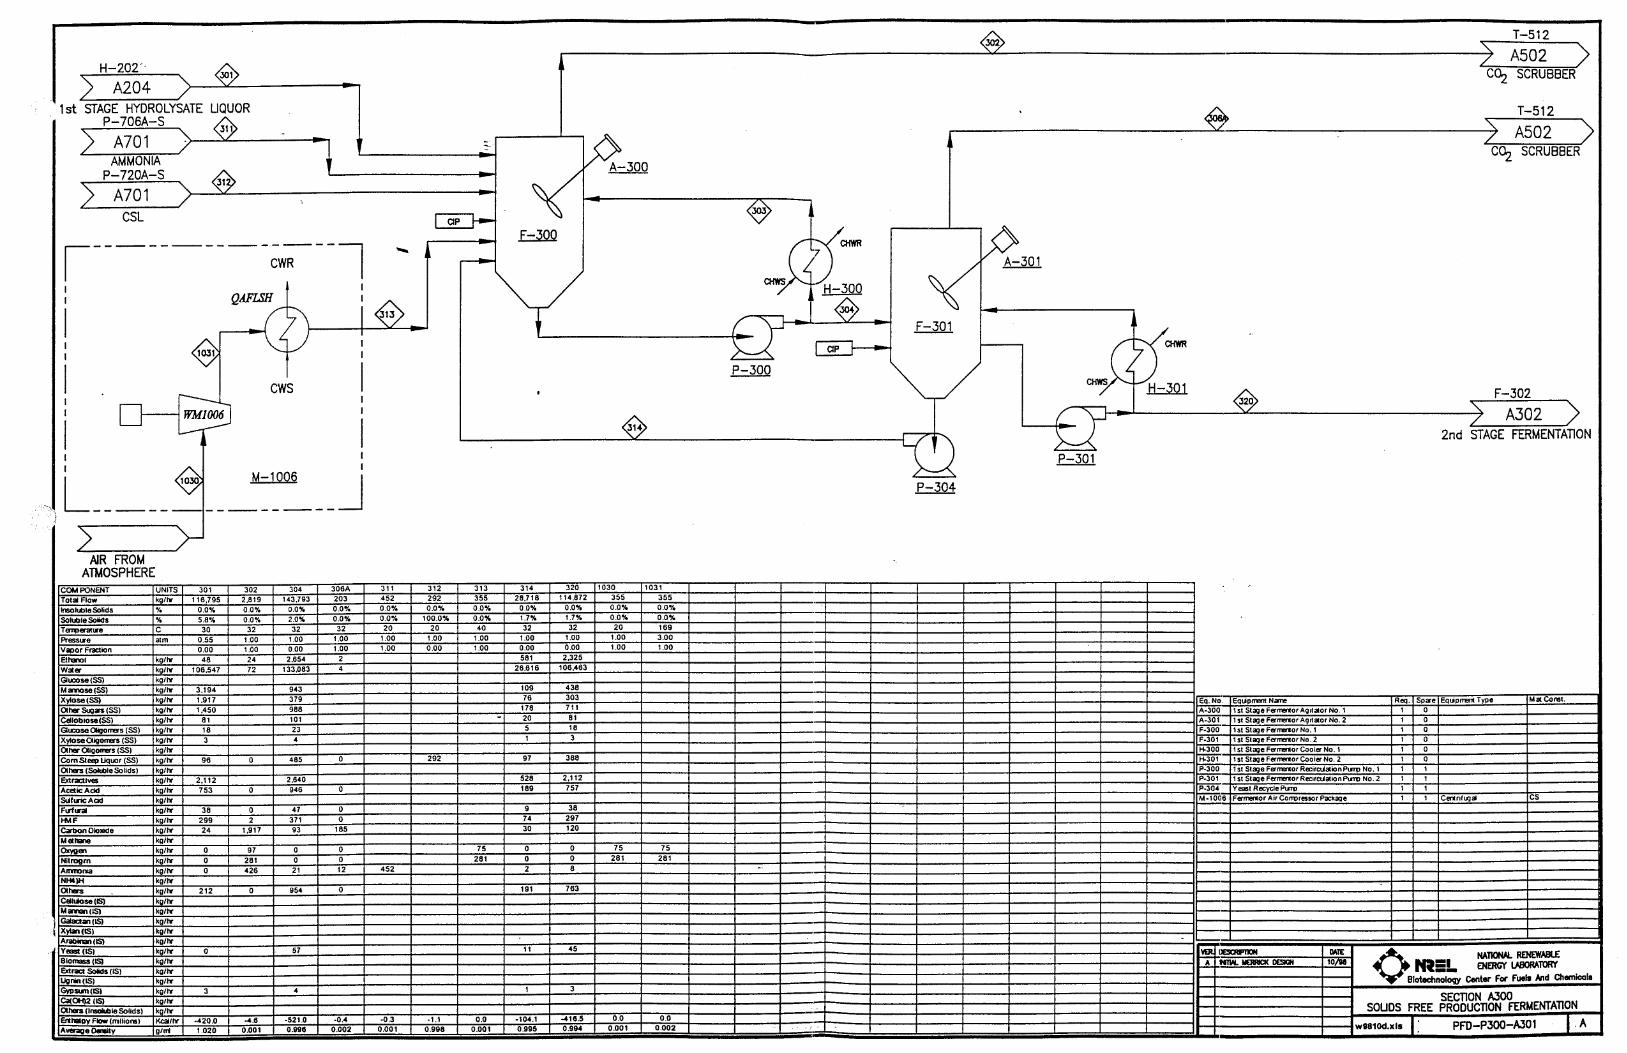
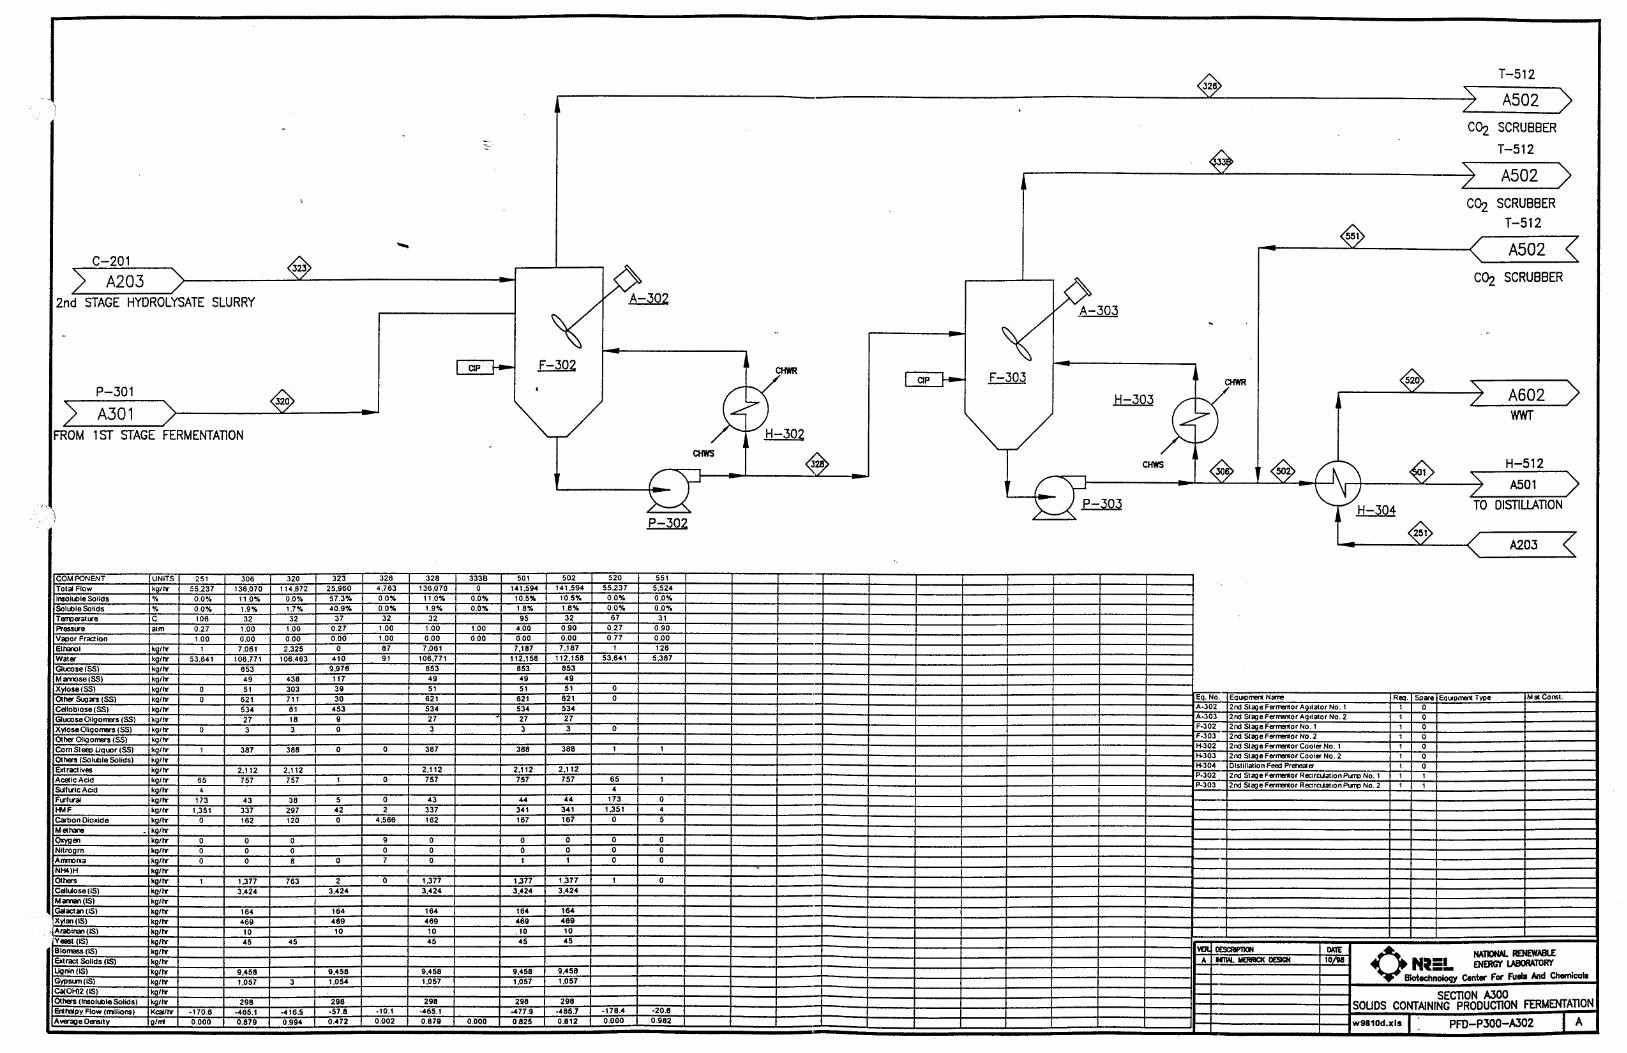
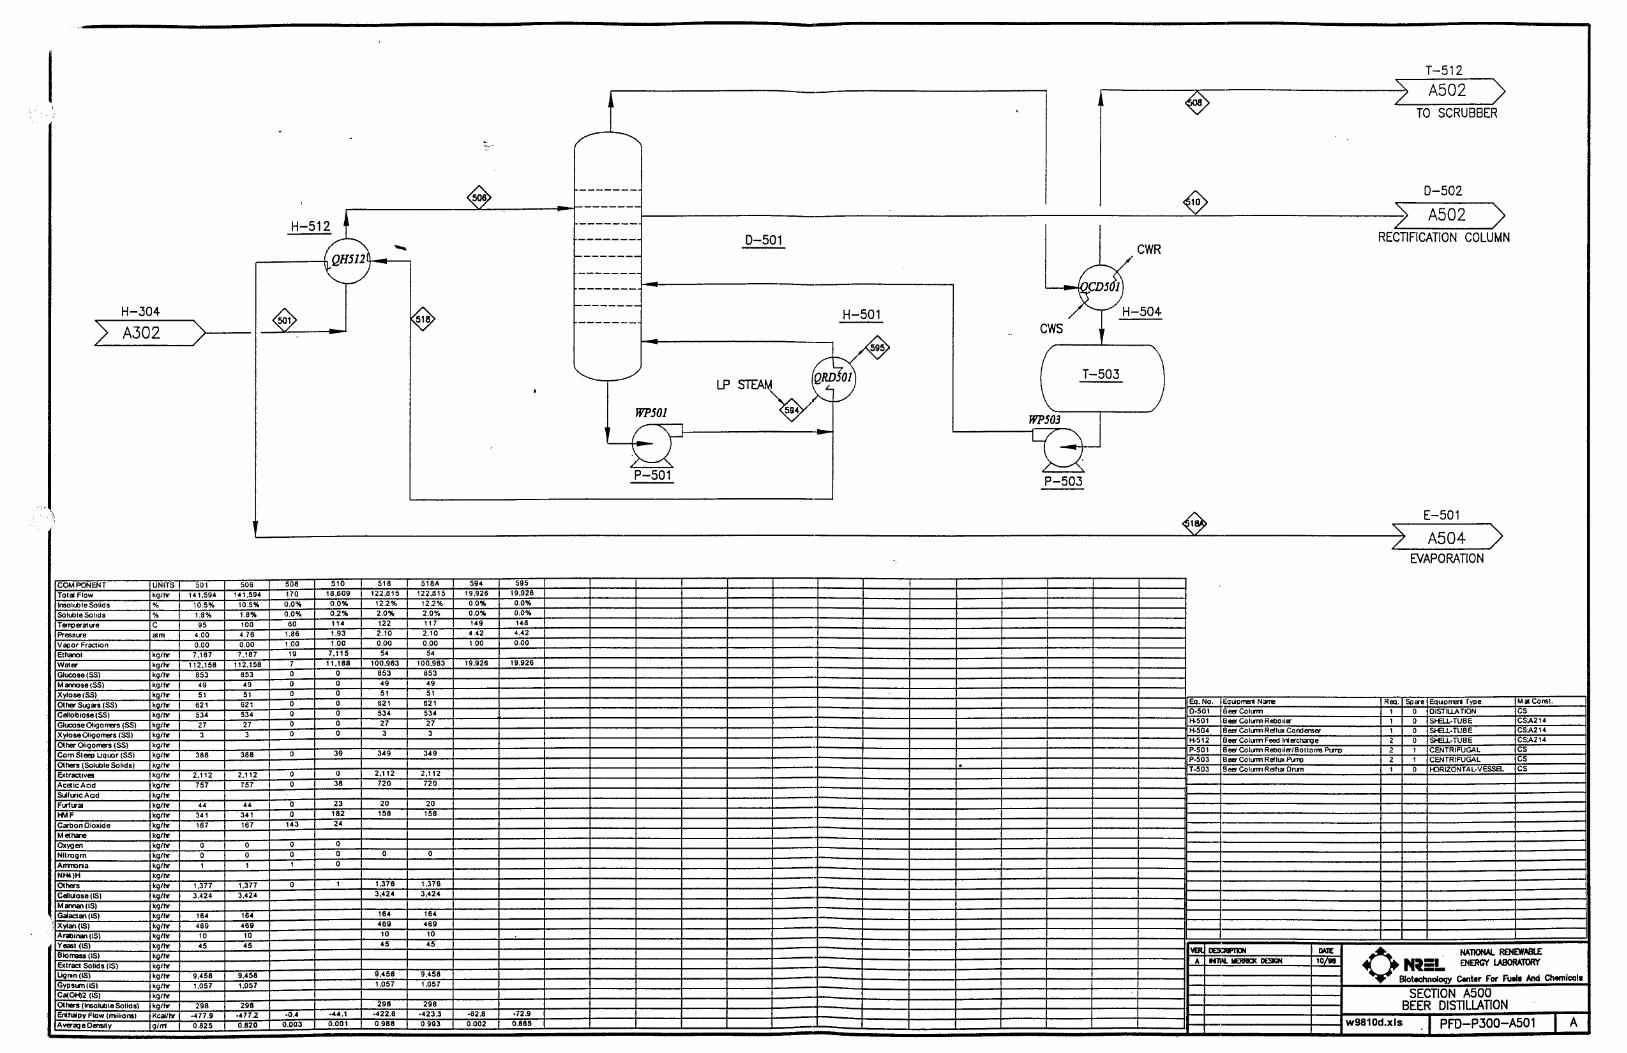

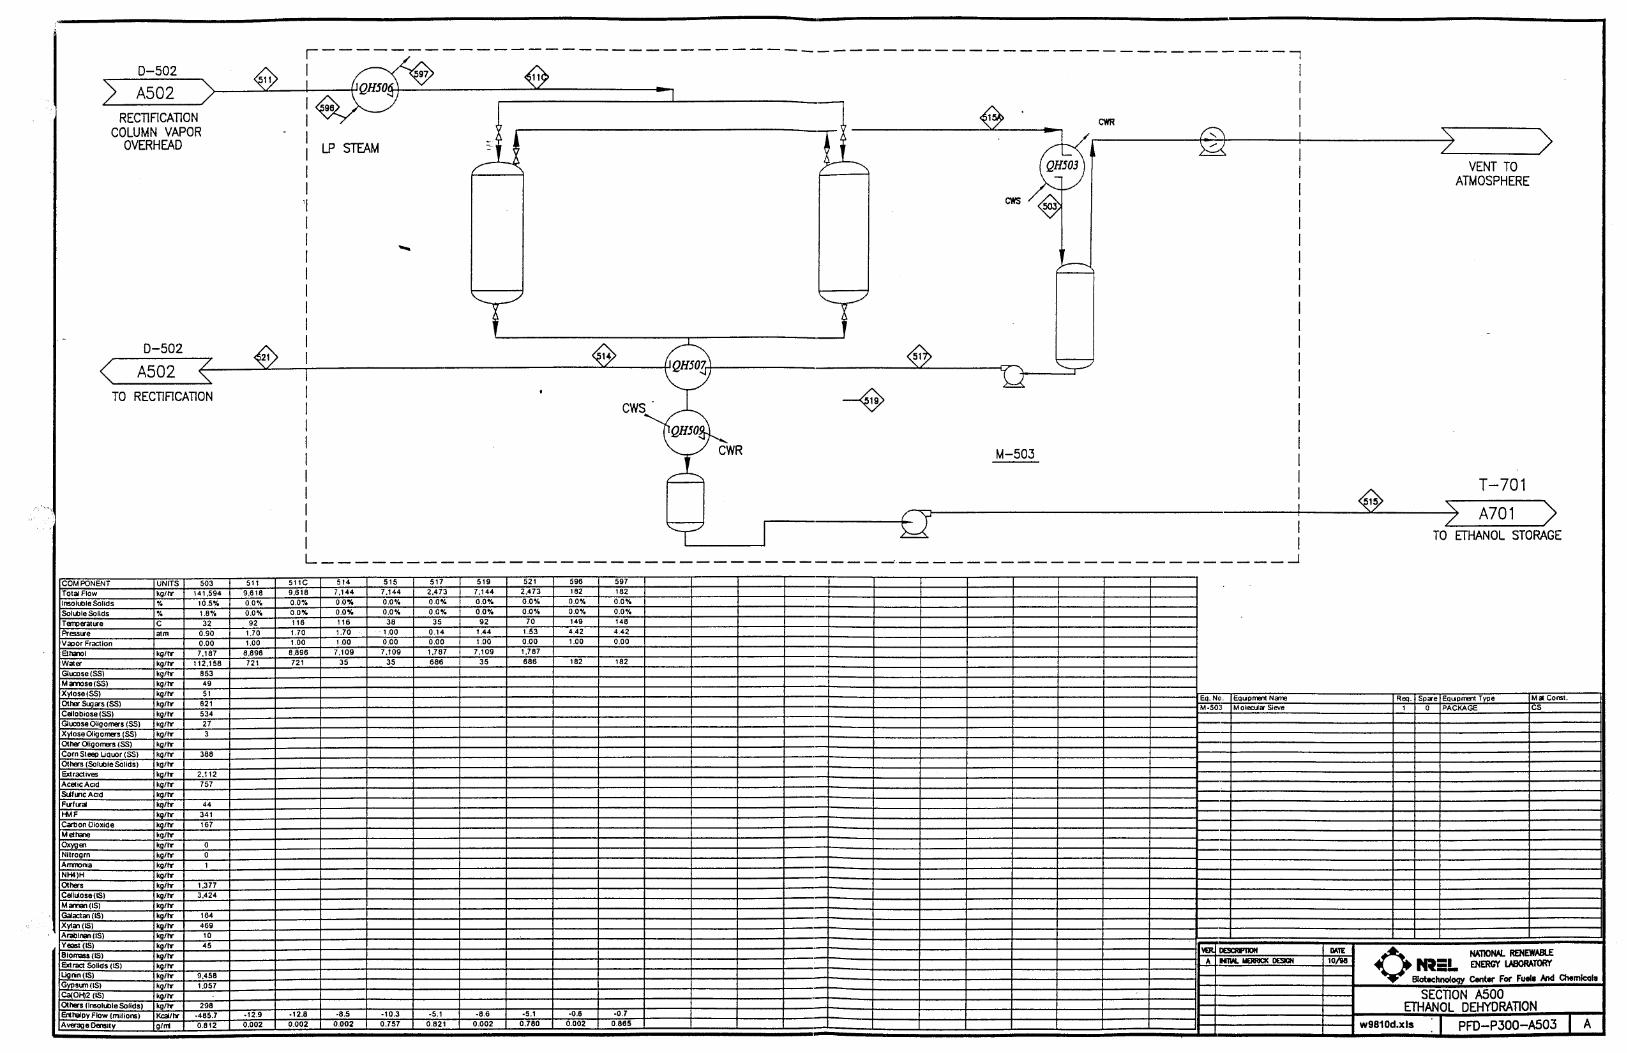
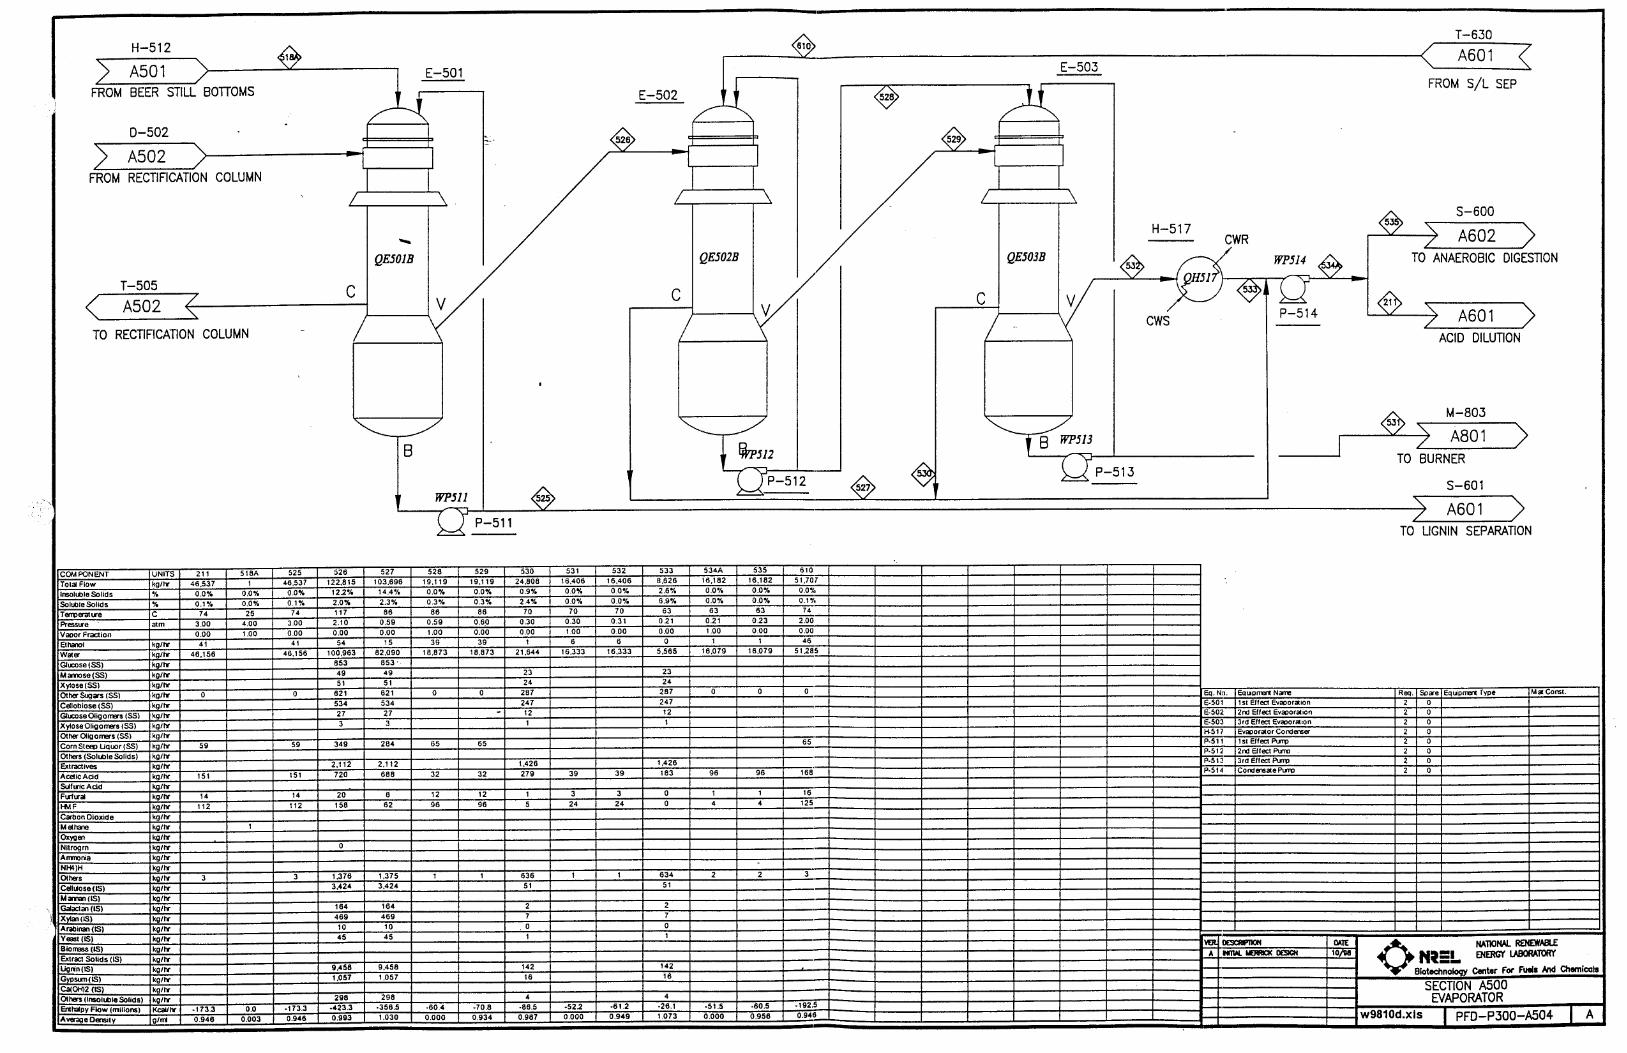
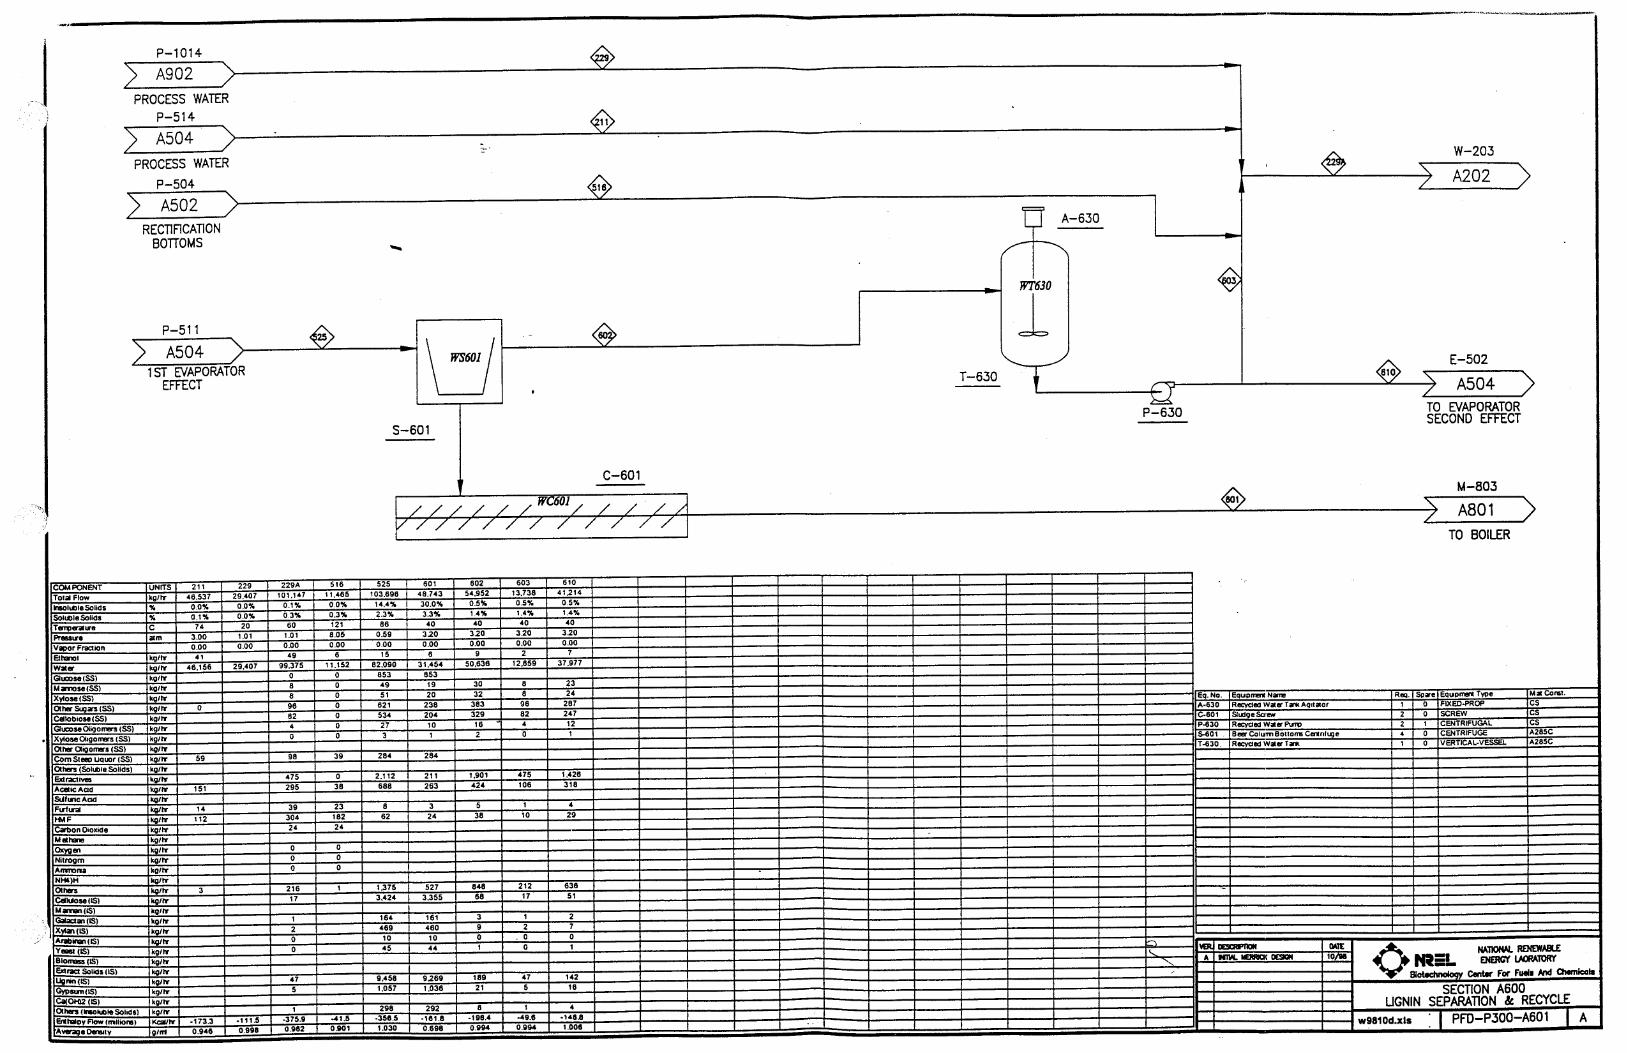
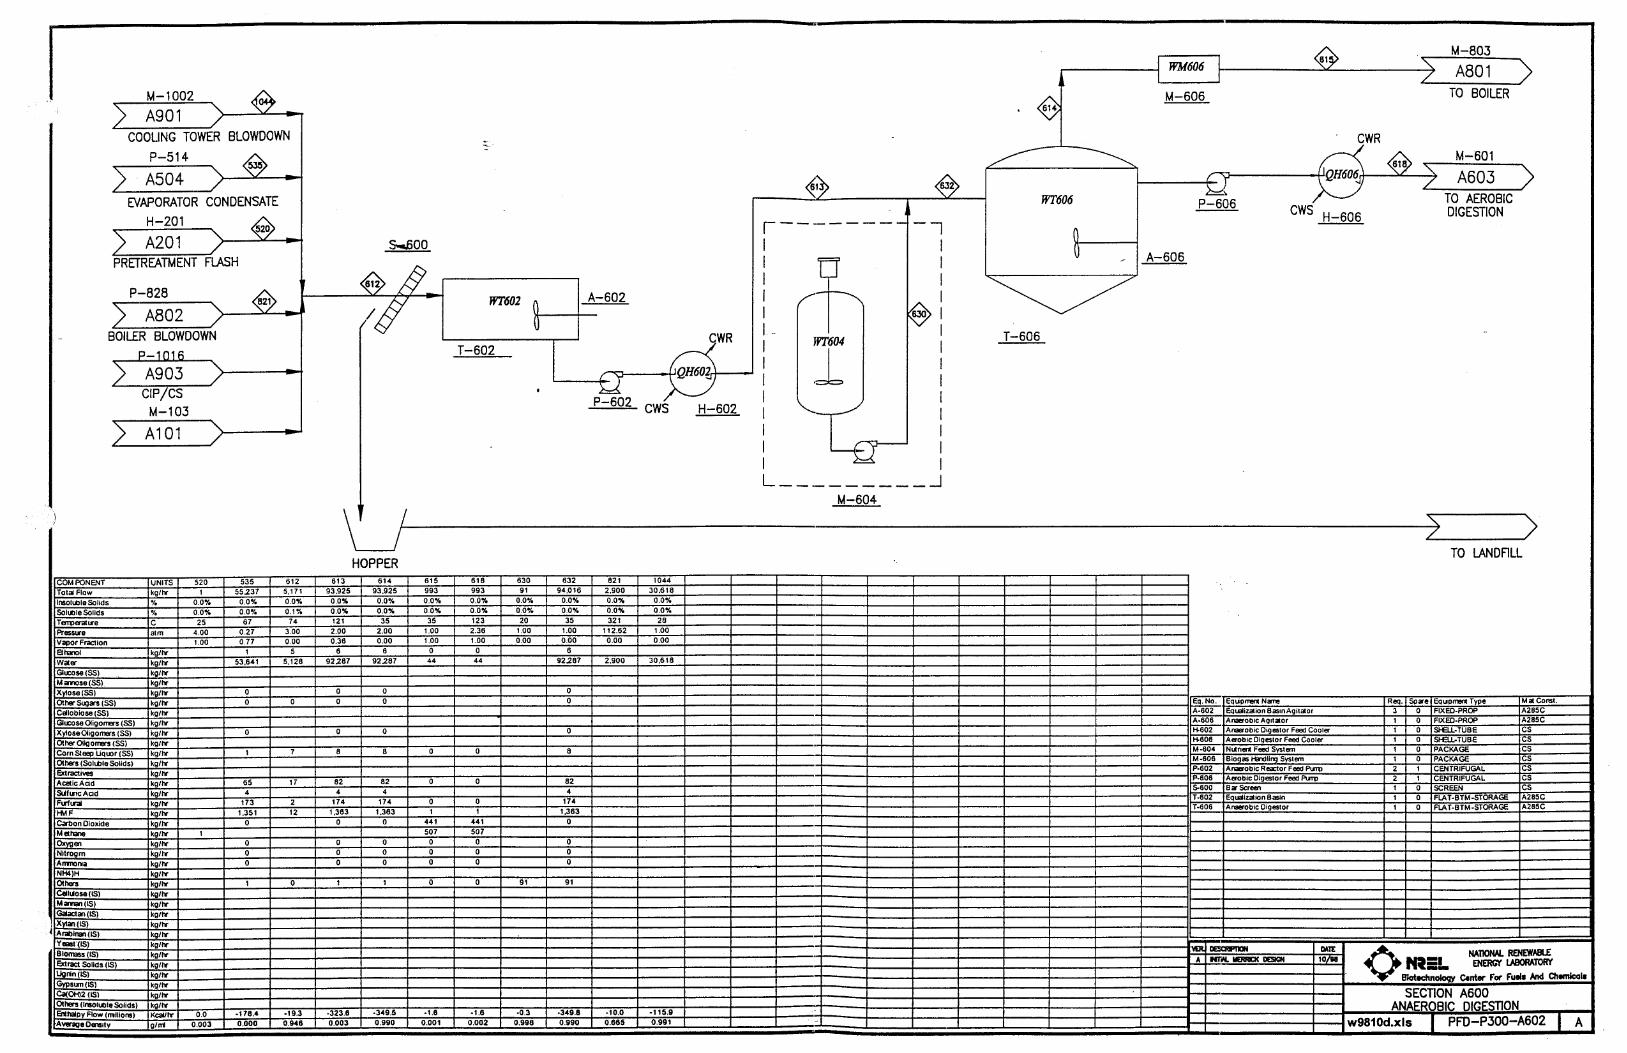
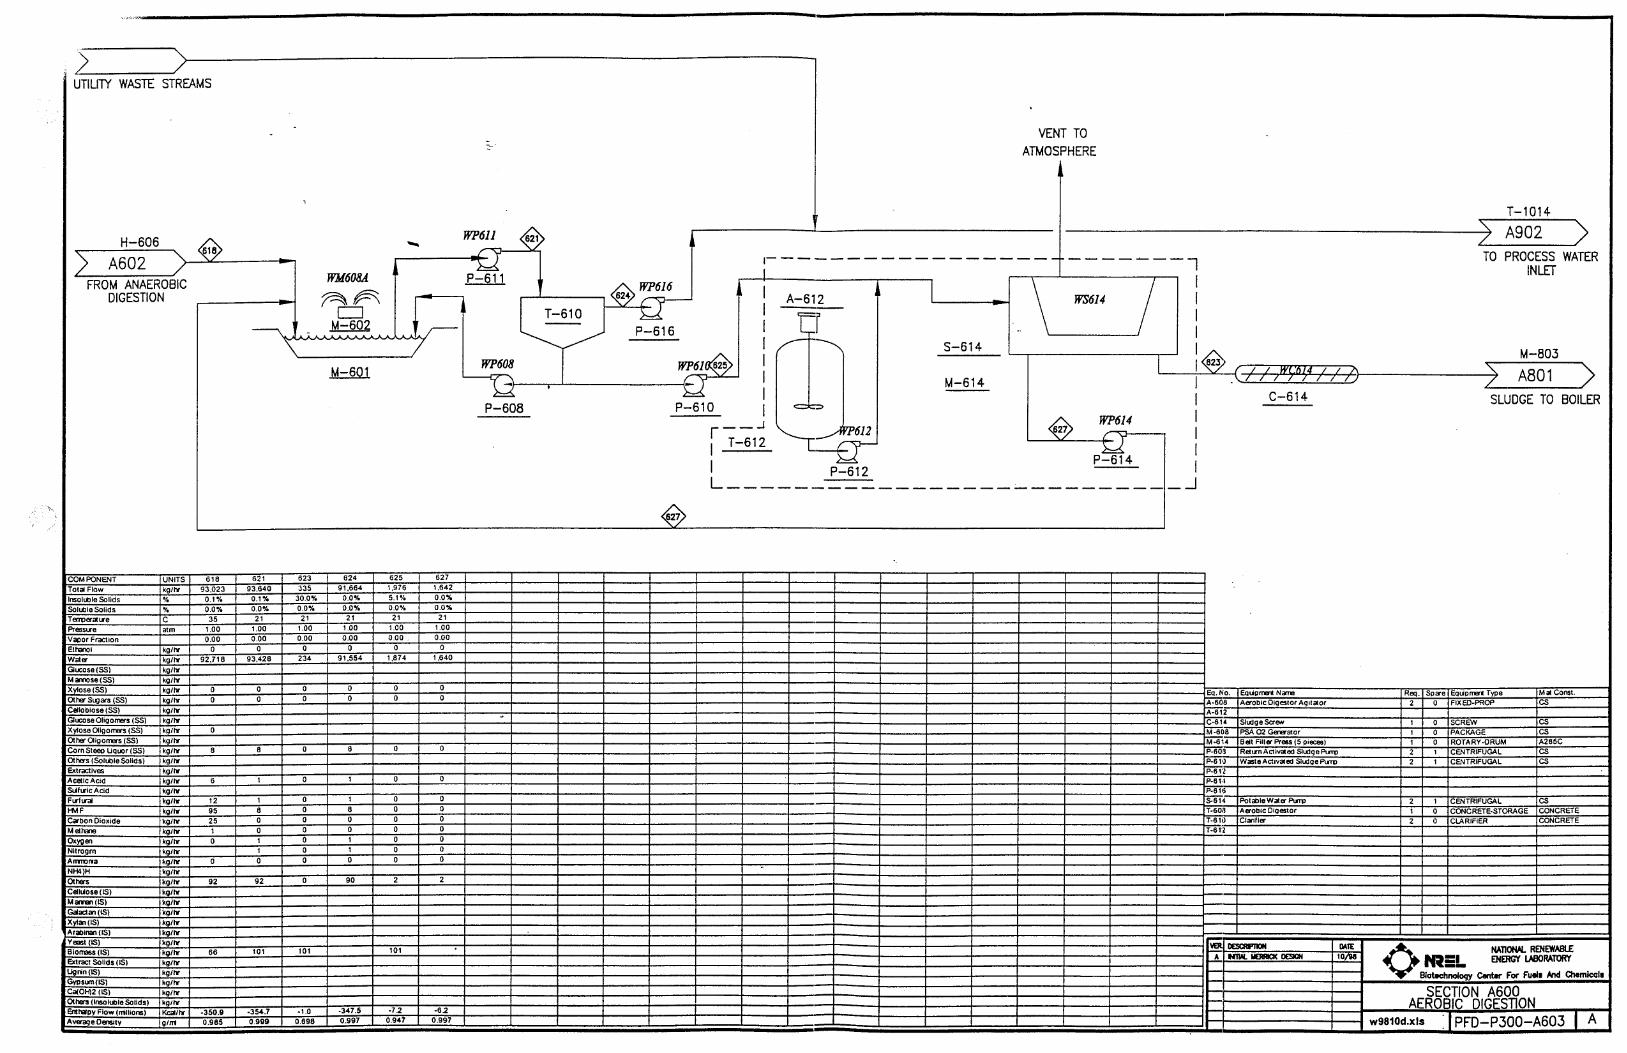
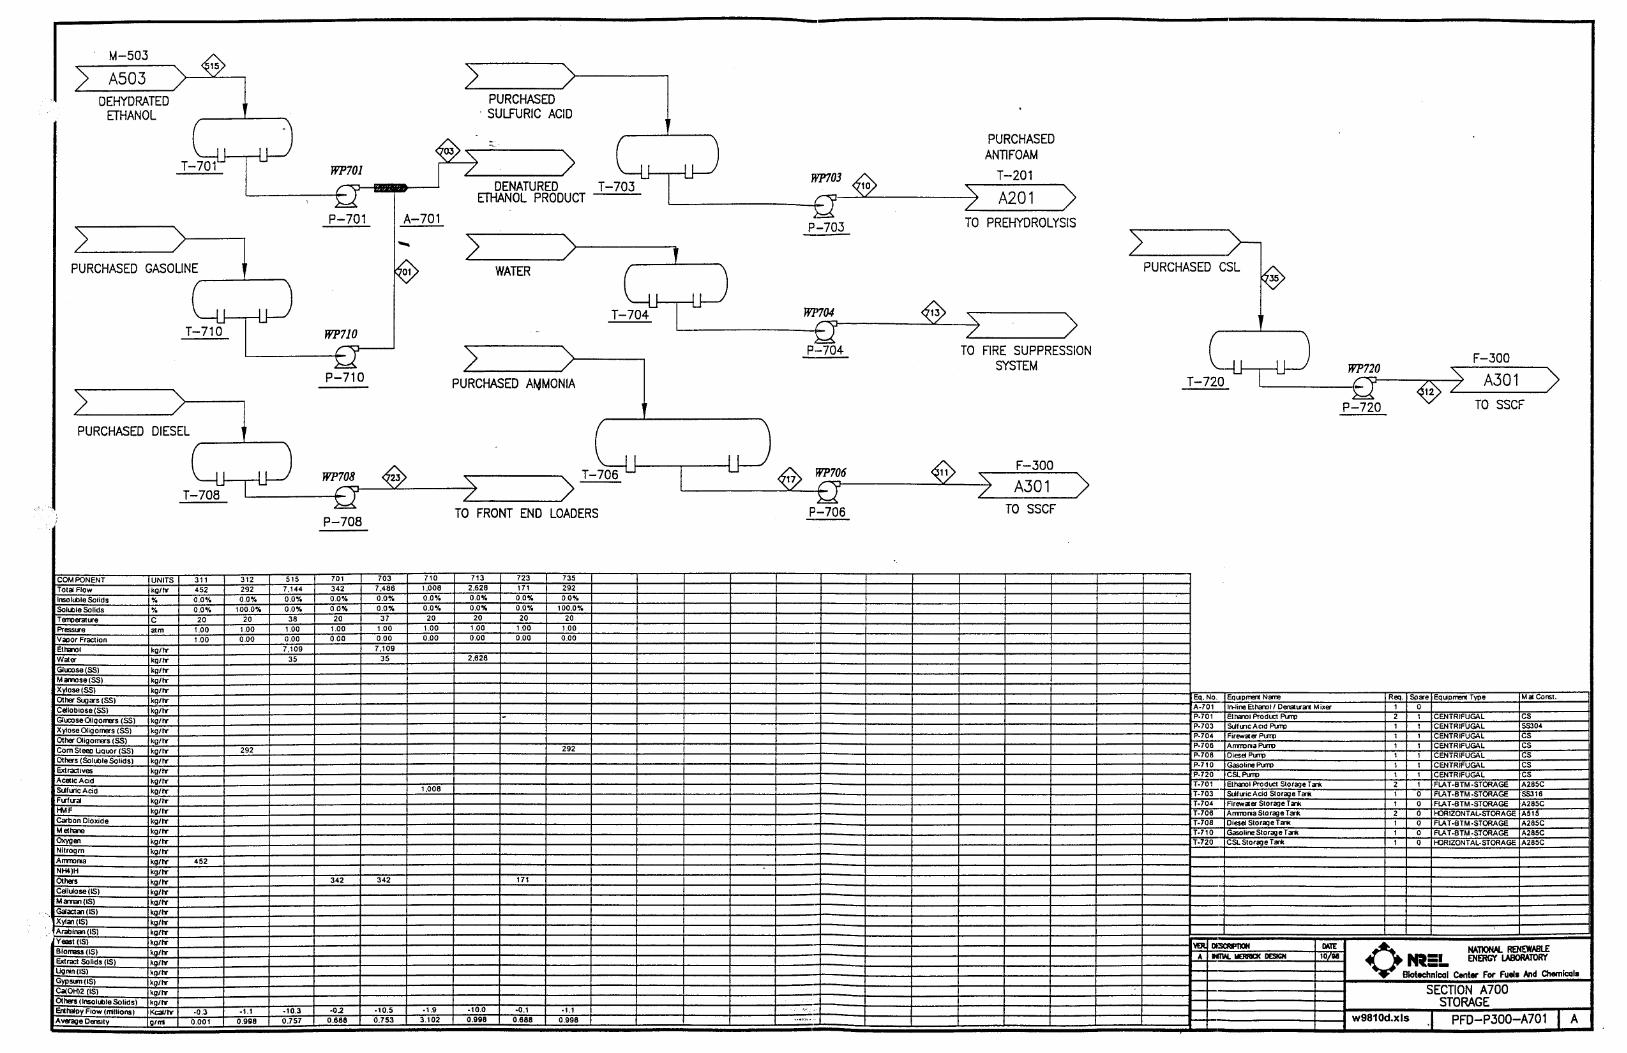
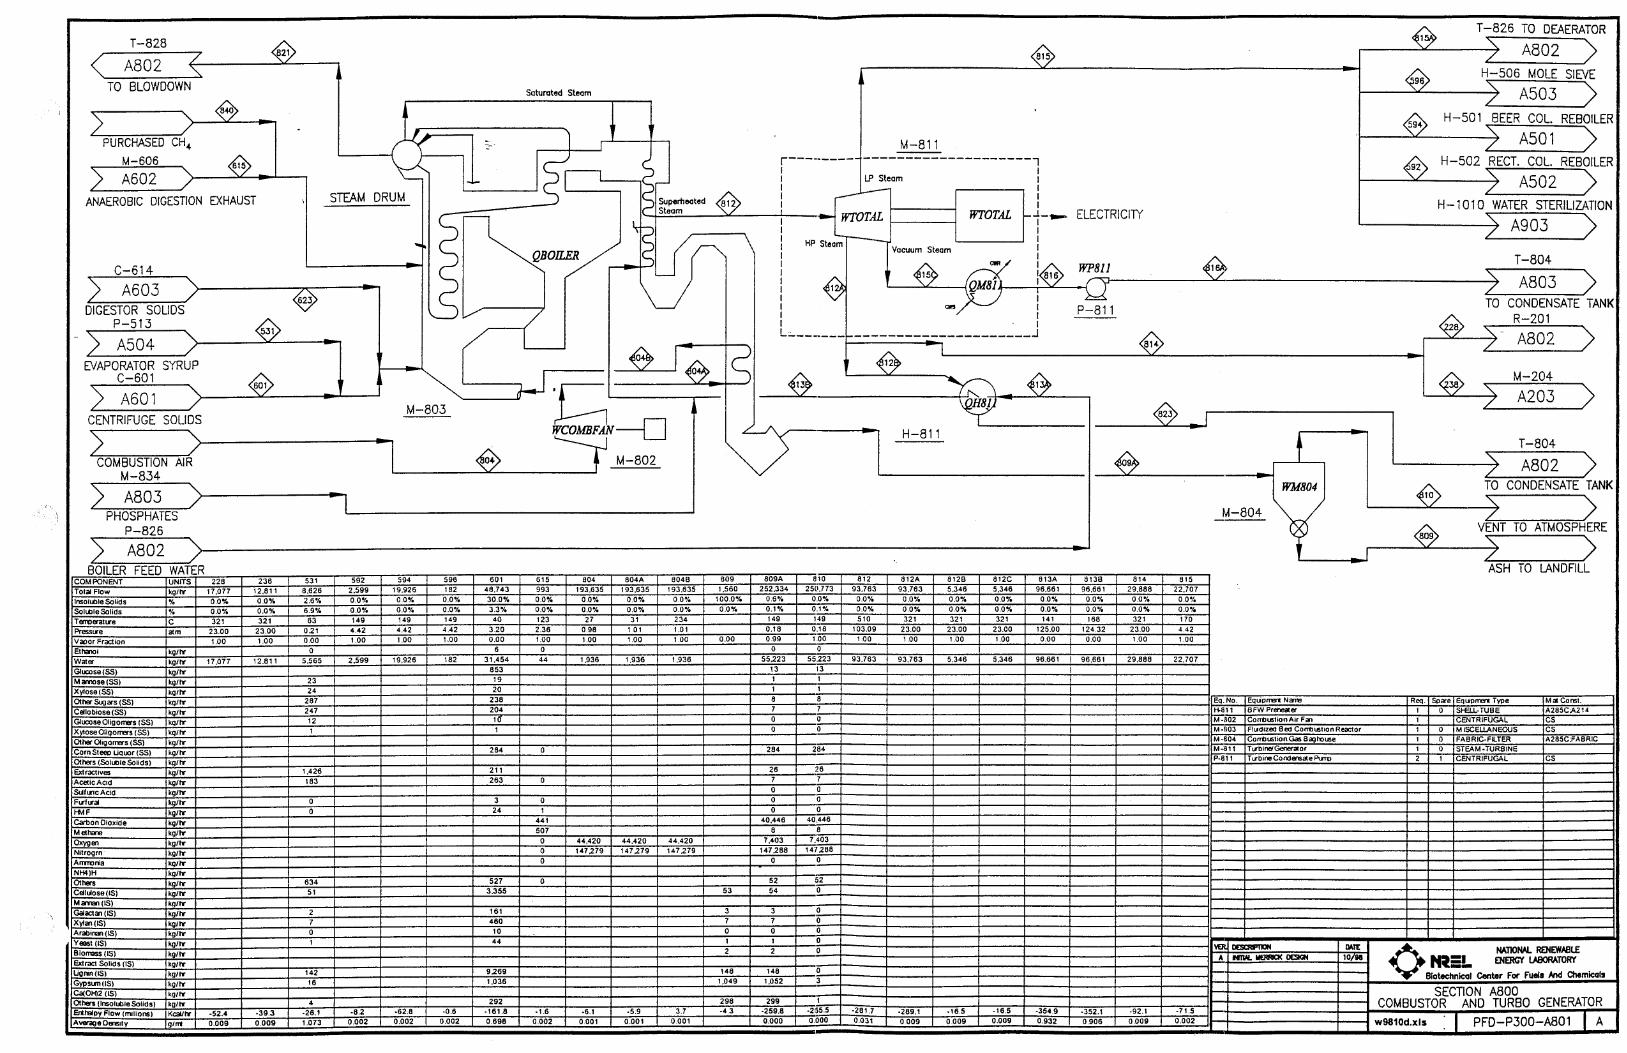
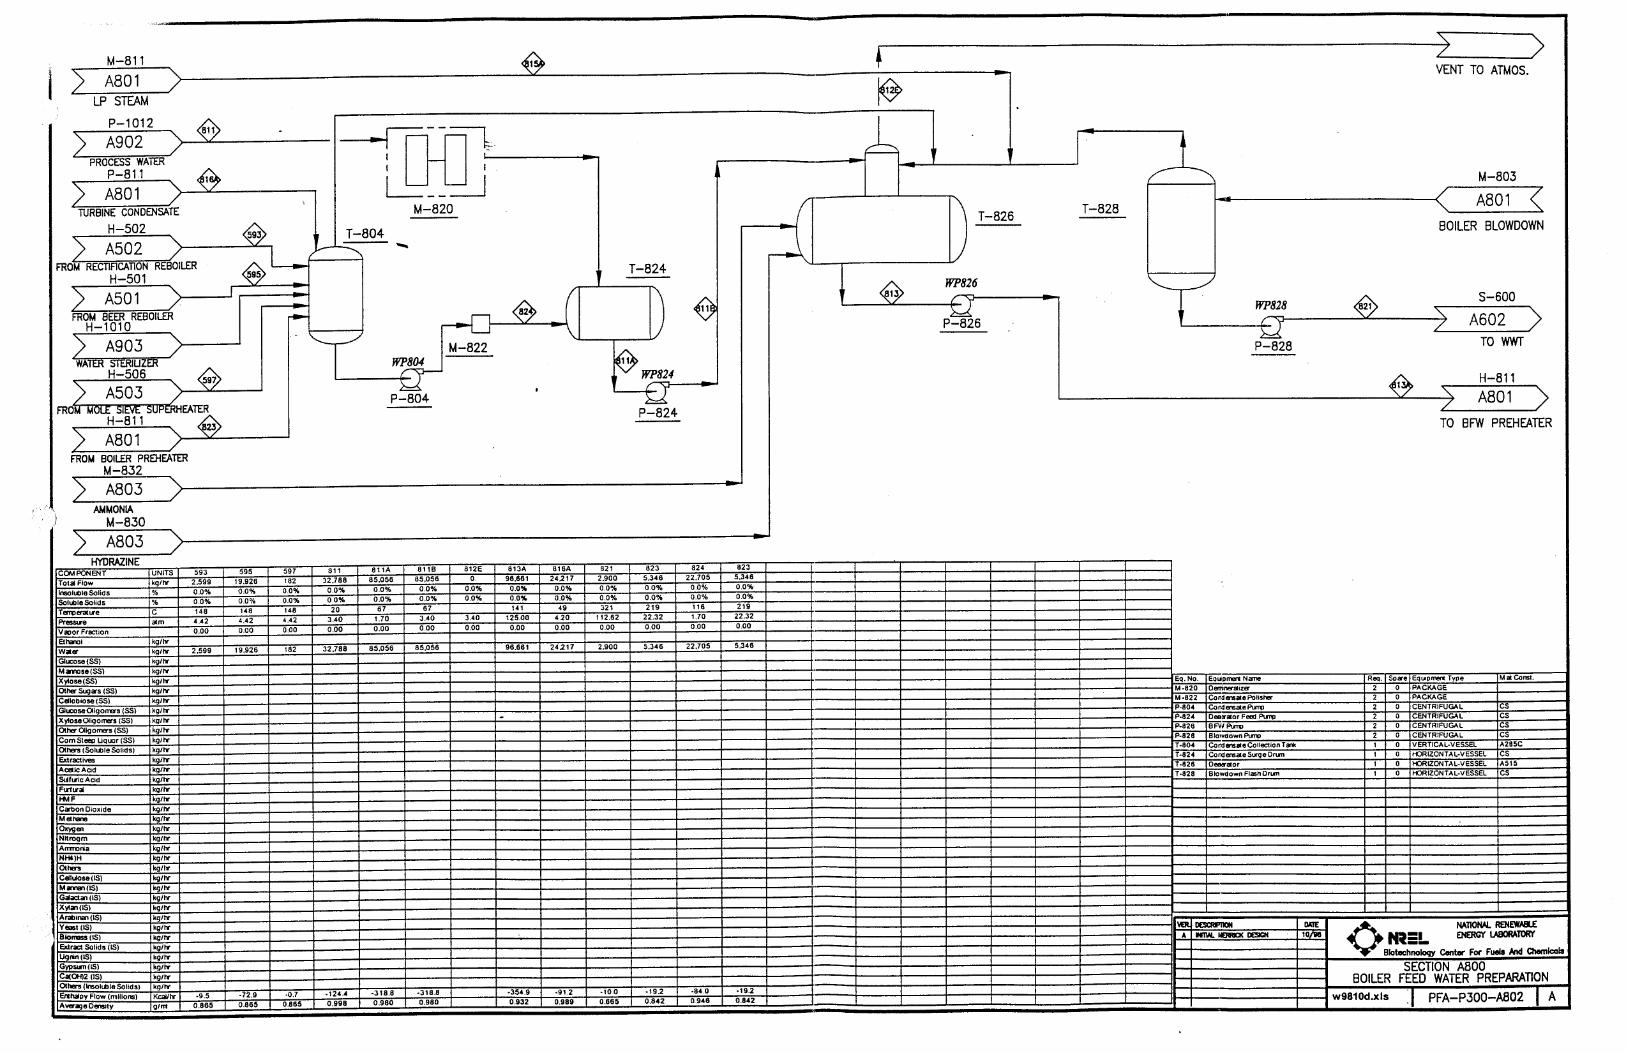
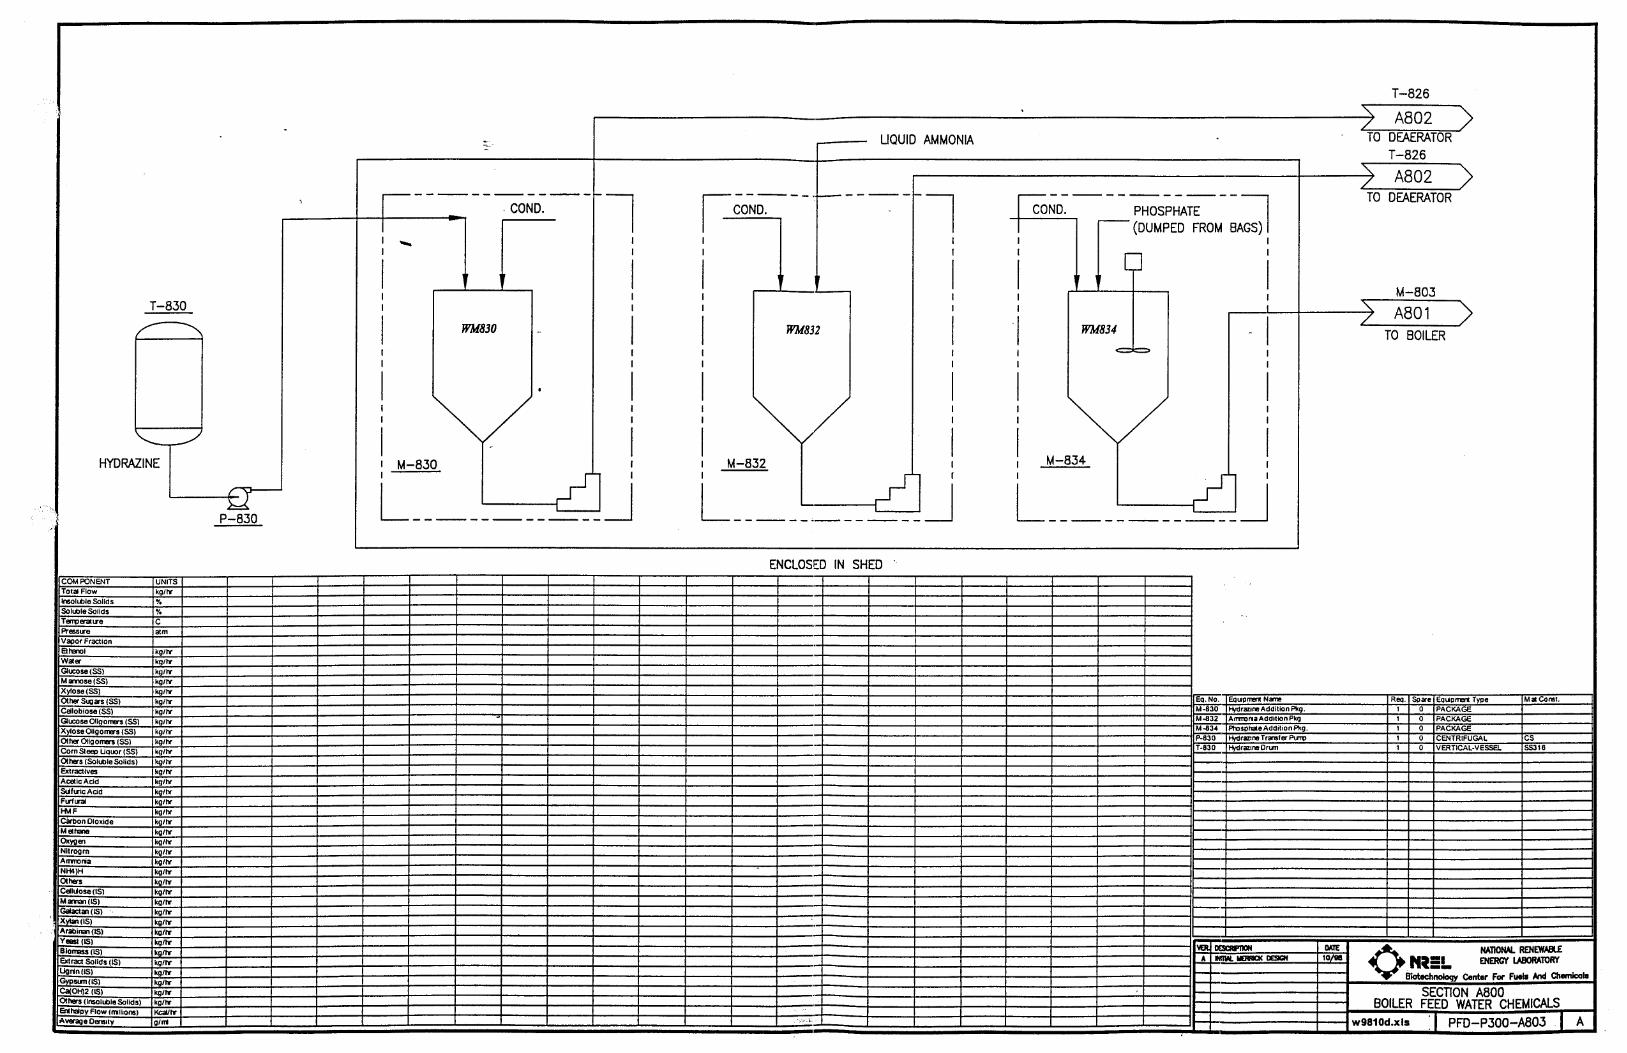
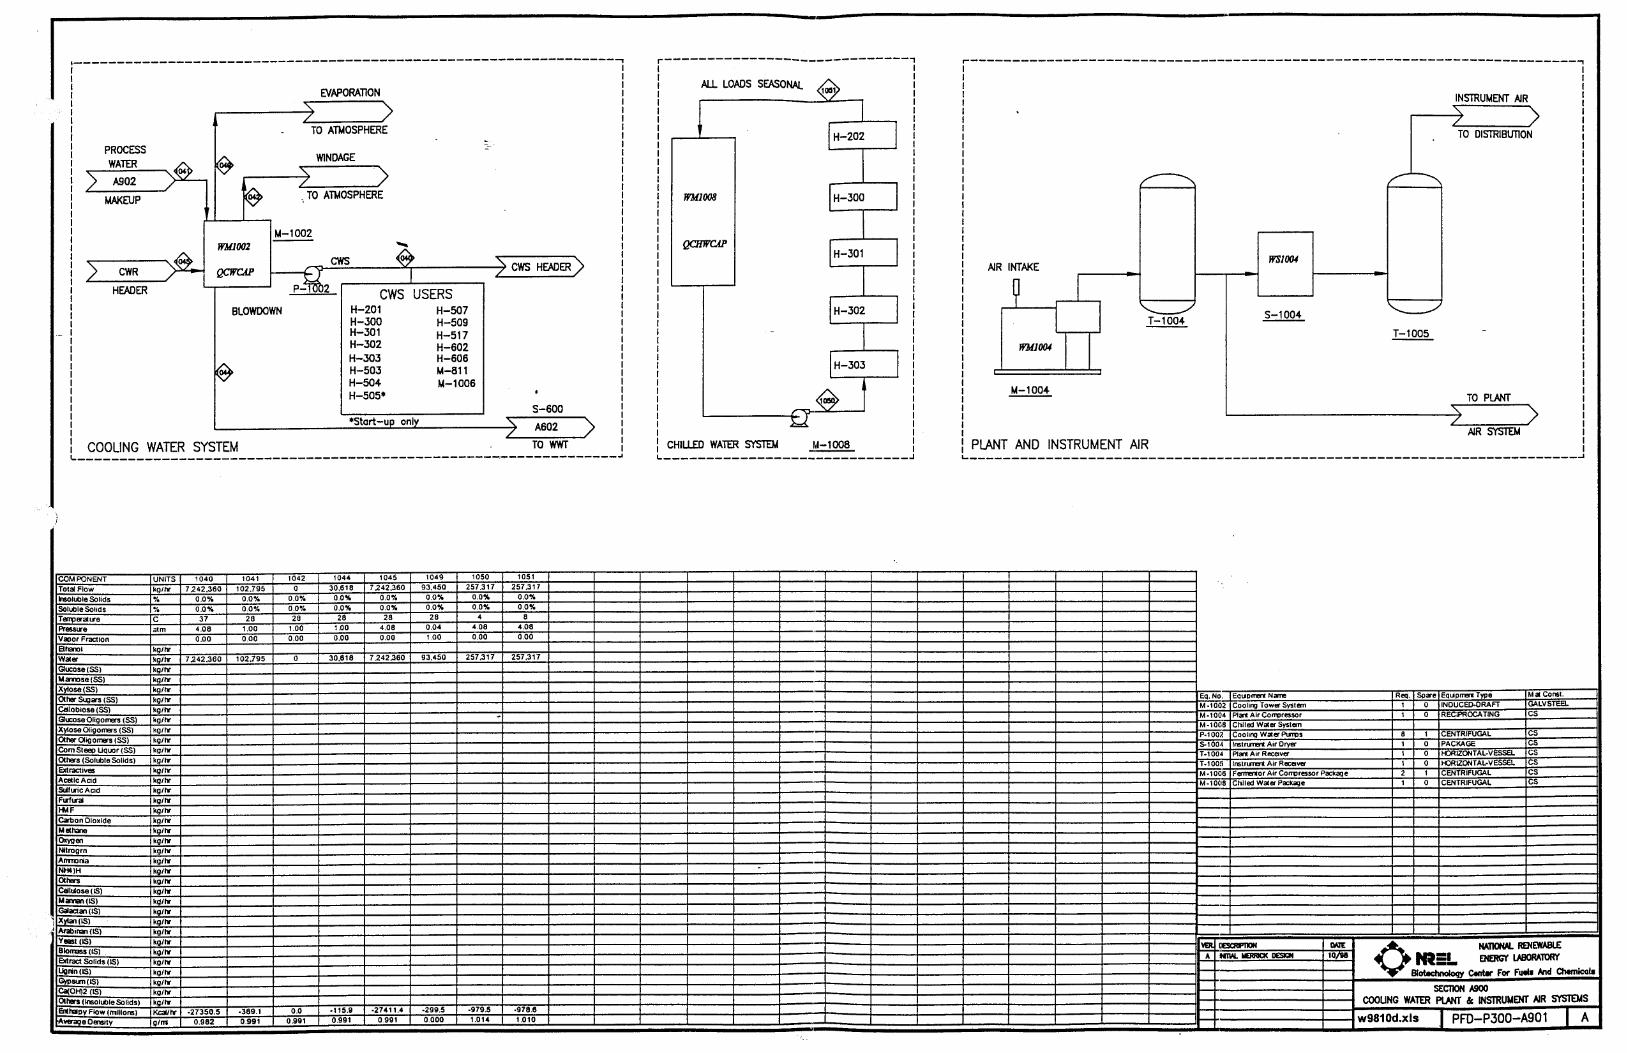
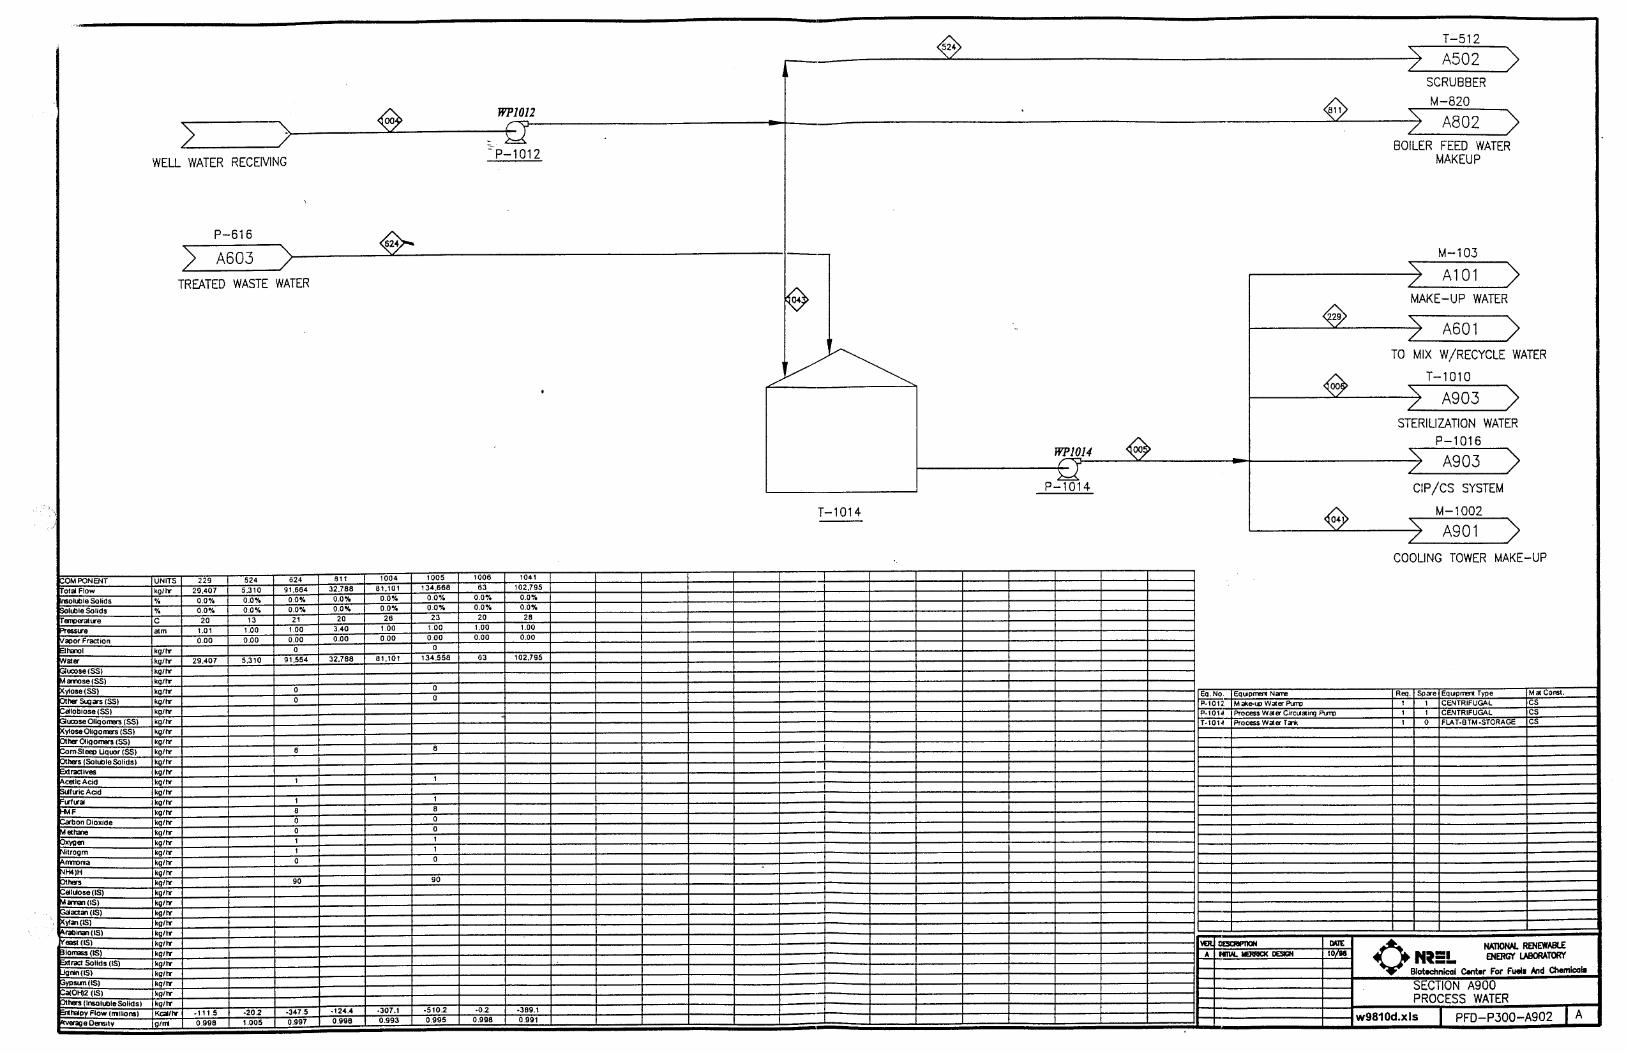
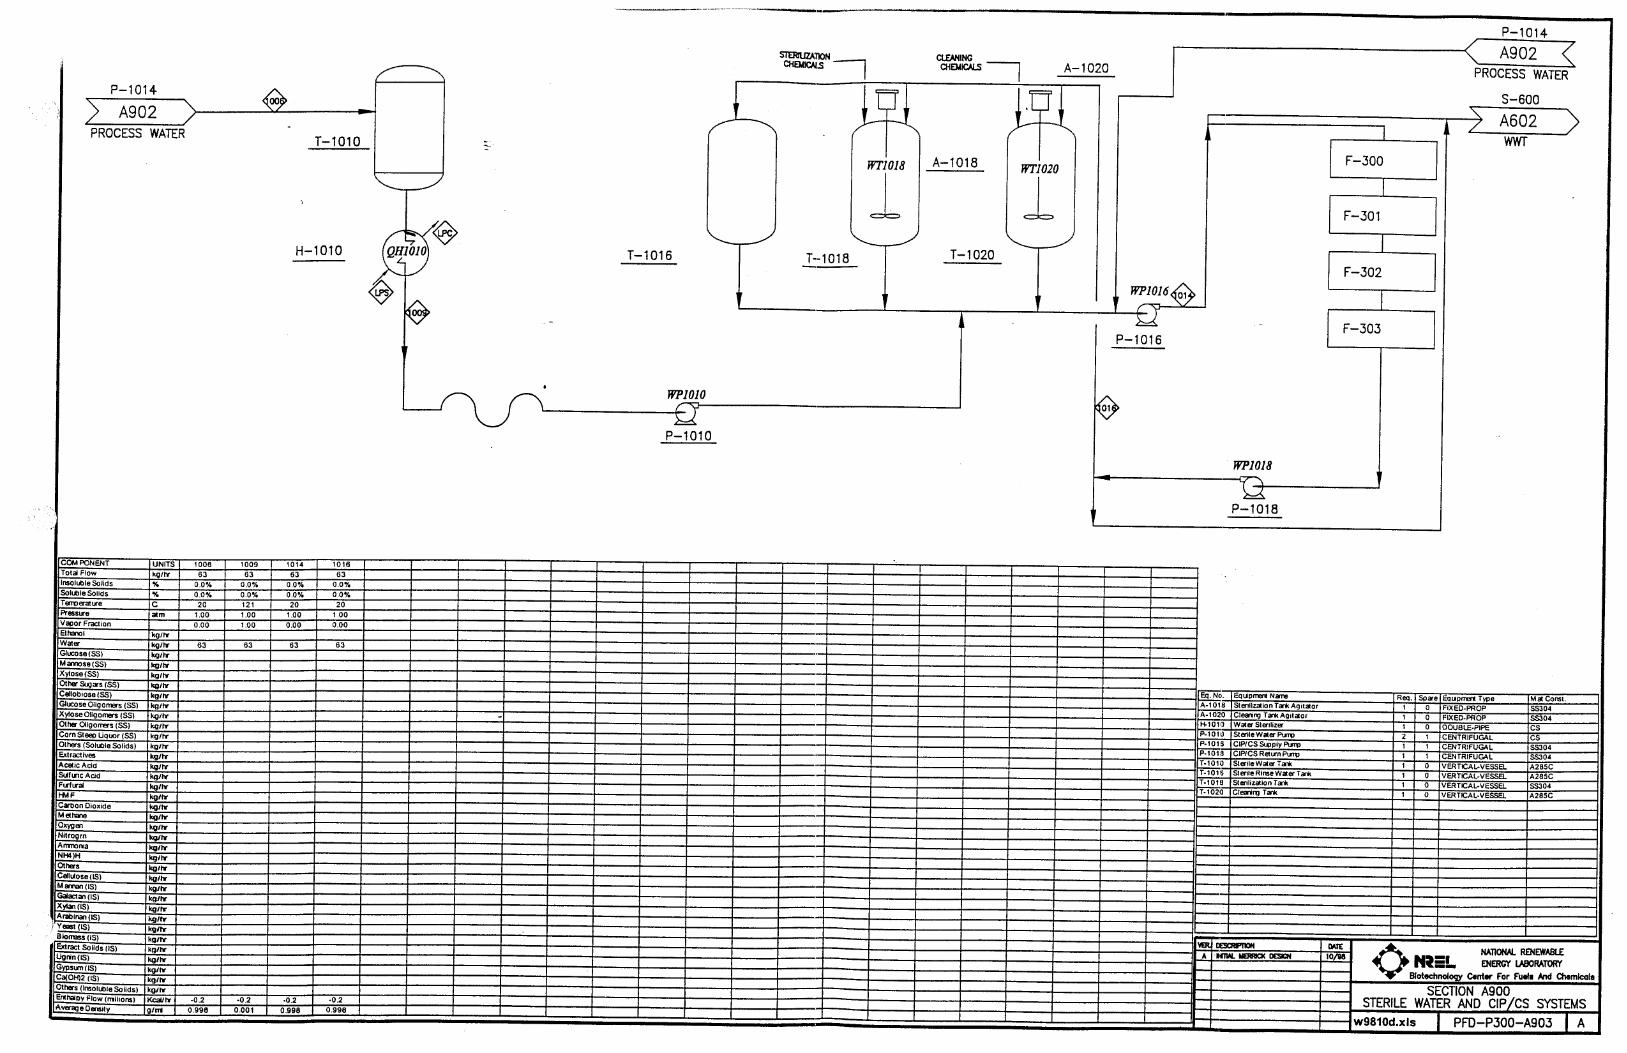
APPENDIX D
CHIP HANDLING REPORT
40
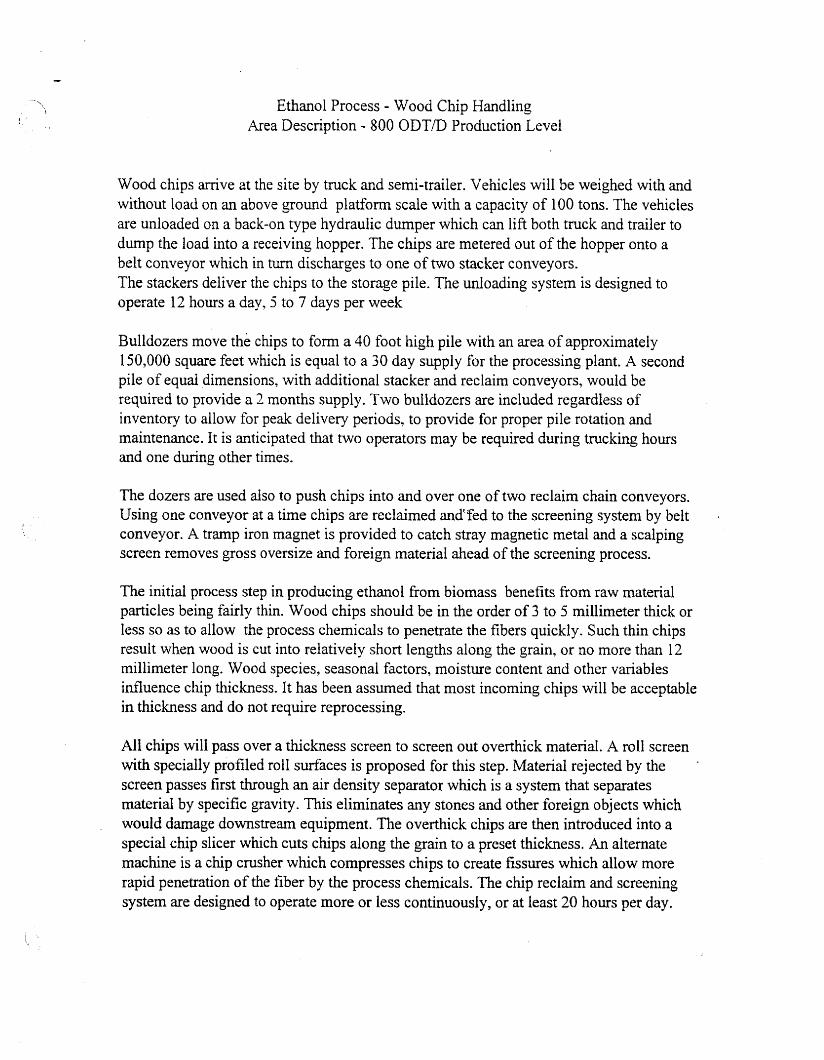
-x\ '\
I
Ethanol Process - Wood Chip Handling Area Description - 800 ODTD Production Level
Wood chips arrive at the site by truck and semi-trailer. Vehicles will be weighed with and without load on an above ground platform scale with a capacity of 100 tons. The vehicles are unloaded on a back-on type hydraulic dumper which can lift both truck and trailer to dump the load into a receiving hopper. The chips are metered out of the hopper onto a belt conveyor which in turn discharges to one of two stacker conveyors. The stackers deliver the chips to the storage pile. The unloading system is designed to operate 12 hours a day, 5 to 7 days per week
Bulldozers move the chips to form a 40 foot high pile with an area of approximately 150,000 square feet which is equal to a 30 day supply for the processing plant. A second pile of equal dimensions, with additional stacker and reclaim conveyors, would be required to provide a 2 months supply. Two bulldozers are included regardless of inventory to allow for peak delivery periods, to provide for proper pile rotation and maintenance. It is anticipated that two operators may be required during trucking hours and one during other times.
The dozers are used also to push chips into and over one of two reclaim chain conveyors. Using one conveyor at a time chips are reclaimed andyed to the screening system by belt conveyor. A tramp iron magnet is provided to catch stray magnetic metal and a scalping screen removes gross oversize and foreign materia1 ahead of the screening process.
The initial process step in producing ethanol from biomass benefits from raw material particles being fairly thin. Wood chips should be in the order of 3 to 5 millimeter thick or less so as to allow the process chemicals to penetrate the fibers quickly. Such thin chips result when wood is cut into relatively short lengths along the grain, or no more than 12 millimeter long. Wood species, seasonal factors, moisture content and other variables influence c h p thickness, It has been assumed that most incoming chips will be acceptable in thickness and do not require reprocessing.
All chips will pass over a thickness screen to screen out overthick material. A roll screen with specially profiled roll surfaces is proposed for this step. Material rejected by the screen passes first through an air density separator which is a system that separates material by specific gravity. This eliminates any stones and other foreign objects which would damage downstream equipment. The overthick chips are then introduced into a special chip slicer which cuts chips along the grain to a preset thickness. An alternate machine is a chip crusher which compresses chips to create fissures which allow more rapid penetration of the fiber by the process chemicals. The chip reclaim and screening system are designed to operate more or less continuously, or at least 20 hours per day.
--l 1 -
In order to allow for equipment maintenance and to guard against breakdowns a storage silo is provided. The silo will hold approx. 55,000cu.ft. of screened chips which is equal to 8 hours of plant operation. Chips are metered and conveyed to the process piant on a continuous. 24 hour basis.
Several process alternates were considered. A fully automated chip storage and reclaim system was discussed which would not require either bulldozers or operators. Such a system can provide full inventory control and material turn-over and eliminates material break-down due to bulldozer action. Fiber loss and operating cost savings are the main advantages. Because of high capital cost this option was not pursued. Alternates for fiber preparation were also considered. As a substitute for screening and slicing of chips the use of hammermills was discussed. Running a11 chips through such equipment would require high energy input and wouid unnecessarily degrade the material. However, hammermills could be fhther evaluated for use after screening and to repiace a slicer.
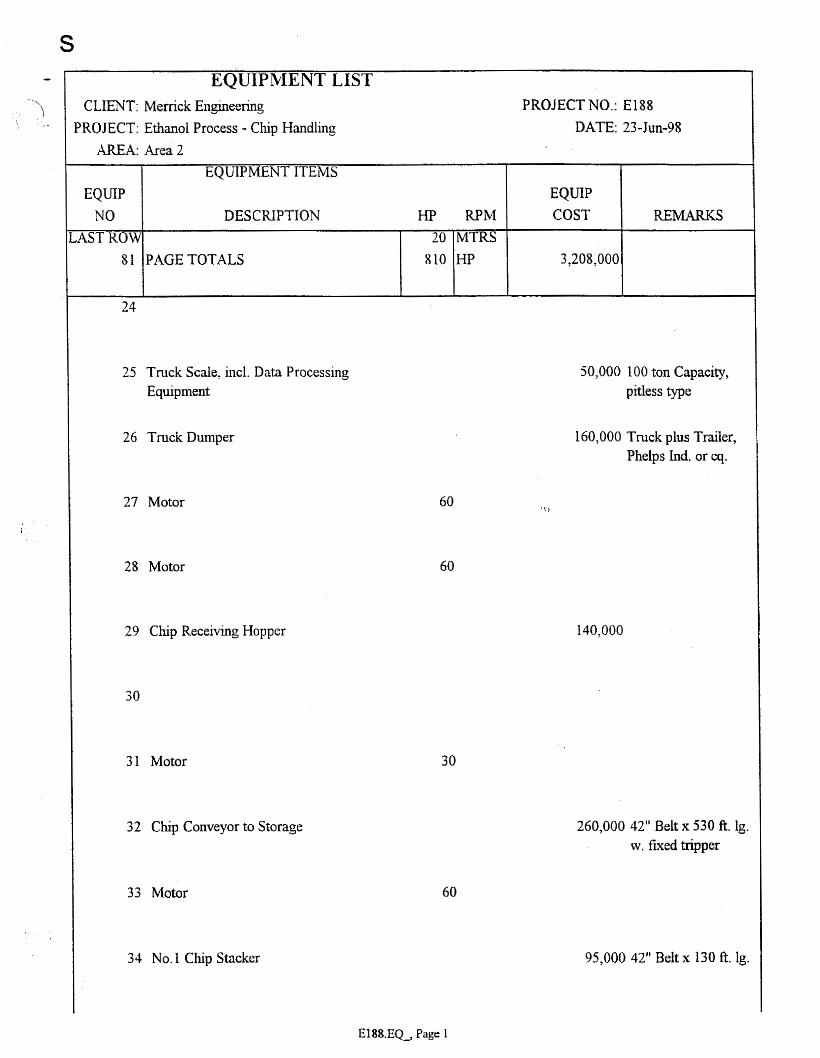
S
EQUIP NO
'AST ROW 81
EQUIPMENT LIST
EQUIPMENT ITEMS EQUIP
DESCNPTION HP RPM COST 20 MTRS
PAGETOTUS 810 HP 3,208,OOC
25 Truck Scale, incl, Data Processing Equipment
26 Truck Dumper
27 Motor
28 Motor
29 C h p Receiving Hopper
30
31 Motor
32 Chp Conveyor to Storage
33 Motor
34 No.1 Chip Stacker
El88 23-Jun-98
REMARKS
50,000 TOO ton Capacity, pitless type
160,000 Truck phs Trailer, Phelps Ind. or eq.
60
60
140,OOO
30
260,000 42" Belt x 530 ft. lg. w. fixed tripper
60
95,000 42" Belt x 130 ft. lg.
E l 8 8 . E L Page 1
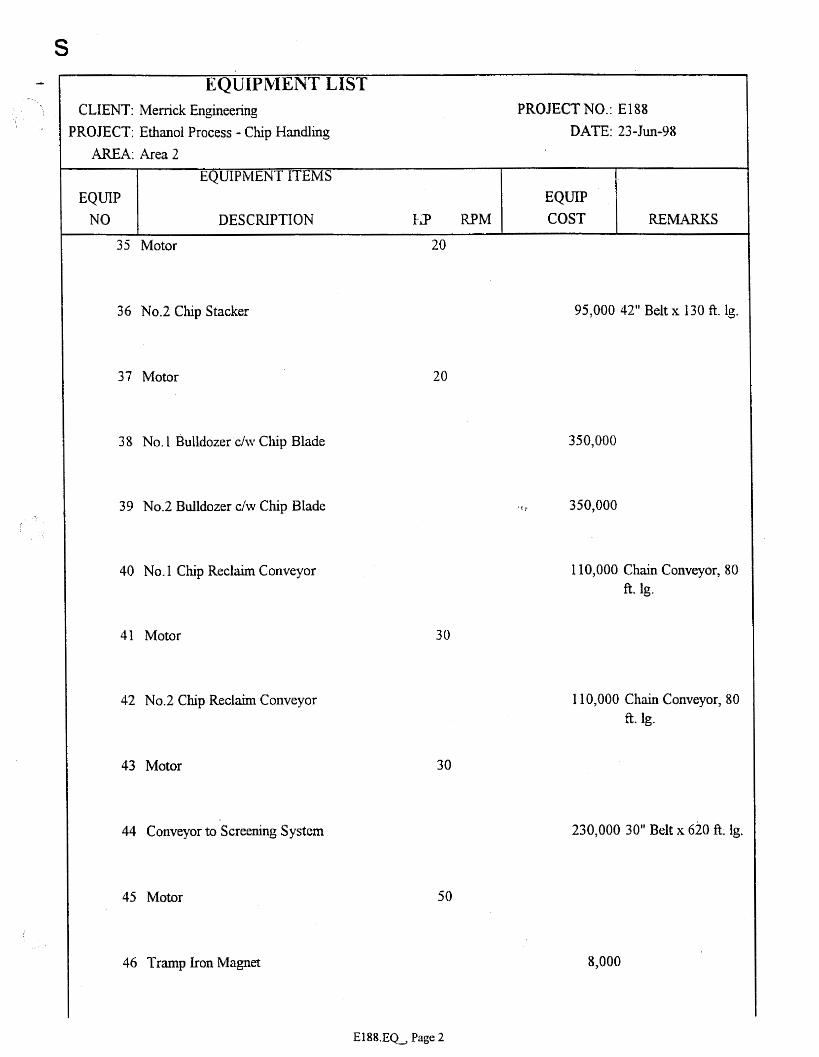
S
EQUIPMENT ITEMS
DESCRIPTION LP RPM
I EQUIP COST REMARKS
EQUIP NO
35 Motor
36 No.2 Chip Stacker
20
95,000 42" Belt x 130 A. lg.
37 Motor 20
3 8 No. 1 Bulldozer c/w Chip Blade
39 No.2 Bulldozer c/w C h p Blade
40 No. 1 Chip Reclaim Conveyor
41 Motor
42 No.2 Chip Reclaim Conveyor
43 Motor
44 Conveyor to Screening system
45 Motor
3 50,000
* ! - 350,000
110,000 Chain Conveyor, SO ft. lg.
30
110,000 Chain Conveyor, 80 ft. lg.
30
230,000 30" Belt x 620 ft. lg.
50
46 Tramp Iron Magnet 8,000
E l 8 8 . E k Page 2
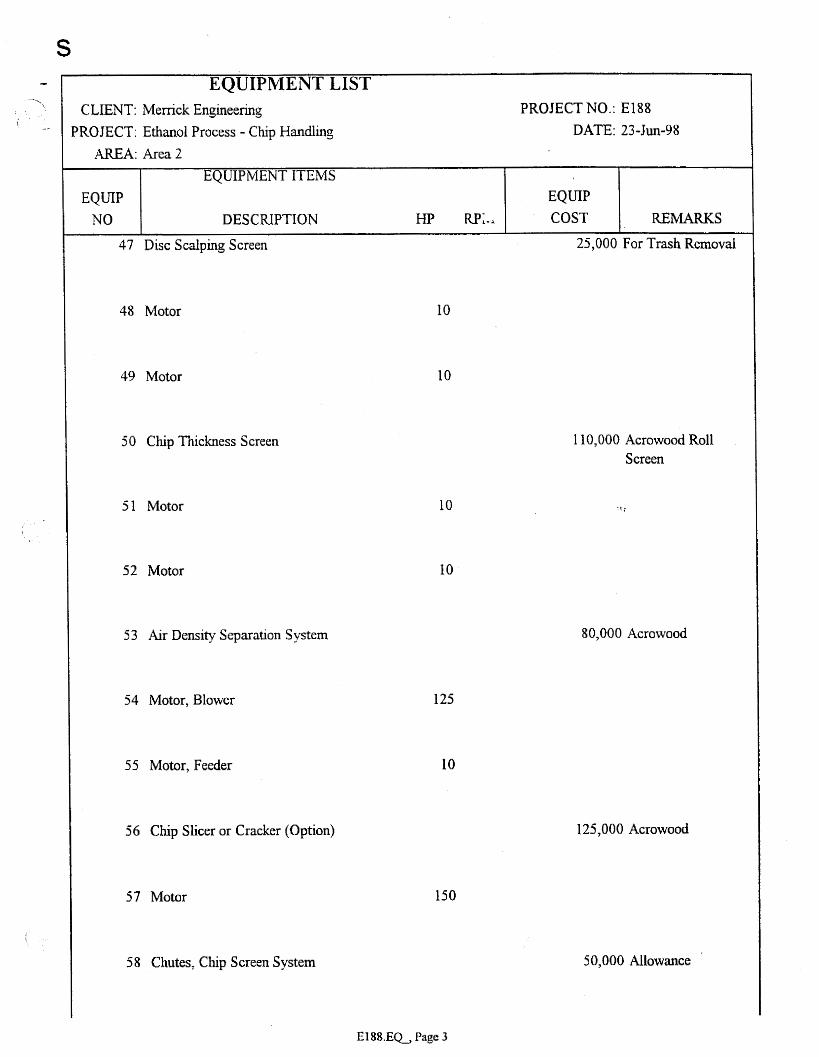
S
EQUIP NO
EQUIPMENT ITEMS EQUIP
DESCIUPTION KP RP;., COST REMARKS
47 Disc Scaiping Screen 25,000 For Trash Removal
48 Motor
49 Motor
50 Chip Thickness Screen
51 Motor
52 Motor
53 IQlr Density Separation System
54 Motor, Blower
55 Motor, Feeder
56 Chip Slicer or Cracker (Option)
57 Motor
5 8 Chutes, Chp Screen System
10
20
10
I0
125
10
150
110,000 Acrowood Roll Screen
80,000 Acrowood
125,000 Acrowood
50,000 Allowance
EI 88.EQ, Page 3
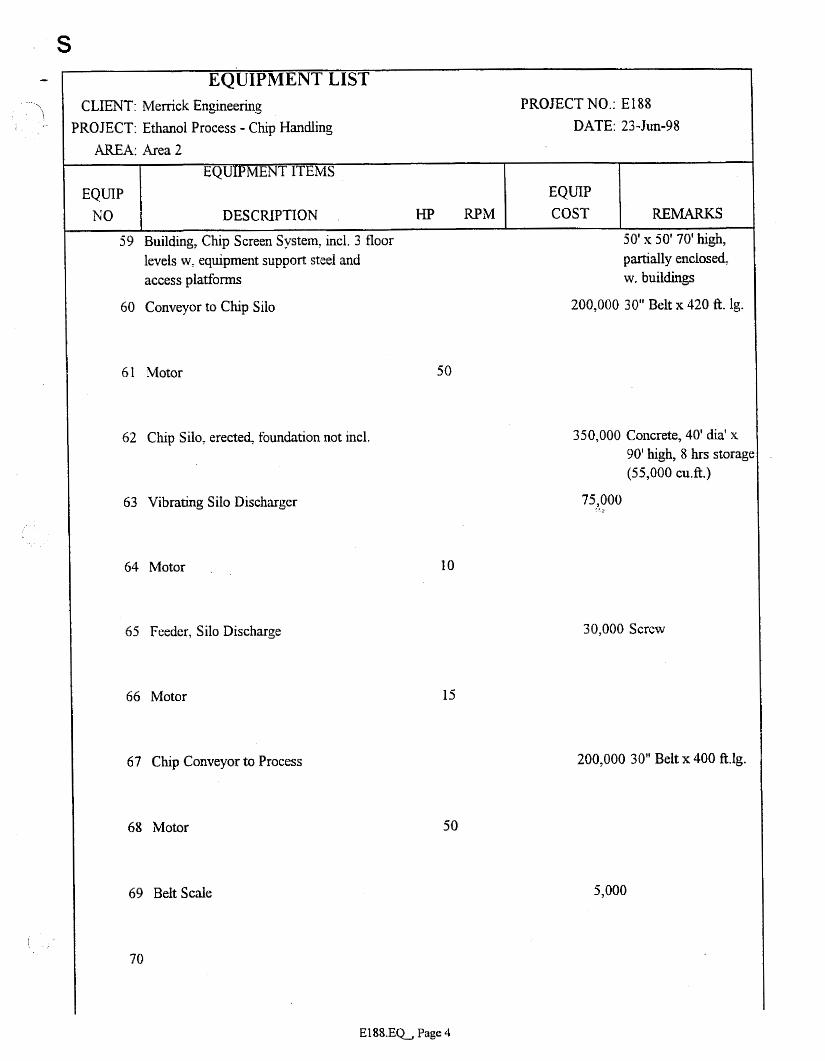
- \
1 .
EQUIPMENT LIST CLIENT: Merrick Engmeering PROJECTNO.: El88
PROJECT: Ethanol Process - Chip Handling DATE: 23-JW-98
REMARKS I
access platforms
60 Conveyor to Chip Silo
61 Motor
62 Chip Silo, erected, foundation not ind.
63 Vibrating SiIo Discharger
64 Motor ,
65 Feeder, Silo Discharge
66 Motor
67 Chp Conveyor to Process
68 Motor
69 BeIt Scale
70
I
EQUIP NO
50' x 50' 70' hgh, partially enclosed, w. buildings
200,000 30" Belt x 420 ft. lg.
EQUIPMENT ITEMS EQUIP
DESCRIPTION HP RPM COST
50
350,000 Concrete, 40' &a' x 90' high, 8 hrs storage (55,000 cu.ft.)
75,000 ' 7, :
I0
30,000 Screw
15
200,000 30" Belt x 400 ft.lg.
50
5,000
E l 8 8 . E k Page 4
S
EQUIP NO
\
EQUIPMENT ITEMS EQUIP
DESCRIPTION HP RPM COST REMARKS
EQUIPMENT LIST
72
73
75
76
77
78
79
80
81
E l 8 8 . E k Page 5
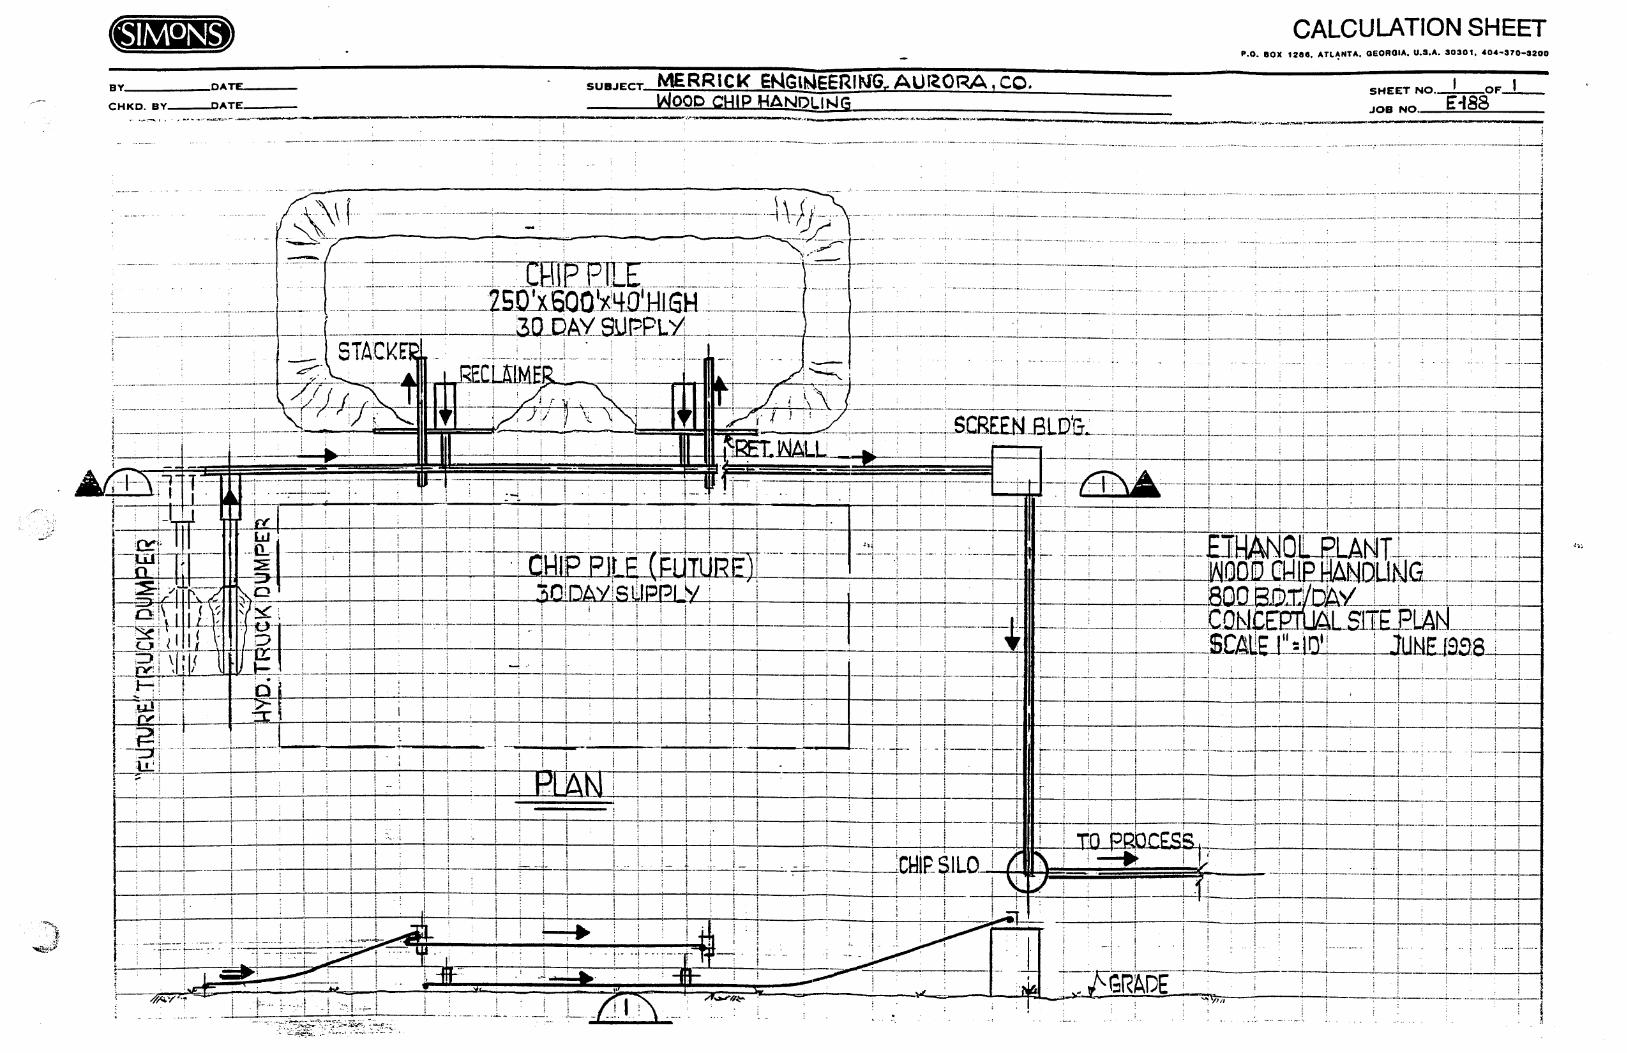
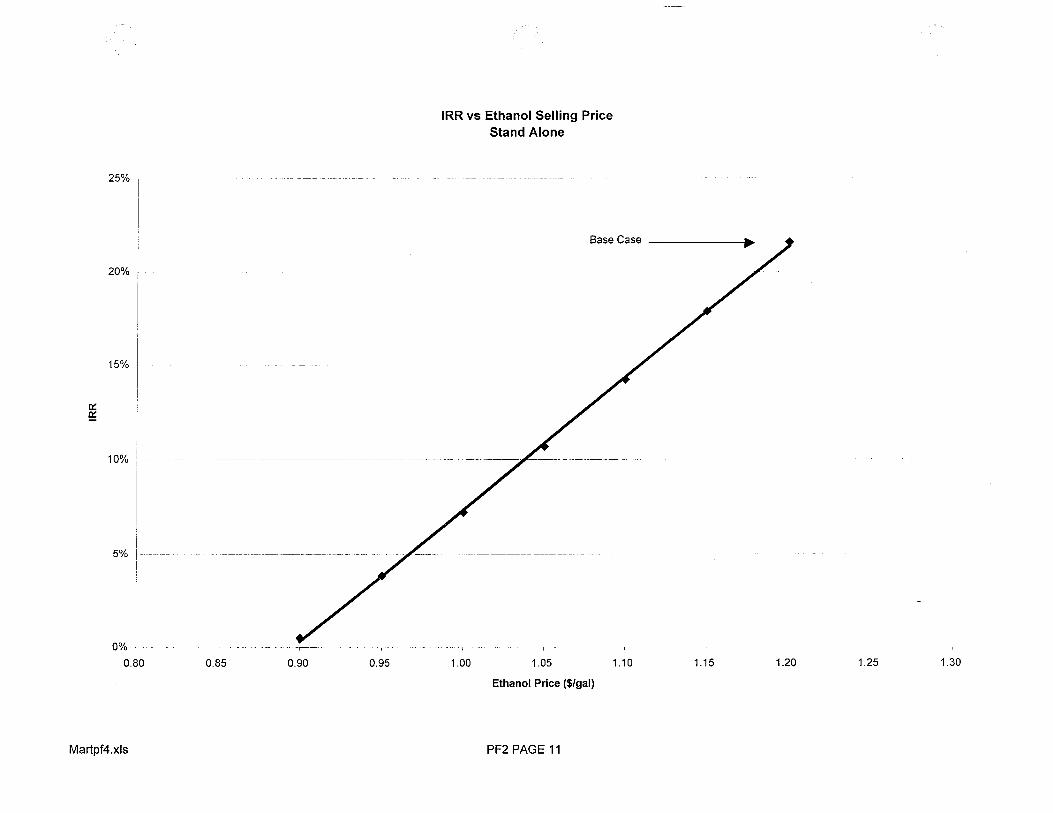
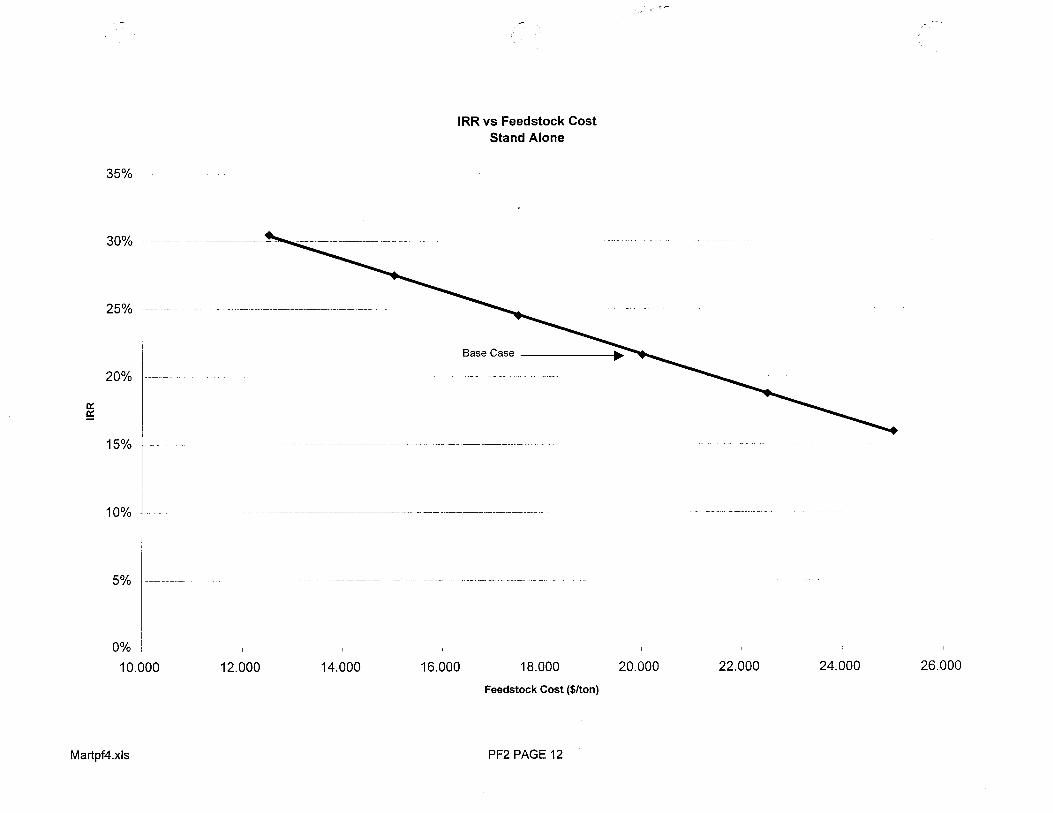
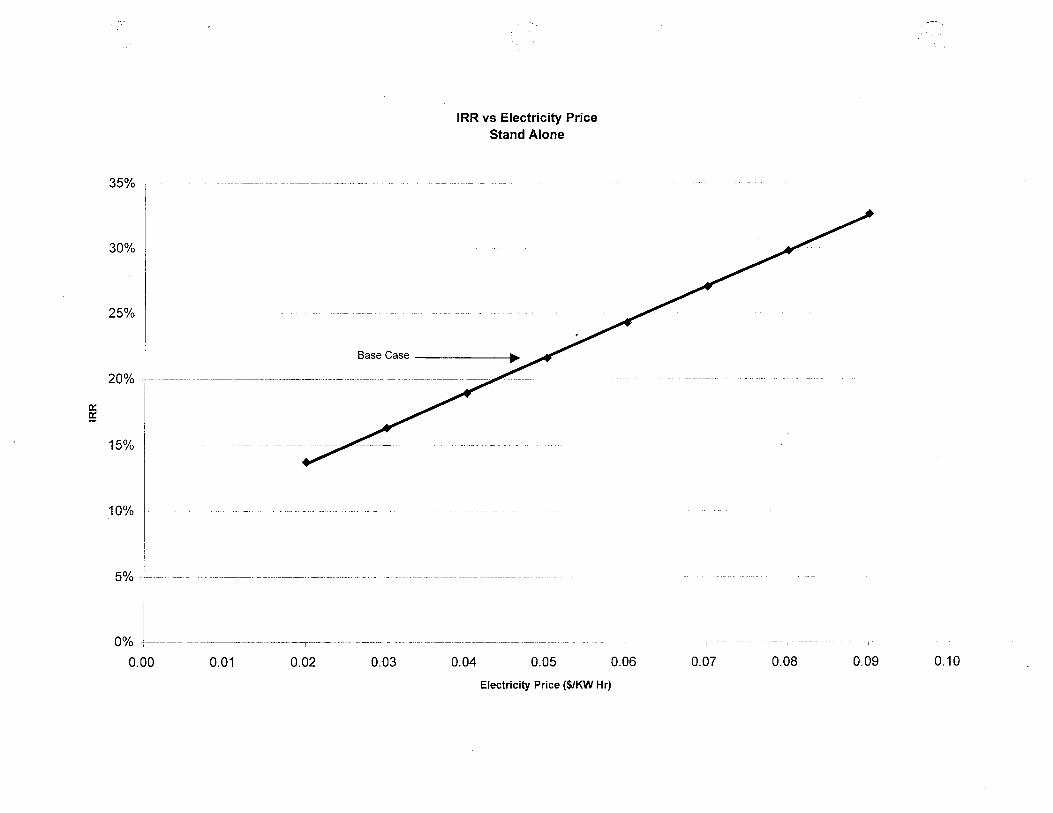
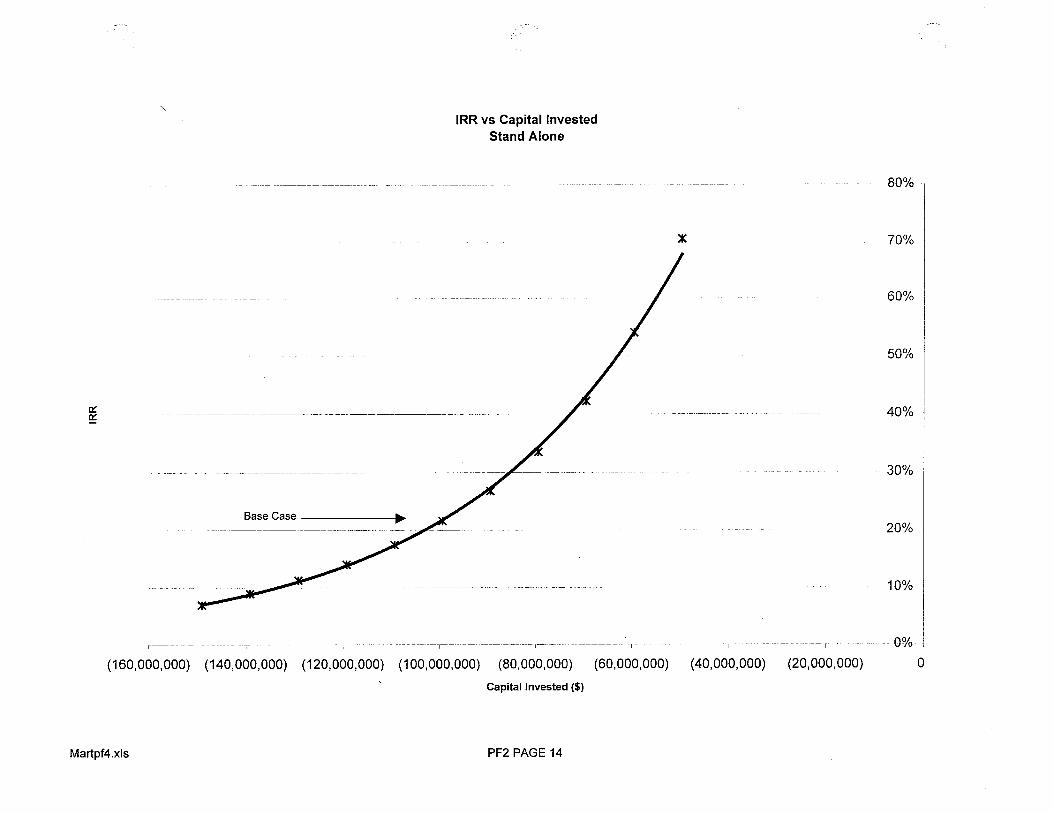
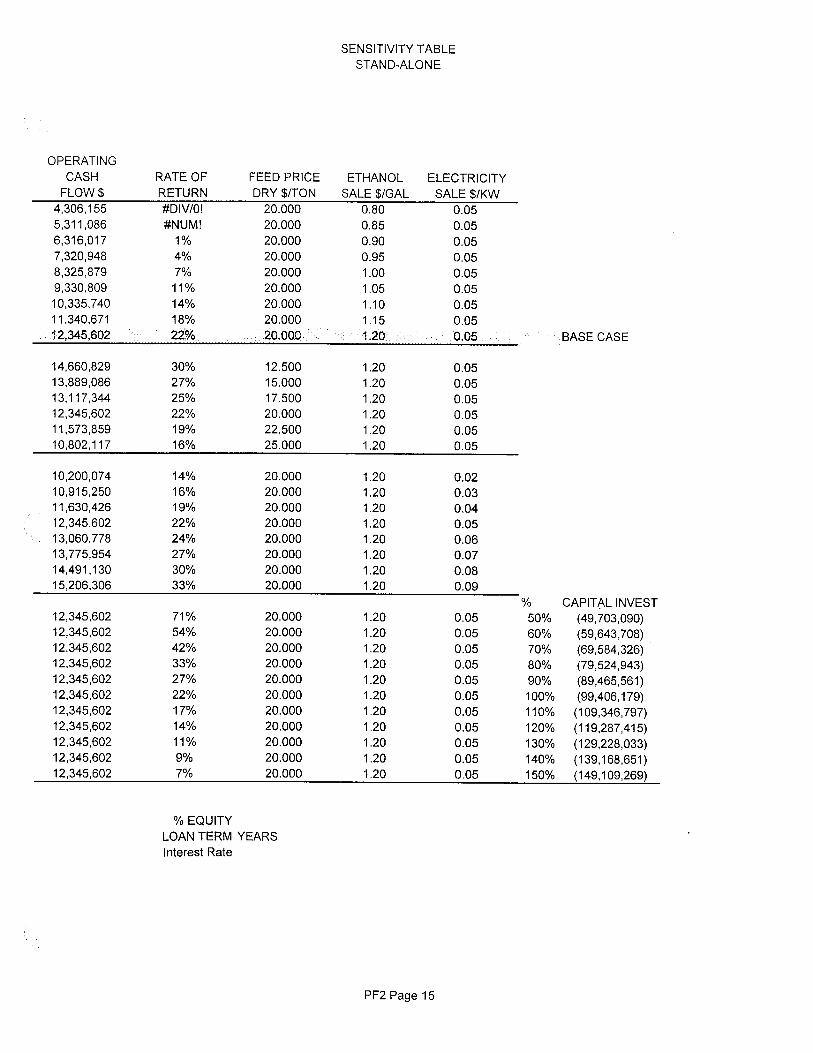
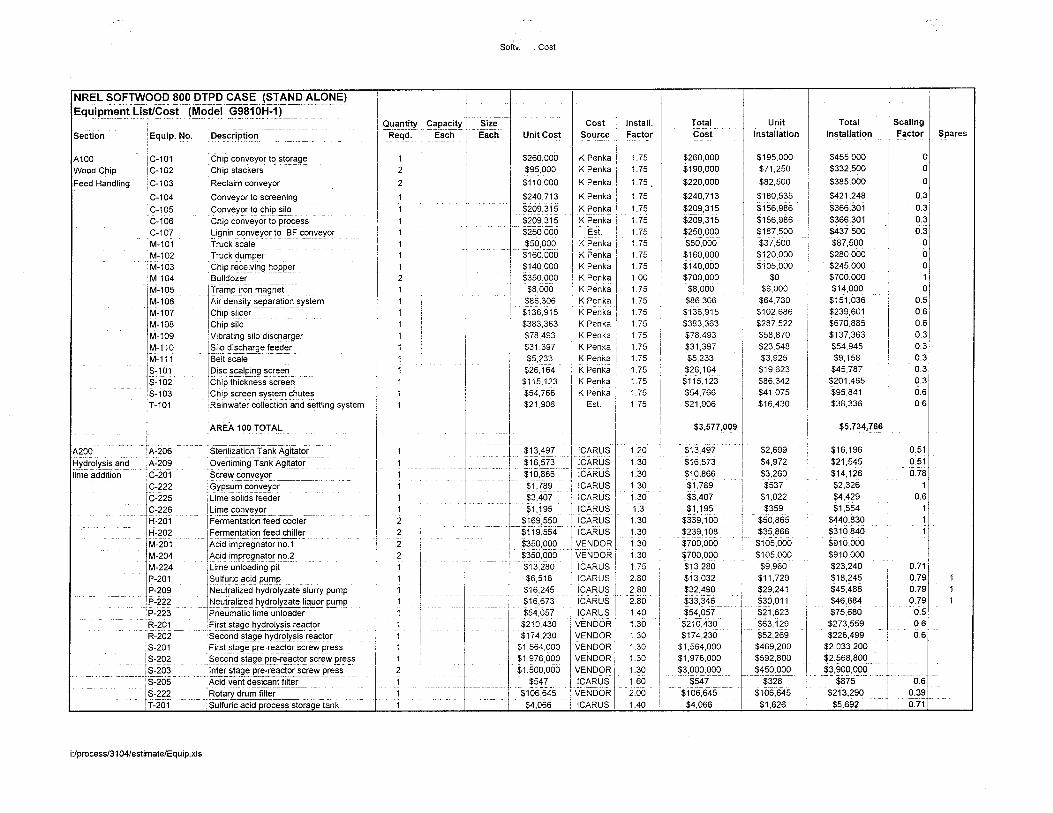
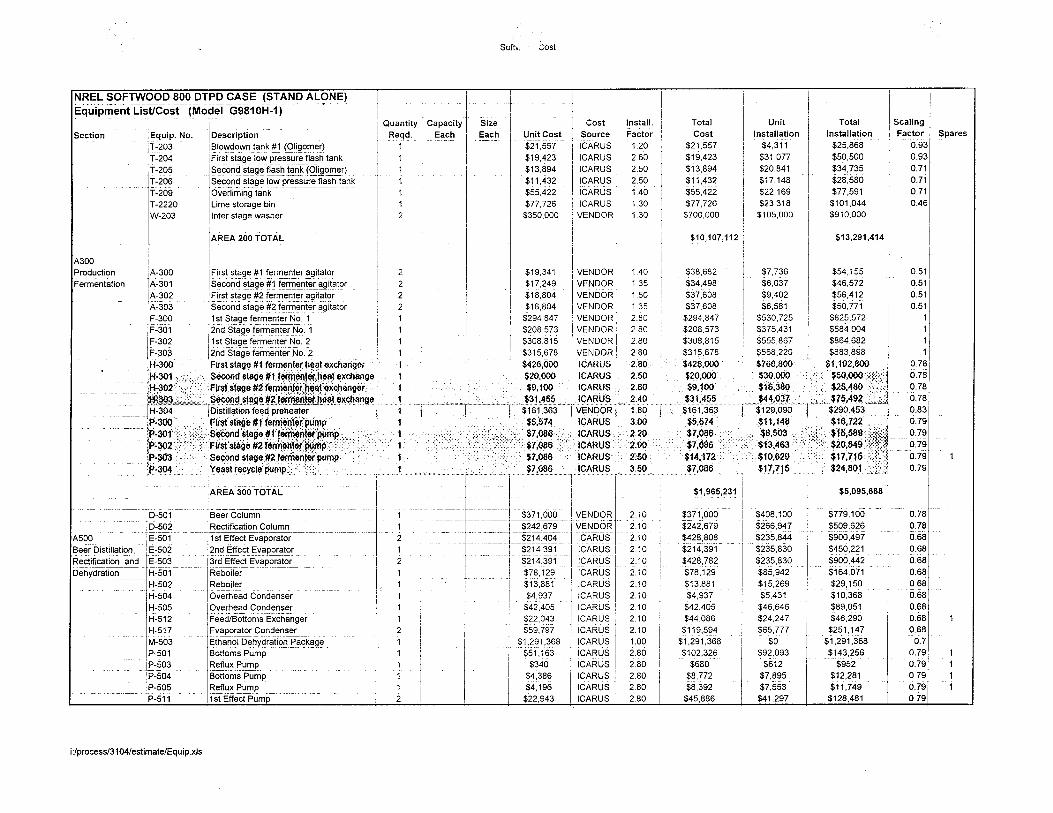
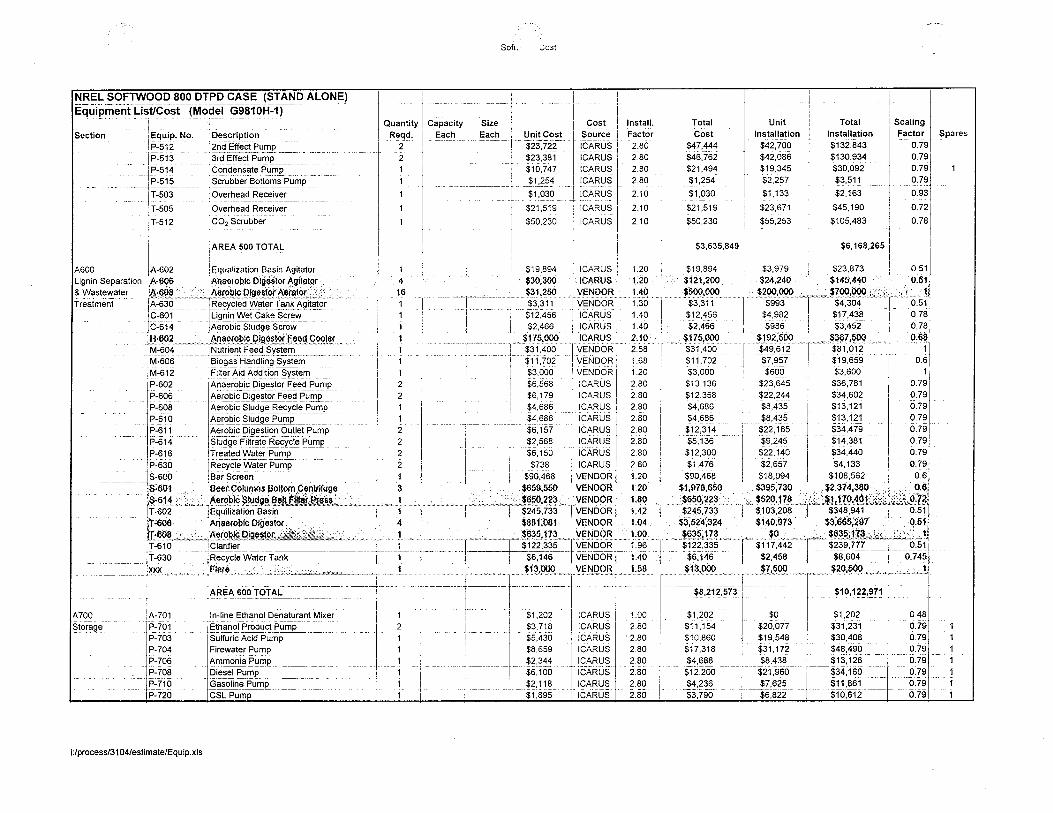
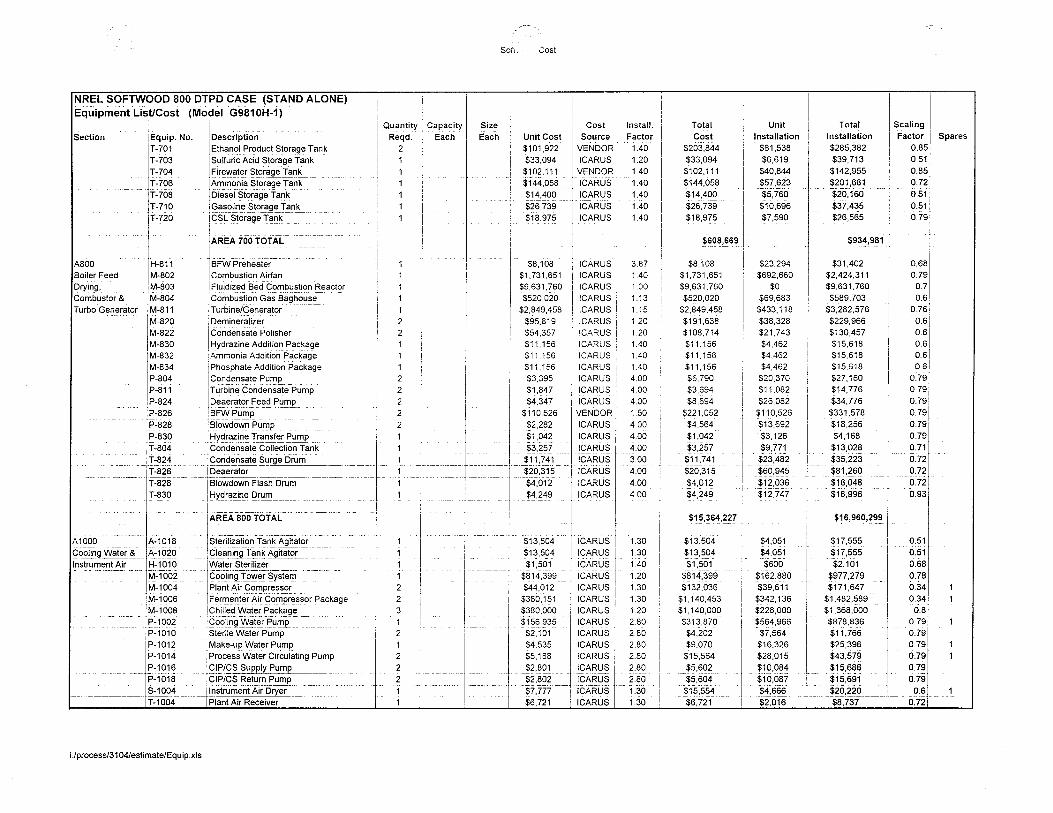
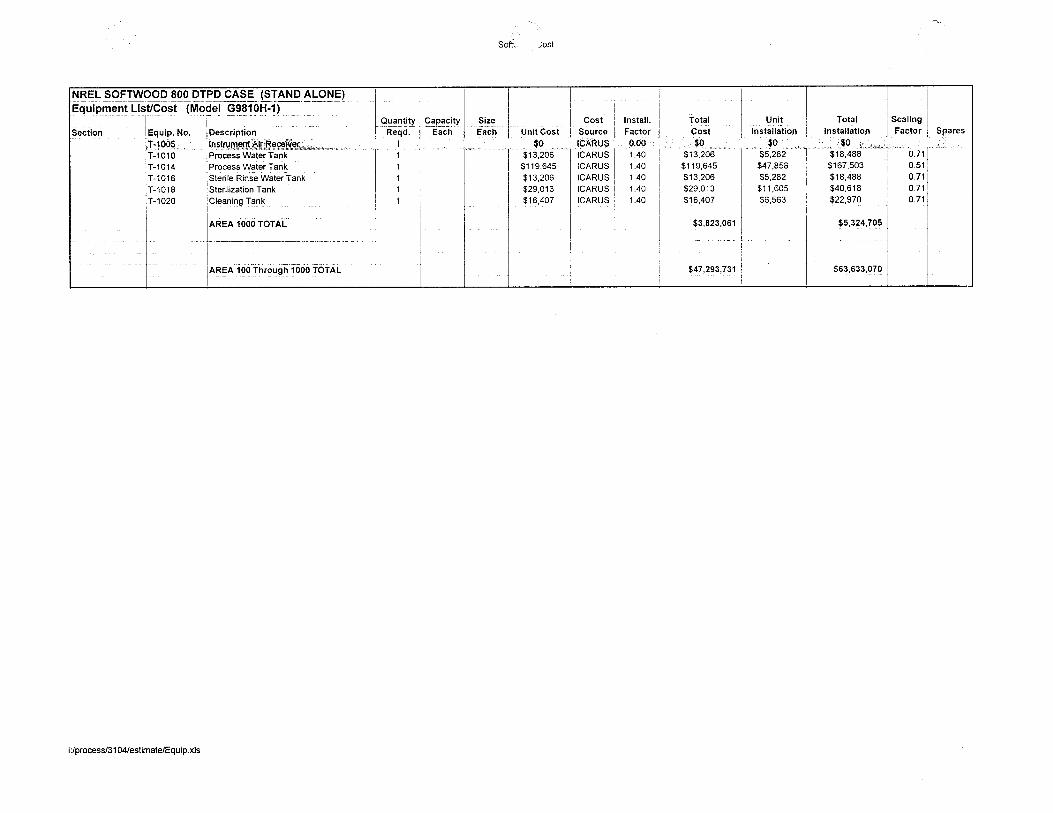
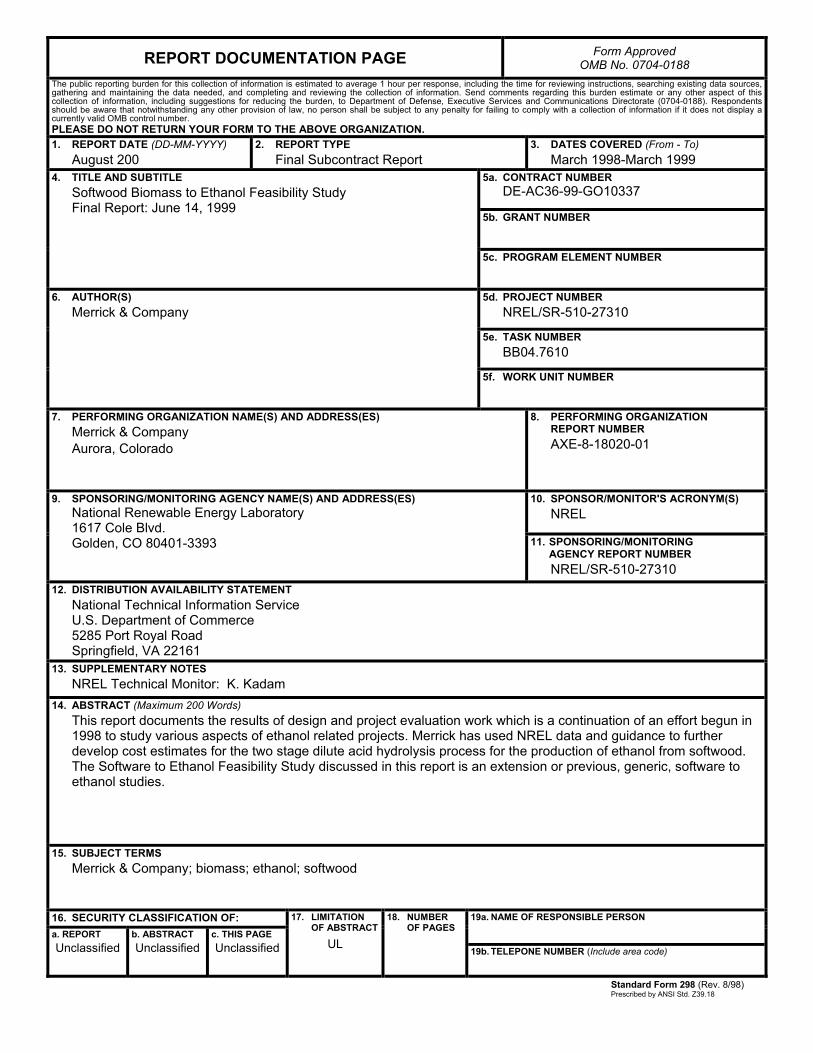
REPORT DOCUMENTATION PAGE Form Approved OMB No. 0704-0188
The public reporting burden for this collection of information is estimated to average 1 hour per response, including the time for reviewing instructions, searching existing data sources, gathering and maintaining the data needed, and completing and reviewing the collection of information. Send comments regarding this burden estimate or any other aspect of this collection of information, including suggestions for reducing the burden, to Department of Defense, Executive Services and Communications Directorate (0704-0188). Respondents should be aware that notwithstanding any other provision of law, no person shall be subject to any penalty for failing to comply with a collection of information if it does not display a currently valid OMB control number. PLEASE DO NOT RETURN YOUR FORM TO THE ABOVE ORGANIZATION. 1. REPORT DATE (DD-MM-YYYY)
August 200 2. REPORT TYPE
Final Subcontract Report 3. DATES COVERED (From - To)
March 1998-March 1999 5a. CONTRACT NUMBER
DE-AC36-99-GO10337
5b. GRANT NUMBER
4. TITLE AND SUBTITLE Softwood Biomass to Ethanol Feasibility Study Final Report: June 14, 1999
5c. PROGRAM ELEMENT NUMBER
5d. PROJECT NUMBER NREL/SR-510-27310
5e. TASK NUMBER BB04.7610
6. AUTHOR(S) Merrick & Company
5f. WORK UNIT NUMBER
7. PERFORMING ORGANIZATION NAME(S) AND ADDRESS(ES) Merrick & Company Aurora, Colorado
8. PERFORMING ORGANIZATION REPORT NUMBER AXE-8-18020-01
10. SPONSOR/MONITOR'S ACRONYM(S) NREL
9. SPONSORING/MONITORING AGENCY NAME(S) AND ADDRESS(ES) National Renewable Energy Laboratory 1617 Cole Blvd. Golden, CO 80401-3393 11. SPONSORING/MONITORING
AGENCY REPORT NUMBER NREL/SR-510-27310
12. DISTRIBUTION AVAILABILITY STATEMENT National Technical Information Service U.S. Department of Commerce 5285 Port Royal Road Springfield, VA 22161
13. SUPPLEMENTARY NOTES NREL Technical Monitor: K. Kadam
14. ABSTRACT (Maximum 200 Words) This report documents the results of design and project evaluation work which is a continuation of an effort begun in 1998 to study various aspects of ethanol related projects. Merrick has used NREL data and guidance to further develop cost estimates for the two stage dilute acid hydrolysis process for the production of ethanol from softwood. The Software to Ethanol Feasibility Study discussed in this report is an extension or previous, generic, software to ethanol studies.
15. SUBJECT TERMS Merrick & Company; biomass; ethanol; softwood
16. SECURITY CLASSIFICATION OF: 19a. NAME OF RESPONSIBLE PERSON a. REPORT
Unclassified b. ABSTRACT Unclassified
c. THIS PAGE Unclassified
17. LIMITATION OF ABSTRACT
UL
18. NUMBER OF PAGES
19b. TELEPONE NUMBER (Include area code)
Standard Form 298 (Rev. 8/98) Prescribed by ANSI Std. Z39.18