software & systems catalog
DESCRIPTION
This document presents all the software and systems developed by ARIA Technologies.TRANSCRIPT
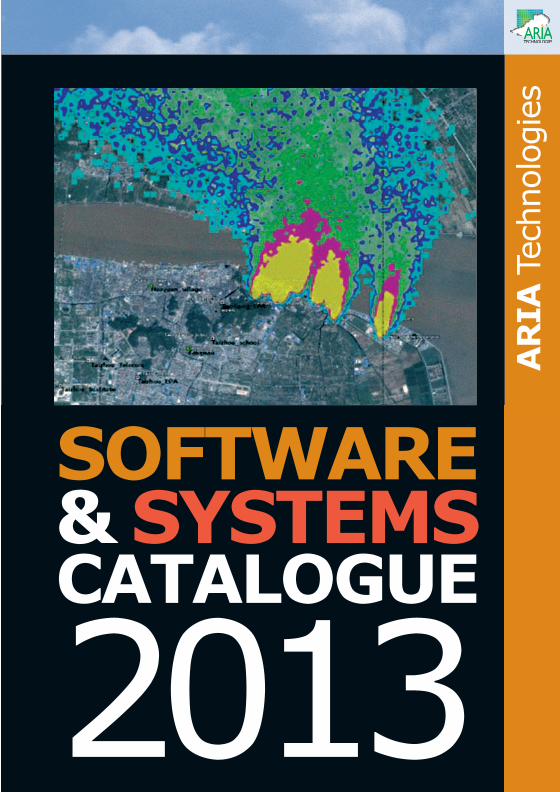
SOFTWARE& SYSTEMSCATALOGUE
2013A
RIA
Tec
hnol
ogie
s
CatalogueLogiciels2013GBV3:Mise en page 1 13/11/12 10:40 Page1
Founded by a group of researchersfrom the French electricity board EDF,ARIA Technologies has played a
pioneering role in the global development ofatmospheric modelling.
The original group has grown into a team of25 engineers drawn from various fields ofatmospheric sciences, who have placed thisknowledge-based SME at the cutting edge.ARIA Technologies’ head office is located inBoulogne-Billancourt, near Paris; off-site staffare posted in Brest, Grenoble, and Toulouse.
Its Italian subsidiaries ARIANET (founded inMilan in 2000) and SIMULARIA (Turin, 2010)together employ 20 engineers specialized inatmospheric sciences. In 2010, ARIAestablished its subsidiary in Rio de Janeiro,Brazil, with a team of 3 specialist engineers.
ARIA Technologies collaborates with keyFrench organizations involved in monitoringair quality — regional air quality managementbodies, CEA (atomic energy), INERIS(environmental safety), METEO-FRANCE(weather) — and with a large number of well-known international partners.
A single concern: the atmospheric environment
2
CatalogueLogiciels2013GBV3:Mise en page 1 13/11/12 10:40 Page2
ARIA Technologies’ software and systemsare designed to address issues related toair pollution—industrial, urban, hazardous,and chronic. They are also suited forspecific uses in applied meteorology.
• ARIA Impact™ and ARIA Impact
3D™: software for studies on the impactof industries and vehicular traffic on airquality
• ARIA City™: GIS-embedded softwarefor modelling air quality in cities
• ARIA Risk™: 3D software for assessingair dispersion of accidental releases
• ARIA Local™: software for calculatingair flow and dispersion at micro-scale
• ARIA Wind™: software for mapping,calculation, and optimization for windfarm sites
• ARIA View™: system for continuoussurveillance of air quality at industrialsites
• ARIA Regional™: system for air qualityanalysis and forecasting at urban andregional levels.
A comprehensive range of software and systems
3
CatalogueLogiciels2013GBV3:Mise en page 1 13/11/12 10:40 Page3

4
ImpactImpactSO
FTW
ARE
ARIA Impact™ is a user-friendly software customized tomeet the requirements of consultancy firms, enterprises,local authorities, and air quality monitoring associations. Itensures compliance with air quality regulations and isused for complete assessments of, for example, healthrisks, olfactory pollution from an industrial site, the impacton air quality and health of a road project. With ARIAImpact™, users can simulate the long-term dispersion ofair pollutants (gaseous or particulate) released from anytype of emission source. They can calculate concentrationsand deposition (dry and wet) expressed as an annualaverage or as percentiles. ARIA Impact™ nowincorporates both the AIM Gaussian model (alreadyavailable in the previous versions) and the AERMOD modelfrom US-EPA.
ImpactImpactSoftware for studies on the impact of industries and vehicular traffic on air quality
Key features
• Easy import of meteorological,terrain, and emission data(constant, cyclic, occasional) fromExcel files
• Statistical processing ofmeteorological data (time series,wind roses)
• Simultaneous processing ofdifferent types of pollutants:gases, particles, odours,radioactive matter, as well as
odour mixes (in odorimetric units)
• Unlimited number of point, area,volume, and line sources
• Conversion of NOx to NO/NO2 forvehicular traffic
• Consideration of constant orfluctuating background pollution
• Extensive range of outputs:concentration and deposition maps(annual average, percentiles, dailyand hourly maximum, exceedancefrequency)
newversion
Selected references:
ABH Environnement;AENA; AFIRM; AirBreizh; ANDRA;Arkema; ASEZA; AXE;BDS Forage; BetureEnvironnement; BureauVeritas Aix-en-Provence/Lille/Lyon/Nantes/Paris/Reims;BURGÉAP; CabinetGreuzat; CabinetMerlin; CEA DAM;CETIM ; CTP; EDS;Entime; EOG; Evolutys;GDF; GEOSAN; GES;GINGER EnvironnementAgen/Montpellier;INGÉROPBesançon/Courbevoie/Marseille/Rennes/Toulouse/; IngevalorisConseil; IRSN; ISPE;ISSEP; JMB; KALIÈS;Ministries ofEnvironment of Maltaand Morocco;Néodyme; Novallia(Belgium); Olentica;Ouest Performance;ORAMIP; OTEIngénierie Illkirch/Metz;PITESTI; RATP; SAIPEM(Italy); Sanofi Aventis;SETIS Environnement ;Socotec St Quentin-en-Yvelines/IndustriesSPPPI (DRIRE NordPas-de-Calais);THERIUS Conseil; Total Petrochemicals;University of Paris VII& XII–DESS QCBA
CatalogueLogiciels2013GBV3:Mise en page 1 13/11/12 10:40 Page4

5
SO
FTW
ARE
• Results for specific points(schools, hospitals, sensors,etc.) at ground level or at agiven altitude
• The AIM model developed byARIA Technologies is based onstability classes and can accountfor calm winds; pollutantdispersion can be modelled froma simple wind rose or a 1- or 3-hourly meteorological database.
• The US-EPA AERMOD model,often described as a second
generation model, is based on the computation ofturbulence; pollutant dispersion can be modelledfrom a 1-hourly meteorological database. Itaccounts for the effect of buildings located near theemission sources.
• Visualization of concentrations at any point by usingthe cursor
• Export of results to Google Earth and to GIS-enabledMapinfo and ArcGIS
• Validated against measured or computed data;validation report available
• Software, detailed technical documentation, andtutorial in English and French.
Project management
All project components are automatically stored incorresponding folders: geographical context, terrain,mapping objects, land cover data, station coordinates,meteorological data, and emissions. Variants arecreated by loading a previous project.
Maps: import from/export to GIS
Geographical data can be imported directly from majorGIS (Mapinfo, ArcInfo/ArcView), in DXF or shapefileformats. The dispersion calculations actually useterrain and land cover data.
Emissions management
For each source, time variation profiles (monthly,weekly, hourly) help define a realistic emissionscenario that provides an accurate assessment of thelong-term impact. The model can also account fortechnical breaks in industrial emissions. Existingemission data can be easily imported from Excelsheets into ARIA Impact™.
CatalogueLogiciels2013GBV3:Mise en page 1 13/11/12 10:41 Page5

6
ARIA Impact3D3D
ARIA Impact3Dsoftware is designedto assess the chronicimpact of industrialplants on air qualitythrough thesimulation of actualor virtual emissionscenarios.It simulates in 3D the
air dispersion of pollutants (gaseous or particulate) fromstacks and outlets, and fugitive sources based on a detailedaccount of terrain, building effects, and meteorological datameasured or forecast simultaneously at multiple heights.
ARIA Impact3D is intended for enterprises, consulting firms,and local authorities of industrial zones that need a detailedassessment of chronic risks. It integrates a 3D Lagrangiandispersion module.
Impact3DImpact3DSO
FTW
ARE
Objectives
• Model air pollution aroundindustrial sites
• Conduct studies (diagnostics,preparation, surveillance) for airquality improvement campaigns
• Plan and develop pollutionmonitoring strategies
• Model and map air pollutantemissions in a city district, city,or region
• Simulate air dispersion of allpollutants measured by airquality monitoring networks inthe study area
• Determine the contribution ofeach emission source
• Analyse existing regulationstrategies
• Simulate the meteorologicalconditions in 3D environment tostudy past episodes or forecastfuture episodes
Key features
• Fully compatible with ARIAImpact™ (provided): allows tostudy significant episodes with2D and 3D emission scenarios.
• Provided with MSS (Micro SWIFTSPRAY), the state-of-the-artlagrangian particle dispersionmodel developped by ARIATechnologies and its partnersARIANET and Mokili.
• Includes CALPUFF, a lagrangianpuff dispersion model which usesCALMET meteorological fields orstation data; CALMET andCALPUFF are US-EPA approved.
• Simulation time period rangingfrom one hour to several years
• Can be inserted as an engine inthe ARIA View™ system forproducing a detailed real-timemap of the impact of anindustrial site.
3D software for studies on the impact of industries and vehicular traffic on air quality
new
software
CatalogueLogiciels2013GBV3:Mise en page 1 13/11/12 10:41 Page6
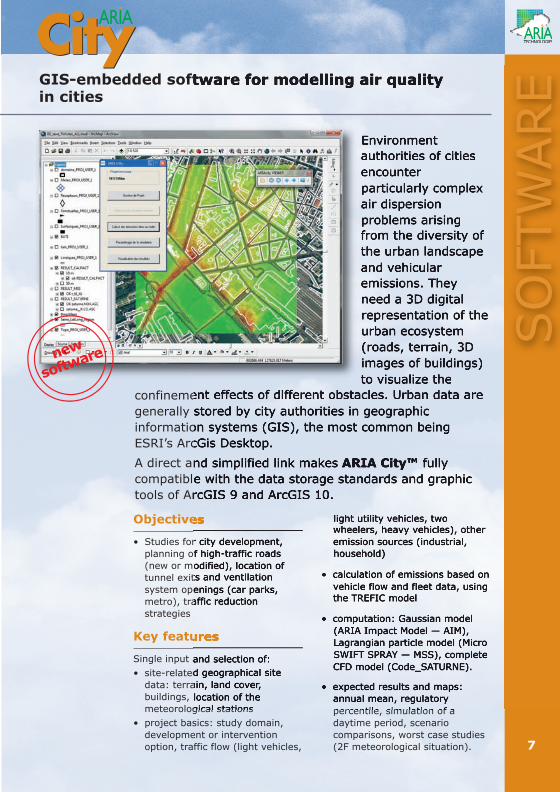
CityCityGIS-embedded software for modelling air quality in cities
Environmentauthorities of citiesencounterparticularly complexair dispersionproblems arisingfrom the diversity ofthe urban landscapeand vehicularemissions. Theyneed a 3D digitalrepresentation of theurban ecosystem(roads, terrain, 3Dimages of buildings)to visualize the
confinement effects of different obstacles. Urban data aregenerally stored by city authorities in geographicinformation systems (GIS), the most common beingESRI’s ArcGis Desktop.
A direct and simplified link makes ARIA City™ fullycompatible with the data storage standards and graphictools of ArcGIS 9 and ArcGIS 10.
Objectives
• Studies for city development,planning of high-traffic roads(new or modified), location oftunnel exits and ventilationsystem openings (car parks,metro), traffic reductionstrategies
Key features
Single input and selection of:• site-related geographical site
data: terrain, land cover,buildings, location of themeteorological stations
• project basics: study domain,development or interventionoption, traffic flow (light vehicles,
light utility vehicles, twowheelers, heavy vehicles), otheremission sources (industrial,household)
• calculation of emissions based onvehicle flow and fleet data, usingthe TREFIC model
• computation: Gaussian model(ARIA Impact Model — AIM),Lagrangian particle model (MicroSWIFT SPRAY — MSS), completeCFD model (Code_SATURNE).
• expected results and maps:annual mean, regulatorypercentile, simulation of adaytime period, scenariocomparisons, worst case studies(2F meteorological situation).
new
software
7
SO
FTW
ARE
CatalogueLogiciels2013GBV3:Mise en page 1 13/11/12 10:41 Page7

8
ARIA Risk™ is a 3Dsoftware for assessing risksarising from the dispersionof toxic industrial gases(storage accident, pipefailure, fire). It can beincorporated in an alertsystem, outputs maps ofinstantaneous or integratedconcentration anddeposition and enables thedetermination of safetylimits, zones of thresholdexposure and IDLH.
ARIA Risk™ is built withmodules using 3Dcalculation of meteorologyand dispersion (puff orparticle model) and takesinto account arbitrarilycomplex topography, theeffect of buildings on theflow, and very low winds.
3D software for assessing dispersion of accidental releases
Selectedreferences:
APSYS; AXE; CAEPE;CEA–DAM; CNES;DGA–CEB; EOG;GSN; INERIS; KNMI(The Netherlands);Météo-France; MGPI;Thales; Total;Tunisian chemicalgroup
SO
FTW
ARE
RiskRisk
Objectives
• Evaluate source term (accident)
• Locate risk zones based on 3Dfields (terrain, meteorologicalstations).
Key features
• Use of real-time meteorologicaldata for multiple sources
• Modules with relatively shortcalculation time depending on theproblem
• Simple, academic, or verycomplex meteorological situations
considered, depending on themodules used
• Accounts for calm winds
• Accounts for wind shear effects
• Accounts for terrain and surfaceroughness
• Accounts for obstacles (based onthe model used)
• Considers variable emissions
• 4D calculation with a 4D grid andtime scale
• Multi species emissions
• Leakage model
• Calculation of depositions.
CatalogueLogiciels2013GBV3:Mise en page 1 13/11/12 10:41 Page8

9
Optionsandvariants
• ARIA Risk
CBRN™ forchemical,biological,radiological,and nuclearaccidents or threats.
• Rescube3D,
a productoffered jointlyby Leosphereand ARIATechnologiesfor real-timemonitoring ofdispersion ofhazardousplumes
Input data
Spatial scale: Domains ranging from 500 m x 500 mto 50 km x 50 km, with a representation of the terrainMeteorological data: Meteorological data at one orseveral sites, from a specific height or wind profiles(measurement towers)Emission data:
• Description of emission species and theirthermodynamic characteristics (product database)
• Creation and use of complete scenarios of flow ratesat a vessel leak (ATRCOD)
• Rapidly changing point emissions of hazardousproducts.
Modelling
Meteorological model: SWIFT meteorologicalassimilation model accounts in detail for topography(terrain, surface roughness)Dispersion model: TRAMES Lagrangian puff modelthat considers dense gases or SPRAY Lagrangianparticle model.
SO
FTW
ARE
CatalogueLogiciels2013GBV3:Mise en page 1 13/11/12 10:41 Page9

10
SO
FTW
ARE Software for calculating air flow and dispersion
at micro scale
LocalLocal
Key features
• Complete CFD applied toatmospheric physics (tested,validated, conforming to QualityAssurance norms). It isparticularly suitable forprocessing small-scaleatmospheric releases; it also hasseveral types of turbulenceclosures.
• Several pre and post processors• Cartesian or terrain-following
coordinates on structured orunstructured grids
• Stationary and transientcalculations at small scale (froma few metres to a fewkilometres) that integrate terrainand buildings on the site
• Microphysical parametrization ofwater based on the Kesslerscheme (condensation, re-evaporation, autoconversion,collection)
• Designed for a wide range ofstudies such as an analysis of theimpact on air quality of newstructures or new urban projects(e.g., ring roads, stadiums,streets), studies for the defencesector (missile launches,delimitation of protected areas),indoor air studies (ventilation inbuildings).
ARIA Local™ is designed to model airpollution problems down to a very smallscale in urban and industrial environments(continuous or accidental releases);it accounts in detail for obstacles (buildings,slopes). ARIA Local™ can also be used formicro-meteorological applications such as
wind power plants,construction works orindoor air qualityassessments.
Selectedreferences
Airparif; Areva; SGN Areva; CEACadarache; CEREA(ENPC); City of Paris;CNES CSG; CNRS(AeronomyLaboratory, Jussieu);DGA–CEB; EcoleCentrale de Lyon(Fluid MechanicsLaboratory), ENEA(Italy); GDF;GIVAUDAN(Switzerland); IRSN(Fontenay); Italeco(Italy); JANUS; LMD; QueenslandUniversity ofTechnology–ILAQH(Australia); RATP;SAIC; SGN(COGEMA); Total
Objectives
• Flow mode precisely for differentapplications such as the study ofwind effects on structures,micrositing for evaluating windpower potential (outdoor),profiling of airflows in closedspaces (indoor)
• Simulate most physicalatmospheric phenomena thatoccur at the local scale, takinginto account, for example, theatmospheric boundary layer,specific turbulence model, watermicrophysics
• Calculate the dispersion of heavyor light gas pollutants fordifferent types of sources(instantaneous or continuous;point, area, or volume) ofdifferent origins (vehicular traffic,industrial, accident).
CatalogueLogiciels2013GBV3:Mise en page 1 13/11/12 10:41 Page10

11
ARIA Wind™ is atool for planningwind farms based onan evaluation of theavailable energyresource. It is usedfor assessing windpotential, optimizingthe wind farmdesign, and
determining the variability of energy generation. ARIAWind™, which is linked to meteorological forecasts in realtime, provides reliable estimates of turbine output.
ARIA Wind™ is a 3D model that reconstitutes wind fieldsaccording to the situation at the wind farm; it cansimultaneously integrate different types of meteorologicaldata and account for complex terrain.
Software for calculating and optimising wind potential
Selected references
ADEME; DesarollosEolicos (Spain); EDF;IMGW; JANUS;University of Moncton(Canada)
SO
FTW
ARE
Objectives
• Regional scale: Map wind potential and specifythe best sites for wind energyproduction
• Local scale: Determine the optimumconfiguration of the turbinesand their location. Accurately calculate the outputper turbine (kWh/year).
Key features
• Accurate 3D wind fields overcomplex terrain.
• Arbitrary number and type ofinput meteorological data(several surface stations or none,wind profiles…).
• Reliable results (severalvalidations)
• Linked to ARIA Local™ formicrositing applications.
Input data
Spatial scale:
• Wind turbine scale: < 1 km (ARIA Local™) • Wind farm scale: 10 km x 10 km • Regional scale: 100 km x 100 kmMeteorological data: All data measured at ground orelevated level, output of large-scale models (ECMWF,ARPEGE, NMC)Site data: Digital terrain model, land cover, obstacles.
WindWindCatalogueLogiciels2013GBV3:Mise en page 1 13/11/12 10:42 Page11

12
ARIA View™ is anoperational system for airquality management.It provides users with acomplete and precisepicture of the impact ofindustrial activity on airquality around the site,which they can monitorcontinuously. ARIA View™can generate the reportsrequired by the authoritiesand present an accurateimage of industrial activity to stakeholders(civil society and localcommittees). It is the besttool for a responsiblecorporate citizen.
ARIA View™ tracksconventional pollutants(SO2, NOx, PM, CO2,dioxin) as well as odours,Legionella, hot air plumes.
Air quality surveillance system for industrial sites
Selected references
Bonduelle; CNIM;EGZIA; ISDN(Villeneuve Loubet);OMIFCO; RECYDEM;Rompetrol; SITADectra; SITAEnvironnement;Taizhou – EPA;Thieverval Grignon;Veolia Propreté
ViewView
Key features
• Automatic: functionsautonomously
• Continuous operation in realtime: speedy calculations,typically 30 minutes of real timecan be simulated in less than5 minutes
• Flexible and powerful: MicroSWIFT SPRAY (MSS), the internalcalculation engine of the system,is a 3D Lagrangian model thataccounts for obstacles.
• Multi-function: automaticmonitoring, simulation of pastevents, forecasting, consolidation(average concentration,deposition, or centiles over aperiod)
• Reliable: designed to function24 x 7, remote maintenanceand telephone assistance
• Connected: real-timevisualization of the plume, imageexport for reports or internet,export of virtual sensor data,automatic generation of easilyconfigurable environmentreports.
SYS
TEM
SCatalogueLogiciels2013GBV3:Mise en page 1 13/11/12 10:42 Page12
13
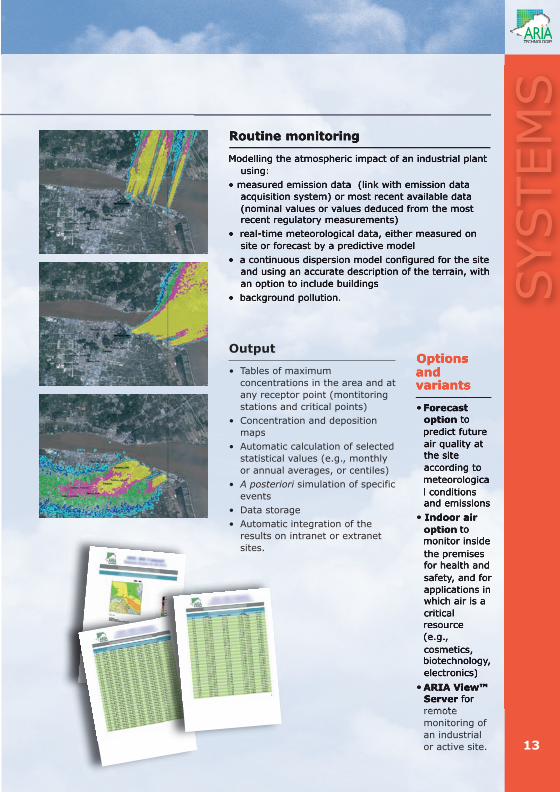
Routine monitoring
Modelling the atmospheric impact of an industrial plantusing:
• measured emission data (link with emission dataacquisition system) or most recent available data(nominal values or values deduced from the mostrecent regulatory measurements)
• real-time meteorological data, either measured onsite or forecast by a predictive model
• a continuous dispersion model configured for the siteand using an accurate description of the terrain, withan option to include buildings
• background pollution.
Optionsandvariants
• Forecast
option topredict futureair quality atthe siteaccording tometeorological conditionsand emissions
• Indoor air
option tomonitor insidethe premisesfor health andsafety, and forapplications inwhich air is acriticalresource(e.g.,cosmetics,biotechnology,electronics)
• ARIA View™
Server forremotemonitoring ofan industrialor active site.
SYS
TEM
S
Output
• Tables of maximumconcentrations in the area and atany receptor point (montitoringstations and critical points)
• Concentration and depositionmaps
• Automatic calculation of selectedstatistical values (e.g., monthlyor annual averages, or centiles)
• A posteriori simulation of specificevents
• Data storage• Automatic integration of the
results on intranet or extranetsites.
CatalogueLogiciels2013GBV3:Mise en page 1 13/11/12 10:42 Page13
14
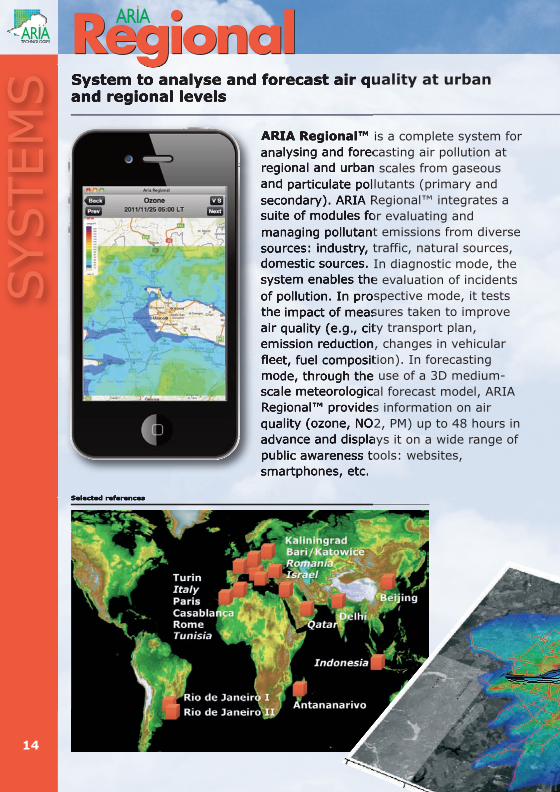
ARIA Regional™ is a complete system foranalysing and forecasting air pollution atregional and urban scales from gaseousand particulate pollutants (primary andsecondary). ARIA Regional™ integrates asuite of modules for evaluating andmanaging pollutant emissions from diversesources: industry, traffic, natural sources,domestic sources. In diagnostic mode, thesystem enables the evaluation of incidentsof pollution. In prospective mode, it teststhe impact of measures taken to improveair quality (e.g., city transport plan,emission reduction, changes in vehicularfleet, fuel composition). In forecastingmode, through the use of a 3D medium-scale meteorological forecast model, ARIARegional™ provides information on airquality (ozone, NO2, PM) up to 48 hours inadvance and displays it on a wide range ofpublic awareness tools: websites,smartphones, etc.
System to analyse and forecast air quality at urbanand regional levels
RegionalRegional
Selected references
SYS
TEM
SCatalogueLogiciels2013GBV3:Mise en page 1 13/11/12 10:42 Page14
15
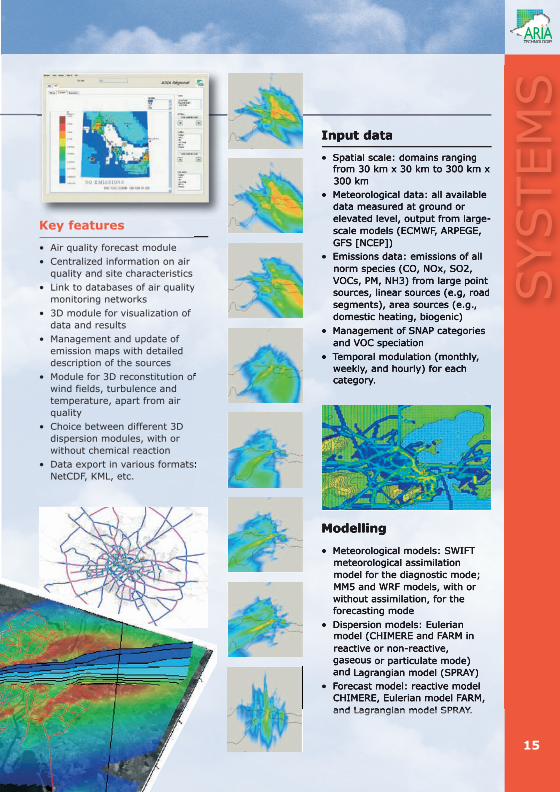
Key features
• Air quality forecast module• Centralized information on air
quality and site characteristics• Link to databases of air quality
monitoring networks • 3D module for visualization of
data and results • Management and update of
emission maps with detaileddescription of the sources
• Module for 3D reconstitution ofwind fields, turbulence andtemperature, apart from airquality
• Choice between different 3Ddispersion modules, with orwithout chemical reaction
• Data export in various formats:NetCDF, KML, etc.
Input data
• Spatial scale: domains rangingfrom 30 km x 30 km to 300 km x300 km
• Meteorological data: all availabledata measured at ground orelevated level, output from large-scale models (ECMWF, ARPEGE,GFS [NCEP])
• Emissions data: emissions of allnorm species (CO, NOx, SO2,VOCs, PM, NH3) from large pointsources, linear sources (e.g, roadsegments), area sources (e.g.,domestic heating, biogenic)
• Management of SNAP categoriesand VOC speciation
• Temporal modulation (monthly,weekly, and hourly) for eachcategory.
Modelling
• Meteorological models: SWIFTmeteorological assimilationmodel for the diagnostic mode;MM5 and WRF models, with orwithout assimilation, for theforecasting mode
• Dispersion models: Eulerianmodel (CHIMERE and FARM inreactive or non-reactive,gaseous or particulate mode)and Lagrangian model (SPRAY)
• Forecast model: reactive modelCHIMERE, Eulerian model FARM,and Lagrangian model SPRAY.
SYS
TEM
S
CatalogueLogiciels2013GBV3:Mise en page 1 13/11/12 10:42 Page15

A single concern, the atmospheric environment
8/10, rue de la Ferme92100 Boulogne-Billancourt
FrancePhone: +33 (0)1 46 08 68 60Fax: +33 (0)1 41 41 93 17
Email: [email protected]
CatalogueLogiciels2013GBV3:Mise en page 1 13/11/12 10:42 Page16