software engineering recitation 3 suhit gupta. review cvs problems xml problems –...
Post on 19-Dec-2015
223 views
TRANSCRIPT

Software Engineering
Recitation 3
Suhit Gupta

Review
CVS problems XML problems –
XML/XSD/DTD/SCHEMAS

Today we will be covering…
UML, UML and more UML… Some Visio and some Rose.

Agenda
Benefits of Visual Modeling History of the UML Visual Modeling with UML The Rational Iterative Development
Process

What is Visual Modeling?
Business Process
Order
Item
Ship via
Visual Modeling is modelingusing standard graphical notations
Computer System
“Modeling captures essential parts of the system.”
Dr. James Rumbaugh

Visual Modeling Captures Business Process
Use Case Analysis is a technique to capture business process from user’s perspective

Visual Modeling - Communication Tool
Use visual modeling to capture business objects and logic
Use visual modeling to analyze and design your application

Visual Modeling Manages Complexity

Database Server(C++ & SQL)
Model your systemindependent of
implementation language
Visual Modeling Defines Software Architecture
User Interface(Visual Basic,
Java)Business Logic
(C++, Java)

Multiple Systems
Visual Modeling Promotes Reuse
ReusableComponents

What is the UML?
UML stands for Unified Modeling Language The UML combines the best of the best from
– Data Modeling concepts (Entity Relationship Diagrams)– Business Modeling (work flow)– Object Modeling – Component Modeling
The UML is the standard language for visualizing, specifying, constructing, and documenting the artifacts of a software-intensive system
It can be used with all processes, throughout the development life cycle, and across different implementation technologies

History of the UMLNov ‘97 UML approved by the OMG

Class Diagrams
A class diagram shows the existence of classes and their relationships in the logical view of a system
UML modeling elements in class diagrams– Classes and their structure and behavior– Association, aggregation, dependency, and
inheritance relationships– Multiplicity and navigation indicators– Role names

UML Supports Application Development
Classesapplication partitioning
Business ObjectsRelationships
Business Process
Objects
Use Cases
large scale system
ScenariosComponentsMicrosoft
ActiveX/COMMicrosoft
ORDBMSOracle
CORBAOMG

UML Concepts The UML may be used to:
– Display the boundary of a system & its major functions using use cases and actors
– Illustrate use case realizations with interaction diagrams
– Represent a static structure of a system using class diagrams
– Model the behavior of objects with state transition diagrams
– Reveal the physical implementation architecture with component & deployment diagrams
– Extend your functionality with stereotypes

Copyright © 1997 by Rational Software Corporation
Actors
An actor is someone or some thing that must interact with the system under development
Student
Registrar
Professor
Billing System

Use Cases A use case is a pattern of behavior the system
exhibits– Each use case is a sequence of related transactions
performed by an actor and the system in a dialogue
Actors are examined to determine their needs– Registrar -- maintain the curriculum– Professor -- request roster– Student -- maintain schedule– Billing System -- receive billing information from
registration
Maintain ScheduleMaintain Curriculum Request Course Roster

Documenting Use Cases
A flow of events document is created for each use cases
– Written from an actor point of view
Details what the system must provide to the actor when the use cases is executed
Typical contents– How the use case starts and ends– Normal flow of events– Alternate flow of events– Exceptional flow of events

Maintain Curriculum Flow of Events
This use case begins when the Registrar logs onto the Registration System and enters his/her password. The system verifies that the password is valid (E-1) and prompts the Registrar to select the current semester or a future semester (E-2). The Registrar enters the desired semester. The system prompts the professor to select the desired activity: ADD, DELETE, REVIEW, or QUIT.
If the activity selected is ADD, the S-1: Add a Course subflow is performed.
If the activity selected is DELETE, the S-2: Delete a Course subflow is performed.
If the activity selected is REVIEW, the S-3: Review Curriculum subflow is performed.
If the activity selected is QUIT, the use case ends. ...

Copyright © 1997 by Rational Software Corporation
Use Case Diagram
Use case diagrams are created to visualize the relationships between actors and use cases
Student
Registrar
Professor
Maintain Schedule
Maintain Curriculum
Request Course Roster
Billing System

Uses and Extends Use Case Relationships
As the use cases are documented, other use case relationships may be discovered
– A uses relationship shows behavior that is common to one or more use cases
– An extends relationship shows optional behavior
Register for courses
<<uses>>
Logon validation<<uses>>
Maintain curriculum

Copyright © 1997 by Rational Software Corporation
Use Case Realizations
The use case diagram presents an outside view of the system
Interaction diagrams describe how use cases are realized as interactions among societies of objects
Two types of interaction diagrams– Sequence diagrams– Collaboration diagrams

Sequence Diagram A sequence diagram displays object interactions
arranged in a time sequence
: Student registration form
registration manager
math 101
1: fill in info
2: submit
3: add course(joe, math 01)
4: are you open?5: are you open?
6: add (joe)7: add (joe)
math 101 section 1
Copyright © 1997 by Rational Software Corporation
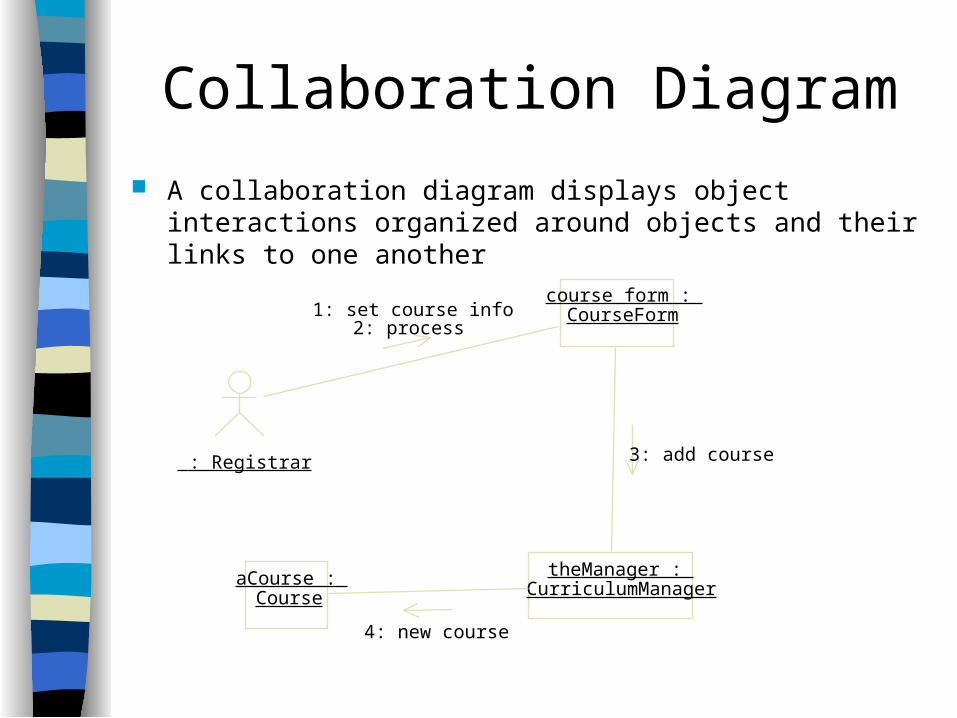
: Registrar
course form : CourseForm
theManager : CurriculumManager
aCourse : Course
1: set course info2: process
3: add course
4: new course
Collaboration Diagram
A collaboration diagram displays object interactions organized around objects and their links to one another

Copyright © 1997 by Rational Software Corporation
Class Diagrams
A class diagram shows the existence of classes and their relationships in the logical view of a system
UML modeling elements in class diagrams– Classes and their structure and behavior– Association, aggregation, dependency, and
inheritance relationships– Multiplicity and navigation indicators– Role names

Copyright © 1997 by Rational Software Corporation
Classes
A class is a collection of objects with common structure, common behavior, common relationships and common semantics
Classes are found by examining the objects in sequence and collaboration diagram
A class is drawn as a rectangle with three compartments
Classes should be named using the vocabulary of the domain
– Naming standards should be created– e.g., all classes are singular nouns starting with a capital
letter

Classes
RegistrationForm
RegistrationManager
Course
Student
CourseOfferingProfessor
ScheduleAlgorithm

Operations
The behavior of a class is represented by its operations
Operations may be found by examining interaction diagrams
registration form
registration manager
3: add course(joe, math 01)
RegistrationManager
addCourse(Student,Course)

Attributes The structure of a class is represented by its
attributes Attributes may be found by examining class
definitions, the problem requirements, and by applying domain knowledge
Each course offeringhas a number, location and time
CourseOffering
numberlocationtime

Relationships
Relationships provide a pathway for communication between objects
Sequence and/or collaboration diagrams are examined to determine what links between objects need to exist to accomplish the behavior -- if two objects need to “talk” there must be a link between them
Three types of relationships are:– Association– Aggregation– Dependency

Relationships An association is a bi-directional connection between classes
– An association is shown as a line connecting the related classes
An aggregation is a stronger form of relationship where the relationship is between a whole and its parts
– An aggregation is shown as a line connecting the related classes with a diamond next to the class representing the whole
A dependency relationship is a weaker form of relationship showing a relationship between a client and a supplier where the client does not have semantic knowledge of the supplier
A dependency is shown as a dashed line pointing from the client to the supplier

Relationships
RegistrationForm
RegistrationManager
Course
Student
CourseOfferingProfessor
addStudent(Course, StudentInfo)
namenumberCredits
open()addStudent(StudentInfo)name
major
location
open()addStudent(StudentInfo)
nametenureStatus
ScheduleAlgorithm

Inheritance
Inheritance is a relationships between a superclass and its subclasses
There are two ways to find inheritance:– Generalization– Specialization
Common attributes, operations, and/or relationships are shown at the highest applicable level in the hierarchy

Inheritance
RegistrationForm
RegistrationManager
Course
Student
CourseOfferingProfessor
addStudent(Course, StudentInfo)
namenumberCredits
open()addStudent(StudentInfo)
major
location
open()addStudent(StudentInfo)
tenureStatus
ScheduleAlgorithm
name
RegistrationUser

Copyright © 1997 by Rational Software Corporation
The State of an Object
A state transition diagram shows – The life history of a given class– The events that cause a transition from
one state to another– The actions that result from a state
change State transition diagrams are created
for objects with significant dynamic behavior

Copyright © 1997 by Rational Software Corporation
State Transition Diagram
InitializationOpen
entry: Register studentexit: Increment count
Closed
Canceled
do: Initialize course
do: Finalize course
do: Notify registered students
Add Student / Set count = 0
Add student[ count < 10 ]
[ count = 10 ]
Cancel
Cancel
Cancel

Course CourseOffering
Student Professor
Component Diagram
Course.dll
People.dll
Course
User
Register.exeBilling.exe
BillingSystem

Deploying the System
The deployment diagram shows the configuration of run-time processing elements and the software processes living on them
The deployment diagram visualizes the distribution of components across the enterprise.

Copyright © 1997 by Rational Software Corporation
Risk Management Phase-by-Phase Inception
– Bracket the project’s risks by building a proof of concept
Elaboration
– Develop a common understanding of the system’s scope and desired behavior by exploring scenarios with end users and domain experts
– Establish the system’s architecture
– Design common mechanisms to address system-wide issues

Risk Management Phase-by-Phase (cont.)
Construction
– Refine the architecture
– Risk-driven iterations
– Continuous integration Transition
– Facilitate user acceptance
– Measure user satisfaction Post-deployment cycles
– Continue evolutionary approach
– Preserve architectural integrity

Copyright © 1997 by Rational Software Corporation
Iteration Assessment Assess iteration results relative to the evaluation
criteria established during iteration planning:– Functionality– Performance– Capacity– Quality measures
Consider external changes that have occurred during this iteration
– For example, changes to requirements, user needs, competitor’s plans
Determine what rework, if any, is required and assign it to the remaining iterations