software development productivity of european …
TRANSCRIPT

SOFTWARE DEVELOPMENT PRODUCTIVITYOF EUROPEAN SPACE, MILITARY AND
INDUSTRIAL APPLICATIONS
by
K. MAXWELL*L. N. VAN WASSENHOVE**
andS. DUTTAt
96/47/TM(Revised version of 94/74/TM)
* Research fellow at INSEAD, Boulevard de Constance, 77305 Fontainebleau Cedex, France.
** Professor of Operations Management and Operations Research at INSEAD, Boulevard de Constance,77305 Fontainebleau Cedex, France.
t Associate Professor of Information Systems at INSEAD, Boulevard de Constance, 77305 FontainebleauCedex, France.
A working paper in the INSEAD Working Paper Series is intended as a means whereby a faculty researcher'sthoughts and findings may be communicated to interested readers. The paper should be consideredpreliminary in nature and may require revision.
Printed at INSEAD, Fontainebleau, France.

Software Development Productivity
of
European Space, Military and Industrial Applications
Katrina Maxwell, *Luk Van Wassenhove ** and Soumitra Dutta***
Research Initiative in Software Excellence (RISE)INSEAD
Boulevard de Constance77305 Fontainebleau Cedex, France
tel: (33-1) 6072-4266fax: (33-1) 6072-4242
29 July 1996
* Research Fellow, INSEAD; e-mail: [email protected]** Professor of Operations Management and Operations Research, INSEAD; e-mail:[email protected]*** Associate Professor of Information Systems, INSEAD; e-mail: [email protected]

Abstract
The identification, combination and interaction of the many factors which influence software
development productivity makes the measurement, estimation, comparison and tracking of
productivity rates very difficult. Through the analysis of a European Space Agency database
consisting of 99 software development projects from 37 companies in 8 European countries,
this paper seeks to provide significant and useful information about the major factors which
influence the productivity of European space, military and industrial applications, as well as
to determine the best metric for measuring the productivity of these projects. Several key
findings emerge from the study. The results indicate that some organizations are obtaining
significantly higher productivity than others. Some of this variation is due to the differences
in the application category and programming language of projects in each company; however,
some differences must also be due to the ways in which these companies manage their
software development projects. The use of tools and modern programming practices were
found to be major controllable factors in productivity improvement. Finally, the lines-of-code
productivity metric is shown to be superior to the process productivity metric for projects in
our database.
1

Introduction
Over the last 25 years, the growing cost of software development has increasingly focused the
attention of industry, commerce and government on the software development process. In an
attempt to control this process, engineering techniques which use metrics, measurements and
models to make quantitative assessments of the cost, productivity and quality of software
development were first introduced in the late sixties. Although initially, the development of
software was perceived to be more of an art and thus outside of these engineering approaches,
in the last decade there has been a growing realization among researchers and managers of the
need for a disciplined approach to software development and a better quantification of
software attributes. Many books have been published in recent years on the need for metrics
in software development (Conte et al. 1986, Grady and Caswell 1987, Jones 1991, Fenton
1991, Putnam and Myers 1992, Grady 1992, Willer and Paulish 1993, Shepperd and Ince
1993). Consequently, the development and use of metrics which describe both the software
itself and the software development process have become more and more widespread.
Productivity rates are highly variable across the software development industry
(Arthur 1985). Some of the many factors that appear to influence software development
productivity are: people factors, such as experience and team size; process factors, such as
programming language and tools; product factors, such as complexity and software type; and
computer factors, such as storage and timing constraints (Conte et al. 1986). The combination
and interaction of all of these factors makes the measurement, estimation, comparison and
tracking of productivity rates very difficult.
Past software development productivity research has taken two main directions: in the
first, research has concentrated on determining the factors which have a significant effect on
productivity; and in the second, the emphasis has been on determining the best way to
measure productivity. As the results of previous research differ and are limited to
programming environments which are similar to those studied, it is important to examine
additional databases to improve our understanding
In this paper we present the results of our analysis of the European Space Agency
software development database which, at the time of the analysis, consisted of 99 projects
2

from 37 companies in 8 European countries. This database is unique in that we have found no
other published research which analyses the factors which have a significant effect on
software development productivity of European non-MIS applications. Our research also
adds to overall management of software development knowledge in that we have been able to
look in detail at the reasons for differences in productivity at the company level.
The objectives of this paper are twofold: firstly, to provide significant and useful
information about the major factors which influence the productivity of European space,
military and industrial applications ; and secondly, to compare the results of using different
productivity metrics in order to determine which metric is better for measuring the
productivity of projects similar to those in our dataset. In our analysis, we employ
parsimonious models to examine the impact of differences in company, country, category,
language, environment, team size, project duration and system size, as well as the following
seven COCOMO factors (Boehm 1981): required software reliability, execution time
constraint, main storage constraint, virtual machine volatility, programming language
experience, use of modem programming practices and use of software tools, on lines-of-code
productivity and process productivity (Putnam and Myers 1992).
The remainder of this paper is organized as follows. An overview of prior
productivity research is presented, followed by a description of the database and our
productivity analysis. The results of the productivity analysis are then presented and
compared with the findings of other researchers. A summary of the results can be found in
the concluding section.
Prior Research
Productivity rates are highly variable across the software development industry
(Arthur 1985). Consequently, early research in cost estimation concentrated on determining
causes for the wide variation of project productivity. An overview of some of the productivity
factors considered by past researchers can be found in Table 1. In an IBM study by Walston
and Felix (1977), 29 factors that were significantly correlated with productivity were found.
In an analysis of data from the NASA/Goddard Space Flight Center, Bailey and Basili (1981)
3

identified 21 productivity parameters . At ITT, Vosburgh et al. (1984) found 14 significant
productivity factors, with modem programming practice usage and development computer
size explaining 24% of the variation in productivity. In Boehm's COCOMO model (1981), 15
software factors which had a significant impact on productivity were identified. However,
such major factors as application type and programming language were omitted in these
models.
[Table 1 here]
Several studies attempt to determine nominal productivity rates depending on the type
of software (Lawrence 1981, Cusumano and Kemerer 1990, Putnam and Myers 1992). The
productivity of sub-systems that were part of a ballistic missile defense system were found to
be a function of software type, with real-time software having the lowest productivity
(Stephenson 1976). Vosburgh et al. (1984) identified 3 different programming environments
with business applications having the highest average productivity followed by normal-time
and real-time applications. These environments were characterised by the hardware used,
resource constraints, application complexity and programming language. However, the
difference in programming environment was not identified as one of their 14 significant
productivity factors and it is not clear how much variation in productivity was accounted for
by this segmentation.
Aron (1976) found that the variation of productivity for a group of IBM projects
involving systems programs and business applications was due to differences in system
difficulty, characterized by the number of interactions with other system elements, and project
duration. He also adjusted his cost estimate for the use of higher-level languages.
Kitchenham (1992) found that productivity varied with programming language level and
working environment. Productivity has also been found to vary with hardware constraints
(Boehm 1981, Vosburgh et al. 1984), programmer experience (Walston and Felix 1977,
Boehm 1981, Lawrence 1981, Thadhani 1984, Vosburgh et al. 1984, Jones 1991), team size
(Brooks 1975, Conte et al. 1986, Jeffrey 1987), duration (Aron 1976, Belady and Lehman
1979), project size (Albrecht 1979, Jones 1979, Behrens 1983, Vosburgh et al. 1984, Conte et
al. 1986, Jeffrey 1987, Putnam and Myers 1992) and modem programming practices (Boehm
4

1981, Brooks 1981, Vosburgh et al. 1984, Banker et al. 1991, Jones 1991), among other
factors. As many of these findings differ and are limited to programming environments
which are similar to those studied, there is a need for additional research on other databases to
determine the applicability of past results to similar projects. An overview of the major
databases which include productivity factors can be found in Table 2.
[Table 2 here]
A second area of productivity research has concentrated on determining the best way
to measure productivity. In software development terms, productivity is conventionally
defined as source lines of code (SLOC) per manmonth. It is a measure of the amount of
product produced per unit of human effort. We will refer to this measure as lines-of-code
productivity.
Lines-of-code Productivity – SLOC Manmonths of Effort (1)
This relationship has been the basis for many software estimation methods. A new measure
of productivity using lines-of-code has recently been developed by Putnam and Myers (1992).
Process Productivity – SLOC
where SLOC is developed, delivered lines of source code, Effort is the manpower applied to
the work measured in manmonths or manyears, B is a skills factor which is a function of
system size, and Time represents the duration of the work measured in months or years.
Putnam and Myers maintain that process productivity is superior to simple lines-of-code
productivity because it covers a complex set of factors affecting the entire software
development organisation throughout the development process. Their process productivity
parameter is based on the analysis of a 750-system database which included projects primarily
from the United States, but also from England, Australia and Japan.
Much discussion concerns the validity of using lines-of-code in the measurement of
productivity. According to Jones (1991) there are three serious deficiencies associated with
r Effort YB 3 (Time Yr'
(2)
5
lines-of-code: 1) The lack of an international standard for a line of code that encompasses all
procedural languages. 2) Software can be produced by program generators, spreadsheets,
graphic icons, etc. all of which make the effort of producing lines-of-code irrelevant. 3)
Lines-of-code metrics paradoxically decrease as the level of the language gets higher, making
the most powerful and advanced languages, such as Ada and C, appear less productive than
primitive low-level languages, such as Assembler.
In order to avoid the lines-of-code problem, Halstead (1977) defined the size of a
program by decomposing lines-of-code into a collection of tokens that were classified either
as operators, which are separate data portions, or operands, which are separate functional
portions. Productivity was then measured as the number of tokens produced per manmonth.
However, the Halstead metrics are now known to be based on questionable assumptions and
to contain many sources of error. (Coulter 1983).
In the late 70's, Albrecht (1979) developed a new measure of productivity by replacing
the lines-of-code measurement with function points. Function points are based on the
functionality of the software as seen by the user. He calculated the total number of function
points by weighting the sums of five different factors: inputs, outputs, logical files, inquiries
and interfaces. Since Albrecht's initial work, many other methods of measuring functionality
have been developed (DeMarco 1982, Symons 1988, Dreger 1989, IFPUG 1994) to name but
a few.
The main disadvantage of function point methods is that they have been created and
used primarily in business systems environments. The function point method gives
misleading counts for software which has a high algorithmic complexity but low numbers of
inputs and outputs (Jones 1991). This means that function points are not necessarily an
accurate measure of functionality for real-time software, defense systems, systems software,
embedded software, communications software and process control software.
Another method, feature points, was developed by Software Productivity Research in
1986 (Jones 1991). This method applies an expanded function point logic to system software
by including the number of algorithms in the application (Jones 1993). It has been applied
6
experimentally to embedded software, real-time software, CAD, AI and MIS software.
However, the use of the feature point method is not yet widespread.
Although the lines-of-code metric is the subject of much debate, the fact remains that
it is considered by many organizations as a more practical productivity metric than the
currently available alternatives (Boehm 1987). In a recent study by Cusumano and Kemerer
(1990), the lines-of-code metric was chosen to compare productivity across a number of
organizations in the US and Japan. Previous research has also shown that function points and
lines-of-code tend to be highly correlated in the case of new software development (Banker et
al. 1991).
Until the use of function and feature point methods become common for non-MIS
applications, and particularly in the domain of space, military and industrial applications,
statistical analysis undertaken of large heterogeneous databases will have to rely upon
measuring and analyzing the productivity of these types of projects using lines-of-code
metrics.
The ESA Database
In 1988, the European Space Agency (ESA), faced with the evaluation of proposals for large
space programs and their huge needs for software development, began compiling a software
metrics database focusing on cost estimation and productivity measures. Subsequently, the
database was expanded to include military and industrial applications. This activity is
ongoing, and at the time of this analysis contained a selection of 99 completed projects from
37 companies in 8 European countries. The variables contained in the database are described
in more detail in Figures 1 a, lb and Table 3. The projects represent 5.14 million lines of
source code (range: 2000 - 413000, average: 51910, median: 22000), 18 development
languages or combinations of languages, and 28328 manmonths of effort (range: 7.8 - 4361,
average: 292, median: 93). The breakdown of projects by application environment was:
military 39%, space 28%, industrial 24% and other 9%.
7

Figure la. Main Countries Represented
Figure lb. Main Languages Represented
Table 3. Variables in ESA datasetLANG (18) 1 Application Programming Language8 main languages ADA Ada
PAS PascalFOR FortranLTR LTRC CTAL TALCOR CoralAS Assembler
ENV (3) Environment (Space, Military, Industry)CATEGORY (8) ESA Classification
OB : On BoardMSG : Message SwitchingRT : Real TimeGSE : Ground Support EquipmentSIM : SimulatorsGRD : Ground ControlTL: ToolOTH : Other
COUNTRY (8) Country where project was developedCOMPANY (37) Company where project was developedTEAM Maximum size of implementation teamDUR Duration of project in monthsKLOC Kilo Lines of CodeCocomo factors rangeRELY 1-6 Required Software ReliabilityTIME 1-6 Execution Time ConstraintSTOR 1-6 Main Storage ConstraintVIRT 1-6 Virtual Machine VolatilityLEXP 1-6 Programming Language ExperienceMODP 1-6 Use of Modern Programming PracticesTOOL 1-6 Use of Software Tools
1 The number of categories is in parentheses.
8

The database collection effort consists of contacting each supplier of data on a regular basis to
determine if suitable projects are nearing completion. When a completed questionnaire is
received, each supplier of data is telephoned to ensure the validity and comparability of his
responses. For example, we verify that the project has actually been completed and that the
numbers provided are actuals and not estimates. We also verify that the definitions of SLOC,
Effort and COCOMO factors have been understood, that the project is put into the correct
category and each company's definition of a manmonth. Other discrepancies, such as the
total duration not equaling the duration in calendar months, are also checked. In the ESA
database, SLOC and Effort are defined as follows:
SLOC: the amount of non-blank, non-commented delivered lines of code. As the
software developed in some projects consists of reused code, adaption adjustment factors
(Boehm 81) were used to correct the size of the software. When no adaption adjustment
factor was available, the new code size was used as a measure for the size.
Effort: The total effort was measured in manmonths and was defined as beginning at
specifications delivery and ending at customer acceptance. The effort value covers all directly
charged labor on the project for activities during this period. All effort data has been
converted to manmonths of 144 manhours per manmonth.
In return, each data supplier receives periodic data analysis reports and diskettes of the
sanitized dataset
Design of Analysis
Two productivity metrics were used in the analysis of our dataset: lines-of-code productivity
and process productivity as defined previously in equations (1) and (2). Parsimonious models
were employed to examine the impact of differences in company, country, category, language,
environment, team size, project duration and system size, as well as the following seven
COCOMO factors (Boehm 1981): required software reliability, execution time constraint,
main storage constraint, virtual machine volatility, programming language experience, use of
modem programming practices and use of software tools, on lines-of-code productivity and
process productivity. As the data was not normally distributed, the measure of correlation
used was Spearman's rank correlation coefficient (Fenton 1991). Any two variables with a
9
correlation coefficient exceeding + or - .75 were considered to be highly correlated and were
not included in the same model. A General Linear Models procedure (SAS Institute Inc.
1989) which can analyze the variance of unbalanced data was used for this analysis. The
variables which explained the greatest amount of the variance of productivity were identified
and the dataset was divided into relevant subsets of productivity values. Crossed effects of
class variables were taken into consideration. The analysis was performed in an unbiased
way: all values were considered as being equally reliable and relationships were extracted
based on the face value of the data. Both additive and multiplicative (log) models were fit to
the data.
Additive: Productivity = a + b x xi + c x x2 + ••• (3)
Multiplicative: Productivity =axx, x x2 x • (4)
where a is a constant which varies with the significant class variable(s)2.
The first phase of the analysis was concerned with determining which individual
variables explained the greatest amount of variation of productivity measured as lines-of-code
per manmonth. The results of the analysis of all individual class variables are presented in a
summary table. As it would not be wise to base our conclusions on the analysis of class levels
that contain limited observations, results are shown for the analysis of all of the data as well as
for subsets that contain a sufficient number of observations at each class level. The results of
these subsets are then examined individually. The results of models based on individual non-
class variables are also presented and are used to explain the differences in the class variables.
In the second phase of the analysis, combinations of two class variables were analyzed
to find the model which could explain the highest amount of productivity variance. A
summary table of results and a matrix of productivity values for the best 2-class variable
model are presented. In the third phase of the analysis, the results of models based on
combinations of all variables are presented. Finally, the results of comparing lines-of-code
productivity with process productivity are presented in the fourth phase of the analysis.
2For the 2-class models, a is a function of the crossed effects of two class variables.
10
Presentation of Results
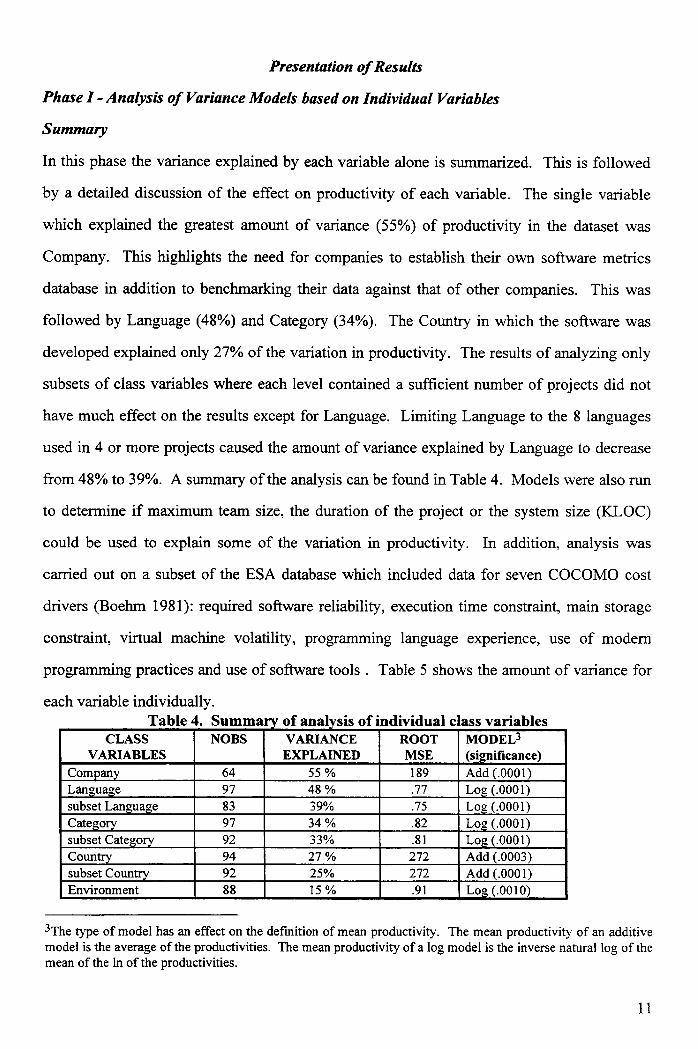
Phase I - Analysis of Variance Models based on Individual Variables
Summary
In this phase the variance explained by each variable alone is summarized. This is followed
by a detailed discussion of the effect on productivity of each variable. The single variable
which explained the greatest amount of variance (55%) of productivity in the dataset was
Company. This highlights the need for companies to establish their own software metrics
database in addition to benchmarking their data against that of other companies. This was
followed by Language (48%) and Category (34%). The Country in which the software was
developed explained only 27% of the variation in productivity. The results of analyzing only
subsets of class variables where each level contained a sufficient number of projects did not
have much effect on the results except for Language. Limiting Language to the 8 languages
used in 4 or more projects caused the amount of variance explained by Language to decrease
from 48% to 39%. A summary of the analysis can be found in Table 4. Models were also run
to determine if maximum team size, the duration of the project or the system size (KLOC)
could be used to explain some of the variation in productivity. In addition, analysis was
carried out on a subset of the ESA database which included data for seven COCOMO cost
drivers (Boehm 1981): required software reliability, execution time constraint, main storage
constraint, virtual machine volatility, programming language experience, use of modern
programming practices and use of software tools . Table 5 shows the amount of variance for
each variable individually.Table 4. Summary of analysis of individual class variables
CLASSVARIABLES
NOBS VARIANCEEXPLAINED
ROOTMSE
MODELS(significance)Add (.0001)Company 64 55 % 189
Language 97 48 % .77 Log (.0001)subset Language 83 39% .75 Log (.0001)Category 97 34 % .82 Log (.0001)subset Category 92 33% .81 Log (.0001)Country 94 27 % 272 Add (.0003)subset Country 92 25% 272 Add (.0001)Environment 88 15 % .91 Log (.0010)
3 The type of model has an effect on the definition of mean productivity. The mean productivity of an additivemodel is the average of the productivities. The mean productivity of a log model is the inverse natural log of themean of the In of the productivities.
11

Table 5. Summary of analysis of influence of non-class variablesVARIABLES NOBS VARIANCE
EXPLAINEDROOTMSE
MODEL(significance)
STOR 59 53 % .81 Log(.0001)TIME 59 41 % .72 Log(.0001)TOOL 60 32 % .77 Log(.0001)RELY 93 27 % .81 Log(.0001)MODP 59 24 % .82 Log(.0001)TEAM 74 19 % .91 Log (.0001)DUR 57 12 % .93 Log (.0088)KLOC 96 5 % .93 Log (.0308)VIRT 59 not significantLEXP 60 not significant
Phase Ia - Analysis of Variance by Individual Class Variables
Analysis of Variance by Company
The difference in Company alone explained 55% of the variation in productivity. A subset of
64 projects from 10 companies which had supplied data for three or more projects was
analyzed. Table 6 lists the average productivity for each company. Some explanations for the
difference in productivity across companies are: more projects in a low productivity category;
more use of a low productivity language; differences in product, computer, personnel and
project attributes; more successful at managing software projects; and differences in quality of
end product. The low productivity of 4 of the 5 least productive companies was due to the
fact that most of their projects were in the low productivity categories of On Board and
Message Switching and/or used the low productivity languages Coral and Assembler.
However, this explanation does not account for the nearly 300% difference in productivity
between company 2 and company 7. Some of this difference must also be due to the ways in
which these companies manage their software development projects. In his analysis of 278
commercial programs from 23 companies, Lawrence (1981) also found that some
organizations obtained significantly higher productivity than others, although no industry
pattern was evident. He suggested that the identification of proper organizational variables,
such as morale, group norms, personality, management style, level of supervision, training
and employee selection criteria, could contribute to a better understanding of programming
productivity variations.
12

STOR increasing productivity--- C2
C4
C7
-7 -Ers MODP 1 Very LowTOOL ..- ,
Table 6. Mean lines-of-code productivity by com anCOMPANY C2 C3 Cl C5 C8 C7 C6 C10 C9 C4
(3)4 (4) (7) (7) (4) (3) (3) (25) (3) (5)MEAN 853 554 524 479 425 293 268 203 131 84PRODUCTIVITY
LOW PROD. 0 0 0 0 0 0 0 44 67 0LANGUAGE% LOW PROD. 0 0 0 14 25 0 67 4 100 100CATEGORY
Some further insight into these large productivity differences can be gained from the
analysis carried out on a subset of the ESA database which included data for the seven
COCOMO cost drivers described previously. The 300% difference in the productivity
between company 7 and company 2 can thus be explained by the fact that company 2 projects
had lower reliability requirements, and a higher use of tools and modem programming
practices (see Figure 2). The least productive company, company 4, had projects with very
high required reliability, execution time constraints and storage constraints. As these three
requirements are fixed, this suggests that the use of tools and modem programming practices
are major controllable factors in productivity improvement.
Figure 2.Median Scores of Significant Productivity Factors for Companies in ESA Dataset
'Number of projects is shown in parentheses.
12
2 Low
3 Nominal
4 High2 1
RELY 1 TIME 5 Very High
6 Extremely High
13
Analysis of Variance by Language
A number of researchers have found that productivity, measured using either lines-of-code or
function points, varies with the levels of the programming language (Aron 1976, Albrecht
1979, Behrens 1983, Jones 1991, Kitchenham 1992). Some productivity studies have
removed this effect either by considering only programs written in the same language
(Lawrence 1981, Card et al. 1987, Banker et al. 1991), or by converting all data into one
language using conversion factors (Cusumano and Kemerer 1990). In the ESA dataset,
language alone explained 48% of the variation in productivity of 99 projects coded in 18
languages or combinations of languages. A subset of 83 projects coded in languages that had
4 or more observations was also analyzed in more detail. Figure 3 shows clearly that Coral
and Assembler are low productivity languages.
It is interesting to note that in the ESA dataset the higher level languages, such as Ada,
do not appear less productive than the low level Assembler language when measuring
productivity in lines-of-code. This result contradicts the lines-of-code paradox put forward by
Jones (1994) which states that "when programs are written in higher level languages, their
apparent productivity expressed in source code per time unit is lower than for similar
applications written in lower level languages. When software migrates from low level to high
level languages, the non-coding tasks act as though they are fixed costs (i.e. specifications,
documentation) while the number of source code "units" goes down . Hence, the cost per unit
must go up." However, this is only true if we assume that the total effort in manmonths
increases, remains unchanged or decreases less than proportionally with lines-of-code. It is
possible that the decrease in effort involved in coding, testing and integrating software written
in higher level languages is so great that the total development effort is substantially
decreased. This would have the effect of counteracting the decrease in the lines-of-code. If
we look ahead to Table 9 we see no proof of a lines-of-code paradox in the ESA database
even when projects in the same category are considered.
5As the level of a language increases fewer lines of code are needed to produce a product of the samefunctionality.
14

Figure 3. Mean lines-of-code productivity by language*
400350
250300
200150100
50 /22,0ADA PAS FOR LTR C TAL COR AS(34) (8) (9) (4) (9) (4) (8) (7)
* The number in parentheses is the number of observations.
In the ESA database, the difference in the productivity between languages can be
accounted for by the five significant COCOMO cost factors (see Table 5). Assembler projects
have a low productivity because they have the highest required reliability and storage
constraints, high time constraints and the lowest use of tools and modern programming
practices. In contrast, the Ada projects have low required reliability and storage constraints,
average time constraints and the highest use of tools and modern programming practices.
Analysis of Variance by Category
As the categorization of other large heterogeneous datasets (Cusumano and Kemerer 1990,
Jones 1991, Putnam and Myers 1992) have been mainly based on a breakdown into MIS,
systems and military projects, with an emphasis on MIS, the results of this part of the analysis
cannot be compared with past research and are presented only in order to highlight the
existence of low productivity categories in the ESA database. The ESA classification by
category alone explained 34% of the variation in productivity. The 99 projects were classified
into 10 categories. A subset of 92 projects in categories that had 5 or more observations was
analyzed in more detail. Figure 4 shows clearly that On Board and Message Switching are
low productivity categories. This is due to the fact that the size of the software for most OB
projects must be as small as possible. In the ESA dataset, OB projects have the highest time
and storage constraints, the second highest required reliability and the lowest use of tools and
modern programming practices. The projects in the MSG category have the highest required
15

GSE TL RT SIM GRDMSG OB(8) (5) (19) (8) (27) (8) (17)
600
500
400
300
200
100
0
reliability and consist of software developed for handling and distributing messages and
managing information flows. In some cases encryption of the messages is required. The high
productivity categories, Ground Support Equipment and Tool, have low reliability
requirements and time constraints and the highest use of modern programming practices.
Figure 4. Mean lines-of-code productivity by category*
* The number in parentheses is the number of observations.
Analysis of Variance by Country
Past research comparing the software development productivity levels of different countries is
almost non-existent. Cusumano and Kemerer (1990) have published a comparative
productivity analysis between the U.S. and Japan in which they find no significant difference
in the productivity of U.S. and Japanese projects when the application type, the hardware
platform, and code reuse have been taken into account. Jones (1993) has published some
tables of world-wide productivity levels but states that there is currently not yet enough
accurate data for such an evaluation. In the ESA dataset, country as a class variable explained
27% of the variation of productivity. The average productivity for countries with four or
more observations is shown in Table 7. These productivity values should not be considered as
national productivity levels as they are based on limited observations. Some difference in the
mean productivity of the countries in our dataset can be explained by the percentage of
projects that companies in each country undertook either in low productivity categories
(OB/MSG) or using low productivity languages (COR/AS).
16
Table 7. Mean lines-of-code productivity by countryCOUNTRY NOBS MEAN
PRODUCTIVITY%0B/MSGPROJECTS
%COR/ASPROJECTS
Belgium 4 838 0 0Netherlands 6 502 0 0France 25 419 32 20Germany 8 406 25 0Italy 15 365 40 0UK 34 187 26 29
Differences can also be accounted for by the mixture of industrial, space and military projects
that were undertaken in each country (see Figure 5). This has also been mentioned by Jones
(1994) as a factor which influences software productivity at a national level. Belgium appears
as the most productive country in our dataset because of the predominance of high relative
productivity industrial projects (see Figure 6). In contrast, the UK appears as the least
productive country because of its high volume of military projects. As no other factors
considered in our analysis could consistently explain any further difference in productivity
across countries, it appears that factors other than the ones considered in our analysis are
contributing to productivity differences. Further large scale data gathering efforts are needed
to establish the relative productivity levels of European countries and their major influential
factors.
Figure 5. Breakdown of projects by country Figure 6. Mean lines-of-codeand development environment productivity by
environment*
400-350'30025020015010050
0 Industry (24)
o Industry
o Space
• Military
BE NE FR GE IT UK
* The number in parentheses is the number of
observations
Phase Ib - Analysis of Variance of Individual Non-Class Variables
Of the seven COCOMO cost factors, only five were found to be significant and two, use of
tools and modern programming practices, were found to be highly positively correlated. This
suggests that in the COCOMO model these two variables could be combined. Referring back
17

to Table 5, we see that the main storage constraint alone explains 53% of the variation in
productivity. Low productivity in the ESA dataset is due to high storage constraints, high
time constraints, high reliability requirements, low tool use and low use of modern
programming practices.
These results are, for the most part, in agreement with other researchers. Storage
constraints and time constraints were also found to have a negative impact on productivity in
the following studies (Brooks 1981, Walston and Felix 1977, Vosburgh et al. 1984). Boehm
(81) assumes that high reliability requirements have a negative impact on productivity in his
COCOMO model. However, there does exists a divergence of opinion on the impact of tools
and modern programming practices on productivity. In agreement with our results, Jones
(1991) concluded that the use of tools and modern programming practices improved
productivity. Significant gains in productivity due to the use of modern programming
practices have also been found by Albrecht (1979), Vosburgh et al. (1984), Walston and Felix
(1977) and Brooks (1981). On the contrary, Kitchenham (1992) found that no significant
productivity improvement resulted from the use of tools and modern programming practices.
Card et al. (1987) determined that although the use of tools and modern programming
practices had no significant effect on productivity, the use of modern programming practices
resulted in improved reliability. Banker et al. (1991) found that these two factors had a
negative impact on short term productivity in their study of maintenance projects. Lawrence
(1981) found that the chief benefits of disciplined programming methodology are experienced
in the early design and test stages. He concluded that even though there was no noticeable
productivity difference in groups using structured programming or walkthroughs, these factors
probably resulted in fewer latent bugs and reduced maintenance costs. As the positive
productivity impact of the use of tools and programming methods may not be visible
immediately, more research should be done to determine their effect on long term
productivity.
Programming language experience was found to have no significant effect on the
productivity of the ESA dataset. Kitchenham (1992) also found weak empirical evidence that
more experienced personnel improved project productivity. Although language experience
18

had the 2nd highest productivity range out of 29 factors studied by Walston and Felix (1977),
Brooks' (1981) analysis of the same dataset determined that programming language
experience was not significant for large projects. Boehm (1987) included language
experience as one of 16 COCOMO software productivity factors, albeit with the smallest
productivity range. An analysis by Kitchenham (1992) of Boehm's dataset confirms that this
result is significant, although she points out that projects with staff of normal experience had
similar productivity level to projects with highly experienced staff This trend was also
confirmed by Jeffrey and Lawrence's (1985) finding that COBOL programmers did not
improve in productivity after a one year experience with the language. The fact that virtual
machine volatility was not found to be significant was due to it not varying much among
projects. Factor Analysis was also carried out on these seven productivity variables. We
found that the seven variables could be grouped in four factors which explained 90% of the
variance in the data. The first factor included the variables TIME, STOR and RELY. The
second factor was comprised of MODP and TOOL, the third factor was LEXP and the fourth
factor was VIRT.
The simple models based on TEAM, DUR and KLOC had a R-squared of less than .20
which means that none of these variables alone is a good indicator of productivity. However,
the models were significant and as they have been discussed in previous research some
comparisons can be made and conclusions drawn.
Productivity was found to decrease with increasing team size. This is probably due to
the coordination and communication problems that occur as more people work on a project.
Team size explained 19% of the productivity variance with an elasticity6 of -0.5. This result is
in agreement with the findings of other researchers (Brooks 1975, Conte et al. 1986). In
particular, Conte et al. also determined that team size had an elasticity of -0.5 when analyzing
projects from the NASA database. Card et al. (1987) found that team size was not significant;
however, this may be because it was confined to a narrow range in their study.
61n this context, elasticity is a measure of the effect on productivity of a change in team size. An elasticity of-0.5 means that if team size is increased by 10%, productivity will decrease by 5%.
19
Increasing project duration was found to lead to a decrease in productivity. Duration
explained 12% of the variation in productivity with an elasticity of -0.6. Putnam and Myers
(1992) include duration with an elasticity of -1.33 in their process productivity equation (see
Equation 2). Their definition of process productivity is directly based on their approach to
cost estimation in which they holds that effort varies inversely as the fourth power of
development time. This severe penalty imposed by reducing development time is not greatly
subscribed to by other researchers (Conte et al. 1986), nor is it supported by our analysis. In
contrast to subsequent findings by other researchers, Aron (1976) determined that the
productivity of easy and medium difficulty projects of greater than 24 months duration was
66% higher than that of shorter projects. He also found that productivity remained relatively
stable for difficult projects no matter what the duration.
Productivity was found to slightly increase with increasing system size for the ESA
dataset. This result is the opposite of those of other researchers who have found that
productivity decreases with increasing system size (Albrecht 1979, Jones 1979, Brooks 1981,
Behrens 1983, Vosburgh et al. 1984, Conte et al. 1986, Putnam and Myers 1992). For the
ESA database, system size (KLOC) explained 5% of the productivity variance with an
elasticity of 0.2. Although Jones found that productivity decreased exponentially and Putnam
and Myers found that productivity decreased substantially, Conte et al. found that productivity
did not show a strong decreasing trend as system size grew.
Phase H Analysis of Variance Models based on Combinations of Class Variables
Summary
Combinations of relevant subsets of class variables (see Table 4) were analyzed to find the
model which could explain the highest amount of productivity variance. Only combinations
of two class variables at a time were considered; categorizing the data by three class variables
led to too many cells with only one observation. Table 8 summarizes the four best models
found:
20
Table 8. Summary of analysis for models based on two class variablesCLASSVARIABLES
NOBS VARIANCEEXPLAINED
ROOTMSE
MODEL(significance)
Category*Language 80 76% .58 Log (.0001)Company*Language 55 76% .58 Log (.0001)Country*Category 89 73% 168 Add (.0001)Company*Category 63 72% 180 Add (.0001)
Although they explained the same amount of variance of productivity, the
Category*Language model has more observations than the Company*Language model and
can be considered to be better. Therefore the best method of benchmarking the productivity
of a project in this dataset would be to compare its productivity to projects of the same
category and language.
These results correspond well with the conclusions of Arthur that lines-of-code metrics
should only be compared within the same language and to similar projects using identical
technologies (Arthur 1985). He also concluded that lines-of-code productivity is
representative only when measured for large projects, as is the case of projects in the ESA
database.
Analysis of Variance by Category and Language
Table 9 shows the average productivity of projects of the same category and language. It can
be concluded that no matter what language is used, the categories of On Board and Message
Switching have a low productivity. In addition, the languages Coral and Assembler have a
low productivity regardless of the category in which they were used. The low average
productivity of the language TAL in the ESA dataset (Figure 3) appears to be a result of its
being used for Message Switching projects.
21
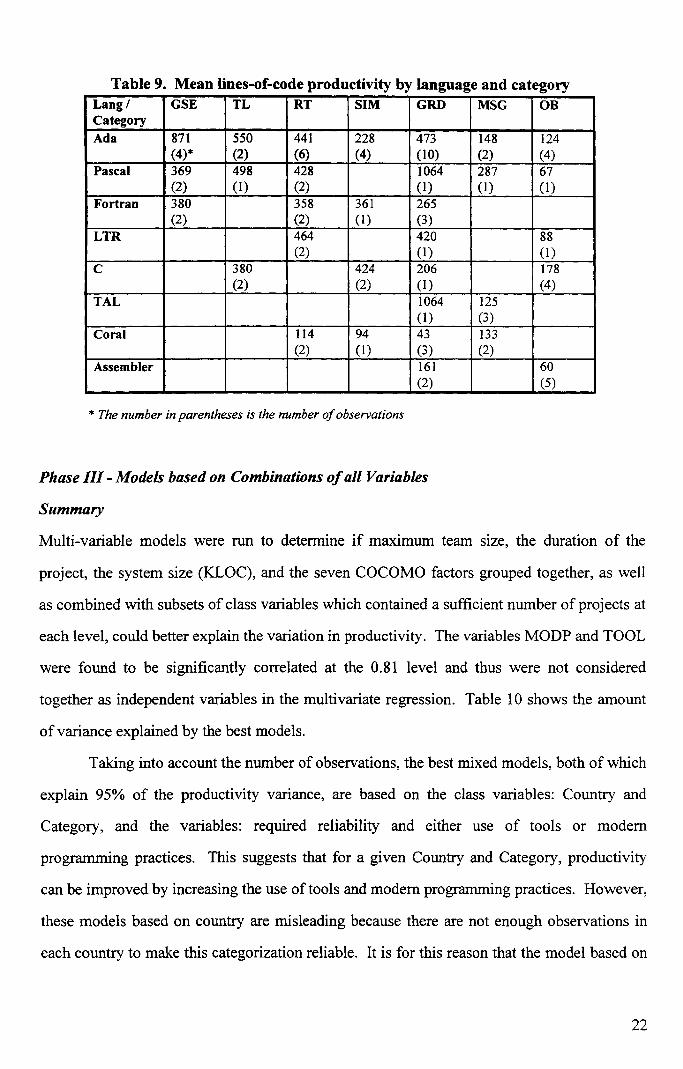
Table 9. Mean lines-of-code productivity by language and categoryLang /Category
GSE TL RT SIM GRD MSG OB
Ada 871 550 441 228 473 148 124(4)* (2) (6) (4) (10) (2) (4)
Pascal 369 498 428 1064 287 67(2) (1) (2) (1) (1) (1)
Fortran 380 358 361 265(2) (2) (1) (3)
LTR 464 420 88(2) (1) (1)
C 380 424 206 178(2) (2) (1) (4)
TAL 1064 125(1) (3)
Coral 114 94 43 133(2) (1) (3) (2)
Assembler 161 60(2) (5)
* The number in parentheses is the number of observations
Phase III - Models based on Combinations of all Variables
Summary
Multi-variable models were run to determine if maximum team size, the duration of the
project, the system size (KLOC), and the seven COCOMO factors grouped together, as well
as combined with subsets of class variables which contained a sufficient number of projects at
each level, could better explain the variation in productivity. The variables MODP and TOOL
were found to be significantly correlated at the 0.81 level and thus were not considered
together as independent variables in the multivariate regression. Table 10 shows the amount
of variance explained by the best models.
Taking into account the number of observations, the best mixed models, both of which
explain 95% of the productivity variance, are based on the class variables: Country and
Category, and the variables: required reliability and either use of tools or modern
programming practices. This suggests that for a given Country and Category, productivity
can be improved by increasing the use of tools and modern programming practices. However,
these models based on country are misleading because there are not enough observations in
each country to make this categorization reliable. It is for this reason that the model based on
22
Language and Category is also presented. Although is explains less of the productivity
variation , it makes more sense.
Table 10. Summary of analysis of best mixed modelsVARIABLES NOBS VARIANCE
EXPLAINEDROOTMSE
MODEL(significance)
Company*subset Category,RELY, TOOL(25%)7
30 99% .16 Log(.0001)
subset Country*subset Category,RELY, TOOL(7%)
54 96% .26 Log(.0001)
subset Country*subset Category,RELY, MODP(6%)
53 95% .29 Log(.0001)
subset Language*subset Category,RELY
60 90% .39 Log(.0001)
TEAM, KLOC, DUR 45 89% .36 Log(.0001)RELY, STOR,TOOL(7%)
59 70% .52 Log(.0001)
RELY, STOR,MODP(7%)
59 70% .53 Log(.0001)
The best non-class variable model of lines-of-code productivity was found to be based on
team size, duration and KLOC. However, we will ignore this model because it is roughly the
definition of lines-of-code productivity and thus adds nothing to our knowledge. The two
models based on required software reliability, main storage constraint and either use of tools
or modern programming practices are much more interesting. As the required software
reliability and main storage constraint are fixed, we can conclude that the use of tools or
modern programming practices are major factors in productivity improvement. However, as
the use of tools and modern programming practices are highly dependent on the language
used, they are only controllable to the extent that the choice of language is not imposed. It is
interesting to note that once language is added to the model neither tools or modern
programming practices are significant.
Phase IV - Comparison of Lines-of-Code Productivity and Process Productivity
Putnam and Myers (1992) maintain that process productivity is superior to simple lines-of-
code productivity because it covers a complex set of factors affecting the entire software
7The number in parentheses is the amount of productivity variation explained by MODP or TOOL.
23

development organisation throughout the development process including: management
practices, use of methods, level of programming language, software environment, skills and
experience of team members and the complexity of the application type. According to
Putnam and Myers, process productivity can be used to measure the effectiveness of an
organisation over time, to compare the effectiveness between organizations, or to indicate the
degree of complexity of the application work being done. In order to assess the added value
of process productivity, a detailed analysis of the factors affecting process productivity in the
ESA database was undertaken in this phase of our analysis.
Summary
The single variable which explained the greatest amount of variance (60%) of process
productivity in the dataset was Country. The results of analyzing only subsets of class
variables where each level contained a sufficient amount of projects substantially effected the
results with the classes subset Language and subset Category becoming insignificant. In
addition, limiting Country to the 6 countries containing 4 or more projects caused the amount
of variance explained by Country to decrease from 60% to 17%. Process productivity was not
found to vary significantly with environment. A summary of the analysis can be found in
Table 11.
Models were also run to determine if maximum team size, the duration of the project
or the system size (KLOC) could be used to explain some of the variation in process
productivity. In addition, analysis was carried out on a subset of the ESA database which
included data for the seven COCOMO cost drivers. Table 12 shows the amount of variance
for each variable individually.
Table 11. Summary of process productivity analysis of individual class variablesCLASS
VARIABLESNOBS VARIANCE
EXPLAINEDROOTMSE
MODEL(significance)
Country 57 60% 3918 Add(.0001)Language 57 53% 4571 Add(.0005)Category 57 45% 4695 Add(.0002)Company 46 34% 3709 Add(.0554)subset Country 54 17% .88 Log(.0505)subset Language 46 not significantsubset Category 53 not significantEnvironment 53 not significant
24

Table 12. Summary of analysis of influence of non-class variables onprocess productivity
VARIABLES NOBS VARIANCEEXPLAINED
ROOTMSE
MODEL(significance)
STOR 23 34% .75 Log(.0034)KLOC 57 32% 4882 Add(.0001)TOOL 24 17% .83 Log(.0440)VIRT 23 16% 4694 Add(.0561)DUR 57 15% .94 Log(.0030)TEAM 45 not significantRELY 53 not significant
TIME 53 not significantMODP 23 not significant
LEXP 24 not significant
Of the set of complex factors which are supposedly covered in the definition of process
productivity, we are able to look in particular at the effect of the use of methods, level of
programming language, software environment, experience of team members, evolution over
time, and company differences on process productivity. Looking in detail at Tables 11 and
12, we see that environment, experience of team members and modern programming practices
had no significant effect on process productivity in the ESA database. Furthermore, the
difference in the level of programming language and category in subsets in which there were
an adequate number of observations at each class level was not significant for process
productivity. The difference among companies did account for 34% of the variation in
process productivity; however, company differences accounted for 53% of the variation of
lines-of-code productivity.
In summary, we believe that process productivity is not superior to lines-of-code
productivity for the following reasons: Firstly, the utility of incorporating duration in the
definition of productivity is questionable as it is one of the factors which accounts for the least
amount of variation in lines-of-code and process productivity. Secondly, lines-of-code
productivity already covers a complex set of factors affecting the development process such as
the differences among company, language, category, environment, storage and time
constraints, use of tools and modern programming practices and software reliability
requirements. The variation of these factors have significant effects on the variation of lines-
of-code productivity while many of these factors were not found to be significant for process
productivity. Finally, lines-of-code productivity is easier to calculate.
25
Conclusions
The objectives of this paper were firstly, to provide significant and useful information about
the major factors which influence the productivity of European space, military and industrial
applications and secondly, to compare two productivity metrics, process productivity and
lines-of-code productivity, in order to determine which metric was better at measuring the
productivity of projects similar to those in our dataset.
Our study has found that organizational differences account for most of the
productivity variation of projects in the ESA dataset. This highlights the need for companies
to establish their own software metrics database in addition to benchmarking their data against
that of other companies. The results indicate that some companies are obtaining significantly
higher productivity than others. Some of the difference in productivity among companies can
be attributed to their use of low productivity languages, such as Coral and Assembler, or to
the fact that many of their projects were in low productivity categories, such as On Board and
Message Switching; however, some differences must also be due to the ways in which these
companies manage their software development projects. Further research should concentrate
on identifying which management related factors contribute to productivity improvement. In
addition, high productivity was found in those companies which undertook projects with low
reliability requirements, low main storage constraints, low execution time constraints and
which had a high use of tools and modern programming practices. As the first three
requirements are fixed, this suggests that the use of tools and modern programming practices
are major controllable factors in productivity improvement.
We have also been able to contribute to knowledge in the area of software
development productivity by confirming or disproving the applicability of previous research
results to projects in the ESA dataset. In agreement with most other researchers, we have
found that productivity decreases with increasing storage constraints, timing constraints,
reliability requirements, team size and project duration. We have also found that
programming language experience has no significant effect on productivity. As the
conclusions of previous research are divided over the positive impact of the use of tools and
26

modern programming practices on productivity, and as the benefits of these two factors may
not be visible immediately, more research should be done to determine their effect on long
term productivity. Contrary to the findings of other researchers, we have found that
productivity increases with increasing system size and that high level languages do not appear
less productive than low level languages when measuring productivity in lines-of-code.
Finally, we have determined that, for the ESA database, the process productivity
metric is not superior to the lines-of-code productivity metric. Until the use of a better metric
becomes widespread for non-MIS applications, the best measure of relative productivity for
space, military and industrial applications is lines-of-code productivity.
The relevance of any analysis is greatly limited by the quality of the data available. One of
the weaknesses of the ESA database is that no faults data was collected and thus there is no
means of assessing the quality of the projects. The analysis would also have been much more
meaningful had metrics concerning management factors been collected. Before any data
collection effort, the hypotheses to be tested should be formulated, terms should be precisely
defined, and care should be taken to ensure that the scales used to collect the data support
statistical analysis. The ESA questionnaire has now been modified to these criteria.
The ESA database is being maintained at INSEAD. A sanitized version of the database is
available to any company who provides data.
27

References
Aron, J.D., "Estimating Resources for Large Programming Systems", Software Engineering:
Concepts and Techniques, Edited by J.M. Buxton, P. Naur and B. Randell, Litton
Education Publishing, Inc., (1976), 206-217.
Albrecht, A.J., "Measuring Application Development Productivity", Proceedings of the Joint
SHARE/GUIDE/IBM Application Development Symposium, Monterey, CA, (October
1979), 83-92.
Arthur, L.J., Measuring Programmer Productivity and Software Quality, John Wiley & Sons,
New York, 1985.
Bailey, J.W. and V.R. Basili, "A Meta-Model for Software Development Resource
Expenditures", Proceedings of the Fifth International Conference on Software
Engineering, San Diego, CA, (1981), 50-60.
Banker, R.D., S.M. Datar and C.F. Kemerer, "A Model to Evaluate Variables Impacting the
Productivity of Software Maintenance Projects", Management Science, Vol. 37, No.
1, (January 1991), 1-18.
Behrens, C.A., "Measuring the Productivity of Computer Systems Development Activities
with Function Points", IEEE Transactions on Software Engineering, Vol. SE-9,
No. 6, (November 1983), 648-652.
Belady, L.A. and M.M. Lehman, "The Characteristics of Large Systems", Research
Directions in Software Technology, ed. P. Weger, MIT Press, Cambridge, MA, 1979.
Boehm, B.W., Software Engineering Economics, Prentice-Hall, Inc., Englewood Cliffs, N.J.,
1981.
Boehm, B.W., "Improving Software Productivity", IEEE Computer, vol. 20, (September
1987), 43-57.
Brooks, F.P., The Mythical Man-Month: Essays on Software Engineering, Addison-Wesley
Publishing Company, 1975.
Brooks, W.D., "Software Technology Payoff: Some Statistical Evidence", The Journal of
Systems and Software 2, (1981), 3-9.
28

Card, D.N., F.E. McGarry and G.T. Page, "Evaluating Software Engineering Technologies",
IEEE Transactions on Software Engineering, Vol. SE-13, No. 7, (July 1987),
845-851.
Conte, S.D., H.E. Dunsmore and V.Y. Shen, Software Engineering Metrics and Models, The
Benjamin/Cummings Publishing Company, Inc., Menlo Park, California, 1986.
Coulter, N.S., "Software Science and Cognitive Psychology", IEEE Transactions on Software
Engineering, Vol. SE-9, No. 2, March 1983.
Cusumano, M.A. and C.F. Kemerer, "A Quantitative Analysis of U.S. and Japanese Practice
and Performance in Software Development", Management Science, Vol. 36, No. 11,
(November 1990), 1384-1406.
DeMarco, T., Controlling Software Projects, Yourdon Press, New York, N.Y., 1982.
Fenton, N.E., Software Metrics: A Rigorous Approach, Chapman and Hall, London, 1991.
Grady, R.B. and D.L. Caswell, Software Metrics: Establishing a Company-Wide Program,
Prentice-Hall, Inc., Englewood Cliffs, New Jersey, 1987.
Grady, R.B., Practical Software Metrics for Project Management and Process Improvement,
P.T.R. Prentice Hall, Englewood Cliffs, N.J., 1992.
Halstead, M.H., Elements of Software Science, Elsevier North-Holland, Inc., New York,
N.Y., 1977.
International Function Point Users Group (IFPUG), Function Point Counting Practices
Manual, Release 4.0, 1994.
Jeffrey, D.R. and M.J. Lawrence, "Managing Programming Productivity", The Journal of
Systems and Software 5, (1985), 49-58.
Jeffrey, D.R., "Time-Sensitive Cost Models in the Commercial MIS Environment", IEEE
Transactions on Software Engineering, Vol. SE-13, No. 7, July 1987.
Jones, T.C., "The Limits of Programming Productivity", Proceedings of the Joint
SHARE/GUIDE/IBM Application Development Symposium, Monterey, CA
(October 1979) 77-82.
Jones, C., Programming Productivity: Issues for the Eighties, IEEE Computer Society
Press, Washington, D.C., 1986.
29

Jones, C., Applied Software Measurement: Assuring Productivity and Quality, McGraw-Hill,
Inc., New York, N.Y., 1991.
Jones, C., Software Productivity and Quality Today: The Worldwide Perspective, IS
Management Group, Calsbad, CA, 1993.
Jones, C., Assessment and Control of Software Risks, PTR Prentice Hall, Englewood Cliffs,
N.J., 1994.
Kitchenham, B.A., "Empirical studies of assumptions that underlie software cost-estimation
models", Information and Software Technology, Vol. 34, No. 4, (April 1992),
211-218.
Lawrence, M.J., "Programming Methodology, Organizational Environment, and
Programming Productivity", The Journal of Systems and Software 2, (1981),
257-269.
K.H. and D.J. Paulish, Software Metrics: A Practitioner's Guide to Improved Product
Development, Chapman & Hall, London, 1993.
Putnam, L.H. and W. Myers, Measures for Excellence: Reliable Software on Time, within
Budget, P.T.R. Prentice Hall, Inc., Englewood Cliffs, N.J., 1992.
SAS Institute Inc., SAS/STAT User's Guide, Version 6, Fourth Edition, Volume 2, SAS
Institute Inc., Cary, NC, 1989.
Sheppard, M. and D. Ince, Derivation and Validation of Software Metrics, Clarendon Press,
Oxford, 1993.
Stephenson, W.E., "An Analysis of the Resources Used in the Safeguard System Software
Development", Proceedings of the 2nd International Conference on Software
Engineering, (1976), 312-321.
Symons, C.R., Function Point Analysis: Difficulties and Improvements, IEEE Transactions
on Software Engineering, Vol. 14, No. 1, (January 1988), 2-11.
Thadhani, A.J., "Factors Affecting Programmer Productivity during Application
Development", IBM Systems Journal 23, No. 1, (1984), 19-35.
30

Vosburgh, J, B. Curtis, R. Wolverton, B. Albert, H. Malec, S. Hoben and Y. Liu,
"Productivity Factors and Programming Environments", Proceedings of the Seventh
International Conference on Software Engineering, (1984), 143-152.
Walston, C.E. and C.P. Felix, "A method of programming measurement and estimation", IBM
Systems Journal 16, No. 1, (1977), 54-73.
Acknowledgements
The authors would like to thank the European Space Agency for their funding of this project
and Dr. Benjamin Schreiber in particular for initiating the data collection effort. They also
extend their thanks to the referees for their constructive comments.
31
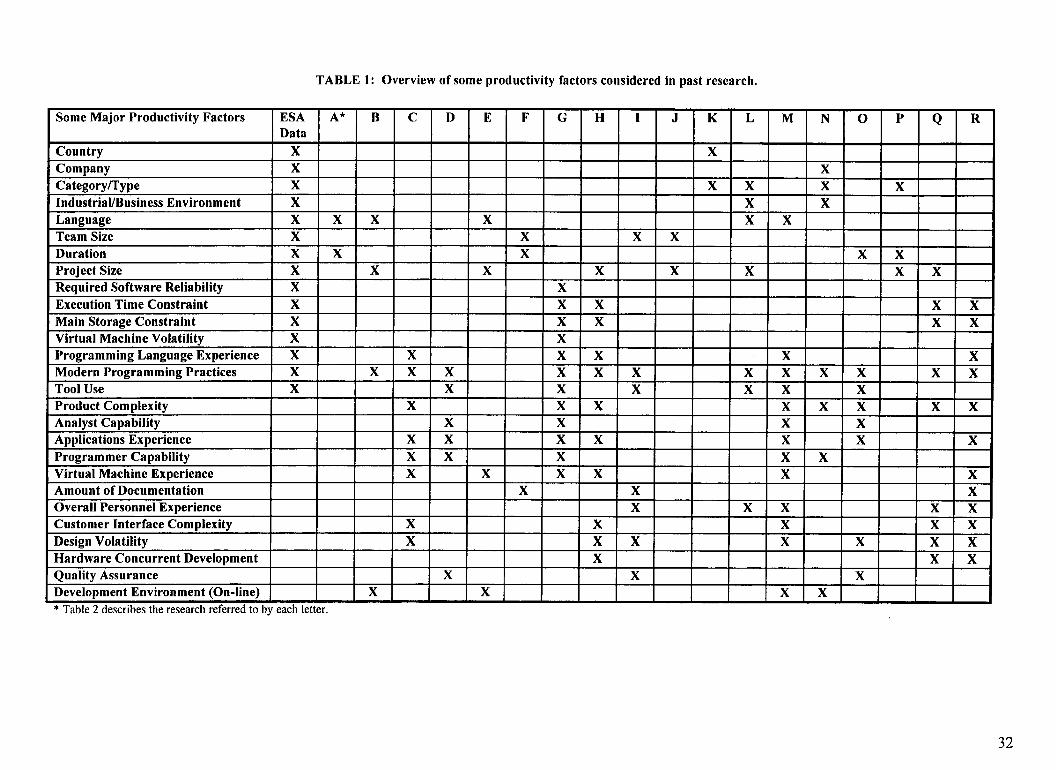
TABLE 1: Overview of some productivity factors considered in past research.
Some Major Productivity Factors ESAData
C D E F G H I J K L M N 0 P Q R
Country X XCompany X XCategory/Type X X X X XIndustrial/Business Environment X X XLanguage X X X X X XTeam Size X X X XDuration X X X X XProject Size X X X X X X X XRequired Software Reliability XExecution Time Constraint X X X X XMain Storage Constraint X X X X XVirtual Machine Volatility X XProgramming Language Experience X X X X X XModern Programming Practices X X X X X X X X X X X X XTool Use X X X X X X XProduct Complexity X X X X X X X XAnalyst Capability X X X XApplications Experience X X X X X X XProgrammer Capability X X X X XVirtual Machine Experience X X X X X XAmount of Documentation X X XOverall Personnel Experience X X X XCustomer Interface Complexity X X X X XDesign Volatility X X X X X X XHardware Concurrent Development X X XQuality Assurance X X XDevelopment Environment (On-line) X X X* Table 2 describes the research referred to by each letter.
32
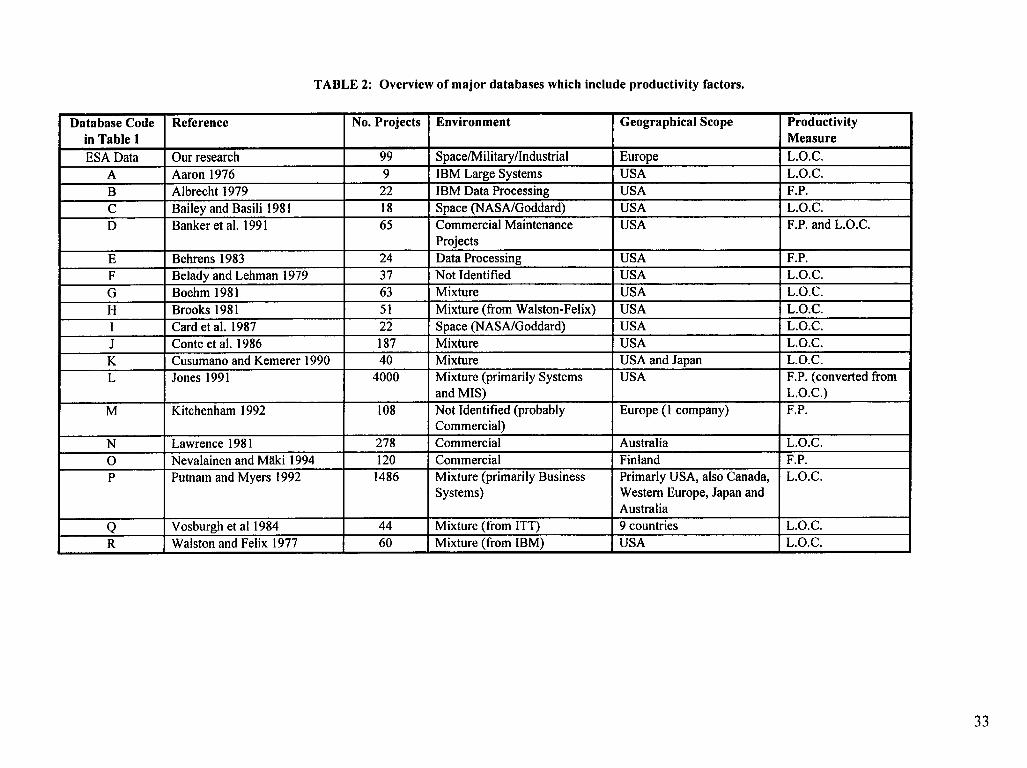
TABLE 2: Overview of major databases which include productivity factors.
Database Codein Table 1
Reference No. Projects Environment Geographical Scope ProductivityMeasure
ESA Data Our research 99 Space/Military/Industrial Europe L.O.C.A Aaron 1976 9 IBM Large Systems USA L.O.C.B Albrecht 1979 22 IBM Data Processing USA F.P.C Bailey and Basili 1981 18 Space (NASA/Goddard) USA L.O.C.D Banker et al. 1991 65 Commercial Maintenance
ProjectsUSA F.P. and L.O.C.
E Behrens 1983 24 Data Processing USA F.P.F Belady and Lehman 1979 37 Not Identified USA L.O.C.G Boehm 1981 63 Mixture USA L.O.C.
H Brooks 1981 51 Mixture (from Walston-Felix) USA L.O.C.I Card et al. 1987 22 Space (NASA/Goddard) USA L.O.C.J Conte et al. 1986 187 Mixture USA L.O.C.K Cusumano and Kemerer 1990 40 Mixture USA and Japan L.O.C.L Jones 1991 4000 Mixture (primarily Systems
and MIS)USA F.P. (converted from
L.O.C.)M Kitchenham 1992 108 Not Identified (probably
Commercial)Europe (1 company) F.P.
N Lawrence 1981 278 Commercial Australia L.O.C.0 Nevalainen and Maki 1994 120 Commercial Finland F.P.P Putnam and Myers 1992 1486 Mixture (primarily Business
Systems)Primarly USA, also Canada,Western Europe, Japan andAustralia
L.O.C.
Q Vosburgh et al 1984 44 Mixture (from ITT) 9 countries L.O.C.R Walston and Felix 1977 60 Mixture (from IBM) USA L.O.C.
33