sofcom meeting m24 - politecnico di torino · •steam / dry reforming ... auto-thermal reforming...
TRANSCRIPT

WP4
CONCEPTUAL AND TECHNO -ECONOMIC STUDY OF COMBINED WASTE
WATER BIOGAS AND SOFC PLANTS (10 KW – 10 MW)
SOFCOM Meeting M24
Politecnico di Torino
1

WP4 ROADMAP – WORK IN PROGRESS (I)
Politecnico di Torino 2
Done
Technical part = Done Economic part =Under development
Technical part = Done Economic part =Under development
Under development

Politecnico di Torino 3
WP4 ROADMAP – WORK IN PROGRESS (II)
Done for small size plant.
Under development
Done for small and medium size plant.
Done for small size plant. Under development for
medium/large size plabt.

SOFC plant size according to biogas source
4 Politecnico di Torino
Plant Size Power generation Biogas type
S Small Size 10-100 kWe
Livestock effluents
Energy crops
Agricultural waste
Organic Waste
M Medium Size < 1 MWe
Livestock effluents + Energy crops +
Agricultural waste
Agro-industrial waste
Small WWTU
L Large Size 1-10 MWe
City WWTU
City Landfill
WWTU + Landfill

Small size => Electrochemical model
Medium size => Economic model
Large size => OSMOSE
SYSTEM ANALYSYS DEVELOPMENT
Politecnico di Torino 5

SMALL SIZE PLANT
Politecnico di Torino 6
Bernhard Tjaden Master Thesis Mixing of Biogas Constituents Decision Variables: •xCH4, db
•xN2, db
Biogas Saturated with Water Drying to RH = 60 %mol
Comparison of different refoming agents •Steam / Dry Reforming •Partial Oxidation Reforming •Auto Thermal Reforming
25 kWel Installed Power

BIOGAS POTENTIAL IN EU
Politecnico di Torino 7
Eurostat (2012a and 2012b) “Energy production and imports”, European Comission
Analysis of the biogas potential and the biogas share in Europe

BIOGAS COMPOSITION AND CONTAMINANTS
Politecnico di Torino 8
Biogas composition Real-time Data CH4 between 50 – 60 %mol
H2S Causes Ni-Catalyst Poisoning Between 100 -> 3,000 ppmmol
Specie Contaminants Average
Value [ppm]
Maximum Value
[ppm]
Sulphur
Compounds H2S 400 2897
Siloxanes D4 0.825 20.144
D5 18.129 1.689
Halogens
Dichloromethane 0.052 0.052
Chlorobenzene 0.255 0.693
Dichlorobenzene 0.254 0.61

COMPARISON WITH ICEs
Politecnico di Torino 9
Kukuk, J. (2011), “BHKW-Kenndaten 2011”, ASUE Arbeitsgemeinschaft für sparsamen und umweltfreundlichen Energieverbrauch e.V.
A rapid decrease of efficiency is observed for power capacities below 500 kWel Small size ICEs present low electrical efficiency values of < 35 % for Pel < 100 kWel. For small size plant, a significant increase in electric efficiency can be expected when deploying a fuel cell.

OPERATING STRATEGY
Politecnico di Torino 10
CONSTANT OPERATING VOLTAGE
Source: Thijssen, «Stack operating strategy for central station SOFC», 2009 Fuel Cell seminar.
Constant VOLTAGE mode:
• Constant voltage = constante efficiency.
• DOES NOT IMPACT SYSTEM PERFORMANCE.
• Requires excess stack capacity.
• With degradation 1% => stack life > 20,000 hrs.
• With excess stak capacity stack performance remain ~
constant.
Constant CURRENT mode:
• Stack replacement at 5-6% degradation.
• Excess BoP capacity (air side).
• Excess stack capacity has no benefit.
• With degradation 1% => stack life < 4,000 hrs.
• SYSTEM PERFORMANCE DEGRADES VERY
RAPIDLY.

ELECTROCHEMICAL MODEL
Politecnico di Torino 11
Van Herle, J., Maréchal, F., Leuenberger, S. and Favrat, D. (2003), “Energy balance model of a SOFC cogenerator operated with biogas”, Scientific Advances in Fuel Cell Systems, Vol. 118 1–2, pp. 375–383.
Wuillemin, “Experimental and Modeling Investigations on Local Performance and Local Degradation in Solid Oxide Fuel Cells”, 2009, EPFL Ph.D. Thesis.
EPFL Updated Values from Experimental trends
Development of a commmon electrochemical model => Shared document: «POLITO Electrochemical Model»

Sensitivy Analysis
Politecnico di Torino 12
Decision Variable Baseline Value Range
Internal Reforming under SR 0 0-50%
Fuel Utilisation [-] 80% 70% – 85%
Operating Voltage [V] 0.8 0.7 – 0.85
xCH4,db [-] 55% 50-65%
xN2,db [-] 0.001 0.001 – 0.25
Performance Indicators:
o ηel and ηtot based on Higher Heating Value
o Total Overnight Cost, Net Present Value

Operating voltage and Fuel Utilization
Politecnico di Torino 13
Operating voltage 0.7 – 0.85 V
Fuel Utilization 70 – 85%
Electrical efficiency [%]

Internal refoming and biogas composition
Politecnico di Torino 14
Internal reforming ratio 0 – 50 %
Methane fraction 50 – 65 %
Total efficiency [%]
Electrical efficiency [%]

Reforming agents performance
Politecnico di Torino 15
Reforming Option AAct ηel ηtot
Steam Reforming 11.35 m² 50.65 % 67.84 %
Partial Oxidation Reforming 9.09 m² 40.62 % 74.14 %
Auto Thermal Reforming 10.62 m² 38.82 % 71.85 %
Auto-thermal reforming brings to the lower electrical efficiency!
Auto-thermal reforming requires the higher engineering costs and technology concerning plant components and brings to the lower performance
This option won’t be studied in the economic analysis and in further analyses.

Economic analysis
Politecnico di Torino 16
Costs functions from: • Turton, Bailie, Whiting, Shaeiwitz, "Analysis, Synthesis and Design of Chemical Processes", 2nd Ed. • DOE/NETL reports. • Commerical component costs re-scaled with the required size.
Financial methodology from: • Classical cashflow analysis methodology
Standard cost function from Turton book 𝒄𝒄𝒐𝒎𝒑𝒐𝒏𝒆𝒏𝒕 = 𝑭𝑩𝑴 ∙ 𝑭𝑷 ∙ 𝑪𝑷
Multiplication factor depending on the material
Multiplication factor depending on the pressure
Base cost depending on the component size

TOC – Total Overnight Cost
Politecnico di Torino 17
4557 €/kWel
3828 €/kWel
Steam Refoming
Partial Oxidation

Finland
Cash flow analysis (I)
Politecnico di Torino 18
Development of a common subsidies database (POLITO + VTT + EPFL + TUM), for biogas production presented in Lausanne (June 2013).
Switzerland
Basic subsidies scheme: • The subsidy is depending on the installed power and on the biogas substrate
(agricoltural substrates are usual linked with higher incentives respect to WWTP and LFG).
• Usually a bonus for CHP is included.
• In some countries extra-bonus for Nitrogen recovery and high efficiency CHP are included
Germany Italy

Cash flow analysis (II)
Politecnico di Torino 19
A simplified cash flow analysis brings to remunerative investments only in Italy and Germany => High subsidies per kW.
Italy Italy + Germany

Small size => Electrochemical model
Medium size => Economic model
Large size => OSMOSE
SYSTEM ANALYSYS DEVELOPMENT
Politecnico di Torino 20

MEDIUM SIZE PLANT – NO CCS
Politecnico di Torino 21
Steam reforming via anode recirculation
CHP for digesters (65-75 °C)
50% external ref. 50% internal ref.
Anode exhaust for reformer heating , air and fuel pre-heating
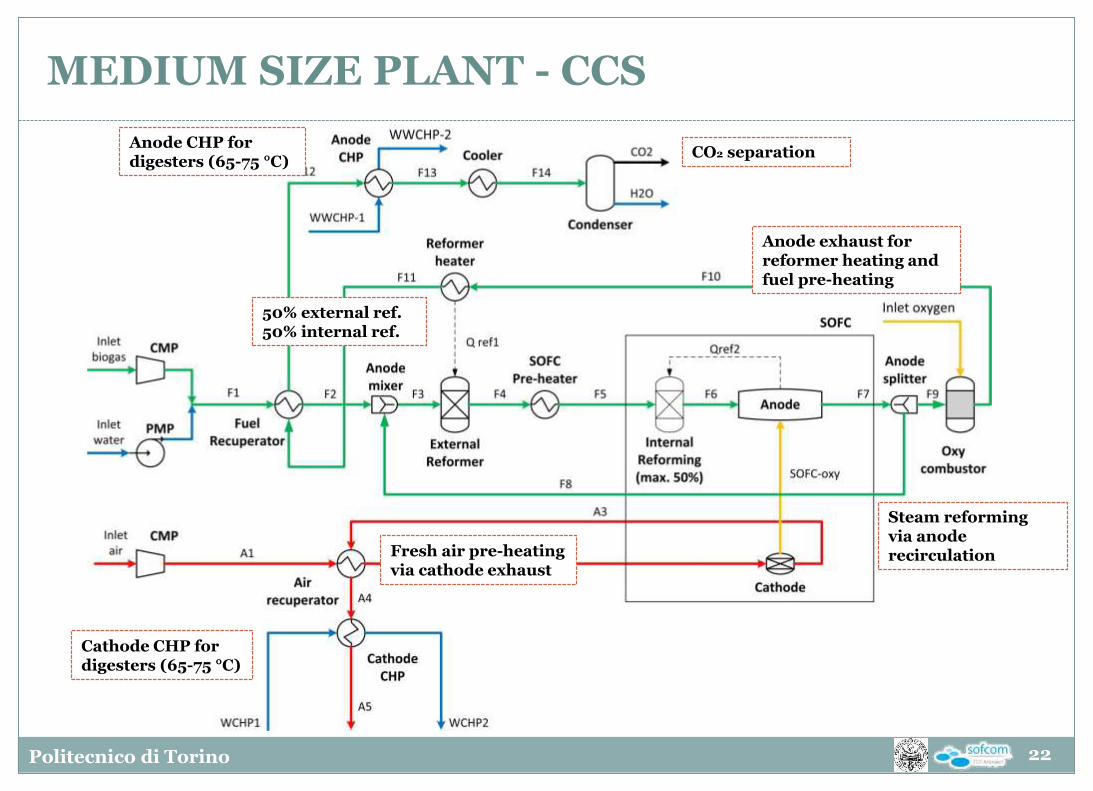
MEDIUM SIZE PLANT - CCS
Politecnico di Torino 22
Steam reforming via anode recirculation Fresh air pre-heating
via cathode exhaust
Cathode CHP for digesters (65-75 °C)
Anode CHP for digesters (65-75 °C)
CO2 separation
50% external ref. 50% internal ref.
Anode exhaust for reformer heating and fuel pre-heating

MODEL INPUT PARAMETERS
Politecnico di Torino 23
Operating voltage.
SOFC DC Power output.
Fuel utilization.
Steam to carbon ratio.
% internal reforming.
Inlet biogas: %CH4-%CO2.
Nominal conditions
Vop [V] WDC [kW] FU [%] S/C % int. Ref. %CH4 - %CO2
0.8 100 80% 2 50% 60% - 40%

RESULTS – CCS Nominal Case
Politecnico di Torino 24
Results Nominal Case
Inlet energy 162.49 kW
We DC - SOFC 100.00 kW
Fuel compressor 0.18 kW
Air compressor 7.06 kW
Water pump 0.001 kW
Oxygen Separation energy cost 300 kWh/ton
Oxygen flow rate 2.64 g/sec
Oxygen energy consumption 2.85 kW
Total power requirement 10.09 kW
Total net power output DC 89.91 kW
Inverter efficiency 95 %
Total net power output AC 85.41 kW
Electrical efficiency 52.56 %
Anode CHP heat duty 33.60 kW
Cathode CHP heat duty 20.61 kW
Thermal efficiency 33.36 %
Total efficiency 85.93 %
Electrochemical model
Voltage Vg 0.970 V
ASR 0.370 Ω cm2
Current density 0.460 A/cm2
Total active area 27.2 m2

Sensitivity of FU
Politecnico di Torino 25
0,40
0,45
0,50
0,55
0,60
0,35
0,36
0,37
0,38
0,39
0,40
50% 60% 70% 80% 90%
J [
A/c
m2]
AS
R [Ω
cm
2]
FU [%]
ASR [Ω cm2]
j [A/cm2]
80%
82%
84%
86%
88%
90%
92%
94%
0%
10%
20%
30%
40%
50%
60%
70%
80%
50% 55% 60% 65% 70% 75% 80% 85% 90%
Eff
to
t [%
]
Eff
el,
th
[%
]
FU [%]
Eff el [%]
Eff th [%]
Eff tot [%]
FU => from 85 to 89% • Electrical efficiency ~ costant
(increase < 3%).
• Increase of 7% in the required active area.
FU [%] Area/Area Nom
55% 80.10%
60% 83.03%
65% 86.41%
70% 90.29%
75% 94.76%
80% 100.00%
85% 106.27%
86% 107.69%
87% 109.17%
88% 110.72%
89% 112.35%

Sensitivity on internal refoming
Politecnico di Torino 26
0,30
0,40
0,50
0,36
0,37
0,38
0,39
0,40
0 10 20 30 40 50J
[A
/cm
2]
AS
R [Ω
cm
2]
% int. Ref.
ASR [Ω cm2]
j [A/cm2]
50%
55%
60%
65%
70%
75%
80%
85%
90%
50%
55%
60%
0 10 20 30 40 50
Eff
to
t [%
]
Eff
el
[%]
% int. Ref.
Eff el [%]
Eff tot [%]
0
2
4
6
8
10
12
200
300
400
500
0 10 20 30 40 50
W c
mp
[k
W]
m a
ir [
g/s
]
% int. Ref.
m air [g/s]
W cmp [KW]
% internal reforming Area/Area Nom
0 132.47%
10 128.31%
20 121.83%
30 114.70%
40 107.34%
50 100.00%
Sensitivity analyses on the CH4 fraction in the inlet biogas and the steam to carbon ratio have also been carried out but results are not included since their variation have not a sensitive influence on the plant performance

ECONOMIC ANALYSIS
Politecnico di Torino 27
Development of an AUTOMATIC excel sheet which is able to calculate the component costs, the TOC, to run the cashflow analysis and plot results.
Since the model is linear with the size in the economic calculator the size can be changed in the range 100 kW – 1 MW and the calculation is auomatically updated by excel.
This calculation can be automatically done for each power plant, with/without CCS, in each country and with the chosen economic input.

ECONOMIC ANALYSIS - Database
Politecnico di Torino 28
Development of a excel database including: • All the Turton book cost functions • Costs from NETL report • Costs from Argonne Lab report for the cleaning system

ECONOMIC ANALYSIS - Model Input
Politecnico di Torino 29
Development of a Aspen calculator block to be directly copied and pasted in the excel economic calculator.

ECONOMIC ANALYSIS – Economic Input
Politecnico di Torino 30
Definition of the economic input parameters: • Contingencies • Equity/Debt percentages • Base year • Scaling method • Tax rate • Depreciation time • Inflation • Capacitiy factor • Stack lifetime • ….

ECONOMIC ANALYSIS – Cost functions
Politecnico di Torino 31
Blowers Pumps Compressors After-burner Heat-exchangers
Reformer Oxy-combustor Co2 separation ASU
SOFC
Cleaning system
Turton book cost function (Scaled value if the size is above maximum/below minimum) Scaling factor from Turton book
Scaled value from NETL report Scaling factor 0.67
Cost function developed by Polito starting from the NETL report costs
Values from Argonne Lab Report Scaling factor = 0.67/1

Turton book cost functions (I)
Politecnico di Torino 32
Blowers for air/biogas • Centrifugal Radial Fan, cost depending on the flow rate. • Material depending on the working temperature. • Pressure from a specific pressure drop analysis. • Scaling factor from Turton (0.6).
Water pumps • Reciprocating Pump, cost depending on the inlet power. • Material depending on the working temperature. • Pressure from a specific pressure drop analysis.
After burner • Furnace, cost depending on the heat duty. • Material depending on the working temperature. • Pressure from a specific pressure drop analysis.
The after-burner cost function is still under development => Looking for more proper functions not only depending on the heat duty.

Turton book cost functions (II)
Politecnico di Torino 33
Heat-exchangers • U values from literature ("Trasmissione del calore", Bonacina, Cavallini, Mattarolo, 1989)
• For Exchange Area < 10 m2 => Double Pipe HX • For Exchange Area > 10 m2 => Multiple Pipe HX
• Material depending on the working temperature T < 350 °C => CS 350 < T < 600 °C => SS T > 600 °C => Ni Alloy • Pressure from a specific pressure drop analysis.
The heat-exchanger cost function is still under development => Make a more detailed choice between the different heat-exchanger types.

NETL reports cost functions (I)
Politecnico di Torino 34
Reformer • Calculation of the catalyst volume from a reference value scaled on the CH4 converted
fraction.
• Calculation of the vessel volume as percentage of the catalyst volume.
• Calculation of the vessel cost using Turton book cost function for vessels.
ASU, Oxy-combustor and CO2 separation • Calculation of the component cost starting from NETL report cost scaled using specific
parameters (O2 flow rate, condenser size) • Fixed scaling factor = 0.67
These two cost functions are still under development => Looking deeply into the NETL cost functions and found proper reference costs and proper scaling factors.

Argonne Laboratory Report
Politecnico di Torino 35
Dionissios D. Papadias, Shabbir Ahmed, Romesh Kumar, "Fuel quality issues with biogas energy - An economic analysis for a stationary fuel cell system" - Energy 2012
Cost functions determined for all the cleaning system components, scaled on the biogas flow rate or contaminants ppm
Cleaning system components • Iron oxide • Chiller/condenser • Activated carbon • High temperature polisher
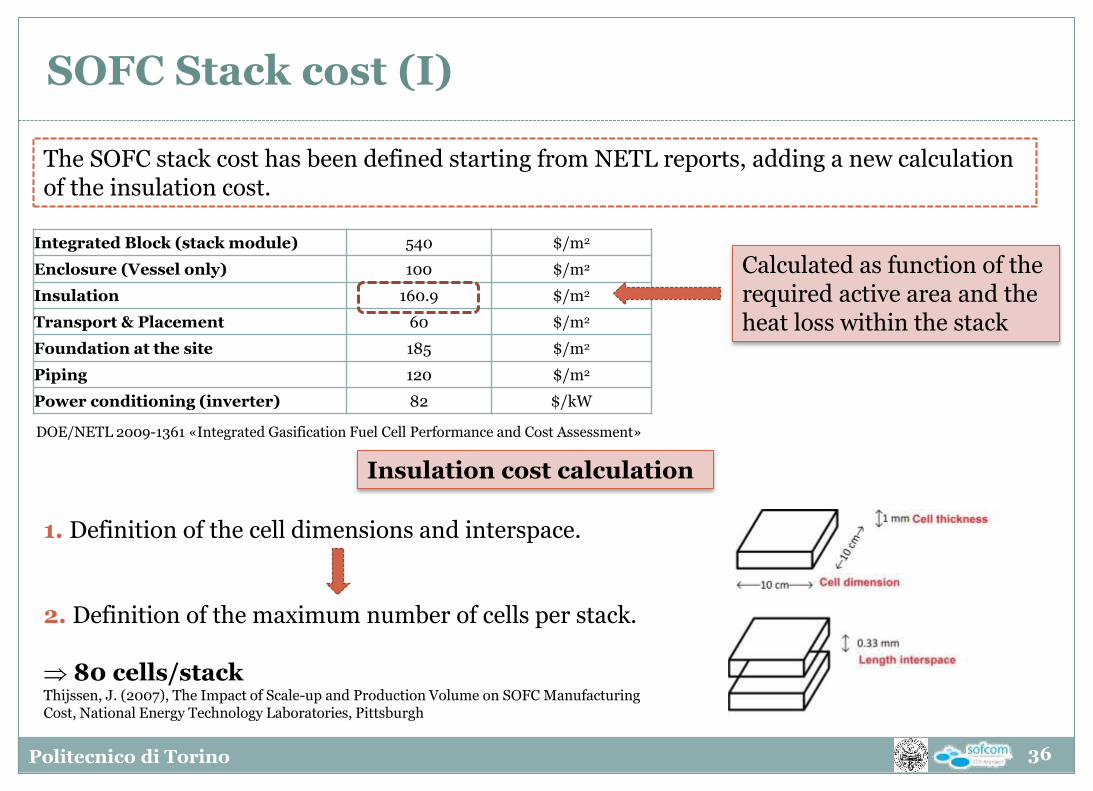
SOFC Stack cost (I)
Politecnico di Torino 36
Integrated Block (stack module) 540 $/m2
Enclosure (Vessel only) 100 $/m2
Insulation 160.9 $/m2
Transport & Placement 60 $/m2
Foundation at the site 185 $/m2
Piping 120 $/m2
Power conditioning (inverter) 82 $/kW
The SOFC stack cost has been defined starting from NETL reports, adding a new calculation of the insulation cost.
Calculated as function of the required active area and the heat loss within the stack
DOE/NETL 2009-1361 «Integrated Gasification Fuel Cell Performance and Cost Assessment»
1. Definition of the cell dimensions and interspace.
2. Definition of the maximum number of cells per stack. 80 cells/stack Thijssen, J. (2007), The Impact of Scale-up and Production Volume on SOFC Manufacturing Cost, National Energy Technology Laboratories, Pittsburgh
Insulation cost calculation

SOFC Stack cost (II)
Politecnico di Torino 37
3. Automatic definition of the stack configuration. S fixed depending on the number of stacks
(S=1,2,3) Fixed ratio H/L (2)
4. Calculation of the insulation area and volume.
5. Definition of the insulation material and cost => Commercial insulation material for high temp. => Standard cost (50$/l from Thjseen report)
6. Definition of the heat loss within the stack as % of the inlet LHV based power (0.5%)
Under development: Calculation of the heat loss as function of the stack external temperature.
7. Calculation of the insulation requirement (m3) and the insulation cost (160 $/m2)

Total Overnight Cost - TOC
Politecnico di Torino 38
Engineering, Procurement, Construction (EPC) Contractor Services
9% of BEC
Process contingencies 27.5% of EPCC
Project contingencies 22.5% of EPCC
Pre-production costs 2.0% of TPC
Inventory capital 0.5% of TPC
Financial costs 2.7% of TPC
Other owner's costs 15.0% of TPC
TASC/TOC factor 1.107
New concept 40 %
Produced commercially 5%
RESULTS
Medium scale plant • SOFC DC power output – 100 kWe • Vop – 0.8 V • FU – 80% • NO CCS • Steam reforming via anode recirculation (S/C = 2) • Internal refoming – 50%
"Cost Estimation Methodology for NETL Assessments of Power Plant Perfomance"

Bare Erected Cost [$ 2010]
Politecnico di Torino 39
BEC $ 366.626,87
EPCC $ 399.623,29
TPC $ 624.161,62
TOC $ 755.668,95
TASC $ 836.525,53 Other costs include: improvements to site, building & structures, inverter, instrumentations and controls.

The heat-exchanger network is ~ 50% of the BEC.
The high cost is due to the material factor: the high temperature of the streams brings to Ni Alloy HX (fuel pre-heater, air pre-heater, reformer heater).
Comments and future works
Politecnico di Torino 40
Subdivide the pre-heater in 2 steps HX => one at low temperature (SS) and one at high temperature (Ni Alloy).
The SOFC cost is quite low respect to the other components costs
This is because the cost function is taken from multi-MW power plants.
Include non-linear effect related to the SOFC size when analyzing smaller power plants.

Operating Costs
Politecnico di Torino 41
Variable/Operating costs
Catalyst Cost 44.58 $/y
Iron oxide cost 1880 $/y
Activated carbon cost 2036 $/y
High temperature Polisher cost
40.6 $/y
Biogas Cost 0.000 $/kW LHV
Maintenance Cost 12483 $/y
Labor Cost 22500 $/y
Scaled from NETL cost on the CH4 converted.
Scaled from Argonne Lab report on the biogas flow rate.
Under development: including in the plant cost the digester and its BoP cost to account for the cost of biogas or finding a proper cost per kW..
2% of TPC (NETL reports).
30% of a standard one-year salary (groos value 75000 $).

Financial hypothesis
Politecnico di Torino 42
• Capacity factor = 80%
• Tax rate depending on the country.
• Subsidy depending on the country and on the biogas substrate
• SOFC stack replacement period = 5 y
• Plant lifetime = 20 y
• Depreciation time = 10 y
• Inflation = 3%
• Discount rate (WACC) calculated on a initial investment 50% equity 50% debt.
Tax rates
Italy 31.4%
Germany 30.0%
Finland 24.5%
Switzerland 17.0%
Deloitte "Corporate tax rate 2012"
Country Italy Germany Finland
Subsidiy for biogas from WWTP [€/kWh]
0.111 0.0669 0.0835
Subsidy for biogas from biological products [€/kWh]
0.180 0.1401 0.0835
Bonus for CHP in case of biological products [€/kWh]
0.040 - -

Cash flow analysis - results
Politecnico di Torino 43
• Biogas from biological products brings to higher subsidies (and bonus for CHP)=> NPV > 0
• Biogas from WWTP should be considered only for higher size plant because of the high cost and low incentives => NPV < 0
• No convenience is related to Finland => NPV < 0
Italy (Biological substrate + CHP bonus)
Germany (Biological substrate + CHP bonus)
Italy WWTP
Germany WWTP
Finland WWTP
The subsidy is the price paid for the net electricity sold to the grid = LCOE

Small size => Electrochemical model
Medium size => Economic model
Large size => OSMOSE
SYSTEM ANALYSYS DEVELOPMENT
Politecnico di Torino 44

Large size plant
Politecnico di Torino 45
Use of the OSMOSE software developed by the EPFL, written as a MATLAB function.
OSMOSE will be able to: • Automatically run different Aspen Models. • Perform Energy Integration with the pinch analysis methodology and define
the HX network. • Perform the Economic Analysis for all the components with the same
methodology of the Excel Calculator => Updated cost functions developed by POLITO.
• Make Multi-Object-Optimization on lots of variables.
Federico Curletti master thesis

AspenPlus Model
Politecnico di Torino 46
• Simplified Aspen Model without any thermal integration (only cooler/heater).
• All calculators have to be written in Fortran => Development of a Fortran model shared with all the WP4 partners.

Parameter import in OSMOSE
Politecnico di Torino 47
All the input/output parameters of the model have been defined as «TAGS» in OSMOSE

Energy integration
Politecnico di Torino 48
• Definition of all the streams to be integrated using pinch analysis.
• Definition of hot and cold utilities to be used as external sources (CHP for district heating in our first study).

Sensitivity analysis and Economic analysis
Politecnico di Torino 49
Under development: • Sensitivity analysis and MOO have been performed using OSMOSE to study the
influence of all the parameters and optimize the layout. • The economic functions have been updated with new cost functions defined by
POLITO. • The cashflow analysis will be included as post-calculator in OSMOSE with the
methodology developed by POLITO.

WP4- EPFL contribution
Politecnico di Torino
50
Priscilla Caliandro Laurence Tock Adriano Viana Ensinas François Maréchal
3 gasifiers analysis
VIKING 2-stages gassification
PCFB Pressurized Circulating Fluidized Bed
FICFB Fast Internally Circulating Fluidized bed

Model Superstructure
Politecnico di Torino
51
Biomass composition
C 51.1% O 42.9% H 5.8% N 0.2% Φ 50%
Outlet humidity Φ 12-25%
Gasifier Temperature 850/ 800 /800 °C
Steam/biomass 0.3-0.9 Carbon conversion 82% /93% /99%
Temperatures 500 °C500 °C700 °C
Steam/carbon 1-2.3
SOFC
Temperature 750-850 °C FU 85%

Methodology
Politecnico di Torino 52
Performance indicators :
- Energy efficiency
- Total cost
𝐶𝑡𝑜𝑡= 𝐶𝑖𝑛𝑣𝑒𝑠𝑡𝑚𝑒𝑛𝑡 + 𝐶𝑜𝑝𝑒𝑟𝑎𝑡𝑖𝑣𝑒
Physical Model (BELSIM VALI)
Process simulation: •Mass and energy balance
Energy integration (risolutor MILP,GLPK)
Pinch analysis: •Maximal heat recovery •Optimal combined heat and power production
Performance evaluation
GLOBAL PROBLEM
MULTI-OBJECTIVE (OSMOSE)
Performance: •Technique (efficiency) •Economy (total cost)
MOO problem: •Evolutionary algorithm
•Optimal values of decision variables •Pareto frontier

Mechanical Power Balance
Politecnico di Torino 53
Small size 103kW - Medium size 8000kW
power consumption (-) power production (+)
Parameters Units FICFB_NP_S VKG_S FICFB_NP_M FICFB_P_M CFB_M
Energy efficiency % 60.0 54.0 59.5 62.4 68.5
Specific investment cost $/kWel 24246 32231 12258 10994 9125
Specific Cost (electricity output) $/kWh el 1.04 1.31 0.38 0.35 0.30

Cost analysis- Small (103 kWth) vs Medium(8000 kWth)
Politecnico di Torino 54
0
0,05
0,1
0,15
0,2
0,25
0,3
0,35
0,4
0
2000
4000
6000
8000
10000
12000
0 1 2 3 4 5 6
Specific investment cost [$/kWel]
Specific total cost [$/kWhel]
SOFC specificcost
SIC Systemspecificinvestmentcost
TCE total costrelated toelectricityproduction
0
0,2
0,4
0,6
0,8
1
0
5000
10000
15000
20000
25000
0 2 4 6
Specific investment cost [$/kWel]
Specific total cost [$/kWhel]
SOFC specificcost
SIC Systemspecificinvestment cost
TCE total costrelated toelectricityproduction
Base 100 1000 10000 50000 case sys/yr sys/yr sys/yr sys/yr
Base 100 1000 10000 50000 case sys/yr sys/yr sys/yr sys/yr
SOFC 65%
SOFC 44%
SOFC cost – sensitivity analysis
SMALL MEDIUM SOFC 65%
SOFC 44%

Multi-object-optmization
Politecnico di Torino 55
0
5
11
16
22
27
32
38
43
49
54
0,00
0,20
0,40
0,60
0,80
1,00
1,20
1,40
1,60
1,80
2,00
0,50 0,55 0,60 0,65 0,70 0,75
Medium system tot Investment cost [M$]
Efficiency (LHV basis)
Small system tot Investment cost [M$]
FICFB_NP_S VKG_S FICFB_NP_M CFB_M FICFB_P_M
Decision variables Range Unit
Humidity wood dryer outlet 10-25 %
Steam/biomass ratio 0.3-0.9 -
Steam to carbon ratio in the reformers 1-2.3 -
Fuel cell Inlet temperature 998 - 1123 K
Steam excess ratio in the post combustor 0.2 - 0.8 -

Optimized configurations
Politecnico di Torino 56
Small size Medium size
Parameters Unit FICFB_NP_S VKG_S FICFB_NP_M FICFB_P_M CFB_M
Humidity wood dryer outlet % 0.16 0.21 0.11 0.11 0.11
Steam/biomass ratio - 0.76 - 0.85 0.9 0.56
Steam to carbon ratio in the reformers
- 1 1.08 1.12 1.86 1
Fuel cell Inlet temperature K 1026 1023 101 1011 1022
Steam excess ratio in the post combustor
- 0.30 0.26 0.27 0.23 0.32
Energy efficiency [%] 64.5 68.7 65.6 67 71
Specific investment cost [$/kW] 22048 27196 11113 10280 9305
Specific Cost (electricity output) [$/kWh el] 1.03 1.10 0.35 0.33 0.30

Energy Integration
Politecnico di Torino 57
VKG_S
67%
FICFB_NP_S
64.5 %
FICFB_NP_M
68.7%
FICFB_P_M
65.6%
CFB_M
71%

Finalize the economic and financial methodology and share the excel instrument with all the partners in order to have comparable results between WP4 and WP5.
Detailed study of possible use of CO2 (downstream separation) such as photobioreactor with algae, electrochemical-assisted recovery and photo-catalytic cells.
Analysis of the possible scenario “upstream separation of CO2”.
Analysis of pressurized large size plants.
Pressurized plants will be coupled with Gas Turbine in order to increase the overall efficiency.
Deliverable 4.3 – «Optimal plant configurations for the ‘biogas+SOFC’ integration»
POLITO - FUTURE WORKS
Politecnico di Torino 58

Politecnico di Torino 59
Any question?
Massimo Santarelli Andrea Lanzini Marta Gandiglio