société d’investissement morgan stanley à capital variable ... · carnegie fund services s.a.,...
TRANSCRIPT

Morgan Stanley Investment Funds
Société d’Investissement à Capital Variable incorporated under the laws of Luxembourg
Semi-Annual ReportJune 30, 2016
INVESTMENT MANAGEMENT
R.C.S. Luxembourg: B-29. 192
UCITS DO NOT HAVE A GUARANTEED RETURN AND PAST PERFORMANCE DOES NOT GUARANTEE FUTURE RETURNS


Morgan Stanley Investment Funds 30 June 2016
Table of contents
1 Shareholders’ information
SCHEDULE OF INVESTMENTS
Equity Funds
2 Asia Opportunity Fund
5 Asian Equity Fund
8 Asia-Pacific Equity Fund
11 Asian Property Fund
13 Breakout Nations Fund
17 Emerging Europe, Middle East and Africa Equity Fund
19 Emerging Leaders Equity Fund
22 Emerging Markets Equity Fund
26 European Champions Fund
28 European Equity Alpha Fund
30 European Property Fund
33 Eurozone Equity Alpha Fund
35 Frontier Emerging Markets Equity Fund
38 Global Advantage Fund
40 Global Brands Fund
42 Global Brands Equity Income Fund
45 Global Discovery Fund
47 Global Infrastructure Fund
50 Global Opportunity Fund
53 Global Property Fund
57 Global Quality Fund
59 Indian Equity Fund
61 International Equity (ex US) Fund
64 Japanese Equity Fund
67 Latin American Equity Fund
69 US Advantage Fund
72 US Growth Fund
75 US Insight Fund
77 US Property Fund
Bond Funds
79 Absolute Return Fixed Income Fund
86 Asian Fixed Income Opportunities Fund
89 Emerging Markets Corporate Debt Fund
95 Emerging Markets Debt Fund
100 Emerging Markets Domestic Debt Fund
103 Emerging Markets Fixed Income Opportunities Fund
108 Euro Bond Fund
115 Euro Corporate Bond Fund
124 Euro Strategic Bond Fund
136 European Currencies High Yield Bond Fund
142 Global Bond Fund
151 Global Convertible Bond Fund
156 Global Credit Fund
164 Global Fixed Income Opportunities Fund
176 Global High Yield Bond Fund
183 Global Mortgage Securities Fund
192 Global Premier Credit Fund
196 Short Maturity Euro Bond Fund
202 US Dollar Corporate Bond Fund
208 US Dollar High Yield Bond Fund
213 US Dollar Short Duration Bond Fund
217 US Dollar Short Duration High Yield Bond Fund
Liquidity Funds
222 US Dollar Liquidity Fund
Asset Allocation Funds
223 Diversified Alpha Plus Fund
233 Diversified Alpha Plus Low Volatility Fund
239 Global Balanced Income Fund
248 Global Balanced Risk Control Fund of Funds
251 Global Multi-Asset Income Fund
Alternative Investment Funds
263 Liquid Alpha Capture Fund
266 Liquid Alternatives Fund
STATEMENTS AND NOTES
270 Statement of assets and liabilities
285 Statement of changes in number of shares
295 Statement of operations and changes in net assets
310 Statement of share and net assets statistics
322 Notes to the financial statements
OTHER INFORMATION
338 Directors and service providers
340 Paying and information agents
341 Appendix 1: Fund expense ratios (unaudited)
346 Appendix 2: Portfolio turnover rate (unaudited)
347 Appendix 3: Sub-Advisers
349 Appendix 4: Hedged Share Classes

1 Morgan Stanley Investment Funds 30 June 2016
The annual general meeting of shareholders of Morgan Stanley Investment Funds (the “Company”) is held at the registered office of the Company and will be held on the second Tuesday of the month of May at 10.30 am, or if such day is not a bank business day on the following bank business day.
Notices of all general meetings are sent by mail to all registered shareholders at their registered address at least 8 days prior to the meeting. Such notices will indicate the time and place of the meeting as well as the conditions of admission thereto. Said notices will also contain the agenda and requirements of Luxembourg law with regard to the necessary quorum and majorities at the meeting. To the extent required by law, further notices will be published in the Mémorial and in one Luxembourg newspaper.
Audited financial statements in respect of the preceding financial period are made available at the registered office of the Company and are available to shareholders upon request. In addition, unaudited semi-annual reports are also made available at the registered office.
The annual and semi-annual reports are also available on the Company’s web-site (www.morganstanleyinvestmentfunds.com).
The Company’s financial year end is 31 December.
Any other notices relevant to the Company are also published in a Luxembourg newspaper or mailed to affected shareholders.
The net asset value per share of each Class of Share is available on each dealing day during Luxembourg business hours at the registered office of the Company. Net asset value per share information is also available from market information providers, such as Bloomberg and Morningstar, as well as being available at www.morganstanleyinvestmentfunds.com.
No subscriptions can be received on the basis of financial reports alone. Subscriptions are only valid if made on the basis of the current prospectus and the latest Key Investor Information Document.
Carnegie Fund Services S.A., 11, rue du Général-Dufour, 1204 Geneva, web: carnegie-fund-services-ch, is the representative in Switzerland and Banque Cantonale de Genève, 17, quai de l’Ile, 1204 Geneva is the paying agent in Switzerland. The Prospectus, the latest Key Investor Information Document, the Articles and the annual and semi-annual reports of the Company may be obtained free of charge from the representative in Switzerland.
The net asset value per share of each Class of Share is available on www.fundinfo.com.
A list of purchases and sales (securities transactions) carried out by the Company during the reporting period may be obtained free of charge from the representative in Switzerland.
The investment objectives set out in this annual report are summaries only. The complete investment objectives and policies for each Fund are set out in the Company’s current prospectus.
Shareholders’ information

Morgan Stanley Investment Funds 30 June 2016 2
The accompanying notes are an integral part of these financial statements.
Please refer to the full prospectus for the Fund’s investment objective and policy.
Asia Opportunity Fund*
SCHEDULE OF INVESTMENTSAs at 30 June 2016
Investments Currency
Quantity/Nominal
Value
Market Value USD
% of Net Assets
Transferable securities and money market instruments admitted to official exchange listing or dealt in on another regulated market
Equities
China58.com, Inc., ADR (Cayman Islands) (2) USD 10,276 476,909 2.11Autohome, Inc., ADR (Cayman Islands) (2) USD 4,345 88,942 0.39China Resources Beer Holdings Co. Ltd.
(Hong Kong) (2) HKD 490,000 1,067,290 4.73Ctrip.com International Ltd., ADR
(Cayman Islands) (2) USD 15,446 630,506 2.79Phoenix Healthcare Group Co. Ltd.
(Cayman Islands) (2) HKD 483,500 668,023 2.96Shenzhou International Group Holdings Ltd.
(Cayman Islands) (2) HKD 91,000 439,231 1.94TAL Education Group, ADR
(Cayman Islands) (2) USD 37,742 2,267,162 10.04Tencent Holdings Ltd. (Cayman Islands) (2) HKD 84,800 1,924,665 8.52
7,562,728 33.48
Hong KongAIA Group Ltd. HKD 184,600 1,102,761 4.88
1,102,761 4.88
IndiaHDFC Bank Ltd., ADR USD 17,561 1,148,314 5.08
1,148,314 5.08
PhilippinesUniversal Robina Corp. PHP 108,480 479,134 2.12
479,134 2.12
South KoreaAmorepacific Corp. KRW 2,814 1,054,660 4.67Loen Entertainment, Inc. KRW 6,677 424,522 1.88Medy-Tox, Inc. KRW 2,731 1,023,315 4.53Osstem Implant Co. Ltd. KRW 8,425 570,785 2.53ViroMed Co. Ltd. KRW 1,388 170,590 0.75
3,243,872 14.36
TaiwanTaiwan Semiconductor Manufacturing
Co. Ltd., ADR USD 19,438 503,833 2.23Taiwan Semiconductor Manufacturing
Co. Ltd. TWD 34,000 171,243 0.76
675,076 2.99
United States of AmericaCognizant Technology Solutions Corp. ‘A’ USD 25,434 1,452,790 6.43
1,452,790 6.43
Total Equities 15,664,675 69.34
* Fund commenced operations on 31 March 2016.
INVESTMENT AIM
To seek long-term appreciation, measured in US Dollars through investment primarily in equity securities, including depositary receipts (including American Depositary Receipts (ADRs), Global Depositary Receipts (GDRs)), of issuers located in Asia, excluding Japan.
SCHEDULE of investmentsEquity Funds
3 Morgan Stanley Investment Funds 30 June 2016
The accompanying notes are an integral part of these financial statements.
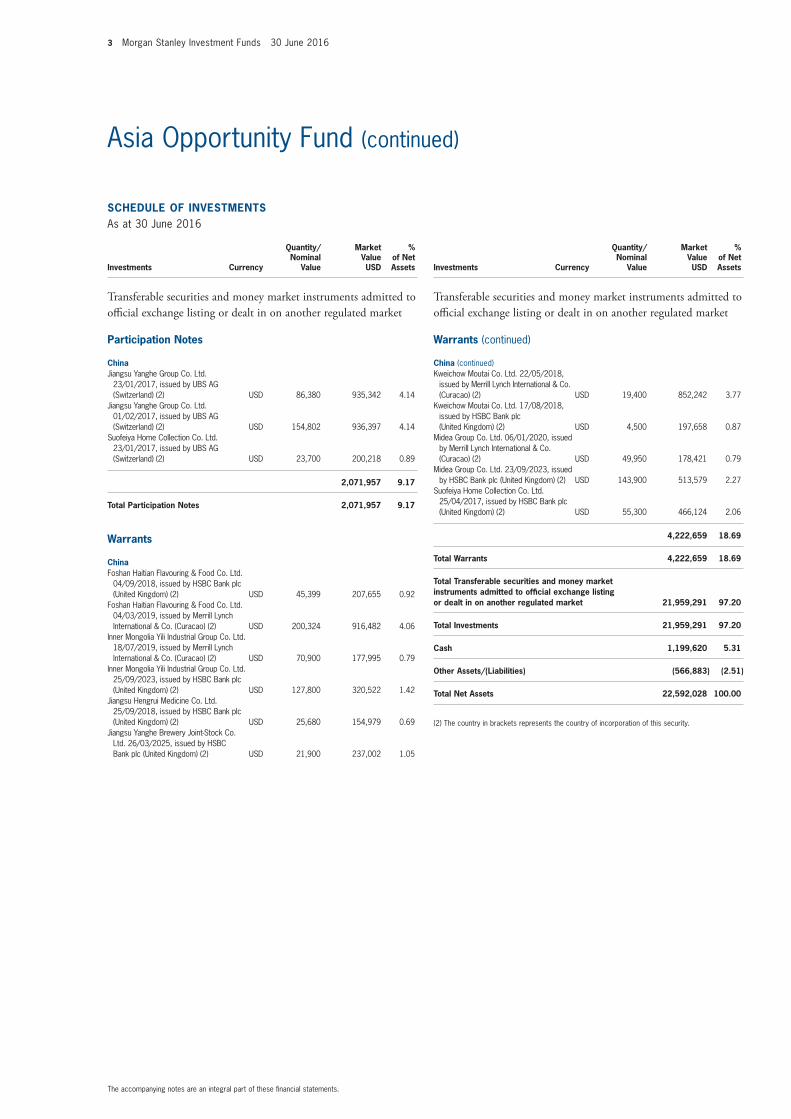
Asia Opportunity Fund (continued)
SCHEDULE OF INVESTMENTSAs at 30 June 2016
Investments Currency
Quantity/Nominal
Value
Market Value USD
% of Net Assets
Transferable securities and money market instruments admitted to official exchange listing or dealt in on another regulated market
Participation Notes
ChinaJiangsu Yanghe Group Co. Ltd.
23/01/2017, issued by UBS AG (Switzerland) (2) USD 86,380 935,342 4.14
Jiangsu Yanghe Group Co. Ltd. 01/02/2017, issued by UBS AG (Switzerland) (2) USD 154,802 936,397 4.14
Suofeiya Home Collection Co. Ltd. 23/01/2017, issued by UBS AG (Switzerland) (2) USD 23,700 200,218 0.89
2,071,957 9.17
Total Participation Notes 2,071,957 9.17
Warrants
ChinaFoshan Haitian Flavouring & Food Co. Ltd.
04/09/2018, issued by HSBC Bank plc (United Kingdom) (2) USD 45,399 207,655 0.92
Foshan Haitian Flavouring & Food Co. Ltd. 04/03/2019, issued by Merrill Lynch International & Co. (Curacao) (2) USD 200,324 916,482 4.06
Inner Mongolia Yili Industrial Group Co. Ltd. 18/07/2019, issued by Merrill Lynch International & Co. (Curacao) (2) USD 70,900 177,995 0.79
Inner Mongolia Yili Industrial Group Co. Ltd. 25/09/2023, issued by HSBC Bank plc (United Kingdom) (2) USD 127,800 320,522 1.42
Jiangsu Hengrui Medicine Co. Ltd. 25/09/2018, issued by HSBC Bank plc (United Kingdom) (2) USD 25,680 154,979 0.69
Jiangsu Yanghe Brewery Joint-Stock Co. Ltd. 26/03/2025, issued by HSBC Bank plc (United Kingdom) (2) USD 21,900 237,002 1.05
SCHEDULE OF INVESTMENTSAs at 30 June 2016
Investments Currency
Quantity/Nominal
Value
Market Value USD
% of Net Assets
Transferable securities and money market instruments admitted to official exchange listing or dealt in on another regulated market
Warrants (continued)
China (continued)Kweichow Moutai Co. Ltd. 22/05/2018,
issued by Merrill Lynch International & Co. (Curacao) (2) USD 19,400 852,242 3.77
Kweichow Moutai Co. Ltd. 17/08/2018, issued by HSBC Bank plc (United Kingdom) (2) USD 4,500 197,658 0.87
Midea Group Co. Ltd. 06/01/2020, issued by Merrill Lynch International & Co. (Curacao) (2) USD 49,950 178,421 0.79
Midea Group Co. Ltd. 23/09/2023, issued by HSBC Bank plc (United Kingdom) (2) USD 143,900 513,579 2.27
Suofeiya Home Collection Co. Ltd. 25/04/2017, issued by HSBC Bank plc (United Kingdom) (2) USD 55,300 466,124 2.06
4,222,659 18.69
Total Warrants 4,222,659 18.69
Total Transferable securities and money market instruments admitted to official exchange listing or dealt in on another regulated market 21,959,291 97.20
Total Investments 21,959,291 97.20
Cash 1,199,620 5.31
Other Assets/(Liabilities) (566,883) (2.51)
Total Net Assets 22,592,028 100.00
(2) The country in brackets represents the country of incorporation of this security.
Morgan Stanley Investment Funds 30 June 2016 4
The accompanying notes are an integral part of these financial statements.
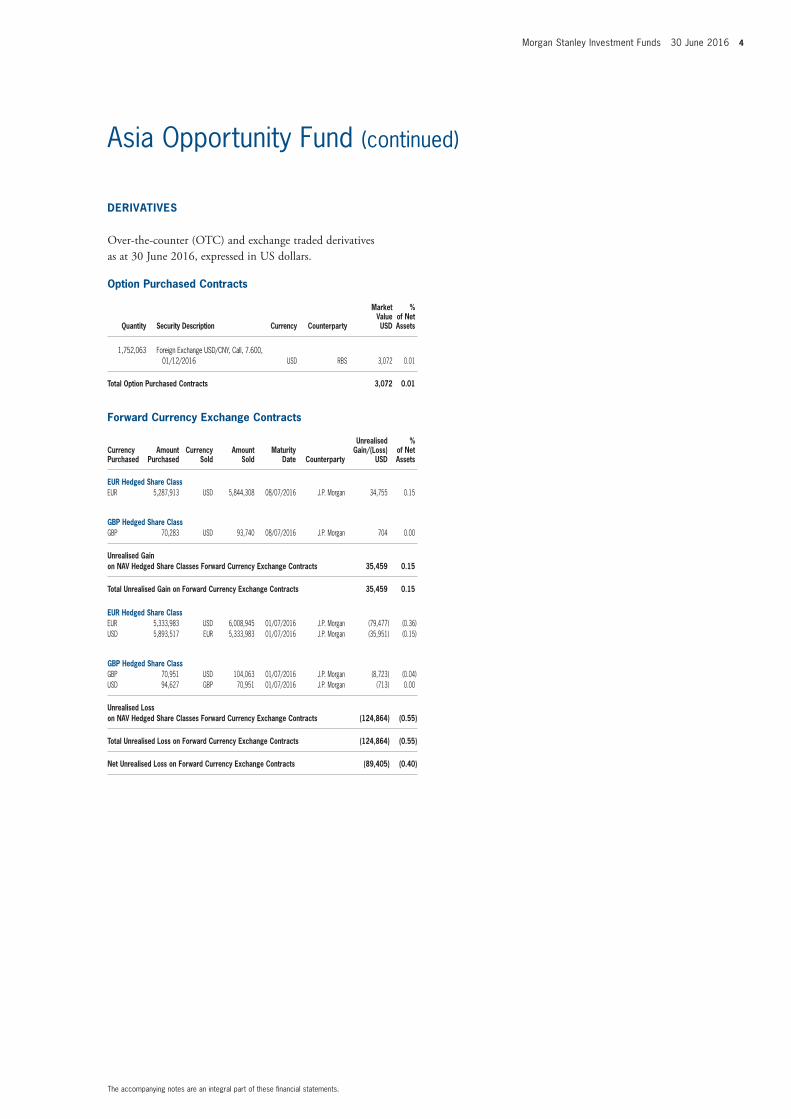
Asia Opportunity Fund (continued)
Option Purchased Contracts
Quantity Security Description Currency Counterparty
Market Value USD
% of Net Assets
1,752,063 Foreign Exchange USD/CNY, Call, 7.600, 01/12/2016 USD RBS 3,072 0.01
Total Option Purchased Contracts 3,072 0.01
Forward Currency Exchange Contracts
Currency Purchased
Amount Purchased
Currency Sold
Amount Sold
Maturity Date Counterparty
Unrealised Gain/(Loss)
USD
% of Net Assets
EUR Hedged Share ClassEUR 5,287,913 USD 5,844,308 08/07/2016 J.P. Morgan 34,755 0.15
GBP Hedged Share ClassGBP 70,283 USD 93,740 08/07/2016 J.P. Morgan 704 0.00
Unrealised Gain on NAV Hedged Share Classes Forward Currency Exchange Contracts 35,459 0.15
Total Unrealised Gain on Forward Currency Exchange Contracts 35,459 0.15
EUR Hedged Share ClassEUR 5,333,983 USD 6,008,945 01/07/2016 J.P. Morgan (79,477) (0.36)USD 5,893,517 EUR 5,333,983 01/07/2016 J.P. Morgan (35,951) (0.15)
GBP Hedged Share ClassGBP 70,951 USD 104,063 01/07/2016 J.P. Morgan (8,723) (0.04)USD 94,627 GBP 70,951 01/07/2016 J.P. Morgan (713) 0.00
Unrealised Loss on NAV Hedged Share Classes Forward Currency Exchange Contracts (124,864) (0.55)
Total Unrealised Loss on Forward Currency Exchange Contracts (124,864) (0.55)
Net Unrealised Loss on Forward Currency Exchange Contracts (89,405) (0.40)
DERIVATIVES
Over-the-counter (OTC) and exchange traded derivatives as at 30 June 2016, expressed in US dollars.

5 Morgan Stanley Investment Funds 30 June 2016
The accompanying notes are an integral part of these financial statements.
Please refer to the full prospectus for the Fund’s investment objective and policy.
Asian Equity Fund
INVESTMENT AIM
To seek long-term capital appreciation, measured in US dollars, through investment primarily in the equity securities of companies domiciled in or exercising the predominant part of their economic activity in Asia, excluding Japan, thereby taking advantage of the dynamic economic growth capabilities of the region.
SCHEDULE OF INVESTMENTSAs at 30 June 2016
Investments Currency
Quantity/Nominal
Value
Market Value USD
% of Net Assets
Transferable securities and money market instruments admitted to official exchange listing or dealt in on another regulated market
Equities
ChinaAlibaba Group Holding Ltd., ADR
(Cayman Islands) (1) (2) USD 55,843 4,395,961 1.79Bank of China Ltd. ‘H’ HKD 13,015,000 5,183,254 2.11China Construction Bank Corp. ‘H’ HKD 10,081,400 6,652,588 2.70China Machinery Engineering Corp. ‘H’ HKD 1,292,000 837,588 0.34China Mengniu Dairy Co. Ltd.
(Cayman Islands) (1) (2) HKD 757,000 1,315,181 0.53China Mobile Ltd. (Hong Kong) (2) HKD 780,500 8,917,672 3.62China Overseas Land & Investment Ltd.
(Hong Kong) (2) HKD 676,000 2,134,581 0.87China Pacific Insurance Group Co. Ltd. ‘H’ HKD 960,400 3,230,669 1.31China Taiping Insurance Holdings Co. Ltd.
(Hong Kong) (2) HKD 528,800 984,144 0.40China Unicom Hong Kong Ltd.
(Hong Kong) (2) HKD 1,676,000 1,732,400 0.70Chongqing Changan Automobile Co. Ltd. ‘B’ HKD 362,179 504,135 0.21CRCC High-Tech Equipment Corp. Ltd. ‘H’ HKD 1,085,000 471,259 0.19CSPC Pharmaceutical Group Ltd.
(Hong Kong) (2) HKD 238,000 211,654 0.09Huadian Power International Corp. Ltd. ‘H’ HKD 1,742,000 828,465 0.34JD.com, Inc., ADR (Cayman Islands) (2) USD 91,765 1,872,924 0.76NetEase, Inc., ADR (Cayman Islands) (2) USD 6,080 1,148,998 0.47New Oriental Education & Technology
Group, Inc., ADR (Cayman Islands) (2) USD 21,831 912,099 0.37Shanghai Jin Jiang International Hotels
Group Co. Ltd. ‘H’ HKD 1,734,000 565,418 0.23Shenzhen International Holdings Ltd.
(Bermuda) (1) (2) HKD 771,500 1,113,663 0.45Shenzhou International Group Holdings Ltd.
(Cayman Islands) (1) (2) HKD 402,000 1,940,340 0.79TAL Education Group, ADR
(Cayman Islands) (2) USD 23,300 1,399,631 0.57Tencent Holdings Ltd. (Cayman Islands) (2) HKD 739,600 16,786,343 6.82
63,138,967 25.66
Hong KongAIA Group Ltd. HKD 1,158,400 6,920,032 2.81BOC Hong Kong Holdings Ltd. (1) HKD 1,327,500 3,969,377 1.62Cheung Kong Property Holdings Ltd.
(Cayman Islands) (1) (2) HKD 537,184 3,350,952 1.36CK Hutchison Holdings Ltd.
(Cayman Islands) (2) HKD 537,184 5,853,782 2.38HKT Trust & HKT Ltd. Stapled Security HKD 1,438,600 2,072,916 0.84Hong Kong Exchanges and Clearing Ltd. (1) HKD 78,400 1,895,609 0.77Power Assets Holdings Ltd. HKD 48,000 439,547 0.18Samsonite International SA
(Luxembourg) (2) HKD 249,300 689,207 0.28
25,191,422 10.24
IndiaAshok Leyland Ltd. INR 2,425,416 3,532,613 1.43Bharat Financial Inclusion Ltd INR 85,081 934,033 0.38Bharat Petroleum Corp. Ltd. INR 162,216 2,575,637 1.05Gateway Distriparks Ltd. INR 299,396 1,371,834 0.56Glenmark Pharmaceuticals Ltd. INR 88,658 1,049,125 0.43HDFC Bank Ltd., ADR USD 46,400 3,034,096 1.23IndusInd Bank Ltd. INR 196,999 3,243,008 1.32Inox Leisure Ltd. INR 304,688 1,088,349 0.44Larsen & Toubro Ltd., GDR USD 133,542 2,931,247 1.19Marico Ltd. INR 535,115 2,088,949 0.85Maruti Suzuki India Ltd. INR 39,941 2,476,726 1.01

Morgan Stanley Investment Funds 30 June 2016 6
The accompanying notes are an integral part of these financial statements.
Asian Equity Fund (continued)
SCHEDULE OF INVESTMENTSAs at 30 June 2016
Investments Currency
Quantity/Nominal
Value
Market Value USD
% of Net Assets
Transferable securities and money market instruments admitted to official exchange listing or dealt in on another regulated market
Equities (continued)
India (continued)Shree Cement Ltd. INR 14,976 3,226,177 1.31Shriram Transport Finance Co. Ltd. INR 190,926 3,404,011 1.38Zee Entertainment Enterprises Ltd. INR 230,557 1,558,671 0.63
32,514,476 13.21
IndonesiaBank Mandiri Persero Tbk. PT IDR 102,200 73,674 0.03Bank Negara Indonesia Persero Tbk. PT IDR 4,608,200 1,813,565 0.74Bumi Serpong Damai Tbk. PT IDR 9,489,600 1,515,406 0.62Jasa Marga Persero Tbk. PT IDR 2,367,000 944,973 0.38Link Net Tbk. PT IDR 4,021,200 1,235,607 0.50Matahari Department Store Tbk. PT IDR 1,587,000 2,402,180 0.98Semen Indonesia Persero Tbk. PT IDR 157,100 111,170 0.05Surya Citra Media Tbk. PT IDR 6,020,000 1,503,519 0.61United Tractors Tbk. PT IDR 1,042,900 1,168,161 0.47XL Axiata Tbk. PT IDR 8,331,575 2,314,151 0.94
13,082,406 5.32
PhilippinesAyala Corp. PHP 96,118 1,732,831 0.70BDO Unibank, Inc. PHP 387,470 921,509 0.37DMCI Holdings, Inc. PHP 4,478,400 1,198,221 0.49International Container Terminal
Services, Inc. PHP 573,400 748,818 0.30Metro Pacific Investments Corp. PHP 7,708,800 1,140,941 0.46Metropolitan Bank & Trust Co. PHP 647,613 1,242,474 0.51SM Investments Corp. PHP 55,730 1,144,351 0.47
8,129,145 3.30
SingaporeJardine Cycle & Carriage Ltd. (1) SGD 108,600 2,941,211 1.20Keppel Infrastructure Trust (1) SGD 4,877,414 1,791,424 0.73Raffles Medical Group Ltd. (1) SGD 754,944 845,854 0.34Singapore Post Ltd. (1) SGD 1,175,700 1,282,382 0.52
6,860,871 2.79
South KoreaAmorepacific Corp. (1) KRW 10,749 4,028,623 1.64CJ CheilJedang Corp. KRW 2,087 704,241 0.29CJ Corp. KRW 6,165 1,081,664 0.44Cosmax, Inc. (1) KRW 5,252 777,780 0.32Coway Co. Ltd. KRW 20,530 1,863,429 0.76Hotel Shilla Co. Ltd. KRW 14,003 825,845 0.34Hugel, Inc. (1) KRW 2,460 679,256 0.28Hyundai Development Co-Engineering
& Construction KRW 58,453 2,007,988 0.82Hyundai Wia Corp. (1) KRW 11,711 906,316 0.37Innocean Worldwide, Inc. KRW 19,292 1,358,957 0.55Kia Motors Corp. KRW 49,423 1,854,473 0.75Korea Aerospace Industries Ltd. KRW 34,593 2,199,414 0.89Korea Electric Power Corp. KRW 37,799 1,983,010 0.81LG Chem Ltd. KRW 9,940 2,244,747 0.91Mando Corp. KRW 4,197 792,877 0.32NAVER Corp. KRW 7,037 4,339,639 1.76Nexon Co. Ltd. (Japan) (2) JPY 94,300 1,382,663 0.56Samsung Electronics Co. Ltd. Preference KRW 4,294 4,412,193 1.79
SCHEDULE OF INVESTMENTSAs at 30 June 2016
Investments Currency
Quantity/Nominal
Value
Market Value USD
% of Net Assets
Transferable securities and money market instruments admitted to official exchange listing or dealt in on another regulated market
Equities (continued)
South Korea (continued)Samsung Electronics Co. Ltd. KRW 8,001 9,903,002 4.02Samsung Fire & Marine Insurance Co. Ltd. KRW 5,468 1,251,460 0.51SK Holdings Co. Ltd. KRW 18,939 3,331,116 1.35
47,928,693 19.48
TaiwanAdvanced Semiconductor Engineering, Inc. TWD 2,152,554 2,445,174 0.99Catcher Technology Co. Ltd. TWD 327,000 2,407,095 0.98Chailease Holding Co. Ltd.
(Cayman Islands) (2) TWD 178,156 287,687 0.12Delta Electronics, Inc. TWD 436,701 2,111,498 0.86E.Sun Financial Holding Co. Ltd. TWD 2,046,000 1,204,872 0.49Eclat Textile Co. Ltd. TWD 198,486 1,910,176 0.78Formosa Plastics Corp. TWD 724,000 1,745,822 0.71Fubon Financial Holding Co. Ltd. TWD 856,710 999,725 0.41Hermes Microvision, Inc. TWD 24,436 995,950 0.40Hon Hai Precision Industry Co. Ltd. TWD 1,492,588 3,816,592 1.55PChome Online, Inc. TWD 139,000 1,525,105 0.62Pegatron Corp. TWD 946,922 1,989,875 0.81President Chain Store Corp. TWD 111,000 863,532 0.35Taiwan Mobile Co. Ltd. TWD 409,000 1,426,125 0.58Taiwan Semiconductor Manufacturing
Co. Ltd. TWD 1,778,362 8,956,850 3.64Uni-President Enterprises Corp. TWD 1,464,187 2,881,722 1.17Yeong Guan Energy Technology Group
Co. Ltd. (Cayman Islands) (2) TWD 184,000 1,163,402 0.47
36,731,202 14.93
ThailandCentral Pattana PCL THB 490,400 834,156 0.34Kasikornbank PCL, NVDR (1) THB 358,600 1,735,474 0.71Land & Houses PCL (1) THB 1,832,767 472,188 0.19Land & Houses PCL, NVDR THB 703,300 181,196 0.07Minor International PCL THB 1,376,430 1,577,172 0.64Sino-Thai Engineering & Construction PCL THB 41,300 27,982 0.01
4,828,168 1.96
United States of AmericaNien Made Enterprise Co. Ltd. (Taiwan) (2) TWD 176,000 1,598,314 0.65
1,598,314 0.65
Total Equities 240,003,664 97.54
Total Transferable securities and money market instruments admitted to official exchange listing or dealt in on another regulated market 240,003,664 97.54

7 Morgan Stanley Investment Funds 30 June 2016
The accompanying notes are an integral part of these financial statements.
Asian Equity Fund (continued)
SCHEDULE OF INVESTMENTSAs at 30 June 2016
Investments Currency
Quantity/Nominal
Value
Market Value USD
% of Net Assets
Units of authorised UCITS or other collective investment undertakings
Collective Investment Schemes – UCITS
LuxembourgMorgan Stanley Liquidity Funds US Dollar
Liquidity Fund – MS Reserve (4) USD 603,103 603,103 0.24
603,103 0.24
Total Collective Investment Schemes – UCITS 603,103 0.24
Total Units of authorised UCITS or other collective investment undertakings 603,103 0.24
Total Investments 240,606,767 97.78
Cash 2,190,074 0.89
Other Assets/(Liabilities) 3,258,446 1.33
Total Net Assets 246,055,287 100.00
(1) All or part of this position is out on loan.(2) The country in brackets represents the country of incorporation of this security.(4) Affiliate managed by an affiliate of the Investment Adviser.

Morgan Stanley Investment Funds 30 June 2016 8
The accompanying notes are an integral part of these financial statements.
Please refer to the full prospectus for the Fund’s investment objective and policy.
INVESTMENT AIM
To seek long-term capital appreciation, measured in US dollars, through investment primarily in the equity securities of companies domiciled in or exercising the predominant part of their economic activity in the Asia-Pacific region, excluding Japan, thereby taking advantage of the dynamic economic growth capabilities of the region.
SCHEDULE OF INVESTMENTSAs at 30 June 2016
Investments Currency
Quantity/Nominal
Value
Market Value USD
% of Net Assets
Transferable securities and money market instruments admitted to official exchange listing or dealt in on another regulated market
Equities
AustraliaASX Ltd. AUD 36,010 1,225,350 1.06Boral Ltd. AUD 245,290 1,134,544 0.98Brambles Ltd. AUD 138,925 1,279,979 1.10Commonwealth Bank of Australia (1) AUD 53,329 2,949,254 2.54CSL Ltd. AUD 14,413 1,202,322 1.04LendLease Group Stapled Security AUD 151,572 1,420,171 1.22Mirvac Group, REIT AUD 548,639 824,117 0.71QBE Insurance Group Ltd. AUD 141,969 1,101,105 0.95ResMed, Inc., CDI
(United States of America) (2) AUD 340,799 2,103,427 1.81Santos Ltd. AUD 300,643 1,037,338 0.89Tabcorp Holdings Ltd. AUD 588,056 1,998,416 1.72Westpac Banking Corp. AUD 90,771 1,984,474 1.71Woolworths Ltd. AUD 60,711 943,098 0.81
19,203,595 16.54
ChinaAlibaba Group Holding Ltd., ADR
(Cayman Islands) (2) USD 20,751 1,633,519 1.41Bank of China Ltd. ‘H’ HKD 4,452,000 1,773,019 1.53China Construction Bank Corp. ‘H’ HKD 3,941,000 2,600,616 2.24China Machinery Engineering Corp. ‘H’ HKD 418,000 270,984 0.23China Mengniu Dairy Co. Ltd.
(Cayman Islands) (1) (2) HKD 214,000 371,795 0.32China Mobile Ltd. (Hong Kong) (2) HKD 291,500 3,330,559 2.87China Overseas Land & Investment Ltd.
(Hong Kong) (2) HKD 246,000 776,785 0.67China Pacific Insurance Group Co. Ltd. ‘H’ HKD 344,400 1,158,520 1.00China Taiping Insurance Holdings Co. Ltd.
(Hong Kong) (2) HKD 201,800 375,568 0.32China Unicom Hong Kong Ltd.
(Hong Kong) (2) HKD 568,000 587,114 0.51Chongqing Changan Automobile Co. Ltd. ‘B’ HKD 146,600 204,060 0.18CRCC High-Tech Equipment Corp. Ltd. ‘H’ (1) HKD 650,500 282,538 0.24CSPC Pharmaceutical Group Ltd.
(Hong Kong) (2) HKD 526,000 467,773 0.40Huadian Power International Corp. Ltd. ‘H’ HKD 496,000 235,889 0.20JD.com, Inc., ADR (Cayman Islands) (2) USD 29,881 609,871 0.53NetEase, Inc., ADR (Cayman Islands) (2) USD 2,331 440,512 0.38New Oriental Education & Technology
Group, Inc., ADR (Cayman Islands) (2) USD 8,092 338,084 0.29Shanghai Jin Jiang International Hotels
Group Co. Ltd. ‘H’ HKD 614,000 200,211 0.17Shenzhen International Holdings Ltd.
(Bermuda) (1) (2) HKD 216,000 311,797 0.27Shenzhou International Group Holdings Ltd.
(Cayman Islands) (1) (2) HKD 116,000 559,899 0.48TAL Education Group, ADR
(Cayman Islands) (2) USD 8,945 537,326 0.46Tencent Holdings Ltd. (Cayman Islands) (2) HKD 290,900 6,602,417 5.69
23,668,856 20.39
Hong KongAIA Group Ltd. HKD 363,000 2,168,484 1.87BOC Hong Kong Holdings Ltd. HKD 454,500 1,359,007 1.17Cheung Kong Property Holdings Ltd.
(Cayman Islands) (1) (2) HKD 200,964 1,253,613 1.08CK Hutchison Holdings Ltd.
(Cayman Islands) (2) HKD 200,964 2,189,938 1.89HKT Trust & HKT Ltd. Stapled Security HKD 524,760 756,140 0.65Hong Kong Exchanges and Clearing Ltd. (1) HKD 31,000 749,539 0.64
Asia-Pacific Equity Fund

9 Morgan Stanley Investment Funds 30 June 2016
The accompanying notes are an integral part of these financial statements.
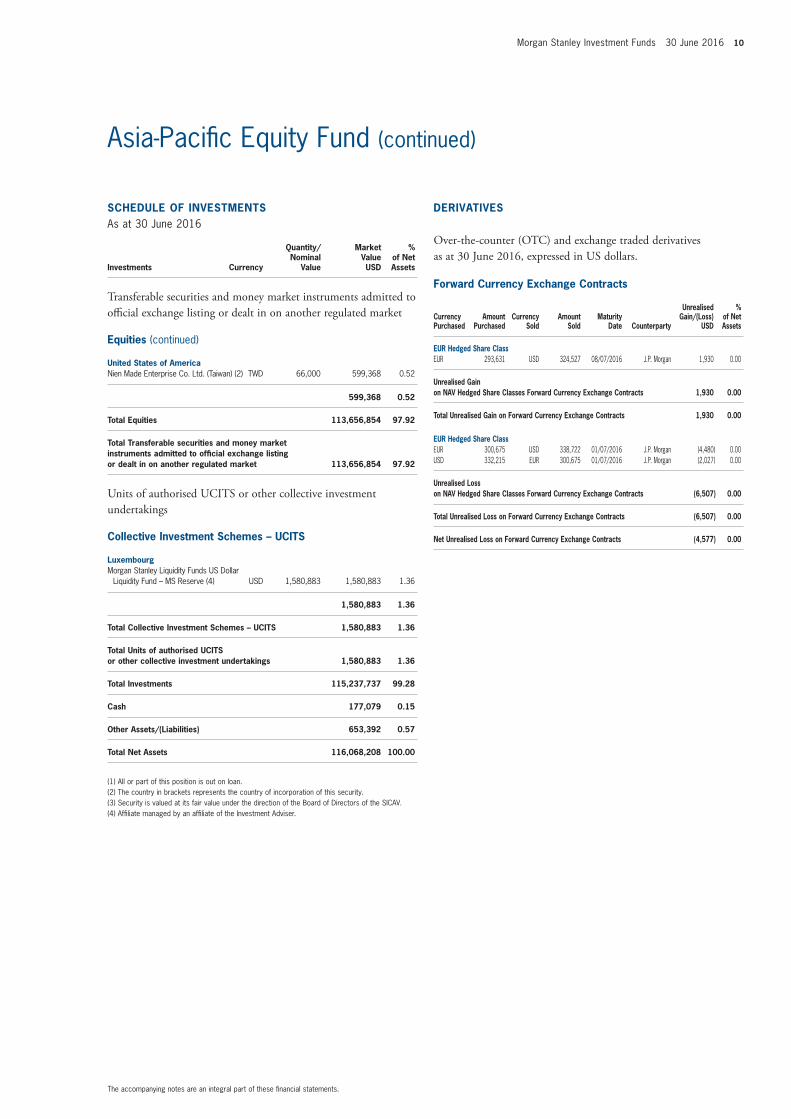
Asia-Pacific Equity Fund (continued)
SCHEDULE OF INVESTMENTSAs at 30 June 2016
Investments Currency
Quantity/Nominal
Value
Market Value USD
% of Net Assets
Transferable securities and money market instruments admitted to official exchange listing or dealt in on another regulated market
Equities (continued)
Hong Kong (continued)Power Assets Holdings Ltd. HKD 16,000 146,516 0.13Samsonite International SA
(Luxembourg) (1) (2) HKD 280,800 776,290 0.67
9,399,527 8.10
IndiaAshok Leyland Ltd. INR 951,653 1,386,080 1.19Bharat Financial Inclusion Ltd INR 29,533 324,218 0.28Bharat Petroleum Corp. Ltd. INR 58,631 930,933 0.80Gateway Distriparks Ltd. INR 136,680 626,269 0.54Glenmark Pharmaceuticals Ltd. INR 40,026 473,643 0.41HDFC Bank Ltd. (3) INR 4,544 91,779 0.08HDFC Bank Ltd., ADR USD 16,325 1,067,492 0.92IndusInd Bank Ltd. INR 75,467 1,242,341 1.07Inox Leisure Ltd. INR 141,405 505,100 0.44Larsen & Toubro Ltd. INR 50,990 1,130,049 0.97Marico Ltd. INR 191,029 745,727 0.64Maruti Suzuki India Ltd. INR 15,044 932,873 0.80Shree Cement Ltd. INR 5,728 1,233,944 1.06Shriram Transport Finance Co. Ltd. INR 71,380 1,272,631 1.10Zee Entertainment Enterprises Ltd. INR 81,767 552,782 0.48
12,515,861 10.78
IndonesiaBank Mandiri Persero Tbk. PT IDR 46,200 33,305 0.03Bank Negara Indonesia Persero Tbk. PT IDR 1,561,400 614,492 0.53Bumi Serpong Damai Tbk. PT IDR 3,670,400 586,131 0.51Jasa Marga Persero Tbk. PT IDR 824,600 329,203 0.28Link Net Tbk. PT IDR 1,341,100 412,084 0.36Matahari Department Store Tbk. PT IDR 546,500 827,216 0.71Semen Indonesia Persero Tbk. PT IDR 71,100 50,313 0.04Surya Citra Media Tbk. PT IDR 2,056,900 513,719 0.44United Tractors Tbk. PT IDR 413,500 463,165 0.40XL Axiata Tbk. PT IDR 3,028,000 841,047 0.72
4,670,675 4.02
PhilippinesAyala Corp. PHP 35,088 632,572 0.54BDO Unibank, Inc. PHP 176,870 420,645 0.36DMCI Holdings, Inc. PHP 1,544,550 413,253 0.36International Container Terminal
Services, Inc. PHP 199,020 259,906 0.22LT Group, Inc. PHP 847,000 286,332 0.25Metro Pacific Investments Corp. PHP 2,427,600 359,297 0.31Metropolitan Bank & Trust Co. PHP 277,199 531,819 0.46SM Investments Corp. PHP 26,580 545,789 0.47
3,449,613 2.97
SingaporeJardine Cycle & Carriage Ltd. (1) SGD 43,400 1,175,401 1.01Keppel Infrastructure Trust (1) SGD 1,916,200 703,801 0.61Oversea-Chinese Banking Corp. Ltd. (1) SGD 52,546 338,815 0.29Raffles Medical Group Ltd. (1) SGD 326,547 365,869 0.32Singapore Post Ltd. (1) SGD 339,600 370,415 0.32
2,954,301 2.55
SCHEDULE OF INVESTMENTSAs at 30 June 2016
Investments Currency
Quantity/Nominal
Value
Market Value USD
% of Net Assets
Transferable securities and money market instruments admitted to official exchange listing or dealt in on another regulated market
Equities (continued)
South KoreaAmorepacific Corp. KRW 4,093 1,534,017 1.32CJ CheilJedang Corp. KRW 919 310,109 0.27CJ Corp. KRW 3,233 567,237 0.49Cosmax, Inc. KRW 2,261 334,836 0.29Coway Co. Ltd. KRW 12,712 1,153,820 0.99Hotel Shilla Co. Ltd. KRW 6,292 371,079 0.32Hugel, Inc. KRW 1,220 336,867 0.29Hyundai Development Co-Engineering
& Construction KRW 24,114 828,368 0.71Hyundai Wia Corp. KRW 6,142 475,330 0.41Innocean Worldwide, Inc. KRW 7,694 541,977 0.47Kia Motors Corp. KRW 24,008 900,840 0.78Korea Aerospace Industries Ltd. KRW 16,565 1,053,199 0.91Korea Electric Power Corp. KRW 20,353 1,067,759 0.92LG Chem Ltd. KRW 3,644 822,923 0.71Mando Corp. KRW 1,689 319,078 0.28NAVER Corp. KRW 2,241 1,382,000 1.19Nexon Co. Ltd. (Japan) (2) JPY 71,400 1,046,894 0.90Samsung Electronics Co. Ltd. KRW 3,079 3,810,941 3.28Samsung Electronics Co. Ltd. Preference KRW 1,928 1,981,068 1.71Samsung Fire & Marine Insurance Co. Ltd. KRW 2,965 678,599 0.58SK Holdings Co. Ltd. KRW 6,540 1,150,298 0.99
20,667,239 17.81
TaiwanAdvanced Semiconductor Engineering, Inc. TWD 940,000 1,067,785 0.92Catcher Technology Co. Ltd. TWD 135,000 993,755 0.86Chailease Holding Co. Ltd.
(Cayman Islands) (2) TWD 95,141 153,634 0.13Delta Electronics, Inc. TWD 203,974 986,237 0.85E.Sun Financial Holding Co. Ltd. TWD 826,000 486,424 0.42Eclat Textile Co. Ltd. TWD 73,152 703,995 0.61Formosa Plastics Corp. TWD 245,000 590,782 0.51Fubon Financial Holding Co. Ltd. TWD 297,000 346,580 0.30Hermes Microvision, Inc. TWD 6,029 245,727 0.21Hon Hai Precision Industry Co. Ltd. TWD 537,250 1,373,764 1.18PChome Online, Inc. TWD 71,000 779,011 0.67Pegatron Corp. TWD 393,000 825,855 0.71President Chain Store Corp. TWD 35,000 272,285 0.23Taiwan Mobile Co. Ltd. TWD 187,000 652,042 0.56Taiwan Semiconductor Manufacturing
Co. Ltd. TWD 720,000 3,626,333 3.12Uni-President Enterprises Corp. TWD 663,452 1,305,765 1.13Yeong Guan Energy Technology Group
Co. Ltd. (Cayman Islands) (2) TWD 84,000 531,118 0.46
14,941,092 12.87
ThailandCentral Pattana PCL THB 114,900 195,442 0.17Kasikornbank PCL, NVDR THB 128,700 622,854 0.54Land & Houses PCL THB 781,000 201,214 0.17Minor International PCL THB 486,980 558,002 0.48Sino-Thai Engineering & Construction PCL THB 13,600 9,215 0.01
1,586,727 1.37
Morgan Stanley Investment Funds 30 June 2016 10
The accompanying notes are an integral part of these financial statements.
Asia-Pacific Equity Fund (continued)
SCHEDULE OF INVESTMENTSAs at 30 June 2016
Investments Currency
Quantity/Nominal
Value
Market Value USD
% of Net Assets
Transferable securities and money market instruments admitted to official exchange listing or dealt in on another regulated market
Equities (continued)
United States of AmericaNien Made Enterprise Co. Ltd. (Taiwan) (2) TWD 66,000 599,368 0.52
599,368 0.52
Total Equities 113,656,854 97.92
Total Transferable securities and money market instruments admitted to official exchange listing or dealt in on another regulated market 113,656,854 97.92
Units of authorised UCITS or other collective investment undertakings
Collective Investment Schemes – UCITS
LuxembourgMorgan Stanley Liquidity Funds US Dollar
Liquidity Fund – MS Reserve (4) USD 1,580,883 1,580,883 1.36
1,580,883 1.36
Total Collective Investment Schemes – UCITS 1,580,883 1.36
Total Units of authorised UCITS or other collective investment undertakings 1,580,883 1.36
Total Investments 115,237,737 99.28
Cash 177,079 0.15
Other Assets/(Liabilities) 653,392 0.57
Total Net Assets 116,068,208 100.00
(1) All or part of this position is out on loan.(2) The country in brackets represents the country of incorporation of this security.(3) Security is valued at its fair value under the direction of the Board of Directors of the SICAV.(4) Affiliate managed by an affiliate of the Investment Adviser.
Forward Currency Exchange Contracts
Currency Purchased
Amount Purchased
Currency Sold
Amount Sold
Maturity Date Counterparty
Unrealised Gain/(Loss)
USD
% of Net Assets
EUR Hedged Share ClassEUR 293,631 USD 324,527 08/07/2016 J.P. Morgan 1,930 0.00
Unrealised Gain on NAV Hedged Share Classes Forward Currency Exchange Contracts 1,930 0.00
Total Unrealised Gain on Forward Currency Exchange Contracts 1,930 0.00
EUR Hedged Share ClassEUR 300,675 USD 338,722 01/07/2016 J.P. Morgan (4,480) 0.00USD 332,215 EUR 300,675 01/07/2016 J.P. Morgan (2,027) 0.00
Unrealised Loss on NAV Hedged Share Classes Forward Currency Exchange Contracts (6,507) 0.00
Total Unrealised Loss on Forward Currency Exchange Contracts (6,507) 0.00
Net Unrealised Loss on Forward Currency Exchange Contracts (4,577) 0.00
DERIVATIVES
Over-the-counter (OTC) and exchange traded derivatives as at 30 June 2016, expressed in US dollars.

11 Morgan Stanley Investment Funds 30 June 2016
The accompanying notes are an integral part of these financial statements.
Please refer to the full prospectus for the Fund’s investment objective and policy.
INVESTMENT AIM
To seek long-term capital appreciation, measured in US dollars, through investment in the equity securities of companies in the Asian and Oceanian real estate industry.
SCHEDULE OF INVESTMENTSAs at 30 June 2016
Investments Currency
Quantity/Nominal
Value
Market Value USD
% of Net Assets
Transferable securities and money market instruments admitted to official exchange listing or dealt in on another regulated market
Equities
AustraliaDexus Property Group, REIT AUD 259,942 1,743,548 0.96Frasers Logistics & Industrial Trust, REIT
(Singapore) (2) SGD 1,124,000 792,307 0.43Goodman Group, REIT AUD 873,842 4,620,123 2.53GPT Group (The), REIT AUD 863,148 3,472,430 1.90Investa Office Fund, REIT AUD 207,627 660,813 0.36Mirvac Group, REIT AUD 1,146,857 1,722,708 0.95Scentre Group, REIT AUD 2,511,753 9,189,525 5.04Shopping Centres Australasia Property
Group, REIT AUD 133,803 226,857 0.13Stockland, REIT AUD 783,133 2,742,884 1.50Vicinity Centres, REIT AUD 616,384 1,521,740 0.83Westfield Corp., REIT AUD 981,272 7,771,235 4.26
34,464,170 18.89
ChinaChina Overseas Land & Investment Ltd.
(Hong Kong) (2) HKD 334,000 1,054,660 0.58China Resources Land Ltd.
(Cayman Islands) (2) HKD 74,000 172,628 0.09Global Logistic Properties Ltd.
(Singapore) (2) SGD 1,239,400 1,659,939 0.91
2,887,227 1.58
Hong KongCheung Kong Property Holdings Ltd.
(Cayman Islands) (2) HKD 1,061,500 6,621,635 3.63Hang Lung Properties Ltd. HKD 491,000 988,467 0.54Henderson Land Development Co. Ltd. HKD 525,465 2,949,387 1.62Hongkong Land Holdings Ltd.
(Bermuda) (2) USD 1,765,100 10,749,459 5.89Hysan Development Co. Ltd. HKD 1,328,705 5,899,533 3.24Kerry Properties Ltd. (Bermuda) (2) HKD 307,213 755,471 0.41Link REIT HKD 870,882 5,926,429 3.25New World Development Co. Ltd. HKD 2,522,885 2,552,507 1.40Sino Land Co. Ltd. HKD 450,531 735,120 0.40Sun Hung Kai Properties Ltd. HKD 1,432,823 17,183,387 9.42Swire Properties Ltd. HKD 2,318,250 6,140,050 3.37Wharf Holdings Ltd. (The) HKD 672,122 4,067,088 2.23
64,568,533 35.40
JapanActivia Properties, Inc., REIT JPY 361 1,910,722 1.05Advance Residence Investment Corp., REIT JPY 387 1,036,594 0.57Aeon Mall Co. Ltd. JPY 13,500 175,219 0.10Daiwa Office Investment Corp., REIT JPY 151 894,717 0.49Frontier Real Estate Investment Corp., REIT JPY 78 405,254 0.22GLP J-REIT JPY 1,142 1,442,222 0.79Hulic Co. Ltd. JPY 108,400 1,130,617 0.62Hulic Reit, Inc. JPY 223 407,466 0.22Invincible Investment Corp., REIT JPY 1,001 631,103 0.35Japan Hotel REIT Investment Corp. JPY 218 183,470 0.10Japan Prime Realty Investment Corp., REIT JPY 65 278,897 0.15Japan Real Estate Investment Corp., REIT JPY 643 3,966,355 2.17Japan Retail Fund Investment Corp., REIT JPY 935 2,384,350 1.31Kenedix Office Investment Corp., REIT JPY 114 679,918 0.37Mitsubishi Estate Co. Ltd. JPY 829,000 15,107,190 8.28Mitsui Fudosan Co. Ltd. JPY 640,000 14,518,000 7.96Mori Hills REIT Investment Corp. JPY 676 1,060,237 0.58Mori Trust Sogo Reit, Inc. JPY 393 744,857 0.41Nippon Building Fund, Inc., REIT JPY 823 5,068,681 2.78
Asian Property Fund
Morgan Stanley Investment Funds 30 June 2016 12
The accompanying notes are an integral part of these financial statements.
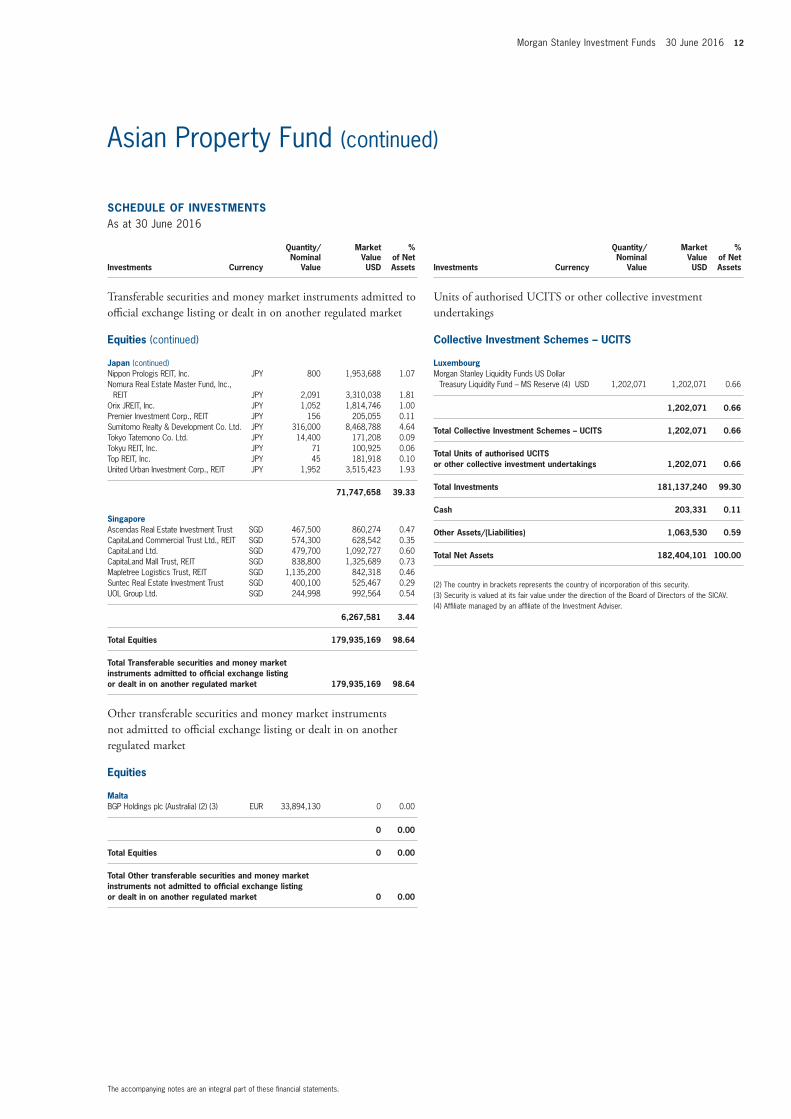
Asian Property Fund (continued)
SCHEDULE OF INVESTMENTSAs at 30 June 2016
Investments Currency
Quantity/Nominal
Value
Market Value USD
% of Net Assets
Transferable securities and money market instruments admitted to official exchange listing or dealt in on another regulated market
Equities (continued)
Japan (continued)Nippon Prologis REIT, Inc. JPY 800 1,953,688 1.07Nomura Real Estate Master Fund, Inc.,
REIT JPY 2,091 3,310,038 1.81Orix JREIT, Inc. JPY 1,052 1,814,746 1.00Premier Investment Corp., REIT JPY 156 205,055 0.11Sumitomo Realty & Development Co. Ltd. JPY 316,000 8,468,788 4.64Tokyo Tatemono Co. Ltd. JPY 14,400 171,208 0.09Tokyu REIT, Inc. JPY 71 100,925 0.06Top REIT, Inc. JPY 45 181,918 0.10United Urban Investment Corp., REIT JPY 1,952 3,515,423 1.93
71,747,658 39.33
SingaporeAscendas Real Estate Investment Trust SGD 467,500 860,274 0.47CapitaLand Commercial Trust Ltd., REIT SGD 574,300 628,542 0.35CapitaLand Ltd. SGD 479,700 1,092,727 0.60CapitaLand Mall Trust, REIT SGD 838,800 1,325,689 0.73Mapletree Logistics Trust, REIT SGD 1,135,200 842,318 0.46Suntec Real Estate Investment Trust SGD 400,100 525,467 0.29UOL Group Ltd. SGD 244,998 992,564 0.54
6,267,581 3.44
Total Equities 179,935,169 98.64
Total Transferable securities and money market instruments admitted to official exchange listing or dealt in on another regulated market 179,935,169 98.64
Other transferable securities and money market instruments not admitted to official exchange listing or dealt in on another regulated market
Equities
MaltaBGP Holdings plc (Australia) (2) (3) EUR 33,894,130 0 0.00
0 0.00
Total Equities 0 0.00
Total Other transferable securities and money market instruments not admitted to official exchange listing or dealt in on another regulated market 0 0.00
SCHEDULE OF INVESTMENTSAs at 30 June 2016
Investments Currency
Quantity/Nominal
Value
Market Value USD
% of Net Assets
Units of authorised UCITS or other collective investment undertakings
Collective Investment Schemes – UCITS
LuxembourgMorgan Stanley Liquidity Funds US Dollar
Treasury Liquidity Fund – MS Reserve (4) USD 1,202,071 1,202,071 0.66
1,202,071 0.66
Total Collective Investment Schemes – UCITS 1,202,071 0.66
Total Units of authorised UCITS or other collective investment undertakings 1,202,071 0.66
Total Investments 181,137,240 99.30
Cash 203,331 0.11
Other Assets/(Liabilities) 1,063,530 0.59
Total Net Assets 182,404,101 100.00
(2) The country in brackets represents the country of incorporation of this security.(3) Security is valued at its fair value under the direction of the Board of Directors of the SICAV.(4) Affiliate managed by an affiliate of the Investment Adviser.

13 Morgan Stanley Investment Funds 30 June 2016
The accompanying notes are an integral part of these financial statements.
Please refer to the full prospectus for the Fund’s investment objective and policy.
SCHEDULE OF INVESTMENTSAs at 30 June 2016
Investments Currency
Quantity/Nominal
Value
Market Value USD
% of Net Assets
Transferable securities and money market instruments admitted to official exchange listing or dealt in on another regulated market
Equities
ArgentinaBanco Macro SA, ADR USD 648 47,868 1.01BBVA Banco Frances SA, ADR USD 778 16,283 0.34Grupo Financiero Galicia SA, ADR USD 1,507 46,250 0.97Petrobras Argentina SA, ADR USD 1,204 7,561 0.16Telecom Argentina SA, ADR USD 1,510 28,328 0.59YPF SA, ADR USD 3,170 61,656 1.30
207,946 4.37
BangladeshGrameenPhone Ltd. BDT 10,777 35,012 0.74Lafarge Surma Cement Ltd. BDT 34,377 34,684 0.73Square Pharmaceuticals Ltd. BDT 25,358 85,939 1.81Titas Gas Transmission & Distribution
Co. Ltd. BDT 20,495 12,626 0.26
168,261 3.54
ColombiaAlmacenes Exito SA COP 1,915 9,397 0.20Banco Davivienda SA Preference COP 968 8,845 0.19Bancolombia SA Preference COP 4,077 35,640 0.75Cementos Argos SA COP 3,833 15,379 0.32Corp. Financiera Colombiana SA COP 813 10,538 0.22Ecopetrol SA COP 46,834 22,150 0.47Grupo Argos SA COP 2,780 17,372 0.36Grupo Aval Acciones y Valores SA
Preference COP 32,000 12,785 0.27Grupo de Inversiones Suramericana SA COP 2,944 38,262 0.80Interconexion Electrica SA ESP COP 3,707 11,101 0.23Isagen SA ESP COP 7,703 10,771 0.23
192,240 4.04
Czech RepublicCEZ A/S CZK 4,516 76,445 1.61Komercni banka A/S CZK 2,125 79,462 1.67
155,907 3.28
EgyptCommercial International Bank Egypt SAE EGP 26,255 117,764 2.47Global Telecom Holding SAE EGP 67,400 24,212 0.51Talaat Moustafa Group EGP 26,514 14,571 0.31
156,547 3.29
IndonesiaAdaro Energy Tbk. PT IDR 47,900 3,081 0.07AKR Corporindo Tbk. PT IDR 6,200 3,003 0.06Astra International Tbk. PT IDR 65,200 36,516 0.77Bank Central Asia Tbk. PT IDR 39,900 40,238 0.85Bank Danamon Indonesia Tbk. PT IDR 11,000 2,947 0.06Bank Mandiri Persero Tbk. PT IDR 30,200 21,771 0.46Bank Negara Indonesia Persero Tbk. PT IDR 24,400 9,603 0.20Bank Rakyat Indonesia Persero Tbk. PT IDR 35,700 29,180 0.61Bumi Serpong Damai Tbk. PT IDR 26,700 4,264 0.09Charoen Pokphand Indonesia Tbk. PT IDR 24,000 6,812 0.14Gudang Garam Tbk. PT IDR 1,600 8,355 0.18Hanjaya Mandala Sampoerna Tbk. PT IDR 30,500 8,772 0.18Indocement Tunggal Prakarsa Tbk. PT IDR 4,800 6,130 0.13Indofood CBP Sukses Makmur Tbk. PT IDR 9,800 12,776 0.27
INVESTMENT AIM
To seek to maximise total return measured in US Dollars primarily through investment in Emerging and Frontier Market Countries.
Breakout Nations Fund

Morgan Stanley Investment Funds 30 June 2016 14
The accompanying notes are an integral part of these financial statements.
Breakout Nations Fund (continued)
SCHEDULE OF INVESTMENTSAs at 30 June 2016
Investments Currency
Quantity/Nominal
Value
Market Value USD
% of Net Assets
Transferable securities and money market instruments admitted to official exchange listing or dealt in on another regulated market
Equities (continued)
Indonesia (continued)Indofood Sukses Makmur Tbk. PT IDR 14,700 8,066 0.17Kalbe Farma Tbk. PT IDR 70,500 8,164 0.17Lippo Karawaci Tbk. PT IDR 61,200 5,303 0.11Matahari Department Store Tbk. PT IDR 7,700 11,655 0.25Media Nusantara Citra Tbk. PT IDR 16,800 2,797 0.06Perusahaan Gas Negara Persero Tbk. IDR 35,600 6,305 0.13Semen Indonesia Persero Tbk. PT IDR 9,700 6,864 0.14Summarecon Agung Tbk. PT IDR 33,400 4,575 0.10Surya Citra Media Tbk. PT IDR 19,700 4,920 0.10Telekomunikasi Indonesia Persero Tbk. PT IDR 162,700 49,008 1.03Tower Bersama Infrastructure Tbk. PT IDR 8,300 4,146 0.09Unilever Indonesia Tbk. PT IDR 5,000 17,057 0.36United Tractors Tbk. PT IDR 5,500 6,161 0.13XL Axiata Tbk. PT IDR 12,400 3,444 0.07
331,913 6.98
KenyaEast African Breweries Ltd. KES 20,700 56,920 1.20Equity Group Holdings Ltd. KES 111,000 42,270 0.89KCB Group Ltd. KES 118,700 39,625 0.83Safaricom Ltd. KES 533,600 93,684 1.97
232,499 4.89
PakistanEngro Corp. Ltd. PKR 7,600 24,158 0.51Fatima Fertilizer Co. Ltd. PKR 13,400 4,342 0.09Fauji Fertilizer Co. Ltd. PKR 17,600 19,275 0.41Habib Bank Ltd. PKR 19,200 36,212 0.76Hub Power Co. Ltd. (The) PKR 13,000 14,900 0.31Indus Motor Co. Ltd. PKR 500 4,485 0.09K-Electric Ltd. PKR 44,700 3,439 0.07Lucky Cement Ltd. PKR 5,200 32,193 0.68MCB Bank Ltd. PKR 17,600 36,968 0.78National Bank of Pakistan PKR 17,100 9,437 0.20Oil & Gas Development Co. Ltd. PKR 21,100 27,812 0.59Pakistan Oilfields Ltd. PKR 2,400 7,961 0.17Pakistan Petroleum Ltd. PKR 6,500 9,621 0.20Pakistan State Oil Co. Ltd. PKR 4,400 15,771 0.33Pakistan Telecommunication Co. Ltd. PKR 14,600 2,095 0.04United Bank Ltd. PKR 11,900 20,099 0.42
268,768 5.65
PeruCia de Minas Buenaventura SAA, ADR USD 2,754 32,167 0.68Credicorp Ltd. (Bermuda) (2) USD 980 151,439 3.18Southern Copper Corp.
(United States of America) (2) USD 2,274 60,466 1.27
244,072 5.13
PhilippinesAboitiz Equity Ventures, Inc. PHP 23,340 38,633 0.81Aboitiz Power Corp. PHP 18,200 17,797 0.37Alliance Global Group, Inc. PHP 24,000 7,542 0.16Ayala Corp. PHP 2,570 46,332 0.97Ayala Land, Inc. PHP 83,600 68,878 1.45Bank of the Philippine Islands PHP 9,690 20,021 0.42BDO Unibank, Inc. PHP 18,920 44,997 0.95DMCI Holdings, Inc. PHP 47,800 12,789 0.27Energy Development Corp. PHP 109,800 12,870 0.27
SCHEDULE OF INVESTMENTSAs at 30 June 2016
Investments Currency
Quantity/Nominal
Value
Market Value USD
% of Net Assets
Transferable securities and money market instruments admitted to official exchange listing or dealt in on another regulated market
Equities (continued)
Philippines (continued)Globe Telecom, Inc. PHP 380 19,140 0.40GT Capital Holdings, Inc. PHP 910 27,826 0.59JG Summit Holdings, Inc. PHP 28,880 52,740 1.11Jollibee Foods Corp. PHP 5,110 26,259 0.55Megaworld Corp. PHP 129,000 12,738 0.27Metro Pacific Investments Corp. PHP 150,000 22,201 0.47Philippine Long Distance Telephone Co. PHP 1,105 50,448 1.06SM Investments Corp. PHP 1,900 39,014 0.82SM Prime Holdings, Inc. PHP 94,500 54,782 1.15Universal Robina Corp. PHP 10,120 44,698 0.94
619,705 13.03
PolandAlior Bank SA PLN 593 7,702 0.16Bank Millennium SA PLN 3,829 4,490 0.10Bank Pekao SA PLN 805 27,561 0.58Bank Zachodni WBK SA PLN 215 14,265 0.30CCC SA PLN 145 5,884 0.12Cyfrowy Polsat SA PLN 1,225 6,779 0.14Energa SA PLN 1,364 3,312 0.07Eurocash SA PLN 507 5,929 0.13Grupa Azoty SA PLN 276 4,784 0.10Grupa Lotos SA PLN 594 4,586 0.10KGHM Polska Miedz SA PLN 872 14,452 0.31LPP SA PLN 8 10,132 0.21mBank SA PLN 94 7,352 0.16Orange Polska SA PLN 4,200 5,369 0.11PGE Polska Grupa Energetyczna SA PLN 5,208 15,688 0.33Polski Koncern Naftowy ORLEN SA PLN 1,915 33,309 0.70Polskie Gornictwo Naftowe
i Gazownictwo SA PLN 10,862 14,870 0.31Powszechna Kasa Oszczednosci Bank
Polski SA PLN 5,304 31,086 0.65Powszechny Zaklad Ubezpieczen SA PLN 3,411 24,429 0.51Tauron Polska Energia SA PLN 7,000 4,879 0.10
246,858 5.19
RomaniaBanca Transilvania SA RON 193,247 100,259 2.11BRD-Groupe Societe Generale SA RON 13,225 31,607 0.66Electrica SA RON 11,682 37,686 0.79OMV Petrom SA RON 340,645 20,311 0.43Societatea Nationala de Gaze Naturale
ROMGAZ SA RON 5,814 35,953 0.76
225,816 4.75
ThailandAdvanced Info Service PCL THB 2,300 10,345 0.22Airports of Thailand PCL THB 900 9,992 0.21Bangkok Bank PCL, NVDR THB 1,400 6,317 0.13Bangkok Dusit Medical Services PCL ‘F’ THB 8,500 5,783 0.12BEC World PCL THB 2,300 1,493 0.03BTS Group Holdings PCL THB 13,200 3,608 0.08Bumrungrad Hospital PCL THB 800 4,156 0.09Central Pattana PCL THB 3,100 5,273 0.11Charoen Pokphand Foods PCL THB 7,100 5,811 0.12CP ALL PCL THB 9,600 13,733 0.29Delta Electronics Thailand PCL THB 1,100 2,137 0.04Energy Absolute PCL THB 2,600 1,577 0.03Glow Energy PCL THB 1,100 2,685 0.06Indorama Ventures PCL THB 3,400 2,807 0.06
15 Morgan Stanley Investment Funds 30 June 2016
The accompanying notes are an integral part of these financial statements.
Breakout Nations Fund (continued)
SCHEDULE OF INVESTMENTSAs at 30 June 2016
Investments Currency
Quantity/Nominal
Value
Market Value USD
% of Net Assets
Transferable securities and money market instruments admitted to official exchange listing or dealt in on another regulated market
Equities (continued)
Thailand (continued)IRPC PCL THB 23,600 3,198 0.07Kasikornbank PCL, NVDR THB 3,800 18,390 0.39Krung Thai Bank PCL THB 8,600 3,991 0.08Minor International PCL THB 3,900 4,469 0.09PTT Exploration & Production PCL THB 3,100 7,391 0.16PTT Global Chemical PCL THB 3,800 6,410 0.13PTT PCL THB 2,200 19,603 0.41Siam Cement PCL (The) THB 900 12,196 0.26Siam Commercial Bank PCL (The) THB 3,500 13,850 0.29Thai Oil PCL THB 1,900 3,245 0.07Thai Union Group PCL ‘F’ THB 4,400 2,756 0.06True Corp. PCL THB 19,285 3,953 0.08
175,169 3.68
VietnamBank for Foreign Trade of Vietnam JSC VND 10,470 22,204 0.47Bank for Investment and Development
of Vietnam JSC VND 6,037 4,737 0.10Bao Viet Holdings VND 2,610 6,904 0.14HAGL JSC VND 16,850 5,515 0.11Hoa Phat Group JSC VND 7,020 12,464 0.26Masan Group Corp. VND 12,640 37,686 0.79PetroVietnam Drilling & Well Services JSC VND 3,990 5,545 0.12PetroVietnam Gas JSC VND 2,830 7,930 0.17Saigon Thuong Tin Commercial JSB VND 26,806 13,581 0.28Vingroup JSC VND 29,559 65,469 1.38
182,035 3.82
Total Equities 3,407,736 71.64
Government Bonds
United States of AmericaUS Treasury Bill 0% 15/12/2016 USD 878,000 876,894 18.44
876,894 18.44
Total Government Bonds 876,894 18.44
Total Transferable securities and money market instruments admitted to official exchange listing or dealt in on another regulated market 4,284,630 90.08
SCHEDULE OF INVESTMENTSAs at 30 June 2016
Investments Currency
Quantity/Nominal
Value
Market Value USD
% of Net Assets
Units of authorised UCITS or other collective investment undertakings
Exchange Traded Funds
IndiaDB x-trackers MSCI India TRN Index Fund –
1C (USD) (Luxembourg) (2) USD 42,888 411,189 8.65
411,189 8.65
Total Exchange Traded Funds 411,189 8.65
Total Units of authorised UCITS or other collective investment undertakings 411,189 8.65
Total Investments 4,695,819 98.73
Cash 37,247 0.78
Other Assets/(Liabilities) 23,210 0.49
Total Net Assets 4,756,276 100.00
(2) The country in brackets represents the country of incorporation of this security.

Morgan Stanley Investment Funds 30 June 2016 16
The accompanying notes are an integral part of these financial statements.
Breakout Nations Fund (continued)
Financial Futures Contracts
Security DescriptionNumber of Contracts Currency
Global Exposure
USD
Unrealised Gain/(Loss)
USD
% of Net Assets
Mexican Bolsa Index, 15/09/2016 17 MXN 421,961 7,432 0.16MSCI Taiwan Index, 28/07/2016 8 USD 254,000 7,352 0.15SGX CNX Nifty Index, 28/07/2016 9 USD 150,039 3,985 0.08
Total Unrealised Gain on Financial Futures Contracts 18,769 0.39
Net Unrealised Gain on Financial Futures Contracts 18,769 0.39
Forward Currency Exchange Contracts
Currency Purchased
Amount Purchased
Currency Sold
Amount Sold
Maturity Date Counterparty
Unrealised Gain/(Loss)
USD
% of Net Assets
EUR Hedged Share ClassEUR 272,940 USD 301,658 08/07/2016 J.P. Morgan 1,794 0.04
GBP Hedged Share ClassGBP 7,348 USD 9,800 08/07/2016 J.P. Morgan 73 0.00
Unrealised Gain on NAV Hedged Share Classes Forward Currency Exchange Contracts 1,867 0.04
Total Unrealised Gain on Forward Currency Exchange Contracts 1,867 0.04
EUR Hedged Share ClassEUR 280,032 USD 315,467 01/07/2016 J.P. Morgan (4,173) (0.09)USD 309,407 EUR 280,032 01/07/2016 J.P. Morgan (1,887) (0.04)
GBP Hedged Share ClassGBP 7,552 USD 11,076 01/07/2016 J.P. Morgan (928) (0.02)USD 10,072 GBP 7,552 01/07/2016 J.P. Morgan (76) 0.00
Unrealised Loss on NAV Hedged Share Classes Forward Currency Exchange Contracts (7,064) (0.15)
Total Unrealised Loss on Forward Currency Exchange Contracts (7,064) (0.15)
Net Unrealised Loss on Forward Currency Exchange Contracts (5,197) (0.11)
Collateral received and paid by the Fund in respect of financial derivative instruments:
Type of Collateral Counterparty CurrencyCollateral Amount
receivedCollateral Amount
paid
Breakout Nations Fund
Cash Goldman Sachs USD 64,602 -
64,602 -
DERIVATIVES
Over-the-counter (OTC) and exchange traded derivatives as at 30 June 2016, expressed in US dollars.
17 Morgan Stanley Investment Funds 30 June 2016
The accompanying notes are an integral part of these financial statements.
Please refer to the full prospectus for the Fund’s investment objective and policy.
SCHEDULE OF INVESTMENTSAs at 30 June 2016
Investments Currency
Quantity/Nominal
Value
Market Value EUR
% of Net Assets
Transferable securities and money market instruments admitted to official exchange listing or dealt in on another regulated market
Equities
AustriaErste Group Bank AG EUR 150,478 3,007,303 2.48Vienna Insurance Group AG Wiener
Versicherung Gruppe EUR 38,334 646,886 0.53
3,654,189 3.01
Czech RepublicKomercni banka A/S CZK 89,000 2,993,830 2.46
2,993,830 2.46
KenyaSafaricom Ltd. KES 13,920,275 2,198,522 1.81
2,198,522 1.81
PolandBank Pekao SA PLN 54,905 1,690,987 1.39CCC SA PLN 117,992 4,307,072 3.54Eurocash SA PLN 237,863 2,502,242 2.06Fabryki Mebli Forte SA PLN 155,422 2,283,075 1.88Grupa Kety SA PLN 31,478 2,226,830 1.83Jeronimo Martins SGPS SA (Portugal) (2) EUR 287,421 4,033,954 3.31KRUK SA PLN 50,440 2,280,824 1.87LPP SA PLN 2,731 3,111,562 2.56PKP Cargo SA PLN 78,107 585,258 0.48Polski Koncern Naftowy ORLEN SA PLN 128,160 2,005,331 1.65
25,027,135 20.57
RomaniaBanca Transilvania SA RON 8,615,484 4,020,905 3.31BRD-Groupe Societe Generale SA RON 1,226,744 2,637,436 2.17OMV Petrom SA RON 29,483,157 1,581,421 1.30
8,239,762 6.78
RussiaMail.Ru Group Ltd., GDR Preference
(British Virgin Islands) (2) USD 298,152 4,867,996 4.00MMC Norilsk Nickel PJSC, ADR USD 163,711 1,945,434 1.60Novatek OJSC, GDR USD 19,448 1,786,227 1.47X5 Retail Group NV, GDR (Netherlands) (2) USD 90,601 1,617,817 1.33Yandex NV ‘A’ (Netherlands) (2) USD 265,003 5,111,065 4.20
15,328,539 12.60
South AfricaAVI Ltd. ZAR 851,402 4,337,226 3.56Clicks Group Ltd. ZAR 205,488 1,538,422 1.26EOH Holdings Ltd. ZAR 308,307 2,616,884 2.15Famous Brands Ltd. ZAR 380,205 2,951,054 2.43Life Healthcare Group Holdings Ltd. ZAR 970,164 2,154,440 1.77Mondi plc (United Kingdom) (2) ZAR 246,605 4,085,029 3.36MTN Group Ltd. ZAR 377,990 3,325,027 2.73Naspers Ltd. ‘N’ ZAR 91,275 12,538,973 10.31Steinhoff International Holdings NV
(Netherlands) (2) ZAR 1,158,664 5,949,230 4.89Vodacom Group Ltd. ZAR 601,310 6,186,319 5.09
45,682,604 37.55
INVESTMENT AIM
To seek long-term capital appreciation, measured in Euro, by investing primarily in equity securities of issuers in Central, Eastern and Southern Europe (including the Russian Federation), the Middle East and Africa.
Emerging Europe, Middle East and Africa Equity Fund

Morgan Stanley Investment Funds 30 June 2016 18
The accompanying notes are an integral part of these financial statements.
SCHEDULE OF INVESTMENTSAs at 30 June 2016
Investments Currency
Quantity/Nominal
Value
Market Value EUR
% of Net Assets
Transferable securities and money market instruments admitted to official exchange listing or dealt in on another regulated market
Equities (continued)
TurkeyAdel Kalemcilik Ticaret ve Sanayi A/S TRY 88,168 468,539 0.38Arcelik A/S TRY 649,704 3,827,479 3.15AvivaSA Emeklilik ve Hayat A/S TRY 261,440 1,555,664 1.28Tat Gida Sanayi A/S TRY 795,467 1,359,465 1.12Tupras Turkiye Petrol Rafinerileri A/S TRY 56,979 1,131,041 0.93Ulker Biskuvi Sanayi A/S TRY 501,710 3,266,996 2.68
11,609,184 9.54
United States of AmericaEPAM Systems, Inc. USD 68,558 4,017,986 3.30
4,017,986 3.30
Total Equities 118,751,751 97.62
Total Transferable securities and money market instruments admitted to official exchange listing or dealt in on another regulated market 118,751,751 97.62
Units of authorised UCITS or other collective investment undertakings
Collective Investment Schemes – UCITS
LuxembourgMorgan Stanley Liquidity Funds Euro
Liquidity Fund – MS Reserve (4) EUR 204,256 204,256 0.17Morgan Stanley Liquidity Funds US Dollar
Liquidity Fund – MS Reserve (4) USD 2,152,802 1,936,599 1.59
2,140,855 1.76
Total Collective Investment Schemes – UCITS 2,140,855 1.76
Total Units of authorised UCITS or other collective investment undertakings 2,140,855 1.76
Total Investments 120,892,606 99.38
Cash 578,011 0.48
Other Assets/(Liabilities) 179,423 0.14
Total Net Assets 121,650,040 100.00
(2) The country in brackets represents the country of incorporation of this security.(4) Affiliate managed by an affiliate of the Investment Adviser.
Emerging Europe, Middle East and Africa Equity Fund (continued)
19 Morgan Stanley Investment Funds 30 June 2016
The accompanying notes are an integral part of these financial statements.
Please refer to the full prospectus for the Fund’s investment objective and policy.
SCHEDULE OF INVESTMENTSAs at 30 June 2016
Investments Currency
Quantity/Nominal
Value
Market Value USD
% of Net Assets
Transferable securities and money market instruments admitted to official exchange listing or dealt in on another regulated market
Equities
BelgiumAnheuser-Busch InBev SA NV (1) EUR 117,946 15,274,721 5.44
15,274,721 5.44
ChinaTencent Holdings Ltd. (Cayman Islands) (2) HKD 684,500 15,535,765 5.53
15,535,765 5.53
Czech RepublicKomercni banka A/S CZK 74,858 2,799,236 1.00
2,799,236 1.00
Hong KongAIA Group Ltd. HKD 3,017,600 18,026,493 6.42Samsonite International SA
(Luxembourg) (1) (2) HKD 7,051,200 19,493,516 6.95
37,520,009 13.37
IndonesiaBank Mandiri Persero Tbk. PT IDR 11,091,300 7,995,507 2.85Matahari Department Store Tbk. PT IDR 3,442,300 5,210,474 1.86Sumber Alfaria Trijaya Tbk. PT IDR 154,149,309 6,999,893 2.49
20,205,874 7.20
MexicoFomento Economico Mexicano SAB
de CV, ADR USD 139,837 12,813,264 4.56Grupo Financiero Banorte SAB de CV ‘O’ MXN 1,636,450 8,832,070 3.15
21,645,334 7.71
PeruCredicorp Ltd. (Bermuda) (2) USD 72,961 11,274,663 4.02
11,274,663 4.02
PhilippinesBDO Unibank, Inc. PHP 2,158,970 5,134,620 1.83
5,134,620 1.83
PolandJeronimo Martins SGPS SA
(Portugal) (1) (2) EUR 675,853 10,544,569 3.76
10,544,569 3.76
South AfricaFamous Brands Ltd. (1) ZAR 1,417,515 12,230,693 4.35Life Healthcare Group Holdings Ltd. (1) ZAR 3,911,244 9,655,358 3.44Naspers Ltd. ‘N’ ZAR 36,349 5,550,943 1.98SABMiller plc (United Kingdom) (2) GBP 126,001 7,349,914 2.62
34,786,908 12.39
INVESTMENT AIM
To seek long-term capital appreciation, measured in US dollars, through investment primarily in a concentrated portfolio of equity securities in emerging and frontier countries.
Emerging Leaders Equity Fund
Morgan Stanley Investment Funds 30 June 2016 20
The accompanying notes are an integral part of these financial statements.
Emerging Leaders Equity Fund (continued)
SCHEDULE OF INVESTMENTSAs at 30 June 2016
Investments Currency
Quantity/Nominal
Value
Market Value USD
% of Net Assets
Transferable securities and money market instruments admitted to official exchange listing or dealt in on another regulated market
Equities (continued)
South KoreaCJ CGV Co. Ltd. KRW 43,792 3,936,796 1.40Hanssem Co. Ltd. KRW 48,094 6,641,952 2.37Orion Corp. KRW 9,900 8,100,164 2.89Osstem Implant Co. Ltd. KRW 33,768 2,287,745 0.81
20,966,657 7.47
TaiwanPoya International Co. Ltd. TWD 634,000 7,034,838 2.50Voltronic Power Technology Corp. TWD 173,000 2,407,544 0.86
9,442,382 3.36
ThailandDKSH Holding AG (Switzerland) (1) (2) CHF 186,644 12,216,099 4.35
12,216,099 4.35
TurkeyUlker Biskuvi Sanayi A/S TRY 623,032 4,509,935 1.61
4,509,935 1.61
United KingdomBritish American Tobacco plc GBP 173,581 11,042,030 3.93
11,042,030 3.93
United States of AmericaYum! Brands, Inc. USD 110,973 9,117,542 3.25
9,117,542 3.25
Total Equities 242,016,344 86.22
Participation Notes
IndiaIpca Laboratories Ltd. 03/02/2017,
issued by Goldman Sachs (United Kingdom) (2) USD 528,652 3,825,632 1.37
3,825,632 1.37
Total Participation Notes 3,825,632 1.37
SCHEDULE OF INVESTMENTSAs at 30 June 2016
Investments Currency
Quantity/Nominal
Value
Market Value USD
% of Net Assets
Transferable securities and money market instruments admitted to official exchange listing or dealt in on another regulated market
Warrants
IndiaApollo Hospitals Enterprise Ltd.
04/05/2018, issued by Macquarie Bank Ltd. (Australia) (2) USD 136,784 2,664,580 0.95
Bank of Baroda 26/12/2016, issued by Goldman Sachs (United Kingdom) (2) USD 1,197,821 2,729,764 0.97
Colgate-Palmolive India Ltd. 18/07/2019, issued by Merrill Lynch International & Co. (Curacao) (2) USD 548,177 7,456,578 2.66
Ipca Laboratories Ltd. 27/01/2017, issued by Goldman Sachs (United Kingdom) (2) USD 147,168 1,064,546 0.38
Marico Ltd. 09/01/2020, issued by Merrill Lynch International & Co. (Curacao) (2) USD 641,554 2,504,460 0.89
Marico Ltd. 10/06/2020, issued by Merrill Lynch International & Co. (Curacao) (2) USD 780,954 3,050,562 1.09
Shriram Transport Finance Co. Ltd. 01/11/2016, issued by Macquarie Bank Ltd. (Australia) (2) USD 306,213 5,459,043 1.94
24,929,533 8.88
Total Warrants 24,929,533 8.88
Total Transferable securities and money market instruments admitted to official exchange listing or dealt in on another regulated market 270,771,509 96.47
Units of authorised UCITS or other collective investment undertakings
Collective Investment Schemes – UCITS
LuxembourgMorgan Stanley Liquidity Funds US Dollar
Liquidity Fund – MS Reserve (4) USD 10,617,660 10,617,660 3.78
10,617,660 3.78
Total Collective Investment Schemes – UCITS 10,617,660 3.78
Total Units of authorised UCITS or other collective investment undertakings 10,617,660 3.78
Total Investments 281,389,169 100.25
Cash 296,860 0.11
Other Assets/(Liabilities) (992,117) (0.36)
Total Net Assets 280,693,912 100.00
(1) All or part of this position is out on loan.(2) The country in brackets represents the country of incorporation of this security.(4) Affiliate managed by an affiliate of the Investment Adviser.

21 Morgan Stanley Investment Funds 30 June 2016
The accompanying notes are an integral part of these financial statements.
Emerging Leaders Equity Fund (continued)
Forward Currency Exchange Contracts
Currency Purchased
Amount Purchased
Currency Sold
Amount Sold
Maturity Date Counterparty
Unrealised Gain/(Loss)
USD
% of Net Assets
EUR Hedged Share ClassEUR 45,688 USD 50,351 01/07/2016 J.P. Morgan 437 0.00USD 26,693 EUR 23,649 01/07/2016 J.P. Morgan 404 0.00EUR 25,060,611 USD 27,697,503 08/07/2016 J.P. Morgan 164,697 0.06USD 139,783 EUR 125,702 08/07/2016 J.P. Morgan 28 0.00
GBP Hedged Share ClassGBP 6,032 USD 8,045 08/07/2016 J.P. Morgan 60 0.00
Unrealised Gain on NAV Hedged Share Classes Forward Currency Exchange Contracts 165,626 0.06
Total Unrealised Gain on Forward Currency Exchange Contracts 165,626 0.06
EUR Hedged Share ClassEUR 25,959,225 USD 29,244,102 01/07/2016 J.P. Morgan (386,789) (0.13)USD 28,706,057 EUR 25,981,264 01/07/2016 J.P. Morgan (175,755) (0.07)EUR 7,991 USD 8,886 08/07/2016 J.P. Morgan (2) 0.00USD 101,759 EUR 91,988 08/07/2016 J.P. Morgan (513) 0.00
GBP Hedged Share ClassGBP 6,194 USD 9,085 01/07/2016 J.P. Morgan (761) 0.00USD 8,262 GBP 6,194 01/07/2016 J.P. Morgan (62) 0.00
Unrealised Loss on NAV Hedged Share Classes Forward Currency Exchange Contracts (563,882) (0.20)
Total Unrealised Loss on Forward Currency Exchange Contracts (563,882) (0.20)
Net Unrealised Loss on Forward Currency Exchange Contracts (398,256) (0.14)
DERIVATIVES
Over-the-counter (OTC) and exchange traded derivatives as at 30 June 2016, expressed in US dollars.

Morgan Stanley Investment Funds 30 June 2016 22
The accompanying notes are an integral part of these financial statements.
Please refer to the full prospectus for the Fund’s investment objective and policy.
SCHEDULE OF INVESTMENTSAs at 30 June 2016
Investments Currency
Quantity/Nominal
Value
Market Value USD
% of Net Assets
Transferable securities and money market instruments admitted to official exchange listing or dealt in on another regulated market
Equities
ArgentinaBanco Macro SA, ADR USD 78,821 5,822,507 0.36Grupo Financiero Galicia SA, ADR USD 167,858 5,151,562 0.32
10,974,069 0.68
AustriaErste Group Bank AG EUR 623,013 13,840,934 0.86Vienna Insurance Group AG Wiener
Versicherung Gruppe (1) EUR 296,877 5,569,093 0.34
19,410,027 1.20
BrazilBanco Bradesco SA Preference BRL 2,613,489 20,215,192 1.25BRF SA BRL 1,376,729 18,931,417 1.17Itau Unibanco Holding SA Preference BRL 2,114,763 19,505,287 1.21Lojas Renner SA BRL 867,384 6,277,015 0.39MercadoLibre, Inc.
(United States of America) (2) USD 112,666 15,650,434 0.97Raia Drogasil SA BRL 859,544 16,610,606 1.03Ultrapar Participacoes SA BRL 447,710 9,744,949 0.60
106,934,900 6.62
ChileSACI Falabella CLP 1,306,609 9,956,469 0.62
9,956,469 0.62
ChinaAlibaba Group Holding Ltd., ADR
(Cayman Islands) (1) (2) USD 230,824 18,170,465 1.13Bank of China Ltd. ‘H’ HKD 51,052,148 20,331,637 1.26China Construction Bank Corp. ‘H’ HKD 43,395,166 28,635,921 1.77China Machinery Engineering Corp. ‘H’ HKD 4,275,231 2,771,580 0.17China Mengniu Dairy Co. Ltd.
(Cayman Islands) (1) (2) HKD 3,042,618 5,286,122 0.33China Mobile Ltd. (Hong Kong) (2) HKD 3,222,194 36,815,463 2.28China Overseas Land & Investment Ltd.
(Hong Kong) (2) HKD 2,852,629 9,007,644 0.56China Pacific Insurance Group Co. Ltd. ‘H’ HKD 3,872,236 13,025,733 0.81China Taiping Insurance Holdings Co. Ltd.
(Hong Kong) (1) (2) HKD 2,106,082 3,919,605 0.24China Unicom Hong Kong Ltd.
(Hong Kong) (2) HKD 6,124,000 6,330,083 0.39Chongqing Changan Automobile Co. Ltd. ‘B’ HKD 1,408,785 1,960,958 0.12CRCC High-Tech Equipment Corp. Ltd. ‘H’ HKD 6,426,500 2,791,286 0.17CSPC Pharmaceutical Group Ltd.
(Hong Kong) (2) HKD 6,011,166 5,345,738 0.33Huadian Power International Corp. Ltd. ‘H’ HKD 6,333,237 3,011,979 0.19JD.com, Inc., ADR (Cayman Islands) (2) USD 357,268 7,291,840 0.45NetEase, Inc., ADR (Cayman Islands) (2) USD 25,710 4,858,676 0.30New Oriental Education & Technology
Group, Inc., ADR (Cayman Islands) (2) USD 88,852 3,712,237 0.23Shanghai Jin Jiang International Hotels
Group Co. Ltd. ‘H’ HKD 5,850,000 1,907,551 0.12Shenzhen International Holdings Ltd.
(Bermuda) (1) (2) HKD 2,944,108 4,249,830 0.26Shenzhou International Group Holdings Ltd.
(Cayman Islands) (1) (2) HKD 1,477,000 7,129,058 0.44
INVESTMENT AIM
To seek to maximise total return, measured in US dollars, through investment primarily in securities located in and or deriving a significant portion of earnings from emerging countries.
Emerging Markets Equity Fund

23 Morgan Stanley Investment Funds 30 June 2016
The accompanying notes are an integral part of these financial statements.
Emerging Markets Equity Fund (continued)
SCHEDULE OF INVESTMENTSAs at 30 June 2016
Investments Currency
Quantity/Nominal
Value
Market Value USD
% of Net Assets
Transferable securities and money market instruments admitted to official exchange listing or dealt in on another regulated market
Equities (continued)
China (continued)TAL Education Group, ADR
(Cayman Islands) (2) USD 94,268 5,662,679 0.35Tencent Holdings Ltd. (Cayman Islands) (2) HKD 3,006,750 68,242,750 4.23
260,458,835 16.13
ColombiaCemex Latam Holdings SA (Spain) (2) COP 1,056,926 4,576,344 0.28Grupo de Inversiones Suramericana SA COP 453,414 5,892,756 0.37Grupo de Inversiones Suramericana SA
Preference COP 174,977 2,228,664 0.14
12,697,764 0.79
Czech RepublicKomercni banka A/S CZK 427,172 15,973,647 0.99
15,973,647 0.99
EgyptCommercial International Bank Egypt SAE EGP 1,486,506 6,667,553 0.41
6,667,553 0.41
Hong KongAIA Group Ltd. (1) HKD 3,257,000 19,456,618 1.20Samsonite International SA
(Luxembourg) (1) (2) HKD 7,929,974 21,922,945 1.36
41,379,563 2.56
IndiaAshok Leyland Ltd. INR 14,538,177 21,174,820 1.31Bharat Financial Inclusion Ltd. INR 480,122 5,270,854 0.33Bharat Petroleum Corp. Ltd. INR 949,846 15,081,487 0.93Glenmark Pharmaceuticals Ltd. INR 608,872 7,205,023 0.45HDFC Bank Ltd. (3) INR 882,997 17,834,623 1.10IndusInd Bank Ltd. INR 1,163,215 19,148,905 1.19Larsen & Toubro Ltd. INR 783,954 17,374,116 1.08Marico Ltd. INR 2,979,962 11,632,995 0.72Maruti Suzuki India Ltd. INR 234,004 14,510,500 0.90Shree Cement Ltd. INR 87,611 18,873,440 1.17Shriram Transport Finance Co. Ltd. INR 1,111,716 19,820,731 1.23Zee Entertainment Enterprises Ltd. INR 1,206,718 8,157,968 0.50
176,085,462 10.91
IndonesiaBank Mandiri Persero Tbk. PT IDR 648,700 467,635 0.03Bank Negara Indonesia Persero Tbk. PT IDR 18,340,800 7,218,055 0.45Bumi Serpong Damai Tbk. PT IDR 41,118,200 6,566,215 0.40Jasa Marga Persero Tbk. PT IDR 12,839,100 5,125,729 0.32Link Net Tbk. PT IDR 18,508,791 5,687,254 0.35Matahari Department Store Tbk. PT IDR 11,177,639 16,919,154 1.05Semen Indonesia Persero Tbk. PT IDR 982,300 695,111 0.04Surya Citra Media Tbk. PT IDR 20,659,982 5,159,914 0.32United Tractors Tbk. PT IDR 5,343,200 5,984,966 0.37XL Axiata Tbk. PT IDR 34,750,873 9,652,290 0.60
63,476,323 3.93
SCHEDULE OF INVESTMENTSAs at 30 June 2016
Investments Currency
Quantity/Nominal
Value
Market Value USD
% of Net Assets
Transferable securities and money market instruments admitted to official exchange listing or dealt in on another regulated market
Equities (continued)
MexicoAlfa SAB de CV ‘A’ MXN 4,798,126 7,906,025 0.49Alsea SAB de CV (1) MXN 2,065,968 7,814,072 0.48Cemex SAB de CV, ADR USD 2,549,472 15,118,369 0.94Fomento Economico Mexicano SAB
de CV, ADR USD 308,461 28,264,282 1.75Grupo Financiero Banorte SAB de CV ‘O’ (1) MXN 4,225,423 22,804,992 1.41Grupo Financiero Santander Mexico SAB
de CV, ADR USD 882,791 7,865,668 0.49Mexichem SAB de CV (1) MXN 3,633,095 7,480,507 0.46
97,253,915 6.02
PakistanLucky Cement Ltd. PKR 1,594,574 9,872,050 0.61United Bank Ltd. PKR 6,273,627 10,595,991 0.66
20,468,041 1.27
PanamaCopa Holdings SA ‘A’ USD 111,205 5,710,377 0.35
5,710,377 0.35
PeruCia de Minas Buenaventura SAA, ADR USD 775,413 9,056,824 0.56Credicorp Ltd. (Bermuda) (2) USD 172,283 26,622,892 1.65
35,679,716 2.21
PhilippinesAyala Corp. PHP 333,870 6,019,061 0.37BDO Unibank, Inc. PHP 2,796,725 6,651,375 0.41DMCI Holdings, Inc. PHP 26,170,591 7,002,090 0.43International Container Terminal
Services, Inc. PHP 3,885,278 5,073,888 0.31LT Group, Inc. PHP 19,056,164 6,442,022 0.40Metro Pacific Investments Corp. PHP 62,680,274 9,276,994 0.58Metropolitan Bank & Trust Co. PHP 7,725,084 14,820,915 0.92SM Investments Corp. PHP 628,752 12,910,691 0.80
68,197,036 4.22
PolandBank Pekao SA (1) PLN 239,599 8,203,091 0.51CCC SA (1) PLN 249,688 10,131,912 0.63Eurocash SA PLN 594,495 6,952,082 0.43Jeronimo Martins SGPS SA
(Portugal) (1) (2) EUR 871,275 13,593,516 0.84LPP SA (1) PLN 4,386 5,555,070 0.34PKP Cargo SA (1) PLN 225,565 1,878,857 0.12Polski Koncern Naftowy ORLEN SA (1) PLN 453,763 7,892,722 0.49
54,207,250 3.36
RussiaMail.Ru Group Ltd., GDR Preference
(British Virgin Islands) (2) USD 483,655 8,778,338 0.54MMC Norilsk Nickel PJSC, ADR USD 549,657 7,260,969 0.45X5 Retail Group NV, GDR (Netherlands) (2) USD 263,825 5,236,927 0.33Yandex NV ‘A’ (Netherlands) (2) USD 487,039 10,442,116 0.65
31,718,350 1.97
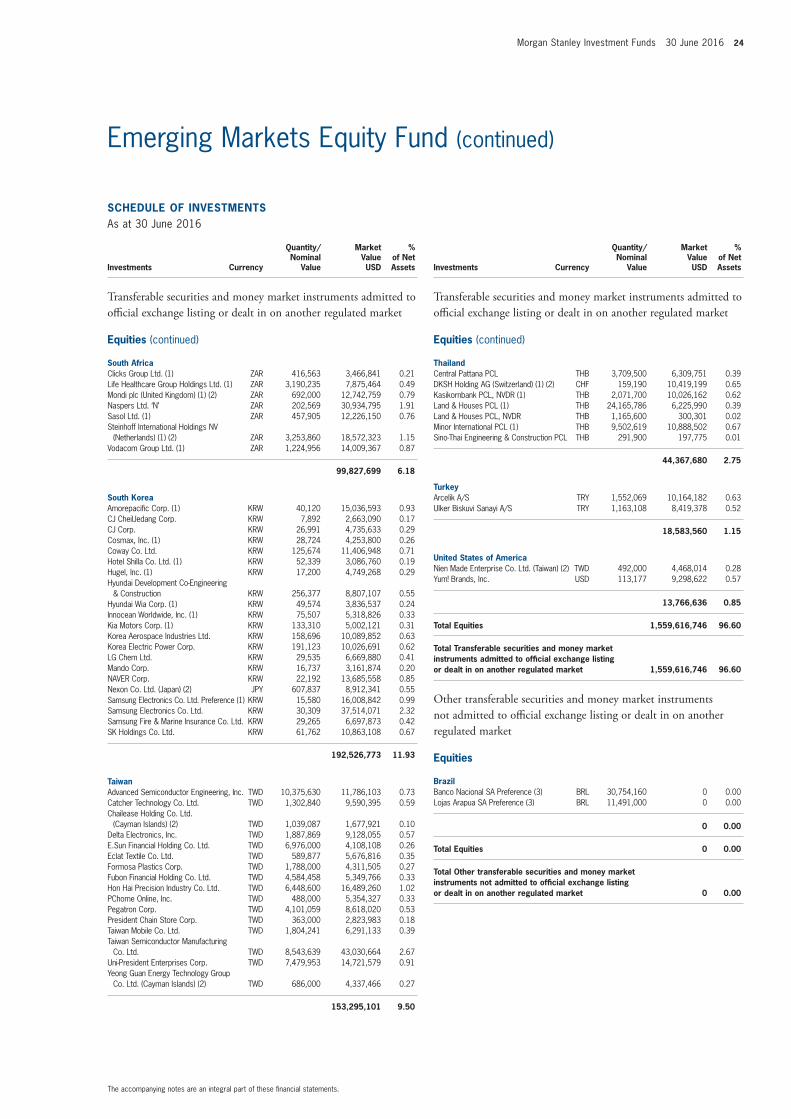
Morgan Stanley Investment Funds 30 June 2016 24
The accompanying notes are an integral part of these financial statements.
Emerging Markets Equity Fund (continued)
SCHEDULE OF INVESTMENTSAs at 30 June 2016
Investments Currency
Quantity/Nominal
Value
Market Value USD
% of Net Assets
Transferable securities and money market instruments admitted to official exchange listing or dealt in on another regulated market
Equities (continued)
South AfricaClicks Group Ltd. (1) ZAR 416,563 3,466,841 0.21Life Healthcare Group Holdings Ltd. (1) ZAR 3,190,235 7,875,464 0.49Mondi plc (United Kingdom) (1) (2) ZAR 692,000 12,742,759 0.79Naspers Ltd. ‘N’ ZAR 202,569 30,934,795 1.91Sasol Ltd. (1) ZAR 457,905 12,226,150 0.76Steinhoff International Holdings NV
(Netherlands) (1) (2) ZAR 3,253,860 18,572,323 1.15Vodacom Group Ltd. (1) ZAR 1,224,956 14,009,367 0.87
99,827,699 6.18
South KoreaAmorepacific Corp. (1) KRW 40,120 15,036,593 0.93CJ CheilJedang Corp. KRW 7,892 2,663,090 0.17CJ Corp. KRW 26,991 4,735,633 0.29Cosmax, Inc. (1) KRW 28,724 4,253,800 0.26Coway Co. Ltd. KRW 125,674 11,406,948 0.71Hotel Shilla Co. Ltd. (1) KRW 52,339 3,086,760 0.19Hugel, Inc. (1) KRW 17,200 4,749,268 0.29Hyundai Development Co-Engineering
& Construction KRW 256,377 8,807,107 0.55Hyundai Wia Corp. (1) KRW 49,574 3,836,537 0.24Innocean Worldwide, Inc. (1) KRW 75,507 5,318,826 0.33Kia Motors Corp. (1) KRW 133,310 5,002,121 0.31Korea Aerospace Industries Ltd. KRW 158,696 10,089,852 0.63Korea Electric Power Corp. KRW 191,123 10,026,691 0.62LG Chem Ltd. KRW 29,535 6,669,880 0.41Mando Corp. KRW 16,737 3,161,874 0.20NAVER Corp. KRW 22,192 13,685,558 0.85Nexon Co. Ltd. (Japan) (2) JPY 607,837 8,912,341 0.55Samsung Electronics Co. Ltd. Preference (1) KRW 15,580 16,008,842 0.99Samsung Electronics Co. Ltd. KRW 30,309 37,514,071 2.32Samsung Fire & Marine Insurance Co. Ltd. KRW 29,265 6,697,873 0.42SK Holdings Co. Ltd. KRW 61,762 10,863,108 0.67
192,526,773 11.93
TaiwanAdvanced Semiconductor Engineering, Inc. TWD 10,375,630 11,786,103 0.73Catcher Technology Co. Ltd. TWD 1,302,840 9,590,395 0.59Chailease Holding Co. Ltd.
(Cayman Islands) (2) TWD 1,039,087 1,677,921 0.10Delta Electronics, Inc. TWD 1,887,869 9,128,055 0.57E.Sun Financial Holding Co. Ltd. TWD 6,976,000 4,108,108 0.26Eclat Textile Co. Ltd. TWD 589,877 5,676,816 0.35Formosa Plastics Corp. TWD 1,788,000 4,311,505 0.27Fubon Financial Holding Co. Ltd. TWD 4,584,458 5,349,766 0.33Hon Hai Precision Industry Co. Ltd. TWD 6,448,600 16,489,260 1.02PChome Online, Inc. TWD 488,000 5,354,327 0.33Pegatron Corp. TWD 4,101,059 8,618,020 0.53President Chain Store Corp. TWD 363,000 2,823,983 0.18Taiwan Mobile Co. Ltd. TWD 1,804,241 6,291,133 0.39Taiwan Semiconductor Manufacturing
Co. Ltd. TWD 8,543,639 43,030,664 2.67Uni-President Enterprises Corp. TWD 7,479,953 14,721,579 0.91Yeong Guan Energy Technology Group
Co. Ltd. (Cayman Islands) (2) TWD 686,000 4,337,466 0.27
153,295,101 9.50
SCHEDULE OF INVESTMENTSAs at 30 June 2016
Investments Currency
Quantity/Nominal
Value
Market Value USD
% of Net Assets
Transferable securities and money market instruments admitted to official exchange listing or dealt in on another regulated market
Equities (continued)
ThailandCentral Pattana PCL THB 3,709,500 6,309,751 0.39DKSH Holding AG (Switzerland) (1) (2) CHF 159,190 10,419,199 0.65Kasikornbank PCL, NVDR (1) THB 2,071,700 10,026,162 0.62Land & Houses PCL (1) THB 24,165,786 6,225,990 0.39Land & Houses PCL, NVDR THB 1,165,600 300,301 0.02Minor International PCL (1) THB 9,502,619 10,888,502 0.67Sino-Thai Engineering & Construction PCL THB 291,900 197,775 0.01
44,367,680 2.75
TurkeyArcelik A/S TRY 1,552,069 10,164,182 0.63Ulker Biskuvi Sanayi A/S TRY 1,163,108 8,419,378 0.52
18,583,560 1.15
United States of AmericaNien Made Enterprise Co. Ltd. (Taiwan) (2) TWD 492,000 4,468,014 0.28Yum! Brands, Inc. USD 113,177 9,298,622 0.57
13,766,636 0.85
Total Equities 1,559,616,746 96.60
Total Transferable securities and money market instruments admitted to official exchange listing or dealt in on another regulated market 1,559,616,746 96.60
Other transferable securities and money market instruments not admitted to official exchange listing or dealt in on another regulated market
Equities
BrazilBanco Nacional SA Preference (3) BRL 30,754,160 0 0.00Lojas Arapua SA Preference (3) BRL 11,491,000 0 0.00
0 0.00
Total Equities 0 0.00
Total Other transferable securities and money market instruments not admitted to official exchange listing or dealt in on another regulated market 0 0.00

25 Morgan Stanley Investment Funds 30 June 2016
The accompanying notes are an integral part of these financial statements.
Emerging Markets Equity Fund (continued)
SCHEDULE OF INVESTMENTSAs at 30 June 2016
Investments Currency
Quantity/Nominal
Value
Market Value USD
% of Net Assets
Units of authorised UCITS or other collective investment undertakings
Collective Investment Schemes – UCITS
LuxembourgMorgan Stanley Liquidity Funds US Dollar
Liquidity Fund – MS Reserve (4) USD 39,276,925 39,276,925 2.43
39,276,925 2.43
Total Collective Investment Schemes – UCITS 39,276,925 2.43
Total Units of authorised UCITS or other collective investment undertakings 39,276,925 2.43
Total Investments 1,598,893,671 99.03
Cash 3,927,051 0.24
Other Assets/(Liabilities) 11,666,582 0.73
Total Net Assets 1,614,487,304 100.00
(1) All or part of this position is out on loan.(2) The country in brackets represents the country of incorporation of this security.(3) Security is valued at its fair value under the direction of the Board of Directors of the SICAV.(4) Affiliate managed by an affiliate of the Investment Adviser.
Forward Currency Exchange Contracts
Currency Purchased
Amount Purchased
Currency Sold
Amount Sold
Maturity Date Counterparty
Unrealised Gain/(Loss)
USD
% of Net Assets
USD 30,589,984 EUR 27,082,766 21/07/2016 UBS 464,846 0.03
Unrealised Gain on Forward Currency Exchange Contracts 464,846 0.03
Total Unrealised Gain on Forward Currency Exchange Contracts 464,846 0.03
Net Unrealised Gain on Forward Currency Exchange Contracts 464,846 0.03
DERIVATIVES
Over-the-counter (OTC) and exchange traded derivatives as at 30 June 2016, expressed in US dollars.

Morgan Stanley Investment Funds 30 June 2016 26
The accompanying notes are an integral part of these financial statements.
Please refer to the full prospectus for the Fund’s investment objective and policy.
European Champions Fund*
* Fund commenced operations on 8 April 2016.
INVESTMENT AIM
To seek long-term capital growth, measured in Euro by investing primarily in equity securities, including depository receipts (American Depository Receipts (ADRs) and European Depository Receipts (EDRs)), of companies located in Europe.
SCHEDULE OF INVESTMENTSAs at 30 June 2016
Investments Currency
Quantity/Nominal
Value
Market Value EUR
% of Net Assets
Transferable securities and money market instruments admitted to official exchange listing or dealt in on another regulated market
Equities
DenmarkColoplast A/S ‘B’ DKK 12,011 801,875 4.45Novo Nordisk A/S ‘B’ DKK 15,128 722,250 4.01
1,524,125 8.46
FranceEssilor International SA EUR 6,815 808,600 4.49Hermes International EUR 2,115 708,102 3.93Publicis Groupe SA EUR 11,136 674,507 3.75
2,191,209 12.17
GermanyContinental AG EUR 3,534 595,479 3.31Fresenius SE & Co. KGaA EUR 12,357 802,587 4.45Henkel AG & Co. KGaA EUR 8,202 789,197 4.38SAP SE EUR 9,932 663,954 3.69Symrise AG EUR 13,432 814,651 4.52
3,665,868 20.35
NetherlandsASML Holding NV EUR 8,365 732,941 4.07RELX NV EUR 46,855 726,253 4.03
1,459,194 8.10
SpainAmadeus IT Holding SA ‘A’ EUR 20,812 816,767 4.54
816,767 4.54
SwedenAssa Abloy AB ‘B’ SEK 43,972 797,640 4.43
797,640 4.43
SwitzerlandCie Financiere Richemont SA CHF 10,169 530,225 2.94Geberit AG CHF 2,476 839,049 4.66Nestle SA CHF 11,427 790,383 4.39Novartis AG CHF 8,384 613,175 3.40Roche Holding AG CHF 2,969 694,579 3.86
3,467,411 19.25
United KingdomARM Holdings plc GBP 52,230 696,386 3.87British American Tobacco plc GBP 15,162 867,639 4.82Experian plc (Jersey) (2) GBP 44,958 751,594 4.17Reckitt Benckiser Group plc GBP 9,476 840,194 4.66
3,155,813 17.52
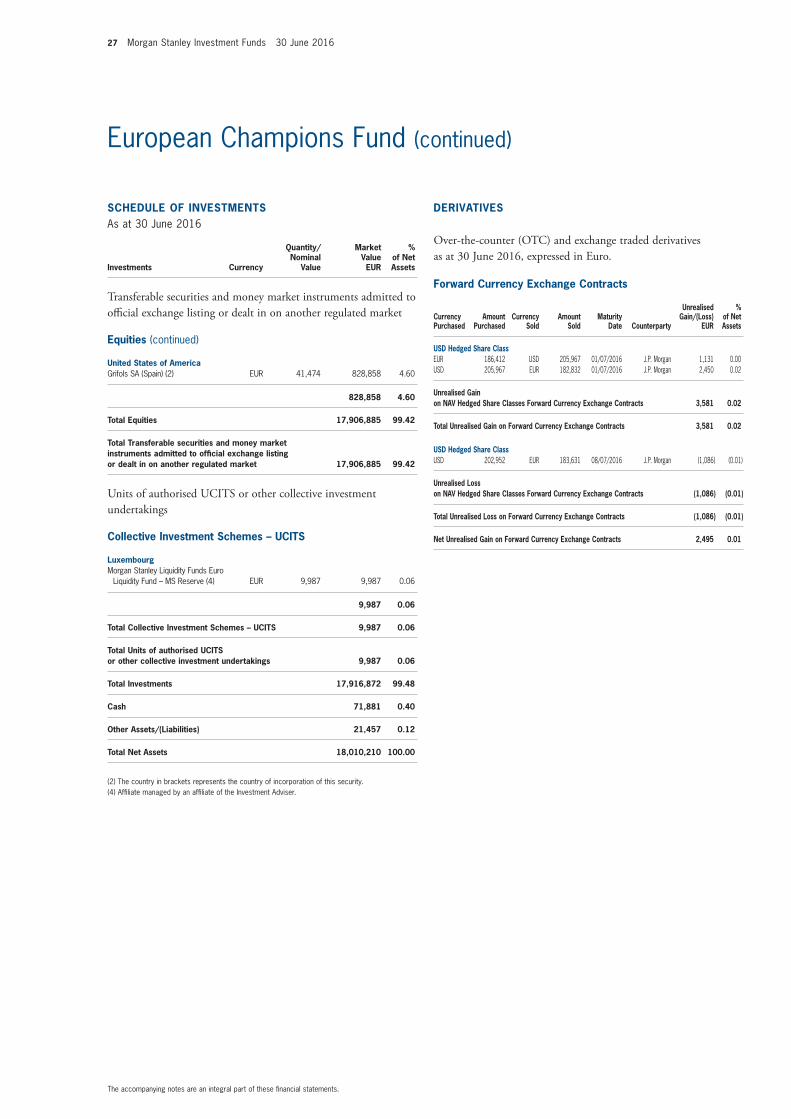
27 Morgan Stanley Investment Funds 30 June 2016
The accompanying notes are an integral part of these financial statements.
European Champions Fund (continued)
SCHEDULE OF INVESTMENTSAs at 30 June 2016
Investments Currency
Quantity/Nominal
Value
Market Value EUR
% of Net Assets
Transferable securities and money market instruments admitted to official exchange listing or dealt in on another regulated market
Equities (continued)
United States of AmericaGrifols SA (Spain) (2) EUR 41,474 828,858 4.60
828,858 4.60
Total Equities 17,906,885 99.42
Total Transferable securities and money market instruments admitted to official exchange listing or dealt in on another regulated market 17,906,885 99.42
Units of authorised UCITS or other collective investment undertakings
Collective Investment Schemes – UCITS
LuxembourgMorgan Stanley Liquidity Funds Euro
Liquidity Fund – MS Reserve (4) EUR 9,987 9,987 0.06
9,987 0.06
Total Collective Investment Schemes – UCITS 9,987 0.06
Total Units of authorised UCITS or other collective investment undertakings 9,987 0.06
Total Investments 17,916,872 99.48
Cash 71,881 0.40
Other Assets/(Liabilities) 21,457 0.12
Total Net Assets 18,010,210 100.00
(2) The country in brackets represents the country of incorporation of this security.(4) Affiliate managed by an affiliate of the Investment Adviser.
DERIVATIVES
Over-the-counter (OTC) and exchange traded derivatives as at 30 June 2016, expressed in Euro.
Forward Currency Exchange Contracts
Currency Purchased
Amount Purchased
Currency Sold
Amount Sold
Maturity Date Counterparty
Unrealised Gain/(Loss)
EUR
% of Net Assets
USD Hedged Share ClassEUR 186,412 USD 205,967 01/07/2016 J.P. Morgan 1,131 0.00USD 205,967 EUR 182,832 01/07/2016 J.P. Morgan 2,450 0.02
Unrealised Gain on NAV Hedged Share Classes Forward Currency Exchange Contracts 3,581 0.02
Total Unrealised Gain on Forward Currency Exchange Contracts 3,581 0.02
USD Hedged Share ClassUSD 202,952 EUR 183,631 08/07/2016 J.P. Morgan (1,086) (0.01)
Unrealised Loss on NAV Hedged Share Classes Forward Currency Exchange Contracts (1,086) (0.01)
Total Unrealised Loss on Forward Currency Exchange Contracts (1,086) (0.01)
Net Unrealised Gain on Forward Currency Exchange Contracts 2,495 0.01
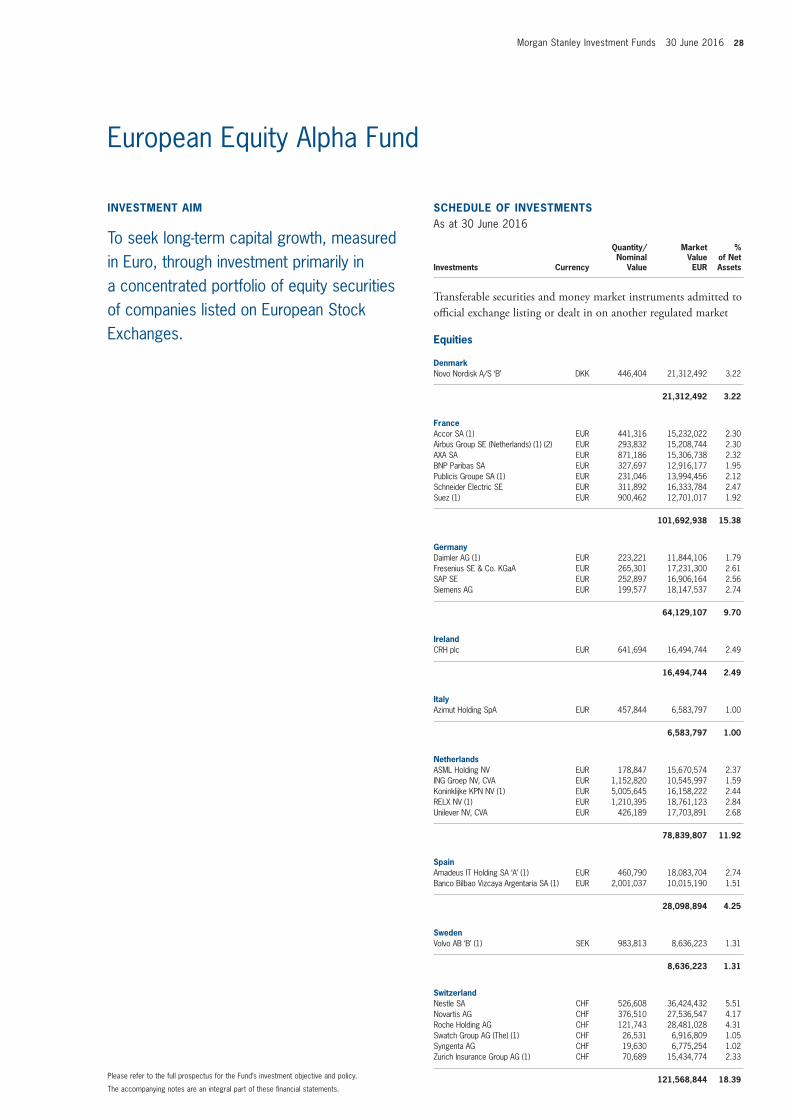
Morgan Stanley Investment Funds 30 June 2016 28
The accompanying notes are an integral part of these financial statements.
Please refer to the full prospectus for the Fund’s investment objective and policy.
SCHEDULE OF INVESTMENTSAs at 30 June 2016
Investments Currency
Quantity/Nominal
Value
Market Value EUR
% of Net Assets
Transferable securities and money market instruments admitted to official exchange listing or dealt in on another regulated market
Equities
DenmarkNovo Nordisk A/S ‘B’ DKK 446,404 21,312,492 3.22
21,312,492 3.22
FranceAccor SA (1) EUR 441,316 15,232,022 2.30Airbus Group SE (Netherlands) (1) (2) EUR 293,832 15,208,744 2.30AXA SA EUR 871,186 15,306,738 2.32BNP Paribas SA EUR 327,697 12,916,177 1.95Publicis Groupe SA (1) EUR 231,046 13,994,456 2.12Schneider Electric SE EUR 311,892 16,333,784 2.47Suez (1) EUR 900,462 12,701,017 1.92
101,692,938 15.38
GermanyDaimler AG (1) EUR 223,221 11,844,106 1.79Fresenius SE & Co. KGaA EUR 265,301 17,231,300 2.61SAP SE EUR 252,897 16,906,164 2.56Siemens AG EUR 199,577 18,147,537 2.74
64,129,107 9.70
IrelandCRH plc EUR 641,694 16,494,744 2.49
16,494,744 2.49
ItalyAzimut Holding SpA EUR 457,844 6,583,797 1.00
6,583,797 1.00
NetherlandsASML Holding NV EUR 178,847 15,670,574 2.37ING Groep NV, CVA EUR 1,152,820 10,545,997 1.59Koninklijke KPN NV (1) EUR 5,005,645 16,158,222 2.44RELX NV (1) EUR 1,210,395 18,761,123 2.84Unilever NV, CVA EUR 426,189 17,703,891 2.68
78,839,807 11.92
SpainAmadeus IT Holding SA ‘A’ (1) EUR 460,790 18,083,704 2.74Banco Bilbao Vizcaya Argentaria SA (1) EUR 2,001,037 10,015,190 1.51
28,098,894 4.25
SwedenVolvo AB ‘B’ (1) SEK 983,813 8,636,223 1.31
8,636,223 1.31
SwitzerlandNestle SA CHF 526,608 36,424,432 5.51Novartis AG CHF 376,510 27,536,547 4.17Roche Holding AG CHF 121,743 28,481,028 4.31Swatch Group AG (The) (1) CHF 26,531 6,916,809 1.05Syngenta AG CHF 19,630 6,775,254 1.02Zurich Insurance Group AG (1) CHF 70,689 15,434,774 2.33
121,568,844 18.39
INVESTMENT AIM
To seek long-term capital growth, measured in Euro, through investment primarily in a concentrated portfolio of equity securities of companies listed on European Stock Exchanges.
European Equity Alpha Fund
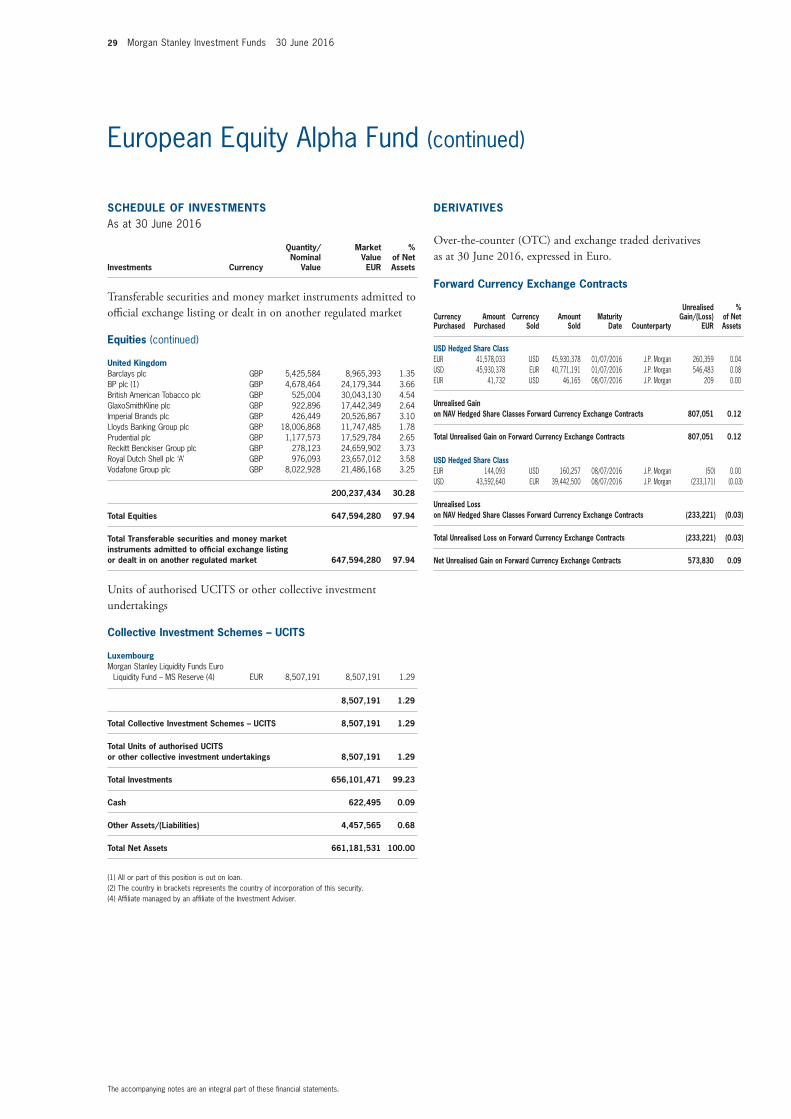
29 Morgan Stanley Investment Funds 30 June 2016
The accompanying notes are an integral part of these financial statements.
European Equity Alpha Fund (continued)
SCHEDULE OF INVESTMENTSAs at 30 June 2016
Investments Currency
Quantity/Nominal
Value
Market Value EUR
% of Net Assets
Transferable securities and money market instruments admitted to official exchange listing or dealt in on another regulated market
Equities (continued)
United KingdomBarclays plc GBP 5,425,584 8,965,393 1.35BP plc (1) GBP 4,678,464 24,179,344 3.66British American Tobacco plc GBP 525,004 30,043,130 4.54GlaxoSmithKline plc GBP 922,896 17,442,349 2.64Imperial Brands plc GBP 426,449 20,526,867 3.10Lloyds Banking Group plc GBP 18,006,868 11,747,485 1.78Prudential plc GBP 1,177,573 17,529,784 2.65Reckitt Benckiser Group plc GBP 278,123 24,659,902 3.73Royal Dutch Shell plc ‘A’ GBP 976,093 23,657,012 3.58Vodafone Group plc GBP 8,022,928 21,486,168 3.25
200,237,434 30.28
Total Equities 647,594,280 97.94
Total Transferable securities and money market instruments admitted to official exchange listing or dealt in on another regulated market 647,594,280 97.94
Units of authorised UCITS or other collective investment undertakings
Collective Investment Schemes – UCITS
LuxembourgMorgan Stanley Liquidity Funds Euro
Liquidity Fund – MS Reserve (4) EUR 8,507,191 8,507,191 1.29
8,507,191 1.29
Total Collective Investment Schemes – UCITS 8,507,191 1.29
Total Units of authorised UCITS or other collective investment undertakings 8,507,191 1.29
Total Investments 656,101,471 99.23
Cash 622,495 0.09
Other Assets/(Liabilities) 4,457,565 0.68
Total Net Assets 661,181,531 100.00
(1) All or part of this position is out on loan.(2) The country in brackets represents the country of incorporation of this security.(4) Affiliate managed by an affiliate of the Investment Adviser.
Forward Currency Exchange Contracts
Currency Purchased
Amount Purchased
Currency Sold
Amount Sold
Maturity Date Counterparty
Unrealised Gain/(Loss)
EUR
% of Net Assets
USD Hedged Share ClassEUR 41,578,033 USD 45,930,378 01/07/2016 J.P. Morgan 260,359 0.04USD 45,930,378 EUR 40,771,191 01/07/2016 J.P. Morgan 546,483 0.08EUR 41,732 USD 46,165 08/07/2016 J.P. Morgan 209 0.00
Unrealised Gain on NAV Hedged Share Classes Forward Currency Exchange Contracts 807,051 0.12
Total Unrealised Gain on Forward Currency Exchange Contracts 807,051 0.12
USD Hedged Share ClassEUR 144,093 USD 160,257 08/07/2016 J.P. Morgan (50) 0.00USD 43,592,640 EUR 39,442,500 08/07/2016 J.P. Morgan (233,171) (0.03)
Unrealised Loss on NAV Hedged Share Classes Forward Currency Exchange Contracts (233,221) (0.03)
Total Unrealised Loss on Forward Currency Exchange Contracts (233,221) (0.03)
Net Unrealised Gain on Forward Currency Exchange Contracts 573,830 0.09
DERIVATIVES
Over-the-counter (OTC) and exchange traded derivatives as at 30 June 2016, expressed in Euro.

Morgan Stanley Investment Funds 30 June 2016 30
The accompanying notes are an integral part of these financial statements.
Please refer to the full prospectus for the Fund’s investment objective and policy.
INVESTMENT AIM
To seek long-term capital appreciation, measured in Euro, through investment in the equity securities of companies in the European real estate industry.
SCHEDULE OF INVESTMENTSAs at 30 June 2016
Investments Currency
Quantity/Nominal
Value
Market Value EUR
% of Net Assets
Transferable securities and money market instruments admitted to official exchange listing or dealt in on another regulated market
Equities
AustriaAtrium European Real Estate Ltd.
(Jersey) (2) EUR 1,260,616 4,857,153 1.63BUWOG AG EUR 75,155 1,555,333 0.52
6,412,486 2.15
FinlandCitycon OYJ EUR 5,301,466 10,857,402 3.63
10,857,402 3.63
FranceFonciere Des Regions, REIT EUR 72,872 5,787,494 1.94Gecina SA, REIT EUR 95,134 11,644,402 3.90ICADE, REIT EUR 182,568 11,614,976 3.89Klepierre, REIT EUR 347,048 13,854,156 4.64Unibail-Rodamco SE, REIT EUR 100,687 23,565,792 7.89
66,466,820 22.26
GermanyADO Properties SA (Luxembourg) (2) EUR 42,693 1,478,885 0.50alstria office REIT-AG EUR 120,022 1,446,265 0.48Deutsche EuroShop AG EUR 32,155 1,312,567 0.44Deutsche Wohnen AG EUR 224,935 6,839,149 2.29Vonovia SE EUR 386,979 12,683,237 4.25
23,760,103 7.96
IrelandGreen REIT plc EUR 5,264,130 7,303,565 2.45Hibernia REIT plc EUR 5,637,336 7,497,657 2.51
14,801,222 4.96
ItalyBeni Stabili SpA SIIQ, REIT EUR 2,782,724 1,572,239 0.53
1,572,239 0.53
NetherlandsEurocommercial Properties NV, REIT, CVA EUR 178,130 6,809,910 2.28Vastned Retail NV, REIT EUR 32,838 1,200,065 0.40Wereldhave NV, REIT EUR 127,293 5,187,826 1.74
13,197,801 4.42
NorwayEntra ASA NOK 1,482,589 12,461,257 4.17Norwegian Property ASA NOK 1,202,838 1,174,432 0.39
13,635,689 4.56
SpainHispania Activos Inmobiliarios SA, REIT EUR 13,715 144,487 0.05Inmobiliaria Colonial SA EUR 3,096,637 1,991,138 0.66Merlin Properties Socimi SA, REIT EUR 355,501 3,283,052 1.10
5,418,677 1.81
European Property Fund

31 Morgan Stanley Investment Funds 30 June 2016
The accompanying notes are an integral part of these financial statements.
European Property Fund (continued)
SCHEDULE OF INVESTMENTSAs at 30 June 2016
Investments Currency
Quantity/Nominal
Value
Market Value EUR
% of Net Assets
Transferable securities and money market instruments admitted to official exchange listing or dealt in on another regulated market
Equities (continued)
SwedenAtrium Ljungberg AB ‘B’ SEK 287,703 4,166,544 1.40Castellum AB SEK 352,979 4,483,185 1.50Fabege AB SEK 57,423 868,742 0.29Hufvudstaden AB ‘A’ SEK 500,460 6,971,812 2.33
16,490,283 5.52
SwitzerlandMobimo Holding AG CHF 1,305 267,842 0.09PSP Swiss Property AG CHF 162,671 14,276,586 4.78
14,544,428 4.87
United KingdomBritish Land Co. plc (The), REIT GBP 2,570,476 18,565,463 6.22Capital & Regional plc, REIT GBP 5,125,058 3,267,951 1.09Derwent London plc, REIT GBP 253,116 7,906,175 2.65Grainger plc GBP 470,744 1,200,095 0.40Great Portland Estates plc, REIT (1) GBP 922,460 6,879,978 2.30Hammerson plc, REIT GBP 1,681,907 10,511,068 3.52Helical Bar plc GBP 409,437 1,426,628 0.48Intu Properties plc, REIT (1) GBP 2,810,067 9,650,331 3.23Kennedy Wilson Europe Real Estate plc
(Jersey) (1) (2) GBP 189,957 2,188,278 0.73Land Securities Group plc, REIT GBP 1,825,629 22,619,901 7.58LXB Retail Properties plc (Jersey) (2) GBP 3,360,987 2,559,539 0.86Segro plc, REIT GBP 869,412 4,317,282 1.45Shaftesbury plc, REIT GBP 42,819 452,638 0.15ST Modwen Properties plc (1) GBP 1,783,933 5,675,691 1.90UNITE Group plc (The) (1) GBP 295,119 2,201,084 0.74Urban & Civic plc GBP 1,754,882 4,454,731 1.49Workspace Group plc, REIT (1) GBP 240,456 1,980,869 0.66
105,857,702 35.45
Total Equities 293,014,852 98.12
Total Transferable securities and money market instruments admitted to official exchange listing or dealt in on another regulated market 293,014,852 98.12
SCHEDULE OF INVESTMENTSAs at 30 June 2016
Investments Currency
Quantity/Nominal
Value
Market Value EUR
% of Net Assets
Units of authorised UCITS or other collective investment undertakings
Collective Investment Schemes – UCITS
LuxembourgMorgan Stanley Liquidity Funds Euro
Liquidity Fund – MS Reserve (4) EUR 6,706,692 6,706,692 2.25
6,706,692 2.25
Total Collective Investment Schemes – UCITS 6,706,692 2.25
Total Units of authorised UCITS or other collective investment undertakings 6,706,692 2.25
Total Investments 299,721,544 100.37
Cash 597,816 0.20
Other Assets/(Liabilities) (1,711,838) (0.57)
Total Net Assets 298,607,522 100.00
(1) All or part of this position is out on loan.(2) The country in brackets represents the country of incorporation of this security.(4) Affiliate managed by an affiliate of the Investment Adviser.
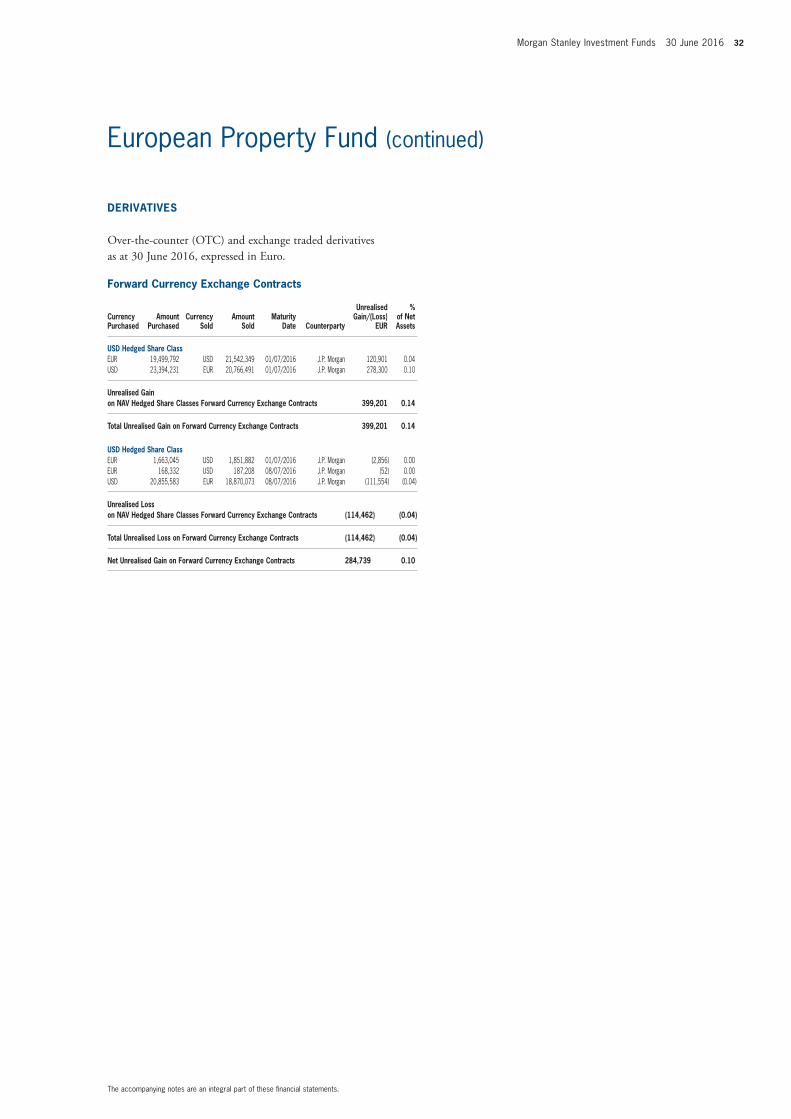
Morgan Stanley Investment Funds 30 June 2016 32
The accompanying notes are an integral part of these financial statements.
European Property Fund (continued)
Forward Currency Exchange Contracts
Currency Purchased
Amount Purchased
Currency Sold
Amount Sold
Maturity Date Counterparty
Unrealised Gain/(Loss)
EUR
% of Net Assets
USD Hedged Share ClassEUR 19,499,792 USD 21,542,349 01/07/2016 J.P. Morgan 120,901 0.04USD 23,394,231 EUR 20,766,491 01/07/2016 J.P. Morgan 278,300 0.10
Unrealised Gain on NAV Hedged Share Classes Forward Currency Exchange Contracts 399,201 0.14
Total Unrealised Gain on Forward Currency Exchange Contracts 399,201 0.14
USD Hedged Share ClassEUR 1,663,045 USD 1,851,882 01/07/2016 J.P. Morgan (2,856) 0.00EUR 168,332 USD 187,208 08/07/2016 J.P. Morgan (52) 0.00USD 20,855,583 EUR 18,870,073 08/07/2016 J.P. Morgan (111,554) (0.04)
Unrealised Loss on NAV Hedged Share Classes Forward Currency Exchange Contracts (114,462) (0.04)
Total Unrealised Loss on Forward Currency Exchange Contracts (114,462) (0.04)
Net Unrealised Gain on Forward Currency Exchange Contracts 284,739 0.10
DERIVATIVES
Over-the-counter (OTC) and exchange traded derivatives as at 30 June 2016, expressed in Euro.

33 Morgan Stanley Investment Funds 30 June 2016
The accompanying notes are an integral part of these financial statements.
Please refer to the full prospectus for the Fund’s investment objective and policy.
INVESTMENT AIM
To seek attractive long-term capital growth, measured in Euro, through investment primarily in a concentrated portfolio of equity securities of companies domiciled or exercising the predominant part of their economic activity in the Eurozone (being those member states of the European Union which have adopted the Euro as their national currency).
SCHEDULE OF INVESTMENTSAs at 30 June 2016
Investments Currency
Quantity/Nominal
Value
Market Value EUR
% of Net Assets
Transferable securities and money market instruments admitted to official exchange listing or dealt in on another regulated market
Equities
FranceAccor SA (1) EUR 452,965 15,634,087 2.72Airbus Group SE (Netherlands) (1) (2) EUR 417,602 21,615,080 3.76AXA SA EUR 1,158,761 20,359,431 3.54BNP Paribas SA EUR 434,302 17,118,013 2.98Faurecia EUR 474,918 13,770,247 2.40Iliad SA EUR 72,286 13,184,966 2.29Publicis Groupe SA (1) EUR 309,829 18,766,343 3.26Schneider Electric SE EUR 387,035 20,269,023 3.53Suez EUR 1,041,684 14,692,953 2.56
155,410,143 27.04
GermanyAllianz SE EUR 193,850 24,473,563 4.26Daimler AG (1) EUR 365,294 19,382,500 3.37Fresenius SE & Co. KGaA EUR 335,297 21,777,540 3.79Henkel AG & Co. KGaA Preference EUR 205,064 22,259,697 3.87SAP SE EUR 405,891 27,133,813 4.72Siemens AG EUR 315,969 28,731,061 5.00Symrise AG (1) EUR 243,093 14,743,591 2.57
158,501,765 27.58
IrelandCRH plc EUR 802,341 20,624,175 3.59
20,624,175 3.59
ItalyAzimut Holding SpA EUR 860,790 12,378,160 2.15Eni SpA EUR 1,547,901 22,073,069 3.84
34,451,229 5.99
NetherlandsASML Holding NV EUR 253,355 22,198,965 3.86ING Groep NV, CVA EUR 2,254,300 20,622,336 3.59Koninklijke Ahold NV (1) EUR 993,368 19,658,753 3.42Koninklijke KPN NV (1) EUR 5,433,493 17,539,315 3.05RELX NV EUR 1,329,233 20,603,112 3.59Unilever NV, CVA EUR 743,830 30,898,698 5.38
131,521,179 22.89
SpainAmadeus IT Holding SA ‘A’ (1) EUR 506,929 19,894,429 3.46Banco Bilbao Vizcaya Argentaria SA (1) EUR 2,752,304 13,775,281 2.40Mediaset Espana Comunicacion SA EUR 1,104,900 10,982,706 1.91
44,652,416 7.77
United KingdomRoyal Dutch Shell plc ‘A’ (1) EUR 501,735 12,264,912 2.13
12,264,912 2.13
Total Equities 557,425,819 96.99
Total Transferable securities and money market instruments admitted to official exchange listing or dealt in on another regulated market 557,425,819 96.99
Eurozone Equity Alpha Fund

Morgan Stanley Investment Funds 30 June 2016 34
The accompanying notes are an integral part of these financial statements.
Eurozone Equity Alpha Fund (continued)
SCHEDULE OF INVESTMENTSAs at 30 June 2016
Investments Currency
Quantity/Nominal
Value
Market Value EUR
% of Net Assets
Units of authorised UCITS or other collective investment undertakings
Collective Investment Schemes – UCITS
LuxembourgMorgan Stanley Liquidity Funds Euro
Liquidity Fund – MS Reserve (4) EUR 7,057,951 7,057,951 1.23
7,057,951 1.23
Total Collective Investment Schemes – UCITS 7,057,951 1.23
Total Units of authorised UCITS or other collective investment undertakings 7,057,951 1.23
Total Investments 564,483,770 98.22
Cash (14,208) 0.00
Other Assets/(Liabilities) 10,236,578 1.78
Total Net Assets 574,706,140 100.00
(1) All or part of this position is out on loan.(2) The country in brackets represents the country of incorporation of this security.(4) Affiliate managed by an affiliate of the Investment Adviser.
DERIVATIVES
Over-the-counter (OTC) and exchange traded derivatives as at 30 June 2016, expressed in Euro.
Forward Currency Exchange Contracts
Currency Purchased
Amount Purchased
Currency Sold
Amount Sold
Maturity Date Counterparty
Unrealised Gain/(Loss)
EUR
% of Net Assets
USD Hedged Share ClassEUR 22,594,977 USD 24,955,345 01/07/2016 J.P. Morgan 145,852 0.02USD 24,955,345 EUR 22,152,205 01/07/2016 J.P. Morgan 296,920 0.06EUR 18,433 USD 20,391 08/07/2016 J.P. Morgan 93 0.00
Unrealised Gain on NAV Hedged Share Classes Forward Currency Exchange Contracts 442,865 0.08
Total Unrealised Gain on Forward Currency Exchange Contracts 442,865 0.08
USD Hedged Share ClassEUR 3,660 USD 4,070 08/07/2016 J.P. Morgan (1) 0.00USD 22,110,788 EUR 20,005,780 08/07/2016 J.P. Morgan (118,267) (0.02)
Unrealised Loss on NAV Hedged Share Classes Forward Currency Exchange Contracts (118,268) (0.02)
Total Unrealised Loss on Forward Currency Exchange Contracts (118,268) (0.02)
Net Unrealised Gain on Forward Currency Exchange Contracts 324,597 0.06

35 Morgan Stanley Investment Funds 30 June 2016
The accompanying notes are an integral part of these financial statements.
Please refer to the full prospectus for the Fund’s investment objective and policy.
INVESTMENT AIM
To seek long-term capital appreciation, measured in US dollars, by investing primarily in a portfolio of equity securities in frontier emerging market countries. The term “frontier emerging markets” refers to those emerging market countries outside the “mainstream” emerging markets, whose capital markets have traditionally been difficult for foreign investors to enter or are in early stages of capital market and/or economic development.
SCHEDULE OF INVESTMENTSAs at 30 June 2016
Investments Currency
Quantity/Nominal
Value
Market Value USD
% of Net Assets
Transferable securities and money market instruments admitted to official exchange listing or dealt in on another regulated market
Equities
ArgentinaBanco Macro SA, ADR USD 58,442 4,317,111 4.32BBVA Banco Frances SA, ADR USD 160,347 3,356,063 3.35Grupo Financiero Galicia SA, ADR USD 77,263 2,371,201 2.37Telecom Argentina SA, ADR USD 93,411 1,752,390 1.75YPF SA, ADR USD 125,328 2,437,630 2.44
14,234,395 14.23
BangladeshBeximco Pharmaceuticals Ltd. BDT 1,635,975 1,742,397 1.74GrameenPhone Ltd. BDT 129,296 420,047 0.42Olympic Industries Ltd. BDT 736,807 3,245,146 3.25
5,407,590 5.41
BrazilAdecoagro SA (Luxembourg) (2) USD 158,302 1,673,252 1.67MercadoLibre, Inc.
(United States of America) (2) USD 12,129 1,684,839 1.69
3,358,091 3.36
Costa RicaPriceSmart, Inc.
(United States of America) (2) USD 16,668 1,502,954 1.50
1,502,954 1.50
EgyptCommercial International Bank Egypt SAE EGP 643,871 2,888,010 2.89Edita Food Industries SAE EGP 879,679 1,485,952 1.48Integrated Diagnostics Holdings plc
(Jersey) (2) USD 317,338 1,269,352 1.27
5,643,314 5.64
KenyaEast African Breweries Ltd. KES 829,145 2,279,944 2.28Safaricom Ltd. KES 20,246,508 3,554,654 3.55
5,834,598 5.83
KuwaitBurgan Bank SAK KWD 990,380 1,066,265 1.06Kuwait Projects Co. Holding KSCP KWD 1,229,680 2,036,771 2.04Mezzan Holding Co. KSCC KWD 452,895 1,620,322 1.62National Bank of Kuwait SAKP KWD 3,438,935 6,721,343 6.72
11,444,701 11.44
MoroccoAttijariwafa Bank MAD 73,210 2,575,892 2.57
2,575,892 2.57
NigeriaLafarge Africa plc NGN 2,722,518 707,807 0.70Nigerian Breweries plc NGN 4,178,351 2,039,301 2.04Zenith Bank plc NGN 14,876,261 829,703 0.83
3,576,811 3.57
Frontier Emerging Markets Equity Fund
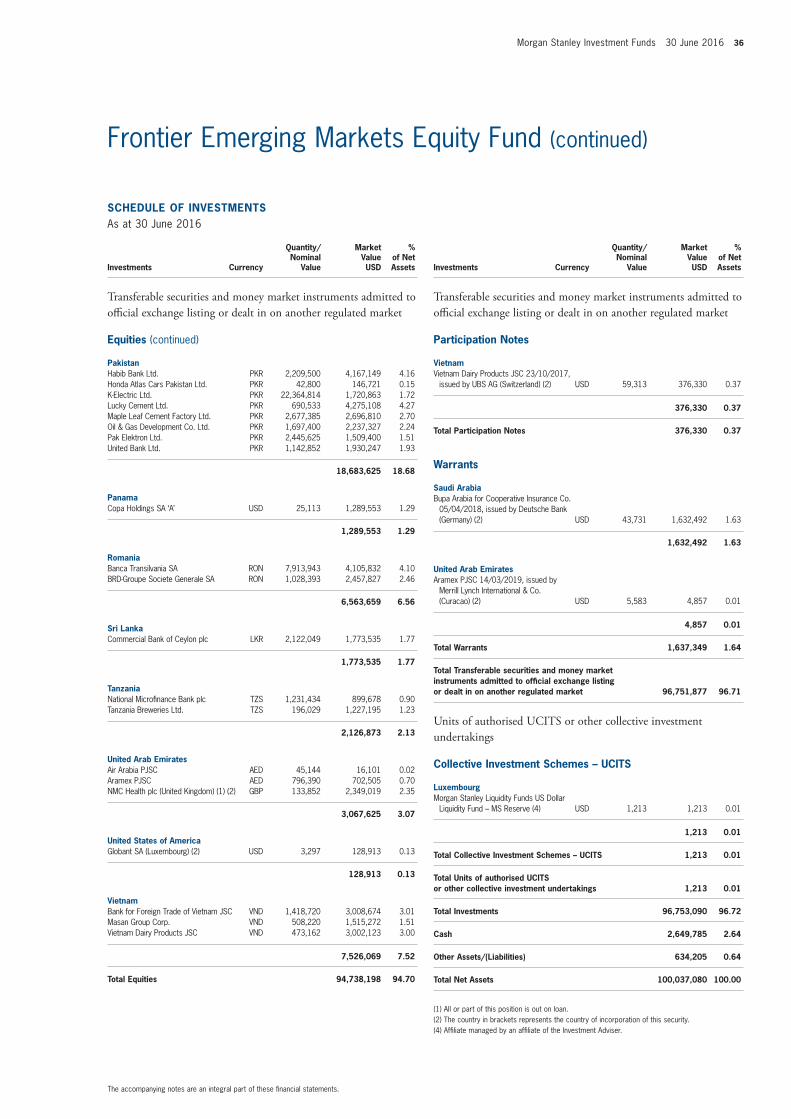
Morgan Stanley Investment Funds 30 June 2016 36
The accompanying notes are an integral part of these financial statements.
Frontier Emerging Markets Equity Fund (continued)
SCHEDULE OF INVESTMENTSAs at 30 June 2016
Investments Currency
Quantity/Nominal
Value
Market Value USD
% of Net Assets
Transferable securities and money market instruments admitted to official exchange listing or dealt in on another regulated market
Equities (continued)
PakistanHabib Bank Ltd. PKR 2,209,500 4,167,149 4.16Honda Atlas Cars Pakistan Ltd. PKR 42,800 146,721 0.15K-Electric Ltd. PKR 22,364,814 1,720,863 1.72Lucky Cement Ltd. PKR 690,533 4,275,108 4.27Maple Leaf Cement Factory Ltd. PKR 2,677,385 2,696,810 2.70Oil & Gas Development Co. Ltd. PKR 1,697,400 2,237,327 2.24Pak Elektron Ltd. PKR 2,445,625 1,509,400 1.51United Bank Ltd. PKR 1,142,852 1,930,247 1.93
18,683,625 18.68
PanamaCopa Holdings SA ‘A’ USD 25,113 1,289,553 1.29
1,289,553 1.29
RomaniaBanca Transilvania SA RON 7,913,943 4,105,832 4.10BRD-Groupe Societe Generale SA RON 1,028,393 2,457,827 2.46
6,563,659 6.56
Sri LankaCommercial Bank of Ceylon plc LKR 2,122,049 1,773,535 1.77
1,773,535 1.77
TanzaniaNational Microfinance Bank plc TZS 1,231,434 899,678 0.90Tanzania Breweries Ltd. TZS 196,029 1,227,195 1.23
2,126,873 2.13
United Arab EmiratesAir Arabia PJSC AED 45,144 16,101 0.02Aramex PJSC AED 796,390 702,505 0.70NMC Health plc (United Kingdom) (1) (2) GBP 133,852 2,349,019 2.35
3,067,625 3.07
United States of AmericaGlobant SA (Luxembourg) (2) USD 3,297 128,913 0.13
128,913 0.13
VietnamBank for Foreign Trade of Vietnam JSC VND 1,418,720 3,008,674 3.01Masan Group Corp. VND 508,220 1,515,272 1.51Vietnam Dairy Products JSC VND 473,162 3,002,123 3.00
7,526,069 7.52
Total Equities 94,738,198 94.70
SCHEDULE OF INVESTMENTSAs at 30 June 2016
Investments Currency
Quantity/Nominal
Value
Market Value USD
% of Net Assets
Transferable securities and money market instruments admitted to official exchange listing or dealt in on another regulated market
Participation Notes
VietnamVietnam Dairy Products JSC 23/10/2017,
issued by UBS AG (Switzerland) (2) USD 59,313 376,330 0.37
376,330 0.37
Total Participation Notes 376,330 0.37
Warrants
Saudi ArabiaBupa Arabia for Cooperative Insurance Co.
05/04/2018, issued by Deutsche Bank (Germany) (2) USD 43,731 1,632,492 1.63
1,632,492 1.63
United Arab EmiratesAramex PJSC 14/03/2019, issued by
Merrill Lynch International & Co. (Curacao) (2) USD 5,583 4,857 0.01
4,857 0.01
Total Warrants 1,637,349 1.64
Total Transferable securities and money market instruments admitted to official exchange listing or dealt in on another regulated market 96,751,877 96.71
Units of authorised UCITS or other collective investment undertakings
Collective Investment Schemes – UCITS
LuxembourgMorgan Stanley Liquidity Funds US Dollar
Liquidity Fund – MS Reserve (4) USD 1,213 1,213 0.01
1,213 0.01
Total Collective Investment Schemes – UCITS 1,213 0.01
Total Units of authorised UCITS or other collective investment undertakings 1,213 0.01
Total Investments 96,753,090 96.72
Cash 2,649,785 2.64
Other Assets/(Liabilities) 634,205 0.64
Total Net Assets 100,037,080 100.00
(1) All or part of this position is out on loan.(2) The country in brackets represents the country of incorporation of this security.(4) Affiliate managed by an affiliate of the Investment Adviser.

37 Morgan Stanley Investment Funds 30 June 2016
The accompanying notes are an integral part of these financial statements.
Frontier Emerging Markets Equity Fund (continued)
DERIVATIVES
Over-the-counter (OTC) and exchange traded derivatives as at 30 June 2016, expressed in US dollars.
Forward Currency Exchange Contracts
Currency Purchased
Amount Purchased
Currency Sold
Amount Sold
Maturity Date Counterparty
Unrealised Gain/(Loss)
USD
% of Net Assets
EUR Hedged Share ClassEUR 20,295 USD 22,457 01/07/2016 J.P. Morgan 104 0.00USD 11,476 EUR 10,198 01/07/2016 J.P. Morgan 139 0.00EUR 16,339,985 USD 18,059,280 08/07/2016 J.P. Morgan 107,394 0.11
Unrealised Gain on NAV Hedged Share Classes Forward Currency Exchange Contracts 107,637 0.11
Total Unrealised Gain on Forward Currency Exchange Contracts 107,637 0.11
EUR Hedged Share ClassEUR 19,625,369 USD 22,108,666 01/07/2016 J.P. Morgan (292,321) (0.29)USD 21,697,367 EUR 19,635,466 01/07/2016 J.P. Morgan (130,201) (0.13)EUR 1,939 USD 2,156 08/07/2016 J.P. Morgan (1) 0.00
Unrealised Loss on NAV Hedged Share Classes Forward Currency Exchange Contracts (422,523) (0.42)
Total Unrealised Loss on Forward Currency Exchange Contracts (422,523) (0.42)
Net Unrealised Loss on Forward Currency Exchange Contracts (314,886) (0.31)

Morgan Stanley Investment Funds 30 June 2016 38
The accompanying notes are an integral part of these financial statements.
Please refer to the full prospectus for the Fund’s investment objective and policy.
INVESTMENT AIM
To seek long-term capital appreciation, measured in US dollars, by investing primarily in securities issued by companies on a global basis.
SCHEDULE OF INVESTMENTSAs at 30 June 2016
Investments Currency
Quantity/Nominal
Value
Market Value USD
% of Net Assets
Transferable securities and money market instruments admitted to official exchange listing or dealt in on another regulated market
Equities
BelgiumAnheuser-Busch InBev SA NV, ADR USD 1,786 231,055 2.70
231,055 2.70
BrazilMercadoLibre, Inc.
(United States of America) (2) USD 1,045 145,161 1.70
145,161 1.70
ChinaAlibaba Group Holding Ltd., ADR
(Cayman Islands) (2) USD 1,703 134,060 1.57JD.com, Inc., ADR (Cayman Islands) (2) USD 11,152 227,612 2.66Tencent Holdings Ltd. (Cayman Islands) (2) HKD 13,000 295,055 3.45
656,727 7.68
FranceChristian Dior SE EUR 3,998 642,207 7.51Hermes International EUR 737 274,294 3.21L’Oreal SA EUR 460 87,109 1.02
1,003,610 11.74
GermanyThyssenKrupp AG EUR 6,480 129,013 1.51
129,013 1.51
JapanCalbee, Inc. JPY 6,000 248,687 2.91
248,687 2.91
SpainIndustria de Diseno Textil SA EUR 6,916 228,452 2.67
228,452 2.67
SwitzerlandNestle SA, ADR USD 5,925 455,372 5.33
455,372 5.33
United KingdomIntertek Group plc GBP 2,698 123,990 1.45Manchester United plc ‘A’
(Cayman Islands) (2) USD 7,500 121,125 1.41Reckitt Benckiser Group plc GBP 2,669 263,067 3.08Whitbread plc GBP 2,216 103,388 1.21
611,570 7.15
United States of America3M Co. USD 982 169,375 1.98Alphabet, Inc. ‘C’ USD 450 308,313 3.61Amazon.com, Inc. USD 1,035 738,234 8.63Apple, Inc. USD 3,321 313,901 3.67Berkshire Hathaway, Inc. ‘B’ USD 1,445 205,623 2.41
Global Advantage Fund
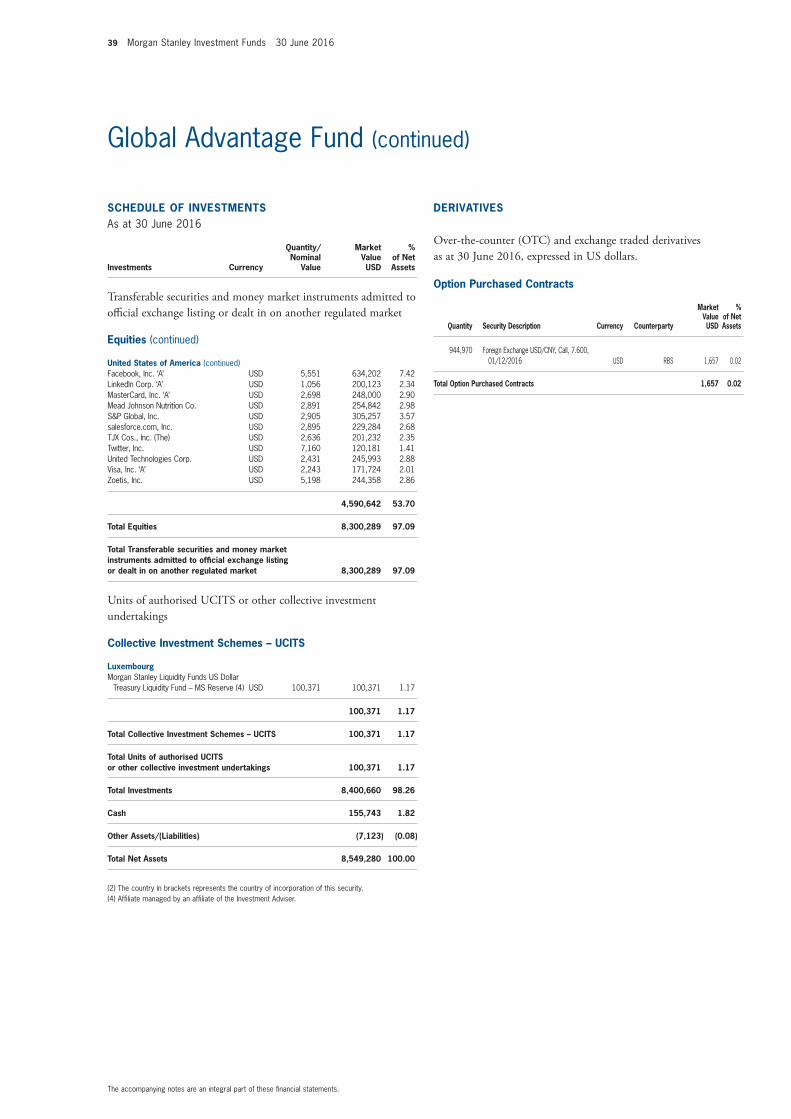
39 Morgan Stanley Investment Funds 30 June 2016
The accompanying notes are an integral part of these financial statements.
Global Advantage Fund (continued)
SCHEDULE OF INVESTMENTSAs at 30 June 2016
Investments Currency
Quantity/Nominal
Value
Market Value USD
% of Net Assets
Transferable securities and money market instruments admitted to official exchange listing or dealt in on another regulated market
Equities (continued)
United States of America (continued)Facebook, Inc. ‘A’ USD 5,551 634,202 7.42LinkedIn Corp. ‘A’ USD 1,056 200,123 2.34MasterCard, Inc. ‘A’ USD 2,698 248,000 2.90Mead Johnson Nutrition Co. USD 2,891 254,842 2.98S&P Global, Inc. USD 2,905 305,257 3.57salesforce.com, Inc. USD 2,895 229,284 2.68TJX Cos., Inc. (The) USD 2,636 201,232 2.35Twitter, Inc. USD 7,160 120,181 1.41United Technologies Corp. USD 2,431 245,993 2.88Visa, Inc. ‘A’ USD 2,243 171,724 2.01Zoetis, Inc. USD 5,198 244,358 2.86
4,590,642 53.70
Total Equities 8,300,289 97.09
Total Transferable securities and money market instruments admitted to official exchange listing or dealt in on another regulated market 8,300,289 97.09
Units of authorised UCITS or other collective investment undertakings
Collective Investment Schemes – UCITS
LuxembourgMorgan Stanley Liquidity Funds US Dollar
Treasury Liquidity Fund – MS Reserve (4) USD 100,371 100,371 1.17
100,371 1.17
Total Collective Investment Schemes – UCITS 100,371 1.17
Total Units of authorised UCITS or other collective investment undertakings 100,371 1.17
Total Investments 8,400,660 98.26
Cash 155,743 1.82
Other Assets/(Liabilities) (7,123) (0.08)
Total Net Assets 8,549,280 100.00
(2) The country in brackets represents the country of incorporation of this security.(4) Affiliate managed by an affiliate of the Investment Adviser.
Option Purchased Contracts
Quantity Security Description Currency Counterparty
Market Value USD
% of Net Assets
944,970 Foreign Exchange USD/CNY, Call, 7.600, 01/12/2016 USD RBS 1,657 0.02
Total Option Purchased Contracts 1,657 0.02
DERIVATIVES
Over-the-counter (OTC) and exchange traded derivatives as at 30 June 2016, expressed in US dollars.

Morgan Stanley Investment Funds 30 June 2016 40
The accompanying notes are an integral part of these financial statements.
Please refer to the full prospectus for the Fund’s investment objective and policy.
INVESTMENT AIM
To seek an attractive long-term rate of return, measured in US dollars, through investment principally in equity securities of companies in the world’s developed countries, by investing in a concentrated portfolio of companies whose success the Company believes depends on intangible assets (for example, but not limited to, brand names, copyrights or methods of distribution) underpinning a strong business franchise.
SCHEDULE OF INVESTMENTSAs at 30 June 2016
Investments Currency
Quantity/Nominal
Value
Market Value USD
% of Net Assets
Transferable securities and money market instruments admitted to official exchange listing or dealt in on another regulated market
Equities
FranceL’Oreal SA EUR 2,538,904 480,786,833 6.98Pernod Ricard SA EUR 1,557,777 172,458,724 2.50
653,245,557 9.48
GermanySAP SE EUR 2,313,418 171,917,335 2.50
171,917,335 2.50
ItalyDavide Campari-Milano SpA EUR 7,202,044 70,413,472 1.02
70,413,472 1.02
JapanJapan Tobacco, Inc. JPY 4,346,900 173,529,195 2.52
173,529,195 2.52
NetherlandsRELX NV EUR 3,535,244 60,913,737 0.88
60,913,737 0.88
SwitzerlandNestle SA CHF 4,364,949 335,620,636 4.87
335,620,636 4.87
United KingdomBritish American Tobacco plc GBP 8,403,274 534,558,503 7.76Experian plc (Jersey) (2) GBP 7,278,346 135,261,233 1.96Reckitt Benckiser Group plc GBP 5,592,587 551,228,077 8.00RELX plc GBP 5,117,186 92,668,857 1.34Unilever plc GBP 9,149,160 429,989,063 6.24
1,743,705,733 25.30
United States of AmericaAccenture plc ‘A’ (Ireland) (2) USD 2,773,055 311,996,418 4.53Altria Group, Inc. USD 4,950,207 336,069,553 4.88Automatic Data Processing, Inc. USD 2,376,492 213,290,157 3.09Coca-Cola Co. (The) USD 2,285,080 102,097,374 1.48International Flavors & Fragrances, Inc. USD 1,030,786 128,075,161 1.86Intuit, Inc. USD 827,253 90,890,287 1.32Microsoft Corp. USD 9,312,644 470,474,775 6.83Mondelez International, Inc. ‘A’ USD 4,055,365 174,948,446 2.54Moody’s Corp. USD 663,040 60,800,768 0.88NIKE, Inc. ‘B’ USD 3,245,732 178,839,833 2.59Philip Morris International, Inc. USD 1,969,141 195,240,330 2.83Reynolds American, Inc. USD 6,426,376 340,340,873 4.94Time Warner, Inc. USD 1,980,538 143,410,757 2.08Twenty-First Century Fox, Inc. ‘A’ USD 4,703,082 127,218,368 1.85Twenty-First Century Fox, Inc. ‘B’ USD 5,829,621 157,866,137 2.29
Global Brands Fund

41 Morgan Stanley Investment Funds 30 June 2016
The accompanying notes are an integral part of these financial statements.
Global Brands Fund (continued)
SCHEDULE OF INVESTMENTSAs at 30 June 2016
Investments Currency
Quantity/Nominal
Value
Market Value USD
% of Net Assets
Transferable securities and money market instruments admitted to official exchange listing or dealt in on another regulated market
Equities (continued)
United States of America (continued)Visa, Inc. ‘A’ USD 3,794,793 290,529,352 4.22Walt Disney Co. (The) USD 2,208,223 214,462,618 3.11
3,536,551,207 51.32
Total Equities 6,745,896,872 97.89
Total Transferable securities and money market instruments admitted to official exchange listing or dealt in on another regulated market 6,745,896,872 97.89
Units of authorised UCITS or other collective investment undertakings
Collective Investment Schemes – UCITS
LuxembourgMorgan Stanley Liquidity Funds US Dollar
Treasury Liquidity Fund – MS Reserve (4) USD 156,082,522 156,082,522 2.27
156,082,522 2.27
Total Collective Investment Schemes – UCITS 156,082,522 2.27
Total Units of authorised UCITS or other collective investment undertakings 156,082,522 2.27
Total Investments 6,901,979,394 100.16
Cash 1,015,513 0.01
Other Assets/(Liabilities) (11,588,574) (0.17)
Total Net Assets 6,891,406,333 100.00
(2) The country in brackets represents the country of incorporation of this security.(4) Affiliate managed by an affiliate of the Investment Adviser.
DERIVATIVES
Over-the-counter (OTC) and exchange traded derivatives as at 30 June 2016, expressed in US dollars.
Forward Currency Exchange Contracts
Currency Purchased
Amount Purchased
Currency Sold
Amount Sold
Maturity Date Counterparty
Unrealised Gain/(Loss)
USD
% of Net Assets
CHF Hedged Share ClassCHF 29,424 USD 30,089 01/07/2016 J.P. Morgan 96 0.00USD 51,360 CHF 49,075 01/07/2016 J.P. Morgan 1,015 0.00CHF 25,690,890 USD 26,186,676 08/07/2016 J.P. Morgan 175,781 0.00
EUR Hedged Share ClassEUR 1,802,019 USD 1,988,908 01/07/2016 J.P. Morgan 14,287 0.00USD 9,419 EUR 8,371 01/07/2016 J.P. Morgan 114 0.00EUR 823,105,564 USD 909,714,840 08/07/2016 J.P. Morgan 5,407,792 0.08
GBP Hedged Share ClassGBP 108,481,579 USD 144,688,521 08/07/2016 J.P. Morgan 1,086,261 0.02
JPY Hedged Share ClassEUR 73,681 JPY 8,263,688 29/07/2016 J.P. Morgan 1,514 0.00GBP 140,274 JPY 18,804,727 29/07/2016 J.P. Morgan 5,413 0.00JPY 97,159,447 CHF 891,078 29/07/2016 J.P. Morgan 30,434 0.00JPY 287,586,147 EUR 2,436,851 29/07/2016 J.P. Morgan 89,016 0.00JPY 518,895,318 GBP 3,393,180 29/07/2016 J.P. Morgan 492,438 0.01JPY 1,109,199,886 USD 10,639,307 29/07/2016 J.P. Morgan 161,835 0.00
Unrealised Gain on NAV Hedged Share Classes Forward Currency Exchange Contracts 7,465,996 0.11
Total Unrealised Gain on Forward Currency Exchange Contracts 7,465,996 0.11
CHF Hedged Share ClassCHF 26,320,291 USD 27,401,499 01/07/2016 J.P. Morgan (399,959) (0.01)USD 26,793,643 CHF 26,300,640 01/07/2016 J.P. Morgan (187,737) 0.00
EUR Hedged Share ClassEUR 843,909,003 USD 950,723,983 01/07/2016 J.P. Morgan (12,601,018) (0.18)USD 934,414,774 EUR 845,702,651 01/07/2016 J.P. Morgan (5,702,083) (0.08)EUR 1,098,276 USD 1,221,297 08/07/2016 J.P. Morgan (242) 0.00
GBP Hedged Share ClassGBP 111,831,684 USD 164,022,065 01/07/2016 J.P. Morgan (13,748,244) (0.20)USD 149,149,917 GBP 111,831,684 01/07/2016 J.P. Morgan (1,123,904) (0.02)
JPY Hedged Share ClassJPY 2,912,214 CHF 27,812 29/07/2016 J.P. Morgan (221) 0.00JPY 9,958,971 EUR 87,363 29/07/2016 J.P. Morgan (229) 0.00JPY 22,494,119 GBP 163,890 29/07/2016 J.P. Morgan (1,227) 0.00
Unrealised Loss on NAV Hedged Share Classes Forward Currency Exchange Contracts (33,764,864) (0.49)
Total Unrealised Loss on Forward Currency Exchange Contracts (33,764,864) (0.49)
Net Unrealised Loss on Forward Currency Exchange Contracts (26,298,868) (0.38)

Morgan Stanley Investment Funds 30 June 2016 42
The accompanying notes are an integral part of these financial statements.
Please refer to the full prospectus for the Fund’s investment objective and policy.
Global Brands Equity Income Fund*
SCHEDULE OF INVESTMENTSAs at 30 June 2016
Investments Currency
Quantity/Nominal
Value
Market Value USD
% of Net Assets
Transferable securities and money market instruments admitted to official exchange listing or dealt in on another regulated market
Equities
FranceL’Oreal SA EUR 3,710 702,555 6.92Pernod Ricard SA EUR 2,276 251,972 2.48
954,527 9.40
GermanySAP SE EUR 3,380 251,178 2.48
251,178 2.48
ItalyDavide Campari-Milano SpA EUR 10,525 102,902 1.01
102,902 1.01
JapanJapan Tobacco, Inc. JPY 6,300 251,497 2.48
251,497 2.48
NetherlandsRELX NV EUR 5,166 89,012 0.88
89,012 0.88
SwitzerlandNestle SA CHF 6,382 490,712 4.83
490,712 4.83
United KingdomBritish American Tobacco plc GBP 12,280 781,169 7.69Experian plc (Jersey) (2) GBP 10,636 197,660 1.95Reckitt Benckiser Group plc GBP 8,173 805,564 7.94RELX plc GBP 7,478 135,422 1.33Unilever plc GBP 13,371 628,406 6.19
2,548,221 25.10
United States of AmericaAccenture plc ‘A’ (Ireland) (2) USD 4,081 459,153 4.52Altria Group, Inc. USD 7,248 492,067 4.85Automatic Data Processing, Inc. USD 3,465 310,984 3.06Coca-Cola Co. (The) USD 3,336 149,052 1.47International Flavors & Fragrances, Inc. USD 1,505 186,996 1.84Intuit, Inc. USD 1,209 132,833 1.31Microsoft Corp. USD 13,609 687,527 6.77Mondelez International, Inc. ‘A’ USD 5,921 255,432 2.52Moody’s Corp. USD 969 88,857 0.88NIKE, Inc. ‘B’ USD 4,732 260,733 2.57Philip Morris International, Inc. USD 2,878 285,354 2.81Reynolds American, Inc. USD 9,383 496,924 4.90Time Warner, Inc. USD 2,895 209,627 2.06Twenty-First Century Fox, Inc. ‘A’ USD 6,873 185,915 1.83Twenty-First Century Fox, Inc. ‘B’ USD 8,519 230,694 2.27
* Fund commenced operations on 29 April 2016.
INVESTMENT AIM
To provide regular income and an attractive rate of return, and measured in USD by investing primarily in equity securities of issuers located in the world’s developed markets.The Fund will enter into financial derivative instruments with Morgan Stanley International Plc to enhance the level of income earned. This strategy is expected to include taking exposure via one or more swaps (the “Swaps”) to options on equity securities and/or to indices.

43 Morgan Stanley Investment Funds 30 June 2016
The accompanying notes are an integral part of these financial statements.
Global Brands Equity Income Fund (continued)
SCHEDULE OF INVESTMENTSAs at 30 June 2016
Investments Currency
Quantity/Nominal
Value
Market Value USD
% of Net Assets
Transferable securities and money market instruments admitted to official exchange listing or dealt in on another regulated market
Equities (continued)
United States of America (continued)Visa, Inc. ‘A’ USD 5,545 424,525 4.18Walt Disney Co. (The) USD 3,227 313,406 3.09
5,170,079 50.93
Total Equities 9,858,128 97.11
Total Transferable securities and money market instruments admitted to official exchange listing or dealt in on another regulated market 9,858,128 97.11
Units of authorised UCITS or other collective investment undertakings
Collective Investment Schemes – UCITS
LuxembourgMorgan Stanley Liquidity Funds US Dollar
Treasury Liquidity Fund – MS Reserve (4) USD 80,060 80,060 0.79
80,060 0.79
Total Collective Investment Schemes – UCITS 80,060 0.79
Total Units of authorised UCITS or other collective investment undertakings 80,060 0.79
Total Investments 9,938,188 97.90
Cash 186,979 1.84
Other Assets/(Liabilities) 26,133 0.26
Total Net Assets 10,151,300 100.00
(2) The country in brackets represents the country of incorporation of this security. (4) Affiliate managed by an affiliate of the Investment Adviser.
DERIVATIVES
Over-the-counter (OTC) and exchange traded derivatives as at 30 June 2016, expressed in US dollars.
Forward Currency Exchange Contracts
Currency Purchased
Amount Purchased
Currency Sold
Amount Sold
Maturity Date Counterparty
Unrealised Gain/(Loss)
USD
% of Net Assets
EUR Hedged Share ClassEUR 266,021 USD 294,011 08/07/2016 J.P. Morgan 1,748 0.02
Unrealised Gain on NAV Hedged Share Classes Forward Currency Exchange Contracts 1,748 0.02
Total Unrealised Gain on Forward Currency Exchange Contracts 1,748 0.02
EUR Hedged Share ClassEUR 273,520 USD 308,131 01/07/2016 J.P. Morgan (4,076) (0.03)USD 302,212 EUR 273,520 01/07/2016 J.P. Morgan (1,843) (0.03)
Unrealised Loss on NAV Hedged Share Classes Forward Currency Exchange Contracts (5,919) (0.06)
Total Unrealised Loss on Forward Currency Exchange Contracts (5,919) (0.06)
Net Unrealised Loss on Forward Currency Exchange Contracts (4,171) (0.04)
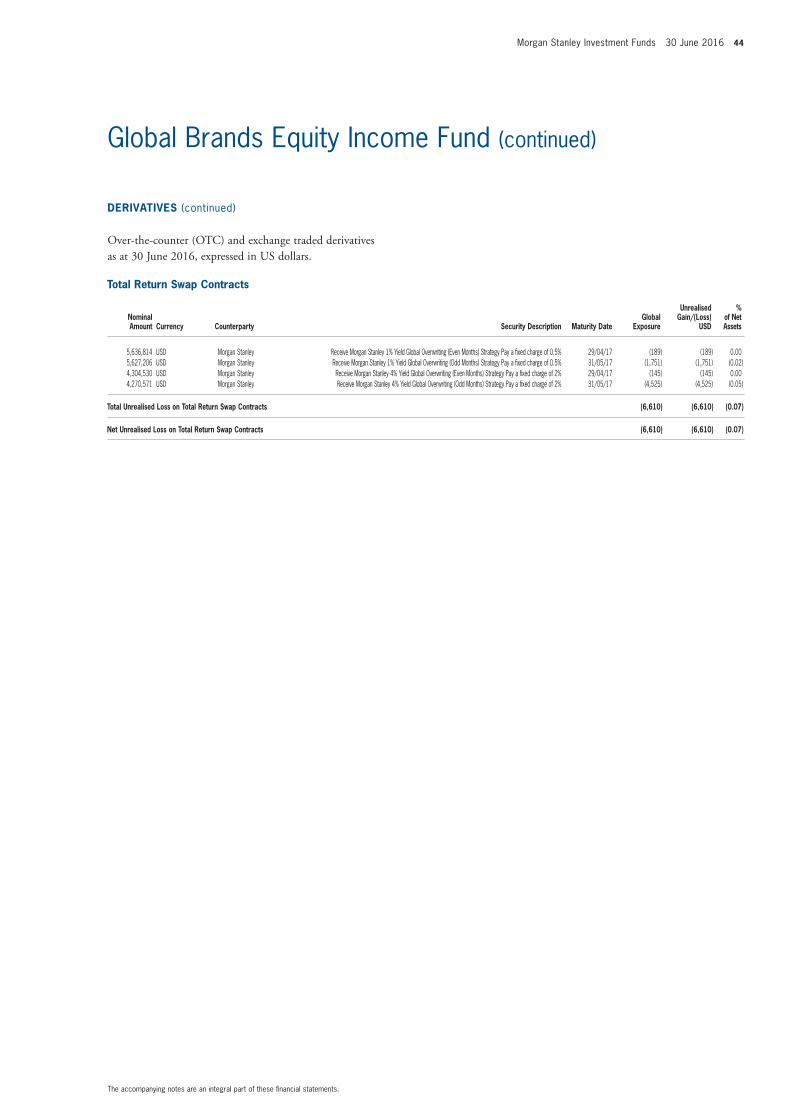
Morgan Stanley Investment Funds 30 June 2016 44
The accompanying notes are an integral part of these financial statements.
Global Brands Equity Income Fund (continued)
DERIVATIVES (continued)
Over-the-counter (OTC) and exchange traded derivatives as at 30 June 2016, expressed in US dollars.
Total Return Swap Contracts
Nominal Amount Currency Counterparty Security Description Maturity Date
Global Exposure
Unrealised Gain/(Loss)
USD
% of Net Assets
5,636,814 USD Morgan Stanley Receive Morgan Stanley 1% Yield Global Overwriting (Even Months) Strategy Pay a fixed charge of 0.5% 29/04/17 (189) (189) 0.005,627,206 USD Morgan Stanley Receive Morgan Stanley 1% Yield Global Overwriting (Odd Months) Strategy Pay a fixed charge of 0.5% 31/05/17 (1,751) (1,751) (0.02)4,304,530 USD Morgan Stanley Receive Morgan Stanley 4% Yield Global Overwriting (Even Months) Strategy Pay a fixed charge of 2% 29/04/17 (145) (145) 0.004,270,571 USD Morgan Stanley Receive Morgan Stanley 4% Yield Global Overwriting (Odd Months) Strategy Pay a fixed charge of 2% 31/05/17 (4,525) (4,525) (0.05)
Total Unrealised Loss on Total Return Swap Contracts (6,610) (6,610) (0.07)
Net Unrealised Loss on Total Return Swap Contracts (6,610) (6,610) (0.07)

45 Morgan Stanley Investment Funds 30 June 2016
The accompanying notes are an integral part of these financial statements.
Please refer to the full prospectus for the Fund’s investment objective and policy.
INVESTMENT AIM
To invest primarily in equity securities of established and emerging companies located throughout the world, with capitalizations within the range of companies included in the MSCI All Country World Index.
SCHEDULE OF INVESTMENTSAs at 30 June 2016
Investments Currency
Quantity/Nominal
Value
Market Value USD
% of Net Assets
Transferable securities and money market instruments admitted to official exchange listing or dealt in on another regulated market
Equities
BrazilGAEC Educacao SA BRL 13,943 58,874 1.06JHSF Participacoes SA BRL 108,238 37,075 0.66Porto Seguro SA BRL 13,453 112,185 2.01
208,134 3.73
CanadaSecond Cup Ltd. (The) CAD 18,177 37,446 0.67
37,446 0.67
ChinaJumei International Holding Ltd., ADR
(Cayman Islands) (2) USD 5,543 22,837 0.41
22,837 0.41
FranceChristian Dior SE EUR 2,978 478,362 8.57Edenred EUR 6,064 124,068 2.22Eurazeo SA EUR 935 55,981 1.00
658,411 11.79
Germanywindeln.de AG EUR 1,614 7,295 0.13Zalando SE EUR 3,588 94,868 1.70
102,163 1.83
ItalyTamburi Investment Partners SpA EUR 16,097 60,124 1.07
60,124 1.07
NetherlandsKoninklijke Philips NV EUR 7,262 179,255 3.21
179,255 3.21
SpainMapfre SA EUR 44,418 95,544 1.71
95,544 1.71
United KingdomBBA Aviation plc GBP 86,248 256,246 4.59Melrose Industries plc GBP 5,070 28,597 0.51
284,843 5.10
United States of AmericaAllison Transmission Holdings, Inc. USD 3,989 111,772 2.00Bojangles’, Inc. USD 1,583 26,468 0.47BWX Technologies, Inc. USD 11,901 421,414 7.55Cosan Ltd. ‘A’ (Bermuda) (2) USD 14,199 90,235 1.62eBay, Inc. USD 7,088 165,292 2.96El Pollo Loco Holdings, Inc. USD 9,680 122,162 2.19Fiesta Restaurant Group, Inc. USD 4,416 95,430 1.71Fox Factory Holding Corp. USD 3,444 59,306 1.06
Global Discovery Fund

Morgan Stanley Investment Funds 30 June 2016 46
The accompanying notes are an integral part of these financial statements.
Global Discovery Fund (continued)
SCHEDULE OF INVESTMENTSAs at 30 June 2016
Investments Currency
Quantity/Nominal
Value
Market Value USD
% of Net Assets
Transferable securities and money market instruments admitted to official exchange listing or dealt in on another regulated market
Equities (continued)
United States of America (continued)Garmin Ltd. (Switzerland) (2) USD 1,978 81,672 1.46GrubHub, Inc. USD 1,527 47,902 0.86Habit Restaurants, Inc. (The) ‘A’ USD 1,480 24,124 0.43Harley-Davidson, Inc. USD 2,467 108,622 1.95Intuitive Surgical, Inc. USD 206 135,599 2.43Joy Global, Inc. USD 15,179 309,044 5.53Manitowoc Foodservice, Inc. USD 32,350 543,480 9.73Papa Murphy’s Holdings, Inc. USD 3,318 21,965 0.39PayPal Holdings, Inc. USD 5,107 182,218 3.26Progressive Corp. (The) USD 3,337 109,737 1.96RenaissanceRe Holdings Ltd. (Bermuda) (2) USD 1,893 218,925 3.92Terex Corp. USD 11,759 230,594 4.13Time Warner, Inc. USD 2,751 199,200 3.57United Technologies Corp. USD 4,549 460,313 8.24
3,765,474 67.42
Total Equities 5,414,231 96.94
Warrants
ItalyTamburi Investment Partners SpA
30/06/2020 EUR 7,102 3,000 0.05
3,000 0.05
Total Warrants 3,000 0.05
Total Transferable securities and money market instruments admitted to official exchange listing or dealt in on another regulated market 5,417,231 96.99
Units of authorised UCITS or other collective investment undertakings
Collective Investment Schemes – UCITS
LuxembourgMorgan Stanley Liquidity Funds US Dollar
Treasury Liquidity Fund – MS Reserve (4) USD 281 281 0.01
281 0.01
Total Collective Investment Schemes – UCITS 281 0.01
Total Units of authorised UCITS or other collective investment undertakings 281 0.01
Total Investments 5,417,512 97.00
Cash 170,385 3.05
Other Assets/(Liabilities) (2,972) (0.05)
Total Net Assets 5,584,925 100.00
(2) The country in brackets represents the country of incorporation of this security.(4) Affiliate managed by an affiliate of the Investment Adviser.

47 Morgan Stanley Investment Funds 30 June 2016
The accompanying notes are an integral part of these financial statements.
Please refer to the full prospectus for the Fund’s investment objective and policy.
INVESTMENT AIM
To seek to provide long-term capital appreciation, measured in US dollars, by investing primarily in equity securities issued by companies located throughout the world that are engaged in the infrastructure business.
SCHEDULE OF INVESTMENTSAs at 30 June 2016
Investments Currency
Quantity/Nominal
Value
Market Value USD
% of Net Assets
Transferable securities and money market instruments admitted to official exchange listing or dealt in on another regulated market
Equities
AustraliaMacquarie Atlas Roads Group Stapled
Security AUD 1,949,597 7,509,753 1.10Sydney Airport Stapled Security AUD 766,334 3,954,837 0.58Transurban Group Stapled Security AUD 1,103,997 9,843,240 1.45
21,307,830 3.13
BrazilCCR SA BRL 183,729 946,850 0.14
946,850 0.14
CanadaEnbridge, Inc. CAD 802,727 33,574,204 4.93Hydro One Ltd. CAD 101,309 1,994,972 0.29Inter Pipeline Ltd. (1) CAD 554,396 11,600,261 1.71Pembina Pipeline Corp. (1) CAD 298,867 8,918,826 1.31TransCanada Corp. CAD 683,401 30,478,053 4.48
86,566,316 12.72
ChinaChina Everbright International Ltd.
(Hong Kong) (2) HKD 3,637,000 4,031,267 0.59Guangdong Investment Ltd.
(Hong Kong) (2) HKD 9,354,000 14,201,771 2.09Hopewell Highway Infrastructure Ltd.
(Cayman Islands) (2) HKD 37,521,500 18,666,691 2.74
36,899,729 5.42
FranceEutelsat Communications SA (1) EUR 43,023 811,130 0.12Groupe Eurotunnel SE (1) EUR 620,020 6,493,321 0.96SES SA (Luxembourg) (1) (2) EUR 171,688 3,700,683 0.54Vinci SA EUR 175,670 12,367,196 1.82
23,372,330 3.44
ItalyAtlantia SpA EUR 318,715 7,833,492 1.15Infrastrutture Wireless Italiane SpA EUR 989,798 4,401,196 0.65Snam SpA EUR 138,196 813,440 0.12
13,048,128 1.92
JapanJapan Airport Terminal Co. Ltd. JPY 25,200 902,277 0.13Tokyo Gas Co. Ltd. JPY 1,869,000 7,644,752 1.13
8,547,029 1.26
MexicoInfraestructura Energetica Nova SAB
de CV (1) MXN 336,966 1,377,617 0.20
1,377,617 0.20
Global Infrastructure Fund
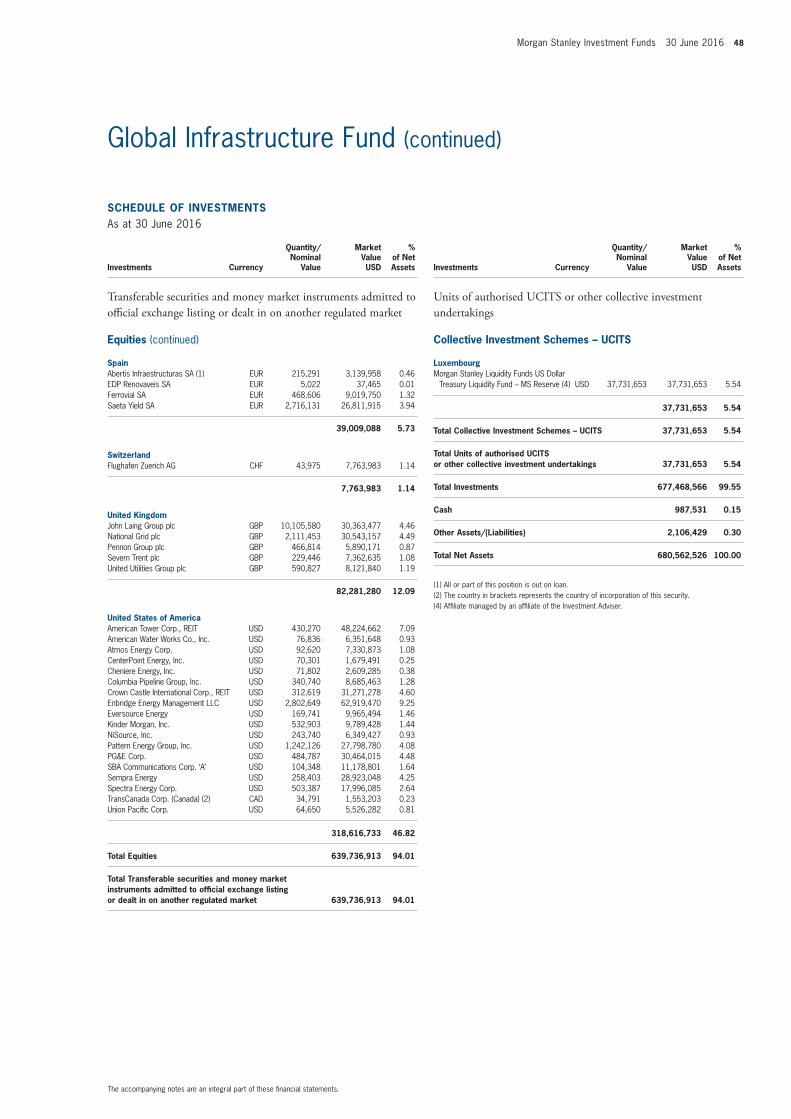
Morgan Stanley Investment Funds 30 June 2016 48
The accompanying notes are an integral part of these financial statements.
Global Infrastructure Fund (continued)
SCHEDULE OF INVESTMENTSAs at 30 June 2016
Investments Currency
Quantity/Nominal
Value
Market Value USD
% of Net Assets
Transferable securities and money market instruments admitted to official exchange listing or dealt in on another regulated market
Equities (continued)
SpainAbertis Infraestructuras SA (1) EUR 215,291 3,139,958 0.46EDP Renovaveis SA EUR 5,022 37,465 0.01Ferrovial SA EUR 468,606 9,019,750 1.32Saeta Yield SA EUR 2,716,131 26,811,915 3.94
39,009,088 5.73
SwitzerlandFlughafen Zuerich AG CHF 43,975 7,763,983 1.14
7,763,983 1.14
United KingdomJohn Laing Group plc GBP 10,105,580 30,363,477 4.46National Grid plc GBP 2,111,453 30,543,157 4.49Pennon Group plc GBP 466,814 5,890,171 0.87Severn Trent plc GBP 229,446 7,362,635 1.08United Utilities Group plc GBP 590,827 8,121,840 1.19
82,281,280 12.09
United States of AmericaAmerican Tower Corp., REIT USD 430,270 48,224,662 7.09American Water Works Co., Inc. USD 76,836 6,351,648 0.93Atmos Energy Corp. USD 92,620 7,330,873 1.08CenterPoint Energy, Inc. USD 70,301 1,679,491 0.25Cheniere Energy, Inc. USD 71,802 2,609,285 0.38Columbia Pipeline Group, Inc. USD 340,740 8,685,463 1.28Crown Castle International Corp., REIT USD 312,619 31,271,278 4.60Enbridge Energy Management LLC USD 2,802,649 62,919,470 9.25Eversource Energy USD 169,741 9,965,494 1.46Kinder Morgan, Inc. USD 532,903 9,789,428 1.44NiSource, Inc. USD 243,740 6,349,427 0.93Pattern Energy Group, Inc. USD 1,242,126 27,798,780 4.08PG&E Corp. USD 484,787 30,464,015 4.48SBA Communications Corp. ‘A’ USD 104,348 11,178,801 1.64Sempra Energy USD 258,403 28,923,048 4.25Spectra Energy Corp. USD 503,387 17,996,085 2.64TransCanada Corp. (Canada) (2) CAD 34,791 1,553,203 0.23Union Pacific Corp. USD 64,650 5,526,282 0.81
318,616,733 46.82
Total Equities 639,736,913 94.01
Total Transferable securities and money market instruments admitted to official exchange listing or dealt in on another regulated market 639,736,913 94.01
SCHEDULE OF INVESTMENTSAs at 30 June 2016
Investments Currency
Quantity/Nominal
Value
Market Value USD
% of Net Assets
Units of authorised UCITS or other collective investment undertakings
Collective Investment Schemes – UCITS
LuxembourgMorgan Stanley Liquidity Funds US Dollar
Treasury Liquidity Fund – MS Reserve (4) USD 37,731,653 37,731,653 5.54
37,731,653 5.54
Total Collective Investment Schemes – UCITS 37,731,653 5.54
Total Units of authorised UCITS or other collective investment undertakings 37,731,653 5.54
Total Investments 677,468,566 99.55
Cash 987,531 0.15
Other Assets/(Liabilities) 2,106,429 0.30
Total Net Assets 680,562,526 100.00
(1) All or part of this position is out on loan.(2) The country in brackets represents the country of incorporation of this security.(4) Affiliate managed by an affiliate of the Investment Adviser.

49 Morgan Stanley Investment Funds 30 June 2016
The accompanying notes are an integral part of these financial statements.
Global Infrastructure Fund (continued)
DERIVATIVES
Over-the-counter (OTC) and exchange traded derivatives as at 30 June 2016, expressed in US dollars.
Forward Currency Exchange Contracts
Currency Purchased
Amount Purchased
Currency Sold
Amount Sold
Maturity Date Counterparty
Unrealised Gain/(Loss)
USD
% of Net Assets
EUR Hedged Share ClassEUR 515,156 USD 569,291 01/07/2016 J.P. Morgan 3,376 0.00USD 55,466 EUR 49,207 01/07/2016 J.P. Morgan 765 0.00EUR 59,264,262 USD 65,500,103 08/07/2016 J.P. Morgan 389,463 0.06USD 2,787 EUR 2,507 08/07/2016 J.P. Morgan 1 0.00
Unrealised Gain on NAV Hedged Share Classes Forward Currency Exchange Contracts 393,605 0.06
Total Unrealised Gain on Forward Currency Exchange Contracts 393,605 0.06
EUR Hedged Share ClassEUR 59,830,665 USD 67,401,456 01/07/2016 J.P. Morgan (891,298) (0.13)USD 66,621,076 EUR 60,296,614 01/07/2016 J.P. Morgan (407,050) (0.06)
Unrealised Loss on NAV Hedged Share Classes Forward Currency Exchange Contracts (1,298,348) (0.19)
Total Unrealised Loss on Forward Currency Exchange Contracts (1,298,348) (0.19)
Net Unrealised Loss on Forward Currency Exchange Contracts (904,743) (0.13)

Morgan Stanley Investment Funds 30 June 2016 50
The accompanying notes are an integral part of these financial statements.
Please refer to the full prospectus for the Fund’s investment objective and policy.
INVESTMENT AIM
To seek long-term capital appreciation measured in US dollars through investment primarily in growth-oriented equity securities on a global basis. The investment process will emphasize a bottom-up stock selection process, seeking attractive investments on an individual company basis.
SCHEDULE OF INVESTMENTSAs at 30 June 2016
Investments Currency
Quantity/Nominal
Value
Market Value USD
% of Net Assets
Transferable securities and money market instruments admitted to official exchange listing or dealt in on another regulated market
Equities
BelgiumAnheuser-Busch InBev SA NV EUR 123,349 15,974,442 1.71
15,974,442 1.71
ChinaChina Resources Beer Holdings Co. Ltd.
(Hong Kong) (2) HKD 7,884,000 17,172,486 1.84TAL Education Group, ADR
(Cayman Islands) (2) USD 946,098 56,832,107 6.08Tencent Holdings Ltd. (Cayman Islands) (2) HKD 1,158,700 26,298,453 2.81
100,303,046 10.73
DenmarkDSV A/S DKK 1,106,499 46,077,121 4.93
46,077,121 4.93
FranceHermes International EUR 78,458 29,200,268 3.12
29,200,268 3.12
IndiaMonsanto India Ltd. INR 128,523 4,927,651 0.53
4,927,651 0.53
JapanCalbee, Inc. JPY 669,900 27,765,849 2.97
27,765,849 2.97
South AfricaNaspers Ltd. ‘N’ ZAR 142,511 21,763,195 2.33
21,763,195 2.33
South KoreaAmorepacific Corp. KRW 63,699 23,873,777 2.56Loen Entertainment, Inc. KRW 138,272 8,791,299 0.94Medy-Tox, Inc. KRW 36,363 13,625,347 1.46ViroMed Co. Ltd. KRW 38,227 4,698,231 0.50
50,988,654 5.46
United KingdomARM Holdings plc GBP 1,247,923 18,496,168 1.98Burberry Group plc GBP 974,550 15,086,034 1.62Just Eat plc (1) GBP 2,800,661 15,727,199 1.68
49,309,401 5.28
Global Opportunity Fund

51 Morgan Stanley Investment Funds 30 June 2016
The accompanying notes are an integral part of these financial statements.
Global Opportunity Fund (continued)
SCHEDULE OF INVESTMENTSAs at 30 June 2016
Investments Currency
Quantity/Nominal
Value
Market Value USD
% of Net Assets
Transferable securities and money market instruments admitted to official exchange listing or dealt in on another regulated market
Equities (continued)
United States of AmericaAlphabet, Inc. ‘C’ USD 40,645 27,847,515 2.98Amazon.com, Inc. USD 83,038 59,228,514 6.34Cognizant Technology Solutions Corp. ‘A’ USD 718,967 41,067,395 4.40EPAM Systems, Inc. USD 875,902 57,065,015 6.11Facebook, Inc. ‘A’ USD 741,033 84,663,020 9.06Globant SA (Luxembourg) (2) USD 520,519 20,352,293 2.18Luxoft Holding, Inc.
(British Virgin Islands) (2) USD 744,771 39,100,478 4.18MasterCard, Inc. ‘A’ USD 399,853 36,754,488 3.93Priceline Group, Inc. (The) USD 34,944 43,820,126 4.69Visa, Inc. ‘A’ USD 491,342 37,617,144 4.03WisdomTree Investments, Inc. USD 1,353,936 12,645,762 1.35
460,161,750 49.25
Total Equities 806,471,377 86.31
Participation Notes
ChinaJiangsu Yanghe Group Co. Ltd.
23/01/2017, issued by UBS AG (Switzerland) (2) USD 2,298,225 24,885,702 2.67
Jiangsu Yanghe Group Co. Ltd. 01/02/2017, issued by UBS AG (Switzerland) (2) USD 3,557,930 21,521,918 2.30
46,407,620 4.97
Total Participation Notes 46,407,620 4.97
Warrants
ChinaFoshan Haitian Flavouring & Food Co. Ltd.
04/09/2018, issued by HSBC Bank plc (United Kingdom) (2) USD 1,627,620 7,444,734 0.80
Foshan Haitian Flavouring & Food Co. Ltd. 17/10/2024, issued by Deutsche Bank (Germany) (2) USD 2,359,974 10,801,609 1.15
Kweichow Moutai Co. Ltd. 17/08/2018, issued by HSBC Bank plc (United Kingdom) (2) USD 14,800 650,075 0.07
Kweichow Moutai Co. Ltd. 04/03/2021, issued by Deutsche Bank (Germany) (2) USD 317,272 13,942,106 1.49
32,838,524 3.51
Total Warrants 32,838,524 3.51
Total Transferable securities and money market instruments admitted to official exchange listing or dealt in on another regulated market 885,717,521 94.79
SCHEDULE OF INVESTMENTSAs at 30 June 2016
Investments Currency
Quantity/Nominal
Value
Market Value USD
% of Net Assets
Units of authorised UCITS or other collective investment undertakings
Collective Investment Schemes – UCITS
LuxembourgMorgan Stanley Liquidity Funds US Dollar
Treasury Liquidity Fund – MS Reserve (4) USD 48,071,395 48,071,395 5.15
48,071,395 5.15
Total Collective Investment Schemes – UCITS 48,071,395 5.15
Total Units of authorised UCITS or other collective investment undertakings 48,071,395 5.15
Total Investments 933,788,916 99.94
Cash (32,452) (0.01)
Other Assets/(Liabilities) 604,163 0.07
Total Net Assets 934,360,627 100.00
(1) All or part of this position is out on loan.(2) The country in brackets represents the country of incorporation of this security.(4) Affiliate managed by an affiliate of the Investment Adviser.

Morgan Stanley Investment Funds 30 June 2016 52
The accompanying notes are an integral part of these financial statements.
Global Opportunity Fund (continued)
Option Purchased Contracts
Quantity Security Description Currency Counterparty
Market Value USD
% of Net Assets
97,192,930 Foreign Exchange USD/CNY, Call, 7.600, 01/12/2016 USD RBS 170,401 0.02
Total Option Purchased Contracts 170,401 0.02
Forward Currency Exchange Contracts
Currency Purchased
Amount Purchased
Currency Sold
Amount Sold
Maturity Date Counterparty
Unrealised Gain/(Loss)
USD
% of Net Assets
EUR Hedged Share ClassEUR 159,179 USD 176,136 01/07/2016 J.P. Morgan 814 0.00USD 11,883 EUR 10,560 01/07/2016 J.P. Morgan 144 0.00EUR 28,634,251 USD 31,647,242 08/07/2016 J.P. Morgan 188,104 0.02
Unrealised Gain on NAV Hedged Share Classes Forward Currency Exchange Contracts 189,062 0.02
Total Unrealised Gain on Forward Currency Exchange Contracts 189,062 0.02
EUR Hedged Share ClassEUR 29,519,825 USD 33,255,280 01/07/2016 J.P. Morgan (439,862) (0.05)USD 32,778,660 EUR 29,668,443 01/07/2016 J.P. Morgan (201,967) (0.02)EUR 123,785 USD 137,651 08/07/2016 J.P. Morgan (28) 0.00
Unrealised Loss on NAV Hedged Share Classes Forward Currency Exchange Contracts (641,857) (0.07)
Total Unrealised Loss on Forward Currency Exchange Contracts (641,857) (0.07)
Net Unrealised Loss on Forward Currency Exchange Contracts (452,795) (0.05)
Collateral received and paid by the Fund in respect of financial derivative instruments:
Type of Collateral Counterparty CurrencyCollateral Amount
receivedCollateral Amount
paid
Global Opportunity Fund
Cash RBS USD 250,000 -
250,000 -
DERIVATIVES
Over-the-counter (OTC) and exchange traded derivatives as at 30 June 2016, expressed in US dollars.

53 Morgan Stanley Investment Funds 30 June 2016
The accompanying notes are an integral part of these financial statements.
Please refer to the full prospectus for the Fund’s investment objective and policy.
INVESTMENT AIM
To seek to provide long-term capital appreciation, measured in US dollars, primarily through investment in the equity securities of companies in the real estate industry located throughout the world.
SCHEDULE OF INVESTMENTSAs at 30 June 2016
Investments Currency
Quantity/Nominal
Value
Market Value USD
% of Net Assets
Transferable securities and money market instruments admitted to official exchange listing or dealt in on another regulated market
Equities
AustraliaDexus Property Group, REIT AUD 583,260 3,912,188 0.35Frasers Logistics & Industrial Trust, REIT
(Singapore) (2) SGD 2,513,600 1,771,835 0.16Goodman Group, REIT AUD 2,019,698 10,678,421 0.97GPT Group (The), REIT AUD 1,978,329 7,958,786 0.72Investa Office Fund, REIT AUD 437,643 1,392,884 0.13Mirvac Group, REIT AUD 2,602,978 3,909,965 0.35Scentre Group, REIT AUD 5,396,030 19,741,969 1.79Shopping Centres Australasia Property
Group, REIT AUD 257,694 436,908 0.04Stockland, REIT AUD 1,783,251 6,245,747 0.56Vicinity Centres, REIT AUD 1,308,045 3,229,325 0.29Westfield Corp., REIT AUD 2,109,379 16,705,337 1.51
75,983,365 6.87
AustriaAtrium European Real Estate Ltd.
(Jersey) (2) EUR 697,868 2,989,072 0.27BUWOG AG EUR 42,025 966,802 0.09
3,955,874 0.36
BrazilBR Properties SA BRL 27,657 65,194 0.01
65,194 0.01
CanadaBoardwalk Real Estate Investment Trust CAD 61,594 2,676,742 0.24Brookfield Canada Office Properties, REIT CAD 103,236 2,286,536 0.21Crombie Real Estate Investment Trust CAD 71,534 843,423 0.08Dream Office Real Estate Investment Trust CAD 64,912 928,314 0.08Extendicare, Inc. CAD 20,320 129,416 0.01First Capital Realty, Inc. CAD 113,845 1,954,259 0.18RioCan Real Estate Investment Trust CAD 192,709 4,297,923 0.39Smart Real Estate Investment Trust CAD 28,183 818,468 0.07
13,935,081 1.26
ChinaChina Overseas Land & Investment Ltd.
(Hong Kong) (2) HKD 956,000 3,018,727 0.27China Resources Land Ltd.
(Cayman Islands) (2) HKD 172,000 401,242 0.03Global Logistic Properties Ltd.
(Singapore) (2) SGD 2,613,400 3,500,150 0.32
6,920,119 0.62
FinlandCitycon OYJ EUR 4,328,782 9,855,072 0.89
9,855,072 0.89
Global Property Fund

Morgan Stanley Investment Funds 30 June 2016 54
The accompanying notes are an integral part of these financial statements.
Global Property Fund (continued)
SCHEDULE OF INVESTMENTSAs at 30 June 2016
Investments Currency
Quantity/Nominal
Value
Market Value USD
% of Net Assets
Transferable securities and money market instruments admitted to official exchange listing or dealt in on another regulated market
Equities (continued)
FranceFonciere Des Regions, REIT EUR 43,797 3,866,681 0.35Gecina SA, REIT EUR 77,134 10,495,217 0.95ICADE, REIT EUR 121,495 8,592,434 0.78Klepierre, REIT EUR 278,489 12,358,414 1.12Unibail-Rodamco SE, REIT EUR 126,515 32,916,588 2.97
68,229,334 6.17
GermanyADO Properties SA (Luxembourg) (2) EUR 36,300 1,397,812 0.13alstria office REIT-AG EUR 99,056 1,326,881 0.12Deutsche EuroShop AG EUR 31,274 1,419,125 0.13Deutsche Wohnen AG EUR 316,050 10,682,304 0.96LEG Immobilien AG EUR 15,483 1,445,768 0.13Vonovia SE EUR 492,362 17,938,717 1.62
34,210,607 3.09
Hong KongCheung Kong Property Holdings Ltd.
(Cayman Islands) (2) HKD 2,942,500 18,355,308 1.66Hang Lung Properties Ltd. HKD 1,009,189 2,031,671 0.18Henderson Land Development Co. Ltd. HKD 1,177,001 6,606,400 0.60Hongkong Land Holdings Ltd.
(Bermuda) (2) USD 4,007,400 24,405,066 2.21Hysan Development Co. Ltd. HKD 3,278,808 14,558,112 1.32Kerry Properties Ltd. (Bermuda) (2) HKD 648,911 1,595,744 0.14Link REIT HKD 2,072,976 14,106,785 1.28New World Development Co. Ltd. HKD 5,076,816 5,136,425 0.46Sino Land Co. Ltd. HKD 700,129 1,142,383 0.10Sun Hung Kai Properties Ltd. HKD 3,194,989 38,316,479 3.47Swire Properties Ltd. HKD 4,983,950 13,200,347 1.19Wharf Holdings Ltd. (The) HKD 1,487,777 9,002,710 0.81
148,457,430 13.42
IrelandGreen REIT plc EUR 4,006,222 6,176,972 0.56Hibernia REIT plc EUR 5,175,759 7,652,262 0.69
13,829,234 1.25
ItalyBeni Stabili SpA SIIQ, REIT EUR 1,030,594 647,292 0.06
647,292 0.06
JapanActivia Properties, Inc., REIT JPY 885 4,684,180 0.42Advance Residence Investment Corp., REIT JPY 758 2,030,331 0.18Aeon Mall Co. Ltd. JPY 30,200 391,971 0.04Daiwa Office Investment Corp., REIT JPY 308 1,824,985 0.17Frontier Real Estate Investment Corp., REIT JPY 138 716,988 0.06GLP J-REIT JPY 3,069 3,875,814 0.35Hulic Co. Ltd. JPY 235,900 2,460,448 0.22Hulic Reit, Inc. JPY 393 718,091 0.07Invincible Investment Corp., REIT JPY 2,149 1,354,886 0.12Japan Hotel REIT Investment Corp. JPY 479 403,128 0.04Japan Prime Realty Investment Corp., REIT JPY 138 592,119 0.05
SCHEDULE OF INVESTMENTSAs at 30 June 2016
Investments Currency
Quantity/Nominal
Value
Market Value USD
% of Net Assets
Transferable securities and money market instruments admitted to official exchange listing or dealt in on another regulated market
Equities (continued)
Japan (continued)Japan Real Estate Investment Corp., REIT JPY 1,363 8,407,686 0.76Japan Retail Fund Investment Corp., REIT JPY 2,318 5,911,148 0.53Kenedix Office Investment Corp., REIT JPY 233 1,389,658 0.13Mitsubishi Estate Co. Ltd. JPY 1,667,000 30,378,391 2.75Mitsui Fudosan Co. Ltd. JPY 1,320,000 29,943,374 2.71Mori Hills REIT Investment Corp. JPY 1,358 2,129,885 0.19Mori Trust Sogo Reit, Inc. JPY 1,124 2,130,329 0.19Nippon Building Fund, Inc., REIT JPY 1,758 10,827,145 0.98Nippon Prologis REIT, Inc. JPY 2,359 5,760,936 0.52Nomura Real Estate Master Fund, Inc., REIT JPY 5,177 8,195,154 0.74Orix JREIT, Inc. JPY 1,930 3,329,335 0.30Premier Investment Corp., REIT JPY 318 417,998 0.04Sumitomo Realty & Development Co. Ltd. JPY 655,000 17,553,975 1.59Tokyo Tatemono Co. Ltd. JPY 30,000 356,684 0.03Tokyu REIT, Inc. JPY 145 206,115 0.02Top REIT, Inc. JPY 103 416,389 0.04United Urban Investment Corp., REIT JPY 3,805 6,852,554 0.62
153,259,697 13.86
NetherlandsEurocommercial Properties NV, REIT, CVA EUR 189,748 8,063,910 0.73Vastned Retail NV, REIT EUR 15,448 627,573 0.06Wereldhave NV, REIT EUR 116,212 5,264,971 0.47
13,956,454 1.26
NorwayEntra ASA NOK 866,258 8,093,801 0.73Norwegian Property ASA NOK 740,487 803,715 0.07
8,897,516 0.80
SingaporeAscendas Real Estate Investment Trust SGD 680,500 1,252,228 0.11CapitaLand Commercial Trust Ltd., REIT SGD 1,335,200 1,461,309 0.13CapitaLand Ltd. SGD 1,175,500 2,677,716 0.24CapitaLand Mall Trust, REIT SGD 1,636,700 2,586,737 0.24Mapletree Logistics Trust, REIT SGD 2,330,800 1,729,452 0.16Suntec Real Estate Investment Trust SGD 505,900 664,418 0.06UOL Group Ltd. SGD 490,505 1,987,191 0.18
12,359,051 1.12
SpainHispania Activos Inmobiliarios SA, REIT EUR 13,315 155,934 0.01Inmobiliaria Colonial SA EUR 2,912,619 2,081,895 0.19Merlin Properties Socimi SA, REIT EUR 299,775 3,077,488 0.28
5,315,317 0.48
SwedenAtrium Ljungberg AB ‘B’ SEK 193,835 3,120,527 0.28Castellum AB SEK 422,451 5,964,558 0.54Fabege AB SEK 65,847 1,107,401 0.10Hufvudstaden AB ‘A’ SEK 476,876 7,384,922 0.67
17,577,408 1.59

55 Morgan Stanley Investment Funds 30 June 2016
The accompanying notes are an integral part of these financial statements.
Global Property Fund (continued)
SCHEDULE OF INVESTMENTSAs at 30 June 2016
Investments Currency
Quantity/Nominal
Value
Market Value USD
% of Net Assets
Transferable securities and money market instruments admitted to official exchange listing or dealt in on another regulated market
Equities (continued)
SwitzerlandPSP Swiss Property AG CHF 147,003 14,341,829 1.30Swiss Prime Site AG CHF 15,978 1,443,277 0.13
15,785,106 1.43
United KingdomBritish Land Co. plc (The), REIT GBP 2,796,341 22,451,559 2.03Capital & Regional plc, REIT GBP 4,219,753 2,991,080 0.27Derwent London plc, REIT GBP 268,670 9,328,894 0.84Great Portland Estates plc, REIT GBP 1,000,082 8,291,617 0.75Hammerson plc, REIT GBP 1,712,498 11,897,044 1.08Helical Bar plc GBP 178,190 690,194 0.06Intu Properties plc, REIT GBP 2,420,740 9,241,402 0.84Kennedy Wilson Europe Real Estate plc
(Jersey) (2) GBP 184,823 2,366,832 0.21Land Securities Group plc, REIT GBP 2,010,878 27,696,702 2.51LXB Retail Properties plc (Jersey) (2) GBP 3,610,805 3,056,772 0.28Segro plc, REIT GBP 1,108,522 6,119,180 0.55Shaftesbury plc, REIT GBP 121,582 1,428,721 0.13ST Modwen Properties plc GBP 1,183,633 4,186,214 0.38UNITE Group plc (The) GBP 201,533 1,670,897 0.15Urban & Civic plc GBP 1,660,957 4,687,013 0.42Workspace Group plc, REIT GBP 227,587 2,084,163 0.19
118,188,284 10.69
United States of AmericaAmerican Homes 4 Rent, REIT ‘A’ USD 32,960 664,474 0.06Apartment Investment & Management Co.,
REIT ‘A’ USD 146,924 6,350,055 0.57AvalonBay Communities, Inc., REIT USD 110,702 19,621,929 1.77Boston Properties, Inc., REIT USD 159,840 20,886,293 1.89Brixmor Property Group, Inc., REIT USD 75,980 1,981,558 0.18Camden Property Trust, REIT USD 133,256 11,571,951 1.05CBL & Associates Properties, Inc., REIT USD 15,240 138,836 0.01Chesapeake Lodging Trust, REIT USD 126,870 2,950,996 0.27Corporate Office Properties Trust, REIT USD 33,105 960,045 0.09Cousins Properties, Inc., REIT USD 241,060 2,466,044 0.22CubeSmart, REIT USD 61,080 1,860,497 0.17DCT Industrial Trust, Inc., REIT USD 6,648 313,054 0.03DDR Corp., REIT USD 114,258 2,055,501 0.19Douglas Emmett, Inc., REIT USD 173,105 6,025,785 0.55Duke Realty Corp., REIT USD 114,067 2,977,149 0.27Equity LifeStyle Properties, Inc., REIT USD 6,024 476,619 0.04Equity One, Inc., REIT USD 34,620 1,095,031 0.10Equity Residential, REIT USD 400,605 27,193,067 2.46Essex Property Trust, Inc., REIT USD 40,357 9,011,718 0.82Gaming and Leisure Properties, Inc., REIT USD 62,260 2,126,179 0.19General Growth Properties, Inc., REIT USD 534,165 15,848,676 1.43HCP, Inc., REIT USD 28,979 1,011,947 0.09Healthcare Realty Trust, Inc., REIT USD 57,216 1,947,633 0.18Hilton Worldwide Holdings, Inc. USD 278,882 6,230,224 0.56Host Hotels & Resorts, Inc., REIT USD 1,163,156 18,470,917 1.67Hudson Pacific Properties, Inc., REIT USD 223,277 6,396,886 0.58Kimco Realty Corp., REIT USD 308,223 9,487,104 0.86LaSalle Hotel Properties, REIT USD 355,332 8,218,829 0.74Liberty Property Trust, REIT USD 54,925 2,138,230 0.19Macerich Co. (The), REIT USD 4,587 386,042 0.04Mack-Cali Realty Corp., REIT USD 46,974 1,254,206 0.11National Retail Properties, Inc., REIT USD 120,430 6,167,220 0.56Omega Healthcare Investors, Inc., REIT USD 94,309 3,139,547 0.28
SCHEDULE OF INVESTMENTSAs at 30 June 2016
Investments Currency
Quantity/Nominal
Value
Market Value USD
% of Net Assets
Transferable securities and money market instruments admitted to official exchange listing or dealt in on another regulated market
Equities (continued)
United States of America (continued)Paramount Group, Inc., REIT USD 80,050 1,244,778 0.11Post Properties, Inc., REIT USD 14,247 856,102 0.08Prologis, Inc., REIT USD 159,135 7,713,273 0.70Public Storage, REIT USD 63,139 15,942,598 1.44QTS Realty Trust, Inc., REIT ‘A’ USD 33,941 1,875,919 0.17Realty Income Corp., REIT USD 1,523 104,204 0.01Regency Centers Corp., REIT USD 167,370 13,841,499 1.25Rexford Industrial Realty, Inc., REIT USD 61,329 1,287,296 0.12Senior Housing Properties Trust, REIT USD 105,556 2,220,898 0.20Simon Property Group, Inc., REIT USD 247,953 53,171,041 4.81Sovran Self Storage, Inc., REIT USD 24,965 2,596,110 0.23Spirit Realty Capital, Inc., REIT USD 64,830 814,913 0.07STORE Capital Corp., REIT USD 76,216 2,188,161 0.20Sunstone Hotel Investors, Inc., REIT USD 119,724 1,421,723 0.13Tanger Factory Outlet Centers, Inc., REIT USD 216,844 8,649,907 0.78Taubman Centers, Inc., REIT USD 46,632 3,444,240 0.31Ventas, Inc., REIT USD 156,440 11,252,729 1.02Vornado Realty Trust, REIT USD 284,641 28,128,224 2.54Welltower, Inc., REIT USD 107,144 8,048,657 0.73WP Glimcher, Inc., REIT USD 72,810 795,813 0.07Xenia Hotels & Resorts, Inc., REIT USD 98,987 1,638,235 0.15
368,660,562 33.34
Total Equities 1,090,087,997 98.57
Total Transferable securities and money market instruments admitted to official exchange listing or dealt in on another regulated market 1,090,087,997 98.57
Other transferable securities and money market instruments not admitted to official exchange listing or dealt in on another regulated market
Equities
MaltaBGP Holdings plc (Australia) (2) (3) EUR 3,475,560 0 0.00
0 0.00
Total Equities 0 0.00
Total Other transferable securities and money market instruments not admitted to official exchange listing or dealt in on another regulated market 0 0.00

Morgan Stanley Investment Funds 30 June 2016 56
The accompanying notes are an integral part of these financial statements.
Global Property Fund (continued)
Forward Currency Exchange Contracts
Currency Purchased
Amount Purchased
Currency Sold
Amount Sold
Maturity Date Counterparty
Unrealised Gain/(Loss)
USD
% of Net Assets
EUR Hedged Share ClassEUR 18,487,443 USD 20,432,692 08/07/2016 J.P. Morgan 121,510 0.01
Unrealised Gain on NAV Hedged Share Classes Forward Currency Exchange Contracts 121,510 0.01
Total Unrealised Gain on Forward Currency Exchange Contracts 121,510 0.01
EUR Hedged Share ClassEUR 19,646,159 USD 22,132,483 01/07/2016 J.P. Morgan (293,028) (0.03)USD 21,702,561 EUR 19,646,159 01/07/2016 J.P. Morgan (136,894) (0.01)EUR 46,361 USD 51,554 08/07/2016 J.P. Morgan (10) 0.00USD 1,096,219 EUR 990,959 08/07/2016 J.P. Morgan (5,522) 0.00
Unrealised Loss on NAV Hedged Share Classes Forward Currency Exchange Contracts (435,454) (0.04)
Total Unrealised Loss on Forward Currency Exchange Contracts (435,454) (0.04)
Net Unrealised Loss on Forward Currency Exchange Contracts (313,944) (0.03)
SCHEDULE OF INVESTMENTSAs at 30 June 2016
Investments Currency
Quantity/Nominal
Value
Market Value USD
% of Net Assets
Units of authorised UCITS or other collective investment undertakings
Collective Investment Schemes – UCITS
LuxembourgMorgan Stanley Liquidity Funds US Dollar
Treasury Liquidity Fund – MS Reserve (4) USD 1,038,043 1,038,043 0.10
1,038,043 0.10
Total Collective Investment Schemes – UCITS 1,038,043 0.10
Total Units of authorised UCITS or other collective investment undertakings 1,038,043 0.10
Total Investments 1,091,126,040 98.67
Cash 4,638,621 0.42
Other Assets/(Liabilities) 10,073,359 0.91
Total Net Assets 1,105,838,020 100.00
(2) The country in brackets represents the country of incorporation of this security.(3) Security is valued at its fair value under the direction of the Board of Directors of the SICAV.(4) Affiliate managed by an affiliate of the Investment Adviser.
DERIVATIVES
Over-the-counter (OTC) and exchange traded derivatives as at 30 June 2016, expressed in US dollars.

57 Morgan Stanley Investment Funds 30 June 2016
The accompanying notes are an integral part of these financial statements.
Please refer to the full prospectus for the Fund’s investment objective and policy.
INVESTMENT AIM
To seek an attractive long-term rate of return, measured in US dollars, through investment principally in equity securities of companies in the world’s developed countries. The strategy will invest in a concentrated portfolio of high quality businesses with strong managements that can sustain high cross-cycle returns on capital.
SCHEDULE OF INVESTMENTSAs at 30 June 2016
Investments Currency
Quantity/Nominal
Value
Market Value USD
% of Net Assets
Transferable securities and money market instruments admitted to official exchange listing or dealt in on another regulated market
Equities
FranceL’Oreal SA EUR 388,716 73,610,319 4.97Pernod Ricard SA EUR 199,352 22,069,906 1.49Sanofi EUR 167,950 13,819,529 0.94
109,499,754 7.40
GermanyBayer AG EUR 258,815 25,574,462 1.73SAP SE EUR 372,755 27,700,591 1.87
53,275,053 3.60
JapanJapan Tobacco, Inc. JPY 700,100 27,948,145 1.89
27,948,145 1.89
NetherlandsRELX NV EUR 738,984 12,733,004 0.86
12,733,004 0.86
SwitzerlandNestle SA CHF 544,803 41,889,866 2.83Novartis AG CHF 802,989 65,283,993 4.41Roche Holding AG CHF 162,003 42,130,719 2.85
149,304,578 10.09
United KingdomARM Holdings plc GBP 1,409,327 20,888,428 1.41British American Tobacco plc GBP 1,004,638 63,908,161 4.32Experian plc (Jersey) (2) GBP 470,687 8,747,276 0.59GlaxoSmithKline plc GBP 1,655,610 34,783,589 2.35Prudential plc GBP 1,662,428 27,510,325 1.86Reckitt Benckiser Group plc GBP 929,667 91,631,753 6.19RELX plc GBP 1,073,866 19,447,004 1.31Unilever plc GBP 1,310,106 61,571,909 4.16
328,488,445 22.19
United States of AmericaAccenture plc ‘A’ (Ireland) (2) USD 517,730 58,249,802 3.94Alphabet, Inc. ‘A’ USD 92,776 64,580,446 4.36Altria Group, Inc. USD 820,321 55,691,593 3.76Automatic Data Processing, Inc. USD 403,088 36,177,148 2.44Coca-Cola Co. (The) USD 244,598 10,928,639 0.74Danaher Corp. USD 287,641 28,841,763 1.95International Flavors & Fragrances, Inc. USD 107,938 13,411,296 0.91Intuit, Inc. USD 83,138 9,134,372 0.62Johnson & Johnson USD 437,094 52,092,863 3.52Microsoft Corp. USD 1,540,405 77,821,261 5.26Mondelez International, Inc. ‘A’ USD 169,178 7,298,339 0.49Moody’s Corp. USD 78,281 7,178,368 0.48Nielsen Holdings plc (United Kingdom) (2) USD 792,367 40,632,580 2.75NIKE, Inc. ‘B’ USD 714,454 39,366,415 2.66Philip Morris International, Inc. USD 204,770 20,302,945 1.37Priceline Group, Inc. (The) USD 11,439 14,344,620 0.97Reynolds American, Inc. USD 1,226,658 64,963,808 4.39
Global Quality Fund

Morgan Stanley Investment Funds 30 June 2016 58
The accompanying notes are an integral part of these financial statements.
Global Quality Fund (continued)
SCHEDULE OF INVESTMENTSAs at 30 June 2016
Investments Currency
Quantity/Nominal
Value
Market Value USD
% of Net Assets
Transferable securities and money market instruments admitted to official exchange listing or dealt in on another regulated market
Equities (continued)
United States of America (continued)Time Warner, Inc. USD 285,644 20,683,482 1.40Twenty-First Century Fox, Inc. ‘A’ USD 830,183 22,456,450 1.52Twenty-First Century Fox, Inc. ‘B’ USD 1,242,845 33,656,243 2.27Visa, Inc. ‘A’ USD 630,215 48,249,260 3.26Walt Disney Co. (The) USD 440,307 42,762,616 2.89
768,824,309 51.95
Total Equities 1,450,073,288 97.98
Total Transferable securities and money market instruments admitted to official exchange listing or dealt in on another regulated market 1,450,073,288 97.98
Units of authorised UCITS or other collective investment undertakings
Collective Investment Schemes – UCITS
LuxembourgMorgan Stanley Liquidity Funds US Dollar
Treasury Liquidity Fund – MS Reserve (4) USD 26,966,127 26,966,127 1.82
26,966,127 1.82
Total Collective Investment Schemes – UCITS 26,966,127 1.82
Total Units of authorised UCITS or other collective investment undertakings 26,966,127 1.82
Total Investments 1,477,039,415 99.80
Cash 149,084 0.01
Other Assets/(Liabilities) 2,880,037 0.19
Total Net Assets 1,480,068,536 100.00
(2) The country in brackets represents the country of incorporation of this security. (4) Affiliate managed by an affiliate of the Investment Adviser.
DERIVATIVES
Over-the-counter (OTC) and exchange traded derivatives as at 30 June 2016, expressed in US dollars.
Forward Currency Exchange Contracts
Currency Purchased
Amount Purchased
Currency Sold
Amount Sold
Maturity Date Counterparty
Unrealised Gain/(Loss)
USD
% of Net Assets
CHF Hedged Share ClassCHF 3,155,046 USD 3,215,881 08/07/2016 J.P. Morgan 21,639 0.00
EUR Hedged Share ClassEUR 142,397 USD 157,098 01/07/2016 J.P. Morgan 1,196 0.00USD 1,706,322 EUR 1,507,704 01/07/2016 J.P. Morgan 30,298 0.00EUR 74,305,126 USD 82,123,669 08/07/2016 J.P. Morgan 488,217 0.04USD 112,293 EUR 100,982 08/07/2016 J.P. Morgan 22 0.00
SGD Hedged Share ClassSGD 5,202,748 USD 3,839,021 08/07/2016 J.P. Morgan 21,508 0.00
Unrealised Gain on NAV Hedged Share Classes Forward Currency Exchange Contracts 562,880 0.04
Total Unrealised Gain on Forward Currency Exchange Contracts 562,880 0.04
CHF Hedged Share ClassCHF 3,253,171 USD 3,386,780 01/07/2016 J.P. Morgan (49,406) 0.00USD 3,314,151 CHF 3,253,171 01/07/2016 J.P. Morgan (23,222) 0.00
EUR Hedged Share ClassEUR 78,318,283 USD 88,228,674 01/07/2016 J.P. Morgan (1,166,941) (0.08)USD 85,025,088 EUR 76,952,976 01/07/2016 J.P. Morgan (518,916) (0.04)EUR 116,622 USD 129,685 08/07/2016 J.P. Morgan (26) 0.00USD 2,542 EUR 2,298 08/07/2016 J.P. Morgan (13) 0.00
SGD Hedged Share ClassSGD 5,364,007 USD 3,996,992 01/07/2016 J.P. Morgan (16,902) 0.00USD 3,957,801 SGD 5,364,007 01/07/2016 J.P. Morgan (22,289) 0.00
Unrealised Loss on NAV Hedged Share Classes Forward Currency Exchange Contracts (1,797,715) (0.12)
Total Unrealised Loss on Forward Currency Exchange Contracts (1,797,715) (0.12)
Net Unrealised Loss on Forward Currency Exchange Contracts (1,234,835) (0.08)
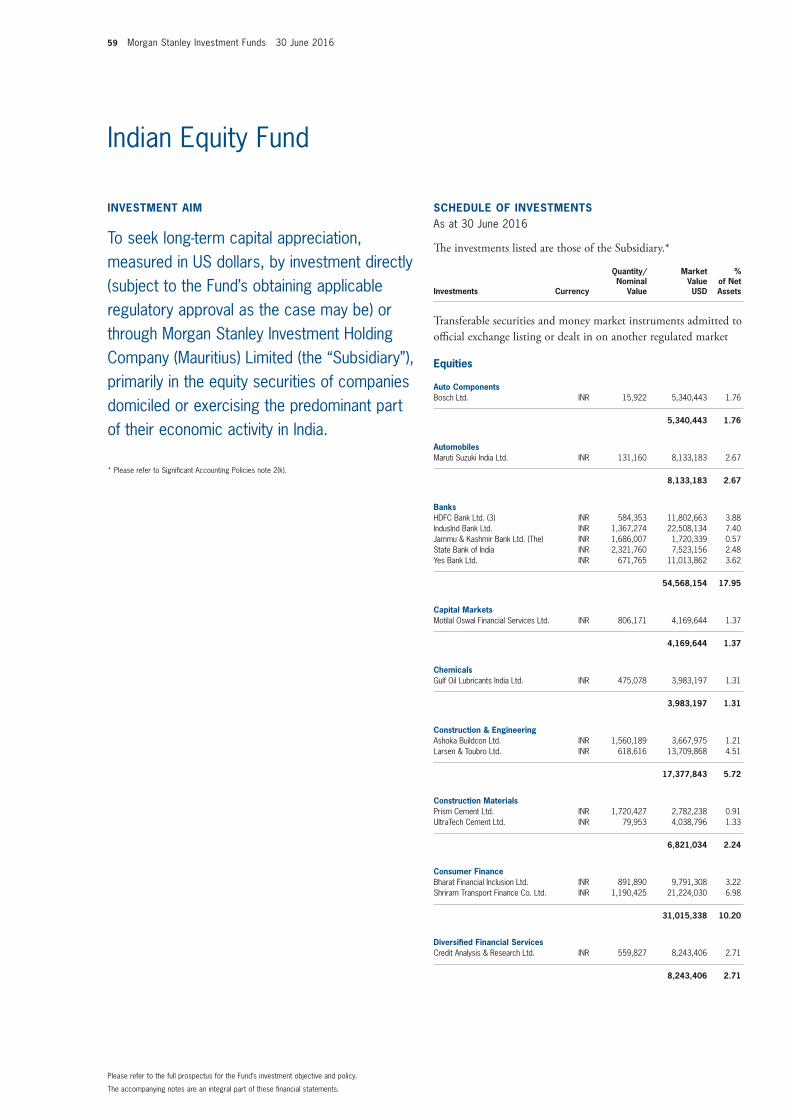
59 Morgan Stanley Investment Funds 30 June 2016
The accompanying notes are an integral part of these financial statements.
Please refer to the full prospectus for the Fund’s investment objective and policy.
INVESTMENT AIM
To seek long-term capital appreciation, measured in US dollars, by investment directly (subject to the Fund’s obtaining applicable regulatory approval as the case may be) or through Morgan Stanley Investment Holding Company (Mauritius) Limited (the “Subsidiary”), primarily in the equity securities of companies domiciled or exercising the predominant part of their economic activity in India.
* Please refer to Significant Accounting Policies note 2(k).
SCHEDULE OF INVESTMENTSAs at 30 June 2016
The investments listed are those of the Subsidiary.*
Investments Currency
Quantity/Nominal
Value
Market Value USD
% of Net Assets
Transferable securities and money market instruments admitted to official exchange listing or dealt in on another regulated market
Equities
Auto ComponentsBosch Ltd. INR 15,922 5,340,443 1.76
5,340,443 1.76
AutomobilesMaruti Suzuki India Ltd. INR 131,160 8,133,183 2.67
8,133,183 2.67
BanksHDFC Bank Ltd. (3) INR 584,353 11,802,663 3.88IndusInd Bank Ltd. INR 1,367,274 22,508,134 7.40Jammu & Kashmir Bank Ltd. (The) INR 1,686,007 1,720,339 0.57State Bank of India INR 2,321,760 7,523,156 2.48Yes Bank Ltd. INR 671,765 11,013,862 3.62
54,568,154 17.95
Capital MarketsMotilal Oswal Financial Services Ltd. INR 806,171 4,169,644 1.37
4,169,644 1.37
ChemicalsGulf Oil Lubricants India Ltd. INR 475,078 3,983,197 1.31
3,983,197 1.31
Construction & EngineeringAshoka Buildcon Ltd. INR 1,560,189 3,667,975 1.21Larsen & Toubro Ltd. INR 618,616 13,709,868 4.51
17,377,843 5.72
Construction MaterialsPrism Cement Ltd. INR 1,720,427 2,782,238 0.91UltraTech Cement Ltd. INR 79,953 4,038,796 1.33
6,821,034 2.24
Consumer FinanceBharat Financial Inclusion Ltd. INR 891,890 9,791,308 3.22Shriram Transport Finance Co. Ltd. INR 1,190,425 21,224,030 6.98
31,015,338 10.20
Diversified Financial ServicesCredit Analysis & Research Ltd. INR 559,827 8,243,406 2.71
8,243,406 2.71
Indian Equity Fund

Morgan Stanley Investment Funds 30 June 2016 60
The accompanying notes are an integral part of these financial statements.
Indian Equity Fund (continued)
SCHEDULE OF INVESTMENTSAs at 30 June 2016
The investments listed are those of the Subsidiary.*
Investments Currency
Quantity/Nominal
Value
Market Value USD
% of Net Assets
Transferable securities and money market instruments admitted to official exchange listing or dealt in on another regulated market
Equities (continued)
Electronic Equipment, Instruments & ComponentsRedington India Ltd. INR 6,171,403 9,468,454 3.11
9,468,454 3.11
Gas UtilitiesGujarat State Petronet Ltd. INR 1,759,438 3,733,839 1.23Indraprastha Gas Ltd. INR 514,283 4,779,538 1.57
8,513,377 2.80
IT ServicesHCL Technologies Ltd. INR 522,003 5,646,755 1.86Infosys Ltd. INR 1,579,262 27,382,450 9.00
33,029,205 10.86
MachineryAshok Leyland Ltd. INR 8,785,968 12,796,741 4.21Eicher Motors Ltd. INR 60,239 17,148,288 5.64
29,945,029 9.85
MediaDB Corp. Ltd. INR 494,084 2,743,895 0.90Inox Leisure Ltd. INR 1,814,325 6,480,788 2.13Zee Entertainment Enterprises Ltd. INR 1,746,757 11,808,879 3.89
21,033,562 6.92
Oil, Gas & Consumable FuelsBharat Petroleum Corp. Ltd. INR 820,344 13,025,277 4.28
13,025,277 4.28
Personal ProductsMarico Ltd. INR 2,152,612 8,403,236 2.76
8,403,236 2.76
PharmaceuticalsGlenmark Pharmaceuticals Ltd. INR 614,537 7,272,059 2.39Natco Pharma Ltd. INR 472,065 4,054,411 1.34
11,326,470 3.73
Transportation InfrastructureGateway Distriparks Ltd. INR 1,850,962 8,481,120 2.79Gujarat Pipavav Port Ltd. INR 1,506,506 3,636,586 1.20
12,117,706 3.99
SCHEDULE OF INVESTMENTSAs at 30 June 2016
The investments listed are those of the Subsidiary.*
Investments Currency
Quantity/Nominal
Value
Market Value USD
% of Net Assets
Transferable securities and money market instruments admitted to official exchange listing or dealt in on another regulated market
Equities (continued)
Wireless Telecommunication ServicesIdea Cellular Ltd. INR 3,010,686 4,752,893 1.56
4,752,893 1.56
Total Equities 291,267,451 95.79
Total Transferable securities and money market instruments admitted to official exchange listing or dealt in on another regulated market 291,267,451 95.79
Total Investments 291,267,451 95.79
Cash 13,876,579 4.56
Other Assets/(Liabilities) (1,083,271) (0.35)
Total Net Assets 304,060,759 100.00
(3) Security is valued at its fair value under the direction of the Board of Directors of the SICAV.
Collateral received and paid by the Fund in respect of financial derivative instruments:
Type of Collateral Counterparty CurrencyCollateral Amount
receivedCollateral Amount
paid
Indian Equity Fund
Cash Goldman Sachs USD 478,212 -
478,212 -
Indian Equity Fund

61 Morgan Stanley Investment Funds 30 June 2016
The accompanying notes are an integral part of these financial statements.
Please refer to the full prospectus for the Fund’s investment objective and policy.
INVESTMENT AIM
To achieve its investment objective by investing principally in equity securities, including depositary receipts (including American Depositary Receipts (ADRs) and Global Depositary Receipts (GDRs), of companies located in the world’s developed countries excluding the United States of America.
SCHEDULE OF INVESTMENTSAs at 30 June 2016
Investments Currency
Quantity/Nominal
Value
Market Value USD
% of Net Assets
Transferable securities and money market instruments admitted to official exchange listing or dealt in on another regulated market
Equities
BelgiumKBC Groep NV EUR 1,412 68,467 0.10
68,467 0.10
CanadaBarrick Gold Corp. CAD 68,610 1,445,645 2.05Turquoise Hill Resources Ltd. CAD 134,743 452,429 0.64
1,898,074 2.69
ChinaChina Petroleum & Chemical Corp. ‘H’ HKD 914,000 659,681 0.94
659,681 0.94
FranceAXA SA EUR 26,259 512,878 0.73L’Oreal SA EUR 14,251 2,698,681 3.83Pernod Ricard SA EUR 17,348 1,920,566 2.72Publicis Groupe SA EUR 10,201 686,854 0.97Safran SA EUR 7,951 538,451 0.76Sanofi EUR 20,810 1,712,322 2.43
8,069,752 11.44
GermanyBASF SE EUR 9,417 713,102 1.01Bayer AG EUR 19,182 1,895,444 2.69Continental AG EUR 3,663 686,121 0.97SAP SE EUR 15,097 1,121,905 1.59
4,416,572 6.26
IrelandBank of Ireland EUR 1,341,295 274,380 0.39CRH plc EUR 45,285 1,294,006 1.83
1,568,386 2.22
ItalyEni SpA EUR 19,256 305,246 0.43
305,246 0.43
JapanFANUC Corp. JPY 4,500 723,949 1.03Hitachi Ltd. JPY 196,000 808,371 1.15Inpex Corp. JPY 86,700 669,272 0.95Japan Tobacco, Inc. JPY 66,600 2,658,687 3.77Keyence Corp. JPY 1,500 1,009,048 1.43Kyocera Corp. JPY 2,500 117,776 0.17Mitsubishi Estate Co. Ltd. JPY 46,000 838,276 1.19MS&AD Insurance Group Holdings, Inc. JPY 10,600 270,363 0.38NGK Spark Plug Co. Ltd. JPY 47,200 702,168 0.99Nitto Denko Corp. JPY 4,000 250,477 0.35Sekisui House Ltd. JPY 26,600 460,544 0.65Shiseido Co. Ltd. JPY 2,500 64,142 0.09Sompo Japan Nipponkoa Holdings, Inc. JPY 48,400 1,270,747 1.80Sumco Corp. JPY 20,800 130,936 0.19Sumitomo Mitsui Financial Group, Inc. JPY 9,100 259,064 0.37Sumitomo Mitsui Trust Holdings, Inc. JPY 28,000 89,846 0.13
International Equity (ex US) Fund

Morgan Stanley Investment Funds 30 June 2016 62
The accompanying notes are an integral part of these financial statements.
International Equity (ex US) Fund (continued)
SCHEDULE OF INVESTMENTSAs at 30 June 2016
Investments Currency
Quantity/Nominal
Value
Market Value USD
% of Net Assets
Transferable securities and money market instruments admitted to official exchange listing or dealt in on another regulated market
Equities (continued)
Japan (continued)Toyota Motor Corp. JPY 17,400 855,271 1.21USS Co. Ltd. JPY 11,600 189,948 0.27
11,368,885 16.12
NetherlandsAkzo Nobel NV EUR 13,826 858,696 1.22RELX NV EUR 68,858 1,186,452 1.68Unilever NV, CVA EUR 74,044 3,419,169 4.85
5,464,317 7.75
SwedenNordea Bank AB SEK 74,221 616,244 0.87
616,244 0.87
SwitzerlandCredit Suisse Group AG CHF 10,338 109,025 0.15Nestle SA CHF 43,086 3,312,880 4.70Novartis AG CHF 35,467 2,883,511 4.09Roche Holding AG CHF 9,221 2,398,026 3.40Swisscom AG CHF 1,495 732,339 1.04Zurich Insurance Group AG CHF 1,786 433,505 0.61
9,869,286 13.99
United KingdomAdmiral Group plc GBP 16,914 450,245 0.64ARM Holdings plc GBP 66,937 992,111 1.41Aviva plc GBP 145,444 751,273 1.06British American Tobacco plc GBP 53,899 3,428,684 4.86BT Group plc GBP 237,003 1,288,541 1.83Bunzl plc GBP 44,288 1,350,922 1.92Experian plc (Jersey) (2) GBP 55,878 1,038,440 1.47GlaxoSmithKline plc GBP 136,764 2,873,347 4.07Imperial Brands plc GBP 40,125 2,147,014 3.04Lloyds Banking Group plc GBP 902,660 654,629 0.93Meggitt plc GBP 148,624 811,835 1.15Prudential plc GBP 106,095 1,755,690 2.49Reckitt Benckiser Group plc GBP 34,397 3,390,308 4.81RELX plc GBP 48,913 885,782 1.26Smiths Group plc GBP 23,239 353,494 0.50Travis Perkins plc GBP 15,150 295,188 0.42Wolseley plc (Jersey) (2) GBP 23,846 1,221,802 1.73
23,689,305 33.59
United States of AmericaAAC Technologies Holdings, Inc.
(Cayman Islands) (2) HKD 64,352 546,157 0.78
546,157 0.78
Total Equities 68,540,372 97.18
Total Transferable securities and money market instruments admitted to official exchange listing or dealt in on another regulated market 68,540,372 97.18
SCHEDULE OF INVESTMENTSAs at 30 June 2016
Investments Currency
Quantity/Nominal
Value
Market Value USD
% of Net Assets
Units of authorised UCITS or other collective investment undertakings
Collective Investment Schemes – UCITS
LuxembourgMorgan Stanley Liquidity Funds US Dollar
Treasury Liquidity Fund – MS Reserve (4) USD 1,442,246 1,442,246 2.05
1,442,246 2.05
Total Collective Investment Schemes – UCITS 1,442,246 2.05
Total Units of authorised UCITS or other collective investment undertakings 1,442,246 2.05
Total Investments 69,982,618 99.23
Cash 313,012 0.44
Other Assets/(Liabilities) 228,624 0.33
Total Net Assets 70,524,254 100.00
(2) The country in brackets represents the country of incorporation of this security.(4) Affiliate managed by an affiliate of the Investment Adviser.

63 Morgan Stanley Investment Funds 30 June 2016
The accompanying notes are an integral part of these financial statements.
International Equity (ex US) Fund (continued)
DERIVATIVES
Over-the-counter (OTC) and exchange traded derivatives as at 30 June 2016, expressed in US dollars.
Forward Currency Exchange Contracts
Currency Purchased
Amount Purchased
Currency Sold
Amount Sold
Maturity Date Counterparty
Unrealised Gain/(Loss)
USD
% of Net Assets
USD 3,704,561 JPY 392,000,000 22/07/2016 Commonwealth Bank of Australia (111,738) (0.16)
Unrealised Loss on Forward Currency Exchange Contracts (111,738) (0.16)
Net Unrealised Loss on Forward Currency Exchange Contracts (111,738) (0.16)
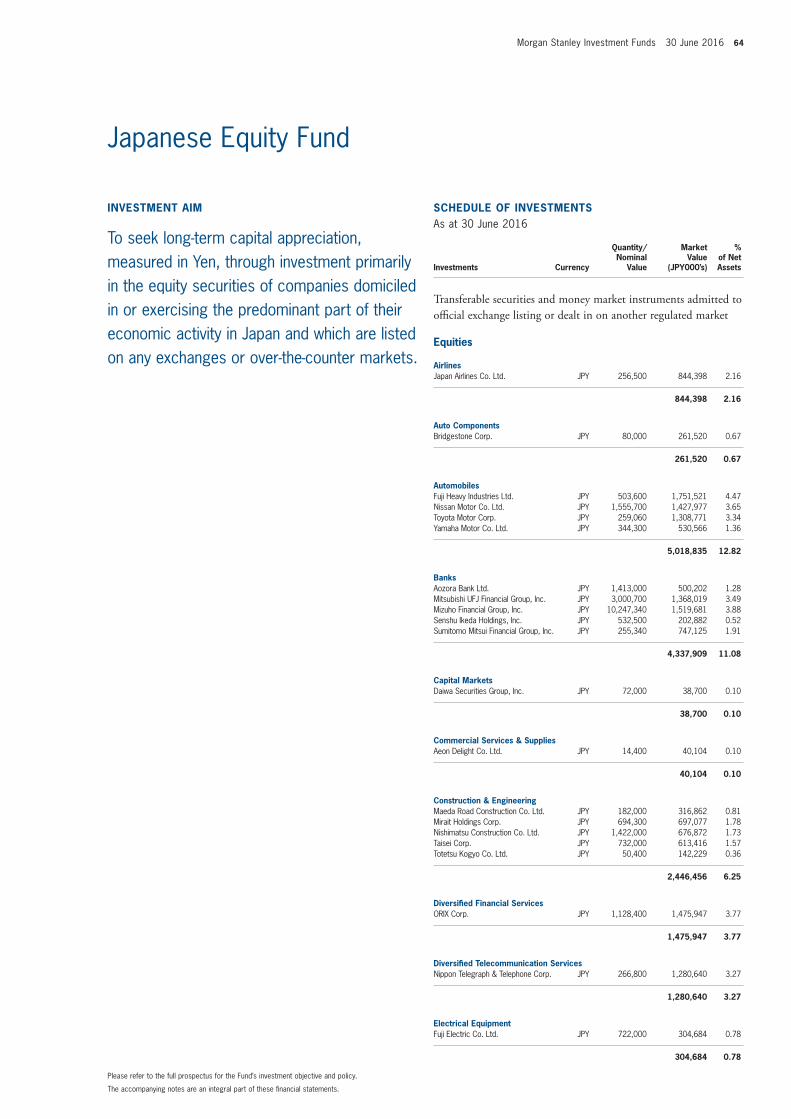
Morgan Stanley Investment Funds 30 June 2016 64
The accompanying notes are an integral part of these financial statements.
Please refer to the full prospectus for the Fund’s investment objective and policy.
INVESTMENT AIM
To seek long-term capital appreciation, measured in Yen, through investment primarily in the equity securities of companies domiciled in or exercising the predominant part of their economic activity in Japan and which are listed on any exchanges or over-the-counter markets.
SCHEDULE OF INVESTMENTSAs at 30 June 2016
Investments Currency
Quantity/Nominal
Value
Market Value
(JPY000’s)
% of Net Assets
Transferable securities and money market instruments admitted to official exchange listing or dealt in on another regulated market
Equities
AirlinesJapan Airlines Co. Ltd. JPY 256,500 844,398 2.16
844,398 2.16
Auto ComponentsBridgestone Corp. JPY 80,000 261,520 0.67
261,520 0.67
AutomobilesFuji Heavy Industries Ltd. JPY 503,600 1,751,521 4.47Nissan Motor Co. Ltd. JPY 1,555,700 1,427,977 3.65Toyota Motor Corp. JPY 259,060 1,308,771 3.34Yamaha Motor Co. Ltd. JPY 344,300 530,566 1.36
5,018,835 12.82
BanksAozora Bank Ltd. JPY 1,413,000 500,202 1.28Mitsubishi UFJ Financial Group, Inc. JPY 3,000,700 1,368,019 3.49Mizuho Financial Group, Inc. JPY 10,247,340 1,519,681 3.88Senshu Ikeda Holdings, Inc. JPY 532,500 202,882 0.52Sumitomo Mitsui Financial Group, Inc. JPY 255,340 747,125 1.91
4,337,909 11.08
Capital MarketsDaiwa Securities Group, Inc. JPY 72,000 38,700 0.10
38,700 0.10
Commercial Services & SuppliesAeon Delight Co. Ltd. JPY 14,400 40,104 0.10
40,104 0.10
Construction & EngineeringMaeda Road Construction Co. Ltd. JPY 182,000 316,862 0.81Mirait Holdings Corp. JPY 694,300 697,077 1.78Nishimatsu Construction Co. Ltd. JPY 1,422,000 676,872 1.73Taisei Corp. JPY 732,000 613,416 1.57Totetsu Kogyo Co. Ltd. JPY 50,400 142,229 0.36
2,446,456 6.25
Diversified Financial ServicesORIX Corp. JPY 1,128,400 1,475,947 3.77
1,475,947 3.77
Diversified Telecommunication ServicesNippon Telegraph & Telephone Corp. JPY 266,800 1,280,640 3.27
1,280,640 3.27
Electrical EquipmentFuji Electric Co. Ltd. JPY 722,000 304,684 0.78
304,684 0.78
Japanese Equity Fund

65 Morgan Stanley Investment Funds 30 June 2016
The accompanying notes are an integral part of these financial statements.
Japanese Equity Fund (continued)
SCHEDULE OF INVESTMENTSAs at 30 June 2016
Investments Currency
Quantity/Nominal
Value
Market Value
(JPY000’s)
% of Net Assets
Transferable securities and money market instruments admitted to official exchange listing or dealt in on another regulated market
Equities (continued)
Electronic Equipment, Instruments & ComponentsHitachi Ltd. JPY 626,000 265,361 0.68Murata Manufacturing Co. Ltd. JPY 98,800 1,124,344 2.87
1,389,705 3.55
Household DurablesFujitsu General Ltd. JPY 98,000 221,774 0.57Sekisui Chemical Co. Ltd. JPY 27,300 34,234 0.09Sekisui House Ltd. JPY 527,000 937,797 2.39
1,193,805 3.05
Industrial Power and Renewable Electricity ProducersElectric Power Development Co. Ltd. JPY 39,200 93,257 0.24
93,257 0.24
InsuranceDai-ichi Life Insurance Co. Ltd. (The) JPY 398,183 448,752 1.15Tokio Marine Holdings, Inc. JPY 185,100 623,232 1.59
1,071,984 2.74
Leisure ProductsHeiwa Corp. JPY 159,800 330,626 0.84
330,626 0.84
MachineryKubota Corp. JPY 324,300 443,480 1.13Mitsubishi Heavy Industries Ltd. JPY 1,168,000 475,843 1.22NTN Corp. JPY 1,118,000 304,096 0.78Star Micronics Co. Ltd. JPY 84,600 90,607 0.23
1,314,026 3.36
MarineNippon Yusen KK JPY 2,430,000 434,970 1.11
434,970 1.11
Metals & MiningHitachi Metals Ltd. JPY 1,007,200 1,036,409 2.65Nippon Light Metal Holdings Co. Ltd. JPY 6,445,000 1,456,570 3.72Nippon Steel & Sumitomo Metal Corp. JPY 401,400 785,941 2.01Nisshin Steel Co. Ltd. JPY 514,300 668,590 1.71Sumitomo Metal Mining Co. Ltd. JPY 78,000 80,223 0.20
4,027,733 10.29
Oil, Gas & Consumable FuelsJX Holdings, Inc. JPY 2,128,600 848,673 2.17
848,673 2.17
SCHEDULE OF INVESTMENTSAs at 30 June 2016
Investments Currency
Quantity/Nominal
Value
Market Value
(JPY000’s)
% of Net Assets
Transferable securities and money market instruments admitted to official exchange listing or dealt in on another regulated market
Equities (continued)
Real Estate Management & DevelopmentHulic Co. Ltd. JPY 521,700 559,262 1.43Nomura Real Estate Holdings, Inc. JPY 605,000 1,076,295 2.75Tokyu Fudosan Holdings Corp. JPY 1,058,000 670,772 1.71
2,306,329 5.89
Road & RailCentral Japan Railway Co. JPY 32,800 594,500 1.52Sankyu, Inc. JPY 932,000 509,804 1.30Senko Co. Ltd. JPY 160,900 98,954 0.25
1,203,258 3.07
Semiconductors & Semiconductor EquipmentTokyo Electron Ltd. JPY 159,000 1,363,425 3.48
1,363,425 3.48
Specialty RetailAOKI Holdings, Inc. JPY 228,700 241,507 0.61EDION Corp. JPY 314,500 265,124 0.68K’s Holdings Corp. JPY 386,000 736,102 1.88
1,242,733 3.17
Tech Hardware, Storage & PeripheralsSeiko Epson Corp. JPY 488,100 797,067 2.04
797,067 2.04
Textiles, Apparel & Luxury GoodsSeiko Holdings Corp. JPY 2,069,000 633,114 1.62
633,114 1.62
Trading Companies & DistributorsHanwa Co. Ltd. JPY 698,000 369,940 0.94ITOCHU Corp. JPY 1,952,700 2,420,372 6.18Mitsubishi Corp. JPY 262,700 469,708 1.20Mitsui & Co. Ltd. JPY 591,300 717,542 1.83Nippon Steel & Sumikin Bussan Corp. JPY 994,000 327,026 0.84
4,304,588 10.99
Total Equities 38,604,486 98.61
Total Transferable securities and money market instruments admitted to official exchange listing or dealt in on another regulated market 38,604,486 98.61
Total Investments 38,604,486 98.61
Cash 480,760 1.23
Other Assets/(Liabilities) 64,295 0.16
Total Net Assets 39,149,541 100.00
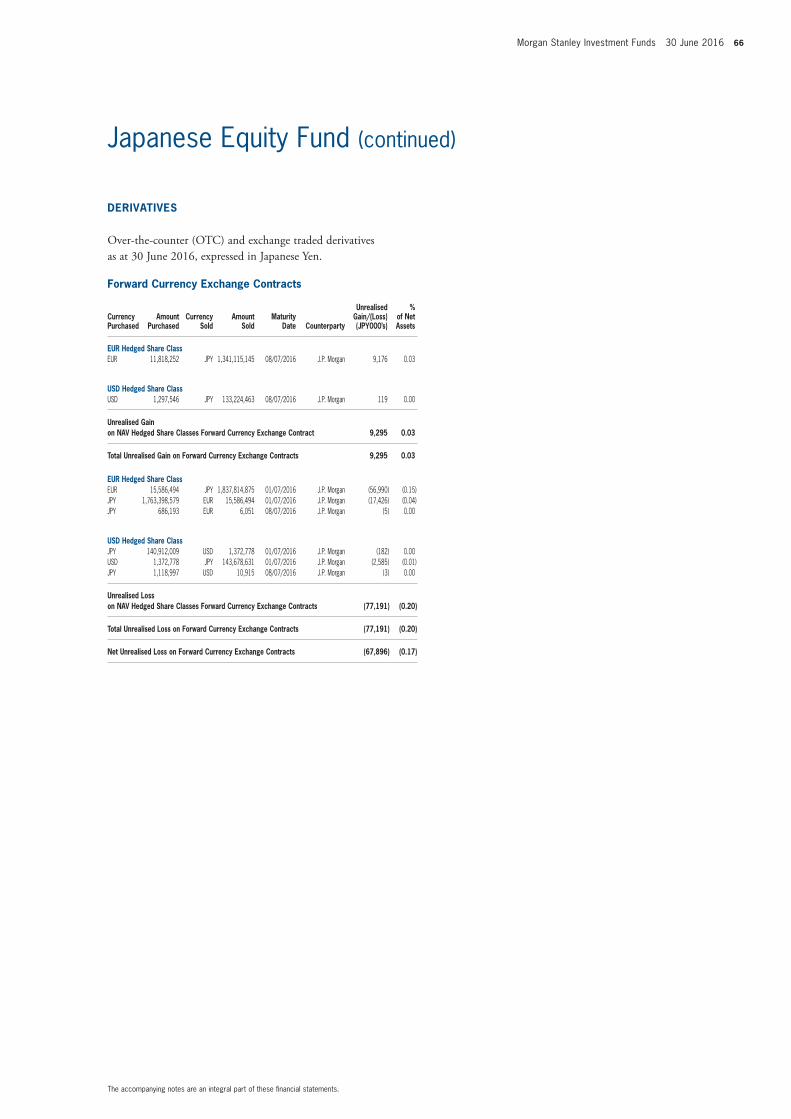
Morgan Stanley Investment Funds 30 June 2016 66
The accompanying notes are an integral part of these financial statements.
Japanese Equity Fund (continued)
DERIVATIVES
Over-the-counter (OTC) and exchange traded derivatives as at 30 June 2016, expressed in Japanese Yen.
Forward Currency Exchange Contracts
Currency Purchased
Amount Purchased
Currency Sold
Amount Sold
Maturity Date Counterparty
Unrealised Gain/(Loss) (JPY000’s)
% of Net Assets
EUR Hedged Share ClassEUR 11,818,252 JPY 1,341,115,145 08/07/2016 J.P. Morgan 9,176 0.03
USD Hedged Share ClassUSD 1,297,546 JPY 133,224,463 08/07/2016 J.P. Morgan 119 0.00
Unrealised Gain on NAV Hedged Share Classes Forward Currency Exchange Contract 9,295 0.03
Total Unrealised Gain on Forward Currency Exchange Contracts 9,295 0.03
EUR Hedged Share ClassEUR 15,586,494 JPY 1,837,814,875 01/07/2016 J.P. Morgan (56,990) (0.15)JPY 1,763,398,579 EUR 15,586,494 01/07/2016 J.P. Morgan (17,426) (0.04)JPY 686,193 EUR 6,051 08/07/2016 J.P. Morgan (5) 0.00
USD Hedged Share ClassJPY 140,912,009 USD 1,372,778 01/07/2016 J.P. Morgan (182) 0.00USD 1,372,778 JPY 143,678,631 01/07/2016 J.P. Morgan (2,585) (0.01)JPY 1,118,997 USD 10,915 08/07/2016 J.P. Morgan (3) 0.00
Unrealised Loss on NAV Hedged Share Classes Forward Currency Exchange Contracts (77,191) (0.20)
Total Unrealised Loss on Forward Currency Exchange Contracts (77,191) (0.20)
Net Unrealised Loss on Forward Currency Exchange Contracts (67,896) (0.17)

67 Morgan Stanley Investment Funds 30 June 2016
The accompanying notes are an integral part of these financial statements.
Please refer to the full prospectus for the Fund’s investment objective and policy.
INVESTMENT AIM
To seek to maximise total return, measured in US dollars, through investment primarily in the common shares of companies incorporated in Latin American countries.
SCHEDULE OF INVESTMENTSAs at 30 June 2016
Investments Currency
Quantity/Nominal
Value
Market Value USD
% of Net Assets
Transferable securities and money market instruments admitted to official exchange listing or dealt in on another regulated market
Equities
ArgentinaBBVA Banco Frances SA, ADR USD 269,800 5,646,914 1.48Pampa Energia SA, ADR USD 78,411 2,119,449 0.56
7,766,363 2.04
BrazilAmbev SA, ADR USD 151,642 890,138 0.23Ambev SA BRL 2,718,661 15,974,694 4.20Banco Bradesco SA Preference BRL 3,342,718 25,855,737 6.79BRF SA BRL 1,218,484 16,755,388 4.40Grupo BTG Pactual BRL 426,781 2,368,200 0.62Iochpe Maxion SA BRL 630,479 2,675,914 0.70Itau Unibanco Holding SA Preference BRL 3,837,551 35,395,236 9.30Lojas Americanas SA Preference BRL 900,055 4,447,865 1.17Lojas Renner SA BRL 1,481,181 10,718,891 2.82MercadoLibre, Inc.
(United States of America) (2) USD 48,826 6,782,420 1.78Multiplan Empreendimentos Imobiliarios SA BRL 280,216 5,250,232 1.38Petroleo Brasileiro SA BRL 386,892 1,360,158 0.36Petroleo Brasileiro SA Preference BRL 1,747,635 5,050,150 1.33Qualicorp SA BRL 1,030,406 5,865,299 1.54Raia Drogasil SA BRL 902,595 17,442,563 4.58Telefonica Brasil SA Preference BRL 603,500 8,129,604 2.14Ultrapar Participacoes SA BRL 684,747 14,904,346 3.92Vale SA BRL 345,053 1,704,098 0.45Vale SA Preference BRL 518,693 2,085,174 0.55
183,656,107 48.26
ChileEnersis Americas SA CLP 27,362,666 4,657,923 1.22Enersis Chile SA CLP 29,550,569 3,431,196 0.90Parque Arauco SA CLP 3,449,694 6,980,519 1.84SACI Falabella CLP 1,789,518 13,636,275 3.58
28,705,913 7.54
ColombiaCementos Argos SA COP 839,135 3,366,856 0.89Cemex Latam Holdings SA (Spain) (2) COP 749,413 3,244,855 0.85Grupo de Inversiones Suramericana SA COP 399,820 5,196,226 1.37Grupo de Inversiones Suramericana SA
Preference COP 176,728 2,250,966 0.59
14,058,903 3.70
MexicoAlfa SAB de CV ‘A’ MXN 6,770,491 11,155,954 2.93Alsea SAB de CV (1) MXN 1,892,667 7,158,599 1.88Cemex SAB de CV, ADR USD 2,460,847 14,592,823 3.84Concentradora Fibra Hotelera Mexicana SA
de CV, REIT (1) MXN 3,340,657 2,552,122 0.67Fomento Economico Mexicano SAB de CV,
ADR USD 329,630 30,203,997 7.94Grupo Financiero Banorte SAB de CV ‘O’ MXN 4,592,019 24,783,544 6.51Grupo Financiero Santander Mexico SAB
de CV, ADR USD 405,489 3,612,907 0.95Kimberly-Clark de Mexico SAB de CV ‘A’ (1) MXN 2,010,223 4,744,424 1.25Mexichem SAB de CV MXN 3,290,589 6,775,290 1.78Promotora y Operadora de Infraestructura
SAB de CV MXN 556,949 6,673,108 1.75
112,252,768 29.50
Latin American Equity Fund

Morgan Stanley Investment Funds 30 June 2016 68
The accompanying notes are an integral part of these financial statements.
Latin American Equity Fund (continued)
SCHEDULE OF INVESTMENTSAs at 30 June 2016
Investments Currency
Quantity/Nominal
Value
Market Value USD
% of Net Assets
Transferable securities and money market instruments admitted to official exchange listing or dealt in on another regulated market
Equities (continued)
PanamaCopa Holdings SA ‘A’ USD 89,342 4,587,712 1.21
4,587,712 1.21
PeruCredicorp Ltd. (Bermuda) (2) USD 124,948 19,308,215 5.07
19,308,215 5.07
Total Equities 370,335,981 97.32
Total Transferable securities and money market instruments admitted to official exchange listing or dealt in on another regulated market 370,335,981 97.32
Other transferable securities and money market instruments not admitted to official exchange listing or dealt in on another regulated market
Equities
BrazilBanco Nacional SA Preference (3) BRL 2,698,000 0 0.00Lojas Arapua SA Preference (3) BRL 58,205,100 0 0.00
0 0.00
Total Equities 0 0.00
Total Other transferable securities and money market instruments not admitted to official exchange listing or dealt in on another regulated market 0 0.00
SCHEDULE OF INVESTMENTSAs at 30 June 2016
Investments Currency
Quantity/Nominal
Value
Market Value USD
% of Net Assets
Units of authorised UCITS or other collective investment undertakings
Collective Investment Schemes – UCITS
LuxembourgMorgan Stanley Liquidity Funds US Dollar
Liquidity Fund – MS Reserve (4) USD 6,255,766 6,255,766 1.64
6,255,766 1.64
Total Collective Investment Schemes – UCITS 6,255,766 1.64
Total Units of authorised UCITS or other collective investment undertakings 6,255,766 1.64
Total Investments 376,591,747 98.96
Cash 695,222 0.18
Other Assets/(Liabilities) 3,258,534 0.86
Total Net Assets 380,545,503 100.00
(1) All or part of this position is out on loan.(2) The country in brackets represents the country of incorporation of this security.(3) Security is valued at its fair value under the direction of the Board of Directors of the SICAV.(4) Affiliate managed by an affiliate of the Investment Adviser.

69 Morgan Stanley Investment Funds 30 June 2016
The accompanying notes are an integral part of these financial statements.
Please refer to the full prospectus for the Fund’s investment objective and policy.
SCHEDULE OF INVESTMENTSAs at 30 June 2016
Investments Currency
Quantity/Nominal
Value
Market Value USD
% of Net Assets
Transferable securities and money market instruments admitted to official exchange listing or dealt in on another regulated market
Equities
Aerospace & DefenseUnited Technologies Corp. USD 1,850,060 187,207,571 4.49
187,207,571 4.49
BeveragesMonster Beverage Corp. USD 308,204 48,714,724 1.17
48,714,724 1.17
ChemicalsSherwin-Williams Co. (The) USD 151,420 43,902,715 1.05
43,902,715 1.05
Diversified Financial ServicesBerkshire Hathaway, Inc. ‘B’ USD 1,142,561 162,586,430 3.90S&P Global, Inc. USD 1,927,024 202,491,682 4.86
365,078,112 8.76
Food ProductsHershey Co. (The) USD 479,259 47,072,819 1.13Kraft Heinz Co. (The) USD 1,306,272 112,992,528 2.71Mead Johnson Nutrition Co. USD 2,384,595 210,202,049 5.05Mondelez International, Inc. ‘A’ USD 2,248,764 97,011,679 2.33Nestle SA, ADR (Switzerland) (2) USD 1,350,315 103,779,810 2.49
571,058,885 13.71
Hotels, Restaurants & LeisureMarriott International, Inc. ‘A’ (1) USD 1,468,593 95,796,322 2.30Starbucks Corp. USD 723,710 41,041,594 0.99
136,837,916 3.29
Industrial Conglomerates3M Co. USD 770,331 132,866,691 3.19Danaher Corp. USD 469,141 47,040,768 1.13
179,907,459 4.32
Internet & Catalog RetailAmazon.com, Inc. USD 564,416 402,581,000 9.67
402,581,000 9.67
Internet Software & ServicesAlphabet, Inc. ‘C’ USD 304,611 208,701,181 5.01Facebook, Inc. ‘A’ USD 3,314,351 378,664,602 9.09LinkedIn Corp. ‘A’ USD 656,036 124,325,382 2.99Twitter, Inc. USD 5,511,258 92,506,465 2.22
804,197,630 19.31
IT ServicesMasterCard, Inc. ‘A’ USD 1,936,832 178,033,598 4.27Visa, Inc. ‘A’ USD 1,602,318 122,673,466 2.95
300,707,064 7.22
INVESTMENT AIM
To seek long-term capital appreciation, measured in US dollars, by investing primarily in securities issued by US companies and on ancillary basis in securities issued by companies that are not from the US.
US Advantage Fund
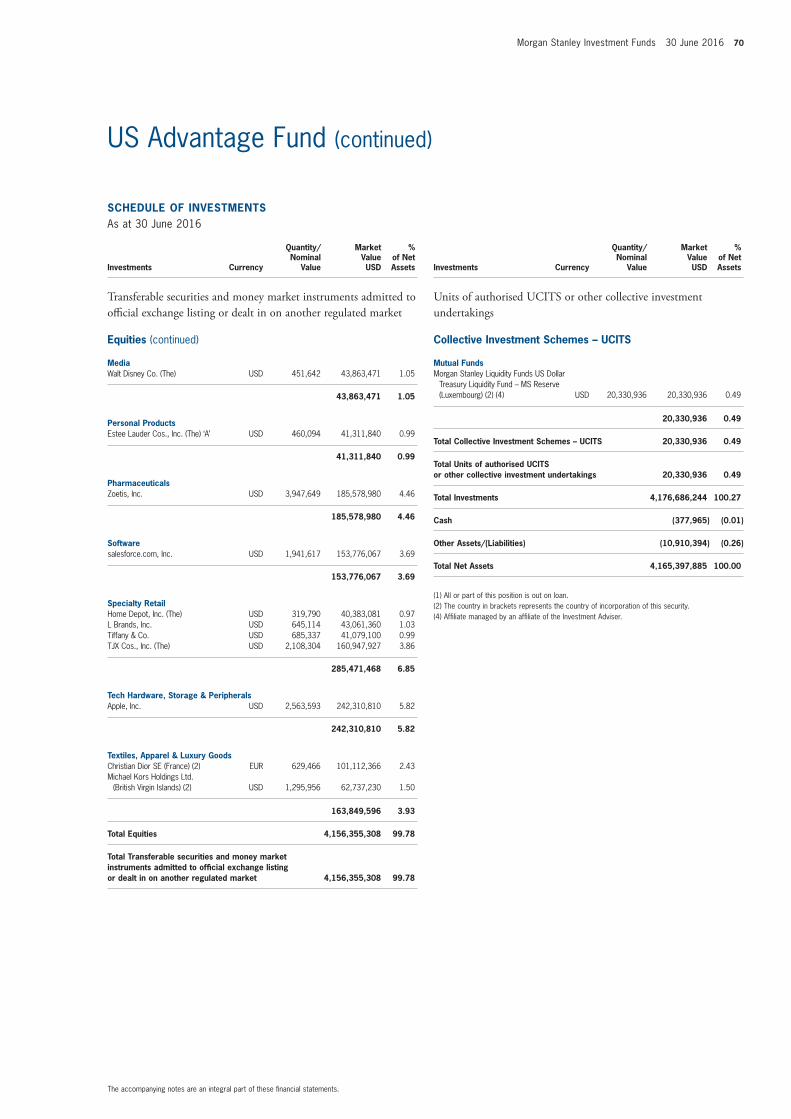
Morgan Stanley Investment Funds 30 June 2016 70
The accompanying notes are an integral part of these financial statements.
US Advantage Fund (continued)
SCHEDULE OF INVESTMENTSAs at 30 June 2016
Investments Currency
Quantity/Nominal
Value
Market Value USD
% of Net Assets
Transferable securities and money market instruments admitted to official exchange listing or dealt in on another regulated market
Equities (continued)
MediaWalt Disney Co. (The) USD 451,642 43,863,471 1.05
43,863,471 1.05
Personal ProductsEstee Lauder Cos., Inc. (The) ‘A’ USD 460,094 41,311,840 0.99
41,311,840 0.99
PharmaceuticalsZoetis, Inc. USD 3,947,649 185,578,980 4.46
185,578,980 4.46
Softwaresalesforce.com, Inc. USD 1,941,617 153,776,067 3.69
153,776,067 3.69
Specialty RetailHome Depot, Inc. (The) USD 319,790 40,383,081 0.97L Brands, Inc. USD 645,114 43,061,360 1.03Tiffany & Co. USD 685,337 41,079,100 0.99TJX Cos., Inc. (The) USD 2,108,304 160,947,927 3.86
285,471,468 6.85
Tech Hardware, Storage & PeripheralsApple, Inc. USD 2,563,593 242,310,810 5.82
242,310,810 5.82
Textiles, Apparel & Luxury GoodsChristian Dior SE (France) (2) EUR 629,466 101,112,366 2.43Michael Kors Holdings Ltd.
(British Virgin Islands) (2) USD 1,295,956 62,737,230 1.50
163,849,596 3.93
Total Equities 4,156,355,308 99.78
Total Transferable securities and money market instruments admitted to official exchange listing or dealt in on another regulated market 4,156,355,308 99.78
SCHEDULE OF INVESTMENTSAs at 30 June 2016
Investments Currency
Quantity/Nominal
Value
Market Value USD
% of Net Assets
Units of authorised UCITS or other collective investment undertakings
Collective Investment Schemes – UCITS
Mutual FundsMorgan Stanley Liquidity Funds US Dollar
Treasury Liquidity Fund – MS Reserve (Luxembourg) (2) (4) USD 20,330,936 20,330,936 0.49
20,330,936 0.49
Total Collective Investment Schemes – UCITS 20,330,936 0.49
Total Units of authorised UCITS or other collective investment undertakings 20,330,936 0.49
Total Investments 4,176,686,244 100.27
Cash (377,965) (0.01)
Other Assets/(Liabilities) (10,910,394) (0.26)
Total Net Assets 4,165,397,885 100.00
(1) All or part of this position is out on loan. (2) The country in brackets represents the country of incorporation of this security. (4) Affiliate managed by an affiliate of the Investment Adviser.
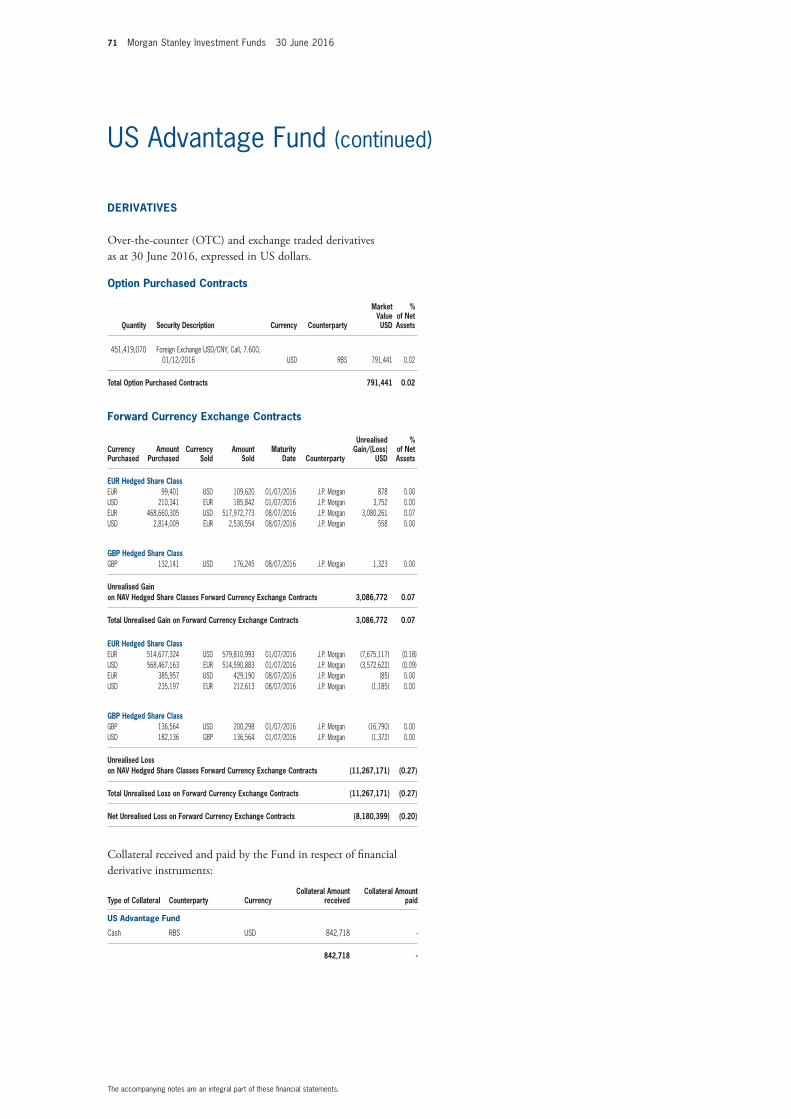
71 Morgan Stanley Investment Funds 30 June 2016
The accompanying notes are an integral part of these financial statements.
US Advantage Fund (continued)
DERIVATIVES
Over-the-counter (OTC) and exchange traded derivatives as at 30 June 2016, expressed in US dollars.
Option Purchased Contracts
Quantity Security Description Currency Counterparty
Market Value USD
% of Net Assets
451,419,070 Foreign Exchange USD/CNY, Call, 7.600, 01/12/2016 USD RBS 791,441 0.02
Total Option Purchased Contracts 791,441 0.02
Forward Currency Exchange Contracts
Currency Purchased
Amount Purchased
Currency Sold
Amount Sold
Maturity Date Counterparty
Unrealised Gain/(Loss)
USD
% of Net Assets
EUR Hedged Share ClassEUR 99,401 USD 109,620 01/07/2016 J.P. Morgan 878 0.00USD 210,341 EUR 185,842 01/07/2016 J.P. Morgan 3,752 0.00EUR 468,660,305 USD 517,972,773 08/07/2016 J.P. Morgan 3,080,261 0.07USD 2,814,009 EUR 2,530,554 08/07/2016 J.P. Morgan 558 0.00
GBP Hedged Share ClassGBP 132,141 USD 176,245 08/07/2016 J.P. Morgan 1,323 0.00
Unrealised Gain on NAV Hedged Share Classes Forward Currency Exchange Contracts 3,086,772 0.07
Total Unrealised Gain on Forward Currency Exchange Contracts 3,086,772 0.07
EUR Hedged Share ClassEUR 514,677,324 USD 579,810,993 01/07/2016 J.P. Morgan (7,675,117) (0.18)USD 568,467,163 EUR 514,590,883 01/07/2016 J.P. Morgan (3,572,622) (0.09)EUR 385,957 USD 429,190 08/07/2016 J.P. Morgan (85) 0.00USD 235,197 EUR 212,613 08/07/2016 J.P. Morgan (1,185) 0.00
GBP Hedged Share ClassGBP 136,564 USD 200,298 01/07/2016 J.P. Morgan (16,790) 0.00USD 182,136 GBP 136,564 01/07/2016 J.P. Morgan (1,372) 0.00
Unrealised Loss on NAV Hedged Share Classes Forward Currency Exchange Contracts (11,267,171) (0.27)
Total Unrealised Loss on Forward Currency Exchange Contracts (11,267,171) (0.27)
Net Unrealised Loss on Forward Currency Exchange Contracts (8,180,399) (0.20)
Collateral received and paid by the Fund in respect of financial derivative instruments:
Type of Collateral Counterparty CurrencyCollateral Amount
receivedCollateral Amount
paid
US Advantage Fund
Cash RBS USD 842,718 -
842,718 -

Morgan Stanley Investment Funds 30 June 2016 72
The accompanying notes are an integral part of these financial statements.
Please refer to the full prospectus for the Fund’s investment objective and policy.
INVESTMENT AIM
To seek long-term capital appreciation, measured in US dollars, by investing primarily in securities issued by US companies and on ancillary basis in securities issued by companies that are not from the US.
SCHEDULE OF INVESTMENTSAs at 30 June 2016
Investments Currency
Quantity/Nominal
Value
Market Value USD
% of Net Assets
Transferable securities and money market instruments admitted to official exchange listing or dealt in on another regulated market
Equities
Aerospace & DefenseUnited Technologies Corp. USD 219,164 22,177,205 1.70
22,177,205 1.70
AutomobilesTesla Motors, Inc. (1) USD 297,140 62,506,371 4.79
62,506,371 4.79
BeveragesMonster Beverage Corp. USD 108,383 17,131,017 1.31
17,131,017 1.31
BiotechnologyAlnylam Pharmaceuticals, Inc. USD 79,006 4,361,921 0.33Illumina, Inc. USD 478,489 65,663,045 5.03Intrexon Corp. USD 190,005 4,579,121 0.35Juno Therapeutics, Inc. USD 97,750 3,771,195 0.29
78,375,282 6.00
Consumer LendingMasterCard, Inc. ‘A’ USD 664,074 61,041,682 4.68Visa, Inc. ‘A’ USD 553,180 42,351,461 3.24
103,393,143 7.92
Diversified Financial ServicesS&P Global, Inc. USD 622,071 65,367,221 5.01
65,367,221 5.01
Food ProductsMead Johnson Nutrition Co. USD 579,045 51,042,817 3.91
51,042,817 3.91
Health CareAthenahealth, Inc. USD 166,400 22,587,136 1.73
22,587,136 1.73
Internet & Catalog RetailAmazon.com, Inc. USD 176,320 125,763,766 9.64JD.com, Inc., ADR (Cayman Islands) (2) USD 590,516 12,052,432 0.92Netflix, Inc. USD 370,742 33,385,317 2.56Priceline Group, Inc. (The) USD 26,333 33,021,845 2.53
204,223,360 15.65
Internet Software & ServicesTencent Holdings Ltd. (Cayman Islands) (2) HKD 781,300 17,732,788 1.36Alphabet, Inc. ‘C’ USD 100,176 68,634,585 5.26Facebook, Inc. ‘A’ USD 1,072,059 122,482,741 9.38LinkedIn Corp. ‘A’ USD 208,343 39,483,082 3.03Twitter, Inc. USD 1,984,216 33,305,065 2.55Workday, Inc. ‘A’ USD 659,511 48,401,512 3.71
330,039,773 25.29
US Growth Fund

73 Morgan Stanley Investment Funds 30 June 2016
The accompanying notes are an integral part of these financial statements.
US Growth Fund (continued)
SCHEDULE OF INVESTMENTSAs at 30 June 2016
Investments Currency
Quantity/Nominal
Value
Market Value USD
% of Net Assets
Transferable securities and money market instruments admitted to official exchange listing or dealt in on another regulated market
Equities (continued)
Medical EquipmentIntuitive Surgical, Inc. USD 103,932 68,413,239 5.24
68,413,239 5.24
PharmaceuticalsZoetis, Inc. USD 995,527 46,799,724 3.58
46,799,724 3.58
Semiconductors & Semiconductor EquipmentNVIDIA Corp. USD 204,062 9,523,574 0.73
9,523,574 0.73
SoftwareMobileye NV (Netherlands) (2) USD 197,354 9,186,828 0.70salesforce.com, Inc. USD 932,074 73,820,261 5.66Splunk, Inc. USD 390,094 21,146,996 1.62
104,154,085 7.98
Tech Hardware, Storage & PeripheralsApple, Inc. USD 913,281 86,323,320 6.61
86,323,320 6.61
Textiles, Apparel & Luxury GoodsMichael Kors Holdings Ltd.
(British Virgin Islands) (2) USD 428,385 20,738,118 1.59
20,738,118 1.59
Total Equities 1,292,795,385 99.04
Total Transferable securities and money market instruments admitted to official exchange listing or dealt in on another regulated market 1,292,795,385 99.04
SCHEDULE OF INVESTMENTSAs at 30 June 2016
Investments Currency
Quantity/Nominal
Value
Market Value USD
% of Net Assets
Units of authorised UCITS or other collective investment undertakings
Collective Investment Schemes – UCITS
Mutual FundsMorgan Stanley Liquidity Funds US Dollar
Treasury Liquidity Fund – MS Reserve (Luxembourg) (2) (4) USD 11,906,688 11,906,688 0.91
11,906,688 0.91
Total Collective Investment Schemes – UCITS 11,906,688 0.91
Total Units of authorised UCITS or other collective investment undertakings 11,906,688 0.91
Total Investments 1,304,702,073 99.95
Cash (322,490) (0.02)
Other Assets/(Liabilities) 889,983 0.07
Total Net Assets 1,305,269,566 100.00
(1) All or part of this position is out on loan.(2) The country in brackets represents the country of incorporation of this security.(4) Affiliate managed by an affiliate of the Investment Adviser.
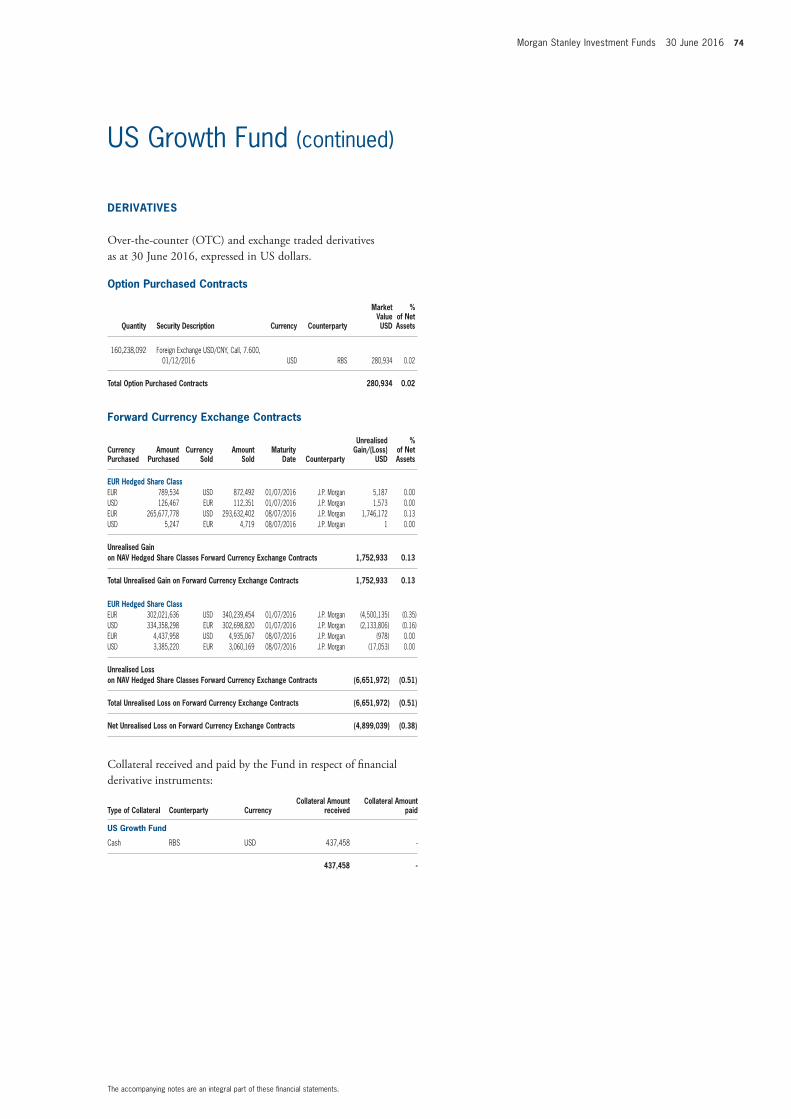
Morgan Stanley Investment Funds 30 June 2016 74
The accompanying notes are an integral part of these financial statements.
US Growth Fund (continued)
DERIVATIVES
Over-the-counter (OTC) and exchange traded derivatives as at 30 June 2016, expressed in US dollars.
Option Purchased Contracts
Quantity Security Description Currency Counterparty
Market Value USD
% of Net Assets
160,238,092 Foreign Exchange USD/CNY, Call, 7.600, 01/12/2016 USD RBS 280,934 0.02
Total Option Purchased Contracts 280,934 0.02
Forward Currency Exchange Contracts
Currency Purchased
Amount Purchased
Currency Sold
Amount Sold
Maturity Date Counterparty
Unrealised Gain/(Loss)
USD
% of Net Assets
EUR Hedged Share ClassEUR 789,534 USD 872,492 01/07/2016 J.P. Morgan 5,187 0.00USD 126,467 EUR 112,351 01/07/2016 J.P. Morgan 1,573 0.00EUR 265,677,778 USD 293,632,402 08/07/2016 J.P. Morgan 1,746,172 0.13USD 5,247 EUR 4,719 08/07/2016 J.P. Morgan 1 0.00
Unrealised Gain on NAV Hedged Share Classes Forward Currency Exchange Contracts 1,752,933 0.13
Total Unrealised Gain on Forward Currency Exchange Contracts 1,752,933 0.13
EUR Hedged Share ClassEUR 302,021,636 USD 340,239,454 01/07/2016 J.P. Morgan (4,500,135) (0.35)USD 334,358,298 EUR 302,698,820 01/07/2016 J.P. Morgan (2,133,806) (0.16)EUR 4,437,958 USD 4,935,067 08/07/2016 J.P. Morgan (978) 0.00USD 3,385,220 EUR 3,060,169 08/07/2016 J.P. Morgan (17,053) 0.00
Unrealised Loss on NAV Hedged Share Classes Forward Currency Exchange Contracts (6,651,972) (0.51)
Total Unrealised Loss on Forward Currency Exchange Contracts (6,651,972) (0.51)
Net Unrealised Loss on Forward Currency Exchange Contracts (4,899,039) (0.38)
Collateral received and paid by the Fund in respect of financial derivative instruments:
Type of Collateral Counterparty CurrencyCollateral Amount
receivedCollateral Amount
paid
US Growth Fund
Cash RBS USD 437,458 -
437,458 -

75 Morgan Stanley Investment Funds 30 June 2016
The accompanying notes are an integral part of these financial statements.
Please refer to the full prospectus for the Fund’s investment objective and policy.
INVESTMENT AIM
To invest primarily in equity securities of well-established and emerging companies based in or carrying out most of their business in the United States of America and with market capitalizations within the range of companies included in the Russell 3000® Value Index.
SCHEDULE OF INVESTMENTSAs at 30 June 2016
Investments Currency
Quantity/Nominal
Value
Market Value USD
% of Net Assets
Transferable securities and money market instruments admitted to official exchange listing or dealt in on another regulated market
Equities
Aerospace & DefenseBWX Technologies, Inc. USD 11,347 401,797 5.99United Technologies Corp. USD 4,735 479,135 7.15
880,932 13.14
Auto ComponentsFox Factory Holding Corp. USD 4,152 71,497 1.07
71,497 1.07
AutomobilesHarley-Davidson, Inc. USD 7,200 317,016 4.73
317,016 4.73
ChemicalsMosaic Co. (The) USD 7,365 186,997 2.79
186,997 2.79
Commercial Services & SuppliesCopart, Inc. USD 3,457 166,178 2.48
166,178 2.48
Diversified Financial ServicesBerkshire Hathaway, Inc. ‘B’ USD 970 138,031 2.06Leucadia National Corp. USD 10,422 173,318 2.58
311,349 4.64
Health Care Equipment & SuppliesIntuitive Surgical, Inc. USD 504 331,758 4.95
331,758 4.95
Health Care TechnologyCastlight Health, Inc. ‘B’ USD 3,336 12,944 0.19
12,944 0.19
Hotels, Restaurants & LeisureBojangles’, Inc. USD 2,712 45,344 0.68El Pollo Loco Holdings, Inc. USD 4,134 52,171 0.78Fiesta Restaurant Group, Inc. USD 1,598 34,533 0.51Habit Restaurants, Inc. (The) ‘A’ USD 1,276 20,799 0.31Papa Murphy’s Holdings, Inc. USD 1,918 12,697 0.19
165,544 2.47
Household DurablesGarmin Ltd. (Switzerland) (2) USD 6,572 271,358 4.05
271,358 4.05
US Insight Fund

Morgan Stanley Investment Funds 30 June 2016 76
The accompanying notes are an integral part of these financial statements.
US Insight Fund (continued)
SCHEDULE OF INVESTMENTSAs at 30 June 2016
Investments Currency
Quantity/Nominal
Value
Market Value USD
% of Net Assets
Transferable securities and money market instruments admitted to official exchange listing or dealt in on another regulated market
Equities (continued)
Industrial ConglomeratesKoninklijke Philips NV, NYRS
(Netherlands) (2) USD 10,619 262,183 3.91
262,183 3.91
InsuranceProgressive Corp. (The) USD 8,084 265,842 3.97RenaissanceRe Holdings Ltd. (Bermuda) (2) USD 2,377 274,900 4.10
540,742 8.07
Internet Software & ServiceseBay, Inc. USD 12,928 301,481 4.50GrubHub, Inc. USD 2,404 75,413 1.12Twitter, Inc. USD 2,279 38,253 0.57
415,147 6.19
IT ServicesPayPal Holdings, Inc. USD 7,504 267,743 3.99
267,743 3.99
Leisure ProductsVista Outdoor, Inc. USD 1,427 67,683 1.01
67,683 1.01
MachineryAllison Transmission Holdings, Inc. USD 4,729 132,507 1.98Joy Global, Inc. USD 16,996 346,038 5.16Manitowoc Co., Inc. (The) USD 7,931 40,448 0.60Manitowoc Foodservice, Inc. USD 23,796 399,773 5.96Terex Corp. USD 14,029 275,109 4.11
1,193,875 17.81
MediaNews Corp. ‘A’ USD 7,889 89,146 1.33Time Warner, Inc. USD 3,872 280,371 4.18
369,517 5.51
Metals & MiningDominion Diamond Corp. (Canada) (2) USD 6,289 53,331 0.80
53,331 0.80
Specialty RetailContainer Store Group, Inc. (The) USD 1,822 9,657 0.14
9,657 0.14
Trading Companies & DistributorsFastenal Co. USD 5,756 251,307 3.75
251,307 3.75
SCHEDULE OF INVESTMENTSAs at 30 June 2016
Investments Currency
Quantity/Nominal
Value
Market Value USD
% of Net Assets
Transferable securities and money market instruments admitted to official exchange listing or dealt in on another regulated market
Equities (continued)
TransportationBBA Aviation plc (United Kingdom) (2) GBP 66,156 196,552 2.93
196,552 2.93
Total Equities 6,343,310 94.62
Total Transferable securities and money market instruments admitted to official exchange listing or dealt in on another regulated market 6,343,310 94.62
Units of authorised UCITS or other collective investment undertakings
Collective Investment Schemes – UCITS
Mutual FundsMorgan Stanley Liquidity Funds US Dollar
Treasury Liquidity Fund – MS Reserve (Luxembourg) (2) (4) USD 200,227 200,227 2.99
200,227 2.99
Total Collective Investment Schemes – UCITS 200,227 2.99
Total Units of authorised UCITS or other collective investment undertakings 200,227 2.99
Total Investments 6,543,537 97.61
Cash 165,991 2.47
Other Assets/(Liabilities) (5,738) (0.08)
Total Net Assets 6,703,790 100.00
(2) The country in brackets represents the country of incorporation of this security.(4) Affiliate managed by an affiliate of the Investment Adviser.

77 Morgan Stanley Investment Funds 30 June 2016
The accompanying notes are an integral part of these financial statements.
Please refer to the full prospectus for the Fund’s investment objective and policy.
INVESTMENT AIM
To seek to provide long-term capital appreciation, measured in US dollars, by investing in equity securities of companies in the US real estate industry.
SCHEDULE OF INVESTMENTSAs at 30 June 2016
Investments Currency
Quantity/Nominal
Value
Market Value USD
% of Net Assets
Transferable securities and money market instruments admitted to official exchange listing or dealt in on another regulated market
Equities
ApartmentsApartment Investment & Management Co.,
REIT ‘A’ USD 142,390 6,154,096 1.48AvalonBay Communities, Inc., REIT USD 109,255 19,365,449 4.66Camden Property Trust, REIT USD 165,795 14,397,638 3.46Equity Residential, REIT USD 440,964 29,932,636 7.20Essex Property Trust, Inc., REIT USD 30,661 6,846,601 1.65Mid-America Apartment Communities,
Inc., REIT USD 2,445 256,285 0.06
76,952,705 18.51
Data CentersQTS Realty Trust, Inc., REIT ‘A’ USD 33,459 1,849,279 0.44
1,849,279 0.44
DiversifiedLexington Realty Trust, REIT USD 2,230 22,055 0.00Vornado Realty Trust, REIT USD 311,771 30,809,210 7.41
30,831,265 7.41
Free StandingNational Retail Properties, Inc., REIT USD 146,020 7,477,684 1.80Realty Income Corp., REIT USD 39,390 2,695,064 0.65Spirit Realty Capital, Inc., REIT USD 43,550 547,423 0.13STORE Capital Corp., REIT USD 154,976 4,449,361 1.07
15,169,532 3.65
Health CareHCP, Inc., REIT USD 61,890 2,161,199 0.52Healthcare Realty Trust, Inc., REIT USD 72,860 2,480,154 0.60Omega Healthcare Investors, Inc., REIT USD 69,479 2,312,956 0.56Senior Housing Properties Trust, REIT USD 171,139 3,600,765 0.87Ventas, Inc., REIT USD 212,402 15,278,076 3.67Welltower, Inc., REIT USD 94,850 7,125,132 1.71
32,958,282 7.93
IndustrialDCT Industrial Trust, Inc., REIT USD 19,835 934,030 0.22Prologis, Inc., REIT USD 146,327 7,092,470 1.71Rexford Industrial Realty, Inc., REIT USD 115,007 2,413,997 0.58
10,440,497 2.51
Lodging/ResortsChesapeake Lodging Trust, REIT USD 188,728 4,389,813 1.06Hilton Worldwide Holdings, Inc. USD 324,990 7,260,277 1.75Host Hotels & Resorts, Inc., REIT USD 1,174,535 18,651,616 4.49LaSalle Hotel Properties, REIT USD 301,111 6,964,697 1.67Sunstone Hotel Investors, Inc., REIT USD 20,380 242,013 0.06Xenia Hotels & Resorts, Inc., REIT USD 91,842 1,519,985 0.36
39,028,401 9.39
Manufactured HomesEquity LifeStyle Properties, Inc., REIT USD 18,324 1,449,795 0.35
1,449,795 0.35
US Property Fund
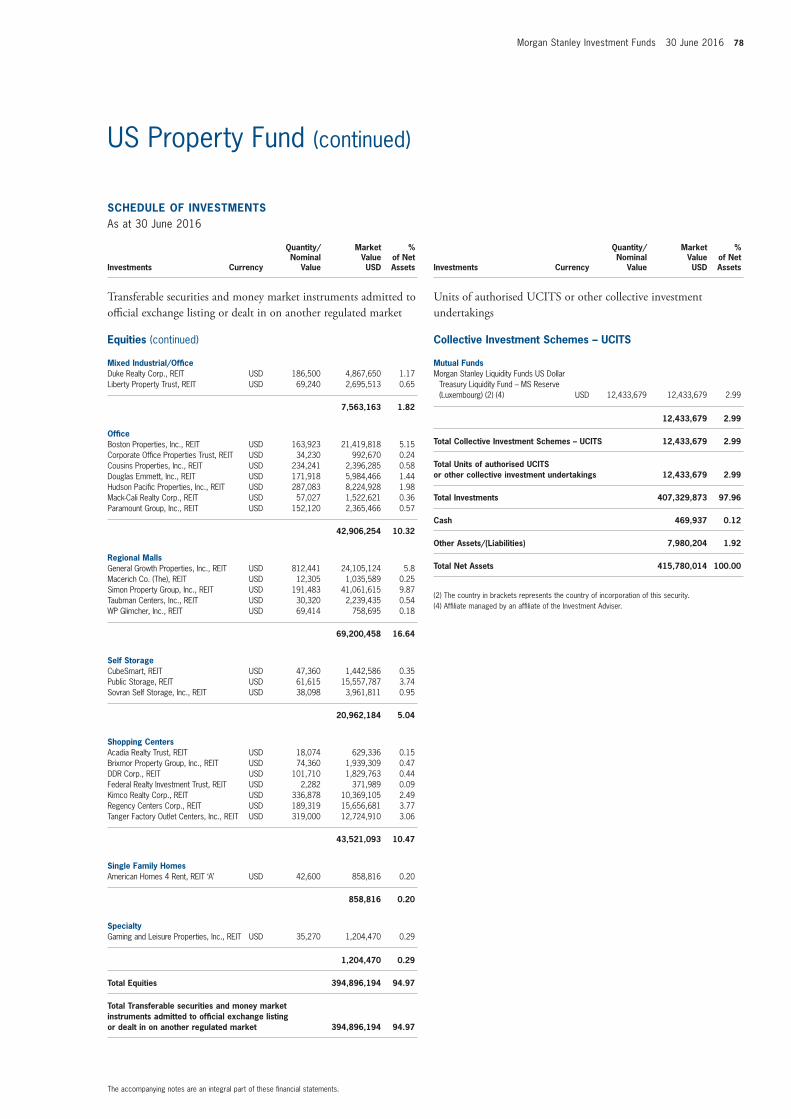
Morgan Stanley Investment Funds 30 June 2016 78
The accompanying notes are an integral part of these financial statements.
US Property Fund (continued)
SCHEDULE OF INVESTMENTSAs at 30 June 2016
Investments Currency
Quantity/Nominal
Value
Market Value USD
% of Net Assets
Transferable securities and money market instruments admitted to official exchange listing or dealt in on another regulated market
Equities (continued)
Mixed Industrial/OfficeDuke Realty Corp., REIT USD 186,500 4,867,650 1.17Liberty Property Trust, REIT USD 69,240 2,695,513 0.65
7,563,163 1.82
OfficeBoston Properties, Inc., REIT USD 163,923 21,419,818 5.15Corporate Office Properties Trust, REIT USD 34,230 992,670 0.24Cousins Properties, Inc., REIT USD 234,241 2,396,285 0.58Douglas Emmett, Inc., REIT USD 171,918 5,984,466 1.44Hudson Pacific Properties, Inc., REIT USD 287,083 8,224,928 1.98Mack-Cali Realty Corp., REIT USD 57,027 1,522,621 0.36Paramount Group, Inc., REIT USD 152,120 2,365,466 0.57
42,906,254 10.32
Regional MallsGeneral Growth Properties, Inc., REIT USD 812,441 24,105,124 5.8Macerich Co. (The), REIT USD 12,305 1,035,589 0.25Simon Property Group, Inc., REIT USD 191,483 41,061,615 9.87Taubman Centers, Inc., REIT USD 30,320 2,239,435 0.54WP Glimcher, Inc., REIT USD 69,414 758,695 0.18
69,200,458 16.64
Self StorageCubeSmart, REIT USD 47,360 1,442,586 0.35Public Storage, REIT USD 61,615 15,557,787 3.74Sovran Self Storage, Inc., REIT USD 38,098 3,961,811 0.95
20,962,184 5.04
Shopping CentersAcadia Realty Trust, REIT USD 18,074 629,336 0.15Brixmor Property Group, Inc., REIT USD 74,360 1,939,309 0.47DDR Corp., REIT USD 101,710 1,829,763 0.44Federal Realty Investment Trust, REIT USD 2,282 371,989 0.09Kimco Realty Corp., REIT USD 336,878 10,369,105 2.49Regency Centers Corp., REIT USD 189,319 15,656,681 3.77Tanger Factory Outlet Centers, Inc., REIT USD 319,000 12,724,910 3.06
43,521,093 10.47
Single Family HomesAmerican Homes 4 Rent, REIT ‘A’ USD 42,600 858,816 0.20
858,816 0.20
SpecialtyGaming and Leisure Properties, Inc., REIT USD 35,270 1,204,470 0.29
1,204,470 0.29
Total Equities 394,896,194 94.97
Total Transferable securities and money market instruments admitted to official exchange listing or dealt in on another regulated market 394,896,194 94.97
SCHEDULE OF INVESTMENTSAs at 30 June 2016
Investments Currency
Quantity/Nominal
Value
Market Value USD
% of Net Assets
Units of authorised UCITS or other collective investment undertakings
Collective Investment Schemes – UCITS
Mutual FundsMorgan Stanley Liquidity Funds US Dollar
Treasury Liquidity Fund – MS Reserve (Luxembourg) (2) (4) USD 12,433,679 12,433,679 2.99
12,433,679 2.99
Total Collective Investment Schemes – UCITS 12,433,679 2.99
Total Units of authorised UCITS or other collective investment undertakings 12,433,679 2.99
Total Investments 407,329,873 97.96
Cash 469,937 0.12
Other Assets/(Liabilities) 7,980,204 1.92
Total Net Assets 415,780,014 100.00
(2) The country in brackets represents the country of incorporation of this security.(4) Affiliate managed by an affiliate of the Investment Adviser.

79 Morgan Stanley Investment Funds 30 June 2016
The accompanying notes are an integral part of these financial statements.
Please refer to the full prospectus for the Fund’s investment objective and policy.
INVESTMENT AIM
To seek to provide positive returns by investing in fixed income securities issued in various currencies and locations, by governmental agencies and corporate bonds, including mortgage-backed securities, rated B- or better by S&P or B3 or better by Moody at the time of purchase.
SCHEDULE OF INVESTMENTSAs at 30 June 2016
Investments Currency
Quantity/Nominal
Value
Market Value EUR
% of Net Assets
Transferable securities and money market instruments admitted to official exchange listing or dealt in on another regulated market
Corporate Bonds
AustraliaAPT Pipelines Ltd., Reg. S 1.375%
22/03/2022 EUR 100,000 99,292 0.33Aurizon Network Pty. Ltd., Reg. S 3.125%
01/06/2026 EUR 100,000 101,925 0.34BHP Billiton Finance Ltd., Reg. S, FRN
4.75% 22/04/2076 EUR 100,000 105,161 0.35Commonwealth Bank of Australia, Reg. S,
FRN 2% 22/04/2027 EUR 200,000 193,076 0.64Origin Energy Finance Ltd., Reg. S, FRN
7.875% 16/06/2071 EUR 200,000 196,707 0.65
696,161 2.31
AustriaUNIQA Insurance Group AG, Reg. S, FRN
6% 27/07/2046 EUR 100,000 102,784 0.34
102,784 0.34
BelgiumAnheuser-Busch InBev Finance, Inc. 3.65%
01/02/2026 (United States of America) (2) USD 200,000 192,871 0.64
Anheuser-Busch InBev SA NV, Reg. S 2.75% 17/03/2036 EUR 150,000 173,401 0.58
Solvay Finance SA, Reg. S, FRN 5.118% Perpetual (France) (2) EUR 100,000 103,237 0.34
UCB SA, Reg. S 1.875% 02/04/2022 EUR 100,000 102,685 0.34
572,194 1.90
BrazilBRF SA, Reg. S 2.75% 03/06/2022 EUR 100,000 98,475 0.33
98,475 0.33
ChinaBank of China Ltd., Reg. S, FRN 0.719%
30/06/2018 EUR 125,000 125,349 0.42Bao-trans Enterprises Ltd., Reg. S 1.625%
23/02/2018 (Hong Kong) (2) EUR 100,000 100,384 0.33CNOOC Curtis Funding No. 1 Pty. Ltd.,
Reg. S 2.75% 03/10/2020 (Australia) (2) EUR 100,000 106,633 0.36Eastern Creation II Investment Holdings
Ltd., Reg. S 1% 19/03/2018 (British Virgin Islands) (2) EUR 100,000 100,199 0.33
Eastern Creation II Investment Holdings Ltd., Reg. S 1.5% 29/07/2019 (British Virgin Islands) (2) EUR 100,000 100,892 0.34
Sinopec Group Overseas Development 2015 Ltd., Reg. S 0.5% 27/04/2018 (British Virgin Islands) (2) EUR 100,000 100,565 0.33
Three Gorges Finance II Cayman Islands Ltd., Reg. S 1.7% 10/06/2022 (Cayman Islands) (2) EUR 100,000 103,134 0.34
737,156 2.45
CyprusAroundtown Property Holdings plc, Reg. S
1.5% 03/05/2022 EUR 100,000 97,601 0.32
97,601 0.32
Absolute Return Fixed Income Fund
Bond Funds

Morgan Stanley Investment Funds 30 June 2016 80
The accompanying notes are an integral part of these financial statements.
Absolute Return Fixed Income Fund (continued)
SCHEDULE OF INVESTMENTSAs at 30 June 2016
Investments Currency
Quantity/Nominal
Value
Market Value EUR
% of Net Assets
Transferable securities and money market instruments admitted to official exchange listing or dealt in on another regulated market
Corporate Bonds (continued)
DenmarkISS Global A/S, Reg. S 1.125%
09/01/2020 EUR 100,000 102,175 0.34ISS Global A/S, Reg. S 1.125%
07/01/2021 EUR 100,000 102,227 0.34Nykredit Realkredit A/S Bond, Reg. S
0.875% 13/06/2019 EUR 100,000 100,883 0.33
305,285 1.01
FinlandSaastopankkien Keskuspankki Suomi OYJ,
Reg. S 1% 06/05/2020 EUR 100,000 100,710 0.34SATO OYJ, Reg. S 2.25% 10/09/2020 EUR 100,000 103,174 0.34SATO OYJ, Reg. S 2.375% 24/03/2021 EUR 100,000 103,105 0.34Transmission Finance DAC, Reg. S 1.5%
24/05/2023 (Ireland) (2) EUR 100,000 102,804 0.34
409,793 1.36
FranceAreva SA 4.875% 23/09/2024 EUR 100,000 82,015 0.27Banque Federative du Credit Mutuel SA,
Reg. S 2.375% 24/03/2026 EUR 100,000 99,458 0.33BNP Paribas Cardif SA, Reg. S, FRN
4.032% Perpetual EUR 100,000 96,037 0.32BNP Paribas SA, Reg. S, FRN 2.625%
14/10/2027 EUR 100,000 100,906 0.33BNP Paribas SA, Reg. S, FRN 6.125%
Perpetual EUR 200,000 191,687 0.64BNP Paribas SA, Reg. S 2.375%
17/02/2025 EUR 200,000 198,375 0.66BPCE SA, Reg. S 5.15% 21/07/2024 USD 200,000 187,720 0.62Bureau Veritas SA, Reg. S 3.125%
21/01/2021 EUR 100,000 108,426 0.36Credit Agricole Assurances SA, Reg. S,
FRN 4.5% Perpetual EUR 200,000 190,125 0.63Electricite de France SA, Reg. S, FRN 5%
Perpetual EUR 200,000 188,601 0.63Eurofins Scientific SE, Reg. S, FRN 4.875%
Perpetual (Luxembourg) (2) EUR 200,000 198,737 0.66Eurofins Scientific SE, Reg. S 2.25%
27/01/2022 (Luxembourg) (2) EUR 100,000 99,156 0.33Europcar Groupe SA, Reg. S 5.75%
15/06/2022 EUR 100,000 104,103 0.35Infra Park SAS, Reg. S 1.25%
16/10/2020 EUR 100,000 104,087 0.35SCOR SE, Reg. S, FRN 3% 08/06/2046 EUR 100,000 97,043 0.32Societe Generale SA, Reg. S 2.625%
27/02/2025 EUR 100,000 99,776 0.33Sogecap SA, Reg. S, FRN 4.125%
Perpetual EUR 100,000 93,376 0.31TOTAL SA, Reg. S, FRN 2.25% Perpetual EUR 200,000 193,561 0.64TOTAL SA, Reg. S, FRN 3.94% Perpetual EUR 100,000 103,938 0.34Veolia Environnement SA, Reg. S,
FRN 4.45% Perpetual EUR 200,000 210,342 0.70Vilmorin & Cie SA, Reg. S 2.375%
26/05/2021 EUR 100,000 104,755 0.35
2,852,224 9.47
SCHEDULE OF INVESTMENTSAs at 30 June 2016
Investments Currency
Quantity/Nominal
Value
Market Value EUR
% of Net Assets
Transferable securities and money market instruments admitted to official exchange listing or dealt in on another regulated market
Corporate Bonds (continued)
GermanyBayer AG, Reg. S, FRN 3.75%
01/07/2074 EUR 200,000 203,750 0.68Celesio Finance BV 4.5% 26/04/2017
(Netherlands) (2) EUR 300,000 309,585 1.03Commerzbank AG 7.75% 16/03/2021 EUR 100,000 119,531 0.4Covestro AG, Reg. S 1% 07/10/2021 EUR 50,000 51,613 0.17Covestro AG, Reg. S 1.75% 25/09/2024 EUR 50,000 53,189 0.18Daimler AG, Reg. S 1.375% 11/05/2028 EUR 100,000 104,485 0.35Deutsche Boerse AG, Reg. S, FRN 2.75%
05/02/2041 EUR 100,000 102,490 0.34Grand City Properties SA, Reg. S 2%
29/10/2021 (Luxembourg) (2) EUR 100,000 105,133 0.35Merck KGaA, Reg. S, FRN 2.625%
12/12/2074 EUR 200,000 203,349 0.67Muenchener Rueckversicherungs-
Gesellschaft AG, Reg. S, FRN 6% 26/05/2041 EUR 200,000 233,861 0.78
RWE AG, Reg. S, FRN 7% Perpetual GBP 100,000 118,635 0.39RWE Finance BV 6.5% 10/08/2021
(Netherlands) (2) EUR 60,000 76,878 0.25Unitymedia Hessen GmbH & Co. KG,
Reg. S 4% 15/01/2025 EUR 100,000 101,091 0.34Volkswagen International Finance NV,
Reg. S, FRN 0.351% 15/04/2019 (Netherlands) (2) EUR 100,000 99,590 0.33
Volkswagen International Finance NV, Reg. S, FRN 4.625% Perpetual (Netherlands) (2) EUR 225,000 231,869 0.77
Vonovia Finance BV, Reg. S, FRN 4% Perpetual (Netherlands) (2) EUR 200,000 203,452 0.67
Wuerth Finance International BV, Reg. S 1% 19/05/2022 (Netherlands) (2) EUR 50,000 52,229 0.17
2,370,730 7.87
Hong KongCK Hutchison Finance 16 Ltd., Reg. S
1.25% 06/04/2023 (Cayman Islands) (2) EUR 100,000 100,375 0.33Shanghai Electric Newage Co. Ltd., Reg. S
1.125% 22/05/2020 EUR 100,000 100,696 0.34
201,071 0.67
IcelandArion Banki HF, Reg. S 2.5% 26/04/2019 EUR 100,000 100,721 0.33Landsbankinn HF, Reg. S 3% 19/10/2018 EUR 100,000 102,012 0.34
202,733 0.67
IrelandBank of Ireland, Reg. S 1.25%
09/04/2020 EUR 100,000 102,196 0.34
102,196 0.34
ItalyAssicurazioni Generali SpA, Reg. S, FRN
7.75% 12/12/2042 EUR 200,000 232,077 0.77CDP Reti SpA, Reg. S 1.875%
29/05/2022 EUR 100,000 104,045 0.35Davide Campari-Milano SpA, Reg. S 4.5%
25/10/2019 EUR 100,000 110,431 0.37Enel SpA, Reg. S, FRN 5% 15/01/2075 EUR 200,000 211,011 0.70

81 Morgan Stanley Investment Funds 30 June 2016
The accompanying notes are an integral part of these financial statements.
Absolute Return Fixed Income Fund (continued)
SCHEDULE OF INVESTMENTSAs at 30 June 2016
Investments Currency
Quantity/Nominal
Value
Market Value EUR
% of Net Assets
Transferable securities and money market instruments admitted to official exchange listing or dealt in on another regulated market
Corporate Bonds (continued)
Italy (continued)FCA Capital Ireland plc, Reg. S, FRN
0.649% 17/10/2017 (Ireland) (2) EUR 200,000 200,762 0.67Intesa Sanpaolo SpA 5.25% 12/01/2024 USD 200,000 192,884 0.64Intesa Sanpaolo Vita SpA 5.35%
18/09/2018 EUR 200,000 217,358 0.72Iren SpA, Reg. S 2.75% 02/11/2022 EUR 100,000 109,883 0.36Poste Vita SpA 2.875% 30/05/2019 EUR 200,000 207,746 0.69Telecom Italia SpA, Reg. S 3.625%
19/01/2024 EUR 100,000 106,564 0.35UniCredit SpA, Reg. S, FRN 4.375%
03/01/2027 EUR 100,000 97,492 0.32
1,790,253 5.94
JapanSumitomo Mitsui Banking Corp., Reg. S
2.25% 16/12/2020 EUR 100,000 108,476 0.36
108,476 0.36
LuxembourgSES SA, Reg. S, FRN 4.625% Perpetual EUR 100,000 99,478 0.33
99,478 0.33
MexicoCemex SAB de CV, Reg. S 4.375%
05/03/2023 EUR 100,000 97,484 0.32Fomento Economico Mexicano SAB de CV,
Reg. S 1.75% 20/03/2023 EUR 100,000 102,258 0.34
199,742 0.66
NetherlandsABN AMRO Bank NV, Reg. S, FRN 2.875%
30/06/2025 EUR 100,000 102,266 0.34ABN AMRO Bank NV, Reg. S, FRN 5.75%
Perpetual EUR 200,000 186,771 0.62ABN AMRO Bank NV, Reg. S 6.375%
27/04/2021 EUR 100,000 119,674 0.40Achmea BV, Reg. S, FRN 4.25% Perpetual EUR 100,000 87,933 0.29ASR Nederland NV, Reg. S, FRN 5.125%
29/09/2045 EUR 115,000 116,984 0.39Cooperatieve Rabobank UA, Reg. S, FRN
2.5% 26/05/2026 EUR 100,000 101,791 0.34LeasePlan Corp. NV, Reg. S 1%
24/05/2021 EUR 100,000 100,498 0.33NN Group NV, Reg. S, FRN 4.625%
08/04/2044 EUR 200,000 202,539 0.67Shell International Finance BV 3.25%
11/05/2025 USD 150,000 141,546 0.47SNS Bank NV, Reg. S, FRN 3.75%
05/11/2025 EUR 100,000 98,224 0.33Vesteda Finance BV, Reg. S 1.75%
22/07/2019 EUR 100,000 103,603 0.34Vesteda Finance BV, Reg. S 2.5%
27/10/2022 EUR 100,000 108,906 0.36
1,470,735 4.88
SCHEDULE OF INVESTMENTSAs at 30 June 2016
Investments Currency
Quantity/Nominal
Value
Market Value EUR
% of Net Assets
Transferable securities and money market instruments admitted to official exchange listing or dealt in on another regulated market
Corporate Bonds (continued)
PortugalBrisa Concessao Rodoviaria SA, Reg. S
1.875% 30/04/2025 EUR 100,000 98,862 0.33EDP - Energias de Portugal SA, Reg. S,
FRN 5.375% 16/09/2075 EUR 100,000 99,619 0.33EDP Finance BV, Reg. S 2.625%
18/01/2022 (Netherlands) (2) EUR 100,000 105,472 0.35
303,953 1.01
Saudi ArabiaSABIC Capital I BV, Reg. S 2.75%
20/11/2020 (Netherlands) (2) EUR 100,000 106,729 0.36
106,729 0.36
SpainAmadeus Finance BV, Reg. S 0.625%
02/12/2017 (Netherlands) (2) EUR 100,000 100,820 0.34Banco Bilbao Vizcaya Argentaria SA,
Reg. S, FRN 6.75% Perpetual EUR 200,000 172,309 0.57Banco Santander SA, Reg. S, FRN 6.25%
Perpetual EUR 100,000 85,092 0.28BBVA Subordinated Capital SAU, Reg. S,
FRN 3.5% 11/04/2024 EUR 200,000 203,945 0.68CaixaBank SA, Reg. S, FRN 5%
14/11/2023 EUR 200,000 207,280 0.69Cellnex Telecom SAU, Reg. S 3.125%
27/07/2022 EUR 100,000 102,764 0.34Criteria Caixa SA, Reg. S 1.625%
21/04/2022 EUR 100,000 98,159 0.33Distribuidora Internacional de Alimentacion
SA, Reg. S 1.5% 22/07/2019 EUR 100,000 103,133 0.34Gas Natural Fenosa Finance BV, Reg. S,
FRN 3.375% Perpetual (Netherlands) (2) EUR 200,000 178,900 0.59Iberdrola International BV, Reg. S 1.125%
27/01/2023 (Netherlands) (2) EUR 100,000 103,635 0.34IE2 Holdco SAU, Reg. S 2.875%
01/06/2026 EUR 100,000 100,900 0.34Inmobiliaria Colonial SA, Reg. S 1.863%
05/06/2019 EUR 100,000 103,493 0.34Mapfre SA, Reg. S 1.625% 19/05/2026 EUR 100,000 100,443 0.33Repsol International Finance BV, Reg. S,
FRN 4.5% 25/03/2075 (Netherlands) (2) EUR 100,000 85,268 0.28Repsol International Finance BV, Reg. S
2.125% 16/12/2020 (Netherlands) (2) EUR 100,000 106,181 0.35Santander Issuances SAU 5.179%
19/11/2025 USD 200,000 179,319 0.60Telefonica Europe BV, Reg. S, FRN 4.2%
Perpetual (Netherlands) (2) EUR 100,000 99,588 0.33Telefonica Europe BV, Reg. S, FRN 5.875%
Perpetual (Netherlands) (2) EUR 100,000 102,313 0.34
2,233,542 7.41
SwitzerlandGlencore Finance Europe SA, Reg. S
1.25% 17/03/2021 (Luxembourg) (2) EUR 100,000 92,440 0.31UBS Group Funding Jersey Ltd., Reg. S
1.75% 16/11/2022 (Jersey) (2) EUR 200,000 208,789 0.69
301,229 1.00

Morgan Stanley Investment Funds 30 June 2016 82
The accompanying notes are an integral part of these financial statements.
Absolute Return Fixed Income Fund (continued)
SCHEDULE OF INVESTMENTSAs at 30 June 2016
Investments Currency
Quantity/Nominal
Value
Market Value EUR
% of Net Assets
Transferable securities and money market instruments admitted to official exchange listing or dealt in on another regulated market
Corporate Bonds (continued)
TurkeyTurkiye Vakiflar Bankasi TAO, Reg. S
2.375% 04/05/2021 EUR 100,000 100,369 0.33
100,369 0.33
United Arab EmiratesEmirates NBD PJSC, Reg. S 1.75%
23/03/2022 EUR 100,000 99,589 0.33
99,589 0.33
United KingdomAnglo American Capital plc, Reg. S 1.75%
20/11/2017 EUR 100,000 99,483 0.33AstraZeneca plc, Reg. S 0.875%
24/11/2021 EUR 100,000 103,290 0.34British Telecommunications plc, Reg. S
1.75% 10/03/2026 EUR 100,000 104,332 0.35DS Smith plc, Reg. S 2.25% 16/09/2022 EUR 100,000 103,633 0.34FCE Bank plc, Reg. S, FRN 0.718%
17/09/2019 EUR 100,000 100,712 0.33G4S International Finance plc, Reg. S
2.625% 06/12/2018 EUR 100,000 104,623 0.35Hammerson plc, REIT, Reg. S 1.75%
15/03/2023 EUR 100,000 100,654 0.33HSBC Holdings plc, Reg. S 1.5%
15/03/2022 EUR 100,000 102,622 0.34HSBC Holdings plc, Reg. S 3%
30/06/2025 EUR 200,000 205,245 0.68HSS Financing plc, Reg. S 6.75%
01/08/2019 GBP 68,000 80,319 0.27International Game Technology plc, Reg. S
4.75% 15/02/2023 EUR 100,000 103,796 0.34Leeds Building Society, Reg. S 1.375%
05/05/2022 EUR 100,000 97,318 0.32Lloyds Bank plc, Reg. S 6.5%
24/03/2020 EUR 200,000 230,779 0.77Lloyds Banking Group plc, Reg. S, FRN
6.375% Perpetual EUR 200,000 187,674 0.62Nationwide Building Society, Reg. S, FRN
4.125% 20/03/2023 EUR 200,000 205,848 0.68Nationwide Building Society, Reg. S, FRN
6.875% Perpetual GBP 100,000 113,299 0.38NGG Finance plc, Reg. S, FRN 4.25%
18/06/2076 EUR 100,000 106,443 0.35Royal Bank of Scotland Group plc, Reg. S
2.5% 22/03/2023 EUR 100,000 99,170 0.33Royal Bank of Scotland plc (The) 5.5%
23/03/2020 EUR 200,000 233,567 0.78Santander UK Group Holdings plc, Reg. S,
FRN 7.375% Perpetual GBP 200,000 225,192 0.75Smiths Group plc, Reg. S 1.25%
28/04/2023 EUR 100,000 97,872 0.33State Grid Europe Development 2014 plc,
Reg. S 1.5% 26/01/2022 EUR 100,000 101,880 0.34Virgin Media Finance plc, Reg. S 4.5%
15/01/2025 EUR 100,000 96,809 0.32Yorkshire Building Society, Reg. S 2.125%
18/03/2019 EUR 100,000 102,851 0.34
3,107,411 10.31
SCHEDULE OF INVESTMENTSAs at 30 June 2016
Investments Currency
Quantity/Nominal
Value
Market Value EUR
% of Net Assets
Transferable securities and money market instruments admitted to official exchange listing or dealt in on another regulated market
Corporate Bonds (continued)
United States of AmericaBall Corp. 4.375% 15/12/2023 EUR 100,000 108,177 0.36Bank of America Corp., Reg. S 1.625%
14/09/2022 EUR 100,000 105,046 0.35General Motors Financial International BV,
Reg. S 1.875% 15/10/2019 (Netherlands) (2) EUR 100,000 103,978 0.35
Harman Finance International SCA 2% 27/05/2022 (Luxembourg) (2) EUR 100,000 101,011 0.34
Honeywell International, Inc. 1.3% 22/02/2023 EUR 100,000 104,183 0.35
J.P. Morgan Chase & Co. 3.875% 01/02/2024 USD 100,000 97,322 0.32
J.P. Morgan Chase & Co. 4.125% 15/12/2026 USD 225,000 214,002 0.71
MasterCard, Inc. 1.1% 01/12/2022 EUR 100,000 103,652 0.34Mohawk Industries, Inc. 2% 14/01/2022 EUR 100,000 103,913 0.34Mondelez International, Inc. 1%
07/03/2022 EUR 100,000 101,662 0.34MPT Operating Partnership LP, REIT 4%
19/08/2022 EUR 100,000 104,252 0.35Omnicom Group, Inc. 3.65% 01/11/2024 USD 32,000 30,828 0.10Pentair Finance SA 2.45% 17/09/2019
(Luxembourg) (2) EUR 100,000 103,897 0.34Time Warner, Inc. 1.95% 15/09/2023 EUR 100,000 106,582 0.35United Technologies Corp. 1.25%
22/05/2023 EUR 100,000 103,887 0.34
1,592,392 5.28
Total Corporate Bonds 20,262,301 67.24
Government Bonds
BrazilBrazil Letras do Tesouro Nacional 0%
01/01/2019 BRL 320,000 671,958 2.23
671,958 2.23
CyprusCyprus Government International Bond,
Reg. S 3.875% 06/05/2022 EUR 200,000 204,995 0.68Cyprus Government International Bond,
Reg. S 4.25% 04/11/2025 EUR 19,000 19,617 0.07
224,612 0.75
HungaryHungary Government Bond 7.5%
12/11/2020 HUF 63,000,000 243,383 0.81Hungary Government Bond 6%
24/11/2023 HUF 95,000,000 362,764 1.20Hungary Government Bond 5.5%
24/06/2025 HUF 44,000,000 165,641 0.55Hungary Government International Bond
5.75% 22/11/2023 USD 220,000 225,580 0.75
997,368 3.31

83 Morgan Stanley Investment Funds 30 June 2016
The accompanying notes are an integral part of these financial statements.
Absolute Return Fixed Income Fund (continued)
SCHEDULE OF INVESTMENTSAs at 30 June 2016
Investments Currency
Quantity/Nominal
Value
Market Value EUR
% of Net Assets
Transferable securities and money market instruments admitted to official exchange listing or dealt in on another regulated market
Government Bonds (continued)
IndonesiaIndonesia Government International Bond,
Reg. S 5.875% 15/01/2024 USD 200,000 208,740 0.69
208,740 0.69
ItalyItaly Buoni Poliennali Del Tesoro, Reg. S,
144A 2.35% 15/09/2024 EUR 180,000 207,652 0.69
207,652 0.69
MexicoMexico Government International Bond
1.625% 06/03/2024 EUR 100,000 100,942 0.33
100,942 0.33
New ZealandNew Zealand Government Bond, Reg. S
5.5% 15/04/2023 NZD 790,000 614,428 2.04
614,428 2.04
PolandPoland Government Bond 2.5%
25/07/2026 PLN 2,400,000 523,621 1.74
523,621 1.74
PortugalPortugal Government International Bond,
144A 5.125% 15/10/2024 USD 200,000 182,087 0.6Portugal Obrigacoes do Tesouro OT,
Reg. S, 144A 2.875% 21/07/2026 EUR 330,000 324,344 1.08
506,431 1.68
RomaniaRomania Government Bond 4.75%
24/02/2025 RON 850,000 206,517 0.68
206,517 0.68
South AfricaSouth Africa Government Bond 8%
31/01/2030 ZAR 11,200,000 621,571 2.06
621,571 2.06
SpainSpain Government Bond, Reg. S, 144A
2.15% 31/10/2025 EUR 160,000 173,884 0.58
173,884 0.58
SCHEDULE OF INVESTMENTSAs at 30 June 2016
Investments Currency
Quantity/Nominal
Value
Market Value EUR
% of Net Assets
Transferable securities and money market instruments admitted to official exchange listing or dealt in on another regulated market
Government Bonds (continued)
United States of AmericaUS Treasury 3.5% 15/02/2039 USD 50,000 56,943 0.19US Treasury 2.5% 15/02/2045 USD 120,000 112,798 0.37US Treasury Inflation Indexed 0.25%
15/01/2025 USD 590,000 544,661 1.81
714,402 2.37
Total Government Bonds 5,772,126 19.15
Mortgage and Asset Backed Securities
GreeceGrifonas Finance plc, Reg. S, FRN,
Series 1 ‘A’ 0.152% 28/08/2039 (United Kingdom) (2) EUR 51,905 36,077 0.12
36,077 0.12
IrelandDeco Ltd., Reg. S, FRN, Series 2014-
BONX ‘A’ 1.25% 07/11/2024 EUR 94,520 94,131 0.31
94,131 0.31
PortugalLusitano Mortgages No. 5 plc, Reg. S,
FRN, Series 5 ‘A’ 0.011% 15/07/2059 (Ireland) (2) EUR 212,226 157,854 0.53
157,854 0.53
United States of AmericaCD Commercial Mortgage Trust, FRN,
Series 2007-CD4 ‘AMFX’ 5.366% 11/12/2049 USD 95,000 86,946 0.29
CFCRE Mortgage Trust, FRN, Series 2015-RUM ‘D’, 144A 4.242% 15/07/2030 USD 100,000 88,114 0.29
CHL Mortgage Pass-Through Trust, Series 2004-5 ‘2A2’ 5.5% 25/05/2034 USD 51,628 47,403 0.16
COMM Mortgage Trust, Series 2014-CR20 ‘D’, 144A 3.222% 10/11/2047 USD 110,000 70,930 0.23
Credit Suisse First Boston Mortgage Securities Corp., FRN, Series 2003-AR30 ‘2A1’ 2.831% 25/01/2034 USD 107,350 95,137 0.32
FNMA Connecticut Avenue Securities, FRN, Series 2015-C03 ‘1M2’ 5.453% 25/07/2025 USD 100,000 90,597 0.30
FREMF Mortgage Trust, FRN, Series 2015-K720 ‘B’, 144A 3.506% 25/07/2022 USD 173,000 148,324 0.49
GNMA, IO, FRN, Series 2010-H26 ‘IO’ 0.816% 20/08/2058 USD 1,030,329 32,252 0.11
J.P. Morgan Chase Commercial Mortgage Securities Trust, FRN, Series 2007-CB20 ‘AJ’ 6.078% 12/02/2051 USD 95,000 85,176 0.28
J.P. Morgan Chase Commercial Mortgage Securities Trust, FRN, Series 2007-LDPX ‘AM’ 5.464% 15/01/2049 USD 95,000 84,166 0.28
J.P. Morgan Mortgage Trust, FRN, Series 2003-A1 ‘1A1’ 2.504% 25/10/2033 USD 134,479 118,221 0.39
J.P. Morgan Mortgage Trust, FRN, Series 2005-A4 ‘4A2’ 2.939% 25/07/2035 USD 32,044 28,607 0.09
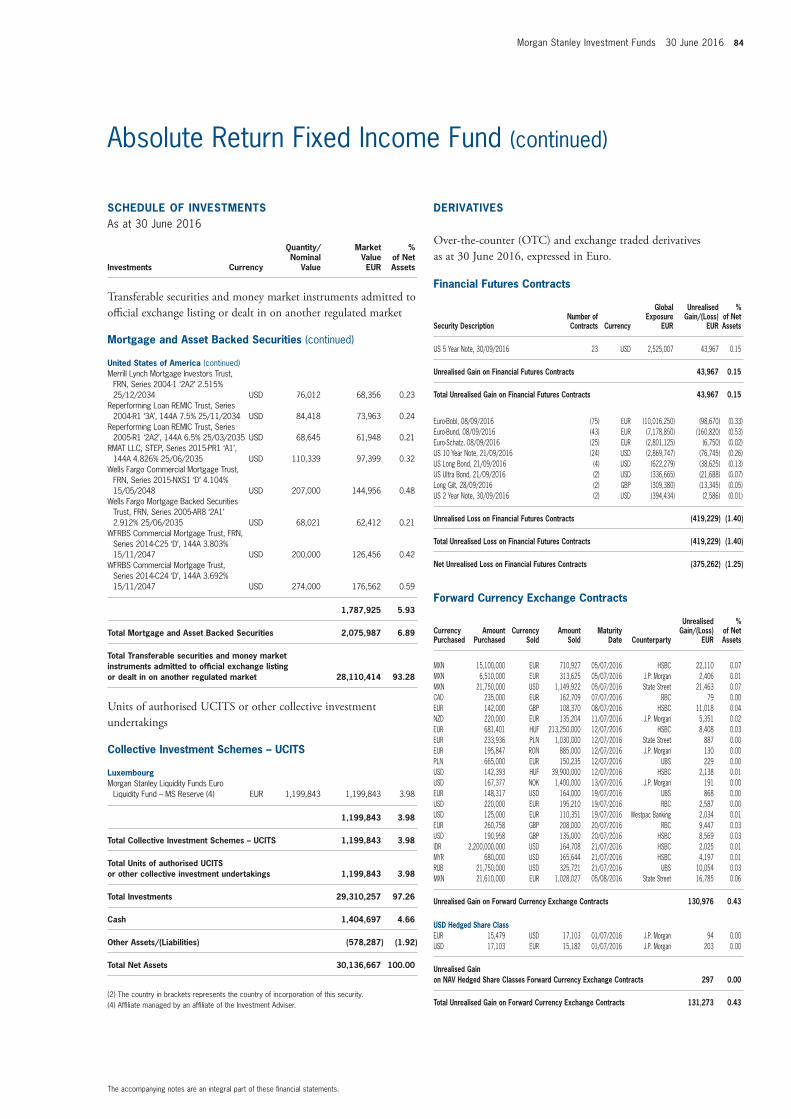
Morgan Stanley Investment Funds 30 June 2016 84
The accompanying notes are an integral part of these financial statements.
Absolute Return Fixed Income Fund (continued)
SCHEDULE OF INVESTMENTSAs at 30 June 2016
Investments Currency
Quantity/Nominal
Value
Market Value EUR
% of Net Assets
Transferable securities and money market instruments admitted to official exchange listing or dealt in on another regulated market
Mortgage and Asset Backed Securities (continued)
United States of America (continued)Merrill Lynch Mortgage Investors Trust,
FRN, Series 2004-1 ‘2A2’ 2.515% 25/12/2034 USD 76,012 68,356 0.23
Reperforming Loan REMIC Trust, Series 2004-R1 ‘3A’, 144A 7.5% 25/11/2034 USD 84,418 73,963 0.24
Reperforming Loan REMIC Trust, Series 2005-R1 ‘2A2’, 144A 6.5% 25/03/2035 USD 68,645 61,948 0.21
RMAT LLC, STEP, Series 2015-PR1 ‘A1’, 144A 4.826% 25/06/2035 USD 110,339 97,399 0.32
Wells Fargo Commercial Mortgage Trust, FRN, Series 2015-NXS1 ‘D’ 4.104% 15/05/2048 USD 207,000 144,956 0.48
Wells Fargo Mortgage Backed Securities Trust, FRN, Series 2005-AR8 ‘2A1’ 2.912% 25/06/2035 USD 68,021 62,412 0.21
WFRBS Commercial Mortgage Trust, FRN, Series 2014-C25 ‘D’, 144A 3.803% 15/11/2047 USD 200,000 126,456 0.42
WFRBS Commercial Mortgage Trust, Series 2014-C24 ‘D’, 144A 3.692% 15/11/2047 USD 274,000 176,562 0.59
1,787,925 5.93
Total Mortgage and Asset Backed Securities 2,075,987 6.89
Total Transferable securities and money market instruments admitted to official exchange listing or dealt in on another regulated market 28,110,414 93.28
Units of authorised UCITS or other collective investment undertakings
Collective Investment Schemes – UCITS
LuxembourgMorgan Stanley Liquidity Funds Euro
Liquidity Fund – MS Reserve (4) EUR 1,199,843 1,199,843 3.98
1,199,843 3.98
Total Collective Investment Schemes – UCITS 1,199,843 3.98
Total Units of authorised UCITS or other collective investment undertakings 1,199,843 3.98
Total Investments 29,310,257 97.26
Cash 1,404,697 4.66
Other Assets/(Liabilities) (578,287) (1.92)
Total Net Assets 30,136,667 100.00
(2) The country in brackets represents the country of incorporation of this security.(4) Affiliate managed by an affiliate of the Investment Adviser.
Financial Futures Contracts
Security DescriptionNumber of Contracts Currency
Global Exposure
EUR
Unrealised Gain/(Loss)
EUR
% of Net Assets
US 5 Year Note, 30/09/2016 23 USD 2,525,007 43,967 0.15
Unrealised Gain on Financial Futures Contracts 43,967 0.15
Total Unrealised Gain on Financial Futures Contracts 43,967 0.15
Euro-Bobl, 08/09/2016 (75) EUR (10,016,250) (98,670) (0.33)Euro-Bund, 08/09/2016 (43) EUR (7,178,850) (160,820) (0.53)Euro-Schatz, 08/09/2016 (25) EUR (2,801,125) (6,750) (0.02)US 10 Year Note, 21/09/2016 (24) USD (2,869,747) (76,745) (0.26)US Long Bond, 21/09/2016 (4) USD (622,279) (38,625) (0.13)US Ultra Bond, 21/09/2016 (2) USD (336,665) (21,688) (0.07)Long Gilt, 28/09/2016 (2) GBP (309,380) (13,345) (0.05)US 2 Year Note, 30/09/2016 (2) USD (394,434) (2,586) (0.01)
Unrealised Loss on Financial Futures Contracts (419,229) (1.40)
Total Unrealised Loss on Financial Futures Contracts (419,229) (1.40)
Net Unrealised Loss on Financial Futures Contracts (375,262) (1.25)
Forward Currency Exchange Contracts (continued)
Currency Purchased
Amount Purchased
Currency Sold
Amount Sold
Maturity Date Counterparty
Unrealised Gain/(Loss)
EUR
% of Net Assets
MXN 15,100,000 EUR 710,927 05/07/2016 HSBC 22,110 0.07MXN 6,510,000 EUR 313,625 05/07/2016 J.P. Morgan 2,406 0.01MXN 21,750,000 USD 1,149,922 05/07/2016 State Street 21,463 0.07CAD 235,000 EUR 162,709 07/07/2016 RBC 79 0.00EUR 142,000 GBP 108,370 08/07/2016 HSBC 11,018 0.04NZD 220,000 EUR 135,204 11/07/2016 J.P. Morgan 5,351 0.02EUR 681,401 HUF 213,250,000 12/07/2016 HSBC 8,408 0.03EUR 233,936 PLN 1,030,000 12/07/2016 State Street 887 0.00EUR 195,847 RON 885,000 12/07/2016 J.P. Morgan 130 0.00PLN 665,000 EUR 150,235 12/07/2016 UBS 229 0.00USD 142,393 HUF 39,900,000 12/07/2016 HSBC 2,138 0.01USD 167,377 NOK 1,400,000 13/07/2016 J.P. Morgan 191 0.00EUR 148,317 USD 164,000 19/07/2016 UBS 868 0.00USD 220,000 EUR 195,210 19/07/2016 RBC 2,587 0.00USD 125,000 EUR 110,351 19/07/2016 Westpac Banking 2,034 0.01EUR 260,758 GBP 208,000 20/07/2016 RBC 9,447 0.03USD 190,958 GBP 135,000 20/07/2016 HSBC 8,569 0.03IDR 2,200,000,000 USD 164,708 21/07/2016 HSBC 2,025 0.01MYR 680,000 USD 165,644 21/07/2016 HSBC 4,197 0.01RUB 21,750,000 USD 325,721 21/07/2016 UBS 10,054 0.03MXN 21,610,000 EUR 1,028,027 05/08/2016 State Street 16,785 0.06
Unrealised Gain on Forward Currency Exchange Contracts 130,976 0.43
USD Hedged Share ClassEUR 15,479 USD 17,103 01/07/2016 J.P. Morgan 94 0.00USD 17,103 EUR 15,182 01/07/2016 J.P. Morgan 203 0.00
Unrealised Gain on NAV Hedged Share Classes Forward Currency Exchange Contracts 297 0.00
Total Unrealised Gain on Forward Currency Exchange Contracts 131,273 0.43
DERIVATIVES
Over-the-counter (OTC) and exchange traded derivatives as at 30 June 2016, expressed in Euro.

85 Morgan Stanley Investment Funds 30 June 2016
The accompanying notes are an integral part of these financial statements.
Absolute Return Fixed Income Fund (continued)
Forward Currency Exchange Contracts (continued)
Currency Purchased
Amount Purchased
Currency Sold
Amount Sold
Maturity Date Counterparty
Unrealised Gain/(Loss)
EUR
% of Net Assets
EUR 1,032,546 MXN 21,610,000 05/07/2016 State Street (16,523) (0.06)USD 308,240 MXN 5,750,000 05/07/2016 J.P. Morgan (1,863) 0.00USD 862,427 MXN 16,000,000 05/07/2016 State Street (940) 0.00EUR 161,187 CAD 235,000 07/07/2016 RBC (1,600) (0.01)EUR 72,000 USD 80,211 08/07/2016 Westpac Banking (145) 0.00EUR 865,586 NZD 1,425,000 11/07/2016 Commonwealth
Bank of Australia (44,827) (0.15)NZD 244,000 USD 173,847 11/07/2016 HSBC (462) 0.00EUR 293,652 PLN 1,300,000 12/07/2016 J.P. Morgan (488) 0.00EUR 135,803 USD 155,000 13/07/2016 J.P. Morgan (3,586) (0.01)NOK 1,430,000 EUR 154,053 13/07/2016 J.P. Morgan (502) 0.00NOK 1,265,000 USD 155,092 13/07/2016 J.P. Morgan (3,639) (0.01)EUR 395,005 ZAR 6,700,000 15/07/2016 J.P. Morgan (13,450) (0.05)EUR 220,097 ZAR 3,655,000 15/07/2016 UBS (2,725) (0.01)EUR 6,466,063 USD 7,364,000 19/07/2016 Westpac Banking (154,750) (0.52)USD 165,000 EUR 149,719 19/07/2016 J.P. Morgan (1,371) 0.00USD 658,666 BRL 2,305,000 21/07/2016 State Street (49,674) (0.17)USD 163,084 IDR 2,200,000,000 21/07/2016 HSBC (3,485) (0.01)USD 165,490 MYR 680,000 21/07/2016 HSBC (4,335) (0.01)EUR 162,551 CAD 235,000 05/08/2016 RBC (75) 0.00USD 1,146,275 MXN 21,750,000 05/08/2016 State Street (21,659) (0.07)
Unrealised Loss on Forward Currency Exchange Contracts (326,099) (1.08)
USD Hedged Share ClassUSD 16,879 EUR 15,272 08/07/2016 J.P. Morgan (90) 0.00
Unrealised Loss on NAV Hedged Share Classes Forward Currency Exchange Contracts (90) 0.00
Total Unrealised Loss on Forward Currency Exchange Contracts (326,189) (1.08)
Net Unrealised Loss on Forward Currency Exchange Contracts (194,916) (0.65)
Credit Default Swap Contracts
Nominal Amount Ccy Counterparty Reference Entity
Buy/Sell
Interest (Paid)/
ReceivedMaturity
Date
Market Value EUR
Unrealised Gain/(Loss)
EUR
% of Net Assets
78,000 USD Deutsche Bank CMBX.NA.BB.6 Sell 5.00% 11/05/2063 (9,779) (9,779) (0.03)57,000 USD Goldman Sachs CMBX.NA.BB.6 Sell 5.00% 11/05/2063 (7,147) (7,147) (0.03)
300,000 USD Goldman Sachs CMBX.NA.BBB-.6 Sell 3.00% 11/05/2063 (20,871) (20,871) (0.07)
Total Unrealised Loss on Credit Default Swap Contracts (37,797) (37,797) (0.13)
Net Unrealised Loss on Credit Default Swap Contracts (37,797) (37,797) (0.13)
Interest Rate Swap Contracts
Nominal Amount Ccy Counterparty
Security Description
Maturity Date
Market Value EUR
Unrealised Gain/(Loss)
EUR
% of Net Assets
1,500,000 USD Goldman Sachs Pay fixed 2.463% Receive floating LIBOR
3 month 17/07/2025 (153,522) (153,522) (0.51)2,900,000 USD Goldman Sachs Pay fixed 1.776%
Receive floating LIBOR 3 month 17/07/2020 (107,828) (107,828) (0.36)
Total Unrealised Loss on Interest Rate Swap Contracts (261,350) (261,350) (0.87)
Net Unrealised Loss on Interest Rate Swap Contracts (261,350) (261,350) (0.87)
Collateral received and paid by the Fund in respect of financial derivative instruments:
Type of Collateral Counterparty CurrencyCollateral Amount
receivedCollateral Amount
paid
Absolute Return Fixed Income Fund
Cash Goldman Sachs EUR 633,387 229,000
633,387 229,000
DERIVATIVES (continued)
Over-the-counter (OTC) and exchange traded derivatives as at 30 June 2016, expressed in Euro.
DERIVATIVES (continued)
Over-the-counter (OTC) and exchange traded derivatives as at 30 June 2016, expressed in Euro.

Morgan Stanley Investment Funds 30 June 2016 86
The accompanying notes are an integral part of these financial statements.
Please refer to the full prospectus for the Fund’s investment objective and policy.
INVESTMENT AIM
To provide an attractive level of total return through investment in Fixed Income Securities in Asia. The Fund seeks to achieve the investment policy through allocation across fixed income asset classes as well as through market and instrument selection.
SCHEDULE OF INVESTMENTSAs at 30 June 2016
Investments Currency
Quantity/Nominal
Value
Market Value USD
% of Net Assets
Transferable securities and money market instruments admitted to official exchange listing or dealt in on another regulated market
Convertible Bonds
ChinaSouFun Holdings Ltd. 2% 15/12/2018
(Cayman Islands) (2) USD 200,000 197,250 1.86
197,250 1.86
IndiaVedanta Resources Jersey Ltd., Reg. S
5.5% 13/07/2016 (Jersey) (2) USD 200,000 200,271 1.88
200,271 1.88
Total Convertible Bonds 397,521 3.74
Corporate Bonds
ChinaBank of China Ltd., Reg. S 5%
13/11/2024 USD 200,000 213,506 2.01Bestgain Real Estate Ltd., Reg. S 2.625%
13/03/2018 (British Virgin Islands) (2) USD 200,000 200,386 1.89Bluestar Finance Holdings Ltd., Reg. S,
FRN 4.375% Perpetual (British Virgin Islands) (2) USD 200,000 202,717 1.91
BOC Aviation Ltd., Reg. S 3.875% 27/04/2026 (Singapore) USD 200,000 206,120 1.94
CCCI Treasure Ltd., Reg. S, FRN 3.5% Perpetual (British Virgin Islands) (2) USD 200,000 203,669 1.92
Chalco Hong Kong Investment Co. Ltd., Reg. S, FRN 6.25% Perpetual (British Virgin Islands) (2) USD 200,000 203,750 1.92
China Oil & Gas Group Ltd., Reg. S 5% 07/05/2020 (Bermuda) (2) USD 200,000 199,171 1.88
CIFI Holdings Group Co. Ltd., Reg. S 8.875% 27/01/2019 (Cayman Islands) (2) USD 200,000 214,615 2.02
CITIC Ltd., Reg. S 6.375% 10/04/2020 (Hong Kong) (2) USD 200,000 228,014 2.15
Country Garden Holdings Co. Ltd., Reg. S 7.5% 09/03/2020 (Cayman Islands) (2) USD 200,000 215,719 2.03
KWG Property Holding Ltd., Reg. S 8.975% 14/01/2019 (Cayman Islands) (2) USD 200,000 213,948 2.01
KWG Property Holding Ltd., Reg. S 8.625% 05/02/2020 (Cayman Islands) (2) USD 200,000 214,194 2.02
Proven Honour Capital Ltd., Reg. S 4.125% 19/05/2025 (British Virgin Islands) (2) USD 200,000 208,647 1.96
Shimao Property Holdings Ltd., Reg. S 8.375% 10/02/2022 (Cayman Islands) (2) USD 200,000 226,189 2.13
Trillion Chance Ltd., Reg. S 8.5% 10/01/2019 (British Virgin Islands) (2) USD 200,000 213,250 2.01
3,163,895 29.80
Asian Fixed Income Opportunities Fund
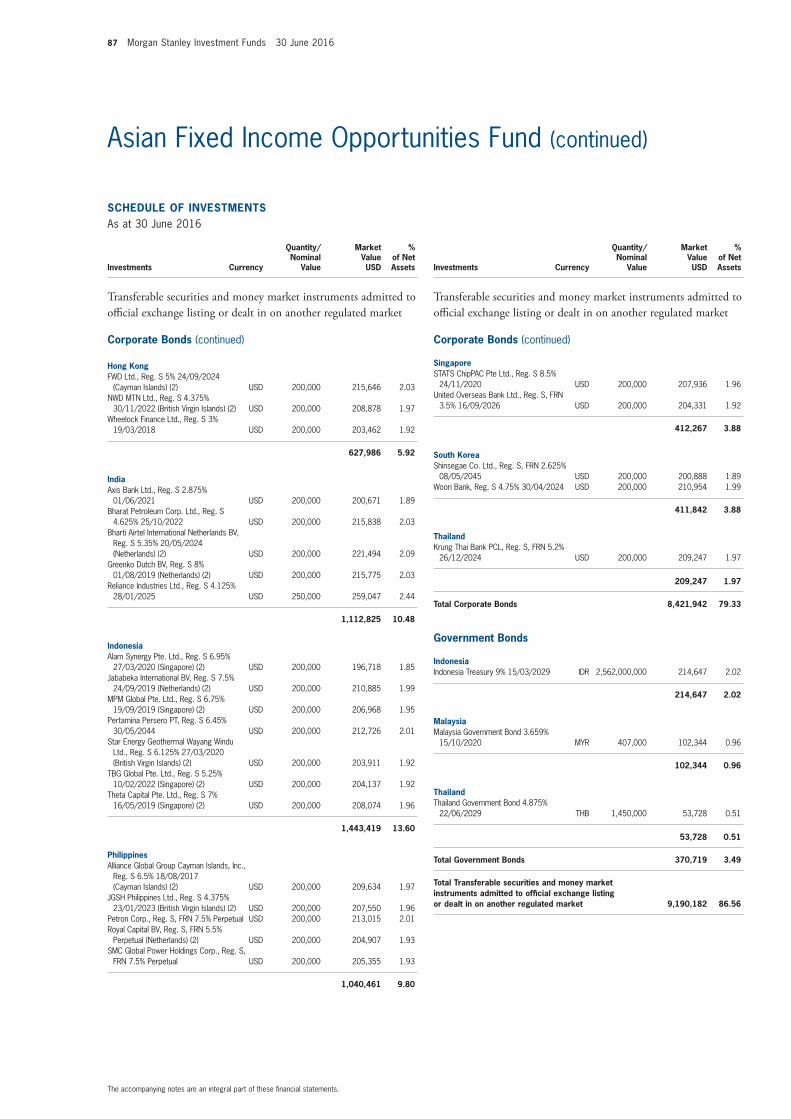
87 Morgan Stanley Investment Funds 30 June 2016
The accompanying notes are an integral part of these financial statements.
Asian Fixed Income Opportunities Fund (continued)
SCHEDULE OF INVESTMENTSAs at 30 June 2016
Investments Currency
Quantity/Nominal
Value
Market Value USD
% of Net Assets
Transferable securities and money market instruments admitted to official exchange listing or dealt in on another regulated market
Corporate Bonds (continued)
Hong KongFWD Ltd., Reg. S 5% 24/09/2024
(Cayman Islands) (2) USD 200,000 215,646 2.03NWD MTN Ltd., Reg. S 4.375%
30/11/2022 (British Virgin Islands) (2) USD 200,000 208,878 1.97Wheelock Finance Ltd., Reg. S 3%
19/03/2018 USD 200,000 203,462 1.92
627,986 5.92
IndiaAxis Bank Ltd., Reg. S 2.875%
01/06/2021 USD 200,000 200,671 1.89Bharat Petroleum Corp. Ltd., Reg. S
4.625% 25/10/2022 USD 200,000 215,838 2.03Bharti Airtel International Netherlands BV,
Reg. S 5.35% 20/05/2024 (Netherlands) (2) USD 200,000 221,494 2.09
Greenko Dutch BV, Reg. S 8% 01/08/2019 (Netherlands) (2) USD 200,000 215,775 2.03
Reliance Industries Ltd., Reg. S 4.125% 28/01/2025 USD 250,000 259,047 2.44
1,112,825 10.48
IndonesiaAlam Synergy Pte. Ltd., Reg. S 6.95%
27/03/2020 (Singapore) (2) USD 200,000 196,718 1.85Jababeka International BV, Reg. S 7.5%
24/09/2019 (Netherlands) (2) USD 200,000 210,885 1.99MPM Global Pte. Ltd., Reg. S 6.75%
19/09/2019 (Singapore) (2) USD 200,000 206,968 1.95Pertamina Persero PT, Reg. S 6.45%
30/05/2044 USD 200,000 212,726 2.01Star Energy Geothermal Wayang Windu
Ltd., Reg. S 6.125% 27/03/2020 (British Virgin Islands) (2) USD 200,000 203,911 1.92
TBG Global Pte. Ltd., Reg. S 5.25% 10/02/2022 (Singapore) (2) USD 200,000 204,137 1.92
Theta Capital Pte. Ltd., Reg. S 7% 16/05/2019 (Singapore) (2) USD 200,000 208,074 1.96
1,443,419 13.60
PhilippinesAlliance Global Group Cayman Islands, Inc.,
Reg. S 6.5% 18/08/2017 (Cayman Islands) (2) USD 200,000 209,634 1.97
JGSH Philippines Ltd., Reg. S 4.375% 23/01/2023 (British Virgin Islands) (2) USD 200,000 207,550 1.96
Petron Corp., Reg. S, FRN 7.5% Perpetual USD 200,000 213,015 2.01Royal Capital BV, Reg. S, FRN 5.5%
Perpetual (Netherlands) (2) USD 200,000 204,907 1.93SMC Global Power Holdings Corp., Reg. S,
FRN 7.5% Perpetual USD 200,000 205,355 1.93
1,040,461 9.80
SCHEDULE OF INVESTMENTSAs at 30 June 2016
Investments Currency
Quantity/Nominal
Value
Market Value USD
% of Net Assets
Transferable securities and money market instruments admitted to official exchange listing or dealt in on another regulated market
Corporate Bonds (continued)
SingaporeSTATS ChipPAC Pte Ltd., Reg. S 8.5%
24/11/2020 USD 200,000 207,936 1.96United Overseas Bank Ltd., Reg. S, FRN
3.5% 16/09/2026 USD 200,000 204,331 1.92
412,267 3.88
South KoreaShinsegae Co. Ltd., Reg. S, FRN 2.625%
08/05/2045 USD 200,000 200,888 1.89Woori Bank, Reg. S 4.75% 30/04/2024 USD 200,000 210,954 1.99
411,842 3.88
ThailandKrung Thai Bank PCL, Reg. S, FRN 5.2%
26/12/2024 USD 200,000 209,247 1.97
209,247 1.97
Total Corporate Bonds 8,421,942 79.33
Government Bonds
IndonesiaIndonesia Treasury 9% 15/03/2029 IDR 2,562,000,000 214,647 2.02
214,647 2.02
MalaysiaMalaysia Government Bond 3.659%
15/10/2020 MYR 407,000 102,344 0.96
102,344 0.96
ThailandThailand Government Bond 4.875%
22/06/2029 THB 1,450,000 53,728 0.51
53,728 0.51
Total Government Bonds 370,719 3.49
Total Transferable securities and money market instruments admitted to official exchange listing or dealt in on another regulated market 9,190,182 86.56

Morgan Stanley Investment Funds 30 June 2016 88
The accompanying notes are an integral part of these financial statements.
Asian Fixed Income Opportunities Fund (continued)
DERIVATIVES
Over-the-counter (OTC) and exchange traded derivatives as at 30 June 2016, expressed in US dollars.
Forward Currency Exchange Contracts
Currency Purchased
Amount Purchased
Currency Sold
Amount Sold
Maturity Date Counterparty
Unrealised Gain/(Loss)
USD
% of Net Assets
MYR 870,000 USD 213,040 05/07/2016 J.P. Morgan 3,253 0.03IDR 4,226,000,000 USD 317,475 18/07/2016 J.P. Morgan 3,342 0.04INR 1,700,000 USD 24,941 22/07/2016 J.P. Morgan 151 0.00THB 1,800,000 USD 51,073 22/07/2016 J.P. Morgan 168 0.00KRW 125,000,000 USD 106,993 29/07/2016 J.P. Morgan 1,522 0.01
Unrealised Gain on Forward Currency Exchange Contracts 8,436 0.08
Total Unrealised Gain on Forward Currency Exchange Contracts 8,436 0.08
MYR 421,538 USD 105,095 05/07/2016 J.P. Morgan (296) 0.00USD 313,933 MYR 1,291,538 05/07/2016 J.P. Morgan (7,158) (0.07)USD 370,653 IDR 5,008,000,000 18/07/2016 J.P. Morgan (9,530) (0.09)INR 1,800,000 USD 26,596 22/07/2016 J.P. Morgan (28) 0.00USD 51,365 INR 3,500,000 22/07/2016 J.P. Morgan (295) 0.00USD 156,152 THB 5,510,000 22/07/2016 J.P. Morgan (705) 0.00USD 105,048 MYR 421,538 29/07/2016 J.P. Morgan (507) (0.01)
Unrealised Loss on Forward Currency Exchange Contracts (18,519) (0.17)
Total Unrealised Loss on Forward Currency Exchange Contracts (18,519) (0.17)
Net Unrealised Loss on Forward Currency Exchange Contracts (10,083) (0.09)
SCHEDULE OF INVESTMENTSAs at 30 June 2016
Investments Currency
Quantity/Nominal
Value
Market Value USD
% of Net Assets
Units of authorised UCITS or other collective investment undertakings
Collective Investment Schemes – UCITS
LuxembourgMorgan Stanley Liquidity Funds US Dollar
Liquidity Fund – MS Reserve (4) USD 1,005,334 1,005,334 9.47
1,005,334 9.47
Total Collective Investment Schemes – UCITS 1,005,334 9.47
Total Units of authorised UCITS or other collective investment undertakings 1,005,334 9.47
Total Investments 10,195,516 96.03
Cash 415,789 3.92
Other Assets/(Liabilities) 5,183 0.05
Total Net Assets 10,616,488 100.00
(2) The country in brackets represents the country of incorporation of this security.(4) Affiliate managed by an affiliate of the Investment Adviser.

89 Morgan Stanley Investment Funds 30 June 2016
The accompanying notes are an integral part of these financial statements.
Please refer to the full prospectus for the Fund’s investment objective and policy.
INVESTMENT AIM
To seek to maximize total return, measured in US dollars, primarily through investments across the credit spectrum of debt securities of corporate issuers, together with investing in debt securities of government and government related issuers located in emerging markets countries. The Fund intends to invest its assets in emerging market countries’ corporate debt securities that provide a high level of current income, while at the same time holding the potential for capital appreciation.
SCHEDULE OF INVESTMENTSAs at 30 June 2016
Investments Currency
Quantity/Nominal
Value
Market Value USD
% of Net Assets
Transferable securities and money market instruments admitted to official exchange listing or dealt in on another regulated market
Convertible Bonds
IndiaVedanta Resources Jersey Ltd., Reg. S
5.5% 13/07/2016 (Jersey) (2) USD 3,500,000 3,504,742 0.48
3,504,742 0.48
Total Convertible Bonds 3,504,742 0.48
Corporate Bonds
ArgentinaBanco de Galicia y Buenos Aires SA,
Reg. S 8.75% 04/05/2018 USD 5,000,000 5,135,175 0.71IRSA Propiedades Comerciales SA, Reg. S
8.75% 23/03/2023 USD 3,220,000 3,426,386 0.47YPF SA, Reg. S 8.875% 19/12/2018 USD 3,000,000 3,242,670 0.45YPF SA, Reg. S 8.5% 23/03/2021 (1) USD 3,750,000 4,026,094 0.55
15,830,325 2.18
BrazilAndrade Gutierrez International SA, Reg. S
4% 30/04/2018 (Luxembourg) (2) USD 3,592,000 2,596,854 0.36Braskem Finance Ltd., Reg. S 5.75%
15/04/2021 (Cayman Islands) (1) (2) USD 2,900,000 2,926,579 0.40Braskem Finance Ltd., Reg. S 7.375%
Perpetual (Cayman Islands) (2) USD 2,300,000 2,168,911 0.30BRF SA, Reg. S 4.75% 22/05/2024 USD 7,000,000 6,998,320 0.96CIMPOR Financial Operations BV, Reg. S
5.75% 17/07/2024 (Netherlands) (2) USD 2,300,000 1,710,188 0.23Cosan Luxembourg SA, Reg. S 7%
20/01/2027 (Luxembourg) (2) USD 6,780,000 6,745,829 0.93Minerva Luxembourg SA, FRN, 144A
8.75% Perpetual (Luxembourg) (2) USD 4,933,000 4,926,414 0.68Minerva Luxembourg SA, Reg. S, FRN
8.75% Perpetual (Luxembourg) (2) USD 850,000 853,494 0.12Petrobras Global Finance BV 3%
15/01/2019 (Netherlands) (2) USD 3,825,000 3,533,325 0.49Petrobras Global Finance BV 8.375%
23/05/2021 (Netherlands) (2) USD 13,978,000 14,418,307 1.99QGOG Constellation SA, Reg. S 6.25%
09/11/2019 (Luxembourg) (2) USD 8,800,000 4,349,444 0.60Virgolino de Oliveira Finance SA, Reg. S
10.5% 28/01/2018 (Luxembourg) (2) USD 2,725,000 136,250 0.02Virgolino de Oliveira Finance SA, Reg. S
11.75% 09/02/2022 (Luxembourg) (2) USD 1,500,000 75,000 0.01
51,438,915 7.09
ChileBanco Santander Chile, Reg. S 3.875%
20/09/2022 USD 3,450,000 3,613,323 0.50Cencosud SA, Reg. S 4.875%
20/01/2023 USD 3,500,000 3,592,732 0.50Cencosud SA, Reg. S 6.625%
12/02/2045 USD 1,845,000 1,798,903 0.25Empresa Electrica Angamos SA, 144A
4.875% 25/05/2029 USD 1,620,000 1,571,246 0.22Empresa Electrica Guacolda SA, Reg. S
4.56% 30/04/2025 USD 4,410,000 4,099,933 0.57Empresa Nacional de Telecomunicaciones
SA, Reg. S 4.875% 30/10/2024 USD 3,300,000 3,367,864 0.46
Emerging Markets Corporate Debt Fund

Morgan Stanley Investment Funds 30 June 2016 90
The accompanying notes are an integral part of these financial statements.
Emerging Markets Corporate Debt Fund (continued)
SCHEDULE OF INVESTMENTSAs at 30 June 2016
Investments Currency
Quantity/Nominal
Value
Market Value USD
% of Net Assets
Transferable securities and money market instruments admitted to official exchange listing or dealt in on another regulated market
Corporate Bonds (continued)
Chile (continued)GeoPark Latin America Ltd. Agencia en
Chile, Reg. S 7.5% 11/02/2020 (Bermuda) (2) USD 4,988,000 3,940,520 0.54
Inversiones CMPC SA, Reg. S 4.375% 15/05/2023 USD 1,000,000 1,029,235 0.14
VTR Finance BV, 144A 6.875% 15/01/2024 (Netherlands) (2) USD 2,825,000 2,832,642 0.39
25,846,398 3.57
ChinaBank of China Ltd., Reg. S 5%
13/11/2024 USD 2,270,000 2,423,293 0.33BCP Singapore VI Cayman Financing Co.
Ltd., Reg. S 8% 15/04/2021 (Cayman Islands) (2) USD 3,395,000 2,945,757 0.41
Bluestar Finance Holdings Ltd., Reg. S, FRN 4.375% Perpetual (British Virgin Islands) (1) (2) USD 4,340,000 4,398,963 0.61
BOC Aviation Ltd., Reg. S 3.875% 27/04/2026 (Singapore) USD 4,000,000 4,122,400 0.57
CCCI Treasure Ltd., Reg. S, FRN 3.5% Perpetual (British Virgin Islands) (1) (2) USD 2,800,000 2,851,372 0.39
China Oil & Gas Group Ltd., Reg. S 5% 07/05/2020 (Bermuda) (2) USD 1,500,000 1,493,783 0.20
CIFI Holdings Group Co. Ltd., Reg. S 8.875% 27/01/2019 (Cayman Islands) (2) USD 1,600,000 1,716,922 0.24
CNOOC Nexen Finance 2014 ULC 4.25% 30/04/2024 (Canada) (2) USD 2,000,000 2,124,458 0.29
Country Garden Holdings Co. Ltd., Reg. S 7.5% 09/03/2020 (Cayman Islands) (2) USD 1,500,000 1,617,893 0.22
CRCC Yupeng Ltd., Reg. S, FRN 3.95% Perpetual (Hong Kong) (2) USD 2,800,000 2,880,245 0.40
Dianjian Haixing Ltd., Reg. S, FRN 4.05% Perpetual (British Virgin Islands) (1) (2) USD 2,800,000 2,897,171 0.40
Double Rosy Ltd., Reg. S 3.625% 18/11/2019 (British Virgin Islands) (1) (2) USD 1,430,000 1,475,288 0.20
Far East Horizon Ltd., Reg. S, FRN 5.55% Perpetual (Hong Kong) (2) USD 2,800,000 2,848,692 0.39
Huarong Finance II Co. Ltd., Reg. S 5.5% 16/01/2025 (British Virgin Islands) (2) USD 1,800,000 1,967,866 0.27
Industrial & Commercial Bank of China Macau Ltd., Reg. S, FRN 3.875% 10/09/2024 USD 2,400,000 2,441,482 0.34
KWG Property Holding Ltd., Reg. S 8.625% 05/02/2020 (Cayman Islands) (2) USD 1,400,000 1,499,358 0.21
Minmetals Bounteous Finance BVI Ltd., Reg. S 4.75% 30/07/2025 (British Virgin Islands) (1) (2) USD 1,800,000 1,883,781 0.26
New World China Land Ltd., Reg. S 5.375% 06/11/2019 (Cayman Islands) (2) USD 1,350,000 1,437,187 0.20
Proven Honour Capital Ltd., Reg. S 4.125% 06/05/2026 (British Virgin Islands) (2) USD 2,500,000 2,601,650 0.36
Shimao Property Holdings Ltd., Reg. S 8.375% 10/02/2022 (Cayman Islands) (2) USD 1,360,000 1,538,082 0.21
Shui On Development Holding Ltd., Reg. S 8.7% 24/11/2017 (Cayman Islands) (2) USD 1,600,000 1,697,915 0.23
SCHEDULE OF INVESTMENTSAs at 30 June 2016
Investments Currency
Quantity/Nominal
Value
Market Value USD
% of Net Assets
Transferable securities and money market instruments admitted to official exchange listing or dealt in on another regulated market
Corporate Bonds (continued)
China (continued)Sino-Ocean Land Treasure Finance I Ltd.,
Reg. S 4.625% 30/07/2019 (British Virgin Islands) (2) USD 1,250,000 1,310,591 0.18
Sino-Ocean Land Treasure Finance I Ltd., Reg. S 6% 30/07/2024 (British Virgin Islands) (1) (2) USD 1,225,000 1,310,077 0.18
Sinopec Group Overseas Development 2016 Ltd., Reg. S 3.5% 03/05/2026 (British Virgin Islands) (2) USD 3,650,000 3,744,334 0.52
Sunac China Holdings Ltd., Reg. S 8.75% 05/12/2019 (Cayman Islands) (1) (2) USD 1,500,000 1,651,784 0.23
Trillion Chance Ltd., Reg. S 8.5% 10/01/2019 (British Virgin Islands) (2) USD 2,572,000 2,742,395 0.38
59,622,739 8.22
ColombiaBanco de Bogota SA, Reg. S 6.25%
12/05/2026 USD 8,750,000 8,923,469 1.23Ecopetrol SA 5.375% 26/06/2026 USD 8,200,000 7,946,415 1.10Ecopetrol SA 5.875% 28/05/2045 USD 7,700,000 6,639,287 0.92Empresa de Energia de Bogota SA ESP,
Reg. S 6.125% 10/11/2021 USD 5,375,000 5,612,064 0.77Millicom International Cellular SA, Reg. S
6.625% 15/10/2021 (Luxembourg) (2) USD 3,000,000 3,083,520 0.42
32,204,755 4.44
Dominican RepublicAES Andres BV, Reg. S 7.95%
11/05/2026 (Netherlands) (2) USD 3,400,000 3,541,049 0.49
3,541,049 0.49
El SalvadorAgricola Senior Trust, Reg. S 6.75%
18/06/2020 (Cayman Islands) (2) USD 5,169,000 5,312,621 0.73
5,312,621 0.73
Hong KongBank of East Asia Ltd. (The), Reg. S, FRN
4.25% 20/11/2024 USD 6,000,000 6,106,230 0.84Champion MTN Ltd., REIT, Reg. S 3.75%
17/01/2023 (Cayman Islands) (2) USD 3,000,000 3,091,545 0.43China CITIC Bank International Ltd., Reg. S,
FRN 3.875% 28/09/2022 USD 3,000,000 3,017,601 0.42FWD Ltd., Reg. S 5% 24/09/2024
(Cayman Islands) (1) (2) USD 2,855,000 3,078,338 0.42Henson Finance Ltd., Reg. S 5.5%
17/09/2019 USD 2,500,000 2,751,745 0.38HLP Finance Ltd., Reg. S 4.45%
16/04/2021 (British Virgin Islands) (1) (2) USD 2,494,000 2,657,741 0.37Hongkong Land Finance Cayman Islands
Co. Ltd. (The), Reg. S 4.625% 16/01/2024 (Cayman Islands) (1) (2) USD 2,850,000 3,222,658 0.44
Li & Fung Ltd., Reg. S 5.25% 13/05/2020 (Bermuda) (2) USD 2,900,000 3,210,126 0.44
NWD MTN Ltd., Reg. S 5.25% 26/02/2021 (British Virgin Islands) (2) USD 2,800,000 3,041,984 0.42
NWD MTN Ltd., Reg. S 4.375% 30/11/2022 (British Virgin Islands) (2) USD 2,800,000 2,924,298 0.40

91 Morgan Stanley Investment Funds 30 June 2016
The accompanying notes are an integral part of these financial statements.
Emerging Markets Corporate Debt Fund (continued)
SCHEDULE OF INVESTMENTSAs at 30 June 2016
Investments Currency
Quantity/Nominal
Value
Market Value USD
% of Net Assets
Transferable securities and money market instruments admitted to official exchange listing or dealt in on another regulated market
Corporate Bonds (continued)
Hong Kong (continued)PCCW-HKT Capital No. 5 Ltd., Reg. S
3.75% 08/03/2023 (British Virgin Islands) (1) (2) USD 2,500,000 2,668,950 0.37
Sun Hung Kai Properties Capital Market Ltd., Reg. S, FRN 3.375% 25/02/2024 (Cayman Islands) (2) USD 3,250,000 3,329,099 0.46
Towngas Finance Ltd., Reg. S, FRN 4.75% Perpetual (British Virgin Islands) (2) USD 2,488,000 2,610,347 0.36
41,710,662 5.75
IndiaAxis Bank Ltd., Reg. S 2.875%
01/06/2021 USD 6,820,000 6,842,867 0.95Bharti Airtel International Netherlands BV,
Reg. S 5.35% 20/05/2024 (Netherlands) (2) USD 6,300,000 6,977,061 0.96
Greenko Dutch BV, Reg. S 8% 01/08/2019 (Netherlands) (2) USD 6,000,000 6,473,250 0.89
ICICI Bank Ltd., Reg. S, FRN 6.375% 30/04/2022 USD 6,200,000 6,309,430 0.87
Oil India Ltd., Reg. S 5.375% 17/04/2024 USD 2,900,000 3,200,454 0.44Reliance Industries Ltd., Reg. S 4.125%
28/01/2025 USD 5,050,000 5,232,760 0.72Reliance Industries Ltd., Reg. S 4.875%
10/02/2045 USD 1,740,000 1,750,536 0.24Tata Motors Ltd., Reg. S 5.75%
30/10/2024 (1) USD 3,000,000 3,177,090 0.44Vedanta Resources plc, Reg. S 8.25%
07/06/2021 (United Kingdom) (2) USD 1,800,000 1,492,434 0.21Vedanta Resources plc, Reg. S 7.125%
31/05/2023 (United Kingdom) (1) (2) USD 5,800,000 4,434,912 0.61
45,890,794 6.33
IndonesiaJababeka International BV, Reg. S 7.5%
24/09/2019 (Netherlands) (2) USD 3,100,000 3,268,721 0.45Listrindo Capital BV, Reg. S 6.95%
21/02/2019 (Netherlands) (2) USD 2,500,000 2,598,713 0.36Marquee Land Pte. Ltd., Reg. S 9.75%
05/08/2019 (Singapore) (1) (2) USD 2,000,000 2,154,360 0.30MPM Global Pte. Ltd., Reg. S 6.75%
19/09/2019 (Singapore) (2) USD 3,000,000 3,104,520 0.43Pakuwon Prima Pte. Ltd., Reg. S 7.125%
02/07/2019 (Singapore) (2) USD 1,700,000 1,805,733 0.25Pertamina Persero PT, Reg. S 6.45%
30/05/2044 USD 1,700,000 1,808,174 0.25Perusahaan Gas Negara Persero Tbk. PT,
Reg. S 5.125% 16/05/2024 USD 1,700,000 1,776,101 0.24Pratama Agung Pte. Ltd., Reg. S 6.25%
24/02/2020 (Singapore) (2) USD 1,400,000 1,433,299 0.20Star Energy Geothermal Wayang Windu
Ltd., Reg. S 6.125% 27/03/2020 (British Virgin Islands) (1) (2) USD 3,000,000 3,058,665 0.42
TBG Global Pte. Ltd., Reg. S 5.25% 10/02/2022 (Singapore) (2) USD 1,450,000 1,479,990 0.20
22,488,276 3.10
SCHEDULE OF INVESTMENTSAs at 30 June 2016
Investments Currency
Quantity/Nominal
Value
Market Value USD
% of Net Assets
Transferable securities and money market instruments admitted to official exchange listing or dealt in on another regulated market
Corporate Bonds (continued)
IsraelAltice Finco SA, 144A 7.625%
15/02/2025 (Luxembourg) (2) USD 6,700,000 6,140,047 0.85B Communications Ltd., 144A 7.375%
15/02/2021 USD 3,000,000 3,218,310 0.44Delek & Avner Tamar Bond Ltd., 144A
5.082% 30/12/2023 USD 4,250,000 4,415,920 0.61Israel Electric Corp. Ltd., Reg. S, 144A 5%
12/11/2024 USD 4,100,000 4,430,583 0.61Israel Electric Corp. Ltd., Reg. S 7.25%
15/01/2019 USD 3,800,000 4,222,028 0.58
22,426,888 3.09
JamaicaDigicel Group Ltd., Reg. S 8.25%
30/09/2020 (Bermuda) (2) USD 8,000,000 6,697,520 0.92Digicel Group Ltd., Reg. S 7.125%
01/04/2022 (Bermuda) (2) USD 6,800,000 5,049,748 0.70
11,747,268 1.62
KazakhstanZhaikmunai LLP, Reg. S 7.125%
13/11/2019 USD 8,550,000 7,514,766 1.04
7,514,766 1.04
KuwaitKuwait Projects Co., Reg. S 5%
15/03/2023 (Cayman Islands) (2) USD 3,000,000 3,138,855 0.43NBK Tier 1 Financing Ltd., Reg. S, FRN
5.75% Perpetual (United Arab Emirates) (2) USD 5,400,000 5,491,665 0.76
8,630,520 1.19
MexicoAlfa SAB de CV, Reg. S 6.875%
25/03/2044 USD 1,800,000 1,848,042 0.25Alpek SAB de CV, Reg. S 4.5%
20/11/2022 USD 3,500,000 3,624,495 0.50BBVA Bancomer SA, Reg. S 6.5%
10/03/2021 USD 2,485,000 2,727,474 0.38Cemex SAB de CV, Reg. S 7.75%
16/04/2026 USD 12,350,000 12,995,164 1.79Grupo Posadas SAB de CV, Reg. S
7.875% 30/06/2022 USD 2,500,000 2,542,838 0.35PLA Administradora Industrial S de RL de
CV, REIT, Reg. S 5.25% 10/11/2022 USD 2,980,000 3,012,601 0.42Southern Copper Corp. 5.875%
23/04/2045 (United States of America) (2) USD 3,950,000 3,690,248 0.51
Trust F/1401, REIT, 144A 5.25% 30/01/2026 USD 6,840,000 6,947,696 0.96
Unifin Financiera SAB de CV SOFOM ENR, Reg. S 6.25% 22/07/2019 USD 10,175,000 9,957,153 1.37
47,345,711 6.53

Morgan Stanley Investment Funds 30 June 2016 92
The accompanying notes are an integral part of these financial statements.
Emerging Markets Corporate Debt Fund (continued)
SCHEDULE OF INVESTMENTSAs at 30 June 2016
Investments Currency
Quantity/Nominal
Value
Market Value USD
% of Net Assets
Transferable securities and money market instruments admitted to official exchange listing or dealt in on another regulated market
Corporate Bonds (continued)
MoroccoOCP SA, Reg. S 4.5% 22/10/2025 USD 4,700,000 4,608,162 0.64
4,608,162 0.64
NigeriaAccess Bank plc, Reg. S, FRN 9.25%
24/06/2021 USD 9,050,000 7,159,862 0.99Zenith Bank plc, Reg. S 6.25%
22/04/2019 USD 5,107,000 4,843,581 0.67
12,003,443 1.66
OmanBank Muscat SAOG, Reg. S 3.75%
03/05/2021 USD 3,650,000 3,691,245 0.51
3,691,245 0.51
PanamaAeropuerto Internacional de Tocumen SA,
Reg. S 5.625% 18/05/2036 USD 2,380,000 2,381,428 0.33AES Panama SRL, Reg. S 6% 25/06/2022 USD 2,700,000 2,771,631 0.38
5,153,059 0.71
PeruBanco de Credito del Peru, Reg. S, FRN
6.125% 24/04/2027 USD 6,293,000 6,879,036 0.95Banco Internacional del Peru SAA
Interbank, Reg. S, FRN 6.625% 19/03/2029 USD 6,600,000 7,030,419 0.97
Corp. Financiera de Desarrollo SA, FRN, 144A 5.25% 15/07/2029 USD 3,090,000 3,199,973 0.44
Ferreycorp SAA, Reg. S 4.875% 26/04/2020 USD 1,399,000 1,402,973 0.19
Union Andina de Cementos SAA, Reg. S 5.875% 30/10/2021 USD 1,550,000 1,580,829 0.22
20,093,230 2.77
PhilippinesAlliance Global Group Cayman Islands, Inc.,
Reg. S 6.5% 18/08/2017 (Cayman Islands) (2) USD 3,100,000 3,249,327 0.45
JGSH Philippines Ltd., Reg. S 4.375% 23/01/2023 (British Virgin Islands) (2) USD 3,000,000 3,113,250 0.43
Petron Corp., Reg. S, FRN 7.5% Perpetual USD 5,450,000 5,804,659 0.80Royal Capital BV, Reg. S, FRN 5.5%
Perpetual (Netherlands) (2) USD 4,485,000 4,595,044 0.63San Miguel Corp., Reg. S 4.875%
26/04/2023 USD 3,000,000 3,002,340 0.41SMC Global Power Holdings Corp., Reg. S,
FRN 7.5% Perpetual USD 6,475,000 6,648,368 0.92
26,412,988 3.64
SCHEDULE OF INVESTMENTSAs at 30 June 2016
Investments Currency
Quantity/Nominal
Value
Market Value USD
% of Net Assets
Transferable securities and money market instruments admitted to official exchange listing or dealt in on another regulated market
Corporate Bonds (continued)
PolandPowszechna Kasa Oszczednosci Bank
Polski SA, Reg. S 4.63% 26/09/2022 (Sweden) (2) USD 3,000,000 3,138,555 0.43
3,138,555 0.43
QatarABQ Finance Ltd., Reg. S 3.625%
13/04/2021 (Cayman Islands) (2) USD 3,150,000 3,207,834 0.44CBQ Finance Ltd., Reg. S 3.25%
13/06/2021 (Bermuda) (2) USD 3,570,000 3,660,624 0.50Nakilat, Inc., Reg. S 6.067% 31/12/2033
(Marshall Islands) (1) (2) USD 2,300,000 2,600,990 0.36Ooredoo International Finance Ltd., Reg. S
5% 19/10/2025 (Bermuda) (2) USD 3,300,000 3,697,997 0.51Ras Laffan Liquefied Natural Gas Co.
Ltd. III, Reg. S 5.838% 30/09/2027 USD 5,194,000 5,766,067 0.80
18,933,512 2.61
RussiaCredit Bank of Moscow, 144A 8.7%
13/11/2018 (Ireland) (2) USD 2,050,000 2,123,431 0.29Credit Bank of Moscow, Reg. S 7.7%
01/02/2018 (Ireland) (2) USD 5,000,000 5,220,550 0.72Gazprom OAO, Reg. S 6.51% 07/03/2022
(Luxembourg) (2) USD 6,450,000 7,156,694 0.99GTH Finance BV, Reg. S 7.25%
26/04/2023 (Netherlands) (2) USD 12,900,000 13,474,502 1.86Lukoil International Finance BV, Reg. S
4.563% 24/04/2023 (Netherlands) (2) USD 3,000,000 3,044,610 0.42MMC Norilsk Nickel OJSC, Reg. S 6.625%
14/10/2022 (Ireland) (2) USD 4,300,000 4,780,160 0.66Mobile Telesystems OJSC, Reg. S 5%
30/05/2023 (Ireland) (2) USD 3,625,000 3,744,244 0.52Novatek OAO, Reg. S 6.604%
03/02/2021 (Ireland) (2) USD 3,275,000 3,619,350 0.50Sberbank of Russia, Reg. S, FRN 5.5%
26/02/2024 (Luxembourg) (2) USD 3,500,000 3,490,462 0.48SCF Capital Ltd., Reg. S 5.375%
16/06/2023 (Ireland) (2) USD 7,190,000 7,273,404 1.00Severstal OAO, Reg. S 5.9% 17/10/2022
(Luxembourg) (2) USD 5,000,000 5,386,900 0.74VTB Bank OJSC, Reg. S 6.95%
17/10/2022 (Luxembourg) (2) USD 6,800,000 7,122,728 0.98VTB Bank PJSC, Reg. S, FRN 9.5%
Perpetual (Ireland) (2) USD 7,000,000 7,446,495 1.03
73,883,530 10.19
SingaporeGlobal Logistic Properties Ltd., Reg. S
3.875% 04/06/2025 USD 5,900,000 6,055,146 0.84Oversea-Chinese Banking Corp. Ltd.,
Reg. S, FRN 3.15% 11/03/2023 USD 2,500,000 2,547,225 0.35STATS ChipPAC Pte Ltd., Reg. S 8.5%
24/11/2020 USD 6,700,000 6,965,856 0.96United Overseas Bank Ltd., Reg. S, FRN
3.5% 16/09/2026 USD 5,200,000 5,312,606 0.73
20,880,833 2.88

93 Morgan Stanley Investment Funds 30 June 2016
The accompanying notes are an integral part of these financial statements.
Emerging Markets Corporate Debt Fund (continued)
SCHEDULE OF INVESTMENTSAs at 30 June 2016
Investments Currency
Quantity/Nominal
Value
Market Value USD
% of Net Assets
Transferable securities and money market instruments admitted to official exchange listing or dealt in on another regulated market
Corporate Bonds (continued)
South AfricaAngloGold Ashanti Holdings plc 6.5%
15/04/2040 (Isle of Man) (2) USD 1,000,000 978,370 0.13Myriad International Holdings BV, Reg. S
5.5% 21/07/2025 (Netherlands) (2) USD 6,650,000 6,941,968 0.96
7,920,338 1.09
South KoreaShinhan Bank, Reg. S 3.875%
24/03/2026 USD 3,000,000 3,096,975 0.43Woori Bank, Reg. S 4.75% 30/04/2024 USD 13,569,000 14,312,188 1.97
17,409,163 2.40
Supra-NationalBlack Sea Trade & Development Bank,
Reg. S 4.875% 06/05/2021 USD 2,800,000 2,933,294 0.41
2,933,294 0.41
ThailandKrung Thai Bank PCL, Reg. S, FRN 5.2%
26/12/2024 USD 6,000,000 6,277,410 0.86PTT Global Chemical PCL, Reg. S 4.25%
19/09/2022 USD 3,500,000 3,818,797 0.53
10,096,207 1.39
TurkeyFinansbank A/S, Reg. S 6.25%
30/04/2019 USD 3,750,000 3,994,800 0.55KOC Holding A/S, Reg. S 5.25%
15/03/2023 USD 1,900,000 1,972,922 0.27Mersin Uluslararasi Liman Isletmeciligi A/S,
Reg. S 5.875% 12/08/2020 USD 2,850,000 3,028,310 0.42TC Ziraat Bankasi A/S, Reg. S 4.75%
29/04/2021 USD 3,650,000 3,721,102 0.51Turk Telekomunikasyon A/S, Reg. S
4.875% 19/06/2024 USD 3,500,000 3,497,620 0.48Turkiye Halk Bankasi A/S, Reg. S 4.75%
04/06/2019 USD 6,350,000 6,453,378 0.89Turkiye Is Bankasi, Reg. S 5%
25/06/2021 USD 5,200,000 5,288,712 0.73Turkiye Is Bankasi, Reg. S 5.375%
06/10/2021 (1) USD 4,400,000 4,544,694 0.63
32,501,538 4.48
UkraineMHP SA, Reg. S 8.25% 02/04/2020
(Luxembourg) (2) USD 3,500,000 3,320,012 0.46
3,320,012 0.46
SCHEDULE OF INVESTMENTSAs at 30 June 2016
Investments Currency
Quantity/Nominal
Value
Market Value USD
% of Net Assets
Transferable securities and money market instruments admitted to official exchange listing or dealt in on another regulated market
Corporate Bonds (continued)
United Arab EmiratesBOS Funding Ltd., Reg. S 3.374%
08/06/2020 (Cayman Islands) (2) USD 6,250,000 6,151,906 0.85Emirates NBD 2014 Tier 1 Ltd., Reg. S,
FRN 6.375% Perpetual (Cayman Islands) (2) USD 2,700,000 2,772,373 0.38
JAFZ Sukuk 2019 Ltd., Reg. S 7% 19/06/2019 (Cayman Islands) (2) USD 2,700,000 3,019,113 0.42
MAF Global Securities Ltd., Reg. S, FRN 7.125% Perpetual (Cayman Islands) (2) USD 6,053,000 6,335,736 0.87
National Bank of Abu Dhabi PJSC, Reg. S, FRN 5.25% Perpetual USD 5,130,000 5,194,125 0.72
23,473,253 3.24
United KingdomSable International Finance Ltd., 144A
6.875% 01/08/2022 (Cayman Islands) (2) USD 3,000,000 3,027,960 0.42
3,027,960 0.42
United States of AmericaMarfrig Holdings Europe BV, 144A 8%
08/06/2023 (Netherlands) (2) USD 4,735,000 4,843,574 0.67
4,843,574 0.67
Total Corporate Bonds 695,875,583 95.97
Total Transferable securities and money market instruments admitted to official exchange listing or dealt in on another regulated market 699,380,325 96.45
Units of authorised UCITS or other collective investment undertakings
Collective Investment Schemes – UCITS
LuxembourgMorgan Stanley Liquidity Funds US Dollar
Liquidity Fund – MS Reserve (4) USD 21,032,421 21,032,421 2.90
21,032,421 2.90
Total Collective Investment Schemes – UCITS 21,032,421 2.90
Total Units of authorised UCITS or other collective investment undertakings 21,032,421 2.90
Total Investments 720,412,746 99.35
Cash 661,545 0.09
Other Assets/(Liabilities) 4,039,595 0.56
Total Net Assets 725,113,886 100.00
(1) All or part of this position is out on loan.(2) The country in brackets represents the country of incorporation of this security.(4) Affiliate managed by an affiliate of the Investment Adviser.

Morgan Stanley Investment Funds 30 June 2016 94
The accompanying notes are an integral part of these financial statements.
Emerging Markets Corporate Debt Fund (continued)
Forward Currency Exchange Contracts
Currency Purchased
Amount Purchased
Currency Sold
Amount Sold
Maturity Date Counterparty
Unrealised Gain/(Loss)
USD
% of Net Assets
EUR Hedged Share ClassEUR 400,188 USD 441,998 01/07/2016 J.P. Morgan 2,868 0.00USD 139,249 EUR 123,343 01/07/2016 J.P. Morgan 2,137 0.00EUR 110,546,629 USD 122,178,372 08/07/2016 J.P. Morgan 726,545 0.10
Unrealised Gain on NAV Hedged Share Classes Forward Currency Exchange Contracts 731,550 0.10
Total Unrealised Gain on Forward Currency Exchange Contracts 731,550 0.10
EUR Hedged Share ClassEUR 111,994,165 USD 126,166,105 01/07/2016 J.P. Morgan (1,668,918) (0.22)USD 124,051,099 EUR 112,271,010 01/07/2016 J.P. Morgan (753,841) (0.11)EUR 27,979 USD 31,113 08/07/2016 J.P. Morgan (6) 0.00USD 16,465 EUR 14,884 08/07/2016 J.P. Morgan (83) 0.00
Unrealised Loss on NAV Hedged Share Classes Forward Currency Exchange Contracts (2,422,848) (0.33)
Total Unrealised Loss on Forward Currency Exchange Contracts (2,422,848) (0.33)
Net Unrealised Loss on Forward Currency Exchange Contracts (1,691,298) (0.23)
DERIVATIVES
Over-the-counter (OTC) and exchange traded derivatives as at 30 June 2016, expressed in US dollars.

95 Morgan Stanley Investment Funds 30 June 2016
The accompanying notes are an integral part of these financial statements.
Please refer to the full prospectus for the Fund’s investment objective and policy.
INVESTMENT AIM
To seek to maximise total return, measured in US dollars, through investment in the debt securities of government and government-related issuers located in emerging market countries together with investing in the debt securities of corporate issuers located in or organised under the laws of Emerging Market countries.
SCHEDULE OF INVESTMENTSAs at 30 June 2016
Investments Currency
Quantity/Nominal
Value
Market Value USD
% of Net Assets
Transferable securities and money market instruments admitted to official exchange listing or dealt in on another regulated market
Corporate Bonds
ArgentinaBanco de la Provincia de Buenos Aires,
Reg. S 5.75% 15/06/2019 USD 1,530,000 1,553,524 0.63City of Buenos Aires Argentina, Reg. S
7.5% 01/06/2027 USD 1,920,000 2,004,355 0.82IRSA Propiedades Comerciales SA, Reg. S
8.75% 23/03/2023 USD 510,000 542,632 0.22Provincia de Cordoba, Reg. S 7.125%
10/06/2021 USD 1,596,000 1,603,469 0.65
5,703,980 2.32
BrazilBanco Safra SA, Reg. S 6.75%
27/01/2021 (1) USD 830,000 881,045 0.36Brazil Minas SPE, Reg. S 5.333%
15/02/2028 (Cayman Islands) (2) USD 3,235,000 2,879,150 1.17CIMPOR Financial Operations BV, 144A
5.75% 17/07/2024 (Netherlands) (2) USD 2,384,000 1,776,080 0.72Minerva Luxembourg SA, FRN, 144A
8.75% Perpetual (Luxembourg) (2) USD 1,420,000 1,437,750 0.59Petrobras Global Finance BV 8.375%
23/05/2021 (Netherlands) (2) USD 3,140,000 3,252,883 1.32
10,226,908 4.16
ChileColbun SA, 144A 4.5% 10/07/2024 USD 672,000 702,897 0.28Empresa Electrica Angamos SA, 144A
4.875% 25/05/2029 USD 2,020,000 1,960,390 0.80Empresa Nacional del Petroleo, Reg. S
5.25% 10/08/2020 USD 2,500,000 2,709,620 1.10Empresa Nacional del Petroleo, Reg. S
4.75% 06/12/2021 USD 1,450,000 1,541,070 0.63
6,913,977 2.81
ChinaSinopec Group Overseas Development
2013 Ltd., Reg. S 4.375% 17/10/2023 (British Virgin Islands) (2) USD 2,280,000 2,474,272 1.01
Sinopec Group Overseas Development 2014 Ltd., Reg. S 4.375% 10/04/2024 (British Virgin Islands) (2) USD 1,700,000 1,849,588 0.75
Sinopec Group Overseas Development 2015 Ltd., Reg. S 3.25% 28/04/2025 (British Virgin Islands) (2) USD 1,135,000 1,150,956 0.47
Three Gorges Finance I Cayman Islands Ltd., Reg. S 2.3% 02/06/2021 (Cayman Islands) (2) USD 2,170,000 2,202,594 0.89
Three Gorges Finance I Cayman Islands Ltd., Reg. S 3.7% 10/06/2025 (Cayman Islands) (2) USD 1,072,000 1,154,265 0.47
8,831,675 3.59
GhanaSaderea Ltd., Reg. S 12.5% 30/11/2026
(Ireland) (2) USD 3,478,668 2,904,688 1.18
2,904,688 1.18
Emerging Markets Debt Fund

Morgan Stanley Investment Funds 30 June 2016 96
The accompanying notes are an integral part of these financial statements.
Emerging Markets Debt Fund (continued)
SCHEDULE OF INVESTMENTSAs at 30 June 2016
Investments Currency
Quantity/Nominal
Value
Market Value USD
% of Net Assets
Transferable securities and money market instruments admitted to official exchange listing or dealt in on another regulated market
Corporate Bonds (continued)
IndonesiaMajapahit Holding BV, Reg. S 7.75%
20/01/2020 (Netherlands) (1) (2) USD 340,000 389,353 0.16Pertamina Persero PT, 144A 6.45%
30/05/2044 USD 2,440,000 2,574,686 1.05Pertamina Persero PT, Reg. S 5.25%
23/05/2021 USD 500,000 536,450 0.22Pertamina Persero PT, Reg. S 4.875%
03/05/2022 USD 1,270,000 1,336,169 0.54Pertamina Persero PT, Reg. S 4.3%
20/05/2023 USD 766,000 783,315 0.32
5,619,973 2.29
JamaicaDigicel Group Ltd., Reg. S 8.25%
30/09/2020 (Bermuda) (2) USD 1,270,000 1,062,038 0.43
1,062,038 0.43
KazakhstanDevelopment Bank of Kazakhstan JSC,
Reg. S 4.125% 10/12/2022 USD 950,000 928,815 0.38KazAgro National Management Holding
JSC, 144A 4.625% 24/05/2023 USD 1,490,000 1,368,937 0.55KazMunayGas National Co. JSC, Reg. S
9.125% 02/07/2018 USD 1,870,000 2,066,350 0.84KazMunayGas National Co. JSC, Reg. S
6.375% 09/04/2021 USD 380,000 414,200 0.17
4,778,302 1.94
MexicoAlfa SAB de CV, Reg. S 6.875%
25/03/2044 USD 1,330,000 1,376,550 0.56Fermaca Enterprises S de RL de CV, 144A
6.375% 30/03/2038 USD 1,372,045 1,348,035 0.55Nemak SAB de CV, Reg. S 5.5%
28/02/2023 USD 1,590,000 1,653,600 0.67Petroleos Mexicanos 4.875% 24/01/2022 USD 1,487,000 1,516,740 0.62Petroleos Mexicanos 8.625% 01/12/2023 USD 1,000,000 1,185,000 0.48Petroleos Mexicanos 6.625% 15/06/2035 USD 3,451,000 3,579,446 1.45Petroleos Mexicanos 6.625% 15/06/2038 USD 5,375,000 5,451,298 2.22Petroleos Mexicanos 6.5% 02/06/2041 USD 550,000 558,250 0.23Petroleos Mexicanos 5.625% 23/01/2046 USD 2,000,000 1,822,300 0.74Petroleos Mexicanos, Reg. S 6.875%
04/08/2026 USD 2,560,000 2,854,400 1.16
21,345,619 8.68
PanamaAeropuerto Internacional de Tocumen SA,
Reg. S 5.625% 18/05/2036 USD 1,600,000 1,608,000 0.65
1,608,000 0.65
PeruBanco de Credito del Peru, Reg. S, FRN
6.125% 24/04/2027 USD 1,470,000 1,613,472 0.66Corp. Financiera de Desarrollo SA, FRN,
144A 5.25% 15/07/2029 USD 1,224,000 1,260,720 0.51
SCHEDULE OF INVESTMENTSAs at 30 June 2016
Investments Currency
Quantity/Nominal
Value
Market Value USD
% of Net Assets
Transferable securities and money market instruments admitted to official exchange listing or dealt in on another regulated market
Corporate Bonds (continued)
Peru (continued)Fondo MIVIVIENDA SA, Reg. S 3.5%
31/01/2023 USD 505,000 505,016 0.21Lima Metro Line 2 Finance Ltd., Reg. S
5.875% 05/07/2034 (Cayman Islands) (2) USD 1,368,000 1,432,980 0.58
Union Andina de Cementos SAA, Reg. S 5.875% 30/10/2021 USD 750,000 764,925 0.31
5,577,113 2.27
RussiaSCF Capital Ltd., Reg. S 5.375%
16/06/2023 (Ireland) (2) USD 2,110,000 2,125,213 0.87
2,125,213 0.87
South AfricaEskom Holdings SOC Ltd., Reg. S 5.75%
26/01/2021 (1) USD 2,056,000 2,029,272 0.83Eskom Holdings SOC Ltd., Reg. S 7.125%
11/02/2025 (1) USD 2,670,000 2,635,290 1.07
4,664,562 1.90
TunisiaBanque Centrale de Tunisie International
Bond, Reg. S 5.75% 30/01/2025 USD 1,320,000 1,200,448 0.49
1,200,448 0.49
TurkeyExport Credit Bank of Turkey, Reg. S
5.875% 24/04/2019 USD 2,230,000 2,370,512 0.97
2,370,512 0.97
VenezuelaPetroleos de Venezuela SA, Reg. S 6%
15/11/2026 USD 32,300,000 11,463,270 4.66
11,463,270 4.66
Total Corporate Bonds 96,396,278 39.21
Government Bonds
ArgentinaArgentine Republic Government
International Bond, Reg. S 6.875% 22/04/2021 USD 2,590,000 2,764,825 1.13
Argentine Republic Government International Bond, Reg. S 7.5% 22/04/2026 (1) USD 2,900,000 3,168,250 1.29
Argentine Republic Government International Bond, Reg. S 7.625% 22/04/2046 USD 790,000 863,865 0.35
Argentine Republic Government International Bond, STEP 2.5% 31/12/2038 USD 2,300,000 1,555,950 0.63

97 Morgan Stanley Investment Funds 30 June 2016
The accompanying notes are an integral part of these financial statements.
Emerging Markets Debt Fund (continued)
SCHEDULE OF INVESTMENTSAs at 30 June 2016
Investments Currency
Quantity/Nominal
Value
Market Value USD
% of Net Assets
Transferable securities and money market instruments admitted to official exchange listing or dealt in on another regulated market
Government Bonds (continued)
Argentina (continued)Letras del Banco Central de la Republica
Argentina 0% 28/12/2016 ARS 31,220,000 1,735,095 0.71Letras del Banco Central de la Republica
Argentina 0% 11/01/2017 ARS 6,190,000 350,250 0.14Republic of Argentina, FRN 33.423%
09/10/2017 ARS 15,540,000 1,141,774 0.46
11,580,009 4.71
BrazilBrazilian Government International Bond
4.25% 07/01/2025 USD 1,500,000 1,471,875 0.60Brazilian Government International Bond
5% 27/01/2045 USD 3,793,000 3,389,045 1.38
4,860,920 1.98
ColombiaColombia Government International Bond
11.75% 25/02/2020 USD 640,000 846,400 0.34Colombia Government International Bond
4.375% 12/07/2021 USD 1,852,000 1,990,900 0.81Colombia Government International Bond
5% 15/06/2045 USD 2,750,000 2,846,250 1.16
5,683,550 2.31
Côte d’IvoireIvory Coast Government International Bond,
144A 5.375% 23/07/2024 USD 1,350,000 1,266,010 0.52Ivory Coast Government International Bond,
Reg. S, STEP 5.75% 31/12/2032 USD 2,267,100 2,119,738 0.86
3,385,748 1.38
Dominican RepublicDominican Republic International Bond,
144A 7.45% 30/04/2044 USD 359,000 394,002 0.16Dominican Republic International Bond,
144A 6.85% 27/01/2045 USD 2,100,000 2,173,500 0.88Dominican Republic International Bond,
Reg. S 6.875% 29/01/2026 USD 1,400,000 1,536,500 0.63Dominican Republic International Bond,
Reg. S 6.85% 27/01/2045 USD 2,638,000 2,730,330 1.11
6,834,332 2.78
GabonGabon Government International Bond,
Reg. S 6.95% 16/06/2025 USD 640,000 563,200 0.23
563,200 0.23
GuatemalaGuatemala Government Bond, Reg. S 4.5%
03/05/2026 USD 930,000 945,113 0.38
945,113 0.38
SCHEDULE OF INVESTMENTSAs at 30 June 2016
Investments Currency
Quantity/Nominal
Value
Market Value USD
% of Net Assets
Transferable securities and money market instruments admitted to official exchange listing or dealt in on another regulated market
Government Bonds (continued)
HondurasHonduras Government International Bond,
Reg. S 8.75% 16/12/2020 USD 1,240,000 1,395,000 0.57
1,395,000 0.57
HungaryHungary Government International Bond
4% 25/03/2019 USD 534,000 554,865 0.22Hungary Government International Bond
6.375% 29/03/2021 USD 1,050,000 1,197,735 0.49Hungary Government International Bond
5.75% 22/11/2023 USD 180,000 205,020 0.08Hungary Government International Bond
5.375% 25/03/2024 USD 1,774,000 1,986,215 0.81Hungary Government International Bond
7.625% 29/03/2041 USD 2,250,000 3,266,606 1.33
7,210,441 2.93
IndonesiaIndonesia Government International Bond,
144A 5.875% 15/01/2024 USD 2,000,000 2,311,416 0.94Indonesia Government International Bond,
Reg. S 5.875% 15/01/2024 USD 3,620,000 4,183,663 1.70Indonesia Government International Bond,
Reg. S 4.125% 15/01/2025 USD 1,400,000 1,463,381 0.60Indonesia Government International Bond,
Reg. S 4.75% 08/01/2026 USD 2,150,000 2,359,674 0.96Indonesia Government International Bond,
Reg. S 7.75% 17/01/2038 USD 2,637,000 3,598,964 1.46Indonesia Government International Bond,
Reg. S 5.125% 15/01/2045 USD 600,000 643,765 0.26Indonesia Government International Bond,
Reg. S 5.95% 08/01/2046 (1) USD 2,300,000 2,706,569 1.10
17,267,432 7.02
IraqIraq International Bond, Reg. S 5.8%
15/01/2028 USD 900,000 690,750 0.28
690,750 0.28
JamaicaJamaica Government International Bond
7.625% 09/07/2025 USD 230,000 257,025 0.11Jamaica Government International Bond
7.875% 28/07/2045 USD 1,290,000 1,380,300 0.56
1,637,325 0.67
KazakhstanKazakhstan Government International
Bond, Reg. S 5.125% 21/07/2025 (1) USD 1,900,000 2,081,317 0.85
2,081,317 0.85
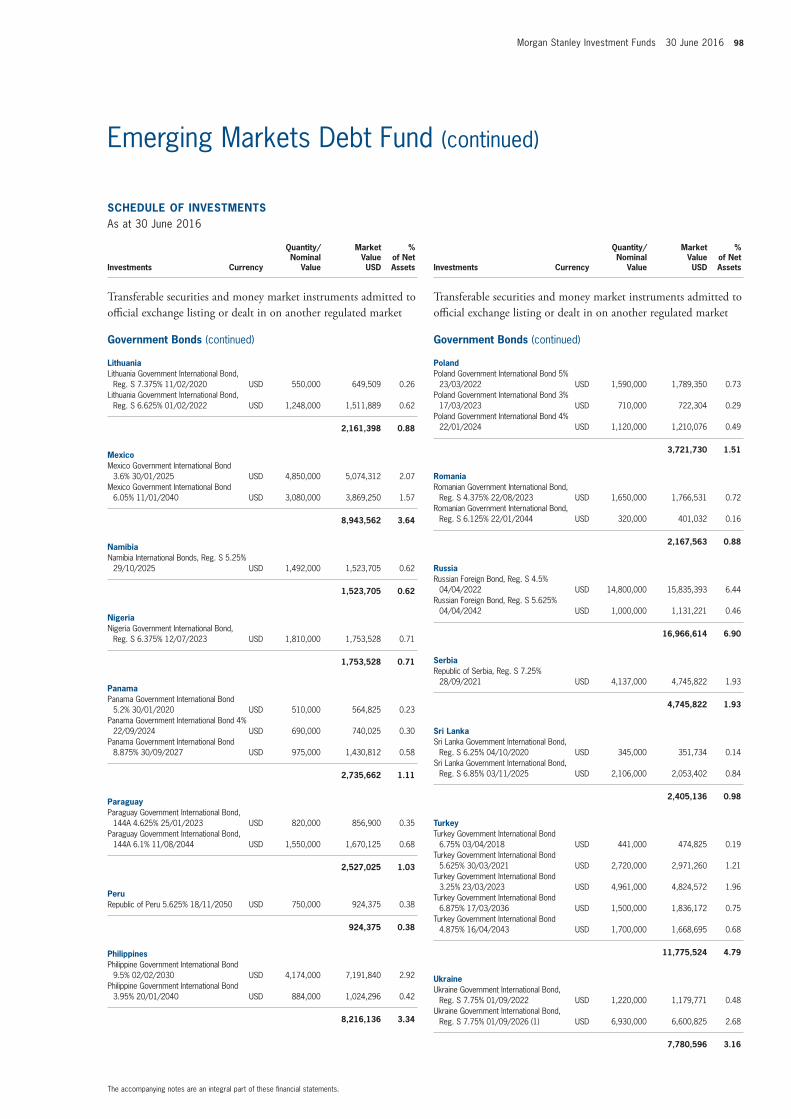
Morgan Stanley Investment Funds 30 June 2016 98
The accompanying notes are an integral part of these financial statements.
Emerging Markets Debt Fund (continued)
SCHEDULE OF INVESTMENTSAs at 30 June 2016
Investments Currency
Quantity/Nominal
Value
Market Value USD
% of Net Assets
Transferable securities and money market instruments admitted to official exchange listing or dealt in on another regulated market
Government Bonds (continued)
LithuaniaLithuania Government International Bond,
Reg. S 7.375% 11/02/2020 USD 550,000 649,509 0.26Lithuania Government International Bond,
Reg. S 6.625% 01/02/2022 USD 1,248,000 1,511,889 0.62
2,161,398 0.88
MexicoMexico Government International Bond
3.6% 30/01/2025 USD 4,850,000 5,074,312 2.07Mexico Government International Bond
6.05% 11/01/2040 USD 3,080,000 3,869,250 1.57
8,943,562 3.64
NamibiaNamibia International Bonds, Reg. S 5.25%
29/10/2025 USD 1,492,000 1,523,705 0.62
1,523,705 0.62
NigeriaNigeria Government International Bond,
Reg. S 6.375% 12/07/2023 USD 1,810,000 1,753,528 0.71
1,753,528 0.71
PanamaPanama Government International Bond
5.2% 30/01/2020 USD 510,000 564,825 0.23Panama Government International Bond 4%
22/09/2024 USD 690,000 740,025 0.30Panama Government International Bond
8.875% 30/09/2027 USD 975,000 1,430,812 0.58
2,735,662 1.11
ParaguayParaguay Government International Bond,
144A 4.625% 25/01/2023 USD 820,000 856,900 0.35Paraguay Government International Bond,
144A 6.1% 11/08/2044 USD 1,550,000 1,670,125 0.68
2,527,025 1.03
PeruRepublic of Peru 5.625% 18/11/2050 USD 750,000 924,375 0.38
924,375 0.38
PhilippinesPhilippine Government International Bond
9.5% 02/02/2030 USD 4,174,000 7,191,840 2.92Philippine Government International Bond
3.95% 20/01/2040 USD 884,000 1,024,296 0.42
8,216,136 3.34
SCHEDULE OF INVESTMENTSAs at 30 June 2016
Investments Currency
Quantity/Nominal
Value
Market Value USD
% of Net Assets
Transferable securities and money market instruments admitted to official exchange listing or dealt in on another regulated market
Government Bonds (continued)
PolandPoland Government International Bond 5%
23/03/2022 USD 1,590,000 1,789,350 0.73Poland Government International Bond 3%
17/03/2023 USD 710,000 722,304 0.29Poland Government International Bond 4%
22/01/2024 USD 1,120,000 1,210,076 0.49
3,721,730 1.51
RomaniaRomanian Government International Bond,
Reg. S 4.375% 22/08/2023 USD 1,650,000 1,766,531 0.72Romanian Government International Bond,
Reg. S 6.125% 22/01/2044 USD 320,000 401,032 0.16
2,167,563 0.88
RussiaRussian Foreign Bond, Reg. S 4.5%
04/04/2022 USD 14,800,000 15,835,393 6.44Russian Foreign Bond, Reg. S 5.625%
04/04/2042 USD 1,000,000 1,131,221 0.46
16,966,614 6.90
SerbiaRepublic of Serbia, Reg. S 7.25%
28/09/2021 USD 4,137,000 4,745,822 1.93
4,745,822 1.93
Sri LankaSri Lanka Government International Bond,
Reg. S 6.25% 04/10/2020 USD 345,000 351,734 0.14Sri Lanka Government International Bond,
Reg. S 6.85% 03/11/2025 USD 2,106,000 2,053,402 0.84
2,405,136 0.98
TurkeyTurkey Government International Bond
6.75% 03/04/2018 USD 441,000 474,825 0.19Turkey Government International Bond
5.625% 30/03/2021 USD 2,720,000 2,971,260 1.21Turkey Government International Bond
3.25% 23/03/2023 USD 4,961,000 4,824,572 1.96Turkey Government International Bond
6.875% 17/03/2036 USD 1,500,000 1,836,172 0.75Turkey Government International Bond
4.875% 16/04/2043 USD 1,700,000 1,668,695 0.68
11,775,524 4.79
UkraineUkraine Government International Bond,
Reg. S 7.75% 01/09/2022 USD 1,220,000 1,179,771 0.48Ukraine Government International Bond,
Reg. S 7.75% 01/09/2026 (1) USD 6,930,000 6,600,825 2.68
7,780,596 3.16

99 Morgan Stanley Investment Funds 30 June 2016
The accompanying notes are an integral part of these financial statements.
Emerging Markets Debt Fund (continued)
SCHEDULE OF INVESTMENTSAs at 30 June 2016
Investments Currency
Quantity/Nominal
Value
Market Value USD
% of Net Assets
Transferable securities and money market instruments admitted to official exchange listing or dealt in on another regulated market
Government Bonds (continued)
VenezuelaVenezuela Government International Bond,
FRN 0% 15/04/2020 USD 852,000 26,727 0.01
26,727 0.01
ZambiaZambia Government International Bond,
Reg. S 8.5% 14/04/2024 (1) USD 1,600,000 1,388,000 0.56Zambia Government International Bond,
Reg. S 8.97% 30/07/2027 USD 875,000 759,063 0.31
2,147,063 0.87
Total Government Bonds 144,657,303 58.83
Warrants
NigeriaCentral Bank of Nigeria 15/11/2020 USD 2,000 152,500 0.06
152,500 0.06
Total Warrants 152,500 0.06
Total Transferable securities and money market instruments admitted to official exchange listing or dealt in on another regulated market 241,206,081 98.10
Units of authorised UCITS or other collective investment undertakings
Collective Investment Schemes – UCITS
LuxembourgMorgan Stanley Liquidity Funds US Dollar
Liquidity Fund – MS Reserve (4) USD 4,925,325 4,925,325 2.00
4,925,325 2.00
Total Collective Investment Schemes – UCITS 4,925,325 2.00
Total Units of authorised UCITS or other collective investment undertakings 4,925,325 2.00
Total Investments 246,131,406 100.10
Cash 883,530 0.36
Other Assets/(Liabilities) (1,142,186) (0.46)
Total Net Assets 245,872,750 100.00
(1) All or part of this position is out on loan.(2) The country in brackets represents the country of incorporation of this security.(4) Affiliate managed by an affiliate of the Investment Adviser.
Financial Futures Contracts
Security DescriptionNumber of Contracts Currency
Global Exposure
USD
Unrealised Gain/(Loss)
USD
% of Net Assets
US 10 Year Note, 21/09/2016 (85) USD (11,298,359) (302,984) (0.12)
Unrealised Loss on Financial Futures Contracts (302,984) (0.12)
Total Unrealised Loss on Financial Futures Contracts (302,984) (0.12)
Net Unrealised Loss on Financial Futures Contracts (302,984) (0.12)
Forward Currency Exchange Contracts
Currency Purchased
Amount Purchased
Currency Sold
Amount Sold
Maturity Date Counterparty
Unrealised Gain/(Loss)
USD
% of Net Assets
USD 582,878 ARS 9,600,000 30/12/2016 Citibank 164 0.00USD 668,098 ARS 10,890,000 18/01/2017 Citibank 13,487 0.00
Unrealised Gain on Forward Currency Exchange Contracts 13,651 0.00
EUR Hedged Share ClassEUR 90,053 USD 99,622 01/07/2016 J.P. Morgan 485 0.00USD 1,871,134 EUR 1,653,198 01/07/2016 J.P. Morgan 33,373 0.01EUR 44,443,640 USD 49,119,999 08/07/2016 J.P. Morgan 292,108 0.13USD 2,815,105 EUR 2,531,540 08/07/2016 J.P. Morgan 558 0.00
Unrealised Gain on NAV Hedged Share Classes Forward Currency Exchange Contracts 326,524 0.14
Total Unrealised Gain on Forward Currency Exchange Contracts 340,175 0.14
USD 787,012 ARS 13,210,000 30/12/2016 Citibank (14,827) 0.00USD 1,358,799 ARS 24,900,000 13/06/2017 Citibank (31,394) (0.01)
Unrealised Loss on Forward Currency Exchange Contracts (46,221) (0.01)
EUR Hedged Share ClassEUR 45,946,386 USD 51,760,514 01/07/2016 J.P. Morgan (684,674) (0.28)USD 49,039,014 EUR 44,383,242 01/07/2016 J.P. Morgan (299,170) (0.13)EUR 55,971 USD 62,241 08/07/2016 J.P. Morgan (13) 0.00USD 2,952 EUR 2,669 08/07/2016 J.P. Morgan (15) 0.00
Unrealised Loss on NAV Hedged Share Classes Forward Currency Exchange Contracts (983,872) (0.41)
Total Unrealised Loss on Forward Currency Exchange Contracts (1,030,093) (0.42)
Net Unrealised Loss on Forward Currency Exchange Contracts (689,918) (0.28)
Collateral received and paid by the Fund in respect of financial derivative instruments:
Type of Collateral Counterparty CurrencyCollateral Amount
receivedCollateral Amount
paid
Emerging Markets Debt Fund
Cash Goldman Sachs USD 478,375 -
478,375 -
DERIVATIVES
Over-the-counter (OTC) and exchange traded derivatives as at 30 June 2016, expressed in US dollars.
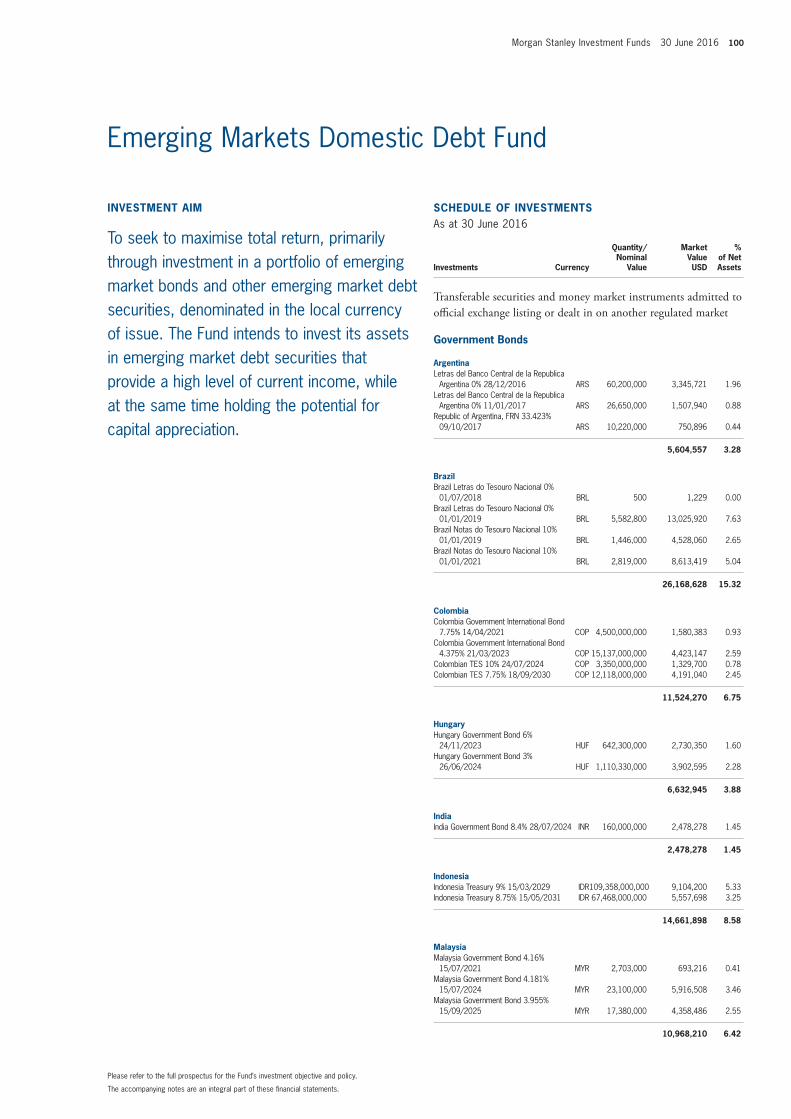
Morgan Stanley Investment Funds 30 June 2016 100
The accompanying notes are an integral part of these financial statements.
Please refer to the full prospectus for the Fund’s investment objective and policy.
SCHEDULE OF INVESTMENTSAs at 30 June 2016
Investments Currency
Quantity/Nominal
Value
Market Value USD
% of Net Assets
Transferable securities and money market instruments admitted to official exchange listing or dealt in on another regulated market
Government Bonds
ArgentinaLetras del Banco Central de la Republica
Argentina 0% 28/12/2016 ARS 60,200,000 3,345,721 1.96Letras del Banco Central de la Republica
Argentina 0% 11/01/2017 ARS 26,650,000 1,507,940 0.88Republic of Argentina, FRN 33.423%
09/10/2017 ARS 10,220,000 750,896 0.44
5,604,557 3.28
BrazilBrazil Letras do Tesouro Nacional 0%
01/07/2018 BRL 500 1,229 0.00Brazil Letras do Tesouro Nacional 0%
01/01/2019 BRL 5,582,800 13,025,920 7.63Brazil Notas do Tesouro Nacional 10%
01/01/2019 BRL 1,446,000 4,528,060 2.65Brazil Notas do Tesouro Nacional 10%
01/01/2021 BRL 2,819,000 8,613,419 5.04
26,168,628 15.32
ColombiaColombia Government International Bond
7.75% 14/04/2021 COP 4,500,000,000 1,580,383 0.93Colombia Government International Bond
4.375% 21/03/2023 COP 15,137,000,000 4,423,147 2.59Colombian TES 10% 24/07/2024 COP 3,350,000,000 1,329,700 0.78Colombian TES 7.75% 18/09/2030 COP 12,118,000,000 4,191,040 2.45
11,524,270 6.75
HungaryHungary Government Bond 6%
24/11/2023 HUF 642,300,000 2,730,350 1.60Hungary Government Bond 3%
26/06/2024 HUF 1,110,330,000 3,902,595 2.28
6,632,945 3.88
IndiaIndia Government Bond 8.4% 28/07/2024 INR 160,000,000 2,478,278 1.45
2,478,278 1.45
IndonesiaIndonesia Treasury 9% 15/03/2029 IDR109,358,000,000 9,104,200 5.33Indonesia Treasury 8.75% 15/05/2031 IDR 67,468,000,000 5,557,698 3.25
14,661,898 8.58
MalaysiaMalaysia Government Bond 4.16%
15/07/2021 MYR 2,703,000 693,216 0.41Malaysia Government Bond 4.181%
15/07/2024 MYR 23,100,000 5,916,508 3.46Malaysia Government Bond 3.955%
15/09/2025 MYR 17,380,000 4,358,486 2.55
10,968,210 6.42
INVESTMENT AIM
To seek to maximise total return, primarily through investment in a portfolio of emerging market bonds and other emerging market debt securities, denominated in the local currency of issue. The Fund intends to invest its assets in emerging market debt securities that provide a high level of current income, while at the same time holding the potential for capital appreciation.
Emerging Markets Domestic Debt Fund
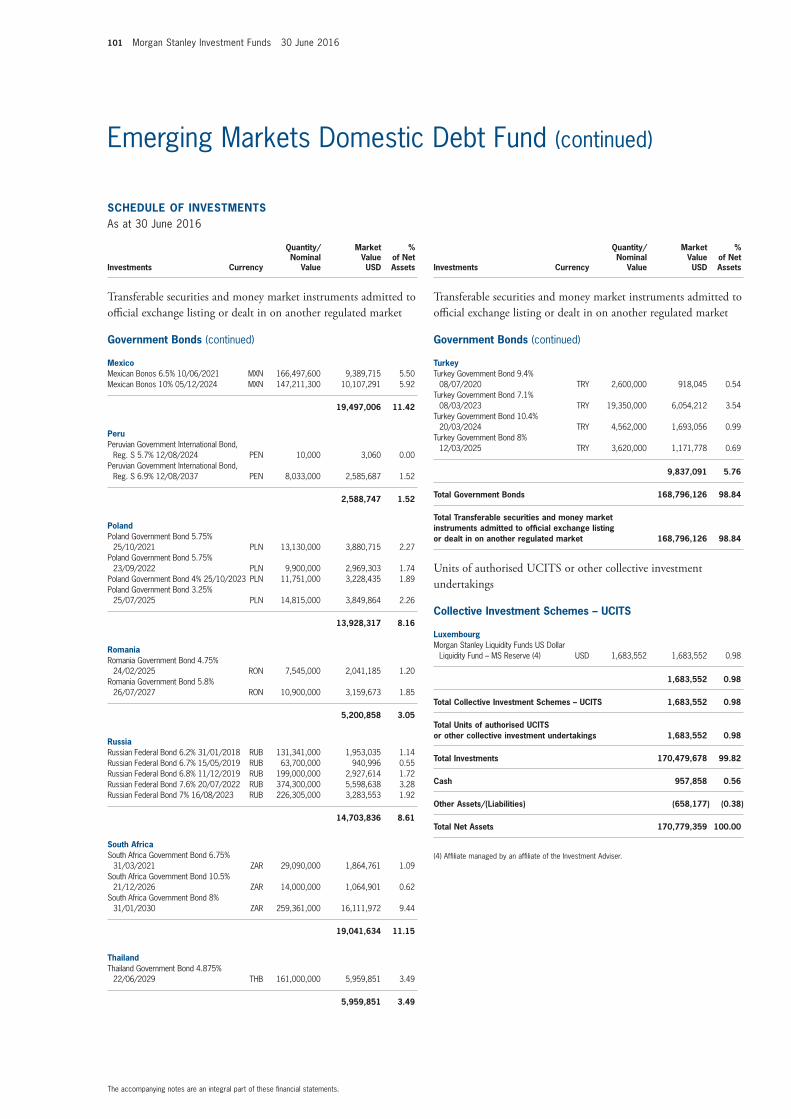
101 Morgan Stanley Investment Funds 30 June 2016
The accompanying notes are an integral part of these financial statements.
Emerging Markets Domestic Debt Fund (continued)
SCHEDULE OF INVESTMENTSAs at 30 June 2016
Investments Currency
Quantity/Nominal
Value
Market Value USD
% of Net Assets
Transferable securities and money market instruments admitted to official exchange listing or dealt in on another regulated market
Government Bonds (continued)
MexicoMexican Bonos 6.5% 10/06/2021 MXN 166,497,600 9,389,715 5.50Mexican Bonos 10% 05/12/2024 MXN 147,211,300 10,107,291 5.92
19,497,006 11.42
PeruPeruvian Government International Bond,
Reg. S 5.7% 12/08/2024 PEN 10,000 3,060 0.00Peruvian Government International Bond,
Reg. S 6.9% 12/08/2037 PEN 8,033,000 2,585,687 1.52
2,588,747 1.52
PolandPoland Government Bond 5.75%
25/10/2021 PLN 13,130,000 3,880,715 2.27Poland Government Bond 5.75%
23/09/2022 PLN 9,900,000 2,969,303 1.74Poland Government Bond 4% 25/10/2023 PLN 11,751,000 3,228,435 1.89Poland Government Bond 3.25%
25/07/2025 PLN 14,815,000 3,849,864 2.26
13,928,317 8.16
RomaniaRomania Government Bond 4.75%
24/02/2025 RON 7,545,000 2,041,185 1.20Romania Government Bond 5.8%
26/07/2027 RON 10,900,000 3,159,673 1.85
5,200,858 3.05
RussiaRussian Federal Bond 6.2% 31/01/2018 RUB 131,341,000 1,953,035 1.14Russian Federal Bond 6.7% 15/05/2019 RUB 63,700,000 940,996 0.55Russian Federal Bond 6.8% 11/12/2019 RUB 199,000,000 2,927,614 1.72Russian Federal Bond 7.6% 20/07/2022 RUB 374,300,000 5,598,638 3.28Russian Federal Bond 7% 16/08/2023 RUB 226,305,000 3,283,553 1.92
14,703,836 8.61
South AfricaSouth Africa Government Bond 6.75%
31/03/2021 ZAR 29,090,000 1,864,761 1.09South Africa Government Bond 10.5%
21/12/2026 ZAR 14,000,000 1,064,901 0.62South Africa Government Bond 8%
31/01/2030 ZAR 259,361,000 16,111,972 9.44
19,041,634 11.15
ThailandThailand Government Bond 4.875%
22/06/2029 THB 161,000,000 5,959,851 3.49
5,959,851 3.49
SCHEDULE OF INVESTMENTSAs at 30 June 2016
Investments Currency
Quantity/Nominal
Value
Market Value USD
% of Net Assets
Transferable securities and money market instruments admitted to official exchange listing or dealt in on another regulated market
Government Bonds (continued)
TurkeyTurkey Government Bond 9.4%
08/07/2020 TRY 2,600,000 918,045 0.54Turkey Government Bond 7.1%
08/03/2023 TRY 19,350,000 6,054,212 3.54Turkey Government Bond 10.4%
20/03/2024 TRY 4,562,000 1,693,056 0.99Turkey Government Bond 8%
12/03/2025 TRY 3,620,000 1,171,778 0.69
9,837,091 5.76
Total Government Bonds 168,796,126 98.84
Total Transferable securities and money market instruments admitted to official exchange listing or dealt in on another regulated market 168,796,126 98.84
Units of authorised UCITS or other collective investment undertakings
Collective Investment Schemes – UCITS
LuxembourgMorgan Stanley Liquidity Funds US Dollar
Liquidity Fund – MS Reserve (4) USD 1,683,552 1,683,552 0.98
1,683,552 0.98
Total Collective Investment Schemes – UCITS 1,683,552 0.98
Total Units of authorised UCITS or other collective investment undertakings 1,683,552 0.98
Total Investments 170,479,678 99.82
Cash 957,858 0.56
Other Assets/(Liabilities) (658,177) (0.38)
Total Net Assets 170,779,359 100.00
(4) Affiliate managed by an affiliate of the Investment Adviser.

Morgan Stanley Investment Funds 30 June 2016 102
The accompanying notes are an integral part of these financial statements.
Emerging Markets Domestic Debt Fund (continued)
Forward Currency Exchange Contracts (continued)
Currency Purchased
Amount Purchased
Currency Sold
Amount Sold
Maturity Date Counterparty
Unrealised Gain/(Loss)
USD
% of Net Assets
USD 1,665,289 TRY 4,870,000 18/07/2016 J.P. Morgan (17,213) (0.01)PHP 74,600,000 USD 1,595,121 21/07/2016 J.P. Morgan (12,164) (0.01)HUF 1,168,512,907 USD 4,180,874 22/07/2016 J.P. Morgan (80,555) (0.05)INR 52,300,000 USD 772,754 22/07/2016 J.P. Morgan (813) 0.00PLN 5,114,418 USD 1,307,208 22/07/2016 J.P. Morgan (20,811) (0.01)RON 2,682,000 USD 666,695 22/07/2016 J.P. Morgan (7,044) 0.00USD 1,947,640 HUF 563,000,000 22/07/2016 J.P. Morgan (27,931) (0.01)USD 5,812,056 INR 396,500,000 22/07/2016 J.P. Morgan (40,235) (0.02)USD 1,577,938 PLN 6,500,000 22/07/2016 J.P. Morgan (56,965) (0.03)USD 1,224,152 RON 5,000,000 22/07/2016 J.P. Morgan (5,622) 0.00USD 2,840,588 THB 100,500,000 22/07/2016 J.P. Morgan (20,399) (0.01)USD 2,433,616 ZAR 36,170,000 22/07/2016 J.P. Morgan (14,958) (0.01)COP 1,387,500,000 USD 475,578 27/07/2016 J.P. Morgan (3,992) 0.00USD 7,647,039 BRL 25,065,000 02/08/2016 J.P. Morgan (86,428) (0.06)USD 1,791,482 ARS 30,070,000 30/12/2016 Citibank (33,748) (0.02)USD 898,226 ARS 16,460,000 13/06/2017 Citibank (20,753) (0.01)
Unrealised Loss on Forward Currency Exchange Contracts (3,054,482) (1.79)
EUR Hedged Share ClassEUR 16,708,365 USD 18,822,739 01/07/2016 J.P. Morgan (249,053) (0.14)USD 18,572,299 EUR 16,809,138 01/07/2016 J.P. Morgan (113,411) (0.07)EUR 43,955 USD 48,879 08/07/2016 J.P. Morgan (10) 0.00
Unrealised Loss on NAV Hedged Share Classes Forward Currency Exchange Contracts (362,474) (0.21)
Total Unrealised Loss on Forward Currency Exchange Contracts (3,416,956) (2.00)
Net Unrealised Loss on Forward Currency Exchange Contracts (1,091,462) (0.64)
Collateral received and paid by the Fund in respect of financial derivative instruments:
Type of Collateral Counterparty CurrencyCollateral Amount
receivedCollateral Amount
paid
Emerging Markets Domestic Debt Fund
Cash Goldman Sachs USD 146,371 126,533Cash J.P. Morgan USD - 500,000
146,371 626,533
Financial Futures Contracts
Security DescriptionNumber of Contracts Currency
Global Exposure
USD
Unrealised Gain/(Loss)
USD
% of Net Assets
Euro-Bobl, 08/09/2016 (6) EUR (890,757) (4,926) 0.00
Unrealised Loss on Financial Futures Contracts (4,926) 0.00
Total Unrealised Loss on Financial Futures Contracts (4,926) 0.00
Net Unrealised Loss on Financial Futures Contracts (4,926) 0.00
Forward Currency Exchange Contracts (continued)
Currency Purchased
Amount Purchased
Currency Sold
Amount Sold
Maturity Date Counterparty
Unrealised Gain/(Loss)
USD
% of Net Assets
BRL 48,075,000 USD 14,091,665 05/07/2016 J.P. Morgan 873,823 0.51MYR 62,697,787 USD 15,187,741 05/07/2016 J.P. Morgan 399,681 0.24RUB 34,300,000 USD 525,295 05/07/2016 J.P. Morgan 8,263 0.00USD 5,185,187 MYR 20,797,787 05/07/2016 J.P. Morgan 14,608 0.01EUR 800,000 USD 889,120 08/07/2016 J.P. Morgan 314 0.00USD 1,649,372 EUR 1,470,000 08/07/2016 J.P. Morgan 15,036 0.01CLP 1,488,000,000 USD 2,167,169 11/07/2016 J.P. Morgan 77,591 0.05MXN 140,700,000 USD 7,484,851 11/07/2016 J.P. Morgan 105,006 0.06PEN 6,720,000 USD 2,021,904 11/07/2016 J.P. Morgan 17,550 0.01USD 8,242,167 MXN 150,163,212 11/07/2016 J.P. Morgan 141,831 0.08IDR 115,220,000,000 USD 8,621,635 18/07/2016 J.P. Morgan 125,292 0.08TRY 26,935,784 USD 9,140,922 18/07/2016 J.P. Morgan 164,930 0.09USD 828,541 PHP 38,900,000 21/07/2016 J.P. Morgan 3,112 0.00INR 171,000,000 USD 2,508,803 22/07/2016 J.P. Morgan 15,136 0.01PLN 4,400,000 USD 1,099,310 22/07/2016 J.P. Morgan 7,393 0.00THB 334,950,000 USD 9,504,570 22/07/2016 J.P. Morgan 30,630 0.02ZAR 6,500,000 USD 431,736 22/07/2016 J.P. Morgan 8,289 0.01COP 2,640,000,000 USD 871,575 27/07/2016 J.P. Morgan 25,714 0.02KRW 981,000,000 USD 839,682 29/07/2016 J.P. Morgan 11,945 0.01MYR 20,797,787 USD 5,182,862 29/07/2016 J.P. Morgan 25,026 0.01USD 5,923,461 RUB 380,526,077 29/07/2016 J.P. Morgan 41,889 0.02BRL 3,700,000 USD 1,130,634 02/08/2016 J.P. Morgan 10,951 0.01USD 473,588 ARS 7,800,000 30/12/2016 Citibank 133 0.00USD 2,143,104 ARS 34,220,000 18/01/2017 Citibank 86,099 0.04USD 803,371 ARS 14,300,000 13/06/2017 Citibank 4,987 0.00
Unrealised Gain on Forward Currency Exchange Contracts 2,215,229 1.29
EUR Hedged Share ClassEUR 114,657 USD 126,845 01/07/2016 J.P. Morgan 613 0.00USD 15,705 EUR 13,885 01/07/2016 J.P. Morgan 271 0.00EUR 16,643,717 USD 18,394,990 08/07/2016 J.P. Morgan 109,370 0.07USD 55,414 EUR 49,832 08/07/2016 J.P. Morgan 11 0.00
Unrealised Gain on NAV Hedged Share Classes Forward Currency Exchange Contracts 110,265 0.07
Total Unrealised Gain on Forward Currency Exchange Contracts 2,325,494 1.36
RUB 411,776,077 USD 6,449,303 05/07/2016 J.P. Morgan (43,868) (0.02)USD 13,290,980 BRL 48,075,000 05/07/2016 J.P. Morgan (1,674,509) (0.97)USD 10,191,427 MYR 41,900,000 05/07/2016 J.P. Morgan (225,415) (0.14)USD 6,670,724 RUB 446,076,077 05/07/2016 J.P. Morgan (268,270) (0.16)EUR 2,985,000 USD 3,380,074 08/07/2016 J.P. Morgan (61,375) (0.04)USD 2,437,116 EUR 2,200,000 08/07/2016 J.P. Morgan (8,828) (0.01)MXN 35,500,000 USD 1,938,126 11/07/2016 J.P. Morgan (23,129) (0.02)PEN 3,650,000 USD 1,111,449 11/07/2016 State Street (3,710) 0.00USD 1,996,074 CLP 1,369,170,000 11/07/2016 J.P. Morgan (69,420) (0.04)USD 3,726,911 MXN 70,600,000 11/07/2016 J.P. Morgan (81,503) (0.05)USD 2,492,419 PEN 8,300,000 11/07/2016 J.P. Morgan (26,549) (0.02)USD 4,962,974 IDR 66,933,400,000 18/07/2016 J.P. Morgan (118,275) (0.07)
DERIVATIVES
Over-the-counter (OTC) and exchange traded derivatives as at 30 June 2016, expressed in US dollars.
DERIVATIVES (continued)
Over-the-counter (OTC) and exchange traded derivatives as at 30 June 2016, expressed in US dollars.

103 Morgan Stanley Investment Funds 30 June 2016
The accompanying notes are an integral part of these financial statements.
Please refer to the full prospectus for the Fund’s investment objective and policy.
INVESTMENT AIM
To seek to maximise total return measured in US Dollars, primarily through investment in the Fixed Income Securities of issuers located in Emerging Market Countries or issues denominated in the currencies of Emerging Market Countries.
SCHEDULE OF INVESTMENTSAs at 30 June 2016
Investments Currency
Quantity/Nominal
Value
Market Value USD
% of Net Assets
Transferable securities and money market instruments admitted to official exchange listing or dealt in on another regulated market
Corporate Bonds
ArgentinaBanco de la Provincia de Buenos Aires,
Reg. S 5.75% 15/06/2019 USD 150,000 152,317 0.81City of Buenos Aires Argentina, Reg. S
7.5% 01/06/2027 USD 250,000 260,786 1.39IRSA Propiedades Comerciales SA, Reg. S
8.75% 23/03/2023 USD 270,000 287,306 1.54Provincia de Cordoba, Reg. S 7.125%
10/06/2021 USD 150,000 150,626 0.81YPF SA, Reg. S 8.875% 19/12/2018 USD 300,000 324,267 1.73
1,175,302 6.28
BrazilCosan Luxembourg SA, Reg. S 7%
20/01/2027 (Luxembourg) (2) USD 200,000 198,992 1.06Petrobras Global Finance BV 8.375%
23/05/2021 (Netherlands) (2) USD 200,000 206,300 1.10QGOG Constellation SA, Reg. S 6.25%
09/11/2019 (Luxembourg) (2) USD 200,000 98,851 0.53
504,143 2.69
ChileCencosud SA, Reg. S 4.875%
20/01/2023 USD 200,000 205,299 1.10Empresa Electrica Angamos SA, 144A
4.875% 25/05/2029 USD 200,000 193,981 1.03
399,280 2.13
ChinaKWG Property Holding Ltd., Reg. S 8.25%
05/08/2019 (Cayman Islands) (2) USD 400,000 433,584 2.32
433,584 2.32
ColombiaMillicom International Cellular SA, Reg. S
6.625% 15/10/2021 (Luxembourg) (2) USD 200,000 205,568 1.10
205,568 1.10
Dominican RepublicAES Andres BV, Reg. S 7.95%
11/05/2026 (Netherlands) (2) USD 200,000 208,297 1.11
208,297 1.11
IndiaABJA Investment Co. Pte. Ltd., Reg. S
5.95% 31/07/2024 (Singapore) (2) USD 200,000 188,755 1.01Greenko Dutch BV, Reg. S 8%
01/08/2019 (Netherlands) (2) USD 400,000 431,550 2.30
620,305 3.31
Emerging Markets Fixed Income Opportunities Fund
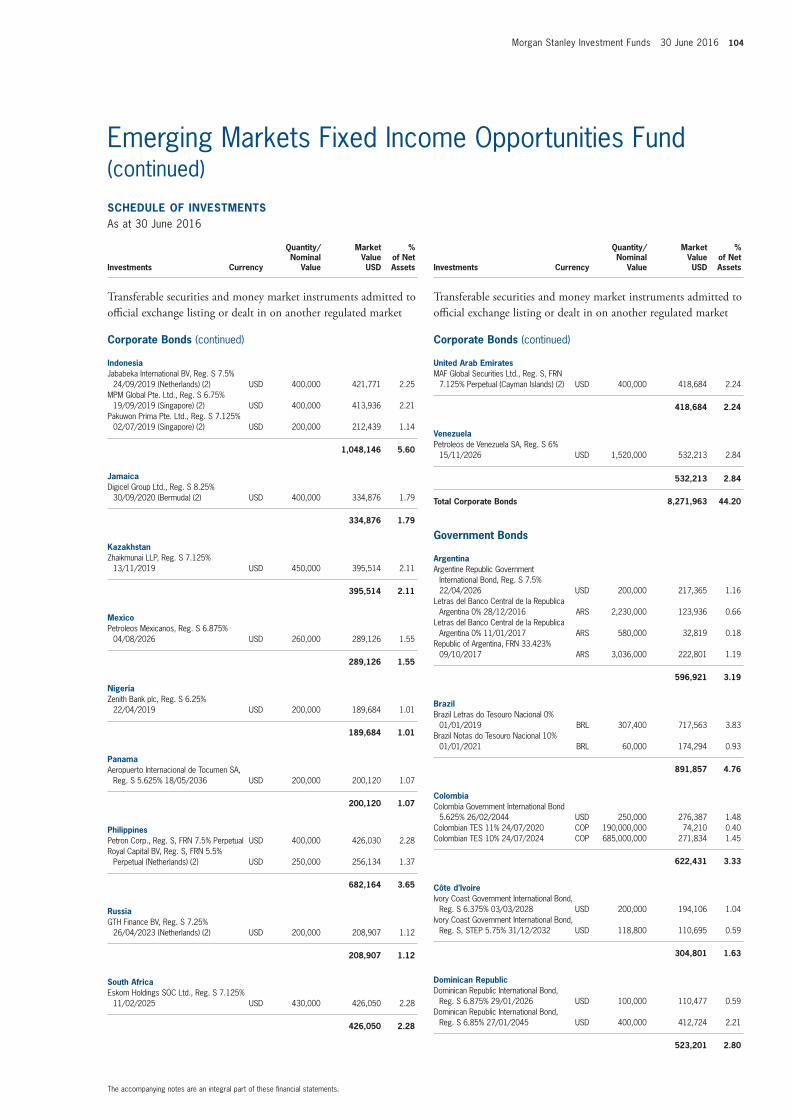
Morgan Stanley Investment Funds 30 June 2016 104
The accompanying notes are an integral part of these financial statements.
Emerging Markets Fixed Income Opportunities Fund (continued)
SCHEDULE OF INVESTMENTSAs at 30 June 2016
Investments Currency
Quantity/Nominal
Value
Market Value USD
% of Net Assets
Transferable securities and money market instruments admitted to official exchange listing or dealt in on another regulated market
Corporate Bonds (continued)
IndonesiaJababeka International BV, Reg. S 7.5%
24/09/2019 (Netherlands) (2) USD 400,000 421,771 2.25MPM Global Pte. Ltd., Reg. S 6.75%
19/09/2019 (Singapore) (2) USD 400,000 413,936 2.21Pakuwon Prima Pte. Ltd., Reg. S 7.125%
02/07/2019 (Singapore) (2) USD 200,000 212,439 1.14
1,048,146 5.60
JamaicaDigicel Group Ltd., Reg. S 8.25%
30/09/2020 (Bermuda) (2) USD 400,000 334,876 1.79
334,876 1.79
KazakhstanZhaikmunai LLP, Reg. S 7.125%
13/11/2019 USD 450,000 395,514 2.11
395,514 2.11
MexicoPetroleos Mexicanos, Reg. S 6.875%
04/08/2026 USD 260,000 289,126 1.55
289,126 1.55
NigeriaZenith Bank plc, Reg. S 6.25%
22/04/2019 USD 200,000 189,684 1.01
189,684 1.01
PanamaAeropuerto Internacional de Tocumen SA,
Reg. S 5.625% 18/05/2036 USD 200,000 200,120 1.07
200,120 1.07
PhilippinesPetron Corp., Reg. S, FRN 7.5% Perpetual USD 400,000 426,030 2.28Royal Capital BV, Reg. S, FRN 5.5%
Perpetual (Netherlands) (2) USD 250,000 256,134 1.37
682,164 3.65
RussiaGTH Finance BV, Reg. S 7.25%
26/04/2023 (Netherlands) (2) USD 200,000 208,907 1.12
208,907 1.12
South AfricaEskom Holdings SOC Ltd., Reg. S 7.125%
11/02/2025 USD 430,000 426,050 2.28
426,050 2.28
SCHEDULE OF INVESTMENTSAs at 30 June 2016
Investments Currency
Quantity/Nominal
Value
Market Value USD
% of Net Assets
Transferable securities and money market instruments admitted to official exchange listing or dealt in on another regulated market
Corporate Bonds (continued)
United Arab EmiratesMAF Global Securities Ltd., Reg. S, FRN
7.125% Perpetual (Cayman Islands) (2) USD 400,000 418,684 2.24
418,684 2.24
VenezuelaPetroleos de Venezuela SA, Reg. S 6%
15/11/2026 USD 1,520,000 532,213 2.84
532,213 2.84
Total Corporate Bonds 8,271,963 44.20
Government Bonds
ArgentinaArgentine Republic Government
International Bond, Reg. S 7.5% 22/04/2026 USD 200,000 217,365 1.16
Letras del Banco Central de la Republica Argentina 0% 28/12/2016 ARS 2,230,000 123,936 0.66
Letras del Banco Central de la Republica Argentina 0% 11/01/2017 ARS 580,000 32,819 0.18
Republic of Argentina, FRN 33.423% 09/10/2017 ARS 3,036,000 222,801 1.19
596,921 3.19
BrazilBrazil Letras do Tesouro Nacional 0%
01/01/2019 BRL 307,400 717,563 3.83Brazil Notas do Tesouro Nacional 10%
01/01/2021 BRL 60,000 174,294 0.93
891,857 4.76
ColombiaColombia Government International Bond
5.625% 26/02/2044 USD 250,000 276,387 1.48Colombian TES 11% 24/07/2020 COP 190,000,000 74,210 0.40Colombian TES 10% 24/07/2024 COP 685,000,000 271,834 1.45
622,431 3.33
Côte d’IvoireIvory Coast Government International Bond,
Reg. S 6.375% 03/03/2028 USD 200,000 194,106 1.04Ivory Coast Government International Bond,
Reg. S, STEP 5.75% 31/12/2032 USD 118,800 110,695 0.59
304,801 1.63
Dominican RepublicDominican Republic International Bond,
Reg. S 6.875% 29/01/2026 USD 100,000 110,477 0.59Dominican Republic International Bond,
Reg. S 6.85% 27/01/2045 USD 400,000 412,724 2.21
523,201 2.80
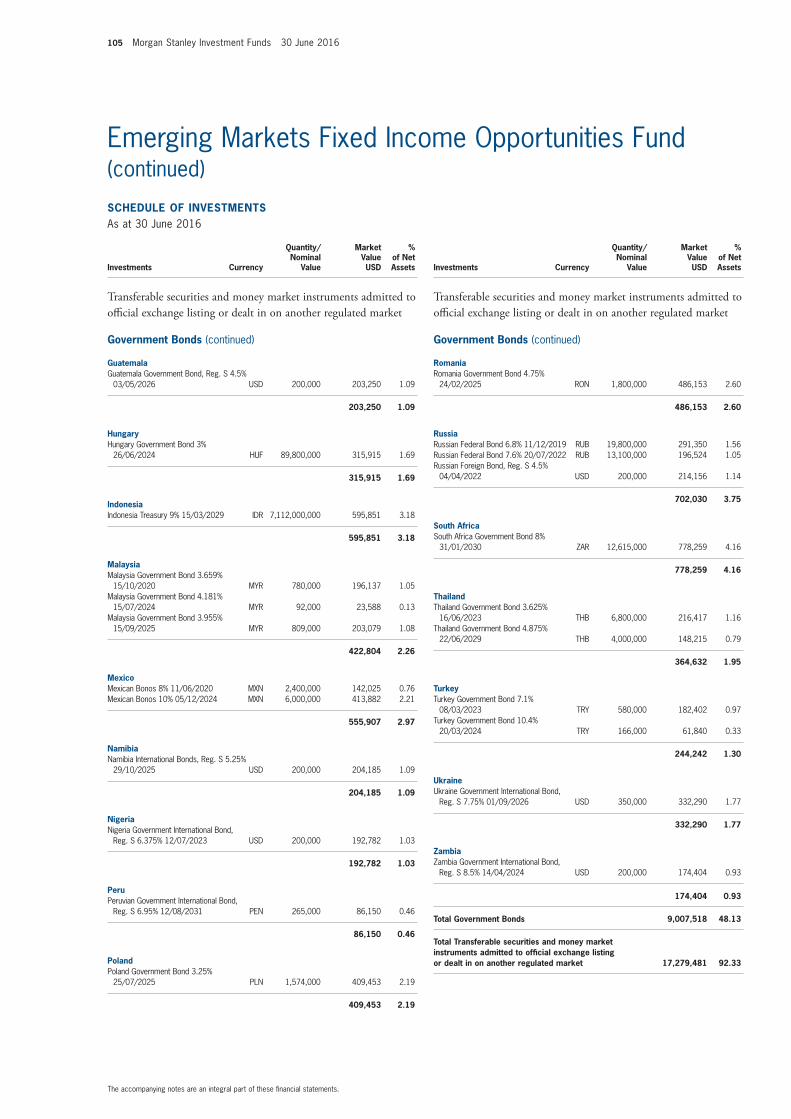
105 Morgan Stanley Investment Funds 30 June 2016
The accompanying notes are an integral part of these financial statements.
SCHEDULE OF INVESTMENTSAs at 30 June 2016
Investments Currency
Quantity/Nominal
Value
Market Value USD
% of Net Assets
Transferable securities and money market instruments admitted to official exchange listing or dealt in on another regulated market
Government Bonds (continued)
GuatemalaGuatemala Government Bond, Reg. S 4.5%
03/05/2026 USD 200,000 203,250 1.09
203,250 1.09
HungaryHungary Government Bond 3%
26/06/2024 HUF 89,800,000 315,915 1.69
315,915 1.69
IndonesiaIndonesia Treasury 9% 15/03/2029 IDR 7,112,000,000 595,851 3.18
595,851 3.18
MalaysiaMalaysia Government Bond 3.659%
15/10/2020 MYR 780,000 196,137 1.05Malaysia Government Bond 4.181%
15/07/2024 MYR 92,000 23,588 0.13Malaysia Government Bond 3.955%
15/09/2025 MYR 809,000 203,079 1.08
422,804 2.26
MexicoMexican Bonos 8% 11/06/2020 MXN 2,400,000 142,025 0.76Mexican Bonos 10% 05/12/2024 MXN 6,000,000 413,882 2.21
555,907 2.97
NamibiaNamibia International Bonds, Reg. S 5.25%
29/10/2025 USD 200,000 204,185 1.09
204,185 1.09
NigeriaNigeria Government International Bond,
Reg. S 6.375% 12/07/2023 USD 200,000 192,782 1.03
192,782 1.03
PeruPeruvian Government International Bond,
Reg. S 6.95% 12/08/2031 PEN 265,000 86,150 0.46
86,150 0.46
PolandPoland Government Bond 3.25%
25/07/2025 PLN 1,574,000 409,453 2.19
409,453 2.19
SCHEDULE OF INVESTMENTSAs at 30 June 2016
Investments Currency
Quantity/Nominal
Value
Market Value USD
% of Net Assets
Transferable securities and money market instruments admitted to official exchange listing or dealt in on another regulated market
Government Bonds (continued)
RomaniaRomania Government Bond 4.75%
24/02/2025 RON 1,800,000 486,153 2.60
486,153 2.60
RussiaRussian Federal Bond 6.8% 11/12/2019 RUB 19,800,000 291,350 1.56Russian Federal Bond 7.6% 20/07/2022 RUB 13,100,000 196,524 1.05Russian Foreign Bond, Reg. S 4.5%
04/04/2022 USD 200,000 214,156 1.14
702,030 3.75
South AfricaSouth Africa Government Bond 8%
31/01/2030 ZAR 12,615,000 778,259 4.16
778,259 4.16
ThailandThailand Government Bond 3.625%
16/06/2023 THB 6,800,000 216,417 1.16Thailand Government Bond 4.875%
22/06/2029 THB 4,000,000 148,215 0.79
364,632 1.95
TurkeyTurkey Government Bond 7.1%
08/03/2023 TRY 580,000 182,402 0.97Turkey Government Bond 10.4%
20/03/2024 TRY 166,000 61,840 0.33
244,242 1.30
UkraineUkraine Government International Bond,
Reg. S 7.75% 01/09/2026 USD 350,000 332,290 1.77
332,290 1.77
ZambiaZambia Government International Bond,
Reg. S 8.5% 14/04/2024 USD 200,000 174,404 0.93
174,404 0.93
Total Government Bonds 9,007,518 48.13
Total Transferable securities and money market instruments admitted to official exchange listing or dealt in on another regulated market 17,279,481 92.33
Emerging Markets Fixed Income Opportunities Fund (continued)

Morgan Stanley Investment Funds 30 June 2016 106
The accompanying notes are an integral part of these financial statements.
Financial Futures Contracts
Security DescriptionNumber of Contracts Currency
Global Exposure
USD
Unrealised Gain/(Loss)
USD
% of Net Assets
Euro-Bobl, 08/09/2016 (1) EUR (148,460) (821) 0.00
Total Unrealised Loss on Financial Futures Contracts (821) 0.00
Net Unrealised Loss on Financial Futures Contracts (821) 0.00
Forward Currency Exchange Contracts (continued)
Currency Purchased
Amount Purchased
Currency Sold
Amount Sold
Maturity Date Counterparty
Unrealised Gain/(Loss)
USD
% of Net Assets
BRL 1,233,000 USD 364,561 05/07/2016 J.P. Morgan 19,265 0.11MYR 2,575,600 USD 629,026 05/07/2016 J.P. Morgan 11,299 0.06RUB 10,865,504 USD 162,969 05/07/2016 J.P. Morgan 6,051 0.03USD 165,944 MYR 665,600 05/07/2016 J.P. Morgan 467 0.00EUR 90,000 USD 100,026 08/07/2016 J.P. Morgan 35 0.00CLP 154,100,000 USD 224,427 11/07/2016 J.P. Morgan 8,044 0.05MXN 12,104,000 USD 641,343 11/07/2016 J.P. Morgan 11,589 0.06PEN 502,000 USD 151,041 11/07/2016 J.P. Morgan 1,311 0.01USD 327,122 MXN 5,956,942 11/07/2016 J.P. Morgan 5,784 0.03IDR 9,291,409,450 USD 695,962 18/07/2016 J.P. Morgan 9,397 0.05TRY 1,626,912 USD 553,826 18/07/2016 J.P. Morgan 8,244 0.05USD 89,457 PHP 4,200,000 21/07/2016 J.P. Morgan 336 0.00INR 13,000,000 USD 190,728 22/07/2016 J.P. Morgan 1,151 0.01THB 6,000,000 USD 170,203 22/07/2016 J.P. Morgan 602 0.00USD 320,670 RON 1,290,000 22/07/2016 J.P. Morgan 3,388 0.02COP 335,000,000 USD 110,598 27/07/2016 J.P. Morgan 3,263 0.02KRW 108,000,000 USD 92,442 29/07/2016 J.P. Morgan 1,315 0.01MYR 665,600 USD 165,869 29/07/2016 J.P. Morgan 801 0.00USD 136,744 RUB 8,784,496 29/07/2016 J.P. Morgan 967 0.01USD 27,322 ARS 450,000 30/12/2016 Citibank 8 0.00USD 42,331 ARS 690,000 18/01/2017 Citibank 854 0.00USD 98,315 ARS 1,750,000 13/06/2017 Citibank 610 0.00
Unrealised Gain on Forward Currency Exchange Contracts 94,781 0.52
EUR Hedged Share ClassEUR 126,476 USD 139,890 01/07/2016 J.P. Morgan 705 0.00EUR 7,450,443 USD 8,234,478 08/07/2016 J.P. Morgan 48,869 0.25
Unrealised Gain on NAV Hedged Share Classes Forward Currency Exchange Contracts 49,574 0.25
Total Unrealised Gain on Forward Currency Exchange Contracts 144,355 0.77
RUB 11,034,496 USD 172,741 05/07/2016 J.P. Morgan (1,093) 0.00USD 344,452 BRL 1,233,000 05/07/2016 J.P. Morgan (39,374) (0.21)USD 466,698 MYR 1,910,000 05/07/2016 J.P. Morgan (8,151) (0.05)USD 335,114 RUB 21,900,000 05/07/2016 J.P. Morgan (5,553) (0.03)EUR 80,000 USD 91,494 08/07/2016 J.P. Morgan (2,551) (0.01)USD 177,245 EUR 160,000 08/07/2016 J.P. Morgan (642) 0.00MXN 1,650,000 USD 90,007 11/07/2016 J.P. Morgan (1,000) (0.01)PEN 388,000 USD 118,149 11/07/2016 State Street (394) 0.00USD 218,350 CLP 150,070,000 11/07/2016 J.P. Morgan (8,041) (0.04)USD 326,689 MXN 6,200,000 11/07/2016 J.P. Morgan (7,762) (0.05)USD 235,354 PEN 785,000 11/07/2016 J.P. Morgan (2,885) (0.02)USD 540,541 IDR 7,288,000,000 18/07/2016 J.P. Morgan (12,727) (0.07)USD 181,233 TRY 530,000 18/07/2016 J.P. Morgan (1,873) (0.01)PHP 9,790,000 USD 208,234 21/07/2016 J.P. Morgan (498) 0.00HUF 60,875,974 USD 217,811 22/07/2016 J.P. Morgan (4,197) (0.02)INR 3,100,000 USD 45,804 22/07/2016 J.P. Morgan (48) 0.00PLN 261,000 USD 66,710 22/07/2016 J.P. Morgan (1,062) (0.01)
DERIVATIVES
Over-the-counter (OTC) and exchange traded derivatives as at 30 June 2016, expressed in US dollars.
SCHEDULE OF INVESTMENTSAs at 30 June 2016
Investments Currency
Quantity/Nominal
Value
Market Value USD
% of Net Assets
Units of authorised UCITS or other collective investment undertakings
Collective Investment Schemes – UCITS
LuxembourgMorgan Stanley Liquidity Funds US Dollar
Liquidity Fund – MS Reserve (4) USD 875,491 875,491 4.68
875,491 4.68
Total Collective Investment Schemes – UCITS 875,491 4.68
Total Units of authorised UCITS or other collective investment undertakings 875,491 4.68
Total Investments 18,154,972 97.01
Cash 367,556 1.96
Other Assets/(Liabilities) 193,313 1.03
Total Net Assets 18,715,841 100.00
(2) The country in brackets represents the country of incorporation of this security.(4) Affiliate managed by an affiliate of the Investment Adviser.
Emerging Markets Fixed Income Opportunities Fund (continued)
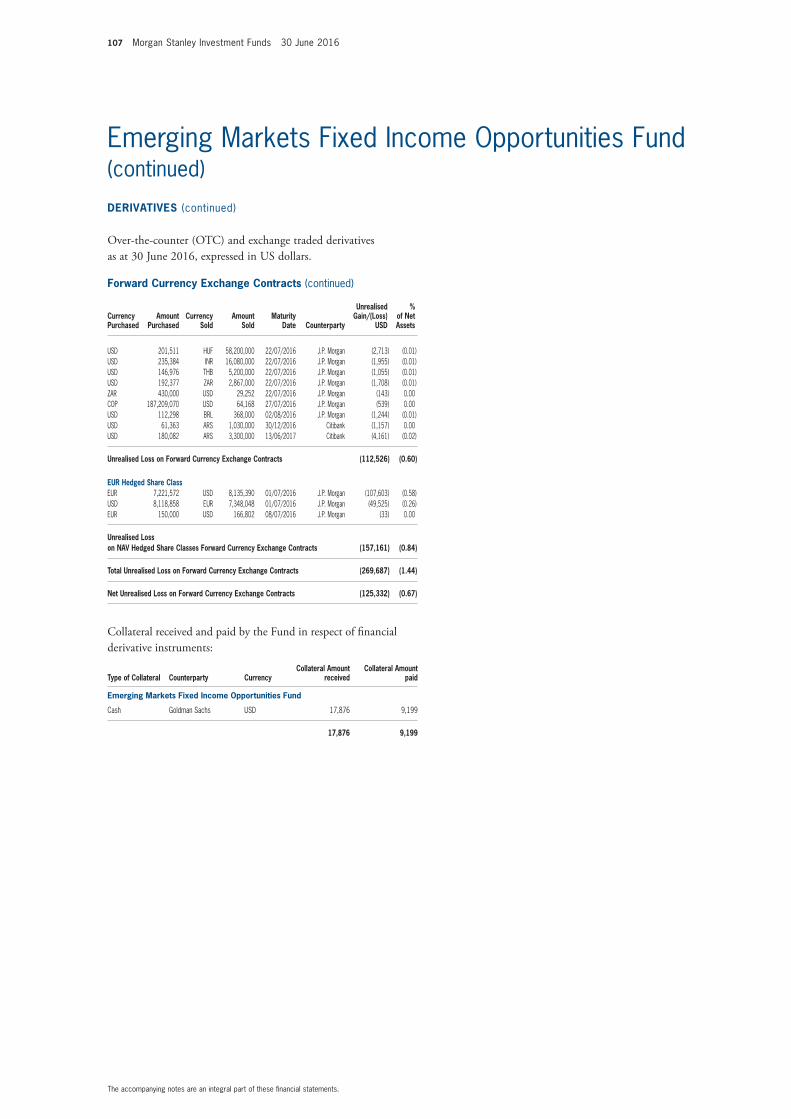
107 Morgan Stanley Investment Funds 30 June 2016
The accompanying notes are an integral part of these financial statements.
DERIVATIVES (continued)
Over-the-counter (OTC) and exchange traded derivatives as at 30 June 2016, expressed in US dollars.
Forward Currency Exchange Contracts (continued)
Currency Purchased
Amount Purchased
Currency Sold
Amount Sold
Maturity Date Counterparty
Unrealised Gain/(Loss)
USD
% of Net Assets
USD 201,511 HUF 58,200,000 22/07/2016 J.P. Morgan (2,713) (0.01)USD 235,384 INR 16,080,000 22/07/2016 J.P. Morgan (1,955) (0.01)USD 146,976 THB 5,200,000 22/07/2016 J.P. Morgan (1,055) (0.01)USD 192,377 ZAR 2,867,000 22/07/2016 J.P. Morgan (1,708) (0.01)ZAR 430,000 USD 29,252 22/07/2016 J.P. Morgan (143) 0.00COP 187,209,070 USD 64,168 27/07/2016 J.P. Morgan (539) 0.00USD 112,298 BRL 368,000 02/08/2016 J.P. Morgan (1,244) (0.01)USD 61,363 ARS 1,030,000 30/12/2016 Citibank (1,157) 0.00USD 180,082 ARS 3,300,000 13/06/2017 Citibank (4,161) (0.02)
Unrealised Loss on Forward Currency Exchange Contracts (112,526) (0.60)
EUR Hedged Share ClassEUR 7,221,572 USD 8,135,390 01/07/2016 J.P. Morgan (107,603) (0.58)USD 8,118,858 EUR 7,348,048 01/07/2016 J.P. Morgan (49,525) (0.26)EUR 150,000 USD 166,802 08/07/2016 J.P. Morgan (33) 0.00
Unrealised Loss on NAV Hedged Share Classes Forward Currency Exchange Contracts (157,161) (0.84)
Total Unrealised Loss on Forward Currency Exchange Contracts (269,687) (1.44)
Net Unrealised Loss on Forward Currency Exchange Contracts (125,332) (0.67)
Collateral received and paid by the Fund in respect of financial derivative instruments:
Type of Collateral Counterparty CurrencyCollateral Amount
receivedCollateral Amount
paid
Emerging Markets Fixed Income Opportunities Fund
Cash Goldman Sachs USD 17,876 9,199
17,876 9,199
Emerging Markets Fixed Income Opportunities Fund (continued)

Morgan Stanley Investment Funds 30 June 2016 108
The accompanying notes are an integral part of these financial statements.
Please refer to the full prospectus for the Fund’s investment objective and policy.
Euro Bond Fund
INVESTMENT AIM
To provide an attractive rate of return, measured in Euro, through investment in Euro-denominated fixed income securities of high quality issued by governments, agencies and corporations.
SCHEDULE OF INVESTMENTSAs at 30 June 2016
Investments Currency
Quantity/Nominal
Value
Market Value EUR
% of Net Assets
Transferable securities and money market instruments admitted to official exchange listing or dealt in on another regulated market
Corporate Bonds
AustraliaAusNet Services Holdings Pty. Ltd., Reg. S
1.5% 26/02/2027 EUR 200,000 207,923 0.09BHP Billiton Finance Ltd., Reg. S, FRN
5.625% 22/10/2079 EUR 450,000 477,472 0.20BHP Billiton Finance Ltd., Reg. S 0.75%
28/10/2022 EUR 500,000 498,377 0.21Commonwealth Bank of Australia, Reg. S,
FRN 2% 22/04/2027 EUR 1,000,000 965,380 0.41Macquarie Bank Ltd., Reg. S 1%
16/09/2019 (1) EUR 400,000 407,794 0.17Macquarie Bank Ltd., Reg. S 0.375%
03/03/2021 EUR 850,000 865,600 0.36National Australia Bank Ltd., Reg. S, FRN
0.276% 19/04/2021 EUR 650,000 650,764 0.27Scentre Group Trust 1, REIT, Reg. S 1.5%
16/07/2020 EUR 300,000 313,640 0.13Scentre Group Trust 1, REIT, Reg. S 2.25%
16/07/2024 EUR 200,000 220,190 0.09Transurban Finance Co. Pty. Ltd. 2.5%
08/10/2020 EUR 250,000 268,665 0.11Transurban Finance Co. Pty. Ltd. 1.875%
16/09/2024 EUR 400,000 418,330 0.18Wesfarmers Ltd., Reg. S 1.25%
07/10/2021 EUR 650,000 672,537 0.28Westpac Banking Corp., Reg. S 0.875%
16/02/2021 EUR 750,000 770,464 0.32
6,737,136 2.82
AustriaUniCredit Bank Austria AG, Reg. S 2.625%
30/01/2018 EUR 400,000 413,910 0.17UniCredit Bank Austria AG, Reg. S 2.5%
27/05/2019 EUR 400,000 419,246 0.18
833,156 0.35
BelgiumAnheuser-Busch InBev SA NV, Reg. S
0.875% 17/03/2022 EUR 400,000 410,419 0.17Anheuser-Busch InBev SA NV, Reg. S
2.75% 17/03/2036 EUR 660,000 762,965 0.32
1,173,384 0.49
BrazilVale SA 3.75% 10/01/2023 EUR 150,000 134,281 0.06
134,281 0.06
CanadaCanadian Imperial Bank of Commerce,
Reg. S, FRN 0% 08/09/2017 EUR 950,000 950,560 0.40Toronto-Dominion Bank (The), Reg. S
0.625% 08/03/2021 (1) EUR 2,700,000 2,740,657 1.14
3,691,217 1.54

109 Morgan Stanley Investment Funds 30 June 2016
The accompanying notes are an integral part of these financial statements.
Euro Bond Fund (continued)
SCHEDULE OF INVESTMENTSAs at 30 June 2016
Investments Currency
Quantity/Nominal
Value
Market Value EUR
% of Net Assets
Transferable securities and money market instruments admitted to official exchange listing or dealt in on another regulated market
Corporate Bonds (continued)
ChinaBank of China Ltd., Reg. S, FRN 0.719%
30/06/2018 EUR 550,000 551,537 0.23Bao-trans Enterprises Ltd., Reg. S 1.625%
23/02/2018 (Hong Kong) (2) EUR 400,000 401,535 0.17CNOOC Curtis Funding No. 1 Pty. Ltd.,
Reg. S 2.75% 03/10/2020 (Australia) (2) EUR 700,000 746,432 0.31Eastern Creation II Investment Holdings
Ltd., Reg. S 1% 19/03/2018 (British Virgin Islands) (2) EUR 350,000 350,695 0.15
Eastern Creation II Investment Holdings Ltd., Reg. S 1.5% 29/07/2019 (British Virgin Islands) (2) EUR 500,000 504,462 0.21
Sinopec Group Overseas Development 2013 Ltd., Reg. S 2.625% 17/10/2020 (British Virgin Islands) (2) EUR 625,000 667,480 0.28
Sinopec Group Overseas Development 2015 Ltd., Reg. S 1% 28/04/2022 (British Virgin Islands) (2) EUR 400,000 395,343 0.16
Three Gorges Finance II Cayman Islands Ltd., Reg. S 1.7% 10/06/2022 (Cayman Islands) (2) EUR 600,000 618,804 0.26
4,236,288 1.77
DenmarkNykredit Realkredit A/S Bond, Reg. S
0.875% 13/06/2019 EUR 450,000 453,975 0.19
453,975 0.19
FinlandOP Corporate Bank plc, Reg. S 0.875%
21/06/2021 (1) EUR 400,000 411,701 0.17OP Corporate Bank plc, Reg. S 0.75%
03/03/2022 EUR 400,000 408,791 0.17Saastopankkien Keskuspankki Suomi OYJ,
Reg. S 1% 06/05/2020 EUR 800,000 805,684 0.34
1,626,176 0.68
FranceAXA SA, Reg. S, FRN 5.25% 16/04/2040 EUR 200,000 221,135 0.09AXA SA, Reg. S, FRN 5.125%
04/07/2043 EUR 360,000 411,162 0.17AXA SA, Reg. S, FRN 3.875% Perpetual EUR 100,000 98,607 0.04Banque Federative du Credit Mutuel SA,
Reg. S 3% 28/11/2023 EUR 300,000 351,135 0.15Banque Federative du Credit Mutuel SA,
Reg. S 2.375% 24/03/2026 EUR 700,000 696,203 0.29BNP Paribas SA, Reg. S, FRN 2.625%
14/10/2027 EUR 800,000 807,251 0.34BNP Paribas SA 2% 28/01/2019 EUR 800,000 839,752 0.35BNP Paribas SA, Reg. S 2.375%
17/02/2025 EUR 150,000 148,781 0.06BNP Paribas SA, Reg. S 2.875%
01/10/2026 (1) EUR 325,000 329,277 0.14BPCE SA, Reg. S, FRN 2.75%
08/07/2026 (1) EUR 400,000 406,338 0.17Credit Agricole SA, Reg. S 2.375%
20/05/2024 EUR 200,000 225,209 0.09Credit Agricole SA, Reg. S 2.625%
17/03/2027 EUR 500,000 499,447 0.21Electricite de France SA, Reg. S, FRN 5%
Perpetual EUR 600,000 565,804 0.24
SCHEDULE OF INVESTMENTSAs at 30 June 2016
Investments Currency
Quantity/Nominal
Value
Market Value EUR
% of Net Assets
Transferable securities and money market instruments admitted to official exchange listing or dealt in on another regulated market
Corporate Bonds (continued)
France (continued)Engie SA, Reg. S, FRN 3% Perpetual EUR 100,000 102,785 0.04Engie SA, Reg. S, FRN 3.875% Perpetual EUR 700,000 732,624 0.31Engie SA, Reg. S 1.375% 19/05/2020 EUR 400,000 422,942 0.18Klepierre, REIT, Reg. S 1.875%
19/02/2026 (1) EUR 1,100,000 1,194,651 0.50Legrand SA, Reg. S 3.375% 19/04/2022 EUR 200,000 234,506 0.10Orange SA 8.125% 28/01/2033 EUR 400,000 770,668 0.32Orange SA, Reg. S 1.875% 02/10/2019 EUR 200,000 212,263 0.09RTE Reseau de Transport d’Electricite SA,
Reg. S 1.625% 27/11/2025 EUR 200,000 216,233 0.09Sanofi, Reg. S 1.75% 10/09/2026 EUR 600,000 664,283 0.28Schneider Electric SE, Reg. S 1.5%
08/09/2023 EUR 300,000 321,979 0.14SCOR SE, Reg. S, FRN 3% 08/06/2046 EUR 400,000 388,173 0.16Total Capital Canada Ltd., Reg. S 1.125%
18/03/2022 (Canada) (2) EUR 300,000 316,061 0.13TOTAL SA, Reg. S, FRN 2.25% Perpetual EUR 450,000 435,512 0.18TOTAL SA, Reg. S, FRN 3.94% Perpetual EUR 250,000 259,844 0.11
11,872,625 4.97
GermanyAllianz Finance II BV, FRN 5.75%
08/07/2041 (Netherlands) (2) EUR 800,000 913,887 0.38Allianz SE, Reg. S, FRN 4.75% Perpetual EUR 400,000 428,024 0.18BMW US Capital LLC, Reg. S 1.125%
18/09/2021 (United States of America) (2) EUR 300,000 313,905 0.13
BMW US Capital LLC, Reg. S 0.625% 20/04/2022 (United States of America) (2) EUR 400,000 407,215 0.17
BSH Hausgerate GmbH 1.875% 13/11/2020 EUR 1,000,000 1,081,662 0.45
Daimler AG, Reg. S 0.875% 12/01/2021 EUR 725,000 747,806 0.31Daimler AG, Reg. S 1.375% 11/05/2028 EUR 350,000 365,698 0.15Deutsche Bank AG, Reg. S 2.75%
17/02/2025 (1) EUR 200,000 179,671 0.08Deutsche Bank AG, Reg. S 1.125%
17/03/2025 (1) EUR 600,000 576,719 0.24Deutsche Boerse AG, Reg. S, FRN 2.75%
05/02/2041 EUR 200,000 204,980 0.09Muenchener Rueckversicherungs-
Gesellschaft AG, Reg. S, FRN 6% 26/05/2041 EUR 1,000,000 1,169,306 0.49
6,388,873 2.67
Hong KongCK Hutchison Finance 16 Ltd., Reg. S
1.25% 06/04/2023 (Cayman Islands) (2) EUR 600,000 602,250 0.25Hutchison Whampoa Europe Finance 12
Ltd., Reg. S 2.5% 06/06/2017 (Cayman Islands) (2) EUR 700,000 715,758 0.30
Shanghai Electric Newage Co. Ltd., Reg. S 1.125% 22/05/2020 EUR 400,000 402,785 0.17
1,720,793 0.72
IsraelTeva Pharmaceutical Finance IV BV, Reg. S
2.875% 15/04/2019 (Curacao) (2) EUR 450,000 481,597 0.20
481,597 0.20
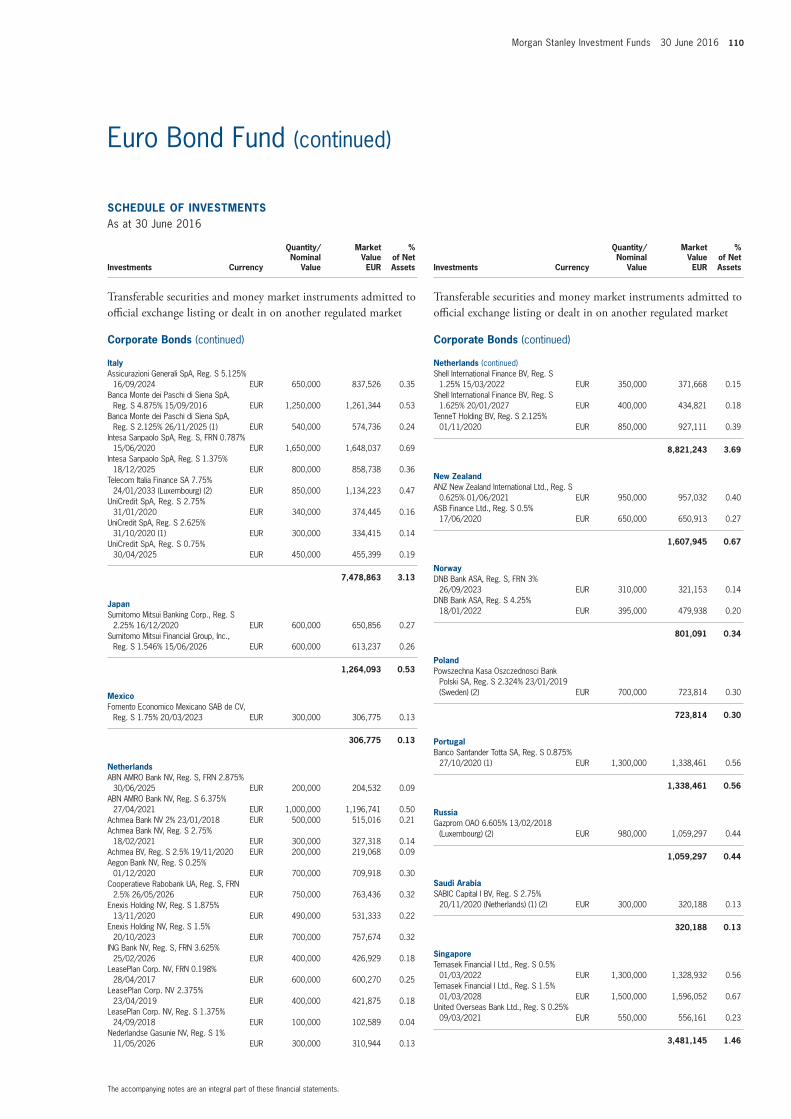
Morgan Stanley Investment Funds 30 June 2016 110
The accompanying notes are an integral part of these financial statements.
Euro Bond Fund (continued)
SCHEDULE OF INVESTMENTSAs at 30 June 2016
Investments Currency
Quantity/Nominal
Value
Market Value EUR
% of Net Assets
Transferable securities and money market instruments admitted to official exchange listing or dealt in on another regulated market
Corporate Bonds (continued)
ItalyAssicurazioni Generali SpA, Reg. S 5.125%
16/09/2024 EUR 650,000 837,526 0.35Banca Monte dei Paschi di Siena SpA,
Reg. S 4.875% 15/09/2016 EUR 1,250,000 1,261,344 0.53Banca Monte dei Paschi di Siena SpA,
Reg. S 2.125% 26/11/2025 (1) EUR 540,000 574,736 0.24Intesa Sanpaolo SpA, Reg. S, FRN 0.787%
15/06/2020 EUR 1,650,000 1,648,037 0.69Intesa Sanpaolo SpA, Reg. S 1.375%
18/12/2025 EUR 800,000 858,738 0.36Telecom Italia Finance SA 7.75%
24/01/2033 (Luxembourg) (2) EUR 850,000 1,134,223 0.47UniCredit SpA, Reg. S 2.75%
31/01/2020 EUR 340,000 374,445 0.16UniCredit SpA, Reg. S 2.625%
31/10/2020 (1) EUR 300,000 334,415 0.14UniCredit SpA, Reg. S 0.75%
30/04/2025 EUR 450,000 455,399 0.19
7,478,863 3.13
JapanSumitomo Mitsui Banking Corp., Reg. S
2.25% 16/12/2020 EUR 600,000 650,856 0.27Sumitomo Mitsui Financial Group, Inc.,
Reg. S 1.546% 15/06/2026 EUR 600,000 613,237 0.26
1,264,093 0.53
MexicoFomento Economico Mexicano SAB de CV,
Reg. S 1.75% 20/03/2023 EUR 300,000 306,775 0.13
306,775 0.13
NetherlandsABN AMRO Bank NV, Reg. S, FRN 2.875%
30/06/2025 EUR 200,000 204,532 0.09ABN AMRO Bank NV, Reg. S 6.375%
27/04/2021 EUR 1,000,000 1,196,741 0.50Achmea Bank NV 2% 23/01/2018 EUR 500,000 515,016 0.21Achmea Bank NV, Reg. S 2.75%
18/02/2021 EUR 300,000 327,318 0.14Achmea BV, Reg. S 2.5% 19/11/2020 EUR 200,000 219,068 0.09Aegon Bank NV, Reg. S 0.25%
01/12/2020 EUR 700,000 709,918 0.30Cooperatieve Rabobank UA, Reg. S, FRN
2.5% 26/05/2026 EUR 750,000 763,436 0.32Enexis Holding NV, Reg. S 1.875%
13/11/2020 EUR 490,000 531,333 0.22Enexis Holding NV, Reg. S 1.5%
20/10/2023 EUR 700,000 757,674 0.32ING Bank NV, Reg. S, FRN 3.625%
25/02/2026 EUR 400,000 426,929 0.18LeasePlan Corp. NV, FRN 0.198%
28/04/2017 EUR 600,000 600,270 0.25LeasePlan Corp. NV 2.375%
23/04/2019 EUR 400,000 421,875 0.18LeasePlan Corp. NV, Reg. S 1.375%
24/09/2018 EUR 100,000 102,589 0.04Nederlandse Gasunie NV, Reg. S 1%
11/05/2026 EUR 300,000 310,944 0.13
SCHEDULE OF INVESTMENTSAs at 30 June 2016
Investments Currency
Quantity/Nominal
Value
Market Value EUR
% of Net Assets
Transferable securities and money market instruments admitted to official exchange listing or dealt in on another regulated market
Corporate Bonds (continued)
Netherlands (continued)Shell International Finance BV, Reg. S
1.25% 15/03/2022 EUR 350,000 371,668 0.15Shell International Finance BV, Reg. S
1.625% 20/01/2027 EUR 400,000 434,821 0.18TenneT Holding BV, Reg. S 2.125%
01/11/2020 EUR 850,000 927,111 0.39
8,821,243 3.69
New ZealandANZ New Zealand International Ltd., Reg. S
0.625% 01/06/2021 EUR 950,000 957,032 0.40ASB Finance Ltd., Reg. S 0.5%
17/06/2020 EUR 650,000 650,913 0.27
1,607,945 0.67
NorwayDNB Bank ASA, Reg. S, FRN 3%
26/09/2023 EUR 310,000 321,153 0.14DNB Bank ASA, Reg. S 4.25%
18/01/2022 EUR 395,000 479,938 0.20
801,091 0.34
PolandPowszechna Kasa Oszczednosci Bank
Polski SA, Reg. S 2.324% 23/01/2019 (Sweden) (2) EUR 700,000 723,814 0.30
723,814 0.30
PortugalBanco Santander Totta SA, Reg. S 0.875%
27/10/2020 (1) EUR 1,300,000 1,338,461 0.56
1,338,461 0.56
RussiaGazprom OAO 6.605% 13/02/2018
(Luxembourg) (2) EUR 980,000 1,059,297 0.44
1,059,297 0.44
Saudi ArabiaSABIC Capital I BV, Reg. S 2.75%
20/11/2020 (Netherlands) (1) (2) EUR 300,000 320,188 0.13
320,188 0.13
SingaporeTemasek Financial I Ltd., Reg. S 0.5%
01/03/2022 EUR 1,300,000 1,328,932 0.56Temasek Financial I Ltd., Reg. S 1.5%
01/03/2028 EUR 1,500,000 1,596,052 0.67United Overseas Bank Ltd., Reg. S 0.25%
09/03/2021 EUR 550,000 556,161 0.23
3,481,145 1.46

111 Morgan Stanley Investment Funds 30 June 2016
The accompanying notes are an integral part of these financial statements.
Euro Bond Fund (continued)
SCHEDULE OF INVESTMENTSAs at 30 June 2016
Investments Currency
Quantity/Nominal
Value
Market Value EUR
% of Net Assets
Transferable securities and money market instruments admitted to official exchange listing or dealt in on another regulated market
Corporate Bonds (continued)
SlovakiaSPP Infrastructure Financing BV, Reg. S
3.75% 18/07/2020 (Netherlands) (2) EUR 200,000 221,416 0.09SPP-Distribucia A/S, Reg. S 2.625%
23/06/2021 EUR 190,000 203,941 0.09
425,357 0.18
South KoreaIndustrial Bank of Korea, Reg. S 2%
30/10/2018 EUR 600,000 623,797 0.26Korea Gas Corp., Reg. S 2.375%
15/04/2019 EUR 325,000 343,611 0.14
967,408 0.40
SpainBanco Bilbao Vizcaya Argentaria SA
3.625% 18/01/2017 EUR 1,050,000 1,071,315 0.45Banco Bilbao Vizcaya Argentaria SA,
Reg. S 0.625% 17/05/2021 EUR 1,100,000 1,132,691 0.47Banco Popular Espanol SA 3.5%
11/09/2017 EUR 1,100,000 1,146,181 0.48Banco Santander SA 2.875%
30/01/2018 EUR 600,000 628,594 0.26Banco Santander SA, Reg. S 0.75%
09/09/2022 EUR 1,200,000 1,245,324 0.52CaixaBank SA 3% 22/03/2018 EUR 1,600,000 1,684,403 0.71CaixaBank SA, Reg. S 2.5% 18/04/2017 EUR 500,000 509,597 0.21CaixaBank SA, Reg. S 1% 08/02/2023 EUR 1,000,000 1,044,530 0.44Enagas Financiaciones SAU, Reg. S
1.375% 05/05/2028 EUR 800,000 832,968 0.35FADE - Fondo de Amortizacion del Deficit
Electrico, Reg. S 1.875% 17/09/2017 EUR 1,900,000 1,944,915 0.81FADE - Fondo de Amortizacion del Deficit
Electrico, Reg. S 0.85% 17/09/2019 EUR 900,000 920,471 0.39Gas Natural Capital Markets SA, Reg. S
4.375% 02/11/2016 EUR 1,100,000 1,115,812 0.47Santander Consumer Finance SA, Reg. S
1.5% 12/11/2020 EUR 500,000 511,671 0.21Telefonica Emisiones SAU, Reg. S 4.75%
07/02/2017 EUR 300,000 308,577 0.13
14,097,049 5.90
SwedenNordea Bank AB, Reg. S, FRN 4.625%
15/02/2022 EUR 1,120,000 1,147,149 0.48Nordea Bank AB, Reg. S, FRN 1.875%
10/11/2025 EUR 200,000 202,045 0.08Nordea Bank AB, Reg. S 1% 22/02/2023 EUR 1,250,000 1,288,854 0.54Skandinaviska Enskilda Banken AB, Reg. S,
FRN 2.5% 28/05/2026 EUR 600,000 614,424 0.26Svenska Handelsbanken AB, Reg. S, FRN
2.656% 15/01/2024 EUR 600,000 621,804 0.26Svenska Handelsbanken AB, Reg. S
1.125% 14/12/2022 (1) EUR 450,000 468,954 0.20Swedbank AB, Reg. S, FRN 2.375%
26/02/2024 EUR 200,000 205,616 0.08Swedbank AB, Reg. S 0.625%
04/01/2021 EUR 375,000 383,143 0.16
4,931,989 2.06
SCHEDULE OF INVESTMENTSAs at 30 June 2016
Investments Currency
Quantity/Nominal
Value
Market Value EUR
% of Net Assets
Transferable securities and money market instruments admitted to official exchange listing or dealt in on another regulated market
Corporate Bonds (continued)
SwitzerlandCredit Suisse AG, Reg. S 1.125%
15/09/2020 EUR 400,000 410,986 0.17Credit Suisse Group Funding Guernsey
Ltd., Reg. S 1.25% 14/04/2022 (Guernsey) (1) (2) EUR 600,000 586,596 0.24
UBS AG, Reg. S 1.125% 30/06/2020 EUR 200,000 207,498 0.09UBS Group Funding Jersey Ltd., Reg. S
1.75% 16/11/2022 (Jersey) (1) (2) EUR 250,000 260,986 0.11Zurich Insurance Co. Ltd., FRN 7.5%
24/07/2039 (Ireland) (2) EUR 700,000 813,687 0.34Zurich Insurance Co. Ltd., Reg. S, FRN
4.25% 02/10/2043 (Ireland) (2) EUR 90,000 97,904 0.04
2,377,657 0.99
TurkeyTurkiye Vakiflar Bankasi TAO, Reg. S
2.375% 04/05/2021 EUR 350,000 351,290 0.15
351,290 0.15
United Arab EmiratesEmirates NBD PJSC, Reg. S 1.75%
23/03/2022 EUR 580,000 577,615 0.24Emirates Telecommunications Group Co.
PJSC, Reg. S 1.75% 18/06/2021 EUR 370,000 385,862 0.16IPIC GMTN Ltd., Reg. S 2.375%
30/05/2018 (Cayman Islands) (2) EUR 120,000 125,040 0.06IPIC GMTN Ltd., Reg. S 5.875%
14/03/2021 (Cayman Islands) (1) (2) EUR 1,110,000 1,361,831 0.57
2,450,348 1.03
United KingdomAstraZeneca plc, Reg. S 0.875%
24/11/2021 EUR 250,000 258,226 0.11Barclays Bank plc, Reg. S 6%
14/01/2021 EUR 700,000 792,618 0.33BAT International Finance plc 5.375%
29/06/2017 EUR 590,000 621,776 0.26BP Capital Markets plc, Reg. S 2.177%
28/09/2021 EUR 300,000 326,696 0.14BP Capital Markets plc, Reg. S 1.526%
26/09/2022 EUR 350,000 368,596 0.15Hammerson plc, REIT, Reg. S 2%
01/07/2022 EUR 175,000 180,349 0.08Hammerson plc, REIT, Reg. S 1.75%
15/03/2023 EUR 400,000 402,618 0.17HBOS plc, FRN 4.5% 18/03/2030 EUR 1,110,000 1,201,040 0.50Heathrow Funding Ltd., Reg. S 4.375%
25/01/2019 (Jersey) (2) EUR 400,000 409,596 0.17Heathrow Funding Ltd., Reg. S 1.875%
23/05/2022 (Jersey) (2) EUR 350,000 371,169 0.15HSBC Holdings plc, Reg. S 6%
10/06/2019 (1) EUR 450,000 513,377 0.21HSBC Holdings plc, Reg. S 1.5%
15/03/2022 EUR 550,000 564,422 0.24HSBC Holdings plc, Reg. S 3%
30/06/2025 EUR 400,000 410,490 0.17Leeds Building Society, Reg. S 1.375%
05/05/2022 EUR 1,000,000 973,185 0.41Lloyds Bank plc, Reg. S 6.5%
24/03/2020 EUR 1,000,000 1,153,894 0.48
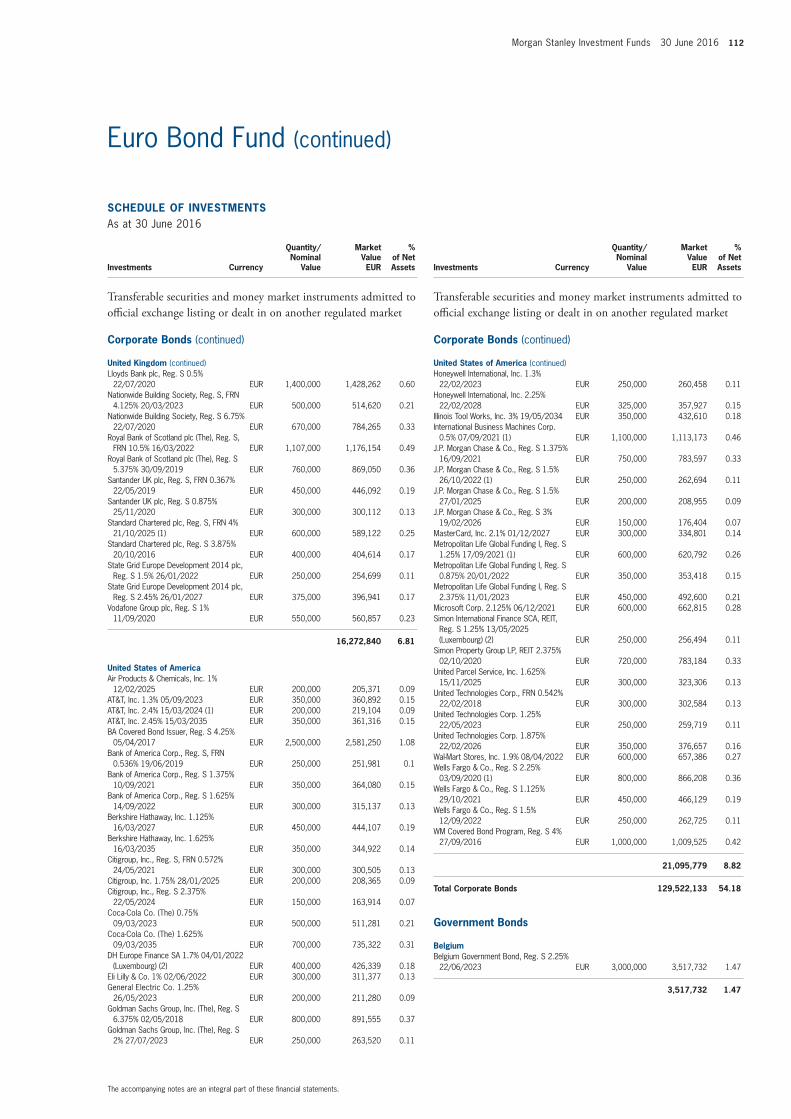
Morgan Stanley Investment Funds 30 June 2016 112
The accompanying notes are an integral part of these financial statements.
Euro Bond Fund (continued)
SCHEDULE OF INVESTMENTSAs at 30 June 2016
Investments Currency
Quantity/Nominal
Value
Market Value EUR
% of Net Assets
Transferable securities and money market instruments admitted to official exchange listing or dealt in on another regulated market
Corporate Bonds (continued)
United Kingdom (continued)Lloyds Bank plc, Reg. S 0.5%
22/07/2020 EUR 1,400,000 1,428,262 0.60Nationwide Building Society, Reg. S, FRN
4.125% 20/03/2023 EUR 500,000 514,620 0.21Nationwide Building Society, Reg. S 6.75%
22/07/2020 EUR 670,000 784,265 0.33Royal Bank of Scotland plc (The), Reg. S,
FRN 10.5% 16/03/2022 EUR 1,107,000 1,176,154 0.49Royal Bank of Scotland plc (The), Reg. S
5.375% 30/09/2019 EUR 760,000 869,050 0.36Santander UK plc, Reg. S, FRN 0.367%
22/05/2019 EUR 450,000 446,092 0.19Santander UK plc, Reg. S 0.875%
25/11/2020 EUR 300,000 300,112 0.13Standard Chartered plc, Reg. S, FRN 4%
21/10/2025 (1) EUR 600,000 589,122 0.25Standard Chartered plc, Reg. S 3.875%
20/10/2016 EUR 400,000 404,614 0.17State Grid Europe Development 2014 plc,
Reg. S 1.5% 26/01/2022 EUR 250,000 254,699 0.11State Grid Europe Development 2014 plc,
Reg. S 2.45% 26/01/2027 EUR 375,000 396,941 0.17Vodafone Group plc, Reg. S 1%
11/09/2020 EUR 550,000 560,857 0.23
16,272,840 6.81
United States of AmericaAir Products & Chemicals, Inc. 1%
12/02/2025 EUR 200,000 205,371 0.09AT&T, Inc. 1.3% 05/09/2023 EUR 350,000 360,892 0.15AT&T, Inc. 2.4% 15/03/2024 (1) EUR 200,000 219,104 0.09AT&T, Inc. 2.45% 15/03/2035 EUR 350,000 361,316 0.15BA Covered Bond Issuer, Reg. S 4.25%
05/04/2017 EUR 2,500,000 2,581,250 1.08Bank of America Corp., Reg. S, FRN
0.536% 19/06/2019 EUR 250,000 251,981 0.1Bank of America Corp., Reg. S 1.375%
10/09/2021 EUR 350,000 364,080 0.15Bank of America Corp., Reg. S 1.625%
14/09/2022 EUR 300,000 315,137 0.13Berkshire Hathaway, Inc. 1.125%
16/03/2027 EUR 450,000 444,107 0.19Berkshire Hathaway, Inc. 1.625%
16/03/2035 EUR 350,000 344,922 0.14Citigroup, Inc., Reg. S, FRN 0.572%
24/05/2021 EUR 300,000 300,505 0.13Citigroup, Inc. 1.75% 28/01/2025 EUR 200,000 208,365 0.09Citigroup, Inc., Reg. S 2.375%
22/05/2024 EUR 150,000 163,914 0.07Coca-Cola Co. (The) 0.75%
09/03/2023 EUR 500,000 511,281 0.21Coca-Cola Co. (The) 1.625%
09/03/2035 EUR 700,000 735,322 0.31DH Europe Finance SA 1.7% 04/01/2022
(Luxembourg) (2) EUR 400,000 426,339 0.18Eli Lilly & Co. 1% 02/06/2022 EUR 300,000 311,377 0.13General Electric Co. 1.25%
26/05/2023 EUR 200,000 211,280 0.09Goldman Sachs Group, Inc. (The), Reg. S
6.375% 02/05/2018 EUR 800,000 891,555 0.37Goldman Sachs Group, Inc. (The), Reg. S
2% 27/07/2023 EUR 250,000 263,520 0.11
SCHEDULE OF INVESTMENTSAs at 30 June 2016
Investments Currency
Quantity/Nominal
Value
Market Value EUR
% of Net Assets
Transferable securities and money market instruments admitted to official exchange listing or dealt in on another regulated market
Corporate Bonds (continued)
United States of America (continued)Honeywell International, Inc. 1.3%
22/02/2023 EUR 250,000 260,458 0.11Honeywell International, Inc. 2.25%
22/02/2028 EUR 325,000 357,927 0.15Illinois Tool Works, Inc. 3% 19/05/2034 EUR 350,000 432,610 0.18International Business Machines Corp.
0.5% 07/09/2021 (1) EUR 1,100,000 1,113,173 0.46J.P. Morgan Chase & Co., Reg. S 1.375%
16/09/2021 EUR 750,000 783,597 0.33J.P. Morgan Chase & Co., Reg. S 1.5%
26/10/2022 (1) EUR 250,000 262,694 0.11J.P. Morgan Chase & Co., Reg. S 1.5%
27/01/2025 EUR 200,000 208,955 0.09J.P. Morgan Chase & Co., Reg. S 3%
19/02/2026 EUR 150,000 176,404 0.07MasterCard, Inc. 2.1% 01/12/2027 EUR 300,000 334,801 0.14Metropolitan Life Global Funding I, Reg. S
1.25% 17/09/2021 (1) EUR 600,000 620,792 0.26Metropolitan Life Global Funding I, Reg. S
0.875% 20/01/2022 EUR 350,000 353,418 0.15Metropolitan Life Global Funding I, Reg. S
2.375% 11/01/2023 EUR 450,000 492,600 0.21Microsoft Corp. 2.125% 06/12/2021 EUR 600,000 662,815 0.28Simon International Finance SCA, REIT,
Reg. S 1.25% 13/05/2025 (Luxembourg) (2) EUR 250,000 256,494 0.11
Simon Property Group LP, REIT 2.375% 02/10/2020 EUR 720,000 783,184 0.33
United Parcel Service, Inc. 1.625% 15/11/2025 EUR 300,000 323,306 0.13
United Technologies Corp., FRN 0.542% 22/02/2018 EUR 300,000 302,584 0.13
United Technologies Corp. 1.25% 22/05/2023 EUR 250,000 259,719 0.11
United Technologies Corp. 1.875% 22/02/2026 EUR 350,000 376,657 0.16
Wal-Mart Stores, Inc. 1.9% 08/04/2022 EUR 600,000 657,386 0.27Wells Fargo & Co., Reg. S 2.25%
03/09/2020 (1) EUR 800,000 866,208 0.36Wells Fargo & Co., Reg. S 1.125%
29/10/2021 EUR 450,000 466,129 0.19Wells Fargo & Co., Reg. S 1.5%
12/09/2022 EUR 250,000 262,725 0.11WM Covered Bond Program, Reg. S 4%
27/09/2016 EUR 1,000,000 1,009,525 0.42
21,095,779 8.82
Total Corporate Bonds 129,522,133 54.18
Government Bonds
BelgiumBelgium Government Bond, Reg. S 2.25%
22/06/2023 EUR 3,000,000 3,517,732 1.47
3,517,732 1.47

113 Morgan Stanley Investment Funds 30 June 2016
The accompanying notes are an integral part of these financial statements.
Euro Bond Fund (continued)
SCHEDULE OF INVESTMENTSAs at 30 June 2016
Investments Currency
Quantity/Nominal
Value
Market Value EUR
% of Net Assets
Transferable securities and money market instruments admitted to official exchange listing or dealt in on another regulated market
Government Bonds (continued)
FranceFrance Government Bond OAT, Reg. S 0%
25/05/2020 EUR 6,000,000 6,101,427 2.55France Government Bond OAT, Reg. S
8.25% 25/04/2022 EUR 5,000,000 7,503,398 3.14France Government Bond OAT, Reg. S
1.1% 25/07/2022 EUR 8,000,000 9,783,047 4.09France Government Bond OAT, Reg. S
0.5% 25/05/2026 EUR 2,300,000 2,365,067 0.99France Government Bond OAT, Reg. S
5.5% 25/04/2029 EUR 3,000,000 4,945,131 2.07
30,698,070 12.84
GermanyBundesrepublik Deutschland, Reg. S 4.75%
04/07/2034 EUR 5,000,000 9,125,957 3.82Bundesrepublik Deutschland, Reg. S 4.25%
04/07/2039 EUR 7,000,000 13,246,579 5.54Bundesrepublik Deutschland, Reg. S 2.5%
04/07/2044 EUR 6,000,000 9,441,439 3.95Bundesrepublik Deutschland Inflation
Linked Bond, Reg. S 0.1% 15/04/2026 EUR 8,200,000 9,156,705 3.83
40,970,680 17.14
IrelandIreland Government Bond 4.5%
18/04/2020 EUR 2,000,000 2,360,077 0.98Ireland Government Bond 5.4%
13/03/2025 EUR 3,000,000 4,251,781 1.78Ireland Government Bond, Reg. S 3.4%
18/03/2024 EUR 3,000,000 3,701,249 1.55
10,313,107 4.31
MexicoMexico Government International Bond
1.625% 06/03/2024 EUR 250,000 252,354 0.11
252,354 0.11
NetherlandsNetherlands Government Bond, Reg. S,
144A 0.25% 15/07/2025 EUR 7,400,000 7,580,301 3.17
7,580,301 3.17
PolandPoland Government International Bond,
Reg. S 3.75% 29/03/2017 EUR 3,000,000 3,083,790 1.29
3,083,790 1.29
SpainSpain Government Bond, Reg. S, 144A
2.15% 31/10/2025 EUR 1,240,000 1,347,604 0.56
1,347,604 0.56
Total Government Bonds 97,763,638 40.89
SCHEDULE OF INVESTMENTSAs at 30 June 2016
Investments Currency
Quantity/Nominal
Value
Market Value EUR
% of Net Assets
Transferable securities and money market instruments admitted to official exchange listing or dealt in on another regulated market
Mortgage and Asset Backed Securities
GermanyGerman Residential Funding Ltd., Reg. S,
FRN, Series 2013-1 ‘A’ 0.892% 27/08/2024 (Ireland) (2) EUR 1,303,909 1,317,274 0.55
1,317,274 0.55
United KingdomTaurus plc, Reg. S, FRN, Series 2013-
GMF1 ‘A’ 0.792% 21/05/2024 EUR 377,284 381,118 0.16
381,118 0.16
Total Mortgage and Asset Backed Securities 1,698,392 0.71
Total Transferable securities and money market instruments admitted to official exchange listing or dealt in on another regulated market 228,984,163 95.78
Units of authorised UCITS or other collective investment undertakings
Collective Investment Schemes – UCITS
LuxembourgMorgan Stanley Liquidity Funds Euro
Liquidity Fund – MS Reserve (4) EUR 3,100,619 3,100,619 1.30
3,100,619 1.30
Total Collective Investment Schemes – UCITS 3,100,619 1.30
Total Units of authorised UCITS or other collective investment undertakings 3,100,619 1.30
Total Investments 232,084,782 97.08
Cash 1,043,915 0.44
Other Assets/(Liabilities) 5,928,956 2.48
Total Net Assets 239,057,653 100.00
(1) All or part of this position is out on loan.(2) The country in brackets represents the country of incorporation of this security.(4) Affiliate managed by an affiliate of the Investment Adviser.

Morgan Stanley Investment Funds 30 June 2016 114
The accompanying notes are an integral part of these financial statements.
Euro Bond Fund (continued)
DERIVATIVES
Over-the-counter (OTC) and exchange traded derivatives as at 30 June 2016, expressed in Euro.
Financial Futures Contracts
Security DescriptionNumber of Contracts Currency
Global Exposure
EUR
Unrealised Gain/(Loss)
EUR
% of Net Assets
Euro-Schatz, 08/09/2016 102 EUR 11,428,590 27,285 0.01
Unrealised Gain on Financial Futures Contracts 27,285 0.01
Total Unrealised Gain on Financial Futures Contracts 27,285 0.01
Euro-Bobl, 08/09/2016 (120) EUR (16,026,000) (157,872) (0.06)Euro-Bund, 08/09/2016 (69) EUR (11,519,550) (258,060) (0.11)
Unrealised Loss on Financial Futures Contracts (415,932) (0.17)
Total Unrealised Loss on Financial Futures Contracts (415,932) (0.17)
Net Unrealised Loss on Financial Futures Contracts (388,647) (0.16)
Credit Default Swap Contracts
Nominal Amount Ccy Counterparty Reference Entity
Buy/Sell
Interest (Paid)/
ReceivedMaturity
Date
Market Value EUR
Unrealised Gain/(Loss)
EUR
% of Net Assets
13,000,000 EUR Societe Generale
iTraxx Europe Senior Financials Series 21
Version 1-FIX Version 1 Sell 1.00% 20/06/2019 62,511 62,511 0.03
Total Unrealised Gain on Credit Default Swap Contracts 62,511 62,511 0.03
Net Unrealised Gain on Credit Default Swap Contracts 62,511 62,511 0.03
Collateral received and paid by the Fund in respect of financial derivative instruments:
Type of Collateral Counterparty CurrencyCollateral Amount
receivedCollateral Amount
paid
Euro Bond Fund
Cash Goldman Sachs EUR 689,233 -
689,233 -

115 Morgan Stanley Investment Funds 30 June 2016
The accompanying notes are an integral part of these financial statements.
Please refer to the full prospectus for the Fund’s investment objective and policy.
INVESTMENT AIM
To provide an attractive rate of return, measured in Euro, primarily through investment in Euro-denominated fixed income securities of high quality issued by corporations and non-government related issuers.
SCHEDULE OF INVESTMENTSAs at 30 June 2016
Investments Currency
Quantity/Nominal
Value
Market Value EUR
% of Net Assets
Transferable securities and money market instruments admitted to official exchange listing or dealt in on another regulated market
Convertible Bonds
FranceCie Generale des Etablissements Michelin
0% 01/01/2017 EUR 2,383,201 3,320,788 0.10
3,320,788 0.10
GermanySiemens Financieringsmaatschappij NV,
Reg. S 1.65% 16/08/2019 (Netherlands) (2) USD 3,000,000 2,943,422 0.08
2,943,422 0.08
Total Convertible Bonds 6,264,210 0.18
Corporate Bonds
AustraliaAPT Pipelines Ltd., Reg. S 1.375%
22/03/2022 (1) EUR 23,670,000 23,502,529 0.65Aurizon Network Pty. Ltd., Reg. S 2%
18/09/2024 (1) EUR 2,600,000 2,563,793 0.07Aurizon Network Pty. Ltd., Reg. S 3.125%
01/06/2026 EUR 15,350,000 15,645,426 0.44AusNet Services Holdings Pty. Ltd., Reg. S
1.5% 26/02/2027 EUR 6,150,000 6,393,629 0.18BHP Billiton Finance Ltd. 2.25%
25/09/2020 EUR 5,625,000 6,052,543 0.17BHP Billiton Finance Ltd., Reg. S 0.75%
28/10/2022 EUR 13,300,000 13,256,815 0.37BHP Billiton Finance Ltd., Reg. S, FRN
5.625% 22/10/2079 EUR 6,775,000 7,188,613 0.20Brambles Finance Ltd., Reg. S 2.375%
12/06/2024 EUR 3,500,000 3,852,014 0.11Commonwealth Bank of Australia, Reg. S,
FRN 2% 22/04/2027 (1) EUR 36,900,000 35,622,517 0.99Origin Energy Finance Ltd., Reg. S 2.5%
23/10/2020 (1) EUR 13,600,000 13,953,448 0.39Scentre Group Trust 1, REIT, Reg. S 1.5%
16/07/2020 (1) EUR 4,850,000 5,070,513 0.14Scentre Group Trust 1, REIT, Reg. S 2.25%
16/07/2024 EUR 6,000,000 6,605,699 0.18SGSP Australia Assets Pty. Ltd., Reg. S 2%
30/06/2022 EUR 11,850,000 12,539,128 0.35Transurban Finance Co. Pty. Ltd. 2.5%
08/10/2020 EUR 5,200,000 5,588,238 0.15Transurban Finance Co. Pty. Ltd. 1.875%
16/09/2024 EUR 6,750,000 7,059,316 0.20Transurban Finance Co. Pty. Ltd., Reg. S
2% 28/08/2025 EUR 10,300,000 10,756,599 0.30
175,650,820 4.89
AustriaUniCredit Bank Austria AG, Reg. S 2.5%
27/05/2019 (1) EUR 7,700,000 8,070,484 0.23UNIQA Insurance Group AG, Reg. S, FRN
6% 27/07/2046 EUR 4,000,000 4,111,365 0.11Vienna Insurance Group AG Wiener
Versicherung Gruppe, Reg. S, FRN 5.5% 09/10/2043 (1) EUR 3,500,000 3,702,746 0.10
15,884,595 0.44
Euro Corporate Bond Fund

Morgan Stanley Investment Funds 30 June 2016 116
The accompanying notes are an integral part of these financial statements.
Euro Corporate Bond Fund (continued)
SCHEDULE OF INVESTMENTSAs at 30 June 2016
Investments Currency
Quantity/Nominal
Value
Market Value EUR
% of Net Assets
Transferable securities and money market instruments admitted to official exchange listing or dealt in on another regulated market
Corporate Bonds (continued)
BelgiumAnheuser-Busch InBev Finance, Inc. 3.65%
01/02/2026 (United States of America) (2) USD 32,000,000 30,859,344 0.86
Anheuser-Busch InBev SA NV, Reg. S 0.875% 17/03/2022 EUR 21,400,000 21,957,427 0.61
Anheuser-Busch InBev SA NV, Reg. S 2.75% 17/03/2036 EUR 37,050,000 42,830,059 1.19
Barry Callebaut Services NV, Reg. S 5.625% 15/06/2021 EUR 5,600,000 6,726,916 0.19
Belfius Bank SA NV, Reg. S 3.125% 11/05/2026 EUR 6,300,000 6,361,808 0.18
Solvay Finance SA, Reg. S, FRN 5.425% Perpetual (France) (2) EUR 3,500,000 3,592,908 0.10
Solvay SA, Reg. S 1.625% 02/12/2022 EUR 8,300,000 8,753,268 0.24UCB SA, Reg. S 4.125% 04/01/2021 EUR 4,705,000 5,307,499 0.15UCB SA, Reg. S 1.875% 02/04/2022 EUR 4,700,000 4,826,195 0.13
131,215,424 3.65
BrazilBRF SA, Reg. S 2.75% 03/06/2022 EUR 6,750,000 6,647,063 0.19Petrobras Global Finance BV 4.875%
07/03/2018 (Netherlands) (2) EUR 7,700,000 7,699,268 0.21Petrobras Global Finance BV 3.75%
14/01/2021 (Netherlands) (2) EUR 4,550,000 3,998,950 0.11Vale SA 3.75% 10/01/2023 EUR 14,000,000 12,532,940 0.35
30,878,221 0.86
ChinaCNOOC Curtis Funding No. 1 Pty. Ltd.,
Reg. S 2.75% 03/10/2020 (Australia) (2) EUR 6,435,000 6,861,842 0.19Sinopec Group Overseas Development
2013 Ltd., Reg. S 2.625% 17/10/2020 (British Virgin Islands) (2) EUR 8,450,000 9,024,332 0.25
Sinopec Group Overseas Development 2015 Ltd., Reg. S 1% 28/04/2022 (British Virgin Islands) (2) EUR 10,000,000 9,883,568 0.28
Three Gorges Finance II Cayman Islands Ltd., Reg. S 1.7% 10/06/2022 (Cayman Islands) (2) EUR 24,000,000 24,752,160 0.69
50,521,902 1.41
ColombiaEcopetrol SA 5.875% 18/09/2023 USD 6,690,000 6,204,307 0.17
6,204,307 0.17
CyprusAroundtown Property Holdings plc, Reg. S
1.5% 03/05/2022 EUR 10,400,000 10,150,513 0.28
10,150,513 0.28
DenmarkDONG Energy A/S, Reg. S, FRN 6.25%
26/06/3013 (1) EUR 1,440,000 1,577,940 0.04DONG Energy A/S, Reg. S, FRN 3%
06/11/3015 EUR 2,700,000 2,656,463 0.07
SCHEDULE OF INVESTMENTSAs at 30 June 2016
Investments Currency
Quantity/Nominal
Value
Market Value EUR
% of Net Assets
Transferable securities and money market instruments admitted to official exchange listing or dealt in on another regulated market
Corporate Bonds (continued)
Denmark (continued)ISS Global A/S, Reg. S 1.125%
09/01/2020 EUR 13,500,000 13,793,560 0.39ISS Global A/S, Reg. S 1.125%
07/01/2021 EUR 8,750,000 8,944,836 0.25Nykredit Realkredit A/S, Reg. S, FRN 4%
03/06/2036 EUR 11,700,000 11,455,294 0.32
38,428,093 1.07
FinlandCitycon Treasury BV, Reg. S 2.375%
16/09/2022 (Netherlands) (1) (2) EUR 10,500,000 11,365,673 0.32Saastopankkien Keskuspankki Suomi OYJ,
Reg. S 1% 06/05/2020 EUR 11,500,000 11,581,707 0.32SATO OYJ, Reg. S 2.25% 10/09/2020 EUR 11,100,000 11,452,370 0.32SATO OYJ, Reg. S 2.375% 24/03/2021 EUR 12,320,000 12,702,474 0.35Transmission Finance DAC, Reg. S 1.5%
24/05/2023 (Ireland) (1) (2) EUR 7,200,000 7,401,866 0.21
54,504,090 1.52
FranceAreva SA, Reg. S 4.625% 05/10/2017 (1) EUR 2,400,000 2,331,648 0.07Areva SA, Reg. S 3.25% 04/09/2020 EUR 9,500,000 7,916,255 0.22AXA SA, Reg. S, FRN 5.25% 16/04/2040 EUR 4,700,000 5,196,684 0.15AXA SA, Reg. S, FRN 5.125%
04/07/2043 EUR 2,100,000 2,398,442 0.07AXA SA, Reg. S, FRN 3.875% Perpetual EUR 3,200,000 3,155,411 0.09AXA SA, Reg. S, FRN 3.941% Perpetual (1) EUR 3,000,000 2,969,205 0.08Banque Federative du Credit Mutuel SA,
Reg. S 2.375% 24/03/2026 EUR 14,500,000 14,421,345 0.40BNP Paribas Cardif SA, Reg. S, FRN
4.032% Perpetual EUR 7,700,000 7,394,864 0.21BNP Paribas SA, Reg. S 2.375%
17/02/2025 (1) EUR 7,000,000 6,943,138 0.19BNP Paribas SA, Reg. S 2.75%
27/01/2026 (1) EUR 7,450,000 7,502,433 0.21BNP Paribas SA, Reg. S 2.875%
01/10/2026 (1) EUR 4,000,000 4,052,636 0.11BNP Paribas SA, Reg. S, FRN 2.625%
14/10/2027 EUR 9,150,000 9,232,931 0.26BNP Paribas SA, Reg. S, FRN 6.125%
Perpetual (1) EUR 5,350,000 5,127,627 0.14BPCE SA, 144A 5.15% 21/07/2024 USD 19,125,000 17,958,807 0.50BPCE SA, Reg. S, FRN 2.75%
08/07/2026 EUR 9,000,000 9,142,599 0.25Bureau Veritas SA, Reg. S 3.125%
21/01/2021 EUR 13,600,000 14,745,936 0.41Credit Agricole Assurances SA, Reg. S,
FRN 4.25% Perpetual EUR 11,000,000 10,412,078 0.29Credit Agricole Assurances SA, Reg. S,
FRN 4.5% Perpetual EUR 15,000,000 14,259,412 0.40Credit Agricole SA, Reg. S 2.375%
20/05/2024 EUR 6,000,000 6,756,269 0.19Credit Agricole SA, Reg. S 2.625%
17/03/2027 EUR 10,000,000 9,988,948 0.28Edenred, Reg. S 2.625% 30/10/2020 EUR 4,500,000 4,800,712 0.13Edenred, Reg. S 1.375% 10/03/2025 (1) EUR 15,600,000 15,160,036 0.42Electricite de France SA, Reg. S, FRN 5%
Perpetual EUR 12,000,000 11,316,075 0.32Engie SA, Reg. S, FRN 3% Perpetual EUR 10,500,000 10,792,438 0.30Engie SA, Reg. S, FRN 3.875% Perpetual EUR 6,500,000 6,802,941 0.19
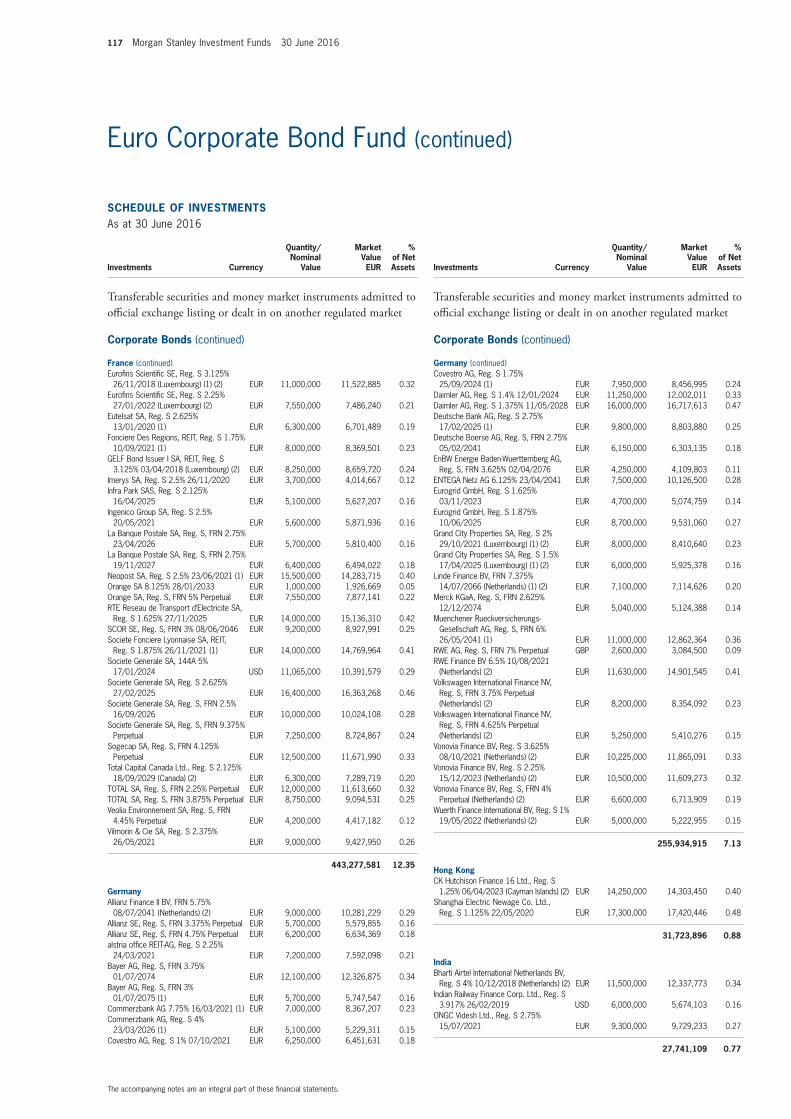
117 Morgan Stanley Investment Funds 30 June 2016
The accompanying notes are an integral part of these financial statements.
Euro Corporate Bond Fund (continued)
SCHEDULE OF INVESTMENTSAs at 30 June 2016
Investments Currency
Quantity/Nominal
Value
Market Value EUR
% of Net Assets
Transferable securities and money market instruments admitted to official exchange listing or dealt in on another regulated market
Corporate Bonds (continued)
France (continued)Eurofins Scientific SE, Reg. S 3.125%
26/11/2018 (Luxembourg) (1) (2) EUR 11,000,000 11,522,885 0.32Eurofins Scientific SE, Reg. S 2.25%
27/01/2022 (Luxembourg) (2) EUR 7,550,000 7,486,240 0.21Eutelsat SA, Reg. S 2.625%
13/01/2020 (1) EUR 6,300,000 6,701,489 0.19Fonciere Des Regions, REIT, Reg. S 1.75%
10/09/2021 (1) EUR 8,000,000 8,369,501 0.23GELF Bond Issuer I SA, REIT, Reg. S
3.125% 03/04/2018 (Luxembourg) (2) EUR 8,250,000 8,659,720 0.24Imerys SA, Reg. S 2.5% 26/11/2020 EUR 3,700,000 4,014,667 0.12Infra Park SAS, Reg. S 2.125%
16/04/2025 EUR 5,100,000 5,627,207 0.16Ingenico Group SA, Reg. S 2.5%
20/05/2021 EUR 5,600,000 5,871,936 0.16La Banque Postale SA, Reg. S, FRN 2.75%
23/04/2026 EUR 5,700,000 5,810,400 0.16La Banque Postale SA, Reg. S, FRN 2.75%
19/11/2027 EUR 6,400,000 6,494,022 0.18Neopost SA, Reg. S 2.5% 23/06/2021 (1) EUR 15,500,000 14,283,715 0.40Orange SA 8.125% 28/01/2033 EUR 1,000,000 1,926,669 0.05Orange SA, Reg. S, FRN 5% Perpetual EUR 7,550,000 7,877,141 0.22RTE Reseau de Transport d’Electricite SA,
Reg. S 1.625% 27/11/2025 EUR 14,000,000 15,136,310 0.42SCOR SE, Reg. S, FRN 3% 08/06/2046 EUR 9,200,000 8,927,991 0.25Societe Fonciere Lyonnaise SA, REIT,
Reg. S 1.875% 26/11/2021 (1) EUR 14,000,000 14,769,964 0.41Societe Generale SA, 144A 5%
17/01/2024 USD 11,065,000 10,391,579 0.29Societe Generale SA, Reg. S 2.625%
27/02/2025 EUR 16,400,000 16,363,268 0.46Societe Generale SA, Reg. S, FRN 2.5%
16/09/2026 EUR 10,000,000 10,024,108 0.28Societe Generale SA, Reg. S, FRN 9.375%
Perpetual EUR 7,250,000 8,724,867 0.24Sogecap SA, Reg. S, FRN 4.125%
Perpetual EUR 12,500,000 11,671,990 0.33Total Capital Canada Ltd., Reg. S 2.125%
18/09/2029 (Canada) (2) EUR 6,300,000 7,289,719 0.20TOTAL SA, Reg. S, FRN 2.25% Perpetual EUR 12,000,000 11,613,660 0.32TOTAL SA, Reg. S, FRN 3.875% Perpetual EUR 8,750,000 9,094,531 0.25Veolia Environnement SA, Reg. S, FRN
4.45% Perpetual EUR 4,200,000 4,417,182 0.12Vilmorin & Cie SA, Reg. S 2.375%
26/05/2021 EUR 9,000,000 9,427,950 0.26
443,277,581 12.35
GermanyAllianz Finance II BV, FRN 5.75%
08/07/2041 (Netherlands) (2) EUR 9,000,000 10,281,229 0.29Allianz SE, Reg. S, FRN 3.375% Perpetual EUR 5,700,000 5,579,855 0.16Allianz SE, Reg. S, FRN 4.75% Perpetual EUR 6,200,000 6,634,369 0.18alstria office REIT-AG, Reg. S 2.25%
24/03/2021 EUR 7,200,000 7,592,098 0.21Bayer AG, Reg. S, FRN 3.75%
01/07/2074 EUR 12,100,000 12,326,875 0.34Bayer AG, Reg. S, FRN 3%
01/07/2075 (1) EUR 5,700,000 5,747,547 0.16Commerzbank AG 7.75% 16/03/2021 (1) EUR 7,000,000 8,367,207 0.23Commerzbank AG, Reg. S 4%
23/03/2026 (1) EUR 5,100,000 5,229,311 0.15Covestro AG, Reg. S 1% 07/10/2021 EUR 6,250,000 6,451,631 0.18
SCHEDULE OF INVESTMENTSAs at 30 June 2016
Investments Currency
Quantity/Nominal
Value
Market Value EUR
% of Net Assets
Transferable securities and money market instruments admitted to official exchange listing or dealt in on another regulated market
Corporate Bonds (continued)
Germany (continued)Covestro AG, Reg. S 1.75%
25/09/2024 (1) EUR 7,950,000 8,456,995 0.24Daimler AG, Reg. S 1.4% 12/01/2024 EUR 11,250,000 12,002,011 0.33Daimler AG, Reg. S 1.375% 11/05/2028 EUR 16,000,000 16,717,613 0.47Deutsche Bank AG, Reg. S 2.75%
17/02/2025 (1) EUR 9,800,000 8,803,880 0.25Deutsche Boerse AG, Reg. S, FRN 2.75%
05/02/2041 EUR 6,150,000 6,303,135 0.18EnBW Energie Baden-Wuerttemberg AG,
Reg. S, FRN 3.625% 02/04/2076 EUR 4,250,000 4,109,803 0.11ENTEGA Netz AG 6.125% 23/04/2041 EUR 7,500,000 10,126,500 0.28Eurogrid GmbH, Reg. S 1.625%
03/11/2023 EUR 4,700,000 5,074,759 0.14Eurogrid GmbH, Reg. S 1.875%
10/06/2025 EUR 8,700,000 9,531,060 0.27Grand City Properties SA, Reg. S 2%
29/10/2021 (Luxembourg) (1) (2) EUR 8,000,000 8,410,640 0.23Grand City Properties SA, Reg. S 1.5%
17/04/2025 (Luxembourg) (1) (2) EUR 6,000,000 5,925,378 0.16Linde Finance BV, FRN 7.375%
14/07/2066 (Netherlands) (1) (2) EUR 7,100,000 7,114,626 0.20Merck KGaA, Reg. S, FRN 2.625%
12/12/2074 EUR 5,040,000 5,124,388 0.14Muenchener Rueckversicherungs-
Gesellschaft AG, Reg. S, FRN 6% 26/05/2041 (1) EUR 11,000,000 12,862,364 0.36
RWE AG, Reg. S, FRN 7% Perpetual GBP 2,600,000 3,084,500 0.09RWE Finance BV 6.5% 10/08/2021
(Netherlands) (2) EUR 11,630,000 14,901,545 0.41Volkswagen International Finance NV,
Reg. S, FRN 3.75% Perpetual (Netherlands) (2) EUR 8,200,000 8,354,092 0.23
Volkswagen International Finance NV, Reg. S, FRN 4.625% Perpetual (Netherlands) (2) EUR 5,250,000 5,410,276 0.15
Vonovia Finance BV, Reg. S 3.625% 08/10/2021 (Netherlands) (2) EUR 10,225,000 11,865,091 0.33
Vonovia Finance BV, Reg. S 2.25% 15/12/2023 (Netherlands) (2) EUR 10,500,000 11,609,273 0.32
Vonovia Finance BV, Reg. S, FRN 4% Perpetual (Netherlands) (2) EUR 6,600,000 6,713,909 0.19
Wuerth Finance International BV, Reg. S 1% 19/05/2022 (Netherlands) (2) EUR 5,000,000 5,222,955 0.15
255,934,915 7.13
Hong KongCK Hutchison Finance 16 Ltd., Reg. S
1.25% 06/04/2023 (Cayman Islands) (2) EUR 14,250,000 14,303,450 0.40Shanghai Electric Newage Co. Ltd.,
Reg. S 1.125% 22/05/2020 EUR 17,300,000 17,420,446 0.48
31,723,896 0.88
IndiaBharti Airtel International Netherlands BV,
Reg. S 4% 10/12/2018 (Netherlands) (2) EUR 11,500,000 12,337,773 0.34Indian Railway Finance Corp. Ltd., Reg. S
3.917% 26/02/2019 USD 6,000,000 5,674,103 0.16ONGC Videsh Ltd., Reg. S 2.75%
15/07/2021 EUR 9,300,000 9,729,233 0.27
27,741,109 0.77

Morgan Stanley Investment Funds 30 June 2016 118
The accompanying notes are an integral part of these financial statements.
Euro Corporate Bond Fund (continued)
SCHEDULE OF INVESTMENTSAs at 30 June 2016
Investments Currency
Quantity/Nominal
Value
Market Value EUR
% of Net Assets
Transferable securities and money market instruments admitted to official exchange listing or dealt in on another regulated market
Corporate Bonds (continued)
IrelandBank of Ireland, Reg. S 1.25%
09/04/2020 EUR 1,874,000 1,915,153 0.05CRH Finland Services OYJ, Reg. S 2.75%
15/10/2020 (Finland) (2) EUR 5,600,000 6,123,994 0.17Kerry Group Financial Services, Reg. S
2.375% 10/09/2025 EUR 6,350,000 7,124,163 0.20Ryanair Ltd., Reg. S 1.875% 17/06/2021 EUR 6,385,000 6,758,571 0.19Ryanair Ltd., Reg. S 1.125% 10/03/2023 EUR 5,600,000 5,655,596 0.16
27,577,477 0.77
ItalyAssicurazioni Generali SpA, Reg. S 2.875%
14/01/2020 (1) EUR 3,000,000 3,242,391 0.09Assicurazioni Generali SpA, Reg. S 5.125%
16/09/2024 (1) EUR 6,000,000 7,731,012 0.22Assicurazioni Generali SpA, Reg. S, FRN
10.125% 10/07/2042 EUR 8,000,000 10,196,126 0.28Assicurazioni Generali SpA, Reg. S, FRN
7.75% 12/12/2042 EUR 2,100,000 2,436,813 0.07Assicurazioni Generali SpA, Reg. S, FRN
5.5% 27/10/2047 (1) EUR 13,500,000 13,860,585 0.39CDP Reti SpA, Reg. S 1.875%
29/05/2022 EUR 8,700,000 9,051,889 0.25Davide Campari-Milano SpA 5.375%
14/10/2016 EUR 9,000,000 9,127,710 0.25Davide Campari-Milano SpA, Reg. S 4.5%
25/10/2019 (1) EUR 2,200,000 2,429,493 0.07Enel SpA, Reg. S, FRN 5% 15/01/2075 EUR 12,500,000 13,188,187 0.37Eni SpA, Reg. S 3.625% 29/01/2029 EUR 4,125,000 5,163,539 0.14FCA Capital Ireland plc, Reg. S 2.875%
26/01/2018 (Ireland) (2) EUR 6,700,000 6,940,339 0.19FCA Capital Ireland plc, Reg. S 2.625%
17/04/2019 (Ireland) (2) EUR 3,900,000 4,086,608 0.11FCA Capital Ireland plc, Reg. S 2%
23/10/2019 (Ireland) (2) EUR 6,400,000 6,595,825 0.18FCA Capital Ireland plc, Reg. S 1.375%
17/04/2020 (Ireland) (2) EUR 6,800,000 6,869,190 0.19Intesa Sanpaolo SpA, Reg. S, FRN 0.787%
15/06/2020 EUR 15,000,000 14,982,150 0.42Intesa Sanpaolo SpA, 144A 6.5%
24/02/2021 USD 26,000,000 26,537,243 0.74Intesa Sanpaolo SpA 5.25% 12/01/2024 USD 21,490,000 20,725,332 0.58Intesa Sanpaolo Vita SpA 5.35%
18/09/2018 EUR 5,300,000 5,759,998 0.16Iren SpA, Reg. S 2.75% 02/11/2022 (1) EUR 6,100,000 6,702,863 0.19Poste Vita SpA 2.875% 30/05/2019 (1) EUR 5,400,000 5,609,129 0.16Snam SpA, Reg. S 5.25% 19/09/2022 EUR 7,450,000 9,620,729 0.27Societa Esercizi Aereoportuali SpA 3.125%
17/04/2021 (1) EUR 5,425,000 5,690,608 0.16Telecom Italia Finance SA 7.75%
24/01/2033 (Luxembourg) (2) EUR 6,000,000 8,006,280 0.22UniCredit SpA, Reg. S 0.75%
30/04/2025 (1) EUR 9,850,000 9,968,180 0.28UniCredit SpA, Reg. S, FRN 4.375%
03/01/2027 EUR 10,000,000 9,749,150 0.27
224,271,369 6.25
SCHEDULE OF INVESTMENTSAs at 30 June 2016
Investments Currency
Quantity/Nominal
Value
Market Value EUR
% of Net Assets
Transferable securities and money market instruments admitted to official exchange listing or dealt in on another regulated market
Corporate Bonds (continued)
JapanSumitomo Mitsui Banking Corp., Reg. S
2.25% 16/12/2020 (1) EUR 12,300,000 13,342,549 0.37Sumitomo Mitsui Financial Group, Inc.,
Reg. S 1.546% 15/06/2026 EUR 16,800,000 17,170,641 0.48
30,513,190 0.85
LuxembourgSES GLOBAL Americas Holdings GP,
Reg. S 1.875% 24/10/2018 (United States of America) (2) EUR 6,000,000 6,237,277 0.17
6,237,277 0.17
MexicoFomento Economico Mexicano SAB de CV,
Reg. S 1.75% 20/03/2023 EUR 8,900,000 9,100,989 0.25Petroleos Mexicanos, Reg. S 5.5%
09/01/2017 EUR 6,800,000 6,967,722 0.19Petroleos Mexicanos, Reg. S 3.125%
27/11/2020 (1) EUR 4,050,000 4,169,981 0.12Petroleos Mexicanos, Reg. S 3.75%
16/04/2026 EUR 3,325,000 3,118,642 0.09
23,357,334 0.65
NetherlandsABN AMRO Bank NV, Reg. S 6.375%
27/04/2021 (1) EUR 11,500,000 13,762,526 0.38ABN AMRO Bank NV, Reg. S, FRN 2.875%
30/06/2025 EUR 10,650,000 10,891,329 0.30Achmea Bank NV, Reg. S 2.75%
18/02/2021 (1) EUR 10,000,000 10,910,602 0.30Achmea BV, Reg. S 2.5% 19/11/2020 EUR 4,000,000 4,381,354 0.12Achmea BV, Reg. S, FRN 6% 04/04/2043 EUR 1,200,000 1,253,171 0.04Achmea BV, Reg. S, FRN 4.25% Perpetual EUR 8,175,000 7,188,502 0.20Aegon NV, Reg. S, FRN 4% 25/04/2044 EUR 3,650,000 3,335,208 0.09ASR Nederland NV, Reg. S, FRN 5.125%
29/09/2045 EUR 12,650,000 12,868,212 0.36ASR Nederland NV, Reg. S, FRN 5%
Perpetual EUR 27,490,000 27,240,748 0.76Cooperatieve Rabobank UA, FRN, 144A
11% Perpetual USD 2,675,000 2,910,101 0.08Cooperatieve Rabobank UA, Reg. S
6.875% 19/03/2020 EUR 15,400,000 18,085,375 0.50Cooperatieve Rabobank UA, Reg. S, FRN
2.5% 26/05/2026 EUR 18,500,000 18,831,425 0.53Cooperatieve Rabobank UA, Reg. S, FRN
5.5% Perpetual EUR 15,950,000 15,256,574 0.43Delta Lloyd NV, Reg. S, FRN 4.375%
Perpetual EUR 2,550,000 1,919,194 0.05ING Bank NV, Reg. S, FRN 3.5%
21/11/2023 EUR 13,000,000 13,649,533 0.38ING Bank NV, Reg. S, FRN 3.625%
25/02/2026 (1) EUR 6,850,000 7,311,153 0.20JAB Holdings BV, Reg. S 1.75%
25/05/2023 EUR 5,100,000 5,278,828 0.15JAB Holdings BV, Reg. S 1.625%
30/04/2025 EUR 11,800,000 11,857,743 0.33

119 Morgan Stanley Investment Funds 30 June 2016
The accompanying notes are an integral part of these financial statements.
Euro Corporate Bond Fund (continued)
SCHEDULE OF INVESTMENTSAs at 30 June 2016
Investments Currency
Quantity/Nominal
Value
Market Value EUR
% of Net Assets
Transferable securities and money market instruments admitted to official exchange listing or dealt in on another regulated market
Corporate Bonds (continued)
Netherlands (continued)LeasePlan Corp. NV 2.375%
23/04/2019 (1) EUR 6,250,000 6,591,796 0.18LeasePlan Corp. NV, Reg. S 1%
24/05/2021 EUR 8,700,000 8,743,362 0.24Nederlandse Gasunie NV, Reg. S 1%
11/05/2026 EUR 7,150,000 7,410,832 0.21NIBC Bank NV, Reg. S 2% 26/07/2018 EUR 9,200,000 9,352,488 0.26NN Group NV, Reg. S, FRN 4.625%
08/04/2044 (1) EUR 8,050,000 8,152,195 0.23Shell International Finance BV 3.25%
11/05/2025 USD 25,100,000 23,685,298 0.66SNS Bank NV, Reg. S, FRN 3.75%
05/11/2025 EUR 6,650,000 6,531,903 0.18SRLEV NV, FRN 9% 15/04/2041 EUR 6,850,000 7,013,441 0.20Vesteda Finance BV, Reg. S 1.75%
22/07/2019 EUR 12,757,000 13,216,635 0.37Vesteda Finance BV, Reg. S 2.5%
27/10/2022 EUR 10,300,000 11,217,318 0.31
288,846,846 8.04
NorwayDNB Bank ASA, Reg. S, FRN 3%
26/09/2023 EUR 9,800,000 10,152,571 0.29SpareBank 1 SR-Bank ASA, Reg. S 2.125%
14/04/2021 EUR 16,500,000 17,677,803 0.49
27,830,374 0.78
PolandPowszechna Kasa Oszczednosci Bank
Polski SA, Reg. S 2.324% 23/01/2019 (Sweden) (2) EUR 13,750,000 14,217,768 0.40
14,217,768 0.40
PortugalBrisa Concessao Rodoviaria SA, Reg. S
3.875% 01/04/2021 EUR 7,500,000 8,529,375 0.24Brisa Concessao Rodoviaria SA, Reg. S
1.875% 30/04/2025 EUR 9,900,000 9,787,338 0.27EDP Finance BV, Reg. S 2.625%
15/04/2019 (Netherlands) (1) (2) EUR 6,150,000 6,480,152 0.18EDP Finance BV, Reg. S 2.625%
18/01/2022 (Netherlands) (2) EUR 12,100,000 12,762,173 0.35Ren Finance BV, Reg. S 2.5% 12/02/2025
(Netherlands) (2) EUR 4,650,000 4,933,464 0.14
42,492,502 1.18
QatarCBQ Finance Ltd., Reg. S 2.875%
24/06/2019 (Bermuda) (2) USD 6,250,000 5,696,960 0.16Ooredoo International Finance Ltd., Reg. S
3.25% 21/02/2023 (Bermuda) (1) (2) USD 3,250,000 2,959,803 0.08QNB Finance Ltd., Reg. S 2.75%
31/10/2018 (Cayman Islands) (2) USD 6,900,000 6,321,162 0.18
14,977,925 0.42
SCHEDULE OF INVESTMENTSAs at 30 June 2016
Investments Currency
Quantity/Nominal
Value
Market Value EUR
% of Net Assets
Transferable securities and money market instruments admitted to official exchange listing or dealt in on another regulated market
Corporate Bonds (continued)
RussiaGazprom OAO, Reg. S 3.7% 25/07/2018
(Luxembourg) (1) (2) EUR 7,000,000 7,291,585 0.20
7,291,585 0.20
Saudi ArabiaSABIC Capital I BV, Reg. S 2.75%
20/11/2020 (Netherlands) (1) (2) EUR 3,800,000 4,055,708 0.11
4,055,708 0.11
SlovakiaSPP Infrastructure Financing BV, Reg. S
3.75% 18/07/2020 (Netherlands) (2) EUR 5,350,000 5,922,880 0.17SPP-Distribucia A/S, Reg. S 2.625%
23/06/2021 EUR 8,190,000 8,790,932 0.24Zapadoslovenska Energetika A/S, Reg. S
4% 14/10/2023 EUR 3,500,000 4,165,805 0.12
18,879,617 0.53
South KoreaIndustrial Bank of Korea, Reg. S 2%
30/10/2018 EUR 8,150,000 8,473,245 0.24Korea Gas Corp., Reg. S 2.375%
15/04/2019 EUR 7,325,000 7,744,453 0.21
16,217,698 0.45
SpainBBVA Subordinated Capital SAU, Reg. S,
FRN 3.5% 11/04/2024 EUR 20,500,000 20,904,406 0.58CaixaBank SA, Reg. S, FRN 5%
14/11/2023 (1) EUR 15,200,000 15,753,280 0.44Cellnex Telecom SAU, Reg. S 3.125%
27/07/2022 (1) EUR 19,800,000 20,347,272 0.57Criteria Caixa SA, Reg. S 1.625%
21/04/2022 (1) EUR 12,500,000 12,269,878 0.34Distribuidora Internacional de Alimentacion
SA, Reg. S 1.5% 22/07/2019 EUR 11,500,000 11,860,236 0.33Gas Natural Fenosa Finance BV, Reg. S
3.5% 15/04/2021 (Netherlands) (2) EUR 4,900,000 5,627,982 0.16Gas Natural Fenosa Finance BV, Reg. S,
FRN 3.375% Perpetual (Netherlands) (1) (2) EUR 14,300,000 12,791,350 0.36
Gas Natural Fenosa Finance BV, Reg. S, FRN 4.125% Perpetual (Netherlands) (2) EUR 7,100,000 7,006,706 0.19
Iberdrola International BV, Reg. S 1.125% 27/01/2023 (Netherlands) (2) EUR 4,500,000 4,663,570 0.13
Iberdrola International BV, Reg. S 1.875% 08/10/2024 (Netherlands) (2) EUR 8,200,000 8,961,313 0.25
IE2 Holdco SAU, Reg. S 2.875% 01/06/2026 EUR 15,200,000 15,336,800 0.43
Inmobiliaria Colonial SA, Reg. S 1.863% 05/06/2019 (1) EUR 16,500,000 17,076,395 0.48
Inmobiliaria Colonial SA, Reg. S 2.728% 05/06/2023 EUR 6,300,000 6,659,623 0.18
Mapfre SA, Reg. S 1.625% 19/05/2026 EUR 15,200,000 15,267,337 0.42Prosegur Cia de Seguridad SA, Reg. S
2.75% 02/04/2018 EUR 9,700,000 10,138,634 0.28

Morgan Stanley Investment Funds 30 June 2016 120
The accompanying notes are an integral part of these financial statements.
Euro Corporate Bond Fund (continued)
SCHEDULE OF INVESTMENTSAs at 30 June 2016
Investments Currency
Quantity/Nominal
Value
Market Value EUR
% of Net Assets
Transferable securities and money market instruments admitted to official exchange listing or dealt in on another regulated market
Corporate Bonds (continued)
Spain (continued)Repsol International Finance BV, Reg. S
2.125% 16/12/2020 (Netherlands) (1) (2) EUR 14,200,000 15,077,715 0.42
Repsol International Finance BV, Reg. S 3.625% 07/10/2021 (Netherlands) (1) (2) EUR 10,600,000 12,116,898 0.34
Santander Consumer Finance SA, Reg. S 1.5% 12/11/2020 EUR 9,600,000 9,824,090 0.27
Santander Issuances SAU 5.179% 19/11/2025 USD 16,800,000 15,062,784 0.42
Telefonica Europe BV, Reg. S, FRN 4.2% Perpetual (Netherlands) (1) (2) EUR 6,300,000 6,274,044 0.18
Telefonica Europe BV, Reg. S, FRN 5.875% Perpetual (Netherlands) (2) EUR 3,500,000 3,580,955 0.10
Telefonica Europe BV, Reg. S, FRN 6.5% Perpetual (Netherlands) (2) EUR 4,000,000 4,201,020 0.12
Telefonica Europe BV, Reg. S, FRN 7.625% Perpetual (Netherlands) (1) (2) EUR 4,600,000 5,112,900 0.14
255,915,188 7.13
SwedenAlfa Laval Treasury International AB, Reg. S
1.375% 12/09/2022 (1) EUR 4,500,000 4,688,759 0.13Nordea Bank AB, Reg. S, FRN 1.875%
10/11/2025 EUR 5,300,000 5,354,187 0.15Svenska Handelsbanken AB, Reg. S, FRN
2.656% 15/01/2024 EUR 8,900,000 9,223,433 0.26Swedbank AB, Reg. S, FRN 2.375%
26/02/2024 (1) EUR 5,000,000 5,140,396 0.14
24,406,775 0.68
SwitzerlandCredit Suisse AG, Reg. S, FRN 5.75%
18/09/2025 EUR 5,100,000 5,409,850 0.15Credit Suisse Group Funding Guernsey
Ltd., Reg. S 1.25% 14/04/2022 (Guernsey) (1) (2) EUR 14,850,000 14,518,248 0.40
Glencore Finance Europe SA, Reg. S 4.625% 03/04/2018 (Luxembourg) (1) (2) EUR 3,500,000 3,697,094 0.10
Glencore Finance Europe SA, Reg. S 1.25% 17/03/2021 (Luxembourg) (1) (2) EUR 7,000,000 6,470,800 0.18
Glencore Finance Europe SA, Reg. S 1.625% 18/01/2022 (Luxembourg) (1) (2) EUR 8,600,000 7,827,612 0.22
Glencore Finance Europe SA, Reg. S 1.75% 17/03/2025 (Luxembourg) (1) (2) EUR 9,750,000 8,117,363 0.23
UBS AG, Reg. S 5.125% 15/05/2024 USD 8,500,000 7,812,210 0.22UBS Group Funding Jersey Ltd., Reg. S
1.75% 16/11/2022 (Jersey) (1) (2) EUR 10,850,000 11,326,779 0.31Zurich Insurance Co. Ltd., FRN 7.5%
24/07/2039 (Ireland) (1) (2) EUR 9,500,000 11,042,895 0.31Zurich Insurance Co. Ltd., Reg. S, FRN
4.25% 02/10/2043 (Ireland) (2) EUR 3,000,000 3,263,461 0.09
79,486,312 2.21
SCHEDULE OF INVESTMENTSAs at 30 June 2016
Investments Currency
Quantity/Nominal
Value
Market Value EUR
% of Net Assets
Transferable securities and money market instruments admitted to official exchange listing or dealt in on another regulated market
Corporate Bonds (continued)
TurkeyTurkiye Vakiflar Bankasi TAO, Reg. S
2.375% 04/05/2021 EUR 5,275,000 5,294,438 0.15
5,294,438 0.15
United Arab EmiratesAbu Dhabi National Energy Co. PJSC,
Reg. S 3.625% 12/01/2023 USD 7,000,000 6,522,089 0.18ADCB Finance Cayman Ltd., Reg. S 2.5%
06/03/2018 (Cayman Islands) (2) USD 9,000,000 8,138,530 0.23ADCB Finance Cayman Ltd., Reg. S 3%
04/03/2019 (Cayman Islands) (1) (2) USD 3,200,000 2,925,624 0.08Emirates NBD PJSC, Reg. S 1.75%
23/03/2022 EUR 14,000,000 13,942,425 0.39Emirates Telecommunications Group Co.
PJSC, Reg. S 1.75% 18/06/2021 (1) EUR 13,890,000 14,485,480 0.41IPIC GMTN Ltd., Reg. S 2.375%
30/05/2018 (Cayman Islands) (1) (2) EUR 1,750,000 1,823,491 0.05IPIC GMTN Ltd., Reg. S 5.875%
14/03/2021 (Cayman Islands) (1) (2) EUR 8,000,000 9,815,000 0.27
57,652,639 1.61
United KingdomAnglo American Capital plc, Reg. S 1.75%
20/11/2017 (1) EUR 2,335,000 2,322,940 0.06Aviva plc, Reg. S, FRN 6.875%
22/05/2038 EUR 5,200,000 5,606,271 0.16Aviva plc, Reg. S, FRN 6.125%
05/07/2043 EUR 2,200,000 2,441,241 0.07Aviva plc, Reg. S, FRN 3.875%
03/07/2044 EUR 3,600,000 3,475,143 0.10Aviva plc, Reg. S, FRN 3.375%
04/12/2045 EUR 8,850,000 8,206,034 0.23Barclays Bank plc, Reg. S 6%
14/01/2021 EUR 6,200,000 7,020,335 0.20Barclays Bank plc, Reg. S, FRN 14%
Perpetual GBP 900,000 1,322,986 0.04BAT International Finance plc, Reg. S
0.875% 13/10/2023 EUR 26,750,000 26,808,056 0.75BP Capital Markets plc, Reg. S 2.517%
17/02/2021 EUR 7,100,000 7,816,122 0.22BP Capital Markets plc, Reg. S 2.177%
28/09/2021 EUR 7,700,000 8,385,203 0.23BP Capital Markets plc, Reg. S 1.526%
26/09/2022 EUR 11,550,000 12,163,658 0.34British Telecommunications plc, Reg. S
1.75% 10/03/2026 EUR 6,300,000 6,572,922 0.18DS Smith plc, Reg. S 2.25% 16/09/2022 EUR 19,000,000 19,690,336 0.55FCE Bank plc, Reg. S, FRN 0.922%
11/08/2018 EUR 12,900,000 13,066,733 0.36FCE Bank plc, Reg. S 1.134%
10/02/2022 EUR 7,700,000 7,732,842 0.21G4S International Finance plc, Reg. S
2.625% 06/12/2018 EUR 9,250,000 9,677,650 0.27GKN Holdings plc, Reg. S 5.375%
19/09/2022 GBP 3,600,000 4,929,852 0.14Glencore Finance Dubai Ltd. 2.625%
19/11/2018 (United Arab Emirates) (1) (2) EUR 15,075,000 15,365,758 0.43
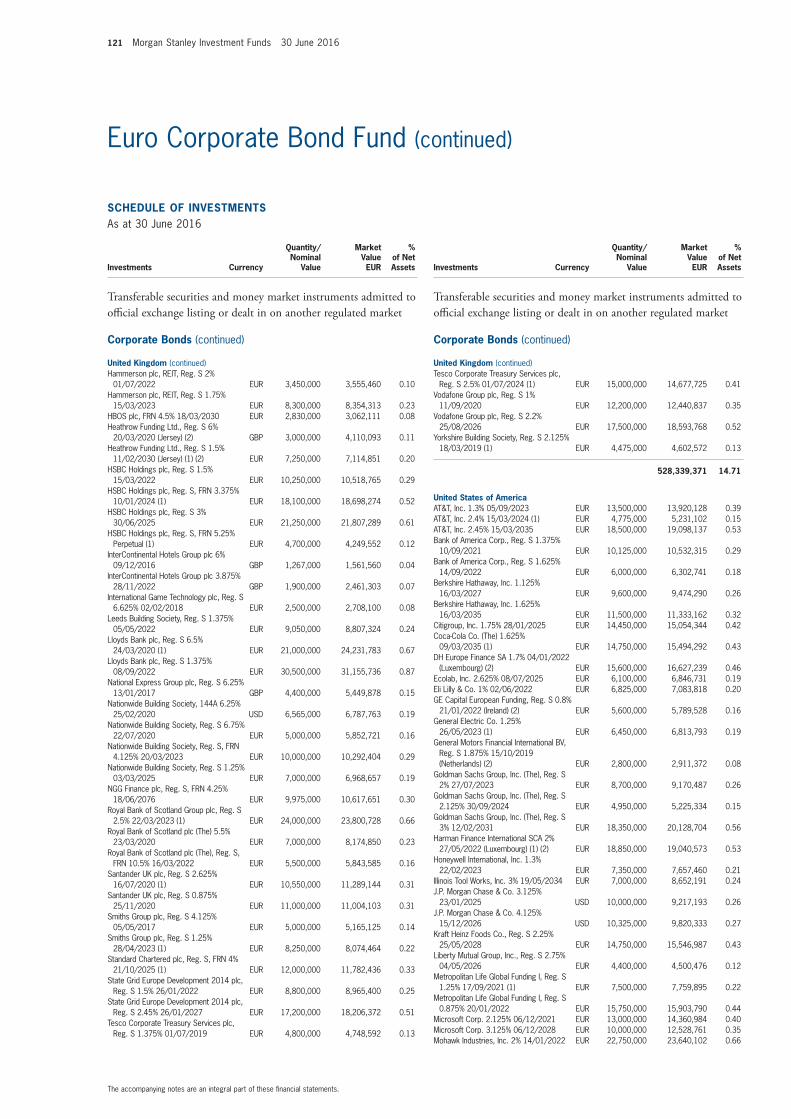
121 Morgan Stanley Investment Funds 30 June 2016
The accompanying notes are an integral part of these financial statements.
Euro Corporate Bond Fund (continued)
SCHEDULE OF INVESTMENTSAs at 30 June 2016
Investments Currency
Quantity/Nominal
Value
Market Value EUR
% of Net Assets
Transferable securities and money market instruments admitted to official exchange listing or dealt in on another regulated market
Corporate Bonds (continued)
United Kingdom (continued)Hammerson plc, REIT, Reg. S 2%
01/07/2022 EUR 3,450,000 3,555,460 0.10Hammerson plc, REIT, Reg. S 1.75%
15/03/2023 EUR 8,300,000 8,354,313 0.23HBOS plc, FRN 4.5% 18/03/2030 EUR 2,830,000 3,062,111 0.08Heathrow Funding Ltd., Reg. S 6%
20/03/2020 (Jersey) (2) GBP 3,000,000 4,110,093 0.11Heathrow Funding Ltd., Reg. S 1.5%
11/02/2030 (Jersey) (1) (2) EUR 7,250,000 7,114,851 0.20HSBC Holdings plc, Reg. S 1.5%
15/03/2022 EUR 10,250,000 10,518,765 0.29HSBC Holdings plc, Reg. S, FRN 3.375%
10/01/2024 (1) EUR 18,100,000 18,698,274 0.52HSBC Holdings plc, Reg. S 3%
30/06/2025 EUR 21,250,000 21,807,289 0.61HSBC Holdings plc, Reg. S, FRN 5.25%
Perpetual (1) EUR 4,700,000 4,249,552 0.12InterContinental Hotels Group plc 6%
09/12/2016 GBP 1,267,000 1,561,560 0.04InterContinental Hotels Group plc 3.875%
28/11/2022 GBP 1,900,000 2,461,303 0.07International Game Technology plc, Reg. S
6.625% 02/02/2018 EUR 2,500,000 2,708,100 0.08Leeds Building Society, Reg. S 1.375%
05/05/2022 EUR 9,050,000 8,807,324 0.24Lloyds Bank plc, Reg. S 6.5%
24/03/2020 (1) EUR 21,000,000 24,231,783 0.67Lloyds Bank plc, Reg. S 1.375%
08/09/2022 EUR 30,500,000 31,155,736 0.87National Express Group plc, Reg. S 6.25%
13/01/2017 GBP 4,400,000 5,449,878 0.15Nationwide Building Society, 144A 6.25%
25/02/2020 USD 6,565,000 6,787,763 0.19Nationwide Building Society, Reg. S 6.75%
22/07/2020 EUR 5,000,000 5,852,721 0.16Nationwide Building Society, Reg. S, FRN
4.125% 20/03/2023 EUR 10,000,000 10,292,404 0.29Nationwide Building Society, Reg. S 1.25%
03/03/2025 EUR 7,000,000 6,968,657 0.19NGG Finance plc, Reg. S, FRN 4.25%
18/06/2076 EUR 9,975,000 10,617,651 0.30Royal Bank of Scotland Group plc, Reg. S
2.5% 22/03/2023 (1) EUR 24,000,000 23,800,728 0.66Royal Bank of Scotland plc (The) 5.5%
23/03/2020 EUR 7,000,000 8,174,850 0.23Royal Bank of Scotland plc (The), Reg. S,
FRN 10.5% 16/03/2022 EUR 5,500,000 5,843,585 0.16Santander UK plc, Reg. S 2.625%
16/07/2020 (1) EUR 10,550,000 11,289,144 0.31Santander UK plc, Reg. S 0.875%
25/11/2020 EUR 11,000,000 11,004,103 0.31Smiths Group plc, Reg. S 4.125%
05/05/2017 EUR 5,000,000 5,165,125 0.14Smiths Group plc, Reg. S 1.25%
28/04/2023 (1) EUR 8,250,000 8,074,464 0.22Standard Chartered plc, Reg. S, FRN 4%
21/10/2025 (1) EUR 12,000,000 11,782,436 0.33State Grid Europe Development 2014 plc,
Reg. S 1.5% 26/01/2022 EUR 8,800,000 8,965,400 0.25State Grid Europe Development 2014 plc,
Reg. S 2.45% 26/01/2027 EUR 17,200,000 18,206,372 0.51Tesco Corporate Treasury Services plc,
Reg. S 1.375% 01/07/2019 EUR 4,800,000 4,748,592 0.13
SCHEDULE OF INVESTMENTSAs at 30 June 2016
Investments Currency
Quantity/Nominal
Value
Market Value EUR
% of Net Assets
Transferable securities and money market instruments admitted to official exchange listing or dealt in on another regulated market
Corporate Bonds (continued)
United Kingdom (continued)Tesco Corporate Treasury Services plc,
Reg. S 2.5% 01/07/2024 (1) EUR 15,000,000 14,677,725 0.41Vodafone Group plc, Reg. S 1%
11/09/2020 EUR 12,200,000 12,440,837 0.35Vodafone Group plc, Reg. S 2.2%
25/08/2026 EUR 17,500,000 18,593,768 0.52Yorkshire Building Society, Reg. S 2.125%
18/03/2019 (1) EUR 4,475,000 4,602,572 0.13
528,339,371 14.71
United States of AmericaAT&T, Inc. 1.3% 05/09/2023 EUR 13,500,000 13,920,128 0.39AT&T, Inc. 2.4% 15/03/2024 (1) EUR 4,775,000 5,231,102 0.15AT&T, Inc. 2.45% 15/03/2035 EUR 18,500,000 19,098,137 0.53Bank of America Corp., Reg. S 1.375%
10/09/2021 EUR 10,125,000 10,532,315 0.29Bank of America Corp., Reg. S 1.625%
14/09/2022 EUR 6,000,000 6,302,741 0.18Berkshire Hathaway, Inc. 1.125%
16/03/2027 EUR 9,600,000 9,474,290 0.26Berkshire Hathaway, Inc. 1.625%
16/03/2035 EUR 11,500,000 11,333,162 0.32Citigroup, Inc. 1.75% 28/01/2025 EUR 14,450,000 15,054,344 0.42Coca-Cola Co. (The) 1.625%
09/03/2035 (1) EUR 14,750,000 15,494,292 0.43DH Europe Finance SA 1.7% 04/01/2022
(Luxembourg) (2) EUR 15,600,000 16,627,239 0.46Ecolab, Inc. 2.625% 08/07/2025 EUR 6,100,000 6,846,731 0.19Eli Lilly & Co. 1% 02/06/2022 EUR 6,825,000 7,083,818 0.20GE Capital European Funding, Reg. S 0.8%
21/01/2022 (Ireland) (2) EUR 5,600,000 5,789,528 0.16General Electric Co. 1.25%
26/05/2023 (1) EUR 6,450,000 6,813,793 0.19General Motors Financial International BV,
Reg. S 1.875% 15/10/2019 (Netherlands) (2) EUR 2,800,000 2,911,372 0.08
Goldman Sachs Group, Inc. (The), Reg. S 2% 27/07/2023 EUR 8,700,000 9,170,487 0.26
Goldman Sachs Group, Inc. (The), Reg. S 2.125% 30/09/2024 EUR 4,950,000 5,225,334 0.15
Goldman Sachs Group, Inc. (The), Reg. S 3% 12/02/2031 EUR 18,350,000 20,128,704 0.56
Harman Finance International SCA 2% 27/05/2022 (Luxembourg) (1) (2) EUR 18,850,000 19,040,573 0.53
Honeywell International, Inc. 1.3% 22/02/2023 EUR 7,350,000 7,657,460 0.21
Illinois Tool Works, Inc. 3% 19/05/2034 EUR 7,000,000 8,652,191 0.24J.P. Morgan Chase & Co. 3.125%
23/01/2025 USD 10,000,000 9,217,193 0.26J.P. Morgan Chase & Co. 4.125%
15/12/2026 USD 10,325,000 9,820,333 0.27Kraft Heinz Foods Co., Reg. S 2.25%
25/05/2028 EUR 14,750,000 15,546,987 0.43Liberty Mutual Group, Inc., Reg. S 2.75%
04/05/2026 EUR 4,400,000 4,500,476 0.12Metropolitan Life Global Funding I, Reg. S
1.25% 17/09/2021 (1) EUR 7,500,000 7,759,895 0.22Metropolitan Life Global Funding I, Reg. S
0.875% 20/01/2022 EUR 15,750,000 15,903,790 0.44Microsoft Corp. 2.125% 06/12/2021 EUR 13,000,000 14,360,984 0.40Microsoft Corp. 3.125% 06/12/2028 EUR 10,000,000 12,528,761 0.35Mohawk Industries, Inc. 2% 14/01/2022 EUR 22,750,000 23,640,102 0.66

Morgan Stanley Investment Funds 30 June 2016 122
The accompanying notes are an integral part of these financial statements.
Euro Corporate Bond Fund (continued)
SCHEDULE OF INVESTMENTSAs at 30 June 2016
Investments Currency
Quantity/Nominal
Value
Market Value EUR
% of Net Assets
Transferable securities and money market instruments admitted to official exchange listing or dealt in on another regulated market
Corporate Bonds (continued)
United States of America (continued)Mondelez International, Inc. 2.375%
06/03/2035 EUR 8,300,000 8,593,485 0.24MPT Operating Partnership LP, REIT 4%
19/08/2022 (1) EUR 7,800,000 8,131,695 0.23National Grid North America, Inc., Reg. S
0.75% 11/02/2022 EUR 7,700,000 7,730,284 0.21Pentair Finance SA 2.45% 17/09/2019
(Luxembourg) (2) EUR 13,900,000 14,441,641 0.40Simon International Finance SCA, REIT,
Reg. S 1.25% 13/05/2025 (Luxembourg) (2) EUR 8,000,000 8,207,792 0.23
Simon Property Group LP, REIT 2.375% 02/10/2020 EUR 8,900,000 9,681,030 0.27
Time Warner, Inc. 1.95% 15/09/2023 EUR 9,950,000 10,604,863 0.30Trinity Acquisition plc 2.125% 26/05/2022
(United Kingdom) (1) (2) EUR 11,150,000 11,185,232 0.31Tyco International Finance SA 1.375%
25/02/2025 (Luxembourg) (2) EUR 12,500,000 12,387,255 0.34United Parcel Service, Inc. 1.625%
15/11/2025 EUR 7,750,000 8,352,075 0.23United Technologies Corp. 1.25%
22/05/2023 EUR 15,500,000 16,102,562 0.45Wells Fargo & Co., Reg. S 1.5%
12/09/2022 EUR 13,850,000 14,554,962 0.41Wells Fargo & Co., Reg. S 1.625%
02/06/2025 EUR 6,850,000 7,214,194 0.20
472,853,332 13.17
Total Corporate Bonds 3,442,830,191 95.88
Total Transferable securities and money market instruments admitted to official exchange listing or dealt in on another regulated market 3,449,094,401 96.06
Units of authorised UCITS or other collective investment undertakings
Collective Investment Schemes – UCITS
LuxembourgMorgan Stanley Liquidity Funds Euro
Liquidity Fund – MS Reserve (4) EUR 50,550,878 50,550,878 1.41
50,550,878 1.41
Total Collective Investment Schemes – UCITS 50,550,878 1.41
Total Units of authorised UCITS or other collective investment undertakings 50,550,878 1.41
Total Investments 3,499,645,279 97.47
Cash 73,974,382 2.06
Other Assets/(Liabilities) 16,983,441 0.47
Total Net Assets 3,590,603,102 100.00
(1) All or part of this position is out on loan. (2) The country in brackets represents the country of incorporation of this security. (4) Affiliate managed by an affiliate of the Investment Adviser.
Financial Futures Contracts
Security DescriptionNumber of Contracts Currency
Global Exposure
EUR
Unrealised Gain/(Loss)
EUR
% of Net Assets
Euro-Schatz, 08/09/2016 3,579 EUR 401,009,055 957,383 0.03US Long Bond, 21/09/2016 5 USD 777,849 26,987 0.00US 2 Year Note, 30/09/2016 1,106 USD 218,122,081 1,430,207 0.04US 5 Year Note, 30/09/2016 2,416 USD 265,235,497 4,618,404 0.13
Unrealised Gain on Financial Futures Contracts 7,032,981 0.20
Total Unrealised Gain on Financial Futures Contracts 7,032,981 0.20
Euro-Bobl, 08/09/2016 (2,141) EUR (285,930,550) (2,816,695) (0.08)Euro-Bund, 08/09/2016 (2,014) EUR (336,237,300) (7,532,360) (0.21)US 10 Year Note, 21/09/2016 (224) USD (26,784,302) (716,284) (0.02)Long Gilt, 28/09/2016 (55) GBP (8,507,955) (366,992) (0.01)
Unrealised Loss on Financial Futures Contracts (11,432,331) (0.32)
Duration Hedged Share ClassEuro-Bobl, 08/09/2016 (1,508) EUR (201,393,400) (1,925,151) (0.05)Euro-Bund, 08/09/2016 (585) EUR (97,665,750) (2,136,660) (0.06)Euro-Schatz, 08/09/2016 (1,058) EUR (118,543,610) (269,605) (0.01)
Unrealised Loss on Financial Futures Contracts (4,331,416) (0.12)
Total Unrealised Loss on Financial Futures Contracts (15,763,747) (0.44)
Net Unrealised Loss on Financial Futures Contracts (8,730,766) (0.24)
Forward Currency Exchange Contracts
Currency Purchased
Amount Purchased
Currency Sold
Amount Sold
Maturity Date Counterparty
Unrealised Gain/(Loss)
EUR
% of Net Assets
USD 7,000,000 EUR 6,159,236 19/07/2016 J.P. Morgan 134,313 0.00USD 8,000,000 EUR 7,098,555 19/07/2016 RBC 94,073 0.00USD 10,000,000 EUR 8,871,855 19/07/2016 Westpac Banking 118,929 0.01EUR 22,377,535 GBP 17,850,000 20/07/2016 RBC 810,745 0.02
Unrealised Gain on Forward Currency Exchange Contracts 1,158,060 0.03
USD Hedged Share ClassEUR 19,987,817 USD 22,084,538 01/07/2016 J.P. Morgan 121,187 0.00USD 22,084,538 EUR 19,603,575 01/07/2016 J.P. Morgan 263,053 0.01
Unrealised Gain on NAV Hedged Share Classes Forward Currency Exchange Contracts 384,240 0.01
Total Unrealised Gain on Forward Currency Exchange Contracts 1,542,300 0.04
EUR 235,794,938 USD 268,615,000 19/07/2016 Westpac Banking (5,711,002) (0.16)USD 16,000,000 EUR 14,425,026 19/07/2016 J.P. Morgan (39,771) 0.00
Unrealised Loss on Forward Currency Exchange Contracts (5,750,773) (0.16)
USD Hedged Share ClassUSD 21,938,747 EUR 19,850,117 08/07/2016 J.P. Morgan (117,347) 0.00
Unrealised Loss on NAV Hedged Share Classes Forward Currency Exchange Contracts (117,347) 0.00
Total Unrealised Loss on Forward Currency Exchange Contracts (5,868,120) (0.16)
Net Unrealised Loss on Forward Currency Exchange Contracts (4,325,820) (0.12)
DERIVATIVES
Over-the-counter (OTC) and exchange traded derivatives as at 30 June 2016, expressed in Euro.

123 Morgan Stanley Investment Funds 30 June 2016
The accompanying notes are an integral part of these financial statements.
Euro Corporate Bond Fund (continued)
Credit Default Swap Contracts
Nominal Amount Ccy Counterparty
Reference Entity
Buy/Sell
Interest (Paid)/
ReceivedMaturity
Date
Market Value EUR
Unrealised Gain/(Loss)
EUR
% of Net Assets
60,000,000 EUR Societe Generale
iTraxx Europe Senior Financials Series 21
Version 1-FIX Version 1 Sell 1.00% 20/06/2019 288,514 288,514 0.0130,000,000 EUR Societe
GeneraleiTraxx Europe
Series 22 Version 1 Sell 1.00% 20/12/2019 318,425 318,425 0.0120,000,000 EUR Morgan Stanley iTraxx Europe
Series 23 Version 1 Sell 1.00% 20/06/2020 167,204 167,204 0.0015,000,000 EUR Goldman Sachs iTraxx Europe
Series 24 Version 1 Sell 1.00% 20/12/2020 105,911 105,911 0.0045,000,000 EUR Barclays iTraxx Europe
Series 25 Version 1 Sell 1.00% 20/06/2021 325,086 325,086 0.01
Total Unrealised Gain on Credit Default Swap Contracts 1,205,140 1,205,140 0.03
Net Unrealised Gain on Credit Default Swap Contracts 1,205,140 1,205,140 0.03
Interest Rate Swap Contracts
Nominal Amount Ccy Counterparty
Security Description
Maturity Date
Market Value EUR
Unrealised Gain/(Loss)
EUR
% of Net Assets
101,200,000 USD Deutsche Bank Pay fixed 2.748% Receive floating LIBOR
3 month 20/11/2023 (10,634,746) (10,634,746) (0.30)101,000,000 USD Goldman Sachs Pay fixed 2.463%
Receive floating LIBOR 3 month 17/07/2025 (10,337,149) (10,337,149) (0.29)
202,000,000 USD Goldman Sachs Pay fixed 1.776% Receive floating LIBOR
3 month 17/07/2020 (7,510,780) (7,510,780) (0.21)46,700,000 USD Bank of America Pay fixed 3.706%
Receive floating LIBOR 3 month 25/01/2020 (4,839,515) (4,839,515) (0.13)
64,272,000 USD Goldman Sachs Pay fixed 1.714% Receive floating LIBOR
3 month 21/08/2019 (1,892,406) (1,892,406) (0.05)194,000,000 USD Goldman Sachs Pay fixed 1.065%
Receive floating LIBOR 3 month 21/08/2017 (1,269,522) (1,269,522) (0.03)
32,000,000 USD RBS Pay fixed 1.814% Receive floating LIBOR
3 month 04/09/2019 (1,037,170) (1,037,170) (0.03)105,000,000 USD Deutsche Bank Pay fixed 1.184%
Receive floating LIBOR 3 month 04/09/2017 (850,936) (850,936) (0.02)
23,000,000 USD Barclays Pay fixed 1.821% Receive floating LIBOR
3 month 05/09/2019 (747,986) (747,986) (0.02)75,000,000 USD Goldman Sachs Pay fixed 1.186%
Receive floating LIBOR 3 month 05/09/2017 (603,423) (603,423) (0.02)
34,000,000 USD Deutsche Bank Pay fixed 1.2% Receive floating LIBOR
3 month 10/09/2017 (283,898) (283,898) (0.01)7,000,000 USD Deutsche Bank Pay fixed 1.847%
Receive floating LIBOR 3 month 10/09/2019 (233,970) (233,970) (0.01)
Total Unrealised Loss on Interest Rate Swap Contracts (40,241,501) (40,241,501) (1.12)
Net Unrealised Loss on Interest Rate Swap Contracts (40,241,501) (40,241,501) (1.12)
Collateral received and paid by the Fund in respect of financial derivative instruments:
Type of Collateral Counterparty CurrencyCollateral Amount
receivedCollateral Amount
paid
Euro Corporate Bond Fund
Cash Bank of America EUR - 4,718,000Cash Barclays EUR - 566,000Cash Deutsche Bank EUR - 11,988,000Cash Goldman Sachs EUR 22,699,636 21,827,550Cash Morgan Stanley EUR 345,000 -Cash RBS EUR - 931,000Cash Societe Generale EUR 321,000 -Cash Westpac Banking EUR - 7,098,000
23,365,636 47,128,550
DERIVATIVES (continued)
Over-the-counter (OTC) and exchange traded derivatives as at 30 June 2016, expressed in Euro.
DERIVATIVES (continued)

Morgan Stanley Investment Funds 30 June 2016 124
The accompanying notes are an integral part of these financial statements.
Please refer to the full prospectus for the Fund’s investment objective and policy.
INVESTMENT AIM
To provide an attractive rate of return, measured in Euro, through market, instrument and currency selection. The Fund consists of fixed income securities of varying maturities denominated primarily in the Euro and other European currencies and may invest in other fixed income securities denominated in other currencies including Emerging Markets fixed income securities.
SCHEDULE OF INVESTMENTSAs at 30 June 2016
Investments Currency
Quantity/Nominal
Value
Market Value EUR
% of Net Assets
Transferable securities and money market instruments admitted to official exchange listing or dealt in on another regulated market
Convertible Bonds
FranceCie Generale des Etablissements Michelin
0% 01/01/2017 EUR 582,300 811,386 0.09
811,386 0.09
GermanySiemens Financieringsmaatschappij NV,
Reg. S 1.65% 16/08/2019 (Netherlands) (2) USD 750,000 735,855 0.09
735,855 0.09
Total Convertible Bonds 1,547,241 0.18
Corporate Bonds
AustraliaAPT Pipelines Ltd., Reg. S 1.375%
22/03/2022 EUR 1,700,000 1,687,972 0.20Aurizon Network Pty. Ltd., Reg. S 2%
18/09/2024 (1) EUR 300,000 295,822 0.04Aurizon Network Pty. Ltd., Reg. S 3.125%
01/06/2026 EUR 1,050,000 1,070,208 0.13AusNet Services Holdings Pty. Ltd., Reg. S
1.5% 26/02/2027 EUR 500,000 519,807 0.06BHP Billiton Finance Ltd. 2.25%
25/09/2020 EUR 650,000 699,405 0.08BHP Billiton Finance Ltd., Reg. S 0.75%
28/10/2022 EUR 1,800,000 1,794,156 0.22BHP Billiton Finance Ltd., Reg. S, FRN
5.625% 22/10/2079 EUR 1,550,000 1,644,627 0.20Brambles Finance Ltd., Reg. S 2.375%
12/06/2024 EUR 400,000 440,230 0.05Commonwealth Bank of Australia, 144A
5% 15/10/2019 USD 310,000 307,939 0.04Commonwealth Bank of Australia, Reg. S,
FRN 2% 22/04/2027 EUR 1,700,000 1,641,146 0.20Macquarie Bank Ltd., Reg. S 2.5%
18/09/2018 EUR 800,000 841,038 0.10Macquarie Bank Ltd., Reg. S 1%
16/09/2019 EUR 1,250,000 1,274,358 0.15Macquarie Bank Ltd., Reg. S 0.375%
03/03/2021 EUR 1,600,000 1,629,365 0.20National Australia Bank Ltd., Reg. S, FRN
0.276% 19/04/2021 EUR 2,400,000 2,402,820 0.29Origin Energy Finance Ltd., Reg. S, FRN
7.875% 16/06/2071 EUR 1,606,000 1,579,557 0.19Santos Finance Ltd., FRN 8.25%
22/09/2070 EUR 920,000 932,162 0.11Scentre Group Trust 1, REIT, Reg. S 1.5%
16/07/2020 EUR 750,000 784,100 0.09Scentre Group Trust 1, REIT, Reg. S 2.25%
16/07/2024 EUR 500,000 550,475 0.07SGSP Australia Assets Pty. Ltd., Reg. S 2%
30/06/2022 EUR 750,000 793,616 0.10Transurban Finance Co. Pty. Ltd. 2.5%
08/10/2020 EUR 500,000 537,331 0.06Transurban Finance Co. Pty. Ltd. 1.875%
16/09/2024 EUR 550,000 575,204 0.07Transurban Finance Co. Pty. Ltd., Reg. S
2% 28/08/2025 EUR 500,000 522,165 0.06
22,523,503 2.71
Euro Strategic Bond Fund

125 Morgan Stanley Investment Funds 30 June 2016
The accompanying notes are an integral part of these financial statements.
Euro Strategic Bond Fund (continued)
SCHEDULE OF INVESTMENTSAs at 30 June 2016
Investments Currency
Quantity/Nominal
Value
Market Value EUR
% of Net Assets
Transferable securities and money market instruments admitted to official exchange listing or dealt in on another regulated market
Corporate Bonds (continued)
AustriaUniCredit Bank Austria AG, Reg. S 2.625%
30/01/2018 EUR 500,000 517,387 0.06UniCredit Bank Austria AG, Reg. S 2.5%
27/05/2019 EUR 800,000 838,492 0.10UNIQA Insurance Group AG, Reg. S, FRN
6% 27/07/2046 EUR 400,000 411,137 0.05Vienna Insurance Group AG Wiener
Versicherung Gruppe, Reg. S, FRN 5.5% 09/10/2043 (1) EUR 300,000 317,378 0.04
2,084,394 0.25
BelgiumAnheuser-Busch InBev Finance, Inc. 3.65%
01/02/2026 (United States of America) (2) USD 2,000,000 1,928,709 0.23
Anheuser-Busch InBev SA NV, Reg. S 0.875% 17/03/2022 EUR 1,100,000 1,128,653 0.14
Anheuser-Busch InBev SA NV, Reg. S 2.75% 17/03/2036 EUR 1,800,000 2,080,813 0.25
Solvay Finance SA, Reg. S, FRN 5.118% Perpetual (France) (2) EUR 900,000 929,138 0.11
Solvay Finance SA, Reg. S, FRN 5.425% Perpetual (France) (2) EUR 300,000 307,963 0.04
Solvay SA, Reg. S 1.625% 02/12/2022 EUR 400,000 421,844 0.05UCB SA, Reg. S 4.125% 04/01/2021 EUR 550,000 620,430 0.07UCB SA, Reg. S 1.875% 02/04/2022 EUR 400,000 410,740 0.05
7,828,290 0.94
BrazilBRF SA, Reg. S 2.75% 03/06/2022 EUR 500,000 492,375 0.06Petrobras Global Finance BV 4.875%
07/03/2018 (Netherlands) (2) EUR 800,000 799,924 0.10Vale SA 3.75% 10/01/2023 EUR 2,000,000 1,790,420 0.21
3,082,719 0.37
ChinaBank of China Ltd., Reg. S, FRN 0.719%
30/06/2018 EUR 2,100,000 2,105,869 0.25Bao-trans Enterprises Ltd., Reg. S 1.625%
23/02/2018 (Hong Kong) (2) EUR 1,200,000 1,204,604 0.14CNOOC Curtis Funding No. 1 Pty. Ltd.,
Reg. S 2.75% 03/10/2020 (Australia) (2) EUR 1,550,000 1,652,814 0.20Sinopec Group Overseas Development
2013 Ltd., Reg. S 2.625% 17/10/2020 (British Virgin Islands) (2) EUR 1,250,000 1,334,960 0.16
Sinopec Group Overseas Development 2015 Ltd., Reg. S 1% 28/04/2022 (British Virgin Islands) (2) EUR 1,400,000 1,383,700 0.17
Three Gorges Finance II Cayman Islands Ltd., Reg. S 1.7% 10/06/2022 (Cayman Islands) (2) EUR 2,250,000 2,320,515 0.28
10,002,462 1.20
ColombiaEcopetrol SA 5.875% 18/09/2023 USD 1,210,000 1,122,154 0.14
1,122,154 0.14
SCHEDULE OF INVESTMENTSAs at 30 June 2016
Investments Currency
Quantity/Nominal
Value
Market Value EUR
% of Net Assets
Transferable securities and money market instruments admitted to official exchange listing or dealt in on another regulated market
Corporate Bonds (continued)
CyprusAroundtown Property Holdings plc, Reg. S
1.5% 03/05/2022 EUR 900,000 878,410 0.11
878,410 0.11
DenmarkISS Global A/S, Reg. S 1.125%
09/01/2020 EUR 600,000 613,047 0.07ISS Global A/S, Reg. S 1.125%
07/01/2021 EUR 800,000 817,814 0.10Nykredit Realkredit A/S, Reg. S, FRN 4%
03/06/2036 EUR 800,000 783,268 0.10Nykredit Realkredit A/S Bond, Reg. S
0.875% 13/06/2019 EUR 1,000,000 1,008,834 0.12
3,222,963 0.39
FinlandCitycon Treasury BV, Reg. S 2.375%
16/09/2022 (Netherlands) (2) EUR 1,500,000 1,623,667 0.20OP Corporate Bank plc, Reg. S 1.125%
17/06/2019 (1) EUR 820,000 845,816 0.10OP Corporate Bank plc, Reg. S 0.875%
21/06/2021 (1) EUR 650,000 669,014 0.08OP Corporate Bank plc, Reg. S 0.75%
03/03/2022 EUR 1,300,000 1,328,571 0.16Saastopankkien Keskuspankki Suomi OYJ,
Reg. S 1% 06/05/2020 EUR 1,650,000 1,661,723 0.20SATO OYJ, Reg. S 2.25% 10/09/2020 EUR 1,700,000 1,753,967 0.21SATO OYJ, Reg. S 2.375% 24/03/2021 EUR 1,150,000 1,185,702 0.14Transmission Finance DAC, Reg. S 1.5%
24/05/2023 (Ireland) (2) EUR 1,000,000 1,028,037 0.13
10,096,497 1.22
FranceAreva SA 3.5% 22/03/2021 EUR 550,000 457,737 0.06Areva SA 4.875% 23/09/2024 (1) EUR 1,750,000 1,435,262 0.17AXA SA, Reg. S, FRN 5.25% 16/04/2040 EUR 950,000 1,050,394 0.13AXA SA, Reg. S, FRN 5.125%
04/07/2043 EUR 400,000 456,846 0.06AXA SA, Reg. S, FRN 3.875% Perpetual EUR 300,000 295,820 0.04AXA SA, Reg. S, FRN 3.941% Perpetual EUR 200,000 197,947 0.02Banque Federative du Credit Mutuel SA,
Reg. S 3% 28/11/2023 EUR 600,000 702,271 0.08Banque Federative du Credit Mutuel SA,
Reg. S 2.375% 24/03/2026 EUR 1,200,000 1,193,491 0.14BNP Paribas Cardif SA, Reg. S, FRN
4.032% Perpetual EUR 800,000 768,298 0.09BNP Paribas SA, Reg. S, FRN 2.625%
14/10/2027 EUR 700,000 706,344 0.09BNP Paribas SA, Reg. S, FRN 6.125%
Perpetual (1) EUR 400,000 383,374 0.05BNP Paribas SA, Reg. S 2.25%
13/01/2021 EUR 650,000 708,789 0.09BNP Paribas SA, Reg. S 2.375%
17/02/2025 EUR 2,150,000 2,132,535 0.26BNP Paribas SA, Reg. S 2.875%
01/10/2026 (1) EUR 950,000 962,501 0.12BPCE SA, Reg. S, FRN 2.75%
08/07/2026 EUR 1,300,000 1,320,598 0.16Bureau Veritas SA, Reg. S 3.125%
21/01/2021 EUR 1,200,000 1,301,112 0.16

Morgan Stanley Investment Funds 30 June 2016 126
The accompanying notes are an integral part of these financial statements.
Euro Strategic Bond Fund (continued)
SCHEDULE OF INVESTMENTSAs at 30 June 2016
Investments Currency
Quantity/Nominal
Value
Market Value EUR
% of Net Assets
Transferable securities and money market instruments admitted to official exchange listing or dealt in on another regulated market
Corporate Bonds (continued)
France (continued)Credit Agricole Assurances SA, Reg. S,
FRN 4.25% Perpetual EUR 1,200,000 1,135,863 0.14Credit Agricole Assurances SA, Reg. S,
FRN 4.5% Perpetual EUR 1,000,000 950,627 0.11Credit Agricole SA, FRN, 144A 7.875%
Perpetual USD 1,220,000 1,054,676 0.13Credit Agricole SA, Reg. S 2.375%
20/05/2024 EUR 600,000 675,627 0.08Credit Agricole SA, Reg. S 2.625%
17/03/2027 EUR 1,350,000 1,348,508 0.16Edenred, Reg. S 1.375% 10/03/2025 (1) EUR 1,500,000 1,457,696 0.18Electricite de France SA, Reg. S, FRN 5%
Perpetual EUR 1,100,000 1,037,307 0.12Engie SA, Reg. S, FRN 3% Perpetual EUR 1,000,000 1,027,851 0.12Engie SA, Reg. S, FRN 3.875% Perpetual EUR 900,000 941,946 0.11Eurofins Scientific SE, Reg. S, FRN 4.875%
Perpetual (Luxembourg) (2) EUR 1,200,000 1,192,422 0.14Eurofins Scientific SE, Reg. S 3.125%
26/11/2018 (Luxembourg) (2) EUR 1,400,000 1,466,549 0.18Eurofins Scientific SE, Reg. S 2.25%
27/01/2022 (Luxembourg) (2) EUR 750,000 743,666 0.09Europcar Groupe SA, Reg. S 5.75%
15/06/2022 (1) EUR 1,550,000 1,613,589 0.19Eutelsat SA, Reg. S 5% 14/01/2019 (1) EUR 500,000 557,067 0.07Eutelsat SA, Reg. S 2.625%
13/01/2020 (1) EUR 800,000 850,983 0.10Fonciere Des Regions, REIT, Reg. S 1.75%
10/09/2021 EUR 1,200,000 1,255,425 0.15GELF Bond Issuer I SA, REIT, Reg. S
3.125% 03/04/2018 (Luxembourg) (2) EUR 950,000 997,180 0.12Infra Park SAS, Reg. S 1.25%
16/10/2020 EUR 900,000 936,786 0.11Infra Park SAS, Reg. S 2.125%
16/04/2025 EUR 600,000 662,024 0.08Ingenico Group SA, Reg. S 2.5%
20/05/2021 EUR 700,000 733,992 0.09Klepierre, REIT, Reg. S 1% 17/04/2023 EUR 800,000 824,413 0.10Klepierre, REIT, Reg. S 1.875%
19/02/2026 EUR 1,300,000 1,411,860 0.17La Banque Postale SA, Reg. S, FRN 2.75%
23/04/2026 EUR 500,000 509,684 0.06La Banque Postale SA, Reg. S, FRN 2.75%
19/11/2027 EUR 900,000 913,222 0.11Legrand SA 4.375% 21/03/2018 EUR 300,000 322,270 0.04Legrand SA, Reg. S 3.375% 19/04/2022 EUR 200,000 234,506 0.03Neopost SA, Reg. S 2.5% 23/06/2021 (1) EUR 1,400,000 1,290,142 0.16Orange SA, Reg. S, FRN 5% Perpetual EUR 470,000 490,365 0.06RTE Reseau de Transport d’Electricite SA,
Reg. S 1.625% 27/11/2025 EUR 600,000 648,699 0.08Sanofi, Reg. S 1.75% 10/09/2026 EUR 900,000 996,424 0.12Schneider Electric SE, Reg. S 1.5%
08/09/2023 EUR 1,000,000 1,073,263 0.13SCOR SE, Reg. S, FRN 3% 08/06/2046 EUR 800,000 776,347 0.09Societe Fonciere Lyonnaise SA, REIT,
Reg. S 1.875% 26/11/2021 EUR 1,300,000 1,371,497 0.17Societe Generale SA, Reg. S, FRN 2.5%
16/09/2026 EUR 1,000,000 1,002,411 0.12Societe Generale SA, Reg. S 2.625%
27/02/2025 EUR 1,100,000 1,097,536 0.13Sogecap SA, Reg. S, FRN 4.125%
Perpetual EUR 1,200,000 1,120,511 0.13Suez, Reg. S 1.75% 10/09/2025 EUR 700,000 768,968 0.09Total Capital Canada Ltd., Reg. S 1.125%
18/03/2022 (Canada) (2) EUR 1,300,000 1,369,599 0.16TOTAL SA, Reg. S, FRN 2.25% Perpetual EUR 1,450,000 1,403,317 0.17TOTAL SA, Reg. S, FRN 3.875% Perpetual EUR 850,000 883,469 0.11
SCHEDULE OF INVESTMENTSAs at 30 June 2016
Investments Currency
Quantity/Nominal
Value
Market Value EUR
% of Net Assets
Transferable securities and money market instruments admitted to official exchange listing or dealt in on another regulated market
Corporate Bonds (continued)
France (continued)Veolia Environnement SA, Reg. S, FRN
4.45% Perpetual EUR 400,000 420,684 0.05Verallia Packaging SASU, Reg. S 5.125%
01/08/2022 (1) EUR 1,550,000 1,594,803 0.19Vilmorin & Cie SA, Reg. S 2.375%
26/05/2021 EUR 1,200,000 1,257,060 0.15Wendel SA 4.375% 09/08/2017 EUR 1,550,000 1,614,971 0.19
58,109,124 7.00
GermanyAllianz Finance II BV, FRN 5.75%
08/07/2041 (Netherlands) (2) EUR 1,000,000 1,142,359 0.14Allianz SE, Reg. S, FRN 4.75% Perpetual (1) EUR 700,000 749,042 0.09Bayer AG, Reg. S, FRN 3.75%
01/07/2074 EUR 600,000 611,250 0.07BMW US Capital LLC, Reg. S 1.125%
18/09/2021 (United States of America) (2) EUR 1,200,000 1,255,621 0.15
BMW US Capital LLC, Reg. S 0.625% 20/04/2022 (United States of America) (2) EUR 1,400,000 1,425,253 0.17
Celesio Finance BV 4.5% 26/04/2017 (Netherlands) (1) (2) EUR 1,750,000 1,805,912 0.22
Celesio Finance BV, Reg. S 4% 18/10/2016 (Netherlands) (2) EUR 550,000 555,461 0.07
Commerzbank AG 7.75% 16/03/2021 EUR 700,000 836,721 0.10Covestro AG, Reg. S 1% 07/10/2021 EUR 750,000 774,196 0.09Covestro AG, Reg. S 1.75% 25/09/2024 EUR 1,150,000 1,223,339 0.15Daimler AG, Reg. S 0.875% 12/01/2021 EUR 2,500,000 2,578,643 0.31Daimler AG, Reg. S 1.375% 11/05/2028 EUR 1,150,000 1,201,578 0.15Deutsche Bank AG, Reg. S 2.75%
17/02/2025 (1) EUR 600,000 539,013 0.07Deutsche Bank AG, Reg. S 1.125%
17/03/2025 (1) EUR 1,900,000 1,826,277 0.22Deutsche Boerse AG, Reg. S, FRN 2.75%
05/02/2041 EUR 875,000 896,787 0.11EnBW Energie Baden-Wuerttemberg AG,
Reg. S, FRN 3.625% 02/04/2076 EUR 600,000 580,208 0.07Eurogrid GmbH, Reg. S 1.625%
03/11/2023 EUR 700,000 755,815 0.09Eurogrid GmbH, Reg. S 1.875%
10/06/2025 EUR 1,200,000 1,314,629 0.16Grand City Properties SA, Reg. S 2%
29/10/2021 (Luxembourg) (2) EUR 800,000 841,064 0.10Grand City Properties SA, Reg. S 1.5%
17/04/2025 (Luxembourg) (2) EUR 500,000 493,782 0.06Merck KGaA, Reg. S, FRN 2.625%
12/12/2074 EUR 575,000 584,628 0.07Muenchener Rueckversicherungs-
Gesellschaft AG, Reg. S, FRN 6% 26/05/2041 EUR 1,800,000 2,104,750 0.25
RWE AG, Reg. S, FRN 7% Perpetual GBP 1,100,000 1,304,981 0.16RWE Finance BV 6.5% 10/08/2021
(Netherlands) (2) EUR 1,000,000 1,281,302 0.15Unitymedia Hessen GmbH & Co. KG,
Reg. S 4% 15/01/2025 EUR 1,150,000 1,162,547 0.14Volkswagen International Finance NV,
Reg. S, FRN 3.75% Perpetual (Netherlands) (2) EUR 800,000 815,033 0.10
Volkswagen International Finance NV, Reg. S, FRN 4.625% Perpetual (Netherlands) (2) EUR 500,000 515,264 0.06
Vonovia Finance BV, Reg. S, FRN 4.625% 08/04/2074 (Netherlands) (2) EUR 900,000 938,195 0.11

127 Morgan Stanley Investment Funds 30 June 2016
The accompanying notes are an integral part of these financial statements.
Euro Strategic Bond Fund (continued)
SCHEDULE OF INVESTMENTSAs at 30 June 2016
Investments Currency
Quantity/Nominal
Value
Market Value EUR
% of Net Assets
Transferable securities and money market instruments admitted to official exchange listing or dealt in on another regulated market
Corporate Bonds (continued)
Germany (continued)Vonovia Finance BV, Reg. S, FRN 4%
Perpetual (Netherlands) (2) EUR 600,000 610,355 0.07Vonovia Finance BV, Reg. S 3.125%
25/07/2019 (Netherlands) (2) EUR 300,000 326,016 0.04Vonovia Finance BV, Reg. S 3.625%
08/10/2021 (Netherlands) (2) EUR 1,250,000 1,450,500 0.17
32,500,521 3.91
Hong KongCK Hutchison Finance 16 Ltd., Reg. S
1.25% 06/04/2023 (Cayman Islands) (2) EUR 1,950,000 1,957,314 0.24Hutchison Whampoa Europe Finance 12
Ltd., Reg. S 2.5% 06/06/2017 (Cayman Islands) (2) EUR 1,000,000 1,022,511 0.12
Shanghai Electric Newage Co. Ltd., Reg. S 1.125% 22/05/2020 EUR 1,750,000 1,762,184 0.21
4,742,009 0.57
IndiaBharti Airtel International Netherlands BV,
Reg. S 4% 10/12/2018 (Netherlands) (2) EUR 800,000 858,280 0.10ONGC Videsh Ltd., Reg. S 2.75%
15/07/2021 EUR 600,000 627,692 0.08Vedanta Resources plc, 144A 6%
31/01/2019 (United Kingdom) (2) USD 1,900,000 1,465,722 0.18
2,951,694 0.36
IrelandBank of Ireland, Reg. S 1.25%
09/04/2020 EUR 270,000 275,929 0.03Kerry Group Financial Services, Reg. S
2.375% 10/09/2025 EUR 700,000 785,341 0.10Ryanair Ltd., Reg. S 1.875% 17/06/2021 EUR 440,000 465,743 0.06Ryanair Ltd., Reg. S 1.125% 10/03/2023 EUR 600,000 605,957 0.07
2,132,970 0.26
ItalyAssicurazioni Generali SpA, Reg. S, FRN
10.125% 10/07/2042 EUR 900,000 1,147,064 0.14Assicurazioni Generali SpA, Reg. S, FRN
7.75% 12/12/2042 EUR 600,000 696,232 0.08Assicurazioni Generali SpA, Reg. S, FRN
5.5% 27/10/2047 EUR 550,000 564,691 0.07Assicurazioni Generali SpA, Reg. S 2.875%
14/01/2020 EUR 250,000 270,199 0.03Assicurazioni Generali SpA, Reg. S 5.125%
16/09/2024 EUR 250,000 322,125 0.04Banca Monte dei Paschi di Siena SpA,
Reg. S 4.875% 15/09/2016 EUR 700,000 706,353 0.08Banca Monte dei Paschi di Siena SpA,
Reg. S 2.125% 26/11/2025 (1) EUR 1,980,000 2,107,365 0.25Banco Popolare SC, Reg. S 0.75%
31/03/2022 EUR 1,200,000 1,232,964 0.15CDP Reti SpA, Reg. S 1.875%
29/05/2022 EUR 800,000 832,358 0.10Davide Campari-Milano SpA, Reg. S 4.5%
25/10/2019 EUR 650,000 717,805 0.09Enel SpA, Reg. S, FRN 5% 15/01/2075 EUR 1,000,000 1,055,055 0.13Enel SpA, Reg. S 5.25% 20/06/2017 EUR 93,000 97,778 0.01
SCHEDULE OF INVESTMENTSAs at 30 June 2016
Investments Currency
Quantity/Nominal
Value
Market Value EUR
% of Net Assets
Transferable securities and money market instruments admitted to official exchange listing or dealt in on another regulated market
Corporate Bonds (continued)
Italy (continued)FCA Capital Ireland plc, Reg. S 2.875%
26/01/2018 (Ireland) (2) EUR 450,000 466,142 0.06FCA Capital Ireland plc, Reg. S 2.625%
17/04/2019 (Ireland) (2) EUR 775,000 812,082 0.10FCA Capital Ireland plc, Reg. S 2%
23/10/2019 (Ireland) (2) EUR 700,000 721,418 0.09FCA Capital Ireland plc, Reg. S 1.375%
17/04/2020 (Ireland) (2) EUR 400,000 404,070 0.05Ferrovie dello Stato Italiane SpA, Reg. S
4% 22/07/2020 EUR 900,000 1,027,445 0.12Ferrovie dello Stato Italiane SpA, Reg. S
3.5% 13/12/2021 EUR 950,000 1,095,483 0.13Intesa Sanpaolo SpA, Reg. S, FRN 0.787%
15/06/2020 EUR 2,500,000 2,497,025 0.30Intesa Sanpaolo SpA, Reg. S, FRN 7%
Perpetual (1) EUR 2,150,000 1,991,061 0.24Intesa Sanpaolo SpA, 144A 6.5%
24/02/2021 USD 2,060,000 2,102,566 0.25Intesa Sanpaolo SpA 5.25% 12/01/2024 USD 1,530,000 1,475,559 0.18Intesa Sanpaolo SpA, Reg. S 1.375%
18/12/2025 EUR 2,600,000 2,790,900 0.34Intesa Sanpaolo Vita SpA 5.35%
18/09/2018 EUR 1,000,000 1,086,792 0.13Iren SpA, Reg. S 2.75% 02/11/2022 EUR 600,000 659,298 0.08Poste Vita SpA 2.875% 30/05/2019 EUR 1,000,000 1,038,728 0.13Snam SpA, Reg. S 4.375% 11/07/2016 EUR 123,000 123,111 0.01Snam SpA, Reg. S 5.25% 19/09/2022 EUR 1,000,000 1,291,373 0.16Societa Esercizi Aereoportuali SpA 3.125%
17/04/2021 EUR 725,000 760,496 0.09Telecom Italia Finance SA 7.75%
24/01/2033 (Luxembourg) (2) EUR 700,000 934,066 0.11Telecom Italia SpA, Reg. S 3.625%
19/01/2024 EUR 950,000 1,012,358 0.12UniCredit SpA, Reg. S, FRN 0.703%
10/04/2017 EUR 500,000 501,923 0.06UniCredit SpA, Reg. S, FRN 4.375%
03/01/2027 EUR 1,000,000 974,915 0.12UniCredit SpA, Reg. S 2.75% 31/01/2020 EUR 200,000 220,262 0.03UniCredit SpA, Reg. S 2.625%
31/10/2020 (1) EUR 650,000 724,565 0.09UniCredit SpA, Reg. S 0.75% 30/04/2025 EUR 1,350,000 1,366,197 0.16
35,827,824 4.32
JapanSumitomo Mitsui Banking Corp., Reg. S
2.25% 16/12/2020 EUR 1,250,000 1,355,950 0.16Sumitomo Mitsui Banking Corp., Reg. S 1%
19/01/2022 EUR 1,600,000 1,640,032 0.20Sumitomo Mitsui Financial Group, Inc.,
Reg. S 1.546% 15/06/2026 EUR 2,300,000 2,350,743 0.28Toyota Motor Credit Corp., Reg. S 1%
10/09/2021 (United States of America) (2) EUR 800,000 832,036 0.10
Toyota Motor Credit Corp., Reg. S 0.75% 21/07/2022 (United States of America) (2) EUR 1,250,000 1,282,703 0.16
7,461,464 0.90
LuxembourgSES SA, Reg. S, FRN 4.625% Perpetual (1) EUR 625,000 621,734 0.07
621,734 0.07

Morgan Stanley Investment Funds 30 June 2016 128
The accompanying notes are an integral part of these financial statements.
Euro Strategic Bond Fund (continued)
SCHEDULE OF INVESTMENTSAs at 30 June 2016
Investments Currency
Quantity/Nominal
Value
Market Value EUR
% of Net Assets
Transferable securities and money market instruments admitted to official exchange listing or dealt in on another regulated market
Corporate Bonds (continued)
MexicoCemex SAB de CV, Reg. S 4.375%
05/03/2023 EUR 1,500,000 1,462,260 0.18Fomento Economico Mexicano SAB de CV,
Reg. S 1.75% 20/03/2023 EUR 800,000 818,066 0.10Mexichem SAB de CV, 144A 5.875%
17/09/2044 USD 1,091,000 902,280 0.11Petroleos Mexicanos 6.375% 23/01/2045 USD 1,250,000 1,120,198 0.13Petroleos Mexicanos, Reg. S 5.5%
09/01/2017 EUR 150,000 153,700 0.02Petroleos Mexicanos, Reg. S 3.125%
27/11/2020 (1) EUR 600,000 617,775 0.07Petroleos Mexicanos, Reg. S 3.75%
16/04/2026 (1) EUR 375,000 351,727 0.04
5,426,006 0.65
NetherlandsABN AMRO Bank NV, Reg. S, FRN 2.875%
30/06/2025 EUR 750,000 766,995 0.09ABN AMRO Bank NV, Reg. S, FRN 5.75%
Perpetual (1) EUR 1,400,000 1,307,397 0.16ABN AMRO Bank NV, 144A 4.25%
02/02/2017 USD 830,000 760,390 0.09ABN AMRO Bank NV, Reg. S 6.375%
27/04/2021 EUR 850,000 1,017,230 0.12Achmea Bank NV 2% 23/01/2018 EUR 700,000 721,023 0.09Achmea Bank NV, Reg. S 2.75%
18/02/2021 EUR 750,000 818,295 0.10Achmea BV, Reg. S, FRN 6% 04/04/2043 EUR 300,000 313,293 0.04Achmea BV, Reg. S, FRN 4.25% Perpetual EUR 400,000 351,731 0.04Achmea BV, Reg. S 2.5% 19/11/2020 EUR 400,000 438,135 0.05Aegon Bank NV, Reg. S 0.25%
01/12/2020 EUR 2,400,000 2,434,003 0.29Aegon NV, Reg. S, FRN 4% 25/04/2044 EUR 250,000 228,439 0.03ASR Nederland NV, Reg. S, FRN 5.125%
29/09/2045 EUR 1,150,000 1,169,838 0.14ASR Nederland NV, Reg. S, FRN 5%
Perpetual EUR 1,830,000 1,813,407 0.22Constellium NV, Reg. S 4.625%
15/05/2021 EUR 1,550,000 1,237,559 0.15Cooperatieve Rabobank UA, FRN, 144A
11% Perpetual USD 105,000 114,228 0.01Cooperatieve Rabobank UA, Reg. S, FRN
2.5% 26/05/2026 EUR 1,900,000 1,934,038 0.23Cooperatieve Rabobank UA, Reg. S, FRN
5.5% Perpetual EUR 1,500,000 1,434,788 0.17Cooperatieve Rabobank UA, Reg. S
6.875% 19/03/2020 EUR 500,000 587,187 0.07Delta Lloyd NV, Reg. S, FRN 4.375%
Perpetual EUR 300,000 225,788 0.03Enexis Holding NV, Reg. S 1.875%
13/11/2020 EUR 450,000 487,959 0.06Enexis Holding NV, Reg. S 1.5%
20/10/2023 EUR 1,650,000 1,785,947 0.22ING Bank NV, Reg. S, FRN 3.625%
25/02/2026 EUR 650,000 693,759 0.08ING Bank NV, Reg. S 1.25% 13/12/2019 EUR 1,250,000 1,297,503 0.16ING Bank NV, Reg. S 0.7%
16/04/2020 (1) EUR 900,000 917,272 0.11JAB Holdings BV, Reg. S 1.75%
25/05/2023 EUR 1,100,000 1,138,571 0.14LeasePlan Corp. NV, Reg. S 1%
24/05/2021 EUR 1,300,000 1,306,479 0.16
SCHEDULE OF INVESTMENTSAs at 30 June 2016
Investments Currency
Quantity/Nominal
Value
Market Value EUR
% of Net Assets
Transferable securities and money market instruments admitted to official exchange listing or dealt in on another regulated market
Corporate Bonds (continued)
Netherlands (continued)LeasePlan Corp. NV, FRN 0.198%
28/04/2017 EUR 1,700,000 1,700,765 0.21Nederlandse Gasunie NV, Reg. S 1%
11/05/2026 EUR 1,000,000 1,036,480 0.12NN Group NV, Reg. S, FRN 4.625%
08/04/2044 EUR 1,300,000 1,316,504 0.16Shell International Finance BV, Reg. S
1.25% 15/03/2022 EUR 1,350,000 1,433,574 0.17Shell International Finance BV, Reg. S
1.625% 20/01/2027 EUR 1,050,000 1,141,404 0.14SNS Bank NV, Reg. S, FRN 3.75%
05/11/2025 EUR 1,600,000 1,571,586 0.19SRLEV NV, FRN 9% 15/04/2041 EUR 600,000 614,316 0.07Vesteda Finance BV, Reg. S 1.75%
22/07/2019 EUR 700,000 725,221 0.09Vesteda Finance BV, Reg. S 2.5%
27/10/2022 EUR 1,100,000 1,197,966 0.14
36,039,070 4.34
New ZealandANZ New Zealand International Ltd., Reg. S
0.625% 01/06/2021 EUR 2,050,000 2,065,174 0.25
2,065,174 0.25
NorwayDNB Bank ASA, Reg. S, FRN 3%
26/09/2023 EUR 1,500,000 1,553,965 0.19DNB Bank ASA, Reg. S 4.375%
24/02/2021 EUR 600,000 714,133 0.09SpareBank 1 SR-Bank ASA, Reg. S 2.125%
14/04/2021 EUR 1,500,000 1,607,073 0.19
3,875,171 0.47
PolandPowszechna Kasa Oszczednosci Bank
Polski SA, Reg. S 2.324% 23/01/2019 (Sweden) (2) EUR 1,600,000 1,654,431 0.20
1,654,431 0.20
PortugalBanco Santander Totta SA, Reg. S 0.875%
27/10/2020 (1) EUR 4,300,000 4,427,218 0.53Brisa Concessao Rodoviaria SA, Reg. S
6.875% 02/04/2018 EUR 800,000 893,000 0.11Brisa Concessao Rodoviaria SA, Reg. S
1.875% 30/04/2025 EUR 1,400,000 1,384,068 0.17EDP - Energias de Portugal SA, Reg. S,
FRN 5.375% 16/09/2075 EUR 1,900,000 1,892,751 0.23EDP Finance BV, Reg. S 2.625%
15/04/2019 (Netherlands) (2) EUR 900,000 948,315 0.11EDP Finance BV, Reg. S 2.625%
18/01/2022 (Netherlands) (2) EUR 1,200,000 1,265,670 0.15Ren Finance BV, Reg. S 2.5% 12/02/2025
(Netherlands) (2) EUR 450,000 477,432 0.06
11,288,454 1.36

129 Morgan Stanley Investment Funds 30 June 2016
The accompanying notes are an integral part of these financial statements.
Euro Strategic Bond Fund (continued)
SCHEDULE OF INVESTMENTSAs at 30 June 2016
Investments Currency
Quantity/Nominal
Value
Market Value EUR
% of Net Assets
Transferable securities and money market instruments admitted to official exchange listing or dealt in on another regulated market
Corporate Bonds (continued)
QatarOoredoo International Finance Ltd., Reg. S
3.25% 21/02/2023 (Bermuda) (1) (2) USD 600,000 546,425 0.07
546,425 0.07
RussiaGazprom OAO, Reg. S 3.7% 25/07/2018
(Luxembourg) (2) EUR 800,000 833,324 0.10
833,324 0.10
Saudi ArabiaSABIC Capital I BV, Reg. S 2.75%
20/11/2020 (Netherlands) (1) (2) EUR 500,000 533,646 0.06
533,646 0.06
SingaporeTemasek Financial I Ltd., Reg. S 0.5%
01/03/2022 EUR 2,200,000 2,248,961 0.27Temasek Financial I Ltd., Reg. S 1.5%
01/03/2028 EUR 2,450,000 2,606,886 0.31United Overseas Bank Ltd., Reg. S, FRN
3.75% 19/09/2024 USD 950,000 884,440 0.11
5,740,287 0.69
SlovakiaSPP Infrastructure Financing BV, Reg. S
3.75% 18/07/2020 (Netherlands) (2) EUR 300,000 332,124 0.04SPP-Distribucia A/S, Reg. S 2.625%
23/06/2021 EUR 550,000 590,356 0.07
922,480 0.11
South KoreaIndustrial Bank of Korea, Reg. S 2%
30/10/2018 EUR 1,150,000 1,195,611 0.15Korea Gas Corp., Reg. S 2.375%
15/04/2019 EUR 650,000 687,221 0.08
1,882,832 0.23
SpainAdif - Alta Velocidad, Reg. S 1.875%
22/09/2022 EUR 1,300,000 1,391,858 0.17Adif - Alta Velocidad, Reg. S 3.5%
27/05/2024 EUR 1,000,000 1,176,869 0.14Amadeus Capital Markets SA, Reg. S
4.875% 15/07/2016 EUR 900,000 901,525 0.11Amadeus Finance BV, Reg. S 0.625%
02/12/2017 (Netherlands) (2) EUR 600,000 604,920 0.07Banco Bilbao Vizcaya Argentaria SA,
Reg. S, FRN 6.75% Perpetual (1) EUR 2,400,000 2,067,708 0.25Banco Bilbao Vizcaya Argentaria SA,
Reg. S 0.625% 17/05/2021 EUR 2,500,000 2,574,298 0.31Banco Popular Espanol SA 3.5%
11/09/2017 EUR 2,400,000 2,500,758 0.30Banco Santander SA, Reg. S, FRN 6.375%
Perpetual (1) USD 2,200,000 1,739,117 0.21BBVA Subordinated Capital SAU, Reg. S,
FRN 3.5% 11/04/2024 EUR 1,800,000 1,835,509 0.22
SCHEDULE OF INVESTMENTSAs at 30 June 2016
Investments Currency
Quantity/Nominal
Value
Market Value EUR
% of Net Assets
Transferable securities and money market instruments admitted to official exchange listing or dealt in on another regulated market
Corporate Bonds (continued)
Spain (continued)CaixaBank SA, Reg. S, FRN 5%
14/11/2023 (1) EUR 1,400,000 1,450,960 0.18CaixaBank SA, Reg. S 2.5% 18/04/2017 EUR 1,500,000 1,528,792 0.18CaixaBank SA, Reg. S 1% 08/02/2023 EUR 3,000,000 3,133,592 0.38Cellnex Telecom SAU, Reg. S 3.125%
27/07/2022 EUR 1,900,000 1,952,516 0.24Criteria Caixa SA, Reg. S 1.625%
21/04/2022 EUR 800,000 785,272 0.09FADE - Fondo de Amortizacion del Deficit
Electrico, Reg. S 0.85% 17/09/2019 EUR 3,800,000 3,886,433 0.47Ferrovial Emisiones SA, Reg. S 3.375%
30/01/2018 EUR 1,200,000 1,263,118 0.15Ferrovial Emisiones SA, Reg. S 3.375%
07/06/2021 EUR 250,000 284,492 0.03Gas Natural Fenosa Finance BV, Reg. S,
FRN 3.375% Perpetual (Netherlands) (2) EUR 1,900,000 1,699,550 0.20Grupo Isolux Corsan Finance BV, Reg. S
6.625% 15/04/2021 (Netherlands) (1) (2) EUR 1,110,000 180,536 0.02
Iberdrola International BV, Reg. S 1.125% 27/01/2023 (Netherlands) (2) EUR 300,000 310,905 0.04
Iberdrola International BV, Reg. S 1.875% 08/10/2024 (Netherlands) (2) EUR 600,000 655,706 0.08
IE2 Holdco SAU, Reg. S 2.875% 01/06/2026 EUR 1,100,000 1,109,900 0.13
Inmobiliaria Colonial SA, Reg. S 1.863% 05/06/2019 EUR 2,200,000 2,276,853 0.27
Inmobiliaria Colonial SA, Reg. S 2.728% 05/06/2023 EUR 700,000 739,958 0.09
Mapfre SA, Reg. S 1.625% 19/05/2026 EUR 1,200,000 1,205,316 0.15Prosegur Cia de Seguridad SA, Reg. S
2.75% 02/04/2018 EUR 400,000 418,088 0.05Repsol International Finance BV, Reg. S,
FRN 4.5% 25/03/2075 (Netherlands) (1) (2) EUR 2,300,000 1,961,164 0.24
Repsol International Finance BV, Reg. S 3.625% 07/10/2021 (Netherlands) (1) (2) EUR 1,200,000 1,371,724 0.17
Santander Consumer Bank A/S, Reg. S 0.625% 20/04/2018 (Norway) (2) EUR 3,500,000 3,519,481 0.42
Santander Issuances SAU 5.179% 19/11/2025 USD 1,000,000 896,594 0.11
Telefonica Europe BV, Reg. S, FRN 4.2% Perpetual (Netherlands) (1) (2) EUR 700,000 697,116 0.08
Telefonica Europe BV, Reg. S, FRN 5.875% Perpetual (Netherlands) (2) EUR 300,000 306,939 0.04
Telefonica Europe BV, Reg. S, FRN 6.5% Perpetual (Netherlands) (2) EUR 500,000 525,128 0.06
Telefonica Europe BV, Reg. S, FRN 7.625% Perpetual (Netherlands) (2) EUR 500,000 555,750 0.07
47,508,445 5.72
SwedenAlfa Laval Treasury International AB, Reg. S
1.375% 12/09/2022 (1) EUR 650,000 677,265 0.08Nordea Bank AB, Reg. S, FRN 4.625%
15/02/2022 EUR 1,200,000 1,229,088 0.15Nordea Bank AB, Reg. S, FRN 1.875%
10/11/2025 EUR 750,000 757,668 0.09Nordea Bank AB, Reg. S 1% 22/02/2023 EUR 2,300,000 2,371,491 0.29Skandinaviska Enskilda Banken AB, Reg. S,
FRN 2.5% 28/05/2026 EUR 1,500,000 1,536,059 0.19Svenska Handelsbanken AB, Reg. S, FRN
2.656% 15/01/2024 EUR 1,000,000 1,036,341 0.12

Morgan Stanley Investment Funds 30 June 2016 130
The accompanying notes are an integral part of these financial statements.
Euro Strategic Bond Fund (continued)
SCHEDULE OF INVESTMENTSAs at 30 June 2016
Investments Currency
Quantity/Nominal
Value
Market Value EUR
% of Net Assets
Transferable securities and money market instruments admitted to official exchange listing or dealt in on another regulated market
Corporate Bonds (continued)
Sweden (continued)Svenska Handelsbanken AB 2.875%
04/04/2017 USD 1,460,000 1,331,611 0.16Svenska Handelsbanken AB, Reg. S
2.625% 23/08/2022 EUR 425,000 485,492 0.06Swedbank AB, Reg. S, FRN 2.375%
26/02/2024 EUR 500,000 514,040 0.06Swedbank AB, Reg. S 0.625%
04/01/2021 EUR 1,300,000 1,328,231 0.16
11,267,286 1.36
SwitzerlandCredit Suisse AG, Reg. S, FRN 0.186%
18/06/2018 EUR 4,200,000 4,202,709 0.51Credit Suisse AG, Reg. S, FRN 5.75%
18/09/2025 EUR 600,000 636,453 0.08Credit Suisse Group Funding Guernsey
Ltd., Reg. S 1.25% 14/04/2022 (Guernsey) (1) (2) EUR 2,050,000 2,004,203 0.24
Glencore Finance Europe SA, Reg. S 4.625% 03/04/2018 (Luxembourg) (1) (2) EUR 500,000 528,156 0.06
Glencore Finance Europe SA, Reg. S 1.25% 17/03/2021 (Luxembourg) (1) (2) EUR 900,000 831,960 0.10
Glencore Finance Europe SA, Reg. S 1.625% 18/01/2022 (Luxembourg) (2) EUR 300,000 273,056 0.03
Glencore Finance Europe SA, Reg. S 1.75% 17/03/2025 (Luxembourg) (2) EUR 1,400,000 1,165,570 0.14
UBS AG, Reg. S 1.125% 30/06/2020 EUR 800,000 829,994 0.10UBS AG, Reg. S 5.125% 15/05/2024 USD 800,000 735,267 0.09UBS Group Funding Jersey Ltd., Reg. S
1.75% 16/11/2022 (Jersey) (1) (2) EUR 950,000 991,746 0.12Zurich Insurance Co. Ltd., FRN 7.5%
24/07/2039 (Ireland) (2) EUR 250,000 290,602 0.03Zurich Insurance Co. Ltd., Reg. S, FRN
4.25% 02/10/2043 (Ireland) (2) EUR 400,000 435,128 0.05Zurich Insurance Co. Ltd., Reg. S 3.375%
27/06/2022 (Ireland) (2) EUR 250,000 290,987 0.04
13,215,831 1.59
TurkeyTurkiye Vakiflar Bankasi TAO, Reg. S
2.375% 04/05/2021 EUR 850,000 853,132 0.10
853,132 0.10
United Arab EmiratesADCB Finance Cayman Ltd., Reg. S 2.5%
06/03/2018 (Cayman Islands) (2) USD 1,300,000 1,175,565 0.14ADCB Finance Cayman Ltd., Reg. S 3%
04/03/2019 (Cayman Islands) (2) USD 450,000 411,416 0.05Emirates NBD PJSC, Reg. S 1.75%
23/03/2022 EUR 1,930,000 1,922,063 0.23Emirates Telecommunications Group Co.
PJSC, Reg. S 1.75% 18/06/2021 (1) EUR 1,000,000 1,042,871 0.13IPIC GMTN Ltd., Reg. S 2.375%
30/05/2018 (Cayman Islands) (2) EUR 300,000 312,599 0.04IPIC GMTN Ltd., Reg. S 5.875%
14/03/2021 (Cayman Islands) (1) (2) EUR 900,000 1,104,187 0.13
5,968,701 0.72
SCHEDULE OF INVESTMENTSAs at 30 June 2016
Investments Currency
Quantity/Nominal
Value
Market Value EUR
% of Net Assets
Transferable securities and money market instruments admitted to official exchange listing or dealt in on another regulated market
Corporate Bonds (continued)
United KingdomAnglo American Capital plc, Reg. S 1.75%
20/11/2017 EUR 253,000 251,693 0.03AstraZeneca plc, Reg. S 0.875%
24/11/2021 EUR 750,000 774,677 0.09Aviva plc, Reg. S, FRN 6.875%
22/05/2038 EUR 800,000 862,503 0.10Aviva plc, Reg. S, FRN 6.125%
05/07/2043 EUR 500,000 554,827 0.07Aviva plc, Reg. S, FRN 3.875%
03/07/2044 EUR 475,000 458,526 0.06Aviva plc, Reg. S, FRN 3.375%
04/12/2045 EUR 500,000 463,618 0.06Barclays Bank plc, Reg. S, FRN 14%
Perpetual GBP 150,000 220,498 0.03Barclays Bank plc, Reg. S 6%
14/01/2021 EUR 1,050,000 1,188,928 0.14BAT International Finance plc, Reg. S
0.875% 13/10/2023 EUR 1,900,000 1,904,124 0.23BP Capital Markets plc, Reg. S 1.526%
26/09/2022 EUR 1,140,000 1,200,569 0.14British Telecommunications plc, Reg. S
1.75% 10/03/2026 EUR 950,000 991,155 0.12Coventry Building Society, Reg. S, FRN
6.375% Perpetual (1) GBP 500,000 540,291 0.07DS Smith plc, Reg. S 2.25% 16/09/2022 EUR 1,300,000 1,347,233 0.16FCE Bank plc, Reg. S, FRN 0.214%
10/02/2018 EUR 2,750,000 2,750,784 0.33FCE Bank plc, Reg. S 1.134%
10/02/2022 EUR 750,000 753,199 0.09G4S International Finance plc, Reg. S
2.625% 06/12/2018 EUR 975,000 1,020,077 0.12Glencore Finance Dubai Ltd. 2.625%
19/11/2018 (United Arab Emirates) (2) EUR 700,000 713,501 0.09Hammerson plc, REIT, Reg. S 2%
01/07/2022 EUR 450,000 463,756 0.06Hammerson plc, REIT, Reg. S 1.75%
15/03/2023 EUR 1,200,000 1,207,853 0.15HBOS plc, FRN 4.5% 18/03/2030 EUR 300,000 324,605 0.04Heathrow Funding Ltd., Reg. S 1.875%
23/05/2022 (Jersey) (2) EUR 350,000 371,169 0.04Heathrow Funding Ltd., Reg. S 1.5%
11/02/2030 (Jersey) (2) EUR 1,050,000 1,030,427 0.12High Speed Rail Finance 1 plc, Reg. S
4.375% 01/11/2038 GBP 400,000 579,904 0.07HSBC Holdings plc, Reg. S, FRN 3.375%
10/01/2024 EUR 525,000 542,353 0.07HSBC Holdings plc, Reg. S, FRN 5.25%
Perpetual (1) EUR 600,000 542,496 0.07HSBC Holdings plc, Reg. S 6%
10/06/2019 EUR 1,300,000 1,483,090 0.18HSBC Holdings plc, Reg. S 1.5%
15/03/2022 EUR 1,500,000 1,539,331 0.19HSBC Holdings plc, Reg. S 3%
30/06/2025 EUR 1,450,000 1,488,027 0.18InterContinental Hotels Group plc 6%
09/12/2016 GBP 150,000 184,873 0.02InterContinental Hotels Group plc 3.875%
28/11/2022 GBP 200,000 259,084 0.03International Game Technology plc, Reg. S
6.625% 02/02/2018 EUR 400,000 433,296 0.05International Game Technology plc, Reg. S
4.125% 15/02/2020 EUR 300,000 314,873 0.04International Game Technology plc, Reg. S
4.75% 15/02/2023 (1) EUR 575,000 596,824 0.07Leeds Building Society, Reg. S 1.375%
05/05/2022 EUR 1,325,000 1,289,470 0.16
131 Morgan Stanley Investment Funds 30 June 2016
The accompanying notes are an integral part of these financial statements.
Euro Strategic Bond Fund (continued)
SCHEDULE OF INVESTMENTSAs at 30 June 2016
Investments Currency
Quantity/Nominal
Value
Market Value EUR
% of Net Assets
Transferable securities and money market instruments admitted to official exchange listing or dealt in on another regulated market
Corporate Bonds (continued)
United Kingdom (continued)Lloyds Bank plc, Reg. S, FRN 0.186%
10/09/2019 (1) EUR 600,000 591,456 0.07Lloyds Bank plc, Reg. S 6.5%
24/03/2020 EUR 2,300,000 2,653,957 0.32Lloyds Bank plc, Reg. S 0.5%
22/07/2020 EUR 800,000 816,150 0.10Lloyds Banking Group plc, Reg. S, FRN
6.375% Perpetual (1) EUR 1,300,000 1,219,881 0.15National Express Group plc, Reg. S 6.25%
13/01/2017 GBP 250,000 309,652 0.04Nationwide Building Society, Reg. S, FRN
4.125% 20/03/2023 EUR 750,000 771,930 0.09Nationwide Building Society, Reg. S, FRN
6.875% Perpetual GBP 1,300,000 1,472,887 0.18Nationwide Building Society, Reg. S 6.75%
22/07/2020 EUR 1,000,000 1,170,544 0.14Nationwide Building Society, Reg. S 0.75%
29/10/2021 (1) EUR 2,500,000 2,580,560 0.31NGG Finance plc, Reg. S, FRN 4.25%
18/06/2076 EUR 1,100,000 1,170,869 0.14Royal Bank of Scotland Group plc, Reg. S
2.5% 22/03/2023 EUR 1,200,000 1,190,036 0.14Royal Bank of Scotland plc (The), Reg. S,
FRN 10.5% 16/03/2022 EUR 258,000 274,117 0.03Royal Bank of Scotland plc (The) 6.934%
09/04/2018 (1) EUR 400,000 433,506 0.05Royal Bank of Scotland plc (The) 5.5%
23/03/2020 EUR 1,800,000 2,102,104 0.25Santander UK Group Holdings plc, Reg. S,
FRN 7.375% Perpetual (1) GBP 800,000 900,768 0.11Santander UK plc, Reg. S, FRN 0.367%
22/05/2019 EUR 850,000 842,618 0.10Santander UK plc, Reg. S 0.875%
25/11/2020 EUR 750,000 750,280 0.09Smiths Group plc, Reg. S 1.25%
28/04/2023 EUR 850,000 831,915 0.10Standard Chartered plc, Reg. S, FRN 4%
21/10/2025 (1) EUR 1,000,000 981,870 0.12Standard Chartered plc, Reg. S 3.875%
20/10/2016 EUR 1,000,000 1,011,535 0.12Standard Chartered plc, Reg. S 1.75%
29/10/2017 EUR 34,000 34,708 –State Grid Europe Development 2014 plc,
Reg. S 1.5% 26/01/2022 EUR 850,000 865,976 0.10State Grid Europe Development 2014 plc,
Reg. S 2.45% 26/01/2027 EUR 1,200,000 1,270,212 0.15Tesco Corporate Treasury Services plc,
Reg. S 2.5% 01/07/2024 (1) EUR 950,000 929,589 0.11Virgin Media Finance plc, Reg. S 4.5%
15/01/2025 (1) EUR 1,900,000 1,839,361 0.22Vodafone Group plc, Reg. S 1%
11/09/2020 EUR 1,750,000 1,784,546 0.21Vodafone Group plc, Reg. S 2.2%
25/08/2026 EUR 1,700,000 1,806,252 0.22Yorkshire Building Society, Reg. S 2.125%
18/03/2019 (1) EUR 625,000 642,817 0.08
59,897,730 7.21
United States of AmericaAir Products & Chemicals, Inc. 1%
12/02/2025 EUR 600,000 616,113 0.07AT&T, Inc. 1.3% 05/09/2023 EUR 850,000 876,453 0.11AT&T, Inc. 2.4% 15/03/2024 EUR 450,000 492,984 0.06AT&T, Inc. 2.45% 15/03/2035 EUR 1,200,000 1,238,798 0.15
SCHEDULE OF INVESTMENTSAs at 30 June 2016
Investments Currency
Quantity/Nominal
Value
Market Value EUR
% of Net Assets
Transferable securities and money market instruments admitted to official exchange listing or dealt in on another regulated market
Corporate Bonds (continued)
United States of America (continued)Ball Corp. 4.375% 15/12/2023 EUR 575,000 622,021 0.08Bank of America Corp., Reg. S, FRN
0.536% 19/06/2019 EUR 700,000 705,548 0.09Bank of America Corp., Reg. S 1.375%
10/09/2021 EUR 1,150,000 1,196,263 0.14Bank of America Corp., Reg. S 1.625%
14/09/2022 EUR 1,250,000 1,313,071 0.16Berkshire Hathaway, Inc. 1.125%
16/03/2027 EUR 1,400,000 1,381,667 0.17Berkshire Hathaway, Inc. 1.625%
16/03/2035 EUR 1,150,000 1,133,316 0.14Citigroup, Inc. 1.75% 28/01/2025 EUR 700,000 729,276 0.09Citigroup, Inc., Reg. S 2.375%
22/05/2024 EUR 400,000 437,105 0.05Coca-Cola Co. (The) 0.75% 09/03/2023 EUR 1,600,000 1,636,100 0.20Coca-Cola Co. (The) 1.625% 09/03/2035 EUR 2,300,000 2,416,059 0.29DH Europe Finance SA 1.7% 04/01/2022
(Luxembourg) (2) EUR 1,650,000 1,758,650 0.21Ecolab, Inc. 2.625% 08/07/2025 EUR 750,000 841,811 0.10Eli Lilly & Co. 1% 02/06/2022 EUR 1,200,000 1,245,506 0.15General Electric Co. 1.25% 26/05/2023 EUR 850,000 897,942 0.11General Motors Financial International BV,
Reg. S 1.875% 15/10/2019 (Netherlands) (2) EUR 400,000 415,910 0.05
Goldman Sachs Group, Inc. (The), Reg. S, FRN 0.436% 18/12/2017 (1) EUR 800,000 804,236 0.10
Goldman Sachs Group, Inc. (The), Reg. S, FRN 0.442% 29/05/2020 EUR 2,500,000 2,491,325 0.30
Goldman Sachs Group, Inc. (The), Reg. S 6.375% 02/05/2018 EUR 800,000 891,555 0.11
Goldman Sachs Group, Inc. (The), Reg. S 2% 27/07/2023 EUR 800,000 843,263 0.10
Harman Finance International SCA 2% 27/05/2022 (Luxembourg) (1) (2) EUR 1,300,000 1,313,143 0.16
Honeywell International, Inc. 1.3% 22/02/2023 EUR 650,000 677,190 0.08
Honeywell International, Inc. 2.25% 22/02/2028 EUR 950,000 1,046,250 0.13
HSBC USA, Inc. 3.5% 23/06/2024 USD 1,175,000 1,091,043 0.13Illinois Tool Works, Inc. 3% 19/05/2034 EUR 900,000 1,112,425 0.13J.P. Morgan Chase & Co., Reg. S 1.375%
16/09/2021 EUR 1,150,000 1,201,516 0.14J.P. Morgan Chase & Co., Reg. S 1.5%
26/10/2022 (1) EUR 850,000 893,161 0.11J.P. Morgan Chase & Co., Reg. S 1.5%
27/01/2025 EUR 700,000 731,343 0.09J.P. Morgan Chase & Co., Reg. S 3%
19/02/2026 EUR 350,000 411,609 0.05Kraft Heinz Foods Co., Reg. S 2.25%
25/05/2028 EUR 2,000,000 2,108,066 0.25Metropolitan Life Global Funding I, Reg. S
1.25% 17/09/2021 (1) EUR 1,800,000 1,862,375 0.22Metropolitan Life Global Funding I, Reg. S
0.875% 20/01/2022 EUR 1,100,000 1,110,741 0.13Microsoft Corp. 3.125% 06/12/2028 EUR 1,000,000 1,252,876 0.15Mohawk Industries, Inc. 2% 14/01/2022 EUR 1,550,000 1,610,644 0.19Mondelez International, Inc. 1%
07/03/2022 (1) EUR 450,000 457,479 0.06Mondelez International, Inc. 2.375%
06/03/2035 EUR 750,000 776,520 0.09MPT Operating Partnership LP, REIT 4%
19/08/2022 EUR 650,000 677,641 0.08National Grid North America, Inc., Reg. S
0.75% 11/02/2022 EUR 700,000 702,753 0.08Omnicom Group, Inc. 3.65% 01/11/2024 USD 806,000 776,483 0.09

Morgan Stanley Investment Funds 30 June 2016 132
The accompanying notes are an integral part of these financial statements.
Euro Strategic Bond Fund (continued)
SCHEDULE OF INVESTMENTSAs at 30 June 2016
Investments Currency
Quantity/Nominal
Value
Market Value EUR
% of Net Assets
Transferable securities and money market instruments admitted to official exchange listing or dealt in on another regulated market
Corporate Bonds (continued)
United States of America (continued)Pentair Finance SA 2.45% 17/09/2019
(Luxembourg) (2) EUR 1,850,000 1,922,089 0.23Simon International Finance SCA, REIT,
Reg. S 1.25% 13/05/2025 (Luxembourg) (2) EUR 850,000 872,078 0.11
Time Warner, Inc. 1.95% 15/09/2023 EUR 400,000 426,326 0.05Trinity Acquisition plc 2.125% 26/05/2022
(United Kingdom) (2) EUR 1,500,000 1,504,740 0.18Tyco International Finance SA 1.375%
25/02/2025 (Luxembourg) (2) EUR 650,000 644,137 0.08United Parcel Service, Inc. 1.625%
15/11/2025 EUR 850,000 916,034 0.11United Technologies Corp. 1.25%
22/05/2023 EUR 1,050,000 1,090,819 0.13United Technologies Corp. 1.875%
22/02/2026 EUR 1,000,000 1,076,163 0.13Wells Fargo & Co., Reg. S 2.25%
03/09/2020 EUR 1,450,000 1,570,001 0.19Wells Fargo & Co., Reg. S 1.125%
29/10/2021 EUR 1,250,000 1,294,802 0.16Wells Fargo & Co., Reg. S 1.5%
12/09/2022 EUR 950,000 998,355 0.12
57,113,774 6.88
Total Corporate Bonds 471,820,931 56.83
Equities
United States of AmericaWMIH Corp. USD 19 37 0.00
37 0.00
Total Equities 37 0.00
Government Bonds
BelgiumBelgium Government Bond, Reg. S, 144A
4.25% 28/09/2021 EUR 2,000,000 2,491,840 0.30
2,491,840 0.30
BrazilBrazil Letras do Tesouro Nacional 0%
01/01/2019 BRL 9,000,000 18,898,817 2.28
18,898,817 2.28
FranceFrance Government Bond OAT, Reg. S
1.1% 25/07/2022 EUR 1,500,000 1,834,321 0.22France Government Bond OAT, Reg. S
5.5% 25/04/2029 EUR 11,500,000 18,956,337 2.28France Government Bond OAT, Reg. S 4%
25/10/2038 EUR 5,000,000 8,311,494 1.00
29,102,152 3.50
SCHEDULE OF INVESTMENTSAs at 30 June 2016
Investments Currency
Quantity/Nominal
Value
Market Value EUR
% of Net Assets
Transferable securities and money market instruments admitted to official exchange listing or dealt in on another regulated market
Government Bonds (continued)
GermanyBundesrepublik Deutschland, Reg. S 4.75%
04/07/2034 EUR 3,500,000 6,388,170 0.77Bundesrepublik Deutschland, Reg. S 4.25%
04/07/2039 EUR 11,200,000 21,194,527 2.55Bundesrepublik Deutschland, Reg. S 2.5%
04/07/2044 EUR 10,300,000 16,207,804 1.95
43,790,501 5.27
HungaryHungary Government Bond 6%
24/11/2023 HUF 3,780,000,000 14,434,198 1.74
14,434,198 1.74
IrelandIreland Government Bond 5.4%
13/03/2025 EUR 2,500,000 3,543,150 0.43
3,543,150 0.43
ItalyItaly Buoni Poliennali Del Tesoro 4%
01/09/2020 EUR 4,750,000 5,502,201 0.66Italy Buoni Poliennali Del Tesoro 5.5%
01/11/2022 EUR 19,000,000 24,671,918 2.97Italy Buoni Poliennali Del Tesoro, Reg. S,
144A 4.75% 01/09/2044 EUR 3,300,000 4,969,391 0.60Italy Buoni Poliennali Del Tesoro, Reg. S
3.75% 01/08/2021 EUR 10,000,000 11,697,670 1.41Italy Buoni Poliennali Del Tesoro, Reg. S 5%
01/08/2034 EUR 4,500,000 6,595,970 0.80Italy Buoni Poliennali Del Tesoro, Reg. S 5%
01/08/2039 EUR 9,700,000 14,713,270 1.77Italy Buoni Poliennali Del Tesoro, Reg. S 5%
01/09/2040 EUR 3,600,000 5,460,602 0.66
73,611,022 8.87
MexicoMexican Bonos 10% 05/12/2024 MXN 330,000,000 20,477,379 2.46Mexico Government International Bond
1.625% 06/03/2024 EUR 650,000 656,121 0.08
21,133,500 2.54
New ZealandNew Zealand Government Bond, Reg. S
5.5% 15/04/2023 NZD 18,100,000 14,077,396 1.70
14,077,396 1.70
PolandPoland Government Bond 2.5%
25/07/2026 PLN 41,800,000 9,119,726 1.10
9,119,726 1.10

133 Morgan Stanley Investment Funds 30 June 2016
The accompanying notes are an integral part of these financial statements.
Euro Strategic Bond Fund (continued)
SCHEDULE OF INVESTMENTSAs at 30 June 2016
Investments Currency
Quantity/Nominal
Value
Market Value EUR
% of Net Assets
Transferable securities and money market instruments admitted to official exchange listing or dealt in on another regulated market
Government Bonds (continued)
PortugalParpublica - Participacoes Publicas SGPS
SA, Reg. S 3.75% 05/07/2021 EUR 900,000 932,418 0.11Portugal Obrigacoes do Tesouro OT,
Reg. S, 144A 2.875% 21/07/2026 EUR 12,680,000 12,462,665 1.50
13,395,083 1.61
RomaniaRomania Government Bond 4.75%
24/02/2025 RON 46,000,000 11,176,193 1.35
11,176,193 1.35
RussiaRussian Foreign Bond, Reg. S 4.5%
04/04/2022 (1) USD 2,000,000 1,926,487 0.23
1,926,487 0.23
SpainSpain Government Bond, Reg. S, 144A
5.85% 31/01/2022 EUR 4,000,000 5,220,511 0.63Spain Government Bond, Reg. S, 144A
4.4% 31/10/2023 EUR 6,000,000 7,557,645 0.91Spain Government Bond, Reg. S, 144A
3.8% 30/04/2024 EUR 1,900,000 2,311,206 0.28Spain Government Bond, Reg. S, 144A
2.75% 31/10/2024 EUR 6,600,000 7,513,601 0.90Spain Government Bond, Reg. S, 144A
2.15% 31/10/2025 EUR 1,940,000 2,108,348 0.25Spain Government Bond, Reg. S, 144A
1.95% 30/04/2026 EUR 3,063,000 3,262,796 0.39Spain Government Bond, Reg. S, 144A
1.95% 30/07/2030 EUR 4,400,000 4,609,103 0.56Spain Government Inflation Linked Bond,
Reg. S, 144A 1.8% 30/11/2024 EUR 10,000,000 11,132,424 1.34Spain Government Inflation Linked Bond,
Reg. S, 144A 1% 30/11/2030 EUR 5,490,000 5,657,371 0.68Spain Government International Bond,
Reg. S 4% 06/03/2018 USD 3,250,000 3,047,219 0.37
52,420,224 6.31
United States of AmericaUS Treasury Inflation Indexed 0.25%
15/01/2025 USD 21,814,000 20,137,689 2.43
20,137,689 2.43
Total Government Bonds 329,257,978 39.66
SCHEDULE OF INVESTMENTSAs at 30 June 2016
Investments Currency
Quantity/Nominal
Value
Market Value EUR
% of Net Assets
Transferable securities and money market instruments admitted to official exchange listing or dealt in on another regulated market
Mortgage and Asset Backed Securities
GermanyGerman Residential Funding Ltd., Reg. S,
FRN, Series 2013-1 ‘A’ 0.892% 27/08/2024 (Ireland) (2) EUR 1,870,435 1,889,607 0.23
1,889,607 0.23
PortugalLusitano Mortgages No. 5 plc, Reg. S,
FRN, Series 5 ‘A’ 0.011% 15/07/2059 (Ireland) (2) EUR 4,797,976 3,568,735 0.43
3,568,735 0.43
United KingdomTaurus plc, Reg. S, FRN, Series 2013-
GMF1 ‘A’ 0.792% 21/05/2024 EUR 620,848 627,155 0.07
627,155 0.07
Total Mortgage and Asset Backed Securities 6,085,497 0.73
Total Transferable securities and money market instruments admitted to official exchange listing or dealt in on another regulated market 808,711,684 97.40
Other transferable securities and money market instruments not admitted to official exchange listing or dealt in on another regulated market
Equities
United States of AmericaWA Funding TR III (3) USD 200 0 0.00
0 0.00
Total Equities 0 0.00
Total Other transferable securities and money market instruments not admitted to official exchange listing or dealt in on another regulated market 0 0.00
Morgan Stanley Investment Funds 30 June 2016 134
The accompanying notes are an integral part of these financial statements.
Euro Strategic Bond Fund (continued)
SCHEDULE OF INVESTMENTSAs at 30 June 2016
Investments Currency
Quantity/Nominal
Value
Market Value EUR
% of Net Assets
Units of authorised UCITS or other collective investment undertakings
Collective Investment Schemes – UCITS
LuxembourgMorgan Stanley Liquidity Funds Euro
Liquidity Fund – MS Reserve (4) EUR 8,700,038 8,700,038 1.05
8,700,038 1.05
Total Collective Investment Schemes – UCITS 8,700,038 1.05
Total Units of authorised UCITS or other collective investment undertakings 8,700,038 1.05
Total Investments 817,411,722 98.45
Cash 17,619,958 2.12
Other Assets/(Liabilities) (4,764,236) (0.57)
Total Net Assets 830,267,444 100.00
(1) All or part of this position is out on loan.(2) The country in brackets represents the country of incorporation of this security.(3) Security is valued at its fair value under the direction of the Board of Directors of the SICAV.(4) Affiliate managed by an affiliate of the Investment Adviser.
Financial Futures Contracts
Security DescriptionNumber of Contracts Currency
Global Exposure
EUR
Unrealised Gain/(Loss)
EUR
% of Net Assets
Euro-OAT, 08/09/2016 34 EUR 5,457,000 132,600 0.02Euro-Schatz, 08/09/2016 738 EUR 82,689,210 197,415 0.02US 2 Year Note, 30/09/2016 564 USD 111,230,428 729,328 0.09US 5 Year Note, 30/09/2016 703 USD 77,177,382 1,343,848 0.16
Unrealised Gain on Financial Futures Contracts 2,403,191 0.29
Total Unrealised Gain on Financial Futures Contracts 2,403,191 0.29
Euro-Bobl, 08/09/2016 (129) EUR (17,227,950) (169,712) (0.02)Euro-Bund, 08/09/2016 (14) EUR (2,337,300) (52,360) (0.01)US 10 Year Note, 21/09/2016 (113) USD (13,511,724) (361,340) (0.04)US Long Bond, 21/09/2016 (54) USD (8,400,764) (521,442) (0.06)US Ultra Bond, 21/09/2016 (42) USD (7,069,960) (455,450) (0.05)Long Gilt, 28/09/2016 (20) GBP (3,093,802) (133,452) (0.02)
Unrealised Loss on Financial Futures Contracts (1,693,756) (0.20)
Duration Hedged Share ClassEuro-Bobl, 08/09/2016 (124) EUR (16,560,200) (163,134) (0.02)Euro-Bund, 08/09/2016 (123) EUR (20,534,850) (460,020) (0.06)Euro-Schatz, 08/09/2016 (77) EUR (8,627,465) (20,370) 0.00
Unrealised Loss on Financial Futures Contracts (643,524) (0.08)
Total Unrealised Loss on Financial Futures Contracts (2,337,280) (0.28)
Net Unrealised Gain on Financial Futures Contracts 65,911 0.01
Forward Currency Exchange Contracts (continued)
Currency Purchased
Amount Purchased
Currency Sold
Amount Sold
Maturity Date Counterparty
Unrealised Gain/(Loss)
EUR
% of Net Assets
MXN 16,700,000 EUR 789,653 05/07/2016 J.P. Morgan 21,057 0.00MXN 410,100,000 EUR 19,594,960 05/07/2016 State Street 313,561 0.04CAD 450,000 EUR 311,570 07/07/2016 RBC 150 0.00AUD 4,000,000 EUR 2,617,226 11/07/2016 Commonwealth
Bank of Australia 57,192 0.01NZD 500,000 EUR 312,704 11/07/2016 Commonwealth
Bank of Australia 6,739 0.00EUR 15,059,514 HUF 4,713,000,000 12/07/2016 HSBC 185,833 0.02EUR 6,259,481 PLN 27,560,000 12/07/2016 State Street 23,727 0.00EUR 11,134,537 RON 50,315,000 12/07/2016 J.P. Morgan 7,390 0.00PLN 18,500,000 USD 4,631,970 12/07/2016 UBS 20,200 0.00USD 3,525,714 PLN 13,900,000 12/07/2016 State Street 25,721 0.00USD 2,000,000 EUR 1,774,636 19/07/2016 J.P. Morgan 23,521 0.00USD 4,590,000 EUR 4,110,877 19/07/2016 Westpac Banking 15,893 0.00EUR 6,268,217 GBP 5,000,000 20/07/2016 RBC 227,099 0.03EUR 4,075,077 GBP 3,235,000 20/07/2016 Westpac Banking 166,474 0.02IDR 62,500,000,000 USD 4,679,194 21/07/2016 HSBC 57,530 0.01RUB 306,100,000 USD 4,584,051 21/07/2016 UBS 141,497 0.02
Unrealised Gain on Forward Currency Exchange Contracts 1,293,584 0.15
Total Unrealised Gain on Forward Currency Exchange Contracts 1,293,584 0.15
DERIVATIVES
Over-the-counter (OTC) and exchange traded derivatives as at 30 June 2016, expressed in Euro.

135 Morgan Stanley Investment Funds 30 June 2016
The accompanying notes are an integral part of these financial statements.
Euro Strategic Bond Fund (continued)
DERIVATIVES (continued)
Over-the-counter (OTC) and exchange traded derivatives as at 30 June 2016, expressed in Euro.
DERIVATIVES (continued)
Forward Currency Exchange Contracts (continued)
Currency Purchased
Amount Purchased
Currency Sold
Amount Sold
Maturity Date Counterparty
Unrealised Gain/(Loss)
EUR
% of Net Assets
EUR 20,615,570 MXN 426,800,000 05/07/2016 State Street (103,661) (0.01)EUR 308,656 CAD 450,000 07/07/2016 RBC (3,064) 0.00EUR 14,888,084 NZD 24,510,000 11/07/2016 Commonwealth
Bank of Australia (771,030) (0.09)NZD 5,800,000 USD 4,128,104 11/07/2016 Commonwealth
Bank of Australia (7,091) 0.00USD 6,746,144 AUD 9,312,000 11/07/2016 Commonwealth
Bank of Australia (158,861) (0.02)USD 2,632,154 NZD 3,878,000 11/07/2016 Commonwealth
Bank of Australia (110,360) (0.01)NOK 40,300,000 EUR 4,341,487 13/07/2016 J.P. Morgan (14,152) 0.00NOK 19,600,000 USD 2,402,999 13/07/2016 J.P. Morgan (56,375) (0.01)EUR 88,202 USD 100,000 19/07/2016 RBC (1,706) 0.00EUR 63,705,847 USD 72,573,000 19/07/2016 Westpac Banking (1,542,969) (0.19)GBP 200,000 EUR 251,824 20/07/2016 HSBC (10,180) 0.00USD 18,545,507 BRL 64,900,000 21/07/2016 State Street (1,398,625) (0.17)EUR 311,269 CAD 450,000 05/08/2016 RBC (144) 0.00EUR 19,509,196 MXN 410,100,000 05/08/2016 State Street (318,528) (0.04)
Unrealised Loss on Forward Currency Exchange Contracts (4,496,746) (0.54)
Total Unrealised Loss on Forward Currency Exchange Contracts (4,496,746) (0.54)
Net Unrealised Loss on Forward Currency Exchange Contracts (3,203,162) (0.39)
Interest Rate Swap Contracts
Nominal Amount Ccy Counterparty
Security Description
Maturity Date
Market Value EUR
Unrealised Gain/(Loss)
EUR
% of Net Assets
33,000,000 USD Goldman Sachs Pay fixed 2.463% Receive floating LIBOR
3 month 17/07/2025 (3,377,484) (3,377,484) (0.41)70,000,000 USD Goldman Sachs Pay fixed 1.776%
Receive floating LIBOR 3 month 17/07/2020 (2,602,746) (2,602,746) (0.31)
37,500,000 USD Goldman Sachs Pay fixed 1.813% Receive floating LIBOR
3 month 04/09/2019 (1,213,969) (1,213,969) (0.15)123,500,000 USD Goldman Sachs Pay fixed 1.183%
Receive floating LIBOR 3 month 04/09/2017 (998,781) (998,781) (0.12)
17,360,000 USD Goldman Sachs Pay fixed 1.714% Receive floating LIBOR
3 month 21/08/2019 (511,143) (511,143) (0.06)52,400,000 USD Goldman Sachs Pay fixed 1.065%
Receive floating LIBOR 3 month 21/08/2017 (342,902) (342,902) (0.04)
5,000,000 USD Deutsche Bank Pay fixed 1.847% Receive floating LIBOR
3 month 10/09/2019 (167,121) (167,121) (0.02)19,500,000 USD Deutsche Bank Pay fixed 1.2%
Receive floating LIBOR 3 month 10/09/2017 (162,824) (162,824) (0.02)
Total Unrealised Loss on Interest Rate Swap Contracts (9,376,970) (9,376,970) (1.13)
Net Unrealised Loss on Interest Rate Swap Contracts (9,376,970) (9,376,970) (1.13)
Collateral received and paid by the Fund in respect of financial derivative instruments:
Type of Collateral Counterparty CurrencyCollateral Amount
receivedCollateral Amount
paid
Euro Strategic Bond Fund
Cash Deutsche Bank EUR - 246,000Cash Goldman Sachs EUR 1,176,189 9,185,965Cash HSBC EUR 245,000 -Cash State Street EUR 172,000 -Cash Westpac Banking EUR - 1,999,000
1,593,189 11,430,965

Morgan Stanley Investment Funds 30 June 2016 136
The accompanying notes are an integral part of these financial statements.
Please refer to the full prospectus for the Fund’s investment objective and policy.
INVESTMENT AIM
To provide an attractive rate of return, measured in Euro, through investments worldwide primarily in lower rated and unrated fixed income securities issued by governments, agencies and corporations that offer a yield above that generally available on debt securities in the four highest rating categories of S&P or Moody’s denominated in European currencies.
SCHEDULE OF INVESTMENTSAs at 30 June 2016
Investments Currency
Quantity/Nominal
Value
Market Value EUR
% of Net Assets
Transferable securities and money market instruments admitted to official exchange listing or dealt in on another regulated market
Corporate Bonds
AustraliaBHP Billiton Finance Ltd., Reg. S, FRN
5.625% 22/10/2079 EUR 4,000,000 4,244,200 0.33Origin Energy Finance Ltd., Reg. S, FRN
7.875% 16/06/2071 EUR 2,900,000 2,852,252 0.23Santos Finance Ltd., FRN 8.25%
22/09/2070 EUR 9,970,000 10,101,803 0.80
17,198,255 1.36
AustriaUNIQA Insurance Group AG, Reg. S, FRN
6.875% 31/07/2043 (1) EUR 6,000,000 6,419,010 0.51Vienna Insurance Group AG Wiener
Versicherung Gruppe, Reg. S, FRN 5.5% 09/10/2043 (1) EUR 3,300,000 3,491,161 0.27
9,910,171 0.78
BelgiumEthias SA, Reg. S 5% 14/01/2026 EUR 6,000,000 5,050,560 0.40Solvay Finance SA, Reg. S, FRN 5.118%
Perpetual (France) (2) EUR 13,000,000 13,420,875 1.06
18,471,435 1.46
BrazilPetrobras Global Finance BV 3.75%
14/01/2021 (Netherlands) (2) EUR 5,200,000 4,570,228 0.36Petrobras Global Finance BV 4.25%
02/10/2023 (Netherlands) (1) (2) EUR 3,500,000 2,829,715 0.22Petrobras Global Finance BV 6.25%
14/12/2026 (Netherlands) (1) (2) GBP 7,750,000 7,529,595 0.60Vale SA 3.75% 10/01/2023 EUR 5,000,000 4,476,050 0.35
19,405,588 1.53
CanadaCott Finance Corp., Reg. S 5.5%
01/07/2024 EUR 4,000,000 4,096,840 0.32
4,096,840 0.32
FranceAlbea Beauty Holdings SA, Reg. S 8.75%
01/11/2019 (Luxembourg) (2) EUR 5,150,000 5,451,687 0.43Albea Beauty Holdings SA, Reg. S 8.75%
01/11/2019 (Luxembourg) (2) EUR 850,000 902,279 0.07Areva SA 3.5% 22/03/2021 EUR 2,000,000 1,664,500 0.13Areva SA 4.875% 23/09/2024 (1) EUR 6,000,000 4,920,900 0.39Areva SA, Reg. S 3.25% 04/09/2020 EUR 5,000,000 4,166,450 0.33Areva SA, Reg. S 3.125% 20/03/2023 (1) EUR 5,000,000 3,946,800 0.31BNP Paribas SA, Reg. S, FRN 6.125%
Perpetual (1) EUR 1,600,000 1,533,496 0.12BUT SAS, Reg. S 7.375% 15/09/2019 EUR 4,000,000 4,162,700 0.33Credit Agricole SA, Reg. S, FRN 6.5%
Perpetual (1) EUR 4,000,000 3,780,660 0.30Crown European Holdings SA, Reg. S 4%
15/07/2022 EUR 8,500,000 9,077,575 0.72Electricite de France SA, Reg. S, FRN 5%
Perpetual EUR 4,000,000 3,772,025 0.30Elis SA, Reg. S 3% 30/04/2022 EUR 10,000,000 9,964,600 0.79
European Currencies High Yield Bond Fund
137 Morgan Stanley Investment Funds 30 June 2016
The accompanying notes are an integral part of these financial statements.
European Currencies High Yield Bond Fund (continued)
SCHEDULE OF INVESTMENTSAs at 30 June 2016
Investments Currency
Quantity/Nominal
Value
Market Value EUR
% of Net Assets
Transferable securities and money market instruments admitted to official exchange listing or dealt in on another regulated market
Corporate Bonds (continued)
France (continued)Eurofins Scientific SE, Reg. S, FRN 4.875%
Perpetual (Luxembourg) (2) EUR 8,000,000 7,949,480 0.63Europcar Groupe SA, Reg. S 5.75%
15/06/2022 (1) EUR 4,150,000 4,320,254 0.34La Financiere Atalian SAS, Reg. S 7.25%
15/01/2020 EUR 7,000,000 7,455,105 0.59Labeyrie Fine Foods SAS, Reg. S 5.625%
15/03/2021 EUR 6,500,000 6,786,845 0.54Novafives SAS, Reg. S 4.5%
30/06/2021 (1) EUR 9,000,000 8,079,705 0.64Numericable-SFR SA, Reg. S 5.375%
15/05/2022 (1) EUR 5,000,000 5,089,250 0.40Numericable-SFR SA, Reg. S 5.625%
15/05/2024 (1) EUR 8,800,000 8,888,924 0.70Oberthur Technologies Holding SAS,
Reg. S 9.25% 30/04/2020 EUR 8,500,000 9,047,400 0.71Peugeot SA, Reg. S 2.375%
14/04/2023 (1) EUR 3,000,000 3,063,645 0.24Rexel SA, Reg. S 3.5% 15/06/2023 (1) EUR 8,000,000 8,089,840 0.64SGD Group SAS, Reg. S 5.625%
15/05/2019 (1) EUR 6,500,000 6,665,197 0.53SMCP SAS, Reg. S 8.875% 15/06/2020 EUR 8,190,000 8,593,808 0.68Sogecap SA, Reg. S, FRN 4.125%
Perpetual EUR 5,000,000 4,668,796 0.37Veolia Environnement SA, Reg. S, FRN
4.45% Perpetual EUR 10,000,000 10,517,100 0.83Verallia Packaging SASU, Reg. S 5.125%
01/08/2022 (1) EUR 9,500,000 9,774,598 0.77
162,333,619 12.83
GermanyHeckler & Koch GmbH, Reg. S 9.5%
15/05/2018 EUR 5,000,000 4,224,500 0.33Paternoster Holding III GmbH, Reg. S 8.5%
15/02/2023 (1) EUR 11,000,000 10,036,125 0.79ProGroup AG, Reg. S 5.125%
01/05/2022 (1) EUR 7,000,000 7,396,200 0.58RWE AG, Reg. S, FRN 2.75% 21/04/2075 EUR 4,340,000 3,725,890 0.30RWE AG, Reg. S, FRN 7% Perpetual GBP 4,500,000 5,338,558 0.42Senvion Holding GmbH, Reg. S 6.625%
15/11/2020 EUR 12,950,000 13,403,250 1.06Trionista TopCo GmbH, Reg. S 6.875%
30/04/2021 (1) EUR 6,716,000 7,089,242 0.56Unitymedia GmbH, Reg. S 3.75%
15/01/2027 EUR 11,000,000 10,097,890 0.80Unitymedia Hessen GmbH & Co. KG,
Reg. S 5.5% 15/09/2022 EUR 8,100,000 8,563,198 0.68Unitymedia Hessen GmbH & Co. KG,
Reg. S 4% 15/01/2025 EUR 1,600,000 1,617,456 0.13Unitymedia Hessen GmbH & Co. KG,
Reg. S 4.625% 15/02/2026 EUR 2,000,000 2,072,130 0.16Unitymedia Hessen GmbH & Co. KG,
Reg. S 3.5% 15/01/2027 (1) EUR 3,000,000 2,900,130 0.23Vonovia Finance BV, Reg. S, FRN 4.625%
08/04/2074 (Netherlands) (2) EUR 8,000,000 8,339,510 0.66WEPA Hygieneprodukte GmbH, Reg. S
3.75% 15/05/2024 (1) EUR 2,000,000 2,041,460 0.16ZF North America Capital, Inc., Reg. S
2.75% 27/04/2023 (United States of America) (1) (2) EUR 15,000,000 15,441,000 1.22
102,286,539 8.08
SCHEDULE OF INVESTMENTSAs at 30 June 2016
Investments Currency
Quantity/Nominal
Value
Market Value EUR
% of Net Assets
Transferable securities and money market instruments admitted to official exchange listing or dealt in on another regulated market
Corporate Bonds (continued)
GreeceOTE plc, Reg. S 7.875% 07/02/2018
(United Kingdom) (2) EUR 3,448,000 3,694,446 0.29OTE plc, Reg. S 4.375% 02/12/2019
(United Kingdom) (2) EUR 2,000,000 2,029,190 0.16OTE plc, Reg. S 3.5% 09/07/2020
(United Kingdom) (2) EUR 3,500,000 3,449,005 0.28
9,172,641 0.73
IndiaVedanta Resources plc, 144A 6%
31/01/2019 (United Kingdom) (2) USD 5,000,000 3,857,162 0.31
3,857,162 0.31
IrelandArdagh Packaging Finance plc, Reg. S
4.25% 15/01/2022 EUR 6,230,000 6,360,300 0.50Smurfit Kappa Acquisitions, Reg. S 3.25%
01/06/2021 EUR 8,000,000 8,497,760 0.67Smurfit Kappa Acquisitions, Reg. S 2.75%
01/02/2025 EUR 5,000,000 5,029,775 0.40
19,887,835 1.57
ItalyCNH Industrial Finance Europe SA, Reg. S
2.875% 27/09/2021 (Luxembourg) (1) (2) EUR 5,000,000 5,120,725 0.41
Enel SpA, FRN, 144A 8.75% 24/09/2073 USD 5,000,000 5,148,047 0.41Enel SpA, Reg. S, FRN 5% 15/01/2075 EUR 4,500,000 4,747,748 0.38Enel SpA, Reg. S, FRN 7.75%
10/09/2075 GBP 7,000,000 9,022,728 0.71Fiat Chrysler Finance Europe, Reg. S
6.75% 14/10/2019 (Luxembourg) (1) (2) EUR 16,500,000 18,559,448 1.47Fiat Chrysler Finance Europe, Reg. S
4.75% 22/03/2021 (Luxembourg) (1) (2) EUR 5,000,000 5,382,500 0.42Fiat Chrysler Finance Europe, Reg. S
4.75% 15/07/2022 (Luxembourg) (1) (2) EUR 2,000,000 2,148,950 0.17Intesa Sanpaolo SpA, Reg. S, FRN 7%
Perpetual (1) EUR 5,200,000 4,815,590 0.38LKQ Italia Bondco SpA, Reg. S 3.875%
01/04/2024 EUR 7,000,000 7,218,505 0.57Telecom Italia Finance SA 7.75%
24/01/2033 (Luxembourg) (2) EUR 10,000,000 13,343,800 1.05Telecom Italia SpA 6.375%
24/06/2019 (1) GBP 5,000,000 6,662,662 0.53Telecom Italia SpA, Reg. S 3.625%
19/01/2024 EUR 4,175,000 4,449,047 0.35UniCredit SpA, Reg. S, FRN 4.375%
03/01/2027 EUR 3,000,000 2,924,745 0.23UnipolSai SpA, Reg. S, FRN 5.75%
Perpetual EUR 3,000,000 2,767,500 0.22Wind Acquisition Finance SA, Reg. S 7%
23/04/2021 (Luxembourg) (1) (2) EUR 14,000,000 13,708,450 1.08
106,020,445 8.38
JapanSoftBank Group Corp., Reg. S 4.75%
30/07/2025 EUR 11,000,000 11,862,015 0.94
11,862,015 0.94
Morgan Stanley Investment Funds 30 June 2016 138
The accompanying notes are an integral part of these financial statements.
European Currencies High Yield Bond Fund (continued)
SCHEDULE OF INVESTMENTSAs at 30 June 2016
Investments Currency
Quantity/Nominal
Value
Market Value EUR
% of Net Assets
Transferable securities and money market instruments admitted to official exchange listing or dealt in on another regulated market
Corporate Bonds (continued)
JerseyCPUK Finance Ltd., Reg. S 7%
28/02/2042 GBP 3,000,000 3,726,886 0.29
3,726,886 0.29
LuxembourgAltice Financing SA, Reg. S 6.5%
15/01/2022 (1) EUR 11,000,000 11,617,210 0.92Altice Luxembourg SA, Reg. S 7.25%
15/05/2022 (1) EUR 17,000,000 17,178,670 1.36Altice Luxembourg SA, Reg. S 6.25%
15/02/2025 (1) EUR 4,000,000 3,681,580 0.29Ardagh Finance Holdings SA, Reg. S
8.375% 15/06/2019 (1) EUR 8,793,145 9,012,006 0.71Bormioli Rocco Holdings SA, Reg. S 10%
01/08/2018 EUR 5,000,000 5,106,175 0.40Cabot Financial Luxembourg II SA, Reg. S,
FRN 5.875% 15/11/2021 EUR 5,000,000 4,653,725 0.37Garfunkelux Holdco 3 SA, Reg. S 7.5%
01/08/2022 (1) EUR 3,000,000 2,949,375 0.23INEOS Group Holdings SA, Reg. S 5.75%
15/02/2019 (1) EUR 4,000,000 4,040,640 0.32LSF9 Balta Issuer SA, Reg. S 7.75%
15/09/2022 (1) EUR 2,000,000 2,117,980 0.17Matterhorn Telecom Holding SA, Reg. S
4.875% 01/05/2023 EUR 3,000,000 2,801,160 0.22Matterhorn Telecom SA, Reg. S 3.875%
01/05/2022 (1) EUR 5,000,000 4,837,225 0.38Monitchem HoldCo 2 SA, Reg. S 6.875%
15/06/2022 EUR 7,000,000 6,185,235 0.49Play Finance 1 SA, Reg. S 6.5%
01/08/2019 (1) EUR 4,000,000 4,147,000 0.33SES SA, Reg. S, FRN 4.625%
Perpetual (1) EUR 2,525,000 2,511,807 0.20Telenet Finance V Luxembourg SCA,
Reg. S 6.25% 15/08/2022 (1) EUR 5,000,000 5,358,425 0.42
86,198,213 6.81
MexicoCemex SAB de CV, Reg. S 4.375%
05/03/2023 EUR 13,000,000 12,672,920 1.00
12,672,920 1.00
NetherlandsABN AMRO Bank NV, Reg. S, FRN 5.75%
Perpetual (1) EUR 5,000,000 4,669,275 0.37Constellium NV, Reg. S 4.625%
15/05/2021 EUR 11,000,000 8,782,675 0.69Constellium NV, Reg. S 7%
15/01/2023 (1) EUR 4,150,000 3,385,964 0.27Koninklijke KPN NV, Reg. S, FRN 6.875%
14/03/2073 GBP 8,000,000 10,029,991 0.79OI European Group BV, Reg. S 6.75%
15/09/2020 (1) EUR 6,500,000 7,616,310 0.60SRLEV NV, FRN 9% 15/04/2041 EUR 2,500,000 2,559,650 0.20UPC Holding BV, Reg. S 6.375%
15/09/2022 (1) EUR 7,000,000 7,437,675 0.59Ziggo Bond Finance BV, Reg. S 4.625%
15/01/2025 EUR 10,484,000 10,038,168 0.79
54,519,708 4.30
SCHEDULE OF INVESTMENTSAs at 30 June 2016
Investments Currency
Quantity/Nominal
Value
Market Value EUR
% of Net Assets
Transferable securities and money market instruments admitted to official exchange listing or dealt in on another regulated market
Corporate Bonds (continued)
PolandPlay Topco SA, Reg. S 7.75%
28/02/2020 (Luxembourg) (2) EUR 7,500,000 7,659,375 0.60TVN Finance Corp. III AB, Reg. S 7.375%
15/12/2020 (Sweden) (2) EUR 4,000,000 4,249,180 0.34
11,908,555 0.94
PortugalEDP - Energias de Portugal SA, Reg. S,
FRN 5.375% 16/09/2075 (1) EUR 10,000,000 9,961,850 0.79Ren Finance BV, Reg. S 4.75%
16/10/2020 (Netherlands) (2) EUR 2,500,000 2,915,800 0.23
12,877,650 1.02
RomaniaCable Communications Systems NV,
Reg. S 7.5% 01/11/2020 (Netherlands) (2) EUR 10,000,000 10,500,100 0.83
10,500,100 0.83
RussiaGazprom OAO, Reg. S 3.389%
20/03/2020 (Luxembourg) (1) (2) EUR 20,000,000 20,737,000 1.64
20,737,000 1.64
SerbiaUnited Group BV, Reg. S 7.875%
15/11/2020 (Netherlands) (1) (2) EUR 8,000,000 8,439,960 0.67
8,439,960 0.67
SpainAbengoa Finance SAU, Reg. S 6%
31/03/2021 EUR 4,500,000 205,470 0.02Abengoa Greenfield SA, Reg. S 5.5%
01/10/2019 EUR 5,000,000 238,750 0.02Banco Bilbao Vizcaya Argentaria SA,
Reg. S, FRN 6.75% Perpetual EUR 7,000,000 6,030,815 0.48Banco Santander SA, Reg. S, FRN 6.25%
Perpetual (1) EUR 7,000,000 5,956,440 0.47Bilbao Luxembourg SA, Reg. S 11.063%
01/12/2018 (Luxembourg) (1) (2) EUR 8,683,877 8,487,361 0.67CaixaBank SA, Reg. S, FRN 5%
14/11/2023 EUR 5,000,000 5,182,000 0.41Campofrio Food Group SA, Reg. S 3.375%
15/03/2022 EUR 10,000,000 10,146,550 0.80Cellnex Telecom SAU, Reg. S 3.125%
27/07/2022 EUR 6,000,000 6,165,840 0.49Cirsa Funding Luxembourg SA, Reg. S
5.75% 15/05/2021 (Luxembourg) (2) EUR 7,000,000 7,197,015 0.57Gas Natural Fenosa Finance BV, Reg. S,
FRN 3.375% Perpetual (Netherlands) (2) EUR 6,000,000 5,367,000 0.42Gas Natural Fenosa Finance BV, Reg. S,
FRN 4.125% Perpetual (Netherlands) (2) EUR 6,000,000 5,921,160 0.47Grupo Isolux Corsan Finance BV, Reg. S
6.625% 15/04/2021 (Netherlands) (1) (2) EUR 11,200,000 1,821,624 0.14
Obrascon Huarte Lain SA, Reg. S 4.75% 15/03/2022 (1) EUR 3,000,000 2,039,370 0.16
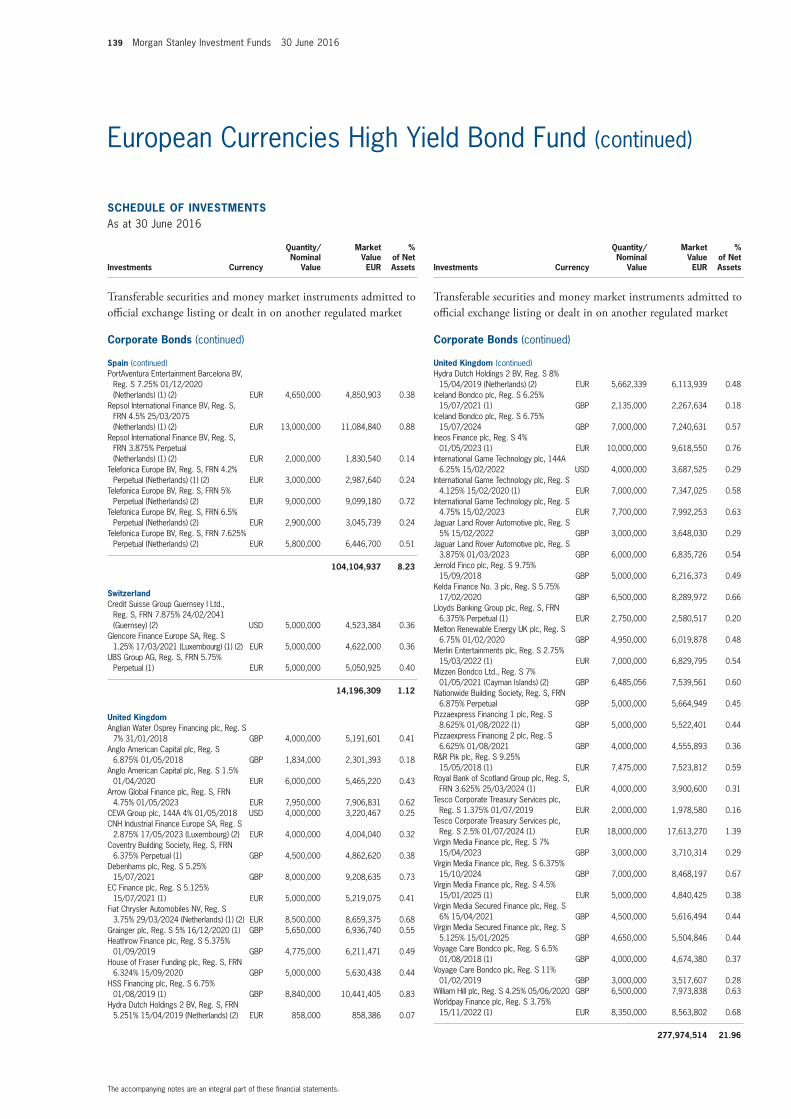
139 Morgan Stanley Investment Funds 30 June 2016
The accompanying notes are an integral part of these financial statements.
European Currencies High Yield Bond Fund (continued)
SCHEDULE OF INVESTMENTSAs at 30 June 2016
Investments Currency
Quantity/Nominal
Value
Market Value EUR
% of Net Assets
Transferable securities and money market instruments admitted to official exchange listing or dealt in on another regulated market
Corporate Bonds (continued)
Spain (continued)PortAventura Entertainment Barcelona BV,
Reg. S 7.25% 01/12/2020 (Netherlands) (1) (2) EUR 4,650,000 4,850,903 0.38
Repsol International Finance BV, Reg. S, FRN 4.5% 25/03/2075 (Netherlands) (1) (2) EUR 13,000,000 11,084,840 0.88
Repsol International Finance BV, Reg. S, FRN 3.875% Perpetual (Netherlands) (1) (2) EUR 2,000,000 1,830,540 0.14
Telefonica Europe BV, Reg. S, FRN 4.2% Perpetual (Netherlands) (1) (2) EUR 3,000,000 2,987,640 0.24
Telefonica Europe BV, Reg. S, FRN 5% Perpetual (Netherlands) (2) EUR 9,000,000 9,099,180 0.72
Telefonica Europe BV, Reg. S, FRN 6.5% Perpetual (Netherlands) (2) EUR 2,900,000 3,045,739 0.24
Telefonica Europe BV, Reg. S, FRN 7.625% Perpetual (Netherlands) (2) EUR 5,800,000 6,446,700 0.51
104,104,937 8.23
SwitzerlandCredit Suisse Group Guernsey I Ltd.,
Reg. S, FRN 7.875% 24/02/2041 (Guernsey) (2) USD 5,000,000 4,523,384 0.36
Glencore Finance Europe SA, Reg. S 1.25% 17/03/2021 (Luxembourg) (1) (2) EUR 5,000,000 4,622,000 0.36
UBS Group AG, Reg. S, FRN 5.75% Perpetual (1) EUR 5,000,000 5,050,925 0.40
14,196,309 1.12
United KingdomAnglian Water Osprey Financing plc, Reg. S
7% 31/01/2018 GBP 4,000,000 5,191,601 0.41Anglo American Capital plc, Reg. S
6.875% 01/05/2018 GBP 1,834,000 2,301,393 0.18Anglo American Capital plc, Reg. S 1.5%
01/04/2020 EUR 6,000,000 5,465,220 0.43Arrow Global Finance plc, Reg. S, FRN
4.75% 01/05/2023 EUR 7,950,000 7,906,831 0.62CEVA Group plc, 144A 4% 01/05/2018 USD 4,000,000 3,220,467 0.25CNH Industrial Finance Europe SA, Reg. S
2.875% 17/05/2023 (Luxembourg) (2) EUR 4,000,000 4,004,040 0.32Coventry Building Society, Reg. S, FRN
6.375% Perpetual (1) GBP 4,500,000 4,862,620 0.38Debenhams plc, Reg. S 5.25%
15/07/2021 GBP 8,000,000 9,208,635 0.73EC Finance plc, Reg. S 5.125%
15/07/2021 (1) EUR 5,000,000 5,219,075 0.41Fiat Chrysler Automobiles NV, Reg. S
3.75% 29/03/2024 (Netherlands) (1) (2) EUR 8,500,000 8,659,375 0.68Grainger plc, Reg. S 5% 16/12/2020 (1) GBP 5,650,000 6,936,740 0.55Heathrow Finance plc, Reg. S 5.375%
01/09/2019 GBP 4,775,000 6,211,471 0.49House of Fraser Funding plc, Reg. S, FRN
6.324% 15/09/2020 GBP 5,000,000 5,630,438 0.44HSS Financing plc, Reg. S 6.75%
01/08/2019 (1) GBP 8,840,000 10,441,405 0.83Hydra Dutch Holdings 2 BV, Reg. S, FRN
5.251% 15/04/2019 (Netherlands) (2) EUR 858,000 858,386 0.07
SCHEDULE OF INVESTMENTSAs at 30 June 2016
Investments Currency
Quantity/Nominal
Value
Market Value EUR
% of Net Assets
Transferable securities and money market instruments admitted to official exchange listing or dealt in on another regulated market
Corporate Bonds (continued)
United Kingdom (continued)Hydra Dutch Holdings 2 BV, Reg. S 8%
15/04/2019 (Netherlands) (2) EUR 5,662,339 6,113,939 0.48Iceland Bondco plc, Reg. S 6.25%
15/07/2021 (1) GBP 2,135,000 2,267,634 0.18Iceland Bondco plc, Reg. S 6.75%
15/07/2024 GBP 7,000,000 7,240,631 0.57Ineos Finance plc, Reg. S 4%
01/05/2023 (1) EUR 10,000,000 9,618,550 0.76International Game Technology plc, 144A
6.25% 15/02/2022 USD 4,000,000 3,687,525 0.29International Game Technology plc, Reg. S
4.125% 15/02/2020 (1) EUR 7,000,000 7,347,025 0.58International Game Technology plc, Reg. S
4.75% 15/02/2023 EUR 7,700,000 7,992,253 0.63Jaguar Land Rover Automotive plc, Reg. S
5% 15/02/2022 GBP 3,000,000 3,648,030 0.29Jaguar Land Rover Automotive plc, Reg. S
3.875% 01/03/2023 GBP 6,000,000 6,835,726 0.54Jerrold Finco plc, Reg. S 9.75%
15/09/2018 GBP 5,000,000 6,216,373 0.49Kelda Finance No. 3 plc, Reg. S 5.75%
17/02/2020 GBP 6,500,000 8,289,972 0.66Lloyds Banking Group plc, Reg. S, FRN
6.375% Perpetual (1) EUR 2,750,000 2,580,517 0.20Melton Renewable Energy UK plc, Reg. S
6.75% 01/02/2020 GBP 4,950,000 6,019,878 0.48Merlin Entertainments plc, Reg. S 2.75%
15/03/2022 (1) EUR 7,000,000 6,829,795 0.54Mizzen Bondco Ltd., Reg. S 7%
01/05/2021 (Cayman Islands) (2) GBP 6,485,056 7,539,561 0.60Nationwide Building Society, Reg. S, FRN
6.875% Perpetual GBP 5,000,000 5,664,949 0.45Pizzaexpress Financing 1 plc, Reg. S
8.625% 01/08/2022 (1) GBP 5,000,000 5,522,401 0.44Pizzaexpress Financing 2 plc, Reg. S
6.625% 01/08/2021 GBP 4,000,000 4,555,893 0.36R&R Pik plc, Reg. S 9.25%
15/05/2018 (1) EUR 7,475,000 7,523,812 0.59Royal Bank of Scotland Group plc, Reg. S,
FRN 3.625% 25/03/2024 (1) EUR 4,000,000 3,900,600 0.31Tesco Corporate Treasury Services plc,
Reg. S 1.375% 01/07/2019 EUR 2,000,000 1,978,580 0.16Tesco Corporate Treasury Services plc,
Reg. S 2.5% 01/07/2024 (1) EUR 18,000,000 17,613,270 1.39Virgin Media Finance plc, Reg. S 7%
15/04/2023 GBP 3,000,000 3,710,314 0.29Virgin Media Finance plc, Reg. S 6.375%
15/10/2024 GBP 7,000,000 8,468,197 0.67Virgin Media Finance plc, Reg. S 4.5%
15/01/2025 (1) EUR 5,000,000 4,840,425 0.38Virgin Media Secured Finance plc, Reg. S
6% 15/04/2021 GBP 4,500,000 5,616,494 0.44Virgin Media Secured Finance plc, Reg. S
5.125% 15/01/2025 GBP 4,650,000 5,504,846 0.44Voyage Care Bondco plc, Reg. S 6.5%
01/08/2018 (1) GBP 4,000,000 4,674,380 0.37Voyage Care Bondco plc, Reg. S 11%
01/02/2019 GBP 3,000,000 3,517,607 0.28William Hill plc, Reg. S 4.25% 05/06/2020 GBP 6,500,000 7,973,838 0.63Worldpay Finance plc, Reg. S 3.75%
15/11/2022 (1) EUR 8,350,000 8,563,802 0.68
277,974,514 21.96
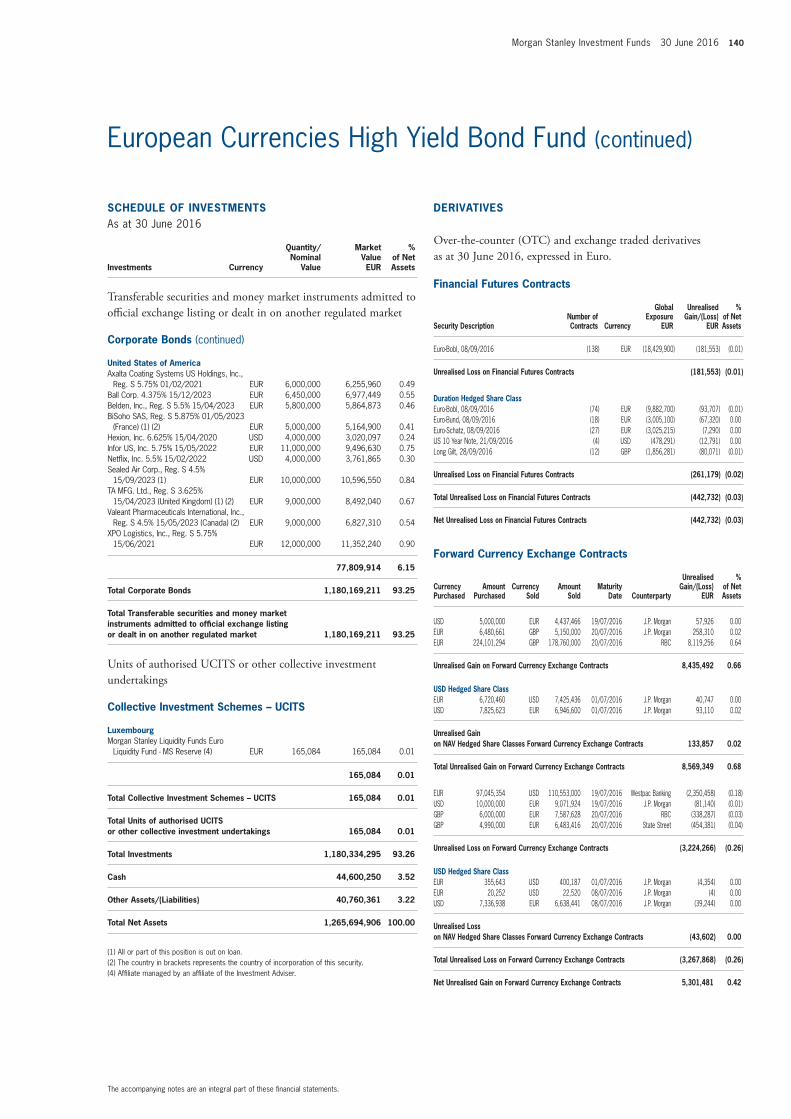
Morgan Stanley Investment Funds 30 June 2016 140
The accompanying notes are an integral part of these financial statements.
European Currencies High Yield Bond Fund (continued)
SCHEDULE OF INVESTMENTSAs at 30 June 2016
Investments Currency
Quantity/Nominal
Value
Market Value EUR
% of Net Assets
Transferable securities and money market instruments admitted to official exchange listing or dealt in on another regulated market
Corporate Bonds (continued)
United States of AmericaAxalta Coating Systems US Holdings, Inc.,
Reg. S 5.75% 01/02/2021 EUR 6,000,000 6,255,960 0.49Ball Corp. 4.375% 15/12/2023 EUR 6,450,000 6,977,449 0.55Belden, Inc., Reg. S 5.5% 15/04/2023 EUR 5,800,000 5,864,873 0.46BiSoho SAS, Reg. S 5.875% 01/05/2023
(France) (1) (2) EUR 5,000,000 5,164,900 0.41Hexion, Inc. 6.625% 15/04/2020 USD 4,000,000 3,020,097 0.24Infor US, Inc. 5.75% 15/05/2022 EUR 11,000,000 9,496,630 0.75Netflix, Inc. 5.5% 15/02/2022 USD 4,000,000 3,761,865 0.30Sealed Air Corp., Reg. S 4.5%
15/09/2023 (1) EUR 10,000,000 10,596,550 0.84TA MFG. Ltd., Reg. S 3.625%
15/04/2023 (United Kingdom) (1) (2) EUR 9,000,000 8,492,040 0.67Valeant Pharmaceuticals International, Inc.,
Reg. S 4.5% 15/05/2023 (Canada) (2) EUR 9,000,000 6,827,310 0.54XPO Logistics, Inc., Reg. S 5.75%
15/06/2021 EUR 12,000,000 11,352,240 0.90
77,809,914 6.15
Total Corporate Bonds 1,180,169,211 93.25
Total Transferable securities and money market instruments admitted to official exchange listing or dealt in on another regulated market 1,180,169,211 93.25
Units of authorised UCITS or other collective investment undertakings
Collective Investment Schemes – UCITS
LuxembourgMorgan Stanley Liquidity Funds Euro
Liquidity Fund - MS Reserve (4) EUR 165,084 165,084 0.01
165,084 0.01
Total Collective Investment Schemes – UCITS 165,084 0.01
Total Units of authorised UCITS or other collective investment undertakings 165,084 0.01
Total Investments 1,180,334,295 93.26
Cash 44,600,250 3.52
Other Assets/(Liabilities) 40,760,361 3.22
Total Net Assets 1,265,694,906 100.00
(1) All or part of this position is out on loan.(2) The country in brackets represents the country of incorporation of this security.(4) Affiliate managed by an affiliate of the Investment Adviser.
Financial Futures Contracts
Security DescriptionNumber of Contracts Currency
Global Exposure
EUR
Unrealised Gain/(Loss)
EUR
% of Net Assets
Euro-Bobl, 08/09/2016 (138) EUR (18,429,900) (181,553) (0.01)
Unrealised Loss on Financial Futures Contracts (181,553) (0.01)
Duration Hedged Share ClassEuro-Bobl, 08/09/2016 (74) EUR (9,882,700) (93,707) (0.01)Euro-Bund, 08/09/2016 (18) EUR (3,005,100) (67,320) 0.00Euro-Schatz, 08/09/2016 (27) EUR (3,025,215) (7,290) 0.00US 10 Year Note, 21/09/2016 (4) USD (478,291) (12,791) 0.00Long Gilt, 28/09/2016 (12) GBP (1,856,281) (80,071) (0.01)
Unrealised Loss on Financial Futures Contracts (261,179) (0.02)
Total Unrealised Loss on Financial Futures Contracts (442,732) (0.03)
Net Unrealised Loss on Financial Futures Contracts (442,732) (0.03)
Forward Currency Exchange Contracts
Currency Purchased
Amount Purchased
Currency Sold
Amount Sold
Maturity Date Counterparty
Unrealised Gain/(Loss)
EUR
% of Net Assets
USD 5,000,000 EUR 4,437,466 19/07/2016 J.P. Morgan 57,926 0.00EUR 6,480,661 GBP 5,150,000 20/07/2016 J.P. Morgan 258,310 0.02EUR 224,101,294 GBP 178,760,000 20/07/2016 RBC 8,119,256 0.64
Unrealised Gain on Forward Currency Exchange Contracts 8,435,492 0.66
USD Hedged Share ClassEUR 6,720,460 USD 7,425,436 01/07/2016 J.P. Morgan 40,747 0.00USD 7,825,623 EUR 6,946,600 01/07/2016 J.P. Morgan 93,110 0.02
Unrealised Gain on NAV Hedged Share Classes Forward Currency Exchange Contracts 133,857 0.02
Total Unrealised Gain on Forward Currency Exchange Contracts 8,569,349 0.68
EUR 97,045,354 USD 110,553,000 19/07/2016 Westpac Banking (2,350,458) (0.18)USD 10,000,000 EUR 9,071,924 19/07/2016 J.P. Morgan (81,140) (0.01)GBP 6,000,000 EUR 7,587,628 20/07/2016 RBC (338,287) (0.03)GBP 4,990,000 EUR 6,483,416 20/07/2016 State Street (454,381) (0.04)
Unrealised Loss on Forward Currency Exchange Contracts (3,224,266) (0.26)
USD Hedged Share ClassEUR 355,643 USD 400,187 01/07/2016 J.P. Morgan (4,354) 0.00EUR 20,252 USD 22,520 08/07/2016 J.P. Morgan (4) 0.00USD 7,336,938 EUR 6,638,441 08/07/2016 J.P. Morgan (39,244) 0.00
Unrealised Loss on NAV Hedged Share Classes Forward Currency Exchange Contracts (43,602) 0.00
Total Unrealised Loss on Forward Currency Exchange Contracts (3,267,868) (0.26)
Net Unrealised Gain on Forward Currency Exchange Contracts 5,301,481 0.42
DERIVATIVES
Over-the-counter (OTC) and exchange traded derivatives as at 30 June 2016, expressed in Euro.

141 Morgan Stanley Investment Funds 30 June 2016
The accompanying notes are an integral part of these financial statements.
European Currencies High Yield Bond Fund (continued)
Credit Default Swap Contracts
Nominal Amount Ccy Counterparty
Reference Entity
Buy/Sell
Interest (Paid)/
ReceivedMaturity
Date
Market Value EUR
Unrealised Gain/(Loss)
EUR
% of Net Assets
20,000,000 EUR Societe Generale
iTraxx Europe Crossover Series 25 Version 1 Sell 5.00% 20/06/2021 1,120,480 1,120,480 0.09
2,500,000 EUR Barclays Ineos Group Holdings SA 6.5% 15/08/2018 Sell 5.00% 20/06/2019 139,317 139,317 0.01
Total Unrealised Gain on Credit Default Swap Contracts 1,259,797 1,259,797 0.10
Net Unrealised Gain on Credit Default Swap Contracts 1,259,797 1,259,797 0.10
Collateral received and paid by the Fund in respect of financial derivative instruments:
Type of Collateral Counterparty CurrencyCollateral Amount
receivedCollateral Amount
paid
European Currencies High Yield Bond Fund
Cash Barclays EUR 38,000 -Cash Goldman Sachs EUR 1,272,270 -Cash Societe Generale EUR 958,000 -Cash Westpac Banking EUR - 3,428,000
2,268,270 3,428,000
DERIVATIVES (continued)
Over-the-counter (OTC) and exchange traded derivatives as at 30 June 2016, expressed in Euro.

Morgan Stanley Investment Funds 30 June 2016 142
The accompanying notes are an integral part of these financial statements.
Please refer to the full prospectus for the Fund’s investment objective and policy.
INVESTMENT AIM
To provide an attractive rate of return, measured in US dollars, through market, instrument and currency selection. The Fund consists of domestic, international and Euromarket fixed income securities of varying maturities denominated in US dollars and other currencies, including emerging markets.
SCHEDULE OF INVESTMENTSAs at 30 June 2016
Investments Currency
Quantity/Nominal
Value
Market Value USD
% of Net Assets
Transferable securities and money market instruments admitted to official exchange listing or dealt in on another regulated market
Convertible Bonds
JerseyDerwent London Capital No. 2 Jersey Ltd.,
REIT, Reg. S 1.125% 24/07/2019 GBP 800,000 1,107,970 0.23
1,107,970 0.23
SingaporeCapitaLand Ltd., Reg. S 1.85%
19/06/2020 SGD 2,250,000 1,594,855 0.34
1,594,855 0.34
United Arab EmiratesDP World Ltd., Reg. S 1.75%
19/06/2024 USD 1,200,000 1,176,762 0.25
1,176,762 0.25
United States of AmericaCitrix Systems, Inc. 0.5% 15/04/2019 USD 1,425,000 1,598,672 0.34Extra Space Storage LP, REIT, 144A
3.125% 01/10/2035 USD 1,250,000 1,414,844 0.30Illumina, Inc. 0% 15/06/2019 USD 1,449,000 1,414,586 0.30Priceline Group, Inc. (The) 0.9%
15/09/2021 USD 1,375,000 1,392,188 0.29
5,820,290 1.23
Total Convertible Bonds 9,699,877 2.05
Corporate Bonds
AustraliaAPT Pipelines Ltd., 144A 4.2%
23/03/2025 USD 325,000 333,161 0.07APT Pipelines Ltd., Reg. S 3.5%
22/03/2030 (1) GBP 700,000 923,643 0.20Aurizon Network Pty. Ltd., Reg. S 2%
18/09/2024 (1) EUR 300,000 328,848 0.07Aurizon Network Pty. Ltd., Reg. S 3.125%
01/06/2026 EUR 350,000 396,562 0.08BHP Billiton Finance USA Ltd. 3.85%
30/09/2023 USD 720,000 782,715 0.17Commonwealth Bank of Australia, Reg. S,
FRN 2% 22/04/2027 EUR 800,000 858,524 0.18Macquarie Bank Ltd., 144A 6.625%
07/04/2021 USD 755,000 869,990 0.18Origin Energy Finance Ltd., Reg. S, FRN
7.875% 16/06/2071 EUR 800,000 874,669 0.18Origin Energy Finance Ltd., 144A 3.5%
09/10/2018 USD 525,000 528,948 0.11Scentre Group Trust 1, REIT, Reg. S 2.25%
16/07/2024 EUR 375,000 458,947 0.10Telstra Corp. Ltd., 144A 3.125%
07/04/2025 USD 535,000 560,033 0.12Transurban Finance Co. Pty. Ltd. 2.5%
08/10/2020 EUR 350,000 418,123 0.09Transurban Finance Co. Pty. Ltd. 1.875%
16/09/2024 EUR 300,000 348,774 0.07Transurban Finance Co. Pty. Ltd., Reg. S
2% 28/08/2025 EUR 350,000 406,322 0.09
8,089,259 1.71
Global Bond Fund

143 Morgan Stanley Investment Funds 30 June 2016
The accompanying notes are an integral part of these financial statements.
Global Bond Fund (continued)
SCHEDULE OF INVESTMENTSAs at 30 June 2016
Investments Currency
Quantity/Nominal
Value
Market Value USD
% of Net Assets
Transferable securities and money market instruments admitted to official exchange listing or dealt in on another regulated market
Corporate Bonds (continued)
BelgiumAnheuser-Busch InBev Finance, Inc.
4.7% 01/02/2036 (United States of America) (2) USD 775,000 875,425 0.19
Solvay Finance SA, Reg. S, FRN 5.118% Perpetual (France) (2) EUR 350,000 401,670 0.08
Solvay Finance SA, Reg. S, FRN 5.425% Perpetual (France) (2) EUR 225,000 256,758 0.05
1,533,853 0.32
BrazilBRF SA, 144A 3.95% 22/05/2023 USD 420,000 405,422 0.09
405,422 0.09
CanadaBarrick Gold Corp. 4.1% 01/05/2023 USD 530,000 559,216 0.12Goldcorp, Inc. 3.7% 15/03/2023 USD 1,312,000 1,342,189 0.28
1,901,405 0.40
ChileEmpresa Nacional de Telecomunicaciones
SA, 144A 4.75% 01/08/2026 USD 1,180,000 1,173,740 0.25
1,173,740 0.25
ChinaWant Want China Finance Ltd., 144A
1.875% 14/05/2018 (British Virgin Islands) (2) USD 990,000 988,540 0.21
988,540 0.21
ColombiaEcopetrol SA 5.875% 18/09/2023 USD 900,000 927,842 0.20
927,842 0.20
FranceAreva SA 3.5% 22/03/2021 EUR 800,000 740,130 0.16Areva SA 4.875% 23/09/2024 (1) EUR 400,000 364,684 0.08AXA SA, Reg. S, FRN 5.25%
16/04/2040 (1) EUR 1,200,000 1,474,938 0.31AXA SA, Reg. S, FRN 5.125%
04/07/2043 EUR 425,000 539,589 0.11AXA SA, Reg. S, FRN 3.941% Perpetual (1) EUR 300,000 330,069 0.07BNP Paribas SA, Reg. S, FRN 6.125%
Perpetual (1) EUR 400,000 426,174 0.09BNP Paribas SA, Reg. S 2.375%
17/02/2025 (1) EUR 225,000 248,087 0.05BPCE SA, 144A 5.15% 21/07/2024 USD 1,125,000 1,174,337 0.25Credit Agricole Assurances SA, Reg. S,
FRN 4.5% Perpetual EUR 700,000 739,729 0.16Credit Agricole SA, 144A 3.875%
15/04/2024 USD 950,000 1,031,895 0.22Credit Agricole SA, Reg. S 2.625%
17/03/2027 EUR 500,000 555,206 0.12Electricite de France SA, Reg. S, FRN 5%
Perpetual EUR 800,000 838,627 0.18
SCHEDULE OF INVESTMENTSAs at 30 June 2016
Investments Currency
Quantity/Nominal
Value
Market Value USD
% of Net Assets
Transferable securities and money market instruments admitted to official exchange listing or dealt in on another regulated market
Corporate Bonds (continued)
France (continued)Numericable-SFR SA, 144A 7.375%
01/05/2026 USD 650,000 637,195 0.13Orange SA, Reg. S, FRN 5% Perpetual EUR 190,000 220,363 0.05Societe Generale SA, Reg. S 2.625%
27/02/2025 EUR 700,000 776,405 0.16TOTAL SA, Reg. S, FRN 2.25% Perpetual EUR 450,000 484,133 0.10
10,581,561 2.24
GermanyAllianz Finance II BV, FRN 5.75%
08/07/2041 (Netherlands) (2) EUR 1,200,000 1,523,870 0.32Bayer AG, Reg. S, FRN 3.75%
01/07/2074 EUR 450,000 509,617 0.11Daimler Finance North America LLC
8.5% 18/01/2031 (United States of America) (2) USD 35,000 57,004 0.01
Muenchener Rueckversicherungs-Gesellschaft AG, Reg. S, FRN 6% 26/05/2041 EUR 1,200,000 1,559,817 0.33
RWE AG, Reg. S, FRN 7% Perpetual (1) GBP 700,000 923,153 0.20Volkswagen International Finance NV,
Reg. S, FRN 4.625% Perpetual (Netherlands) (1) (2) EUR 350,000 400,952 0.08
Vonovia Finance BV, Reg. S, FRN 4.625% 08/04/2074 (Netherlands) (2) EUR 600,000 695,290 0.15
5,669,703 1.20
IndiaBharat Petroleum Corp. Ltd., Reg. S
4.625% 25/10/2022 USD 530,000 571,971 0.12Bharti Airtel International Netherlands BV,
Reg. S 4% 10/12/2018 (Netherlands) (2) EUR 700,000 834,836 0.18Indian Railway Finance Corp. Ltd., Reg. S
3.917% 26/02/2019 USD 600,000 630,756 0.13
2,037,563 0.43
IrelandRyanair Ltd., Reg. S 1.875% 17/06/2021 EUR 220,000 258,869 0.06Ryanair Ltd., Reg. S 1.125% 10/03/2023 EUR 350,000 392,937 0.08
651,806 0.14
ItalyAssicurazioni Generali SpA, Reg. S, FRN
10.125% 10/07/2042 EUR 800,000 1,133,442 0.24Enel SpA, FRN, 144A 8.75% 24/09/2073 USD 645,000 738,238 0.16FCA Capital Ireland plc, Reg. S 1.375%
17/04/2020 (Ireland) (2) EUR 700,000 786,066 0.17Intesa Sanpaolo SpA, Reg. S, FRN 7%
Perpetual (1) EUR 1,050,000 1,080,935 0.23Intesa Sanpaolo SpA, 144A 6.5%
24/02/2021 USD 2,280,000 2,586,911 0.55Intesa Sanpaolo SpA 5.25% 12/01/2024 USD 200,000 214,417 0.04Poste Vita SpA 2.875% 30/05/2019 EUR 200,000 230,938 0.05Telecom Italia Finance SA 7.75%
24/01/2033 (Luxembourg) (2) EUR 300,000 445,005 0.09
7,215,952 1.53

Morgan Stanley Investment Funds 30 June 2016 144
The accompanying notes are an integral part of these financial statements.
Global Bond Fund (continued)
SCHEDULE OF INVESTMENTSAs at 30 June 2016
Investments Currency
Quantity/Nominal
Value
Market Value USD
% of Net Assets
Transferable securities and money market instruments admitted to official exchange listing or dealt in on another regulated market
Corporate Bonds (continued)
MalaysiaPetronas Capital Ltd., Reg. S 3.5%
18/03/2025 (1) USD 1,000,000 1,053,408 0.22
1,053,408 0.22
NetherlandsABN AMRO Bank NV, Reg. S 6.375%
27/04/2021 (1) EUR 800,000 1,064,276 0.23Achmea BV, Reg. S, FRN 4.25% Perpetual EUR 275,000 268,811 0.06Aegon NV, Reg. S, FRN 4% 25/04/2044 EUR 150,000 152,365 0.03ASR Nederland NV, Reg. S, FRN 5%
Perpetual EUR 800,000 881,249 0.19Cooperatieve Rabobank UA, FRN, 144A
11% Perpetual USD 75,000 90,700 0.02Cooperatieve Rabobank UA, Reg. S, FRN
2.5% 26/05/2026 (1) EUR 1,000,000 1,131,555 0.24Cooperatieve Rabobank UA, Reg. S, FRN
5.5% Perpetual EUR 900,000 956,980 0.20Cooperatieve Rabobank UA, Reg. S
6.875% 19/03/2020 EUR 400,000 522,193 0.11ING Bank NV, 144A 5.8% 25/09/2023 USD 910,000 1,001,805 0.21NN Group NV, Reg. S, FRN 4.625%
08/04/2044 EUR 800,000 900,602 0.19
6,970,536 1.48
PeruBanco de Credito del Peru, FRN, 144A
6.125% 24/04/2027 USD 1,525,000 1,668,975 0.35
1,668,975 0.35
PortugalEDP - Energias de Portugal SA, Reg. S,
FRN 5.375% 16/09/2075 (1) EUR 1,000,000 1,107,399 0.23EDP Finance BV, 144A 4.125%
15/01/2020 (Netherlands) (2) USD 1,025,000 1,061,142 0.23
2,168,541 0.46
South KoreaExport-Import Bank of Korea 4%
14/01/2024 USD 1,100,000 1,226,554 0.26
1,226,554 0.26
SpainBanco Bilbao Vizcaya Argentaria SA,
Reg. S, FRN 6.75% Perpetual (1) EUR 1,400,000 1,340,819 0.28Banco Santander SA, Reg. S, FRN 6.375%
Perpetual (1) USD 1,600,000 1,406,016 0.30BBVA Subordinated Capital SAU, Reg. S,
FRN 3.5% 11/04/2024 EUR 300,000 340,071 0.07Gas Natural Fenosa Finance BV, Reg. S,
FRN 3.375% Perpetual (Netherlands) (1) (2) EUR 700,000 696,053 0.15
Gas Natural Fenosa Finance BV, Reg. S, FRN 4.125% Perpetual (Netherlands) (2) EUR 200,000 219,407 0.05
IE2 Holdco SAU, Reg. S 2.875% 01/06/2026 EUR 300,000 336,493 0.07
Inmobiliaria Colonial SA, Reg. S 2.728% 05/06/2023 (1) EUR 500,000 587,548 0.12
SCHEDULE OF INVESTMENTSAs at 30 June 2016
Investments Currency
Quantity/Nominal
Value
Market Value USD
% of Net Assets
Transferable securities and money market instruments admitted to official exchange listing or dealt in on another regulated market
Corporate Bonds (continued)
Spain (continued)Santander Issuances SAU 5.179%
19/11/2025 USD 1,000,000 996,690 0.21Telefonica Europe BV, Reg. S, FRN 4.2%
Perpetual (Netherlands) (1) (2) EUR 400,000 442,824 0.09Telefonica Europe BV, Reg. S, FRN 5.875%
Perpetual (Netherlands) (2) EUR 300,000 341,206 0.07Telefonica Europe BV, Reg. S, FRN 6.5%
Perpetual (Netherlands) (2) EUR 200,000 233,501 0.05Telefonica Europe BV, Reg. S, FRN 7.625%
Perpetual (Netherlands) (1) (2) EUR 200,000 247,118 0.05
7,187,746 1.51
SwedenSvenska Handelsbanken AB, Reg. S, FRN
2.656% 15/01/2024 EUR 450,000 518,417 0.11
518,417 0.11
SwitzerlandCredit Suisse AG, 144A 6.5% 08/08/2023 USD 1,100,000 1,157,409 0.25Novartis Capital Corp. 4.4% 06/05/2044
(United States of America) (2) USD 400,000 485,410 0.10Syngenta Finance NV 3.125%
28/03/2022 (Netherlands) (2) USD 640,000 671,359 0.14UBS AG, Reg. S 5.125% 15/05/2024 USD 650,000 664,099 0.14Zurich Insurance Co. Ltd., Reg. S, FRN
4.25% 02/10/2043 (Ireland) (2) EUR 300,000 362,779 0.08
3,341,056 0.71
ThailandThai Oil PCL, Reg. S 4.875% 23/01/2043 USD 875,000 945,647 0.20
945,647 0.20
United Arab EmiratesADCB Finance Cayman Ltd., Reg. S 3%
04/03/2019 (Cayman Islands) (2) USD 500,000 508,163 0.11IPIC GMTN Ltd., Reg. S 5.875%
14/03/2021 (Cayman Islands) (1) (2) EUR 400,000 545,537 0.11
1,053,700 0.22
United KingdomAviva plc, Reg. S, FRN 6.875%
22/05/2038 EUR 1,200,000 1,438,190 0.30Barclays Bank plc, Reg. S, FRN 14%
Perpetual GBP 250,000 408,523 0.09Barclays Bank plc, Reg. S 6%
14/01/2021 EUR 300,000 377,617 0.08BP Capital Markets plc 3.119%
04/05/2026 USD 1,000,000 1,020,610 0.22British Telecommunications plc, Reg. S
1.75% 10/03/2026 EUR 450,000 521,909 0.11Heathrow Funding Ltd., Reg. S 6%
20/03/2020 (Jersey) (2) GBP 300,000 456,894 0.10High Speed Rail Finance 1 plc, Reg. S
4.375% 01/11/2038 GBP 300,000 483,483 0.10HSBC Holdings plc, FRN 6.375%
Perpetual USD 600,000 565,833 0.12HSBC Holdings plc, Reg. S 6%
10/06/2019 (1) EUR 700,000 887,741 0.19

145 Morgan Stanley Investment Funds 30 June 2016
The accompanying notes are an integral part of these financial statements.
Global Bond Fund (continued)
SCHEDULE OF INVESTMENTSAs at 30 June 2016
Investments Currency
Quantity/Nominal
Value
Market Value USD
% of Net Assets
Transferable securities and money market instruments admitted to official exchange listing or dealt in on another regulated market
Corporate Bonds (continued)
United Kingdom (continued)Imperial Tobacco Finance plc, Reg. S
7.75% 24/06/2019 (1) GBP 500,000 788,559 0.17John Lewis plc, Reg. S 4.25% 18/12/2034 GBP 450,000 621,842 0.13Lloyds Bank plc, Reg. S 6.5%
24/03/2020 (1) EUR 1,700,000 2,180,616 0.46Nationwide Building Society, Reg. S, FRN
4.125% 20/03/2023 EUR 550,000 629,280 0.13Nationwide Building Society, 144A 6.25%
25/02/2020 USD 620,000 712,603 0.15NGG Finance plc, Reg. S, FRN 5.625%
18/06/2073 (1) GBP 600,000 847,342 0.18Santander UK plc, 144A 5% 07/11/2023 USD 1,050,000 1,081,799 0.23Standard Chartered plc, Reg. S, FRN 4%
21/10/2025 (1) EUR 350,000 382,020 0.08Vodafone Group plc, Reg. S 2.2%
25/08/2026 EUR 800,000 944,895 0.20
14,349,756 3.04
United States of AmericaActavis Funding SCS 3.8% 15/03/2025
(Luxembourg) (2) USD 475,000 495,185 0.11American International Group, Inc. 4.875%
01/06/2022 USD 500,000 555,497 0.12AT&T, Inc. 6.3% 15/01/2038 USD 875,000 1,057,123 0.22Bank of America Corp. 5.7% 24/01/2022 USD 1,850,000 2,135,113 0.45Bank of America Corp. 4% 01/04/2024 USD 800,000 854,156 0.18Bank of America Corp. 4.2% 26/08/2024 USD 325,000 336,825 0.07Bank of America Corp. 4.25%
22/10/2026 USD 589,000 610,401 0.13Baxalta, Inc. 4% 23/06/2025 USD 700,000 731,213 0.15Boston Properties LP, REIT 3.85%
01/02/2023 USD 1,200,000 1,292,016 0.27Capital One Bank USA NA 3.375%
15/02/2023 USD 1,254,000 1,284,234 0.27Charter Communications Operating LLC,
144A 4.908% 23/07/2025 USD 1,125,000 1,228,972 0.26Charter Communications Operating LLC,
144A 6.484% 23/10/2045 USD 525,000 633,183 0.13Citigroup, Inc. 5.5% 13/09/2025 USD 1,125,000 1,264,686 0.27Citigroup, Inc. 8.125% 15/07/2039 USD 650,000 1,014,387 0.21Citigroup, Inc. 6.675% 13/09/2043 USD 70,000 90,389 0.02Comcast Corp. 4.6% 15/08/2045 USD 770,000 893,254 0.19Discover Financial Services 3.95%
06/11/2024 USD 550,000 567,977 0.12Enable Midstream Partners LP 3.9%
15/05/2024 USD 600,000 532,740 0.11Five Corners Funding Trust, 144A 4.419%
15/11/2023 USD 1,225,000 1,325,385 0.28General Motors Financial Co., Inc. 4.3%
13/07/2025 USD 960,000 987,898 0.21Gilead Sciences, Inc. 4.8% 01/04/2044 USD 350,000 396,482 0.08Goldman Sachs Group, Inc. (The) 6.75%
01/10/2037 USD 1,320,000 1,628,939 0.34Goldman Sachs Group, Inc. (The) 4.8%
08/07/2044 USD 325,000 360,742 0.08Hewlett Packard Enterprise Co., 144A
3.6% 15/10/2020 USD 415,000 432,366 0.09HSBC USA, Inc. 3.5% 23/06/2024 USD 1,125,000 1,161,236 0.25J.P. Morgan Chase & Co. 3.25%
23/09/2022 USD 800,000 838,684 0.18J.P. Morgan Chase & Co. 4.125%
15/12/2026 USD 1,500,000 1,585,958 0.34
SCHEDULE OF INVESTMENTSAs at 30 June 2016
Investments Currency
Quantity/Nominal
Value
Market Value USD
% of Net Assets
Transferable securities and money market instruments admitted to official exchange listing or dealt in on another regulated market
Corporate Bonds (continued)
United States of America (continued)Liberty Mutual Group, Inc., 144A 4.85%
01/08/2044 USD 400,000 409,162 0.09Mallinckrodt International Finance SA, 144A
5.5% 15/04/2025 (Luxembourg) (2) USD 945,000 850,500 0.18Monongahela Power Co., 144A 5.4%
15/12/2043 USD 400,000 504,736 0.11Omnicom Group, Inc. 3.65% 01/11/2024 USD 338,000 361,974 0.08Rowan Cos., Inc. 5.85% 15/01/2044 USD 575,000 392,190 0.08Tyco International Finance SA 1.375%
25/02/2025 (Luxembourg) (2) EUR 700,000 771,129 0.16Verizon Communications, Inc. 4.672%
15/03/2055 USD 1,109,000 1,123,461 0.24Visa, Inc. 3.15% 14/12/2025 USD 825,000 881,904 0.19Wells Fargo & Co. 3.45% 13/02/2023 USD 615,000 637,057 0.14Wells Fargo & Co. 4.125% 15/08/2023 USD 400,000 430,522 0.09Whole Foods Market, Inc., 144A 5.2%
03/12/2025 USD 1,230,000 1,322,465 0.28Yum! Brands, Inc. 3.875% 01/11/2020 USD 1,850,000 1,886,436 0.40Zimmer Biomet Holdings, Inc. 5.75%
30/11/2039 USD 600,000 722,808 0.15
34,589,385 7.32
Total Corporate Bonds 116,250,367 24.60
Government Bonds
AustraliaAustralia Government Bond, Reg. S 2.75%
21/04/2024 AUD 600,000 473,683 0.10
473,683 0.10
AustriaAustria Government Bond, Reg. S, 144A
1.2% 20/10/2025 EUR 1,800,000 2,213,909 0.47
2,213,909 0.47
BelgiumBelgium Government Bond, Reg. S, 144A
0.8% 22/06/2025 EUR 5,600,000 6,609,458 1.40
6,609,458 1.40
BermudaBermuda Government International Bond,
Reg. S 4.854% 06/02/2024 (1) USD 1,000,000 1,093,025 0.23
1,093,025 0.23
BrazilBrazil Letras do Tesouro Nacional 0%
01/01/2019 BRL 2,000,000 4,668,596 0.99Brazil Notas do Tesouro Nacional 10%
01/01/2025 BRL 1,030,000 2,876,842 0.61
7,545,438 1.60

Morgan Stanley Investment Funds 30 June 2016 146
The accompanying notes are an integral part of these financial statements.
Global Bond Fund (continued)
SCHEDULE OF INVESTMENTSAs at 30 June 2016
Investments Currency
Quantity/Nominal
Value
Market Value USD
% of Net Assets
Transferable securities and money market instruments admitted to official exchange listing or dealt in on another regulated market
Government Bonds (continued)
CanadaCanadian Government Bond 1.5%
01/06/2023 CAD 9,200,000 7,424,368 1.57
7,424,368 1.57
ColombiaColombia Government International Bond
4.5% 28/01/2026 USD 1,200,000 1,286,430 0.27
1,286,430 0.27
CyprusCyprus Government International Bond,
Reg. S 3.875% 06/05/2022 EUR 1,100,000 1,253,340 0.27
1,253,340 0.27
FranceFrance Government Bond OAT, Reg. S
5.5% 25/04/2029 EUR 1,200,000 2,198,882 0.47France Government Bond OAT, Reg. S
3.25% 25/05/2045 EUR 2,200,000 3,871,178 0.82
6,070,060 1.29
GermanyBundesrepublik Deutschland, Reg. S 4.25%
04/07/2039 EUR 2,300,000 4,838,355 1.02
4,838,355 1.02
GreeceHellenic Republic Government Bond,
Reg. S, STEP 3% 24/02/2023 EUR 250,000 204,510 0.04Hellenic Republic Government Bond,
Reg. S, STEP 3% 24/02/2024 EUR 250,000 203,771 0.04Hellenic Republic Government Bond,
Reg. S, STEP 3% 24/02/2025 EUR 250,000 194,775 0.04Hellenic Republic Government Bond,
Reg. S, STEP 3% 24/02/2026 EUR 250,000 191,283 0.04Hellenic Republic Government Bond,
Reg. S, STEP 3% 24/02/2027 EUR 250,000 191,570 0.04Hellenic Republic Government Bond,
Reg. S, STEP 3% 24/02/2028 EUR 250,000 187,624 0.04Hellenic Republic Government Bond,
Reg. S, STEP 3% 24/02/2029 EUR 250,000 182,412 0.04Hellenic Republic Government Bond,
Reg. S, STEP 3% 24/02/2030 EUR 250,000 178,952 0.04Hellenic Republic Government Bond,
Reg. S, STEP 3% 24/02/2031 EUR 250,000 176,271 0.04Hellenic Republic Government Bond,
Reg. S, STEP 3% 24/02/2032 EUR 250,000 173,976 0.04Hellenic Republic Government Bond,
Reg. S, STEP 3% 24/02/2033 EUR 250,000 171,420 0.04Hellenic Republic Government Bond,
Reg. S, STEP 3% 24/02/2034 EUR 250,000 169,547 0.04Hellenic Republic Government Bond,
Reg. S, STEP 3% 24/02/2035 EUR 250,000 171,644 0.04Hellenic Republic Government Bond,
Reg. S, STEP 3% 24/02/2036 EUR 250,000 169,490 0.04Hellenic Republic Government Bond,
Reg. S, STEP 3% 24/02/2037 EUR 250,000 166,934 0.03
SCHEDULE OF INVESTMENTSAs at 30 June 2016
Investments Currency
Quantity/Nominal
Value
Market Value USD
% of Net Assets
Transferable securities and money market instruments admitted to official exchange listing or dealt in on another regulated market
Government Bonds (continued)
Greece (continued)Hellenic Republic Government Bond,
Reg. S, STEP 3% 24/02/2038 EUR 250,000 167,545 0.04Hellenic Republic Government Bond,
Reg. S, STEP 3% 24/02/2039 EUR 250,000 165,499 0.03Hellenic Republic Government Bond,
Reg. S, STEP 3% 24/02/2040 EUR 250,000 165,597 0.03Hellenic Republic Government Bond,
Reg. S, STEP 3% 24/02/2041 EUR 250,000 165,758 0.03Hellenic Republic Government Bond,
Reg. S, STEP 3% 24/02/2042 EUR 250,000 167,316 0.03
3,565,894 0.75
HungaryHungary Government Bond 7.5%
12/11/2020 HUF 1,364,000,000 5,857,723 1.24Hungary Government Bond 3%
26/06/2024 HUF 917,000,000 3,225,993 0.68
9,083,716 1.92
IndonesiaIndonesia Government International Bond,
144A 5.875% 15/01/2024 USD 4,100,000 4,756,894 1.01
4,756,894 1.01
IrelandIreland Government Bond 5.4%
13/03/2025 EUR 1,000,000 1,575,483 0.33
1,575,483 0.33
ItalyItaly Buoni Poliennali Del Tesoro 1.5%
01/06/2025 EUR 8,200,000 9,367,344 1.98Italy Buoni Poliennali Del Tesoro, Reg. S,
144A 2.35% 15/09/2024 EUR 4,800,000 6,155,579 1.30Italy Buoni Poliennali Del Tesoro, Reg. S,
144A 1.65% 01/03/2032 EUR 1,700,000 1,874,840 0.40Italy Buoni Poliennali Del Tesoro, Reg. S 5%
01/09/2040 EUR 1,000,000 1,686,173 0.36
19,083,936 4.04
JapanJapan Government Ten Year Bond 1.7%
20/06/2018 JPY 951,000,000 9,617,434 2.04Japan Government Ten Year Bond 0.5%
20/09/2024 JPY 1,051,000,000 10,908,404 2.31Japan Government Thirty Year Bond 1.7%
20/06/2033 JPY 1,556,000,000 19,595,018 4.15Japan Government Thirty Year Bond 2%
20/09/2040 JPY 950,000,000 13,385,748 2.83
53,506,604 11.33
MexicoMexican Bonos 10% 05/12/2024 MXN 135,000,000 9,312,330 1.97
9,312,330 1.97
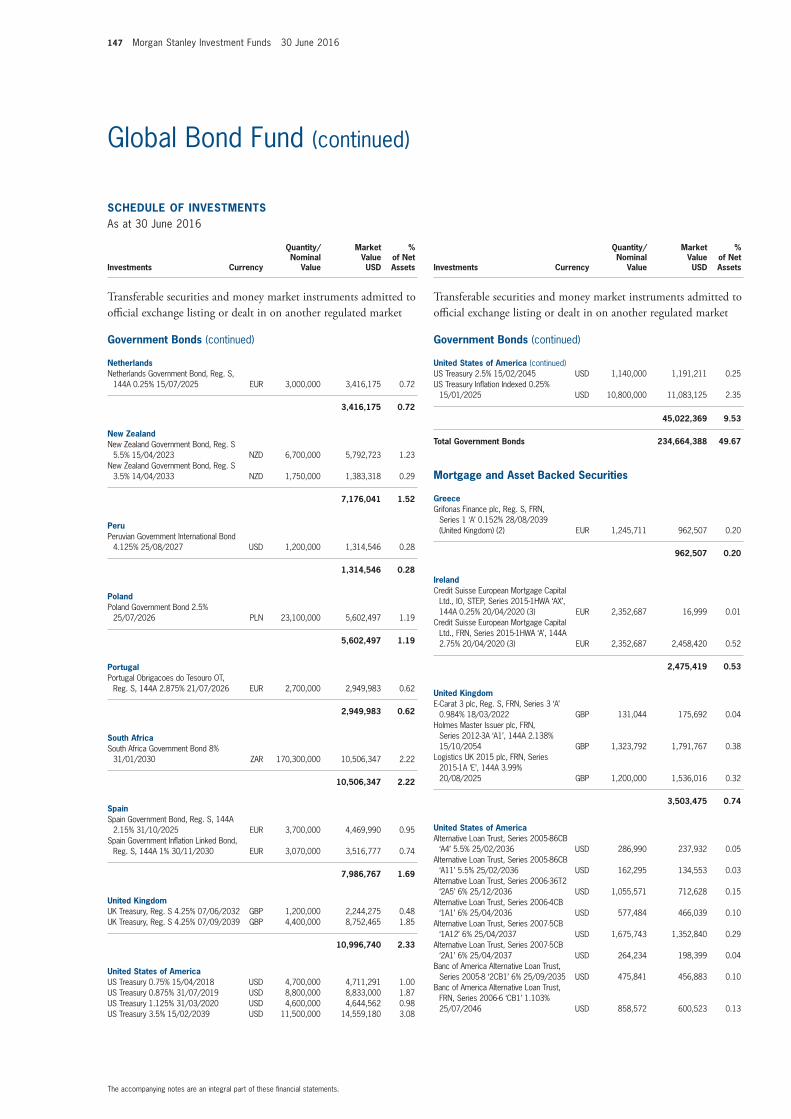
147 Morgan Stanley Investment Funds 30 June 2016
The accompanying notes are an integral part of these financial statements.
Global Bond Fund (continued)
SCHEDULE OF INVESTMENTSAs at 30 June 2016
Investments Currency
Quantity/Nominal
Value
Market Value USD
% of Net Assets
Transferable securities and money market instruments admitted to official exchange listing or dealt in on another regulated market
Government Bonds (continued)
NetherlandsNetherlands Government Bond, Reg. S,
144A 0.25% 15/07/2025 EUR 3,000,000 3,416,175 0.72
3,416,175 0.72
New ZealandNew Zealand Government Bond, Reg. S
5.5% 15/04/2023 NZD 6,700,000 5,792,723 1.23New Zealand Government Bond, Reg. S
3.5% 14/04/2033 NZD 1,750,000 1,383,318 0.29
7,176,041 1.52
PeruPeruvian Government International Bond
4.125% 25/08/2027 USD 1,200,000 1,314,546 0.28
1,314,546 0.28
PolandPoland Government Bond 2.5%
25/07/2026 PLN 23,100,000 5,602,497 1.19
5,602,497 1.19
PortugalPortugal Obrigacoes do Tesouro OT,
Reg. S, 144A 2.875% 21/07/2026 EUR 2,700,000 2,949,983 0.62
2,949,983 0.62
South AfricaSouth Africa Government Bond 8%
31/01/2030 ZAR 170,300,000 10,506,347 2.22
10,506,347 2.22
SpainSpain Government Bond, Reg. S, 144A
2.15% 31/10/2025 EUR 3,700,000 4,469,990 0.95Spain Government Inflation Linked Bond,
Reg. S, 144A 1% 30/11/2030 EUR 3,070,000 3,516,777 0.74
7,986,767 1.69
United KingdomUK Treasury, Reg. S 4.25% 07/06/2032 GBP 1,200,000 2,244,275 0.48UK Treasury, Reg. S 4.25% 07/09/2039 GBP 4,400,000 8,752,465 1.85
10,996,740 2.33
United States of AmericaUS Treasury 0.75% 15/04/2018 USD 4,700,000 4,711,291 1.00US Treasury 0.875% 31/07/2019 USD 8,800,000 8,833,000 1.87US Treasury 1.125% 31/03/2020 USD 4,600,000 4,644,562 0.98US Treasury 3.5% 15/02/2039 USD 11,500,000 14,559,180 3.08
SCHEDULE OF INVESTMENTSAs at 30 June 2016
Investments Currency
Quantity/Nominal
Value
Market Value USD
% of Net Assets
Transferable securities and money market instruments admitted to official exchange listing or dealt in on another regulated market
Government Bonds (continued)
United States of America (continued)US Treasury 2.5% 15/02/2045 USD 1,140,000 1,191,211 0.25US Treasury Inflation Indexed 0.25%
15/01/2025 USD 10,800,000 11,083,125 2.35
45,022,369 9.53
Total Government Bonds 234,664,388 49.67
Mortgage and Asset Backed Securities
GreeceGrifonas Finance plc, Reg. S, FRN,
Series 1 ‘A’ 0.152% 28/08/2039 (United Kingdom) (2) EUR 1,245,711 962,507 0.20
962,507 0.20
IrelandCredit Suisse European Mortgage Capital
Ltd., IO, STEP, Series 2015-1HWA ‘AX’, 144A 0.25% 20/04/2020 (3) EUR 2,352,687 16,999 0.01
Credit Suisse European Mortgage Capital Ltd., FRN, Series 2015-1HWA ‘A’, 144A 2.75% 20/04/2020 (3) EUR 2,352,687 2,458,420 0.52
2,475,419 0.53
United KingdomE-Carat 3 plc, Reg. S, FRN, Series 3 ‘A’
0.984% 18/03/2022 GBP 131,044 175,692 0.04Holmes Master Issuer plc, FRN,
Series 2012-3A ‘A1’, 144A 2.138% 15/10/2054 GBP 1,323,792 1,791,767 0.38
Logistics UK 2015 plc, FRN, Series 2015-1A ‘E’, 144A 3.99% 20/08/2025 GBP 1,200,000 1,536,016 0.32
3,503,475 0.74
United States of AmericaAlternative Loan Trust, Series 2005-86CB
‘A4’ 5.5% 25/02/2036 USD 286,990 237,932 0.05Alternative Loan Trust, Series 2005-86CB
‘A11’ 5.5% 25/02/2036 USD 162,295 134,553 0.03Alternative Loan Trust, Series 2006-36T2
‘2A5’ 6% 25/12/2036 USD 1,055,571 712,628 0.15Alternative Loan Trust, Series 2006-4CB
‘1A1’ 6% 25/04/2036 USD 577,484 466,039 0.10Alternative Loan Trust, Series 2007-5CB
‘1A12’ 6% 25/04/2037 USD 1,675,743 1,352,840 0.29Alternative Loan Trust, Series 2007-5CB
‘2A1’ 6% 25/04/2037 USD 264,234 198,399 0.04Banc of America Alternative Loan Trust,
Series 2005-8 ‘2CB1’ 6% 25/09/2035 USD 475,841 456,883 0.10Banc of America Alternative Loan Trust,
FRN, Series 2006-6 ‘CB1’ 1.103% 25/07/2046 USD 858,572 600,523 0.13
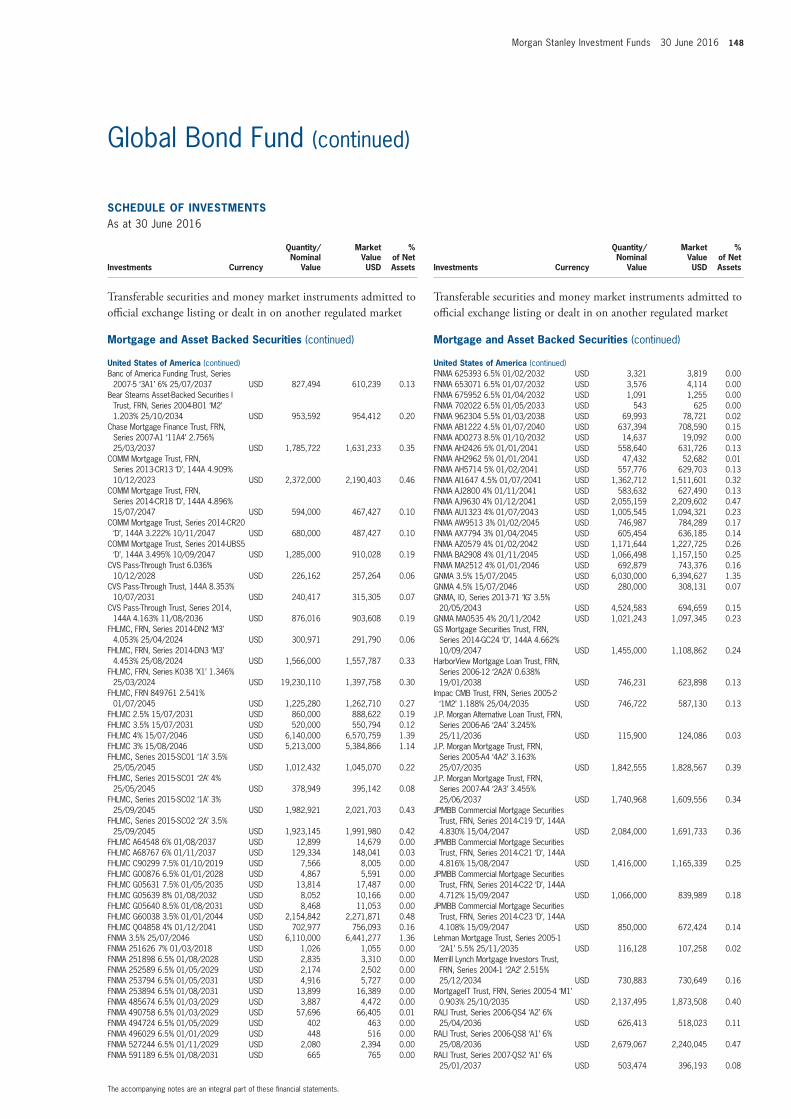
Morgan Stanley Investment Funds 30 June 2016 148
The accompanying notes are an integral part of these financial statements.
Global Bond Fund (continued)
SCHEDULE OF INVESTMENTSAs at 30 June 2016
Investments Currency
Quantity/Nominal
Value
Market Value USD
% of Net Assets
Transferable securities and money market instruments admitted to official exchange listing or dealt in on another regulated market
Mortgage and Asset Backed Securities (continued)
United States of America (continued)Banc of America Funding Trust, Series
2007-5 ‘3A1’ 6% 25/07/2037 USD 827,494 610,239 0.13Bear Stearns Asset-Backed Securities I
Trust, FRN, Series 2004-BO1 ‘M2’ 1.203% 25/10/2034 USD 953,592 954,412 0.20
Chase Mortgage Finance Trust, FRN, Series 2007-A1 ‘11A4’ 2.756% 25/03/2037 USD 1,785,722 1,631,233 0.35
COMM Mortgage Trust, FRN, Series 2013-CR13 ‘D’, 144A 4.909% 10/12/2023 USD 2,372,000 2,190,403 0.46
COMM Mortgage Trust, FRN, Series 2014-CR18 ‘D’, 144A 4.896% 15/07/2047 USD 594,000 467,427 0.10
COMM Mortgage Trust, Series 2014-CR20 ‘D’, 144A 3.222% 10/11/2047 USD 680,000 487,427 0.10
COMM Mortgage Trust, Series 2014-UBS5 ‘D’, 144A 3.495% 10/09/2047 USD 1,285,000 910,028 0.19
CVS Pass-Through Trust 6.036% 10/12/2028 USD 226,162 257,264 0.06
CVS Pass-Through Trust, 144A 8.353% 10/07/2031 USD 240,417 315,305 0.07
CVS Pass-Through Trust, Series 2014, 144A 4.163% 11/08/2036 USD 876,016 903,608 0.19
FHLMC, FRN, Series 2014-DN2 ‘M3’ 4.053% 25/04/2024 USD 300,971 291,790 0.06
FHLMC, FRN, Series 2014-DN3 ‘M3’ 4.453% 25/08/2024 USD 1,566,000 1,557,787 0.33
FHLMC, FRN, Series K038 ‘X1’ 1.346% 25/03/2024 USD 19,230,110 1,397,758 0.30
FHLMC, FRN 849761 2.541% 01/07/2045 USD 1,225,280 1,262,710 0.27
FHLMC 2.5% 15/07/2031 USD 860,000 888,622 0.19FHLMC 3.5% 15/07/2031 USD 520,000 550,794 0.12FHLMC 4% 15/07/2046 USD 6,140,000 6,570,759 1.39FHLMC 3% 15/08/2046 USD 5,213,000 5,384,866 1.14FHLMC, Series 2015-SC01 ‘1A’ 3.5%
25/05/2045 USD 1,012,432 1,045,070 0.22FHLMC, Series 2015-SC01 ‘2A’ 4%
25/05/2045 USD 378,949 395,142 0.08FHLMC, Series 2015-SC02 ‘1A’ 3%
25/09/2045 USD 1,982,921 2,021,703 0.43FHLMC, Series 2015-SC02 ‘2A’ 3.5%
25/09/2045 USD 1,923,145 1,991,980 0.42FHLMC A64548 6% 01/08/2037 USD 12,899 14,679 0.00FHLMC A68767 6% 01/11/2037 USD 129,334 148,041 0.03FHLMC C90299 7.5% 01/10/2019 USD 7,566 8,005 0.00FHLMC G00876 6.5% 01/01/2028 USD 4,867 5,591 0.00FHLMC G05631 7.5% 01/05/2035 USD 13,814 17,487 0.00FHLMC G05639 8% 01/08/2032 USD 8,052 10,166 0.00FHLMC G05640 8.5% 01/08/2031 USD 8,468 11,053 0.00FHLMC G60038 3.5% 01/01/2044 USD 2,154,842 2,271,871 0.48FHLMC Q04858 4% 01/12/2041 USD 702,977 756,093 0.16FNMA 3.5% 25/07/2046 USD 6,110,000 6,441,277 1.36FNMA 251626 7% 01/03/2018 USD 1,026 1,055 0.00FNMA 251898 6.5% 01/08/2028 USD 2,835 3,310 0.00FNMA 252589 6.5% 01/05/2029 USD 2,174 2,502 0.00FNMA 253794 6.5% 01/05/2031 USD 4,916 5,727 0.00FNMA 253894 6.5% 01/08/2031 USD 13,899 16,389 0.00FNMA 485674 6.5% 01/03/2029 USD 3,887 4,472 0.00FNMA 490758 6.5% 01/03/2029 USD 57,696 66,405 0.01FNMA 494724 6.5% 01/05/2029 USD 402 463 0.00FNMA 496029 6.5% 01/01/2029 USD 448 516 0.00FNMA 527244 6.5% 01/11/2029 USD 2,080 2,394 0.00FNMA 591189 6.5% 01/08/2031 USD 665 765 0.00
SCHEDULE OF INVESTMENTSAs at 30 June 2016
Investments Currency
Quantity/Nominal
Value
Market Value USD
% of Net Assets
Transferable securities and money market instruments admitted to official exchange listing or dealt in on another regulated market
Mortgage and Asset Backed Securities (continued)
United States of America (continued)FNMA 625393 6.5% 01/02/2032 USD 3,321 3,819 0.00FNMA 653071 6.5% 01/07/2032 USD 3,576 4,114 0.00FNMA 675952 6.5% 01/04/2032 USD 1,091 1,255 0.00FNMA 702022 6.5% 01/05/2033 USD 543 625 0.00FNMA 962304 5.5% 01/03/2038 USD 69,993 78,721 0.02FNMA AB1222 4.5% 01/07/2040 USD 637,394 708,590 0.15FNMA AD0273 8.5% 01/10/2032 USD 14,637 19,092 0.00FNMA AH2426 5% 01/01/2041 USD 558,640 631,726 0.13FNMA AH2962 5% 01/01/2041 USD 47,432 52,682 0.01FNMA AH5714 5% 01/02/2041 USD 557,776 629,703 0.13FNMA AI1647 4.5% 01/07/2041 USD 1,362,712 1,511,601 0.32FNMA AJ2800 4% 01/11/2041 USD 583,632 627,490 0.13FNMA AJ9630 4% 01/12/2041 USD 2,055,159 2,209,602 0.47FNMA AU1323 4% 01/07/2043 USD 1,005,545 1,094,321 0.23FNMA AW9513 3% 01/02/2045 USD 746,987 784,289 0.17FNMA AX7794 3% 01/04/2045 USD 605,454 636,185 0.14FNMA AZ0579 4% 01/02/2042 USD 1,171,644 1,227,725 0.26FNMA BA2908 4% 01/11/2045 USD 1,066,498 1,157,150 0.25FNMA MA2512 4% 01/01/2046 USD 692,879 743,376 0.16GNMA 3.5% 15/07/2045 USD 6,030,000 6,394,627 1.35GNMA 4.5% 15/07/2046 USD 280,000 308,131 0.07GNMA, IO, Series 2013-71 ‘IG’ 3.5%
20/05/2043 USD 4,524,583 694,659 0.15GNMA MA0535 4% 20/11/2042 USD 1,021,243 1,097,345 0.23GS Mortgage Securities Trust, FRN,
Series 2014-GC24 ‘D’, 144A 4.662% 10/09/2047 USD 1,455,000 1,108,862 0.24
HarborView Mortgage Loan Trust, FRN, Series 2006-12 ‘2A2A’ 0.638% 19/01/2038 USD 746,231 623,898 0.13
Impac CMB Trust, FRN, Series 2005-2 ‘1M2’ 1.188% 25/04/2035 USD 746,722 587,130 0.13
J.P. Morgan Alternative Loan Trust, FRN, Series 2006-A6 ‘2A4’ 3.245% 25/11/2036 USD 115,900 124,086 0.03
J.P. Morgan Mortgage Trust, FRN, Series 2005-A4 ‘4A2’ 3.163% 25/07/2035 USD 1,842,555 1,828,567 0.39
J.P. Morgan Mortgage Trust, FRN, Series 2007-A4 ‘2A3’ 3.455% 25/06/2037 USD 1,740,968 1,609,556 0.34
JPMBB Commercial Mortgage Securities Trust, FRN, Series 2014-C19 ‘D’, 144A 4.830% 15/04/2047 USD 2,084,000 1,691,733 0.36
JPMBB Commercial Mortgage Securities Trust, FRN, Series 2014-C21 ‘D’, 144A 4.816% 15/08/2047 USD 1,416,000 1,165,339 0.25
JPMBB Commercial Mortgage Securities Trust, FRN, Series 2014-C22 ‘D’, 144A 4.712% 15/09/2047 USD 1,066,000 839,989 0.18
JPMBB Commercial Mortgage Securities Trust, FRN, Series 2014-C23 ‘D’, 144A 4.108% 15/09/2047 USD 850,000 672,424 0.14
Lehman Mortgage Trust, Series 2005-1 ‘2A1’ 5.5% 25/11/2035 USD 116,128 107,258 0.02
Merrill Lynch Mortgage Investors Trust, FRN, Series 2004-1 ‘2A2’ 2.515% 25/12/2034 USD 730,883 730,649 0.16
MortgageIT Trust, FRN, Series 2005-4 ‘M1’ 0.903% 25/10/2035 USD 2,137,495 1,873,508 0.40
RALI Trust, Series 2006-QS4 ‘A2’ 6% 25/04/2036 USD 626,413 518,023 0.11
RALI Trust, Series 2006-QS8 ‘A1’ 6% 25/08/2036 USD 2,679,067 2,240,045 0.47
RALI Trust, Series 2007-QS2 ‘A1’ 6% 25/01/2037 USD 503,474 396,193 0.08

149 Morgan Stanley Investment Funds 30 June 2016
The accompanying notes are an integral part of these financial statements.
Global Bond Fund (continued)
SCHEDULE OF INVESTMENTSAs at 30 June 2016
Investments Currency
Quantity/Nominal
Value
Market Value USD
% of Net Assets
Transferable securities and money market instruments admitted to official exchange listing or dealt in on another regulated market
Mortgage and Asset Backed Securities (continued)
United States of America (continued)Residential Asset Securitization Trust,
Series 2006-A6 ‘2A6’ 6% 25/07/2036 USD 388,297 333,262 0.07Wells Fargo Commercial Mortgage Trust,
Series 2014-LC16 ‘D’, 144A 3.938% 15/08/2050 USD 2,580,000 2,039,913 0.43
WFRBS Commercial Mortgage Trust, FRN, Series 2014-C22 ‘D’, 144A 4.056% 15/09/2057 USD 1,915,000 1,429,930 0.30
WFRBS Commercial Mortgage Trust, FRN, Series 2014-C23 ‘D’, 144A 4.138% 15/10/2057 USD 1,516,000 1,150,434 0.24
WFRBS Commercial Mortgage Trust, Series 2014-C20 ‘D’, 144A 3.986% 15/05/2047 USD 1,562,000 1,147,524 0.24
WFRBS Commercial Mortgage Trust, Series 2014-C24 ‘D’, 144A 3.692% 15/11/2047 USD 980,000 702,000 0.15
89,571,536 18.96
Total Mortgage and Asset Backed Securities 96,512,937 20.43
Total Transferable securities and money market instruments admitted to official exchange listing or dealt in on another regulated market 457,127,569 96.75
Units of authorised UCITS or other collective investment undertakings
Collective Investment Schemes – UCITS
LuxembourgMorgan Stanley Liquidity Funds Euro
Liquidity Fund – MS Reserve (4) EUR 256,009 284,590 0.06
284,590 0.06
Total Collective Investment Schemes – UCITS 284,590 0.06
Total Units of authorised UCITS or other collective investment undertakings 284,590 0.06
Total Investments 457,412,159 96.81
Cash 27,478,774 5.82
Other Assets/(Liabilities) (12,416,972) (2.63)
Total Net Assets 472,473,961 100.00
(1) All or part of this position is out on loan.(2) The country in brackets represents the country of incorporation of this security.(3) Security is valued at its fair value under the direction of the Board of Directors of the SICAV.(4) Affiliate managed by an affiliate of the Investment Adviser.
Financial Futures Contracts
Security DescriptionNumber of Contracts Currency
Global Exposure
USD
Unrealised Gain/(Loss)
USD
% of Net Assets
Japan 10 Year Bond, 12/09/2016 11 JPY 16,366,219 86,301 0.02Australia 10 Year Bond, 15/09/2016 40 AUD 4,051,228 42,492 0.01Canada 10 Year Bond, 21/09/2016 49 CAD 5,575,849 130,189 0.03Long Gilt, 28/09/2016 50 GBP 8,597,984 319,812 0.07US 2 Year Note, 30/09/2016 100 USD 21,923,438 143,750 0.03US 5 Year Note, 30/09/2016 288 USD 35,147,250 612,000 0.13
Unrealised Gain on Financial Futures Contracts 1,334,544 0.29
Total Unrealised Gain on Financial Futures Contracts 1,334,544 0.29
Euro-Bund, 08/09/2016 (62) EUR (11,506,474) (174,202) (0.04)US 10 Year Note, 21/09/2016 (143) USD (19,007,828) (508,320) (0.11)US Long Bond, 21/09/2016 (20) USD (3,458,750) (214,687) (0.05)
Unrealised Loss on Financial Futures Contracts (897,209) (0.20)
Total Unrealised Loss on Financial Futures Contracts (897,209) (0.20)
Net Unrealised Gain on Financial Futures Contracts 437,335 0.09
Forward Currency Exchange Contracts (continued)
Currency Purchased
Amount Purchased
Currency Sold
Amount Sold
Maturity Date Counterparty
Unrealised Gain/(Loss)
USD
% of Net Assets
MXN 56,700,000 USD 2,998,445 05/07/2016 HSBC 61,484 0.01MXN 9,100,000 USD 487,554 05/07/2016 J.P. Morgan 3,546 0.00MXN 11,800,000 USD 629,898 05/07/2016 RBC 6,913 0.00MXN 113,050,000 USD 5,976,950 05/07/2016 State Street 124,020 0.03THB 52,400,000 USD 1,468,803 05/07/2016 HSBC 22,940 0.01CAD 1,000,000 EUR 685,903 07/07/2016 RBC 7,570 0.00CAD 4,880,000 USD 3,740,680 07/07/2016 RBC 17,534 0.00USD 3,355,415 EUR 3,000,000 08/07/2016 Westpac Banking 20,038 0.00AUD 7,107,000 USD 5,148,706 11/07/2016 Commonwealth
Bank of Australia 134,823 0.03NZD 6,400,000 USD 4,344,320 11/07/2016 Commonwealth
Bank of Australia 202,129 0.04NZD 2,060,000 USD 1,444,863 11/07/2016 J.P. Morgan 18,525 0.00CHF 3,250,000 USD 3,286,048 12/07/2016 UBS 49,766 0.01PLN 9,500,000 USD 2,371,727 12/07/2016 UBS 18,387 0.00USD 9,599,018 HUF 2,689,740,000 12/07/2016 HSBC 160,223 0.03USD 2,643,524 PLN 10,422,000 12/07/2016 State Street 21,444 0.01USD 2,014,420 PLN 7,700,000 12/07/2016 UBS 77,170 0.02USD 8,000,000 EUR 7,022,540 19/07/2016 Westpac Banking 189,178 0.04USD 2,301,187 GBP 1,640,000 20/07/2016 J.P. Morgan 97,193 0.02KRW 6,419,150,000 USD 5,448,037 21/07/2016 State Street 125,236 0.03MYR 4,575,000 USD 1,114,440 21/07/2016 HSBC 31,411 0.01RUB 149,100,000 USD 2,232,872 21/07/2016 UBS 76,665 0.02JPY 1,923,750,000 EUR 16,116,223 25/07/2016 RBC 801,077 0.17JPY 146,219,000 USD 1,407,603 25/07/2016 ANZ 16,051 0.00JPY 320,000,000 USD 3,065,178 25/07/2016 State Street 50,486 0.01JPY 1,264,993,000 USD 11,920,912 25/07/2016 Westpac Banking 395,632 0.08TRY 2,425,000 USD 829,400 29/07/2016 UBS 6,230 0.00CAD 1,000,000 EUR 691,708 05/08/2016 RBC 357 0.00CAD 4,880,000 USD 3,756,360 05/08/2016 RBC 2,264 0.00THB 52,400,000 USD 1,486,698 05/08/2016 HSBC 4,817 0.00USD 586,586 SGD 790,000 05/08/2016 HSBC 556 0.00
Unrealised Gain on Forward Currency Exchange Contracts 2,743,665 0.57
DERIVATIVES
Over-the-counter (OTC) and exchange traded derivatives as at 30 June 2016, expressed in US dollars.

Morgan Stanley Investment Funds 30 June 2016 150
The accompanying notes are an integral part of these financial statements.
Global Bond Fund (continued)
Forward Currency Exchange Contracts (continued)
Currency Purchased
Amount Purchased
Currency Sold
Amount Sold
Maturity Date Counterparty
Unrealised Gain/(Loss)
USD
% of Net Assets
EUR Hedged Share ClassEUR 72,299 USD 79,611 01/07/2016 J.P. Morgan 758 0.00USD 9,959 EUR 8,851 01/07/2016 J.P. Morgan 120 0.00EUR 11,256,217 USD 12,440,624 08/07/2016 J.P. Morgan 73,954 0.02
Unrealised Gain on NAV Hedged Share Classes Forward Currency Exchange Contracts 74,832 0.02
Total Unrealised Gain on Forward Currency Exchange Contracts 2,818,497 0.59
MXN 66,900,000 USD 3,612,155 05/07/2016 J.P. Morgan (1,763) 0.00USD 12,966,047 MXN 240,550,000 05/07/2016 State Street (15,715) 0.00USD 906,723 MXN 17,000,000 05/07/2016 UBS (10,716) 0.00USD 1,486,462 THB 52,400,000 05/07/2016 HSBC (5,282) 0.00EUR 692,378 CAD 1,000,000 07/07/2016 RBC (372) 0.00SGD 790,000 USD 586,641 07/07/2016 HSBC (451) 0.00USD 3,756,192 CAD 4,880,000 07/07/2016 RBC (2,021) 0.00USD 574,258 SGD 790,000 07/07/2016 HSBC (11,932) 0.00EUR 36,697,000 USD 40,888,990 08/07/2016 Westpac Banking (89,538) (0.02)USD 3,327,099 EUR 3,020,000 08/07/2016 J.P. Morgan (30,515) (0.01)USD 1,663,005 EUR 1,500,000 08/07/2016 State Street (4,684) 0.00EUR 4,403,860 NZD 7,250,000 11/07/2016 Commonwealth
Bank of Australia (253,591) (0.05)NZD 4,364,000 USD 3,109,289 11/07/2016 HSBC (9,179) 0.00USD 9,913,676 NZD 14,606,000 11/07/2016 Commonwealth
Bank of Australia (462,172) (0.10)DKK 10,050,000 EUR 1,351,444 13/07/2016 UBS (695) 0.00NOK 20,000,000 EUR 2,154,584 13/07/2016 J.P. Morgan (7,810) 0.00NOK 26,924,000 USD 3,300,936 13/07/2016 J.P. Morgan (86,113) (0.02)SEK 4,900,000 EUR 531,025 13/07/2016 State Street (12,795) 0.00SEK 14,142,000 USD 1,744,504 13/07/2016 State Street (77,190) (0.02)USD 3,091,136 ZAR 46,300,000 15/07/2016 J.P. Morgan (47,830) (0.01)USD 2,765,897 ZAR 41,671,000 15/07/2016 State Street (59,241) (0.01)USD 3,721,737 ZAR 55,875,000 15/07/2016 UBS (66,378) (0.02)GBP 1,290,000 EUR 1,617,200 20/07/2016 RBC (65,171) (0.01)GBP 1,018,000 USD 1,439,964 20/07/2016 HSBC (71,875) (0.02)USD 6,692,385 BRL 23,420,000 21/07/2016 State Street (561,410) (0.12)USD 5,957,996 MXN 113,050,000 05/08/2016 State Street (125,294) (0.03)
Unrealised Loss on Forward Currency Exchange Contracts (2,079,733) (0.44)
EUR Hedged Share ClassEUR 11,207,024 USD 12,625,525 01/07/2016 J.P. Morgan (167,350) (0.03)USD 12,452,714 EUR 11,270,472 01/07/2016 J.P. Morgan (75,993) (0.02)EUR 8,854 USD 9,846 08/07/2016 J.P. Morgan (2) 0.00USD 376,434 EUR 340,288 08/07/2016 J.P. Morgan (1,896) 0.00
Unrealised Loss on NAV Hedged Share Classes Forward Currency Exchange Contracts (245,241) (0.05)
Total Unrealised Loss on Forward Currency Exchange Contracts (2,324,974) (0.49)
Net Unrealised Gain on Forward Currency Exchange Contracts 493,523 0.10
Credit Default Swap Contracts
Nominal Amount Ccy Counterparty
Reference Entity
Buy/Sell
Interest (Paid)/
ReceivedMaturity
Date
Market Value USD
Unrealised Gain/(Loss)
USD
% of Net Assets
1,190,000 USD Deutsche Bank CMBX.NA.BB.6 Sell 5.00% 11/05/2063 (165,856) (165,856) (0.03)942,000 USD Goldman Sachs CMBX.NA.BB.6 Sell 5.00% 11/05/2063 (131,291) (131,291) (0.03)
2,525,000 USD Barclays Quest Diagnostics, Inc. 6.95% 01/07/2037 Buy (1.00)% 20/03/2019 (50,475) (50,475) (0.01)
2,500,000 USD Barclays Yum! Brands, Inc. 6.25% 15/03/2018 Buy (1.00)% 20/12/2018 (1,560) (1,560) 0.00
Total Unrealised Loss on Credit Default Swap Contracts (349,182) (349,182) (0.07)
Net Unrealised Loss on Credit Default Swap Contracts (349,182) (349,182) (0.07)
Interest Rate Swap Contracts
Nominal Amount Ccy Counterparty
Security Description
Maturity Date
Market Value USD
Unrealised Gain/(Loss)
USD
% of Net Assets
16,300,000 USD Barclays Pay fixed 2.43% Receive floating LIBOR
3 month 17/07/2025 (1,805,836) (1,805,836) (0.38)19,400,000 USD Citibank Pay fixed 1.749%
Receive floating LIBOR 3 month 17/07/2020 (778,339) (778,339) (0.17)
7,400,000 USD Goldman Sachs Pay fixed 1.703% Receive floating LIBOR
3 month 20/03/2020 (257,144) (257,144) (0.05)
Total Unrealised Loss on Interest Rate Swap Contracts (2,841,319) (2,841,319) (0.60)
Net Unrealised Loss on Interest Rate Swap Contracts (2,841,319) (2,841,319) (0.60)
Collateral received and paid by the Fund in respect of financial derivative instruments:
Type of Collateral Counterparty CurrencyCollateral Amount
receivedCollateral Amount
paid
Global Bond Fund
Cash Barclays USD - 1,630,000Cash Citigroup Global Market Ltd. USD - 590,000Cash Deutsche Bank USD - 200,000Cash Goldman Sachs USD 500,942 270,109Cash State Street USD 300,000 -Cash Westpac Banking USD 780,000 -
1,580,942 2,690,109
DERIVATIVES (continued)
Over-the-counter (OTC) and exchange traded derivatives as at 30 June 2016, expressed in US dollars.
DERIVATIVES (continued)
Over-the-counter (OTC) and exchange traded derivatives as at 30 June 2016, expressed in US dollars.
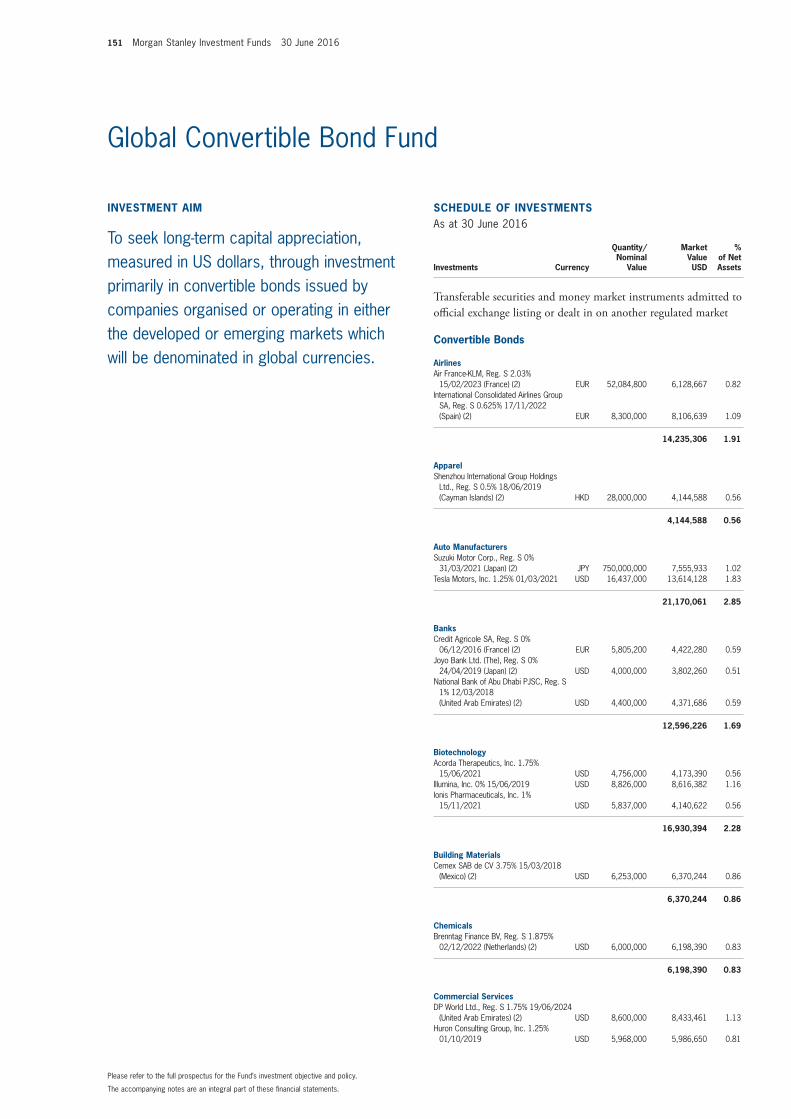
151 Morgan Stanley Investment Funds 30 June 2016
The accompanying notes are an integral part of these financial statements.
Please refer to the full prospectus for the Fund’s investment objective and policy.
Global Convertible Bond Fund
INVESTMENT AIM
To seek long-term capital appreciation, measured in US dollars, through investment primarily in convertible bonds issued by companies organised or operating in either the developed or emerging markets which will be denominated in global currencies.
SCHEDULE OF INVESTMENTSAs at 30 June 2016
Investments Currency
Quantity/Nominal
Value
Market Value USD
% of Net Assets
Transferable securities and money market instruments admitted to official exchange listing or dealt in on another regulated market
Convertible Bonds
AirlinesAir France-KLM, Reg. S 2.03%
15/02/2023 (France) (2) EUR 52,084,800 6,128,667 0.82International Consolidated Airlines Group
SA, Reg. S 0.625% 17/11/2022 (Spain) (2) EUR 8,300,000 8,106,639 1.09
14,235,306 1.91
ApparelShenzhou International Group Holdings
Ltd., Reg. S 0.5% 18/06/2019 (Cayman Islands) (2) HKD 28,000,000 4,144,588 0.56
4,144,588 0.56
Auto ManufacturersSuzuki Motor Corp., Reg. S 0%
31/03/2021 (Japan) (2) JPY 750,000,000 7,555,933 1.02Tesla Motors, Inc. 1.25% 01/03/2021 USD 16,437,000 13,614,128 1.83
21,170,061 2.85
BanksCredit Agricole SA, Reg. S 0%
06/12/2016 (France) (2) EUR 5,805,200 4,422,280 0.59Joyo Bank Ltd. (The), Reg. S 0%
24/04/2019 (Japan) (2) USD 4,000,000 3,802,260 0.51National Bank of Abu Dhabi PJSC, Reg. S
1% 12/03/2018 (United Arab Emirates) (2) USD 4,400,000 4,371,686 0.59
12,596,226 1.69
BiotechnologyAcorda Therapeutics, Inc. 1.75%
15/06/2021 USD 4,756,000 4,173,390 0.56Illumina, Inc. 0% 15/06/2019 USD 8,826,000 8,616,382 1.16Ionis Pharmaceuticals, Inc. 1%
15/11/2021 USD 5,837,000 4,140,622 0.56
16,930,394 2.28
Building MaterialsCemex SAB de CV 3.75% 15/03/2018
(Mexico) (2) USD 6,253,000 6,370,244 0.86
6,370,244 0.86
ChemicalsBrenntag Finance BV, Reg. S 1.875%
02/12/2022 (Netherlands) (2) USD 6,000,000 6,198,390 0.83
6,198,390 0.83
Commercial ServicesDP World Ltd., Reg. S 1.75% 19/06/2024
(United Arab Emirates) (2) USD 8,600,000 8,433,461 1.13Huron Consulting Group, Inc. 1.25%
01/10/2019 USD 5,968,000 5,986,650 0.81

Morgan Stanley Investment Funds 30 June 2016 152
The accompanying notes are an integral part of these financial statements.
Global Convertible Bond Fund (continued)
SCHEDULE OF INVESTMENTSAs at 30 June 2016
Investments Currency
Quantity/Nominal
Value
Market Value USD
% of Net Assets
Transferable securities and money market instruments admitted to official exchange listing or dealt in on another regulated market
Convertible Bonds (continued)
Commercial Services (continued)Live Nation Entertainment, Inc. 2.5%
15/05/2019 USD 5,613,000 5,644,573 0.76Toppan Printing Co. Ltd., Reg. S 0%
19/12/2019 (Japan) (2) JPY 720,000,000 7,324,869 0.98
27,389,553 3.68
ComputersBrocade Communications Systems, Inc.
1.375% 01/01/2020 USD 7,400,000 7,276,457 0.98
7,276,457 0.98
Distribution/WholesaleIwatani Corp., Reg. S 0% 22/10/2020
(Japan) (2) JPY 400,000,000 3,984,316 0.54
3,984,316 0.54
Diversified Financial ServicesBrait SE, Reg. S 2.75% 18/09/2020
(Malta) (2) GBP 3,500,000 4,985,618 0.67China Overseas Finance Investment
Cayman V Ltd., Reg. S 0% 05/01/2023 (Cayman Islands) (2) USD 11,000,000 11,152,185 1.50
Element Financial Corp., 144A 4.25% 30/06/2020 (Canada) (2) CAD 5,917,000 4,653,628 0.62
Encore Capital Group, Inc. 2.875% 15/03/2021 USD 7,589,000 5,354,988 0.72
Haniel Finance Deutschland GmbH, Reg. S 0% 12/05/2020 (Germany) (2) EUR 4,600,000 5,224,380 0.70
Magyar Nemzeti Vagyonkezelo Zrt., Reg. S 3.375% 02/04/2019 (Hungary) (2) EUR 6,400,000 8,036,250 1.08
PRA Group, Inc. 3% 01/08/2020 USD 6,060,000 4,738,163 0.64Remgro Jersey GBP Ltd., Reg. S 2.625%
22/03/2021 (Jersey) (2) GBP 3,000,000 4,449,512 0.60
48,594,724 6.53
ElectricCEZ MH BV, Reg. S 0% 04/08/2017
(Netherlands) (2) EUR 6,300,000 7,081,034 0.95Iberdrola International BV, Reg. S 0%
11/11/2022 (Netherlands) (2) EUR 7,400,000 7,973,387 1.07
15,054,421 2.02
Electrical Components & EquipmentsPrysmian SpA, Reg. S 1.25% 08/03/2018
(Italy) (2) EUR 4,000,000 4,748,770 0.64SunPower Corp. 0.875% 01/06/2021 USD 7,272,000 5,908,500 0.79
10,657,270 1.43
ElectronicsZhen Ding Technology Holding Ltd., Reg. S
0% 26/06/2019 (Cayman Islands) (2) USD 4,200,000 4,133,199 0.56
4,133,199 0.56
SCHEDULE OF INVESTMENTSAs at 30 June 2016
Investments Currency
Quantity/Nominal
Value
Market Value USD
% of Net Assets
Transferable securities and money market instruments admitted to official exchange listing or dealt in on another regulated market
Convertible Bonds (continued)
Engineering & ConstructionChina Railway Construction Corp. Ltd.,
Reg. S 0% 29/01/2021 (China) (2) USD 2,500,000 2,895,062 0.39Dycom Industries, Inc., 144A 0.75%
15/09/2021 USD 3,514,000 4,003,764 0.54Shimizu Corp., Reg. S 0% 16/10/2020
(Japan) (2) JPY 400,000,000 4,144,133 0.55
11,042,959 1.48
EntertainmentREXLot Holdings Ltd., Reg. S 4.5%
17/04/2019 (Bermuda) (2) HKD 57,000,000 6,060,782 0.81
6,060,782 0.81
FoodJ Sainsbury plc, Reg. S 1.25%
21/11/2019 (United Kingdom) (2) GBP 4,700,000 6,383,455 0.86Marine Harvest ASA, Reg. S 0.125%
05/11/2020 (Norway) (2) EUR 4,400,000 5,431,768 0.73Shoprite Investments Ltd., Reg. S 6.5%
03/04/2017 (South Africa) (2) ZAR 958,300 6,846,977 0.92
18,662,200 2.51
GasENN Energy Holdings Ltd., Reg. S 0%
26/02/2018 (Cayman Islands) (2) USD 8,000,000 8,389,160 1.13
8,389,160 1.13
Healthcare ProductsCepheid 1.25% 01/02/2021 USD 5,859,000 5,042,402 0.68Nipro Corp., Reg. S 0% 29/01/2021
(Japan) (2) JPY 380,000,000 4,011,980 0.54NuVasive, Inc., 144A 2.25% 15/03/2021 USD 3,745,000 4,430,803 0.59QIAGEN NV, Reg. S 0.375% 19/03/2019
(Netherlands) (2) USD 3,800,000 3,858,083 0.52Wright Medical Group, Inc. 2%
15/02/2020 USD 4,169,000 3,793,790 0.51
21,137,058 2.84
Healthcare ServicesBangkok Dusit Medical Services PCL,
Reg. S 0% 18/09/2019 (Thailand) (2) THB 124,000,000 4,065,168 0.55
4,065,168 0.55
Holding Companies – DiversifiedGBL Verwaltung SA, Reg. S 1.25%
07/02/2017 (Luxembourg) (2) EUR 9,300,000 10,436,568 1.40Industrivarden AB, Reg. S 1.875%
27/02/2017 (Sweden) (2) EUR 6,200,000 6,993,241 0.94OHL Investments SA, Reg. S 4%
25/04/2018 (Luxembourg) (2) EUR 3,800,000 3,800,922 0.51
21,230,731 2.85

153 Morgan Stanley Investment Funds 30 June 2016
The accompanying notes are an integral part of these financial statements.
Global Convertible Bond Fund (continued)
SCHEDULE OF INVESTMENTSAs at 30 June 2016
Investments Currency
Quantity/Nominal
Value
Market Value USD
% of Net Assets
Transferable securities and money market instruments admitted to official exchange listing or dealt in on another regulated market
Convertible Bonds (continued)
Holding Companies – DiversifiedIndustrivarden AB, Reg. S 0% 15/05/2019
(Sweden) (2) SEK 33,000,000 4,254,675 0.57
4,254,675 0.57
Home BuildersCalAtlantic Group, Inc. 0.25% 01/06/2019 USD 4,428,000 4,096,188 0.55Iida Group Holdings Co. Ltd., Reg. S 0%
18/06/2020 (Japan) (2) JPY 610,000,000 6,386,364 0.86
10,482,552 1.41
Home FurnishingsSony Corp. 0% 30/09/2022 (Japan) (2) JPY 514,000,000 5,238,519 0.70Steinhoff Finance Holdings GmbH, Reg. S
1.25% 11/08/2022 (Austria) (2) EUR 7,900,000 8,710,822 1.17TiVo, Inc. 2% 01/10/2021 USD 6,150,000 6,061,594 0.82
20,010,935 2.69
InternetCtrip.com International Ltd. 1%
01/07/2020 (Cayman Islands) (2) USD 10,478,000 11,008,449 1.48Priceline Group, Inc. (The) 0.9%
15/09/2021 USD 19,214,000 19,454,175 2.62SBI Holdings, Inc., Reg. S 0% 02/11/2017
(Japan) (1) (2) JPY 470,000,000 4,607,879 0.62Shutterfly, Inc. 0.25% 15/05/2018 USD 5,777,000 5,657,849 0.76Twitter, Inc. 0.25% 15/09/2019 USD 5,222,000 4,788,992 0.64Vipshop Holdings Ltd. 1.5% 15/03/2019
(Cayman Islands) (2) USD 7,101,000 6,984,615 0.94Yahoo!, Inc. 0% 01/12/2018 USD 7,719,000 7,694,878 1.03
60,196,837 8.09
Investment CompaniesAabar Investments PJSC, Reg. S 1%
27/03/2022 (United Arab Emirates) (2) EUR 14,500,000 11,539,676 1.55AYC Finance Ltd., Reg. S 0.5%
02/05/2019 (Cayman Islands) (2) USD 4,155,000 4,486,881 0.60Baosteel Hong Kong Investment Co. Ltd.,
Reg. S 0% 01/12/2018 (Hong Kong) (1) (2) USD 6,756,000 6,415,903 0.86
Cahaya Capital Ltd., Reg. S 0% 18/09/2021 (Malaysia) (2) USD 9,842,000 9,641,223 1.30
32,083,683 4.31
MediaLiberty Media Corp. 1.375% 15/10/2023 USD 6,801,000 6,698,985 0.90
6,698,985 0.90
Miscellaneous ManufacturersCRRC Corp. Ltd., Reg. S 0% 05/02/2021
(China) (2) USD 4,250,000 4,401,066 0.59Siemens Financieringsmaatschappij NV,
Reg. S 1.65% 16/08/2019 (Netherlands) (2) USD 16,500,000 17,996,138 2.42
Trinity Industries, Inc. 3.875% 01/06/2036 USD 5,891,000 6,332,825 0.85
28,730,029 3.86
SCHEDULE OF INVESTMENTSAs at 30 June 2016
Investments Currency
Quantity/Nominal
Value
Market Value USD
% of Net Assets
Transferable securities and money market instruments admitted to official exchange listing or dealt in on another regulated market
Convertible Bonds (continued)
Oil & GasBP Capital Markets plc, Reg. S 1%
28/04/2023 (United Kingdom) (2) GBP 3,800,000 5,430,114 0.73Eni SpA, Reg. S 0% 13/04/2022 (Italy) (2) EUR 2,800,000 3,221,299 0.44Premier Oil Finance Jersey Ltd., Reg. S
2.5% 27/07/2018 (Jersey) (2) USD 4,372,000 2,917,239 0.39TOTAL SA, Reg. S 0.5% 02/12/2022
(France) (2) USD 5,600,000 5,654,124 0.76
17,222,776 2.32
PharmaceuticalsImpax Laboratories, Inc., 144A 2%
15/06/2022 USD 5,819,000 5,102,536 0.69Jazz Investments I Ltd. 1.875%
15/08/2021 (Bermuda) (2) USD 3,740,000 4,015,825 0.54
9,118,361 1.23
Real EstateBritish Land Jersey Ltd., Reg. S 1.5%
10/09/2017 (Jersey) (1) (2) GBP 3,200,000 4,474,730 0.60CapitaLand Ltd., Reg. S 1.85%
19/06/2020 (Singapore) (2) SGD 15,500,000 10,986,781 1.48IMMOFINANZ AG, Reg. S 4.25%
08/03/2018 (Austria) (2) EUR 74,666,400 3,638,815 0.49
19,100,326 2.57
Real Estate Investment Trusts (REITs)Colony Capital, Inc., REIT 5% 15/04/2023 USD 5,516,000 5,271,228 0.71Extra Space Storage LP, REIT, 144A
3.125% 01/10/2035 USD 5,208,000 5,894,805 0.79Spirit Realty Capital, Inc., REIT 3.75%
15/05/2021 USD 5,032,000 5,619,461 0.75Starwood Property Trust, Inc., REIT 4.55%
01/03/2018 USD 5,519,000 5,717,325 0.77
22,502,819 3.02
RetailRestoration Hardware Holdings, Inc., 144A
0% 15/06/2019 USD 7,002,000 5,712,441 0.77Takashimaya Co. Ltd. 0% 11/12/2018
(Japan) (2) JPY 620,000,000 6,021,233 0.81
11,733,674 1.58
SemiconductorsAdvanced Semiconductor Engineering, Inc.,
Reg. S 0% 05/09/2018 (Taiwan) (2) USD 5,000,000 5,915,800 0.80ASM Pacific Technology Ltd., Reg. S 2%
28/03/2019 (Cayman Islands) (2) HKD 40,000,000 5,142,482 0.69Microchip Technology, Inc. 1.625%
15/02/2025 USD 9,259,000 10,208,047 1.37Micron Technology, Inc. 3% 15/11/2043 USD 9,017,000 6,790,928 0.91NXP Semiconductors NV 1% 01/12/2019
(Netherlands) (2) USD 8,371,000 9,077,764 1.22ON Semiconductor Corp. 1% 01/12/2020 USD 7,503,000 6,718,111 0.91Semiconductor Manufacturing International
Corp., Reg. S 0% 07/11/2018 (Cayman Islands) (2) USD 6,300,000 6,554,331 0.88

Morgan Stanley Investment Funds 30 June 2016 154
The accompanying notes are an integral part of these financial statements.
Global Convertible Bond Fund (continued)
SCHEDULE OF INVESTMENTSAs at 30 June 2016
Investments Currency
Quantity/Nominal
Value
Market Value USD
% of Net Assets
Transferable securities and money market instruments admitted to official exchange listing or dealt in on another regulated market
Convertible Bonds (continued)
Semiconductors (continued)Siliconware Precision Industries Co. Ltd.,
Reg. S 0% 31/10/2019 (Taiwan) (2) USD 4,750,000 4,895,991 0.66STMicroelectronics NV, Reg. S 0%
03/07/2019 (Netherlands) (2) USD 7,600,000 7,074,916 0.95United Microelectronics Corp., Reg. S 0%
18/05/2020 (Taiwan) (2) USD 7,200,000 6,630,048 0.89
69,008,418 9.28
SoftwareAkamai Technologies, Inc. 0% 15/02/2019 USD 7,034,000 6,897,751 0.93Allscripts Healthcare Solutions, Inc. 1.25%
01/07/2020 USD 5,661,000 5,643,309 0.76Citrix Systems, Inc. 0.5% 15/04/2019 USD 5,108,000 5,730,538 0.77Nuance Communications, Inc., 144A 1%
15/12/2035 USD 6,578,000 5,772,195 0.78Red Hat, Inc. 0.25% 01/10/2019 USD 4,715,000 5,711,044 0.77salesforce.com, Inc. 0.25% 01/04/2018 USD 7,734,000 9,990,356 1.34ServiceNow, Inc. 0% 01/11/2018 USD 4,877,000 5,446,999 0.73
45,192,192 6.08
TelecommunicationsAmerica Movil SAB de CV, Reg. S 0%
28/05/2020 (Mexico) (2) EUR 18,700,000 20,509,632 2.76Telefonica Participaciones SAU, Reg. S 0%
09/03/2021 (Spain) (2) EUR 3,600,000 3,930,850 0.53Viavi Solutions, Inc. 0.625% 15/08/2033 USD 6,511,000 6,368,572 0.86Vodafone Group plc, Reg. S 0%
26/11/2020 (United Kingdom) (2) GBP 2,800,000 3,685,105 0.49
34,494,159 4.64
TextilesToray Industries, Inc., Reg. S 0%
30/08/2019 (Japan) (2) JPY 690,000,000 7,593,155 1.02
7,593,155 1.02
TransportationKawasaki Kisen Kaisha Ltd., Reg. S 0%
26/09/2018 (Japan) (2) JPY 490,000,000 4,797,952 0.64Mitsui OSK Lines Ltd., Reg. S 0%
24/04/2020 (Japan) (2) USD 5,400,000 4,526,523 0.61Seino Holdings Co. Ltd., Reg. S 0%
01/10/2018 (Japan) (2) JPY 650,000,000 6,408,110 0.86
15,732,585 2.11
Total Convertible Bonds 703,479,368 94.57
SCHEDULE OF INVESTMENTSAs at 30 June 2016
Investments Currency
Quantity/Nominal
Value
Market Value USD
% of Net Assets
Transferable securities and money market instruments admitted to official exchange listing or dealt in on another regulated market
Equities
BanksBank of America Corp. Preference 7.25% USD 4,000 4,740,000 0.64
4,740,000 0.64
PharmaceuticalsAllergan plc Preference 5.5% (Ireland) (2) USD 7,000 5,782,700 0.78
5,782,700 0.78
TelecommunicationsFrontier Communications Corp. Preference
11.125% USD 49,500 4,589,145 0.61
4,589,145 0.61
Total Equities 15,111,845 2.03
Government Bonds
Parpublica – Participacoes Publicas SGPS SA, Reg. S 5.25% 28/09/2017 (Portugal) (2) EUR 9,200,000 10,638,012 1.43
10,638,012 1.43
Total Government Bonds 10,638,012 1.43
Total Transferable securities and money market instruments admitted to official exchange listing or dealt in on another regulated market 729,229,225 98.03
Units of authorised UCITS or other collective investment undertakings
Collective Investment Schemes – UCITS
Mutual FundsMorgan Stanley Liquidity Funds US Dollar
Liquidity Fund – MS Reserve (Luxembourg) (2) (4) USD 16,623,029 16,623,029 2.23
16,623,029 2.23
Total Collective Investment Schemes – UCITS 16,623,029 2.23
Total Units of authorised UCITS or other collective investment undertakings 16,623,029 2.23
Total Investments 745,852,254 100.26
Cash (6,936,409) (0.93)
Other Assets/(Liabilities) 4,993,260 0.67
Total Net Assets 743,909,105 100.00
(1) All or part of this position is out on loan.(2) The country in brackets represents the country of incorporation of this security.(4) Affiliate managed by an affiliate of the Investment Adviser.
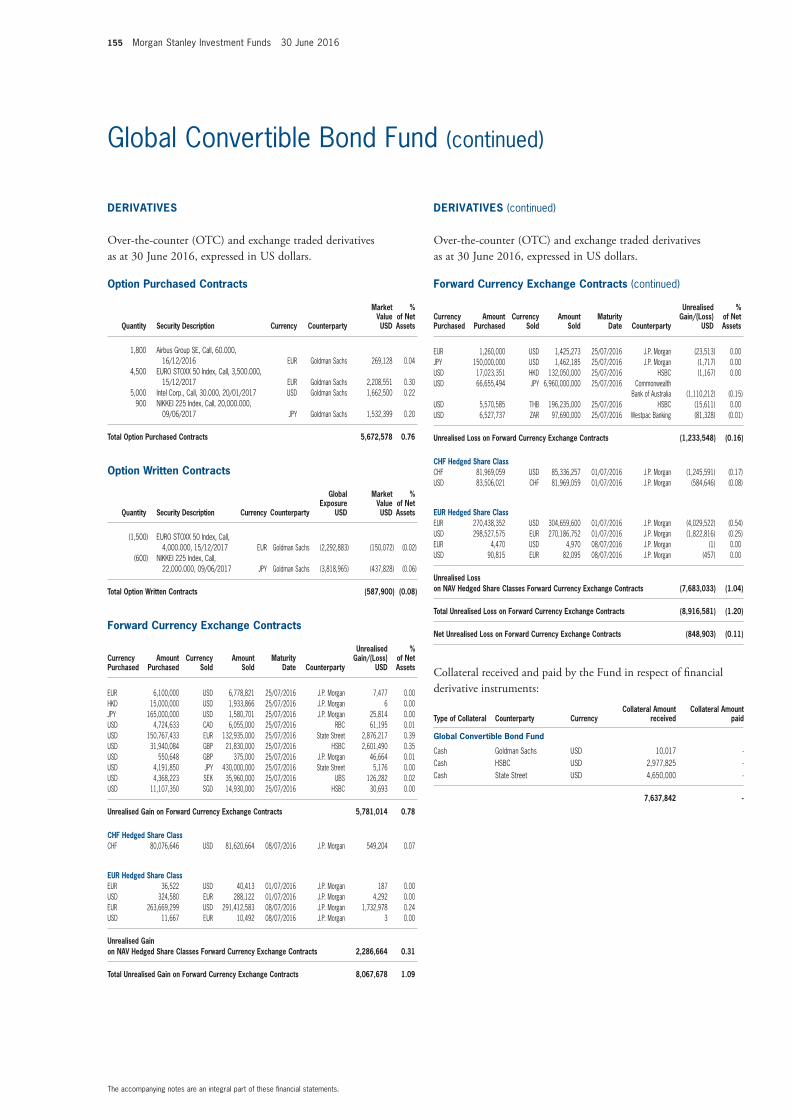
155 Morgan Stanley Investment Funds 30 June 2016
The accompanying notes are an integral part of these financial statements.
Global Convertible Bond Fund (continued)
Option Purchased Contracts
Quantity Security Description Currency Counterparty
Market Value USD
% of Net Assets
1,800 Airbus Group SE, Call, 60.000, 16/12/2016 EUR Goldman Sachs 269,128 0.04
4,500 EURO STOXX 50 Index, Call, 3,500.000, 15/12/2017 EUR Goldman Sachs 2,208,551 0.30
5,000 Intel Corp., Call, 30.000, 20/01/2017 USD Goldman Sachs 1,662,500 0.22900 NIKKEI 225 Index, Call, 20,000.000,
09/06/2017 JPY Goldman Sachs 1,532,399 0.20
Total Option Purchased Contracts 5,672,578 0.76
Option Written Contracts
Quantity Security Description Currency Counterparty
Global Exposure
USD
Market Value USD
% of Net Assets
(1,500) EURO STOXX 50 Index, Call, 4,000.000, 15/12/2017 EUR Goldman Sachs (2,292,883) (150,072) (0.02)
(600) NIKKEI 225 Index, Call, 22,000.000, 09/06/2017 JPY Goldman Sachs (3,818,965) (437,828) (0.06)
Total Option Written Contracts (587,900) (0.08)
Forward Currency Exchange Contracts (continued)
Currency Purchased
Amount Purchased
Currency Sold
Amount Sold
Maturity Date Counterparty
Unrealised Gain/(Loss)
USD
% of Net Assets
EUR 6,100,000 USD 6,778,821 25/07/2016 J.P. Morgan 7,477 0.00HKD 15,000,000 USD 1,933,866 25/07/2016 J.P. Morgan 6 0.00JPY 165,000,000 USD 1,580,701 25/07/2016 J.P. Morgan 25,814 0.00USD 4,724,633 CAD 6,055,000 25/07/2016 RBC 61,195 0.01USD 150,767,433 EUR 132,935,000 25/07/2016 State Street 2,876,217 0.39USD 31,940,084 GBP 21,830,000 25/07/2016 HSBC 2,601,490 0.35USD 550,648 GBP 375,000 25/07/2016 J.P. Morgan 46,664 0.01USD 4,191,850 JPY 430,000,000 25/07/2016 State Street 5,176 0.00USD 4,368,223 SEK 35,960,000 25/07/2016 UBS 126,282 0.02USD 11,107,350 SGD 14,930,000 25/07/2016 HSBC 30,693 0.00
Unrealised Gain on Forward Currency Exchange Contracts 5,781,014 0.78
CHF Hedged Share ClassCHF 80,076,646 USD 81,620,664 08/07/2016 J.P. Morgan 549,204 0.07
EUR Hedged Share ClassEUR 36,522 USD 40,413 01/07/2016 J.P. Morgan 187 0.00USD 324,580 EUR 288,122 01/07/2016 J.P. Morgan 4,292 0.00EUR 263,669,299 USD 291,412,583 08/07/2016 J.P. Morgan 1,732,978 0.24USD 11,667 EUR 10,492 08/07/2016 J.P. Morgan 3 0.00
Unrealised Gain on NAV Hedged Share Classes Forward Currency Exchange Contracts 2,286,664 0.31
Total Unrealised Gain on Forward Currency Exchange Contracts 8,067,678 1.09
Forward Currency Exchange Contracts (continued)
Currency Purchased
Amount Purchased
Currency Sold
Amount Sold
Maturity Date Counterparty
Unrealised Gain/(Loss)
USD
% of Net Assets
EUR 1,260,000 USD 1,425,273 25/07/2016 J.P. Morgan (23,513) 0.00JPY 150,000,000 USD 1,462,185 25/07/2016 J.P. Morgan (1,717) 0.00USD 17,023,351 HKD 132,050,000 25/07/2016 HSBC (1,167) 0.00USD 66,655,494 JPY 6,960,000,000 25/07/2016 Commonwealth
Bank of Australia (1,110,212) (0.15)USD 5,570,585 THB 196,235,000 25/07/2016 HSBC (15,611) 0.00USD 6,527,737 ZAR 97,690,000 25/07/2016 Westpac Banking (81,328) (0.01)
Unrealised Loss on Forward Currency Exchange Contracts (1,233,548) (0.16)
CHF Hedged Share ClassCHF 81,969,059 USD 85,336,257 01/07/2016 J.P. Morgan (1,245,591) (0.17)USD 83,506,021 CHF 81,969,059 01/07/2016 J.P. Morgan (584,646) (0.08)
EUR Hedged Share ClassEUR 270,438,352 USD 304,659,600 01/07/2016 J.P. Morgan (4,029,522) (0.54)USD 298,527,575 EUR 270,186,752 01/07/2016 J.P. Morgan (1,822,816) (0.25)EUR 4,470 USD 4,970 08/07/2016 J.P. Morgan (1) 0.00USD 90,815 EUR 82,095 08/07/2016 J.P. Morgan (457) 0.00
Unrealised Loss on NAV Hedged Share Classes Forward Currency Exchange Contracts (7,683,033) (1.04)
Total Unrealised Loss on Forward Currency Exchange Contracts (8,916,581) (1.20)
Net Unrealised Loss on Forward Currency Exchange Contracts (848,903) (0.11)
Collateral received and paid by the Fund in respect of financial derivative instruments:
Type of Collateral Counterparty CurrencyCollateral Amount
receivedCollateral Amount
paid
Global Convertible Bond Fund
Cash Goldman Sachs USD 10,017 -Cash HSBC USD 2,977,825 -Cash State Street USD 4,650,000 -
7,637,842 -
DERIVATIVES
Over-the-counter (OTC) and exchange traded derivatives as at 30 June 2016, expressed in US dollars.
DERIVATIVES (continued)
Over-the-counter (OTC) and exchange traded derivatives as at 30 June 2016, expressed in US dollars.
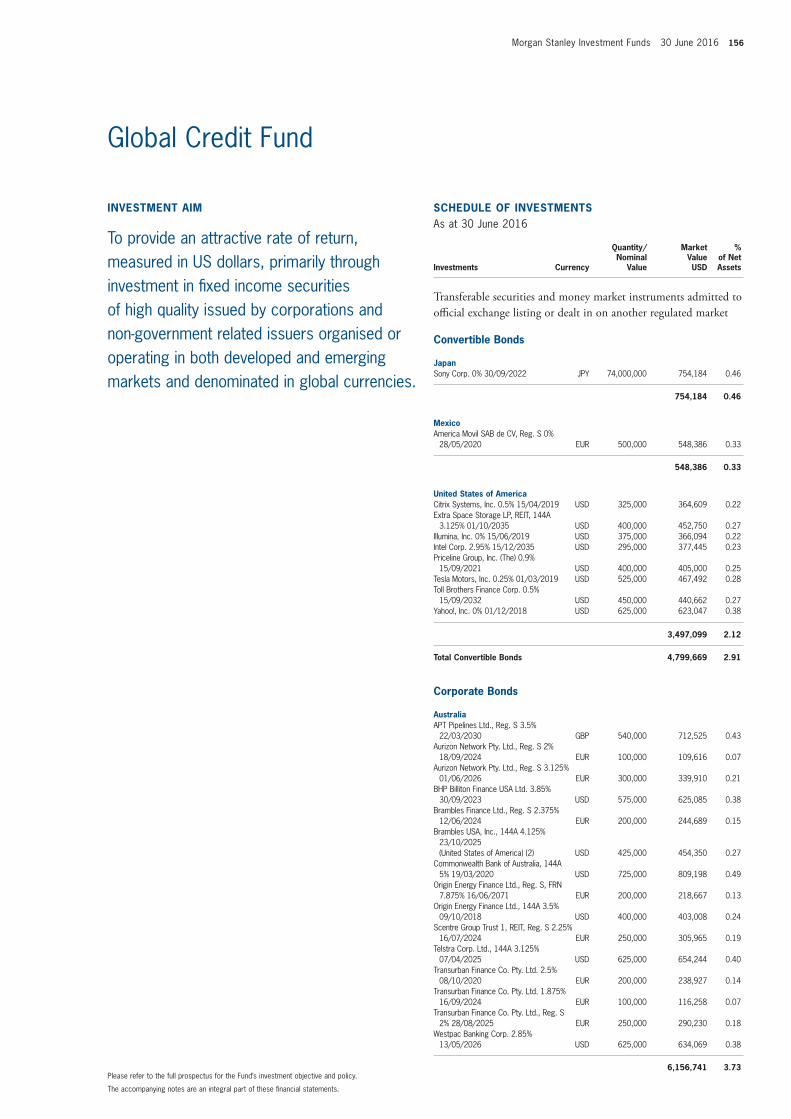
Morgan Stanley Investment Funds 30 June 2016 156
The accompanying notes are an integral part of these financial statements.
Please refer to the full prospectus for the Fund’s investment objective and policy.
INVESTMENT AIM
To provide an attractive rate of return, measured in US dollars, primarily through investment in fixed income securities of high quality issued by corporations and non-government related issuers organised or operating in both developed and emerging markets and denominated in global currencies.
SCHEDULE OF INVESTMENTSAs at 30 June 2016
Investments Currency
Quantity/Nominal
Value
Market Value USD
% of Net Assets
Transferable securities and money market instruments admitted to official exchange listing or dealt in on another regulated market
Convertible Bonds
JapanSony Corp. 0% 30/09/2022 JPY 74,000,000 754,184 0.46
754,184 0.46
MexicoAmerica Movil SAB de CV, Reg. S 0%
28/05/2020 EUR 500,000 548,386 0.33
548,386 0.33
United States of AmericaCitrix Systems, Inc. 0.5% 15/04/2019 USD 325,000 364,609 0.22Extra Space Storage LP, REIT, 144A
3.125% 01/10/2035 USD 400,000 452,750 0.27Illumina, Inc. 0% 15/06/2019 USD 375,000 366,094 0.22Intel Corp. 2.95% 15/12/2035 USD 295,000 377,445 0.23Priceline Group, Inc. (The) 0.9%
15/09/2021 USD 400,000 405,000 0.25Tesla Motors, Inc. 0.25% 01/03/2019 USD 525,000 467,492 0.28Toll Brothers Finance Corp. 0.5%
15/09/2032 USD 450,000 440,662 0.27Yahoo!, Inc. 0% 01/12/2018 USD 625,000 623,047 0.38
3,497,099 2.12
Total Convertible Bonds 4,799,669 2.91
Corporate Bonds
AustraliaAPT Pipelines Ltd., Reg. S 3.5%
22/03/2030 GBP 540,000 712,525 0.43Aurizon Network Pty. Ltd., Reg. S 2%
18/09/2024 EUR 100,000 109,616 0.07Aurizon Network Pty. Ltd., Reg. S 3.125%
01/06/2026 EUR 300,000 339,910 0.21BHP Billiton Finance USA Ltd. 3.85%
30/09/2023 USD 575,000 625,085 0.38Brambles Finance Ltd., Reg. S 2.375%
12/06/2024 EUR 200,000 244,689 0.15Brambles USA, Inc., 144A 4.125%
23/10/2025 (United States of America) (2) USD 425,000 454,350 0.27
Commonwealth Bank of Australia, 144A 5% 19/03/2020 USD 725,000 809,198 0.49
Origin Energy Finance Ltd., Reg. S, FRN 7.875% 16/06/2071 EUR 200,000 218,667 0.13
Origin Energy Finance Ltd., 144A 3.5% 09/10/2018 USD 400,000 403,008 0.24
Scentre Group Trust 1, REIT, Reg. S 2.25% 16/07/2024 EUR 250,000 305,965 0.19
Telstra Corp. Ltd., 144A 3.125% 07/04/2025 USD 625,000 654,244 0.40
Transurban Finance Co. Pty. Ltd. 2.5% 08/10/2020 EUR 200,000 238,927 0.14
Transurban Finance Co. Pty. Ltd. 1.875% 16/09/2024 EUR 100,000 116,258 0.07
Transurban Finance Co. Pty. Ltd., Reg. S 2% 28/08/2025 EUR 250,000 290,230 0.18
Westpac Banking Corp. 2.85% 13/05/2026 USD 625,000 634,069 0.38
6,156,741 3.73
Global Credit Fund
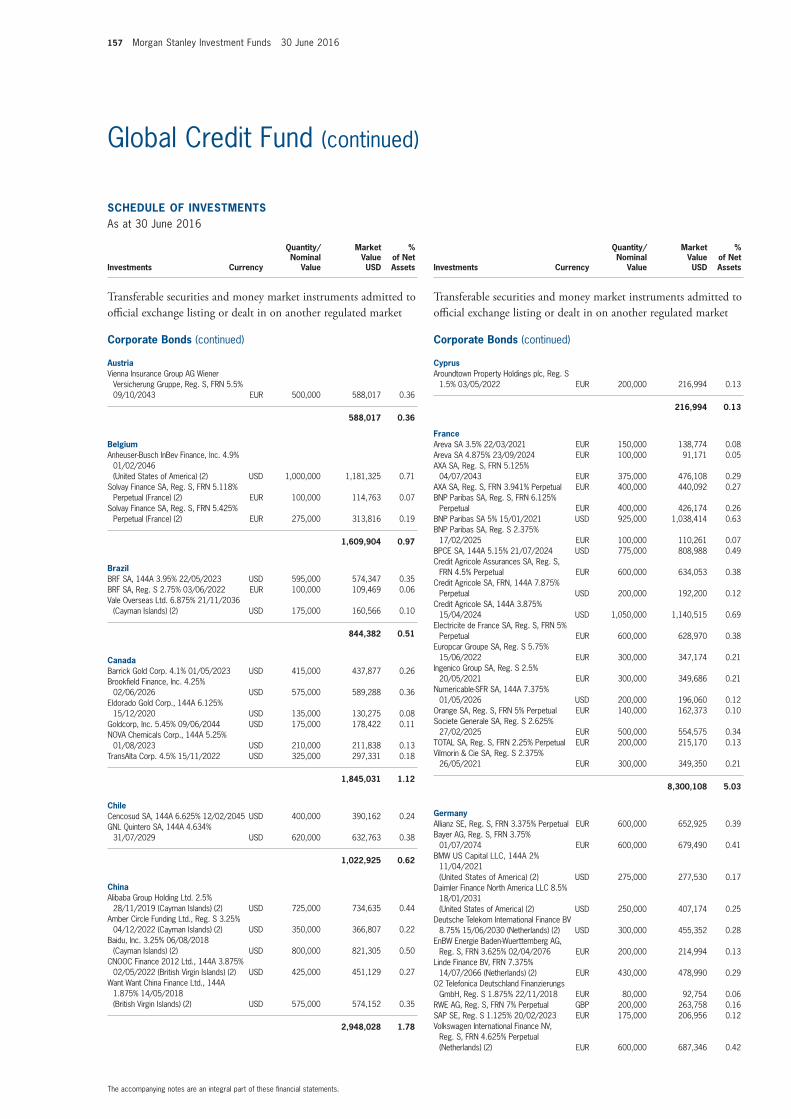
157 Morgan Stanley Investment Funds 30 June 2016
The accompanying notes are an integral part of these financial statements.
Global Credit Fund (continued)
SCHEDULE OF INVESTMENTSAs at 30 June 2016
Investments Currency
Quantity/Nominal
Value
Market Value USD
% of Net Assets
Transferable securities and money market instruments admitted to official exchange listing or dealt in on another regulated market
Corporate Bonds (continued)
AustriaVienna Insurance Group AG Wiener
Versicherung Gruppe, Reg. S, FRN 5.5% 09/10/2043 EUR 500,000 588,017 0.36
588,017 0.36
BelgiumAnheuser-Busch InBev Finance, Inc. 4.9%
01/02/2046 (United States of America) (2) USD 1,000,000 1,181,325 0.71
Solvay Finance SA, Reg. S, FRN 5.118% Perpetual (France) (2) EUR 100,000 114,763 0.07
Solvay Finance SA, Reg. S, FRN 5.425% Perpetual (France) (2) EUR 275,000 313,816 0.19
1,609,904 0.97
BrazilBRF SA, 144A 3.95% 22/05/2023 USD 595,000 574,347 0.35BRF SA, Reg. S 2.75% 03/06/2022 EUR 100,000 109,469 0.06Vale Overseas Ltd. 6.875% 21/11/2036
(Cayman Islands) (2) USD 175,000 160,566 0.10
844,382 0.51
CanadaBarrick Gold Corp. 4.1% 01/05/2023 USD 415,000 437,877 0.26Brookfield Finance, Inc. 4.25%
02/06/2026 USD 575,000 589,288 0.36Eldorado Gold Corp., 144A 6.125%
15/12/2020 USD 135,000 130,275 0.08Goldcorp, Inc. 5.45% 09/06/2044 USD 175,000 178,422 0.11NOVA Chemicals Corp., 144A 5.25%
01/08/2023 USD 210,000 211,838 0.13TransAlta Corp. 4.5% 15/11/2022 USD 325,000 297,331 0.18
1,845,031 1.12
ChileCencosud SA, 144A 6.625% 12/02/2045 USD 400,000 390,162 0.24GNL Quintero SA, 144A 4.634%
31/07/2029 USD 620,000 632,763 0.38
1,022,925 0.62
ChinaAlibaba Group Holding Ltd. 2.5%
28/11/2019 (Cayman Islands) (2) USD 725,000 734,635 0.44Amber Circle Funding Ltd., Reg. S 3.25%
04/12/2022 (Cayman Islands) (2) USD 350,000 366,807 0.22Baidu, Inc. 3.25% 06/08/2018
(Cayman Islands) (2) USD 800,000 821,305 0.50CNOOC Finance 2012 Ltd., 144A 3.875%
02/05/2022 (British Virgin Islands) (2) USD 425,000 451,129 0.27Want Want China Finance Ltd., 144A
1.875% 14/05/2018 (British Virgin Islands) (2) USD 575,000 574,152 0.35
2,948,028 1.78
SCHEDULE OF INVESTMENTSAs at 30 June 2016
Investments Currency
Quantity/Nominal
Value
Market Value USD
% of Net Assets
Transferable securities and money market instruments admitted to official exchange listing or dealt in on another regulated market
Corporate Bonds (continued)
CyprusAroundtown Property Holdings plc, Reg. S
1.5% 03/05/2022 EUR 200,000 216,994 0.13
216,994 0.13
FranceAreva SA 3.5% 22/03/2021 EUR 150,000 138,774 0.08Areva SA 4.875% 23/09/2024 EUR 100,000 91,171 0.05AXA SA, Reg. S, FRN 5.125%
04/07/2043 EUR 375,000 476,108 0.29AXA SA, Reg. S, FRN 3.941% Perpetual EUR 400,000 440,092 0.27BNP Paribas SA, Reg. S, FRN 6.125%
Perpetual EUR 400,000 426,174 0.26BNP Paribas SA 5% 15/01/2021 USD 925,000 1,038,414 0.63BNP Paribas SA, Reg. S 2.375%
17/02/2025 EUR 100,000 110,261 0.07BPCE SA, 144A 5.15% 21/07/2024 USD 775,000 808,988 0.49Credit Agricole Assurances SA, Reg. S,
FRN 4.5% Perpetual EUR 600,000 634,053 0.38Credit Agricole SA, FRN, 144A 7.875%
Perpetual USD 200,000 192,200 0.12Credit Agricole SA, 144A 3.875%
15/04/2024 USD 1,050,000 1,140,515 0.69Electricite de France SA, Reg. S, FRN 5%
Perpetual EUR 600,000 628,970 0.38Europcar Groupe SA, Reg. S 5.75%
15/06/2022 EUR 300,000 347,174 0.21Ingenico Group SA, Reg. S 2.5%
20/05/2021 EUR 300,000 349,686 0.21Numericable-SFR SA, 144A 7.375%
01/05/2026 USD 200,000 196,060 0.12Orange SA, Reg. S, FRN 5% Perpetual EUR 140,000 162,373 0.10Societe Generale SA, Reg. S 2.625%
27/02/2025 EUR 500,000 554,575 0.34TOTAL SA, Reg. S, FRN 2.25% Perpetual EUR 200,000 215,170 0.13Vilmorin & Cie SA, Reg. S 2.375%
26/05/2021 EUR 300,000 349,350 0.21
8,300,108 5.03
GermanyAllianz SE, Reg. S, FRN 3.375% Perpetual EUR 600,000 652,925 0.39Bayer AG, Reg. S, FRN 3.75%
01/07/2074 EUR 600,000 679,490 0.41BMW US Capital LLC, 144A 2%
11/04/2021 (United States of America) (2) USD 275,000 277,530 0.17
Daimler Finance North America LLC 8.5% 18/01/2031 (United States of America) (2) USD 250,000 407,174 0.25
Deutsche Telekom International Finance BV 8.75% 15/06/2030 (Netherlands) (2) USD 300,000 455,352 0.28
EnBW Energie Baden-Wuerttemberg AG, Reg. S, FRN 3.625% 02/04/2076 EUR 200,000 214,994 0.13
Linde Finance BV, FRN 7.375% 14/07/2066 (Netherlands) (2) EUR 430,000 478,990 0.29
O2 Telefonica Deutschland Finanzierungs GmbH, Reg. S 1.875% 22/11/2018 EUR 80,000 92,754 0.06
RWE AG, Reg. S, FRN 7% Perpetual GBP 200,000 263,758 0.16SAP SE, Reg. S 1.125% 20/02/2023 EUR 175,000 206,956 0.12Volkswagen International Finance NV,
Reg. S, FRN 4.625% Perpetual (Netherlands) (2) EUR 600,000 687,346 0.42
Morgan Stanley Investment Funds 30 June 2016 158
The accompanying notes are an integral part of these financial statements.
Global Credit Fund (continued)
SCHEDULE OF INVESTMENTSAs at 30 June 2016
Investments Currency
Quantity/Nominal
Value
Market Value USD
% of Net Assets
Transferable securities and money market instruments admitted to official exchange listing or dealt in on another regulated market
Corporate Bonds (continued)
Germany (continued)Vonovia Finance BV, Reg. S, FRN 4.625%
08/04/2074 (Netherlands) (2) EUR 600,000 695,290 0.42Vonovia Finance BV, Reg. S 3.125%
25/07/2019 (Netherlands) (2) EUR 200,000 241,608 0.15Vonovia Finance BV, Reg. S 3.625%
08/10/2021 (Netherlands) (2) EUR 250,000 322,487 0.19
5,676,654 3.44
Hong KongAIA Group Ltd., Reg. S 4.5% 16/03/2046 USD 225,000 244,200 0.15
244,200 0.15
IndiaBharti Airtel International Netherlands BV,
Reg. S 4% 10/12/2018 (Netherlands) (2) EUR 600,000 715,574 0.43Indian Railway Finance Corp. Ltd., Reg. S
3.917% 26/02/2019 USD 400,000 420,504 0.26
1,136,078 0.69
IrelandGAS Networks Ireland, Reg. S 3.625%
04/12/2017 EUR 525,000 614,108 0.37Kerry Group Financial Services, Reg. S
2.375% 10/09/2025 EUR 200,000 249,433 0.15Ryanair Ltd., Reg. S 1.875% 17/06/2021 EUR 260,000 305,937 0.19Ryanair Ltd., Reg. S 1.125% 10/03/2023 EUR 100,000 112,268 0.07
1,281,746 0.78
ItalyEnel Finance International NV, 144A 6%
07/10/2039 (Netherlands) (2) USD 100,000 119,590 0.07Enel Finance International NV, Reg. S
1.375% 01/06/2026 (Netherlands) (2) EUR 259,000 297,279 0.18Enel SpA, FRN, 144A 8.75%
24/09/2073 USD 500,000 572,277 0.35FCA Capital Ireland plc, Reg. S 1.375%
17/04/2020 (Ireland) (2) EUR 600,000 673,771 0.41Intesa Sanpaolo SpA, Reg. S, FRN 7%
Perpetual EUR 350,000 360,312 0.22Intesa Sanpaolo SpA, 144A 5.71%
15/01/2026 USD 225,000 214,357 0.13Poste Vita SpA 2.875% 30/05/2019 EUR 150,000 173,204 0.10Telecom Italia Finance SA 7.75%
24/01/2033 (Luxembourg) (2) EUR 250,000 370,838 0.22
2,781,628 1.68
JapanNissan Motor Acceptance Corp., 144A
2.55% 08/03/2021 (United States of America) (2) USD 775,000 797,502 0.48
Toyota Motor Credit Corp. 1.4% 20/05/2019 (United States of America) (2) USD 675,000 679,300 0.41
1,476,802 0.89
SCHEDULE OF INVESTMENTSAs at 30 June 2016
Investments Currency
Quantity/Nominal
Value
Market Value USD
% of Net Assets
Transferable securities and money market instruments admitted to official exchange listing or dealt in on another regulated market
Corporate Bonds (continued)
MalaysiaPetronas Capital Ltd., Reg. S 3.5%
18/03/2025 USD 350,000 368,693 0.22
368,693 0.22
MexicoAlfa SAB de CV, 144A 5.25%
25/03/2024 USD 200,000 213,433 0.13BBVA Bancomer SA, 144A 6.5%
10/03/2021 USD 600,000 658,275 0.40Fermaca Enterprises S de RL de CV,
144A 6.375% 30/03/2038 USD 246,562 243,478 0.15Mexichem SAB de CV, 144A 5.875%
17/09/2044 USD 325,000 298,789 0.18Sigma Alimentos SA de CV, 144A 5.625%
14/04/2018 USD 600,000 640,935 0.39Southern Copper Corp. 5.25%
08/11/2042 (United States of America) (2) USD 550,000 483,293 0.29
2,538,203 1.54
NetherlandsABN AMRO Bank NV, Reg. S, FRN 2.875%
30/06/2025 EUR 150,000 170,524 0.10ABN AMRO Bank NV, 144A 1.8%
04/06/2018 USD 950,000 958,237 0.58 ABN AMRO Bank NV, Reg. S 6.375%
27/04/2021 EUR 300,000 399,104 0.24Achmea BV, Reg. S, FRN 4.25% Perpetual EUR 175,000 171,062 0.10Achmea BV, Reg. S 2.5% 19/11/2020 EUR 300,000 365,287 0.22Aegon NV, Reg. S, FRN 4% 25/04/2044 EUR 500,000 507,884 0.31AerCap Ireland Capital Ltd. 3.75%
15/05/2019 (Ireland) (2) USD 455,000 458,692 0.28ASR Nederland NV, Reg. S, FRN 5%
Perpetual EUR 625,000 688,475 0.42Cooperatieve Rabobank UA, Reg. S, FRN
2.5% 26/05/2026 EUR 950,000 1,074,977 0.65Cooperatieve Rabobank UA, Reg. S, FRN
5.5% Perpetual EUR 500,000 531,656 0.32Cooperatieve Rabobank UA 3.95%
09/11/2022 USD 650,000 672,964 0.41ING Bank NV, 144A 5.8% 25/09/2023 USD 850,000 935,752 0.57LeasePlan Corp. NV, 144A 2.875%
22/01/2019 USD 675,000 675,179 0.41NN Group NV, Reg. S, FRN 4.625%
08/04/2044 EUR 100,000 112,575 0.07Shell International Finance BV 2.125%
11/05/2020 USD 1,450,000 1,478,493 0.89Vesteda Finance BV, Reg. S 2.5%
27/10/2022 EUR 400,000 484,257 0.29
9,685,118 5.86
PeruBanco de Credito del Peru, FRN, 144A
6.125% 24/04/2027 USD 775,000 848,168 0.51
848,168 0.51

159 Morgan Stanley Investment Funds 30 June 2016
The accompanying notes are an integral part of these financial statements.
Global Credit Fund (continued)
SCHEDULE OF INVESTMENTSAs at 30 June 2016
Investments Currency
Quantity/Nominal
Value
Market Value USD
% of Net Assets
Transferable securities and money market instruments admitted to official exchange listing or dealt in on another regulated market
Corporate Bonds (continued)
PortugalEDP - Energias de Portugal SA, Reg. S,
FRN 5.375% 16/09/2075 EUR 300,000 332,220 0.20EDP Finance BV, 144A 4.125%
15/01/2020 (Netherlands) (2) USD 300,000 310,578 0.19EDP Finance BV, 144A 5.25%
14/01/2021 (Netherlands) (2) USD 200,000 212,980 0.13
855,778 0.52
QatarCBQ Finance Ltd., Reg. S 2.875%
24/06/2019 (Bermuda) (2) USD 350,000 354,646 0.21
354,646 0.21
SlovakiaSPP Infrastructure Financing BV, Reg. S
3.75% 18/07/2020 (Netherlands) (2) EUR 100,000 123,067 0.07
123,067 0.07
SpainAdif - Alta Velocidad, Reg. S 3.5%
27/05/2024 EUR 600,000 784,953 0.48Banco Bilbao Vizcaya Argentaria SA,
Reg. S, FRN 6.75% Perpetual EUR 400,000 383,091 0.23Banco Santander SA, Reg. S, FRN 6.375%
Perpetual USD 400,000 351,504 0.21BBVA Subordinated Capital SAU, Reg. S,
FRN 3.5% 11/04/2024 EUR 600,000 680,142 0.41Gas Natural Fenosa Finance BV, Reg. S,
FRN 3.375% Perpetual (Netherlands) (2) EUR 100,000 99,436 0.06Gas Natural Fenosa Finance BV, Reg. S,
FRN 4.125% Perpetual (Netherlands) (2) EUR 500,000 548,517 0.33IE2 Holdco SAU, Reg. S 2.875%
01/06/2026 EUR 300,000 336,493 0.21Inmobiliaria Colonial SA, Reg. S 2.728%
05/06/2023 EUR 200,000 235,019 0.14Repsol International Finance BV, Reg. S,
FRN 4.5% 25/03/2075 (Netherlands) (2) EUR 300,000 284,362 0.17Santander Issuances SAU 5.179%
19/11/2025 USD 400,000 398,676 0.24Telefonica Emisiones SAU, Reg. S 4.71%
20/01/2020 EUR 300,000 384,878 0.24Telefonica Europe BV, Reg. S, FRN 5.875%
Perpetual (Netherlands) (2) EUR 400,000 454,941 0.28
4,942,012 3.00
SwedenSwedbank AB, 144A 2.375% 27/02/2019 USD 820,000 837,281 0.51
837,281 0.51
SwitzerlandCredit Suisse AG, 144A 6.5% 08/08/2023 USD 1,104,000 1,161,618 0.70Novartis Capital Corp. 4.4% 06/05/2044
(United States of America) (2) USD 425,000 515,748 0.31UBS AG, Reg. S 5.125% 15/05/2024 USD 500,000 510,845 0.31Zurich Insurance Co. Ltd., Reg. S, FRN
4.25% 02/10/2043 (Ireland) (2) EUR 800,000 967,412 0.59
3,155,623 1.91
SCHEDULE OF INVESTMENTSAs at 30 June 2016
Investments Currency
Quantity/Nominal
Value
Market Value USD
% of Net Assets
Transferable securities and money market instruments admitted to official exchange listing or dealt in on another regulated market
Corporate Bonds (continued)
ThailandThai Oil PCL, 144A 3.625% 23/01/2023 USD 425,000 440,697 0.27
440,697 0.27
United KingdomBP Capital Markets plc 3.245%
06/05/2022 USD 375,000 392,948 0.24BP Capital Markets plc 3.119%
04/05/2026 USD 625,000 637,944 0.39British Telecommunications plc, Reg. S
1.75% 10/03/2026 EUR 225,000 260,954 0.16CEVA Group plc, 144A 7% 01/03/2021 USD 425,000 369,750 0.22Delphi Automotive plc 3.15% 19/11/2020
(Jersey) (2) USD 350,000 360,236 0.22Delphi Automotive plc 3.15% 19/11/2020
(Jersey) (2) USD 350,000 360,246 0.22G4S International Finance plc, Reg. S
2.625% 06/12/2018 EUR 575,000 668,744 0.40Heathrow Funding Ltd., Reg. S 1.875%
23/05/2022 (Jersey) (2) EUR 500,000 589,437 0.36HSBC Holdings plc, FRN 6.375%
Perpetual USD 200,000 188,611 0.11InterContinental Hotels Group plc 3.875%
28/11/2022 GBP 425,000 612,019 0.37International Game Technology plc, Reg. S
6.625% 02/02/2018 EUR 250,000 301,043 0.18John Lewis plc, Reg. S 4.25%
18/12/2034 GBP 500,000 690,936 0.42Lloyds Bank plc, Reg. S 6.5%
24/03/2020 EUR 800,000 1,026,172 0.62Nationwide Building Society, Reg. S, FRN
4.125% 20/03/2023 EUR 300,000 343,243 0.21Nationwide Building Society, Reg. S, FRN
6.875% Perpetual GBP 300,000 377,843 0.23Nationwide Building Society, 144A 3.9%
21/07/2025 USD 400,000 427,664 0.26NGG Finance plc, Reg. S, FRN 5.625%
18/06/2073 GBP 450,000 635,506 0.38Royal Bank of Scotland plc (The) 5.5%
23/03/2020 EUR 775,000 1,006,115 0.61Royal Bank of Scotland plc (The), Reg. S
5.375% 30/09/2019 EUR 200,000 254,229 0.15RSA Insurance Group plc, FRN 9.375%
20/05/2039 GBP 50,000 77,984 0.05Santander UK Group Holdings plc 2.875%
16/10/2020 USD 400,000 398,786 0.24Smiths Group plc, Reg. S 4.125%
05/05/2017 EUR 400,000 459,341 0.28Standard Chartered Bank, Reg. S 5.875%
26/09/2017 EUR 750,000 883,937 0.54Standard Chartered plc, 144A 5.7%
26/03/2044 USD 570,000 582,375 0.35State Grid Europe Development 2014 plc,
Reg. S 1.5% 26/01/2022 EUR 150,000 169,880 0.10Virgin Media Secured Finance plc, Reg. S
5.125% 15/01/2025 GBP 200,000 263,200 0.16Vodafone Group plc 4.375% 19/02/2043 USD 350,000 334,145 0.20Vodafone Group plc, Reg. S 2.2%
25/08/2026 EUR 250,000 295,280 0.18
12,968,568 7.85

Morgan Stanley Investment Funds 30 June 2016 160
The accompanying notes are an integral part of these financial statements.
Global Credit Fund (continued)
SCHEDULE OF INVESTMENTSAs at 30 June 2016
Investments Currency
Quantity/Nominal
Value
Market Value USD
% of Net Assets
Transferable securities and money market instruments admitted to official exchange listing or dealt in on another regulated market
Corporate Bonds (continued)
United States of America21st Century Fox America, Inc. 4.75%
15/09/2044 USD 425,000 470,464 0.29AbbVie, Inc. 3.2% 14/05/2026 USD 625,000 634,369 0.38Actavis Funding SCS 3.8% 15/03/2025
(Luxembourg) (2) USD 535,000 557,735 0.34Actavis Funding SCS 4.75% 15/03/2045
(Luxembourg) (2) USD 175,000 184,736 0.11AES Corp. 7.375% 01/07/2021 USD 200,000 224,728 0.14Air Lease Corp. 3.375% 01/06/2021 USD 325,000 333,494 0.20Alexandria Real Estate Equities, Inc., REIT
3.95% 15/01/2027 USD 325,000 336,106 0.20Altria Group, Inc. 10.2% 06/02/2039 USD 133,000 246,900 0.15Amazon.com, Inc. 3.8% 05/12/2024 USD 300,000 336,703 0.20Amazon.com, Inc. 3.8% 05/12/2024 USD 475,000 533,066 0.32American Campus Communities Operating
Partnership LP 3.75% 15/04/2023 USD 275,000 286,307 0.17American Tower Corp., REIT 4.4%
15/02/2026 USD 350,000 381,743 0.23Amgen, Inc., 144A 4.663% 15/06/2051 USD 223,000 233,780 0.14Anadarko Petroleum Corp. 6.45%
15/09/2036 USD 500,000 572,852 0.35Appalachian Power Co. 3.4%
01/06/2025 USD 625,000 664,438 0.40Apple, Inc. 4.5% 23/02/2036 USD 775,000 875,580 0.53 Ashland, Inc. 6.875% 15/05/2043 USD 100,000 98,954 0.06AT&T, Inc. 3% 30/06/2022 USD 500,000 511,582 0.31AT&T, Inc. 5.55% 15/08/2041 USD 975,000 1,104,514 0.67AT&T, Inc. 5.65% 15/02/2047 USD 375,000 436,401 0.26AvalonBay Communities, Inc., REIT 2.95%
11/05/2026 USD 400,000 403,496 0.24Bank of America Corp. 4% 22/01/2025 USD 750,000 766,590 0.46Bank of America Corp. 4.25%
22/10/2026 USD 272,000 281,883 0.17Bank of America Corp. 4.25%
22/10/2026 USD 125,000 129,542 0.08Bank of America Corp. 5% 21/01/2044 USD 475,000 551,454 0.33Bank of America Corp. 4.75%
21/04/2045 USD 100,000 103,522 0.06Baxalta, Inc. 5.25% 23/06/2045 USD 225,000 246,527 0.15Boston Properties LP, REIT 3.8%
01/02/2024 USD 485,000 519,971 0.32Boston Scientific Corp. 3.85%
15/05/2025 USD 375,000 397,581 0.24Brixmor Operating Partnership LP, REIT
4.125% 15/06/2026 USD 650,000 668,174 0.40Buckeye Partners LP 4.15%
01/07/2023 USD 550,000 554,158 0.34Burlington Northern Santa Fe LLC 4.55%
01/09/2044 USD 225,000 258,981 0.16Burlington Northern Santa Fe LLC 4.55%
01/09/2044 USD 230,000 264,625 0.16Capital One Bank USA NA 3.375%
15/02/2023 USD 950,000 972,904 0.59Capital One Financial Corp. 6.15%
01/09/2016 USD 100,000 100,776 0.06Capital One Financial Corp. 2.45%
24/04/2019 USD 775,000 789,136 0.48Carrizo Oil & Gas, Inc. 6.25%
15/04/2023 USD 390,000 376,869 0.23CBS Corp. 4.6% 15/01/2045 USD 225,000 223,683 0.14Celgene Corp. 3.875% 15/08/2025 USD 750,000 802,598 0.49CenterPoint Energy Houston Electric LLC
1.85% 01/06/2021 USD 650,000 655,200 0.40Charter Communications Operating LLC,
144A 4.908% 23/07/2025 USD 850,000 928,557 0.56
SCHEDULE OF INVESTMENTSAs at 30 June 2016
Investments Currency
Quantity/Nominal
Value
Market Value USD
% of Net Assets
Transferable securities and money market instruments admitted to official exchange listing or dealt in on another regulated market
Corporate Bonds (continued)
United States of America (continued)Charter Communications Operating LLC,
144A 6.484% 23/10/2045 USD 300,000 361,819 0.22Citigroup, Inc. 3.7% 12/01/2026 USD 275,000 289,594 0.18Citigroup, Inc. 8.125% 15/07/2039 USD 425,000 663,253 0.40Citigroup, Inc. 6.675% 13/09/2043 USD 370,000 477,770 0.29Citizens Bank NA 2.55% 13/05/2021 USD 425,000 429,641 0.26Cleco Corporate Holdings LLC, 144A
3.743% 01/05/2026 USD 200,000 205,567 0.12CNA Financial Corp. 5.75% 15/08/2021 USD 550,000 628,006 0.38Crown Castle International Corp., REIT
3.4% 15/02/2021 USD 450,000 470,205 0.28Crown Castle International Corp., REIT
4.45% 15/02/2026 USD 500,000 543,702 0.33CVS Health Corp. 2.125% 01/06/2021 USD 475,000 481,196 0.29DCP Midstream LLC, 144A 5.35%
15/03/2020 USD 132,000 128,357 0.08Discover Financial Services 3.95%
06/11/2024 USD 800,000 826,148 0.50Duke Energy Carolinas LLC 3.75%
01/06/2045 USD 650,000 683,535 0.41Eastman Chemical Co. 3.8%
15/03/2025 USD 375,000 398,496 0.24Enable Midstream Partners LP 3.9%
15/05/2024 USD 475,000 421,752 0.26Energy Transfer Partners LP 6.5%
01/02/2042 USD 150,000 157,981 0.10Energy Transfer Partners LP 6.125%
15/12/2045 USD 350,000 363,209 0.22Ensco plc 5.75% 01/10/2044
(United Kingdom) (2) USD 275,000 165,474 0.10Entergy Louisiana LLC 3.05%
01/06/2031 USD 425,000 433,545 0.26Exelon Generation Co. LLC 6.25%
01/10/2039 USD 550,000 617,537 0.37Express Scripts Holding Co. 4.5%
25/02/2026 USD 300,000 330,540 0.20Exxon Mobil Corp. 4.114% 01/03/2046 USD 275,000 311,799 0.19Ford Motor Credit Co. LLC 3.2%
15/01/2021 USD 1,075,000 1,108,664 0.67Ford Motor Credit Co. LLC 3.096%
04/05/2023 USD 575,000 582,777 0.35GE Capital International Funding Co., 144A
4.418% 15/11/2035 (Ireland) (2) USD 1,268,000 1,432,428 0.87General Motors Co. 6.6% 01/04/2036 USD 525,000 605,506 0.37Gilead Sciences, Inc. 4.8% 01/04/2044 USD 175,000 198,241 0.12Goldman Sachs Group, Inc. (The) 2.55%
23/10/2019 USD 780,000 797,199 0.48Goldman Sachs Group, Inc. (The) 6.75%
01/10/2037 USD 650,000 802,129 0.49Goldman Sachs Group, Inc. (The) 4.8%
08/07/2044 USD 400,000 443,990 0.27Harris Corp. 4.854% 27/04/2035 USD 200,000 220,802 0.13Healthcare Trust of America Holdings LP,
REIT 3.7% 15/04/2023 USD 650,000 667,708 0.40Hess Corp. 6% 15/01/2040 USD 155,000 161,412 0.10Hilcorp Energy I LP, 144A 5%
01/12/2024 USD 150,000 140,344 0.09Hilcorp Energy I LP, 144A 5.75%
01/10/2025 USD 270,000 258,863 0.16Hospitality Properties Trust, REIT 5.25%
15/02/2026 USD 425,000 450,647 0.27HSBC Finance Corp. 6.676%
15/01/2021 USD 1,025,000 1,149,015 0.70HSBC USA, Inc. 3.5% 23/06/2024 USD 925,000 954,794 0.58

161 Morgan Stanley Investment Funds 30 June 2016
The accompanying notes are an integral part of these financial statements.
Global Credit Fund (continued)
SCHEDULE OF INVESTMENTSAs at 30 June 2016
Investments Currency
Quantity/Nominal
Value
Market Value USD
% of Net Assets
Transferable securities and money market instruments admitted to official exchange listing or dealt in on another regulated market
Corporate Bonds (continued)
United States of America (continued)J.P. Morgan Chase & Co. 3.125%
23/01/2025 USD 1,175,000 1,203,928 0.73J.P. Morgan Chase & Co. 4.95%
01/06/2045 USD 805,000 888,744 0.54J.P. Morgan Chase & Co., Reg. S 2.875%
24/05/2028 EUR 100,000 128,881 0.08Jersey Central Power & Light Co., 144A
4.3% 15/01/2026 USD 475,000 509,100 0.31Kennedy-Wilson, Inc. 5.875%
01/04/2024 USD 400,000 397,478 0.24Kinder Morgan, Inc., 144A 5.625%
15/11/2023 USD 425,000 453,779 0.27Kinder Morgan, Inc. 4.3% 01/06/2025 USD 150,000 153,913 0.09Kraft Heinz Foods Co., 144A 4.375%
01/06/2046 USD 525,000 554,555 0.34Lam Research Corp. 3.9% 15/06/2026 USD 425,000 448,562 0.27Liberty Mutual Group, Inc., 144A 4.85%
01/08/2044 USD 250,000 255,726 0.16Lincoln National Corp. 7% 15/06/2040 USD 250,000 322,616 0.20Lockheed Martin Corp. 3.55%
15/01/2026 USD 475,000 519,006 0.31Lowe’s Cos, Inc. 2.5% 15/04/2026 USD 500,000 510,458 0.31LyondellBasell Industries NV 4.625%
26/02/2055 (Netherlands) (2) USD 350,000 340,316 0.21Mallinckrodt International Finance SA, 144A
5.5% 15/04/2025 (Luxembourg) (2) USD 280,000 252,000 0.15Massachusetts Mutual Life Insurance Co.,
144A 4.5% 15/04/2065 USD 100,000 96,237 0.06MasTec, Inc. 4.875% 15/03/2023 USD 470,000 439,791 0.27McDonald’s Corp. 3.7% 30/01/2026 USD 400,000 433,570 0.26McDonald’s Corp. 4.6% 26/05/2045 USD 250,000 282,671 0.17Mead Johnson Nutrition Co. 3%
15/11/2020 USD 300,000 313,490 0.19Medtronic, Inc. 4.625% 15/03/2045 USD 325,000 382,631 0.23MetLife, Inc. 3% 01/03/2025 USD 750,000 761,216 0.46Microsoft Corp. 4.45% 03/11/2045 USD 425,000 483,833 0.29Motorola Solutions, Inc. 4% 01/09/2024 USD 285,000 280,801 0.17MPLX LP 4% 15/02/2025 USD 200,000 183,781 0.11Mylan NV, 144A 3.95% 15/06/2026
(Netherlands) (2) USD 550,000 555,673 0.34NBCUniversal Media LLC 5.95%
01/04/2041 USD 650,000 873,278 0.53Netflix, Inc. 5.5% 15/02/2022 USD 375,000 392,048 0.24Newell Brands, Inc. 3.85% 01/04/2023 USD 375,000 397,545 0.24Occidental Petroleum Corp. 4.4%
15/04/2046 USD 150,000 165,739 0.10Omnicom Group, Inc. 3.65% 01/11/2024 USD 634,000 678,970 0.41Omnicom Group, Inc. 3.6% 15/04/2026 USD 175,000 183,917 0.11Oncor Electric Delivery Co. LLC 2.95%
01/04/2025 USD 775,000 808,792 0.49Oracle Corp. 3.4% 08/07/2024 USD 175,000 189,515 0.11Oracle Corp. 2.95% 15/05/2025 USD 114,000 119,275 0.07Philip Morris International, Inc. 4.5%
20/03/2042 USD 600,000 680,799 0.41Phillips 66 Partners LP 4.68%
15/02/2045 USD 100,000 92,971 0.06PNC Financial Services Group, Inc. (The)
3.9% 29/04/2024 USD 460,000 496,600 0.30PNC Financial Services Group, Inc. (The)
3.9% 29/04/2024 USD 475,000 512,793 0.31Prudential Financial, Inc., FRN 5.625%
15/06/2043 USD 745,000 777,285 0.47QVC, Inc. 4.375% 15/03/2023 USD 550,000 558,860 0.34
SCHEDULE OF INVESTMENTSAs at 30 June 2016
Investments Currency
Quantity/Nominal
Value
Market Value USD
% of Net Assets
Transferable securities and money market instruments admitted to official exchange listing or dealt in on another regulated market
Corporate Bonds (continued)
United States of America (continued)Realty Income Corp., REIT 3.25%
15/10/2022 USD 550,000 560,498 0.34Rowan Cos., Inc. 5.85% 15/01/2044 USD 550,000 375,138 0.23RR Donnelley & Sons Co. 7.875%
15/03/2021 USD 275,000 288,749 0.17Southern Power Co. 2.375%
01/06/2020 USD 625,000 638,125 0.39State Street Corp. 1.95% 19/05/2021 USD 750,000 760,672 0.46Time Warner, Inc. 3.6% 15/07/2025 USD 500,000 531,673 0.32Travelers Cos., Inc. (The) 3.75%
15/05/2046 USD 200,000 209,739 0.13Tyco International Finance SA 1.375%
25/02/2025 (Luxembourg) (2) EUR 375,000 413,105 0.25Tyson Foods, Inc. 4.875% 15/08/2034 USD 225,000 250,131 0.15Under Armour, Inc. 3.25% 15/06/2026 USD 400,000 404,306 0.24United Rentals North America, Inc. 5.75%
15/11/2024 USD 400,000 402,748 0.24United Technologies Corp. 4.5%
01/06/2042 USD 450,000 518,868 0.31UnitedHealth Group, Inc. 2.875%
15/03/2023 USD 650,000 677,540 0.41UnitedHealth Group, Inc. 3.75%
15/07/2025 USD 475,000 521,690 0.32Verizon Communications, Inc. 3.5%
01/11/2024 USD 700,000 745,535 0.45Verizon Communications, Inc. 5.012%
21/08/2054 USD 591,000 628,924 0.38Verizon Communications, Inc. 4.672%
15/03/2055 USD 625,000 633,150 0.38Viacom, Inc. 5.85% 01/09/2043 USD 175,000 176,744 0.11Virginia Electric & Power Co. 4.2%
15/05/2045 USD 420,000 471,654 0.29Visa, Inc. 4.3% 14/12/2045 USD 325,000 378,890 0.23Walgreens Boots Alliance, Inc. 3.45%
01/06/2026 USD 250,000 257,154 0.16Wal-Mart Stores, Inc. 5.25%
01/09/2035 USD 600,000 791,829 0.48Weingarten Realty Investors, REIT 4.45%
15/01/2024 USD 375,000 400,946 0.24Wells Fargo & Co. 4.1% 03/06/2026 USD 650,000 695,266 0.42Wells Fargo & Co. 3.9% 01/05/2045 USD 500,000 528,707 0.32Wells Fargo & Co., Reg. S 2.25%
03/09/2020 EUR 300,000 361,092 0.22Whole Foods Market, Inc., 144A 5.2%
03/12/2025 USD 500,000 537,587 0.33Yum! Brands, Inc. 3.875% 01/11/2020 USD 275,000 280,416 0.17Zimmer Biomet Holdings, Inc. 5.75%
30/11/2039 USD 190,000 228,889 0.14
70,135,232 42.47
Total Corporate Bonds 143,382,324 86.82
Mortgage and Asset Backed Securities
United KingdomBritish Airways Pass Through Trust, Series
2013-1 ‘A’, 144A 4.625% 20/06/2024 (United States of America) (2) USD 251,118 265,369 0.16
265,369 0.16

Morgan Stanley Investment Funds 30 June 2016 162
The accompanying notes are an integral part of these financial statements.
Global Credit Fund (continued)
Financial Futures Contracts
Security DescriptionNumber of Contracts Currency
Global Exposure
USD
Unrealised Gain/(Loss)
USD
% of Net Assets
Euro-OAT, 08/09/2016 7 EUR 1,248,927 30,348 0.02Australia 10 Year Bond, 15/09/2016 23 AUD 2,329,456 24,433 0.01Canada 10 Year Bond, 21/09/2016 23 CAD 2,617,235 61,109 0.04Long Gilt, 28/09/2016 32 GBP 5,502,710 224,352 0.14US 2 Year Note, 30/09/2016 103 USD 22,581,141 136,547 0.08US 5 Year Note, 30/09/2016 89 USD 10,861,477 188,445 0.11
Unrealised Gain on Financial Futures Contracts 665,234 0.40
Total Unrealised Gain on Financial Futures Contracts 665,234 0.40
Euro-Bobl, 08/09/2016 (6) EUR (890,757) (8,775) (0.01)Euro-Bund, 08/09/2016 (12) EUR (2,227,059) (49,890) (0.03)Euro-Schatz, 08/09/2016 (3) EUR (373,661) (900) 0.00US 10 Year Note, 21/09/2016 (72) USD (9,570,375) (233,883) (0.14)US 10 Year Ultra Note, 21/09/2016 (74) USD (10,782,031) (370,453) (0.22)US Long Bond, 21/09/2016 (5) USD (864,688) (53,672) (0.03)US Ultra Bond, 21/09/2016 (23) USD (4,303,875) (257,781) (0.16)
Unrealised Loss on Financial Futures Contracts (975,354) (0.59)
Total Unrealised Loss on Financial Futures Contracts (975,354) (0.59)
Net Unrealised Loss on Financial Futures Contracts (310,120) (0.19)
Forward Currency Exchange Contracts (continued)
Currency Purchased
Amount Purchased
Currency Sold
Amount Sold
Maturity Date Counterparty
Unrealised Gain/(Loss)
USD
% of Net Assets
CAD 5,229,000 USD 4,013,416 07/07/2016 RBC 13,571 0.01EUR 415,000 USD 456,907 08/07/2016 UBS 4,487 0.01USD 336,439 EUR 302,000 08/07/2016 Westpac Banking 678 0.00CHF 1,380,000 USD 1,416,061 12/07/2016 J.P. Morgan 376 0.00CHF 971,000 USD 981,770 12/07/2016 UBS 14,869 0.01JPY 85,000,000 EUR 712,088 25/07/2016 RBC 35,395 0.02JPY 158,333,000 USD 1,491,569 25/07/2016 Westpac Banking 50,033 0.03CAD 5,524,000 USD 4,252,076 05/08/2016 RBC 2,563 0.00
Unrealised Gain on Forward Currency Exchange Contracts 121,972 0.08
CHF Hedged Share ClassCHF 2,898,361 GBP 2,069,473 29/07/2016 J.P. Morgan 197,009 0.12CHF 23,044 JPY 2,423,848 29/07/2016 J.P. Morgan 78 0.00GBP 59,363 CHF 76,443 29/07/2016 J.P. Morgan 1,230 0.00
Unrealised Gain on NAV Hedged Share Classes Forward Currency Exchange Contracts 198,317 0.12
Total Unrealised Gain on Forward Currency Exchange Contracts 320,289 0.20
SCHEDULE OF INVESTMENTSAs at 30 June 2016
Investments Currency
Quantity/Nominal
Value
Market Value USD
% of Net Assets
Transferable securities and money market instruments admitted to official exchange listing or dealt in on another regulated market
Mortgage and Asset Backed Securities (continued)
United States of AmericaAmerican Airlines Pass Through Trust,
Series 2013-1 ‘A’ 4% 15/07/2025 USD 306,407 323,642 0.19American Airlines Pass Through Trust,
Series 2016-2 ‘AA’ 3.2% 15/06/2028 USD 250,000 258,450 0.16CVS Pass-Through Trust, Series 2014,
144A 4.163% 11/08/2036 USD 355,142 366,328 0.22United Airlines Pass Through Trust,
Series 2014-1 ‘A’ 4% 11/04/2026 USD 777,752 823,444 0.50
1,771,864 1.07
Total Mortgage and Asset Backed Securities 2,037,233 1.23
Total Transferable securities and money market instruments admitted to official exchange listing or dealt in on another regulated market 150,219,226 90.96
Units of authorised UCITS or other collective investment undertakings
Collective Investment Schemes – UCITS
LuxembourgMorgan Stanley Liquidity Funds US Dollar
Liquidity Fund – MS Reserve (4) USD 8,218,932 8,218,932 4.98
8,218,932 4.98
Total Collective Investment Schemes – UCITS 8,218,932 4.98
Total Units of authorised UCITS or other collective investment undertakings 8,218,932 4.98
Total Investments 158,438,158 95.94
Cash 6,682,317 4.05
Other Assets/(Liabilities) 19,286 0.01
Total Net Assets 165,139,761 100.00
(2) The country in brackets represents the country of incorporation of this security.(4) Affiliate managed by an affiliate of the Investment Adviser.
DERIVATIVES
Over-the-counter (OTC) and exchange traded derivatives as at 30 June 2016, expressed in US dollars.

163 Morgan Stanley Investment Funds 30 June 2016
The accompanying notes are an integral part of these financial statements.
Global Credit Fund (continued)
Forward Currency Exchange Contracts (continued)
Currency Purchased
Amount Purchased
Currency Sold
Amount Sold
Maturity Date Counterparty
Unrealised Gain/(Loss)
USD
% of Net Assets
CAD 295,000 USD 231,501 07/07/2016 UBS (4,314) 0.00USD 4,251,887 CAD 5,524,000 07/07/2016 RBC (2,288) 0.00EUR 270,000 USD 307,080 08/07/2016 Commonwealth
Bank of Australia (6,896) (0.01)EUR 985,000 USD 1,111,468 08/07/2016 UBS (16,352) (0.01)USD 1,371,307 CHF 1,340,000 12/07/2016 UBS (4,075) 0.00GBP 3,844,000 USD 5,437,350 20/07/2016 HSBC (271,403) (0.17)
Unrealised Loss on Forward Currency Exchange Contracts (305,328) (0.19)
CHF Hedged Share ClassCHF 1,247,654 CAD 1,672,364 29/07/2016 J.P. Morgan (5,939) 0.00CHF 10,166,751 EUR 9,394,408 29/07/2016 J.P. Morgan (5,492) 0.00CHF 883,490 JPY 96,332,015 29/07/2016 J.P. Morgan (30,175) (0.02)CHF 32,026,626 USD 33,497,607 29/07/2016 J.P. Morgan (586,670) (0.36)GBP 109,999 CHF 145,920 29/07/2016 J.P. Morgan (2,110) 0.00
Unrealised Loss on NAV Hedged Share Classes Forward Currency Exchange Contracts (630,386) (0.38)
Total Unrealised Loss on Forward Currency Exchange Contracts (935,714) (0.57)
Net Unrealised Loss on Forward Currency Exchange Contracts (615,425) (0.37)
Credit Default Swap Contracts
Nominal Amount Ccy Counterparty
Reference Entity
Buy/Sell
Interest (Paid)/
ReceivedMaturity
Date
Market Value USD
Unrealised Gain/(Loss)
USD
% of Net Assets
4,150,000 USD Barclays CDX.NA.HY.24-V3 Buy (5.00)% 20/06/2020 (233,410) (233,410) (0.14)5,000,000 USD Barclays CDX.NA.IG.26-V1 Buy (1.00)% 20/06/2021 (46,494) (46,494) (0.03)
550,000 EUR Barclays iTraxx Europe Crossover Series 21 Version 3 Buy (5.00)% 20/06/2019 (48,698) (48,698) (0.03)
355,000 USD Barclays Quest Diagnostics, Inc. 6.95% 01/07/2037 Buy (1.00)% 20/03/2019 (7,096) (7,096) 0.00
375,000 USD Barclays Yum! Brands, Inc. 6.25% 15/03/2018 Buy (1.00)% 20/12/2018 (234) (234) 0.00
Total Unrealised Loss on Credit Default Swap Contracts (335,932) (335,932) (0.20)
Net Unrealised Loss on Credit Default Swap Contracts (335,932) (335,932) (0.20)
Interest Rate Swap Contracts
Nominal Amount Ccy Counterparty
Security Description
Maturity Date
Market Value USD
Unrealised Gain/(Loss)
USD
% of Net Assets
6,000,000 USD Societe Generale Pay fixed 1.695% Receive floating LIBOR
3 month 20/03/2020 (206,713) (206,713) (0.12)1,350,000 USD Citibank Pay fixed 2.43%
Receive floating LIBOR 3 month 17/07/2025 (149,563) (149,563) (0.09)
4,000,000 USD Barclays Pay fixed 1.715% Receive floating LIBOR
3 month 19/03/2020 (140,896) (140,896) (0.09)2,400,000 USD Citibank Pay fixed 1.749%
Receive floating LIBOR 3 month 17/07/2020 (96,289) (96,289) (0.06)
Total Unrealised Loss on Interest Rate Swap Contracts (593,461) (593,461) (0.36)
Net Unrealised Loss on Interest Rate Swap Contracts (593,461) (593,461) (0.36)
Collateral received and paid by the Fund in respect of financial derivative instruments:
Type of Collateral Counterparty CurrencyCollateral Amount
receivedCollateral Amount
paid
Global Credit Fund
Cash Barclays USD - 520,000Cash Citigroup Global Market Ltd. USD - 260,000Cash Goldman Sachs USD 1,007,121 -
1,007,121 780,000
DERIVATIVES (continued)
Over-the-counter (OTC) and exchange traded derivatives as at 30 June 2016, expressed in US dollars.
DERIVATIVES (continued)
Over-the-counter (OTC) and exchange traded derivatives as at 30 June 2016, expressed in US dollars.

Morgan Stanley Investment Funds 30 June 2016 164
The accompanying notes are an integral part of these financial statements.
Please refer to the full prospectus for the Fund’s investment objective and policy.
INVESTMENT AIM
To provide an attractive level of total return, measured in US dollars, through investment primarily in the global securities of corporate, government and government related issuers across a spectrum of fixed income asset classes including high yield bonds, investment-grade bonds, mortgage-backed securities, convertibles and currencies.
SCHEDULE OF INVESTMENTSAs at 30 June 2016
Investments Currency
Quantity/Nominal
Value
Market Value USD
% of Net Assets
Transferable securities and money market instruments admitted to official exchange listing or dealt in on another regulated market
Convertible Bonds
ChinaCtrip.com International Ltd. 1.25%
15/10/2018 (Cayman Islands) (2) USD 1,000,000 1,212,500 0.09ENN Energy Holdings Ltd., Reg. S 0%
26/02/2018 (Cayman Islands) (2) USD 3,500,000 3,670,257 0.28Shenzhou International Group Holdings
Ltd., Reg. S 0.5% 18/06/2019 (Cayman Islands) (2) HKD 6,000,000 888,126 0.07
5,770,883 0.44
FranceTOTAL SA, Reg. S 0.5% 02/12/2022 USD 2,000,000 2,019,330 0.16
2,019,330 0.16
JapanSony Corp. 0% 30/09/2022 JPY 380,000,000 3,872,835 0.30
3,872,835 0.30
JerseyDerwent London Capital No. 2 Jersey Ltd.,
REIT, Reg. S 1.125% 24/07/2019 GBP 600,000 830,978 0.06
830,978 0.06
MexicoAmerica Movil SAB de CV, Reg. S 0%
28/05/2020 EUR 3,300,000 3,619,347 0.28
3,619,347 0.28
United Arab EmiratesAabar Investments PJSC, Reg. S 1%
27/03/2022 EUR 2,700,000 2,148,767 0.17
2,148,767 0.17
United States of AmericaAkamai Technologies, Inc. 0% 15/02/2019 USD 2,000,000 1,961,260 0.15Citrix Systems, Inc. 0.5% 15/04/2019 USD 3,850,000 4,319,219 0.33Extra Space Storage LP, REIT, 144A
3.125% 01/10/2035 USD 3,350,000 3,791,781 0.29Illumina, Inc. 0% 15/06/2019 USD 3,900,000 3,807,375 0.29ON Semiconductor Corp. 2.625%
15/12/2026 USD 1,840,000 1,901,318 0.15Priceline Group, Inc. (The) 0.9%
15/09/2021 USD 4,200,000 4,252,500 0.33Starwood Property Trust, Inc., REIT 4.55%
01/03/2018 USD 2,831,000 2,932,732 0.23Tesla Motors, Inc. 0.25% 01/03/2019 USD 4,300,000 3,828,978 0.29Toll Brothers Finance Corp. 0.5%
15/09/2032 USD 2,750,000 2,692,938 0.21Twitter, Inc. 0.25% 15/09/2019 USD 2,125,000 1,948,795 0.15
31,436,896 2.42
Total Convertible Bonds 49,699,036 3.83
Global Fixed Income Opportunities Fund

165 Morgan Stanley Investment Funds 30 June 2016
The accompanying notes are an integral part of these financial statements.
Global Fixed Income Opportunities Fund (continued)
SCHEDULE OF INVESTMENTSAs at 30 June 2016
Investments Currency
Quantity/Nominal
Value
Market Value USD
% of Net Assets
Transferable securities and money market instruments admitted to official exchange listing or dealt in on another regulated market
Corporate Bonds
ArgentinaProvincia de Cordoba, Reg. S 7.125%
10/06/2021 USD 1,350,000 1,355,636 0.10
1,355,636 0.10
AustraliaAPT Pipelines Ltd., 144A 4.2%
23/03/2025 USD 2,475,000 2,537,147 0.20APT Pipelines Ltd., Reg. S 3.5%
22/03/2030 GBP 1,000,000 1,319,490 0.10Aurizon Network Pty. Ltd., Reg. S 3.125%
01/06/2026 EUR 6,050,000 6,854,859 0.53Commonwealth Bank of Australia, Reg. S,
FRN 2% 22/04/2027 EUR 4,700,000 5,043,828 0.39Origin Energy Finance Ltd., Reg. S, FRN
7.875% 16/06/2071 EUR 5,000,000 5,466,684 0.42Santos Finance Ltd., FRN 8.25%
22/09/2070 EUR 1,650,000 1,858,454 0.14
23,080,462 1.78
AustriaVienna Insurance Group AG Wiener
Versicherung Gruppe, Reg. S, FRN 5.5% 09/10/2043 EUR 2,200,000 2,587,276 0.20
2,587,276 0.20
BelgiumSolvay Finance SA, Reg. S, FRN 5.118%
Perpetual (France) (2) EUR 925,000 1,061,557 0.08Solvay Finance SA, Reg. S, FRN 5.425%
Perpetual (France) (1) (2) EUR 1,300,000 1,483,493 0.12
2,545,050 0.20
BrazilBanco ABC Brasil SA, Reg. S 7.875%
08/04/2020 USD 2,775,000 2,815,210 0.22Banco Daycoval SA, 144A 5.75%
19/03/2019 USD 1,250,000 1,254,925 0.10BRF SA, Reg. S 2.75% 03/06/2022 EUR 1,000,000 1,094,687 0.08
5,164,822 0.40
CanadaAir Canada, 144A 7.75% 15/04/2021 USD 2,750,000 2,866,875 0.22Lundin Mining Corp., 144A 7.5%
01/11/2020 USD 2,500,000 2,560,625 0.20
5,427,500 0.42
ChileCencosud SA, 144A 6.625% 12/02/2045 USD 1,525,000 1,487,493 0.11
1,487,493 0.11
ColombiaEcopetrol SA 5.875% 18/09/2023 USD 2,900,000 2,989,711 0.23
2,989,711 0.23
SCHEDULE OF INVESTMENTSAs at 30 June 2016
Investments Currency
Quantity/Nominal
Value
Market Value USD
% of Net Assets
Transferable securities and money market instruments admitted to official exchange listing or dealt in on another regulated market
Corporate Bonds (continued)
FranceAXA SA, Reg. S, FRN 5.25% 16/04/2040 EUR 2,300,000 2,826,965 0.22BNP Paribas SA, Reg. S, FRN 6.125%
Perpetual (1) EUR 800,000 852,348 0.07BPCE SA, 144A 5.15% 21/07/2024 USD 3,500,000 3,653,492 0.28Credit Agricole Assurances SA, Reg. S,
FRN 4.5% Perpetual EUR 4,500,000 4,755,400 0.37Credit Agricole SA, FRN, 144A 7.875%
Perpetual USD 2,475,000 2,378,475 0.18Electricite de France SA, Reg. S, FRN 5%
Perpetual EUR 1,800,000 1,886,910 0.15Eurofins Scientific SE, Reg. S, FRN 4.875%
Perpetual (Luxembourg) (2) EUR 2,000,000 2,209,240 0.17Europcar Groupe SA, Reg. S 5.75%
15/06/2022 (1) EUR 2,600,000 3,008,837 0.23Numericable-SFR SA, 144A 6%
15/05/2022 USD 1,732,000 1,690,432 0.13Societe Generale SA, Reg. S 2.625%
27/02/2025 EUR 1,900,000 2,107,385 0.16TOTAL SA, Reg. S, FRN 2.25% Perpetual EUR 1,700,000 1,828,946 0.14Veolia Environnement SA, Reg. S, FRN
4.45% Perpetual EUR 2,000,000 2,338,246 0.18Verallia Packaging SASU, Reg. S 5.125%
01/08/2022 EUR 2,200,000 2,516,298 0.19
32,052,974 2.47
GermanyAllianz Finance II BV, FRN 5.75%
08/07/2041 (Netherlands) (2) EUR 3,900,000 4,952,577 0.38Bayer AG, Reg. S, FRN 3.75%
01/07/2074 EUR 1,900,000 2,151,718 0.17Muenchener Rueckversicherungs-
Gesellschaft AG, Reg. S, FRN 6% 26/05/2041 (1) EUR 3,800,000 4,939,419 0.38
RWE AG, Reg. S, FRN 7% Perpetual GBP 2,300,000 3,033,217 0.23Unitymedia Hessen GmbH & Co. KG,
Reg. S 4% 15/01/2025 EUR 1,500,000 1,685,652 0.13Volkswagen International Finance NV,
Reg. S, FRN 4.625% Perpetual (Netherlands) (2) EUR 1,850,000 2,119,317 0.16
Vonovia Finance BV, Reg. S, FRN 4.625% 08/04/2074 (Netherlands) (2) EUR 4,100,000 4,751,148 0.37
23,633,048 1.82
IndiaVedanta Resources plc, 144A 6%
31/01/2019 (United Kingdom) (2) USD 2,275,000 1,950,938 0.15
1,950,938 0.15
ItalyAssicurazioni Generali SpA, Reg. S, FRN
10.125% 10/07/2042 EUR 3,500,000 4,958,809 0.38Enel SpA, Reg. S, FRN 5% 15/01/2075 EUR 2,125,000 2,492,288 0.19Intesa Sanpaolo SpA, Reg. S, FRN 7%
Perpetual (1) EUR 2,800,000 2,882,494 0.22Intesa Sanpaolo SpA 5.25% 12/01/2024 USD 2,350,000 2,519,400 0.19Telecom Italia Finance SA 7.75%
24/01/2033 (Luxembourg) (2) EUR 1,700,000 2,521,695 0.20
15,374,686 1.18

Morgan Stanley Investment Funds 30 June 2016 166
The accompanying notes are an integral part of these financial statements.
Global Fixed Income Opportunities Fund (continued)
SCHEDULE OF INVESTMENTSAs at 30 June 2016
Investments Currency
Quantity/Nominal
Value
Market Value USD
% of Net Assets
Transferable securities and money market instruments admitted to official exchange listing or dealt in on another regulated market
Corporate Bonds (continued)
KazakhstanKazMunayGas National Co. JSC, Reg. S
6.375% 09/04/2021 USD 3,100,000 3,393,074 0.26
3,393,074 0.26
LuxembourgArdagh Finance Holdings SA, 144A
8.625% 15/06/2019 USD 592,396 599,801 0.05
599,801 0.05
MalaysiaPetronas Capital Ltd., Reg. S 3.5%
18/03/2025 USD 3,200,000 3,370,906 0.26
3,370,906 0.26
MexicoFermaca Enterprises S de RL de CV, 144A
6.375% 30/03/2038 USD 1,943,489 1,919,176 0.15
1,919,176 0.15
NetherlandsABN AMRO Bank NV, Reg. S, FRN 2.875%
30/06/2025 (1) EUR 3,400,000 3,865,221 0.30ABN AMRO Bank NV, Reg. S 6.375%
27/04/2021 EUR 1,775,000 2,361,363 0.18Achmea BV, Reg. S, FRN 6% 04/04/2043 EUR 1,600,000 1,857,433 0.14Achmea BV, Reg. S, FRN 4.25%
Perpetual (1) EUR 900,000 879,746 0.07Aegon NV, Reg. S, FRN 4% 25/04/2044 EUR 1,800,000 1,828,381 0.14AerCap Ireland Capital Ltd. 3.75%
15/05/2019 (Ireland) (2) USD 1,800,000 1,814,607 0.14ASR Nederland NV, Reg. S, FRN 5%
Perpetual EUR 4,400,000 4,846,867 0.37Constellium NV, Reg. S 4.625%
15/05/2021 EUR 2,500,000 2,218,903 0.17Cooperatieve Rabobank UA, Reg. S, FRN
5.5% Perpetual EUR 5,000,000 5,316,557 0.41ING Bank NV, 144A 5.8% 25/09/2023 USD 2,525,000 2,779,735 0.22Playa Resorts Holding BV, 144A 8%
15/08/2020 USD 1,530,000 1,545,300 0.12
29,314,113 2.26
PortugalEDP - Energias de Portugal SA, Reg. S,
FRN 5.375% 16/09/2075 EUR 4,200,000 4,651,076 0.36EDP Finance BV, 144A 4.125%
15/01/2020 (Netherlands) (2) USD 2,200,000 2,277,572 0.17
6,928,648 0.53
South AfricaEskom Holdings SOC Ltd., Reg. S 7.125%
11/02/2025 (1) USD 3,000,000 2,972,445 0.23
2,972,445 0.23
SCHEDULE OF INVESTMENTSAs at 30 June 2016
Investments Currency
Quantity/Nominal
Value
Market Value USD
% of Net Assets
Transferable securities and money market instruments admitted to official exchange listing or dealt in on another regulated market
Corporate Bonds (continued)
SpainBanco Bilbao Vizcaya Argentaria SA,
Reg. S, FRN 6.75% Perpetual EUR 3,800,000 3,639,366 0.28Banco Santander SA, Reg. S, FRN 6.25%
Perpetual EUR 2,300,000 2,175,608 0.17Banco Santander SA, Reg. S, FRN 6.375%
Perpetual (1) USD 4,600,000 4,042,296 0.31BBVA Subordinated Capital SAU, Reg. S,
FRN 3.5% 11/04/2024 (1) EUR 2,200,000 2,493,853 0.19Gas Natural Fenosa Finance BV, Reg. S,
FRN 3.375% Perpetual (Netherlands) (2) EUR 3,800,000 3,778,575 0.29IE2 Holdco SAU, Reg. S 2.875%
01/06/2026 EUR 2,500,000 2,804,112 0.22Repsol International Finance BV, Reg. S,
FRN 4.5% 25/03/2075 (Netherlands) (2) EUR 2,500,000 2,369,683 0.18Santander Issuances SAU 5.179%
19/11/2025 USD 2,000,000 1,993,380 0.15Telefonica Europe BV, Reg. S, FRN 5.875%
Perpetual (Netherlands) (2) EUR 3,300,000 3,753,262 0.29
27,050,135 2.08
SwitzerlandCredit Suisse AG, 144A 6.5%
08/08/2023 USD 1,275,000 1,341,542 0.10UBS AG, Reg. S 5.125% 15/05/2024 (1) USD 2,100,000 2,145,549 0.17
3,487,091 0.27
United KingdomAviva plc, Reg. S, FRN 3.875%
03/07/2044 EUR 1,725,000 1,851,072 0.14CEVA Group plc, 144A 4% 01/05/2018 USD 2,000,000 1,790,000 0.14HSBC Holdings plc, FRN 6.375%
Perpetual USD 2,400,000 2,288,412 0.17HSS Financing plc, Reg. S 6.75%
01/08/2019 GBP 1,462,000 1,919,633 0.15International Game Technology plc, 144A
6.25% 15/02/2022 USD 1,250,000 1,281,000 0.10International Game Technology plc, Reg. S
4.75% 15/02/2023 EUR 2,500,000 2,884,581 0.22John Lewis plc, Reg. S 4.25%
18/12/2034 GBP 1,400,000 1,934,621 0.15Lloyds Bank plc, Reg. S 6.5%
24/03/2020 EUR 1,200,000 1,539,258 0.12Lloyds Banking Group plc, Reg. S, FRN
6.375% Perpetual (1) EUR 3,200,000 3,338,015 0.26Nationwide Building Society, Reg. S, FRN
6.875% Perpetual GBP 2,200,000 2,770,849 0.21NGG Finance plc, Reg. S, FRN 5.625%
18/06/2073 (1) GBP 2,200,000 3,106,920 0.24Vodafone Group plc, Reg. S 2.2%
25/08/2026 (1) EUR 2,100,000 2,480,349 0.19Voyage Care Bondco plc, Reg. S 6.5%
01/08/2018 GBP 1,400,000 1,818,679 0.14
29,003,389 2.23
United States of AmericaAcadia Healthcare Co., Inc. 5.125%
01/07/2022 USD 1,000,000 985,000 0.08Allied Specialty Vehicles, Inc., 144A 8.5%
01/11/2019 USD 1,800,000 1,831,500 0.14

167 Morgan Stanley Investment Funds 30 June 2016
The accompanying notes are an integral part of these financial statements.
Global Fixed Income Opportunities Fund (continued)
SCHEDULE OF INVESTMENTSAs at 30 June 2016
Investments Currency
Quantity/Nominal
Value
Market Value USD
% of Net Assets
Transferable securities and money market instruments admitted to official exchange listing or dealt in on another regulated market
Corporate Bonds (continued)
United States of America (continued)Ally Financial, Inc. 4.125% 30/03/2020 USD 2,000,000 2,003,470 0.15Ally Financial, Inc. 4.25% 15/04/2021 USD 1,425,000 1,418,808 0.11Apex Tool Group LLC, 144A 7%
01/02/2021 USD 850,000 737,375 0.06Aramark Services, Inc., 144A 4.75%
01/06/2026 USD 3,350,000 3,299,984 0.25Argos Merger Sub, Inc., 144A 7.125%
15/03/2023 USD 2,600,000 2,648,802 0.20Artesyn Embedded Technologies, Inc.,
144A 9.75% 15/10/2020 USD 1,200,000 1,062,000 0.08AT&T, Inc. 6.3% 15/01/2038 USD 2,450,000 2,959,943 0.23Ball Corp. 4% 15/11/2023 USD 2,000,000 1,967,820 0.15Bank of America Corp. 4.25%
22/10/2026 USD 2,200,000 2,279,937 0.18Bank of America Corp. 6.11%
29/01/2037 USD 1,175,000 1,394,294 0.11Bank of America Corp. 4.75%
21/04/2045 USD 1,275,000 1,319,912 0.10Cable One, Inc., 144A 5.75%
15/06/2022 USD 2,800,000 2,877,000 0.22Carrizo Oil & Gas, Inc. 6.25%
15/04/2023 USD 2,500,000 2,415,825 0.19Central Garden & Pet Co. 6.125%
15/11/2023 USD 1,900,000 1,980,750 0.15Century Communities, Inc. 6.875%
15/05/2022 USD 1,700,000 1,640,500 0.13Charter Communications Operating LLC,
144A 4.908% 23/07/2025 USD 3,275,000 3,577,675 0.28Chemtura Corp. 5.75% 15/07/2021 USD 1,525,000 1,543,216 0.12Citigroup, Inc. 5.5% 13/09/2025 USD 2,525,000 2,838,517 0.22Crestwood Midstream Partners LP, 144A
6.25% 01/04/2023 USD 1,750,000 1,610,000 0.12CSC Holdings LLC 5.25% 01/06/2024 USD 2,250,000 2,040,536 0.16CTP Transportation Products LLC, 144A
8.25% 15/12/2019 USD 1,100,000 973,500 0.07CTR Partnership LP, REIT 5.875%
01/06/2021 USD 1,500,000 1,528,125 0.12DCP Midstream LLC, 144A 5.35%
15/03/2020 USD 2,130,000 2,071,212 0.16Discover Financial Services 3.95%
06/11/2024 USD 2,700,000 2,788,250 0.21DISH DBS Corp. 5% 15/03/2023 USD 2,500,000 2,269,537 0.17Dollar Tree, Inc., 144A 5.75%
01/03/2023 USD 2,000,000 2,141,260 0.16DuPont Fabros Technology LP, REIT
5.625% 15/06/2023 USD 2,000,000 2,027,620 0.16Ensco plc 5.75% 01/10/2044
(United Kingdom) (2) USD 3,150,000 1,895,434 0.15First Data Corp., 144A 5.75%
15/01/2024 USD 2,500,000 2,479,463 0.19Florida East Coast Holdings Corp., 144A
6.75% 01/05/2019 USD 1,500,000 1,500,000 0.12General Motors Financial Co., Inc. 4.3%
13/07/2025 USD 1,925,000 1,980,941 0.15Global Partners LP 6.25% 15/07/2022 USD 1,100,000 918,500 0.07Global Partners LP 7% 15/06/2023 USD 2,500,000 2,087,500 0.16Goldman Sachs Group, Inc. (The) 6.75%
01/10/2037 USD 2,275,000 2,807,452 0.22Guitar Center, Inc., 144A 6.5%
15/04/2019 USD 1,000,000 867,500 0.07Hanesbrands, Inc., 144A 4.875%
15/05/2026 USD 1,950,000 1,952,535 0.15Harland Clarke Holdings Corp., 144A
9.75% 01/08/2018 USD 1,750,000 1,785,000 0.14HCA, Inc. 4.75% 01/05/2023 USD 2,250,000 2,305,597 0.18
SCHEDULE OF INVESTMENTSAs at 30 June 2016
Investments Currency
Quantity/Nominal
Value
Market Value USD
% of Net Assets
Transferable securities and money market instruments admitted to official exchange listing or dealt in on another regulated market
Corporate Bonds (continued)
United States of America (continued)Hewlett Packard Enterprise Co., 144A
3.6% 15/10/2020 USD 990,000 1,031,427 0.08Hexion, Inc. 10% 15/04/2020 USD 1,300,000 1,225,250 0.09Hilcorp Energy I LP, 144A 5%
01/12/2024 USD 2,975,000 2,783,499 0.21Hilcorp Energy I LP, 144A 5.75%
01/10/2025 USD 1,429,000 1,370,054 0.11inVentiv Health, Inc., 144A 9%
15/01/2018 USD 1,340,000 1,380,200 0.11Iron Mountain, Inc., REIT, 144A 4.375%
01/06/2021 USD 2,000,000 1,995,000 0.15iStar, Inc., REIT 6.5% 01/07/2021 USD 1,500,000 1,413,750 0.11JB Poindexter & Co., Inc., 144A 9%
01/04/2022 USD 1,539,000 1,608,255 0.12JC Penney Corp., Inc. 8.125%
01/10/2019 USD 1,750,000 1,804,530 0.14Jefferies Finance LLC, 144A 7.375%
01/04/2020 USD 1,500,000 1,396,875 0.11KCG Holdings, Inc., 144A 6.875%
15/03/2020 USD 2,250,000 2,053,125 0.16Kemet Corp. 10.5% 01/05/2018 USD 1,500,000 1,447,050 0.11Kennedy-Wilson, Inc. 5.875%
01/04/2024 USD 1,766,000 1,754,865 0.14KFC Holding Co., 144A 5.25%
01/06/2026 USD 3,350,000 3,407,000 0.26Lamar Media Corp. 5% 01/05/2023 USD 1,750,000 1,803,296 0.14Lear Corp. 5.25% 15/01/2025 USD 2,000,000 2,113,710 0.16Mallinckrodt International Finance SA, 144A
5.5% 15/04/2025 (Luxembourg) (2) USD 1,575,000 1,417,500 0.11Martin Midstream Partners LP 7.25%
15/02/2021 USD 1,950,000 1,794,000 0.14MasTec, Inc. 4.875% 15/03/2023 USD 2,750,000 2,573,244 0.20MDC Partners, Inc., 144A 6.5%
01/05/2024 (Canada) (2) USD 2,525,000 2,499,750 0.19MGM Resorts International 6%
15/03/2023 USD 2,530,000 2,674,830 0.21Midcontinent Communications &
Midcontinent Finance Corp., 144A 6.25% 01/08/2021 USD 1,400,000 1,449,000 0.11
Motorola Solutions, Inc. 4% 01/09/2024 USD 2,080,000 2,049,351 0.16MPLX LP 4% 15/02/2025 USD 2,825,000 2,595,907 0.20Netflix, Inc. 5.5% 15/02/2022 USD 3,650,000 3,815,929 0.29Newfield Exploration Co. 5.375%
01/01/2026 USD 1,550,000 1,510,529 0.12Northern Tier Energy LLC 7.125%
15/11/2020 USD 1,500,000 1,515,000 0.12Omnicom Group, Inc. 3.6% 15/04/2026 USD 3,050,000 3,205,413 0.25OPE KAG Finance Sub, Inc., 144A 7.875%
31/07/2023 USD 2,760,000 2,732,400 0.21Pinnacle Foods Finance LLC, 144A
5.875% 15/01/2024 USD 1,500,000 1,575,000 0.12Prince Mineral Holding Corp., 144A 11.5%
15/12/2019 USD 2,442,000 2,136,750 0.16Provident Funding Associates LP, 144A
6.75% 15/06/2021 USD 1,500,000 1,432,500 0.11Prudential Financial, Inc., FRN 5.625%
15/06/2043 USD 1,390,000 1,450,236 0.11Quintiles Transnational Corp., 144A
4.875% 15/05/2023 USD 2,093,000 2,134,860 0.16QVC, Inc. 4.85% 01/04/2024 USD 2,800,000 2,920,680 0.22Rice Energy, Inc. 6.25% 01/05/2022 USD 1,000,000 996,360 0.08Rite Aid Corp. 6.75% 15/06/2021 USD 1,000,000 1,052,425 0.08Rivers Pittsburgh Borrower LP, 144A 9.5%
15/06/2019 USD 1,320,000 1,364,933 0.11Rowan Cos., Inc. 5.85% 15/01/2044 USD 3,500,000 2,387,245 0.18

Morgan Stanley Investment Funds 30 June 2016 168
The accompanying notes are an integral part of these financial statements.
Global Fixed Income Opportunities Fund (continued)
SCHEDULE OF INVESTMENTSAs at 30 June 2016
Investments Currency
Quantity/Nominal
Value
Market Value USD
% of Net Assets
Transferable securities and money market instruments admitted to official exchange listing or dealt in on another regulated market
Corporate Bonds (continued)
United States of America (continued)RR Donnelley & Sons Co. 7.875%
15/03/2021 USD 1,257,000 1,319,844 0.10RSI Home Products, Inc., 144A 6.5%
15/03/2023 USD 2,000,000 2,065,000 0.16SAExploration Holdings, Inc. 10%
15/07/2019 USD 500,000 232,500 0.02Safway Group Holding LLC, 144A 7%
15/05/2018 USD 1,575,000 1,578,937 0.12Sally Holdings LLC 5.625% 01/12/2025 USD 2,500,000 2,618,700 0.20SBA Communications Corp. 4.875%
15/07/2022 USD 2,500,000 2,493,575 0.19Select Medical Corp. 6.375%
01/06/2021 USD 1,000,000 955,745 0.07Seminole Hard Rock Entertainment, Inc.,
144A 5.875% 15/05/2021 USD 1,250,000 1,259,375 0.10Shape Technologies Group, Inc., 144A
7.625% 01/02/2020 USD 1,504,000 1,500,240 0.12Silgan Holdings, Inc. 5% 01/04/2020 USD 2,000,000 2,044,820 0.16Sonic Automotive, Inc. 5% 15/05/2023 USD 1,348,000 1,324,410 0.10Speedway Motorsports, Inc. 5.125%
01/02/2023 USD 2,215,000 2,237,150 0.17Standard Industries, Inc., 144A 5.375%
15/11/2024 USD 2,000,000 2,045,000 0.16Suburban Propane Partners LP 5.5%
01/06/2024 USD 1,000,000 985,680 0.08Suburban Propane Partners LP 5.75%
01/03/2025 USD 1,250,000 1,236,675 0.10Sugarhouse HSP Gaming Prop Mezz LP,
144A 6.375% 01/06/2021 USD 1,122,000 1,113,585 0.09Summit Materials LLC 6.125%
15/07/2023 USD 1,900,000 1,863,482 0.14Tempur Sealy International, Inc., 144A
5.5% 15/06/2026 USD 1,750,000 1,719,375 0.13T-Mobile USA, Inc. 6.836% 28/04/2023 USD 2,500,000 2,642,625 0.20Tops Holding LLC, 144A 8%
15/06/2022 USD 1,500,000 1,327,500 0.10United Rentals North America, Inc. 5.75%
15/11/2024 USD 2,000,000 2,013,740 0.16Verizon Communications, Inc. 4.672%
15/03/2055 USD 2,675,000 2,709,882 0.21Whole Foods Market, Inc., 144A 5.2%
03/12/2025 USD 3,025,000 3,252,404 0.25Wynn Las Vegas LLC, 144A 5.5%
01/03/2025 USD 2,750,000 2,657,188 0.20XPO Logistics, Inc., 144A 7.875%
01/09/2019 USD 1,250,000 1,281,250 0.10Zachry Holdings, Inc., 144A 7.5%
01/02/2020 USD 2,180,000 2,169,100 0.17
201,331,800 15.52
VenezuelaPetroleos de Venezuela SA, Reg. S 9%
17/11/2021 USD 3,500,000 1,524,880 0.12
1,524,880 0.12
Total Corporate Bonds 428,545,054 33.02
SCHEDULE OF INVESTMENTSAs at 30 June 2016
Investments Currency
Quantity/Nominal
Value
Market Value USD
% of Net Assets
Transferable securities and money market instruments admitted to official exchange listing or dealt in on another regulated market
Government Bonds
ArgentinaArgentine Republic Government
International Bond, 144A 7.5% 22/04/2026 USD 1,650,000 1,793,789 0.14
Argentine Republic Government International Bond, 144A 7.5% 22/04/2026 USD 4,850,000 5,269,137 0.41
7,062,926 0.55
AustraliaAustralia Government Bond, Reg. S 3.25%
21/04/2025 AUD 20,700,000 17,009,190 1.31
17,009,190 1.31
BermudaBermuda Government International Bond,
Reg. S 4.854% 06/02/2024 USD 2,430,000 2,656,051 0.20
2,656,051 0.20
BrazilBrazil Letras do Tesouro Nacional 0%
01/01/2019 BRL 12,440,000 29,038,665 2.24Brazilian Government International Bond
6% 07/04/2026 USD 6,500,000 7,020,000 0.54
36,058,665 2.78
CanadaCanadian Government Bond 1.5%
01/06/2023 CAD 12,000,000 9,683,958 0.75
9,683,958 0.75
ColombiaColombia Government International Bond
4.5% 28/01/2026 USD 6,400,000 6,860,960 0.53
6,860,960 0.53
Côte d’IvoireIvory Coast Government International Bond,
Reg. S, STEP 5.75% 31/12/2032 USD 2,970,000 2,767,372 0.21
2,767,372 0.21
CyprusCyprus Government International Bond,
Reg. S 3.875% 06/05/2022 EUR 5,500,000 6,266,699 0.48Cyprus Government International Bond,
Reg. S 4.25% 04/11/2025 EUR 5,495,000 6,306,889 0.49
12,573,588 0.97

169 Morgan Stanley Investment Funds 30 June 2016
The accompanying notes are an integral part of these financial statements.
Global Fixed Income Opportunities Fund (continued)
SCHEDULE OF INVESTMENTSAs at 30 June 2016
Investments Currency
Quantity/Nominal
Value
Market Value USD
% of Net Assets
Transferable securities and money market instruments admitted to official exchange listing or dealt in on another regulated market
Government Bonds (continued)
Dominican RepublicDominican Republic International Bond,
Reg. S 5.5% 27/01/2025 USD 6,700,000 6,836,680 0.53
6,836,680 0.53
GreeceHellenic Republic Government Bond,
Reg. S, STEP 3% 24/02/2023 EUR 650,000 531,726 0.04Hellenic Republic Government Bond,
Reg. S, STEP 3% 24/02/2024 EUR 650,000 529,804 0.04Hellenic Republic Government Bond,
Reg. S, STEP 3% 24/02/2025 EUR 650,000 506,416 0.04Hellenic Republic Government Bond,
Reg. S, STEP 3% 24/02/2026 EUR 650,000 497,335 0.04Hellenic Republic Government Bond,
Reg. S, STEP 3% 24/02/2027 EUR 650,000 498,083 0.04Hellenic Republic Government Bond,
Reg. S, STEP 3% 24/02/2028 EUR 650,000 487,822 0.04Hellenic Republic Government Bond,
Reg. S, STEP 3% 24/02/2029 EUR 650,000 474,272 0.04Hellenic Republic Government Bond,
Reg. S, STEP 3% 24/02/2030 EUR 650,000 465,275 0.04Hellenic Republic Government Bond,
Reg. S, STEP 3% 24/02/2031 EUR 650,000 458,305 0.04Hellenic Republic Government Bond,
Reg. S, STEP 3% 24/02/2032 EUR 650,000 452,338 0.04Hellenic Republic Government Bond,
Reg. S, STEP 3% 24/02/2033 EUR 650,000 445,692 0.03Hellenic Republic Government Bond,
Reg. S, STEP 3% 24/02/2034 EUR 650,000 440,821 0.03Hellenic Republic Government Bond,
Reg. S, STEP 3% 24/02/2035 EUR 650,000 446,275 0.04Hellenic Republic Government Bond,
Reg. S, STEP 3% 24/02/2036 EUR 650,000 440,675 0.03Hellenic Republic Government Bond,
Reg. S, STEP 3% 24/02/2037 EUR 650,000 434,030 0.03Hellenic Republic Government Bond,
Reg. S, STEP 3% 24/02/2038 EUR 650,000 435,617 0.03Hellenic Republic Government Bond,
Reg. S, STEP 3% 24/02/2039 EUR 650,000 430,297 0.03Hellenic Republic Government Bond,
Reg. S, STEP 3% 24/02/2040 EUR 650,000 430,553 0.03Hellenic Republic Government Bond,
Reg. S, STEP 3% 24/02/2041 EUR 650,000 430,969 0.03Hellenic Republic Government Bond,
Reg. S, STEP 3% 24/02/2042 EUR 650,000 435,021 0.03
9,271,326 0.71
HungaryHungary Government Bond 7.5%
12/11/2020 HUF 1,726,000,000 7,412,338 0.57Hungary Government Bond 6%
24/11/2023 HUF 6,200,000,000 26,318,232 2.03Hungary Government International Bond
5.75% 22/11/2023 USD 8,400,000 9,574,614 0.74
43,305,184 3.34
SCHEDULE OF INVESTMENTSAs at 30 June 2016
Investments Currency
Quantity/Nominal
Value
Market Value USD
% of Net Assets
Transferable securities and money market instruments admitted to official exchange listing or dealt in on another regulated market
Government Bonds (continued)
IndonesiaIndonesia Government International Bond,
Reg. S 5.875% 15/01/2024 USD 16,300,000 18,911,553 1.46
18,911,553 1.46
New ZealandNew Zealand Government Bond, Reg. S
5.5% 15/04/2023 NZD 15,000,000 12,968,781 1.00New Zealand Government Bond, Reg. S
4.5% 15/04/2027 NZD 9,500,000 8,126,049 0.63New Zealand Government Bond, Reg. S
3.5% 14/04/2033 NZD 6,300,000 4,979,945 0.38
26,074,775 2.01
PeruPeruvian Government International Bond
4.125% 25/08/2027 USD 6,300,000 6,901,366 0.53
6,901,366 0.53
PolandPoland Government Bond 2.5%
25/07/2026 PLN 94,000,000 22,798,040 1.76
22,798,040 1.76
PortugalPortugal Obrigacoes do Tesouro OT,
Reg. S, 144A 5.65% 15/02/2024 EUR 9,000,000 11,915,329 0.92
11,915,329 0.92
RomaniaRomania Government Bond 4.75%
24/02/2025 RON 35,000,000 9,452,969 0.73
9,452,969 0.73
RussiaRussian Foreign Bond, Reg. S 4.875%
16/09/2023 USD 6,000,000 6,556,800 0.50
6,556,800 0.50
SerbiaRepublic of Serbia, Reg. S 7.25%
28/09/2021 USD 5,900,000 6,765,530 0.52
6,765,530 0.52
South AfricaSouth Africa Government Bond 8%
31/01/2030 ZAR 444,000,000 27,391,769 2.11
27,391,769 2.11

Morgan Stanley Investment Funds 30 June 2016 170
The accompanying notes are an integral part of these financial statements.
Global Fixed Income Opportunities Fund (continued)
SCHEDULE OF INVESTMENTSAs at 30 June 2016
Investments Currency
Quantity/Nominal
Value
Market Value USD
% of Net Assets
Transferable securities and money market instruments admitted to official exchange listing or dealt in on another regulated market
Government Bonds (continued)
United KingdomUK Treasury, Reg. S 2% 07/09/2025 GBP 20,900,000 30,652,123 2.36
30,652,123 2.36
United States of AmericaUS Treasury 0.625% 15/12/2016 USD 13,100,000 13,117,399 1.01US Treasury 3.5% 15/02/2039 USD 45,800,000 57,983,515 4.47US Treasury 2.5% 15/02/2045 USD 4,800,000 5,015,625 0.39
76,116,539 5.87
Total Government Bonds 397,622,693 30.65
Mortgage and Asset Backed Securities
GermanyTaurus Ltd., Reg. S, FRN, Series 2015-DE2
‘F’ 4.4% 01/02/2026 (Ireland) (2) EUR 3,000,000 3,168,174 0.25
3,168,174 0.25
GreeceGrifonas Finance plc, Reg. S, FRN,
Series 1 ‘A’ 0.152% 28/08/2039 (United Kingdom) (2) EUR 3,114,278 2,406,267 0.19
2,406,267 0.19
IrelandCredit Suisse European Mortgage Capital
Ltd., FRN, Series 2015-1HWA ‘A’, 144A 2.75% 20/04/2020 (3) EUR 4,705,373 4,916,840 0.38
Credit Suisse European Mortgage Capital Ltd., IO, STEP, Series 2015-1HWA ‘AX’, 144A 0.25% 20/04/2020 (3) EUR 4,705,373 34,000 0.00
4,950,840 0.38
ItalyTibet CMBS SRL, Reg. S, FRN, Series 1 ‘D’
4.15% 09/12/2026 EUR 1,469,828 1,605,326 0.12
1,605,326 0.12
SpainIM Pastor 4 FTA, Reg. S, FRN, Series 4 ‘A’
0% 22/03/2044 EUR 1,555,046 1,308,791 0.10
1,308,791 0.10
United KingdomALBA plc, Reg. S, FRN, Series 2006-2 ‘E’
1.522% 15/12/2038 GBP 869,232 862,343 0.07ALBA plc, Reg. S, FRN, Series 2015-1 ‘C’
2.603% 24/04/2049 GBP 1,600,000 1,982,154 0.15ALBA plc, Reg. S, FRN, Series 2015-1 ‘E’
3.203% 24/04/2049 GBP 5,000,000 5,842,269 0.45Eurosail-UK plc, Reg. S, FRN, Series
2007- 4X ‘A5’ 1.524% 13/06/2045 GBP 1,222,000 1,336,827 0.10
SCHEDULE OF INVESTMENTSAs at 30 June 2016
Investments Currency
Quantity/Nominal
Value
Market Value USD
% of Net Assets
Transferable securities and money market instruments admitted to official exchange listing or dealt in on another regulated market
Mortgage and Asset Backed Securities (continued)
United Kingdom (continued)Logistics UK 2015 plc, FRN, Series
2015-1A ‘E’, 144A 3.99% 20/08/2025 GBP 2,400,000 3,072,032 0.24Money Partners Securities 4 plc, Reg. S,
FRN, Series 4X ‘B2’ 5.372% 15/03/2040 GBP 854,180 1,069,485 0.08
Paragon Mortgages No. 13 plc, Reg. S, FRN, Series 13X ‘C1A’ 1.388% 15/01/2039 GBP 3,000,000 2,983,375 0.23
THRONES plc, Reg. S, FRN, Series 2015-1 ‘D’ 2.836% 18/03/2050 GBP 1,881,000 2,190,963 0.17
THRONES plc, Reg. S, FRN, Series 2015-1 ‘E’ 3.536% 18/03/2050 GBP 2,502,000 2,862,167 0.22
22,201,615 1.71
United States of AmericaAdjustable Rate Mortgage Trust, FRN,
Series 2004-5 ‘5A1’ 4.952% 25/04/2035 USD 1,943,513 1,872,038 0.14
Alternative Loan Trust, FRN, Series 2005-36 ‘4A1’ 2.785% 25/08/2035 USD 938,819 838,633 0.06
Alternative Loan Trust, FRN, Series 2005-43 ‘3A1’ 2.383% 25/10/2035 USD 2,308,142 1,912,160 0.15
Alternative Loan Trust, FRN, Series 2006-29T1 ‘2A16’ 0.903% 25/10/2036 USD 1,617,636 952,191 0.07
Alternative Loan Trust, FRN, Series 2006-HY10 ‘3A1’ 2.736% 25/05/2036 USD 2,610,905 1,756,849 0.14
Alternative Loan Trust, FRN, Series 2006-OA22 ‘A1’ 0.613% 25/02/2047 USD 1,022,132 817,369 0.06
Alternative Loan Trust, FRN, Series 2007-16CB ‘4A1’ 0.853% 25/08/2037 USD 222,272 162,618 0.01
Alternative Loan Trust, FRN, Series 2007-OA2 ‘2A1’ 0.583% 25/03/2047 USD 5,534,967 3,938,689 0.30
Alternative Loan Trust, FRN, Series 2007-OA7 ‘A1A’ 0.633% 25/05/2047 USD 824,377 660,341 0.05
Alternative Loan Trust, Series 2005-86CB ‘A11’ 5.5% 25/02/2036 USD 21,932 18,183 0.00
Alternative Loan Trust, Series 2005-86CB ‘A4’ 5.5% 25/02/2036 USD 37,736 31,285 0.00
Alternative Loan Trust, Series 2006-36T2 ‘2A5’ 6% 25/12/2036 USD 136,850 92,389 0.01
Alternative Loan Trust, Series 2006-4CB ‘1A1’ 6% 25/04/2036 USD 199,936 161,351 0.01
Alternative Loan Trust, Series 2006-6CB ‘1A10’ 5.5% 25/05/2036 USD 466,853 394,388 0.03
Alternative Loan Trust, Series 2007-5CB ‘1A12’ 6% 25/04/2037 USD 375,636 303,254 0.02
Alternative Loan Trust, Series 2007-5CB ‘1A13’ 6% 25/04/2037 USD 1,522,044 1,228,757 0.09
Alternative Loan Trust, Series 2007-5CB ‘1A31’ 5.5% 25/04/2037 USD 791,623 612,478 0.05
Alternative Loan Trust, Series 2008-2R ‘4A1’ 6.25% 25/08/2037 USD 363,068 281,931 0.02
American Home Mortgage Assets Trust, FRN, Series 2006-3 ‘1A1’ 1.407% 25/10/2046 USD 1,618,132 1,267,283 0.10
American Home Mortgage Assets Trust, FRN, Series 2007-2 ‘A1’ 0.578% 25/03/2047 USD 837,321 608,265 0.05
American Home Mortgage Investment Trust, IO, Series 2007-1 ‘GIOP’ 2.078% 25/05/2047 USD 14,468,222 2,644,502 0.20
American Home Mortgage Investment Trust, STEP, Series 2007-A ‘13A1’, 144A 6.1% 25/01/2037 USD 407,576 228,344 0.02

171 Morgan Stanley Investment Funds 30 June 2016
The accompanying notes are an integral part of these financial statements.
Global Fixed Income Opportunities Fund (continued)
SCHEDULE OF INVESTMENTSAs at 30 June 2016
Investments Currency
Quantity/Nominal
Value
Market Value USD
% of Net Assets
Transferable securities and money market instruments admitted to official exchange listing or dealt in on another regulated market
Mortgage and Asset Backed Securities (continued)
United States of America (continued)Asset-Backed Securities Corp. Home
Equity Loan Trust, FRN, Series 2006-HE2 ‘A3’ 0.643% 25/03/2036 USD 1,515,400 1,339,314 0.10
BAMLL Re-REMIC Trust, FRN, Series 2015-FR11 ‘A705’, 144A 1.875% 27/09/2044 USD 2,000,000 1,845,349 0.14
Banc of America Alternative Loan Trust, FRN, Series 2006-6 ‘CB1’ 1.103% 25/07/2046 USD 747,977 523,168 0.04
Banc of America Alternative Loan Trust, Series 2005-8 ‘2CB1’ 6% 25/09/2035 USD 1,024,724 983,898 0.08
Banc of America Alternative Loan Trust, Series 2006-2 ‘6A1’ 5.5% 25/03/2021 USD 0 0 0.00
Banc of America Alternative Loan Trust, Series 2006-4 ‘5CB1’ 6.5% 25/05/2046 USD 289,529 248,903 0.02
Banc of America Funding Trust, FRN, Series 2007-A ‘2A5’ 0.678% 20/02/2047 USD 2,528,557 2,095,150 0.16
Banc of America Funding Trust, Series 2007-5 ‘3A1’ 6% 25/07/2037 USD 120,090 88,561 0.01
Bayview Opportunity Master Fund IIIa Trust, STEP, Series 2014-16RP ‘A’, 144A 3.844% 28/11/2029 USD 574,934 574,837 0.04
BCAP LLC Trust, FRN, Series 2012-RR9 ‘1A2’, 144A 0.626% 26/07/2035 USD 2,823,248 2,258,853 0.17
Bear Stearns ALT-A Trust, FRN, Series 2006-3 ‘1A1’ 0.833% 25/05/2036 USD 8,609,409 7,134,035 0.55
Bear Stearns ALT-A Trust, FRN, Series 2006-3 ‘23A1’ 3.035% 25/05/2036 USD 2,507,735 1,918,616 0.15
Bear Stearns ARM Trust, FRN, Series 2007-3 ‘2A1’ 3.122% 25/05/2047 USD 887,407 762,785 0.06
Bear Stearns Asset-Backed Securities I Trust, FRN, Series 2006-HE8 ‘1A3’ 0.713% 25/10/2036 USD 3,007,000 2,137,875 0.16
Bear Stearns Asset-Backed Securities I Trust, FRN, Series 2007-HE4 ‘1A4’ 0.803% 25/05/2037 USD 3,868,110 2,340,212 0.18
Bear Stearns Structured Products, Inc., FRN, Series 2007-R6 ‘1A1’ 2.878% 26/01/2036 USD 1,865,834 1,465,082 0.11
BNC Mortgage Loan Trust, FRN, Series 2007-1 ‘A4’ 0.613% 25/03/2037 USD 4,900,000 3,604,193 0.28
CDC Mortgage Capital Trust, FRN, Series 2002-HE1 ‘A’ 1.073% 25/01/2033 USD 1,441,090 1,338,215 0.10
Chase Mortgage Finance Trust, FRN, Series 2007-A1 ‘11A4’ 2.756% 25/03/2037 USD 336,107 307,030 0.02
ChaseFlex Trust, Series 2007-1 ‘1A1’ 6.5% 25/02/2037 USD 239,144 164,140 0.01
CHL Mortgage Pass-Through Trust, FRN, Series 2004-20 ‘3A1’ 2.542% 25/09/2034 USD 2,727,721 2,199,050 0.17
CHL Mortgage Pass-Through Trust, Series 2004-5 ‘2A2’ 5.5% 25/05/2034 USD 1,929,607 1,969,469 0.15
CHL Mortgage Pass-Through Trust, Series 2006-9 ‘A3’ 6% 25/05/2036 USD 233,827 200,063 0.02
Citigroup Mortgage Loan Trust, FRN, Series 2006-AR1 ‘2A1’ 2.73% 25/03/2036 USD 98,513 94,695 0.01
Citigroup Mortgage Loan Trust, FRN, Series 2006-AR7 ‘2A2A’ 2.865% 25/11/2036 USD 921,204 821,911 0.06
SCHEDULE OF INVESTMENTSAs at 30 June 2016
Investments Currency
Quantity/Nominal
Value
Market Value USD
% of Net Assets
Transferable securities and money market instruments admitted to official exchange listing or dealt in on another regulated market
Mortgage and Asset Backed Securities (continued)
United States of America (continued)COMM Mortgage Trust, FRN,
Series 2013-CR6 ‘D’, 144A 4.311% 10/03/2046 USD 1,785,000 1,611,768 0.12
COMM Mortgage Trust, FRN, Series 2013-CR13 ‘D’, 144A 4.909% 10/12/2023 USD 1,290,000 1,191,240 0.09
COMM Mortgage Trust, FRN, Series 2014-CR16 ‘D’, 144A 5.068% 10/04/2047 USD 2,854,043 2,375,324 0.18
COMM Mortgage Trust, FRN, Series 2014-CR18 ‘D’, 144A 4.896% 15/07/2047 USD 401,000 315,552 0.02
COMM Mortgage Trust, FRN, Series 2014-KYO ‘F’, 144A 3.948% 11/06/2027 USD 3,000,000 2,958,157 0.23
COMM Mortgage Trust, FRN, Series 2015-DC1 ‘D’, 144A 4.498% 10/02/2048 USD 1,700,000 1,273,810 0.10
COMM Mortgage Trust, Series 2014-CR20 ‘D’, 144A 3.222% 10/11/2047 USD 3,410,000 2,444,305 0.19
COMM Mortgage Trust, Series 2014-UBS5 ‘D’, 144A 3.495% 10/09/2047 USD 1,317,000 932,690 0.07
Commercial Mortgage Trust, FRN, Series 2014-CR14 ‘D’, 144A 4.752% 10/02/2047 USD 900,000 747,021 0.06
Commercial Mortgage Trust, FRN, Series 2014-CR14 ‘XA’ 0.851% 10/02/2047 USD 14,967,974 547,380 0.04
COOF Securitization Trust, FRN, Series 2015-1 ‘A’, 144A 2.821% 25/10/2040 USD 17,763,977 2,222,178 0.17
COOF Securitization Trust II, IO, FRN, Series 2015-2 ‘A1’, 144A 2.226% 25/08/2041 USD 22,521,641 2,332,713 0.18
Countrywide Alternative Loan Trust, Series 2007-15CB ‘A7’ 6% 25/07/2037 USD 307,750 259,310 0.02
Credit-Based Asset Servicing and Securitization LLC, FRN, Series 2006-CB4 ‘AV3’ 0.603% 25/05/2036 USD 6,136,611 4,424,308 0.34
CSMC Mortgage-Backed Trust, FRN, Series 2006-7 ‘3A1’ 0.753% 25/08/2036 USD 658,113 451,616 0.03
CSMC Mortgage-Backed Trust, FRN, Series 2007-3 ‘1A2’ 5.587% 25/04/2037 USD 4,743,720 2,351,579 0.18
CSMC Mortgage-Backed Trust, FRN, Series 2007-3 ‘1A3A’ 5.746% 25/04/2037 USD 1,020,268 510,551 0.04
CSMC Mortgage-Backed Trust, Series 2006-4 ‘10A1’ 6.5% 25/05/2036 USD 8,634,171 4,380,352 0.34
CSMC Mortgage-Backed Trust, Series 2007-5 ‘1A11’ 6.548% 25/08/2037 USD 3,579,271 2,761,380 0.21
CSMC Trust, FRN, Series 2014-RPL4 ‘A2’, 144A 4.72% 25/08/2062 USD 2,391,000 2,352,510 0.18
CSMC Trust, FRN, Series 2015-RPL2 ‘A2’, 144A 4.715% 25/11/2057 USD 3,600,000 3,631,697 0.28
CVS Pass-Through Trust, Series 2014, 144A 4.163% 11/08/2036 USD 1,444,242 1,489,732 0.11
CWABS Asset-Backed Certificates Trust, FRN, Series 2006-9 ‘1AF4’ 4.841% 25/10/2046 USD 6,883,674 4,612,728 0.36
CWABS Asset-Backed Certificates Trust, FRN, Series 2006-9 ‘3AV4’ 0.693% 25/10/2046 USD 6,690,945 5,020,626 0.39

Morgan Stanley Investment Funds 30 June 2016 172
The accompanying notes are an integral part of these financial statements.
Global Fixed Income Opportunities Fund (continued)
SCHEDULE OF INVESTMENTSAs at 30 June 2016
Investments Currency
Quantity/Nominal
Value
Market Value USD
% of Net Assets
Transferable securities and money market instruments admitted to official exchange listing or dealt in on another regulated market
Mortgage and Asset Backed Securities (continued)
United States of America (continued)DBUBS Mortgage Trust, Series 2011-LC3A
‘A2’ 3.642% 10/08/2044 USD 28,614 28,606 0.00EMC Mortgage Loan Trust, FRN,
Series 2004-C ‘M1’, 144A 1.446% 25/11/2030 USD 1,471,000 1,284,123 0.10
FHLMC, FRN, Series 2013-DN2 ‘M2’ 4.703% 25/11/2023 USD 3,600,000 3,610,518 0.28
FHLMC, FRN, Series 2014-DN2 ‘M3’ 4.053% 25/04/2024 USD 1,594,029 1,545,404 0.12
FHLMC, FRN, Series 2014-DN3 ‘M3’ 4.453% 25/08/2024 USD 3,002,000 2,986,257 0.23
FHLMC, FRN, Series 2014-DN4 ‘M3’ 5.003% 25/10/2024 USD 2,595,000 2,647,714 0.20
FHLMC, FRN, Series 2014-HQ2 ‘M3’ 4.203% 25/09/2024 USD 2,767,000 2,661,191 0.21
FHLMC REMIC, IO, FRN, Series 4002 ‘ES’ 1.782% 15/02/2038 USD 7,194,237 476,578 0.04
Fieldstone Mortgage Investment Trust, FRN, Series 2007-1 ‘2A2’ 0.723% 25/04/2047 USD 5,431,083 3,822,142 0.29
First Horizon Alternative Mortgage Securities Trust, Series 2006-FA4 ‘1A1’ 6% 25/08/2036 USD 570,223 474,281 0.04
First Horizon Alternative Mortgage Securities Trust, Series 2006-FA5 ‘A3’ 6.25% 25/08/2036 USD 909,780 728,849 0.06
FNMA Connecticut Avenue Securities, FRN, Series 2014-C04 ‘1M2’ 5.353% 25/11/2024 USD 5,038,000 5,148,597 0.40
FNMA Connecticut Avenue Securities, FRN, Series 2015-C02 ‘1M2’ 4.453% 25/05/2025 USD 3,577,000 3,581,039 0.28
FNMA REMIC, IO, FRN, Series 2012-63 ‘HS’ 6.097% 25/08/2041 USD 685,584 107,690 0.01
FNMA REMIC, IO, FRN, Series 2014-10 ‘CS’ 1.874% 25/03/2044 USD 9,037,296 622,125 0.05
FNMA REMIC, IO, FRN, Series 2014-23 ‘SA’ 1.950% 25/10/2039 USD 16,375,141 1,266,745 0.10
GNMA, IO, FRN, Series 2012-149 ‘MS’ 5.802% 20/12/2042 USD 11,961,578 1,897,770 0.15
GreenPoint Mortgage Funding Trust, FRN, Series 2006-AR1 ‘A1A’ 0.743% 25/02/2036 USD 1,034,232 885,701 0.07
GreenPoint Mortgage Funding Trust, FRN, Series 2006-OH1 ‘A1’ 0.633% 25/01/2037 USD 3,019,945 2,432,126 0.19
GreenPoint Mortgage Funding Trust, FRN, Series 2007-AR1 ‘3A2’ 0.613% 25/02/2037 USD 2,328,745 1,947,437 0.15
GS Mortgage Securities Trust, FRN, Series 2014-GC24 ‘D’, 144A 4.529% 10/09/2047 USD 4,080,000 3,109,387 0.24
GS Mortgage Securities Trust, FRN, Series 2014-GC26 ‘D’, 144A 4.661% 10/11/2047 USD 3,000,000 2,335,992 0.18
GSAA Home Equity Trust, STEP, Series 2006-18 ‘AF5A’ 6.002% 25/11/2036 USD 2,588,476 1,640,873 0.13
GSAMP Trust, FRN, Series 2006-HE2 ‘M1’ 0.773% 25/03/2046 USD 6,400,000 4,909,696 0.38
GSR Mortgage Loan Trust, FRN, Series 2005-AR3 ‘6A1’ 3.072% 25/05/2035 USD 79,453 73,814 0.01
GSR Mortgage Loan Trust, FRN, Series 2007-AR1 ‘1A1’ 2.913% 25/03/2037 USD 1,239,814 1,023,386 0.08
SCHEDULE OF INVESTMENTSAs at 30 June 2016
Investments Currency
Quantity/Nominal
Value
Market Value USD
% of Net Assets
Transferable securities and money market instruments admitted to official exchange listing or dealt in on another regulated market
Mortgage and Asset Backed Securities (continued)
United States of America (continued)HILT Mortgage Trust, FRN,
Series 2014-ORL ‘F’, 144A 4.192% 15/07/2029 USD 4,500,000 3,910,985 0.30
Impac CMB Trust, FRN, Series 2005-2 ‘1M2’ 1.188% 25/04/2035 USD 383,935 301,879 0.02
Impac Secured Assets Trust, FRN, Series 2006-2 ‘1A2B’ 0.623% 25/08/2036 USD 2,152,283 1,550,565 0.12
Invitation Homes Trust, FRN, Series 2015-SFR3 ‘F’, 144A 5.196% 17/08/2032 USD 5,929,000 5,889,869 0.45
J.P. Morgan Alternative Loan Trust, FRN, Series 2006-A6 ‘2A4’ 3.245% 25/11/2036 USD 57,706 61,781 0.00
J.P. Morgan Alternative Loan Trust, Series 2005-S1 ‘2A9’ 6% 25/12/2035 USD 317,073 293,024 0.02
J.P. Morgan Alternative Loan Trust, STEP, Series 2006-S3 ‘A3A’ 6% 25/08/2036 USD 601,529 581,868 0.04
J.P. Morgan Chase Commercial Mortgage Securities Trust, FRN, Series 2014-C20 ‘D’, 144A 4.724% 15/07/2047 USD 1,875,000 1,437,626 0.11
J.P. Morgan Chase Commercial Mortgage Securities Trust, FRN, Series 2014-CBMZ ‘M’, 144A 6.667% 15/10/2019 USD 1,500,000 1,457,742 0.11
J.P. Morgan Mortgage Trust, FRN, Series 2007-A4 ‘1A1’ 2.940% 25/06/2037 USD 580,386 507,726 0.04
J.P. Morgan Mortgage Trust, FRN, Series 2007-A4 ‘2A3’ 3.455% 25/06/2037 USD 233,303 215,693 0.02
JPMBB Commercial Mortgage Securities Trust, FRN, Series 2013-C15 ‘D’, 144A 5.212% 15/11/2045 USD 1,210,000 1,153,652 0.09
JPMBB Commercial Mortgage Securities Trust, FRN, Series 2014-C19 ‘D’, 144A 4.831% 15/04/2047 USD 1,104,000 896,197 0.07
JPMBB Commercial Mortgage Securities Trust, FRN, Series 2014-C21 ‘D’, 144A 4.816% 15/08/2047 USD 1,047,000 861,659 0.07
JPMBB Commercial Mortgage Securities Trust, FRN, Series 2014-C22 ‘D’, 144A 4.56% 15/09/2047 USD 961,000 757,251 0.06
JPMBB Commercial Mortgage Securities Trust, FRN, Series 2014-C23 ‘D’, 144A 3.959% 15/09/2047 USD 872,000 689,828 0.05
JPMBB Commercial Mortgage Securities Trust, FRN, Series 2015-C27 ‘D’, 144A 3.984% 15/02/2048 USD 2,000,000 1,453,630 0.11
JPMBB Commercial Mortgage Securities Trust, IO, FRN, Series 2014-C21 ‘XA’ 1.259% 15/08/2047 USD 10,943,536 716,279 0.06
JPMCC Re-REMIC Trust, FRN, Series 2014-FRR1 ‘BK10’, 144A 2.897% 27/11/2049 USD 1,600,000 1,321,904 0.10
KGS-Alpha SBA COOF Trust, FRN, Series 2015-2 ‘A’, 144A 2.800% 25/07/2041 USD 8,343,722 1,164,208 0.09
LB-UBS Commercial Mortgage Trust, FRN, Series 2007-C7 ‘AJ’ 6.449% 15/09/2045 USD 740,000 741,474 0.06
Lehman Mortgage Trust, Series 2006-1 ‘1A3’ 5.5% 25/02/2036 USD 563,110 456,377 0.04
Lehman Mortgage Trust, Series 2007-5 ‘9A2’ 6% 25/06/2037 USD 4,985,513 3,061,693 0.24
Lehman Mortgage Trust, Series 2007-8 ‘2A1’ 6.5% 25/09/2037 USD 792,990 602,879 0.05

173 Morgan Stanley Investment Funds 30 June 2016
The accompanying notes are an integral part of these financial statements.
Global Fixed Income Opportunities Fund (continued)
SCHEDULE OF INVESTMENTSAs at 30 June 2016
Investments Currency
Quantity/Nominal
Value
Market Value USD
% of Net Assets
Transferable securities and money market instruments admitted to official exchange listing or dealt in on another regulated market
Mortgage and Asset Backed Securities (continued)
United States of America (continued)Luminent Mortgage Trust, FRN,
Series 2006-4 ‘A1B’ 0.683% 25/05/2046 USD 78,830 8,263 0.00
Luminent Mortgage Trust, FRN, Series 2007-2 ‘2A1’ 0.683% 25/05/2037 USD 2,069,097 1,540,734 0.12
MASTR Adjustable Rate Mortgages Trust, FRN, Series 2007-R5 ‘A1’, 144A 2.904% 25/11/2035 USD 2,263,643 1,721,765 0.13
MASTR Alternative Loan Trust, Series 2006-3 ‘1A3’ 6.25% 25/07/2036 USD 2,121,400 1,805,510 0.14
MASTR Asset Securitization Trust, FRN, Series 2006-2 ‘1A11’ 6% 25/06/2036 USD 562,689 539,831 0.04
Mastr Specialized Loan Trust, FRN, Series 2007-2 ‘A’, 144A 0.803% 25/05/2037 USD 2,288,590 1,783,512 0.14
Merrill Lynch Mortgage Investors Trust, FRN, Series 2005-1 ‘2A2’ 2.458% 25/04/2035 USD 177,135 171,916 0.01
Merrill Lynch Mortgage Investors Trust, IO, FRN, Series 2006-A2 ‘XA’, 144A 2.135% 25/02/2036 USD 11,170,073 1,311,335 0.10
Merrill Lynch Mortgage Investors Trust, FRN, Series 2006-OPT1 ‘A2D’ 0.693% 25/08/2037 USD 3,650,000 2,183,369 0.17
MortgageIT Trust, FRN, Series 2005-4 ‘M1’ 0.903% 25/10/2035 USD 1,764,149 1,546,271 0.12
Nationstar HECM Loan Trust, Series 2016-1A ‘M2’, 144A 7.385% 25/02/2026 USD 2,500,000 2,515,675 0.19
Nomura Asset Acceptance Corp. Alternative Loan Trust, FRN, Series 2006-AR3 ‘A2’ 0.513% 25/10/2036 USD 1,064,187 782,110 0.06
NRPL Trust, FRN, Series 2014-2A ‘A2’, 144A 3.75% 25/10/2057 USD 3,050,000 3,120,184 0.24
Oakwood Mortgage Investors, Inc., FRN, Series 1999-D ‘A1’ 7.84% 15/11/2029 USD 2,088,631 2,092,338 0.16
Opteum Mortgage Acceptance Corp. Trust, FRN, Series 2006-1 ‘1AC1’ 0.753% 25/04/2036 USD 807,946 705,291 0.05
Ownit Mortgage Loan Trust, FRN, Series 2006-3 ‘A2D’ 0.723% 25/03/2037 USD 5,760,000 4,480,076 0.35
RALI Trust, Series 2006-QS16 ‘A10’ 6% 25/11/2036 USD 1,410,969 1,135,286 0.09
RALI Trust, Series 2006-QS16 ‘A9’ 6% 25/11/2036 USD 1,049,566 844,495 0.06
RALI Trust, Series 2006-QS4 ‘A2’ 6% 25/04/2036 USD 81,065 67,038 0.01
RALI Trust, Series 2006-QS8 ‘A1’ 6% 25/08/2036 USD 817,447 683,491 0.05
RALI Trust, Series 2007-QS2 ‘A1’ 6% 25/01/2037 USD 71,925 56,599 0.00
RALI Trust, Series 2007-QS4 ‘5A2’ 5.5% 25/04/2022 USD 233,931 238,167 0.02
RALI Trust, Series 2007-QS6 ‘A45’ 5.75% 25/04/2037 USD 265,635 220,270 0.02
RAMP Trust, FRN, Series 2005-RS9 ‘AI4’ 0.773% 25/11/2035 USD 2,617,020 2,148,138 0.17
RAMP Trust, STEP, Series 2003-RS3 ‘AI4’ 6.17% 25/04/2033 USD 493,461 491,754 0.04
RASC Trust, FRN, Series 2007-KS2 ‘AI4’ 0.673% 25/02/2037 USD 5,000,000 3,478,401 0.27
SCHEDULE OF INVESTMENTSAs at 30 June 2016
Investments Currency
Quantity/Nominal
Value
Market Value USD
% of Net Assets
Transferable securities and money market instruments admitted to official exchange listing or dealt in on another regulated market
Mortgage and Asset Backed Securities (continued)
United States of America (continued)Renaissance Home Equity Loan Trust,
STEP, Series 2005-1 ‘AF5’ 5.451% 25/05/2035 USD 750,000 751,453 0.06
Reperforming Loan REMIC Trust, Series 2004-R1 ‘3A’, 144A 7.5% 25/11/2034 USD 1,367,567 1,331,967 0.10
Reperforming Loan REMIC Trust, Series 2005-R1 ‘2A2’, 144A 6.5% 25/03/2035 USD 1,134,995 1,138,615 0.09
RMAT LLC, STEP, Series 2015-PR1 ‘A1’, 144A 4.826% 25/06/2035 USD 4,565,985 4,480,480 0.35
Silver Bay Realty Trust, FRN, Series 2014-1 ‘F’, 144A 3.996% 17/09/2031 USD 4,600,000 4,365,257 0.34
STARM Mortgage Loan Trust, FRN, Series 2007-4 ‘3A1’ 3.096% 25/10/2037 USD 934,399 834,553 0.06
Structured Adjustable Rate Mortgage Loan Trust, FRN, Series 2007-5 ‘2A1’ 3.028% 25/06/2037 USD 3,426,726 3,123,173 0.24
Structured Asset Mortgage Investments II Trust, FRN, Series 2006-AR6 ‘2A2’ 0.683% 25/07/2046 USD 72,688 27,291 0.00
Structured Asset Securities Corp. Trust, IO, FRN, Series 2005-RF5 ‘1AIO’, 144A 4.461% 25/07/2035 USD 10,985,948 2,049,426 0.16
Sunset Mortgage Loan Co. LLC, STEP, Series 2014-NPL2 ‘A’, 144A 3.721% 16/11/2044 USD 694,442 690,762 0.05
VOLT NPL X LLC, STEP, Series 2014-NPL8 ‘A2’, 144A 4.75% 26/10/2054 USD 3,519,061 3,416,206 0.26
VOLT XIX LLC, STEP, Series 2014-NP11 ‘A2’, 144A 5% 25/04/2055 USD 1,200,000 1,166,350 0.09
VOLT XXII LLC, STEP, Series 2015-NPL4 ‘A2’, 144A 4.25% 25/02/2055 USD 1,152,970 1,105,662 0.09
VOLT XXXI LLC, STEP, Series 2015-NPL2 ‘A2’, 144A 4.5% 25/02/2055 USD 2,695,552 2,597,425 0.20
VOLT XXXIII LLC, STEP, Series 2015-NPL5 ‘A2’, 144A 4.25% 25/03/2055 USD 4,859,463 4,651,969 0.36
Washington Mutual Mortgage Pass-Through Certificates WMALT Trust, FRN, Series 2006-AR12 ‘1A2’ 2.484% 25/10/2036 USD 1,339,351 1,168,678 0.09
Washington Mutual Mortgage Pass-Through Certificates WMALT Trust, FRN, Series 2006-AR3 ‘A1A’ 1.407% 25/05/2046 USD 3,524,408 2,667,507 0.21
Washington Mutual Mortgage Pass-Through Certificates WMALT Trust, FRN, Series 2007-OA4 ‘A1A’ 1.197% 25/04/2047 USD 1,142,085 832,665 0.06
Wells Fargo Commercial Mortgage Trust, Series 2014-LC16 ‘D’, 144A 3.938% 15/08/2050 USD 1,435,000 1,134,603 0.09
WFRBS Commercial Mortgage Trust, FRN, Series 2013-C13 ‘D’, 144A 4.275% 15/05/2045 USD 670,000 586,097 0.05
WFRBS Commercial Mortgage Trust, FRN, Series 2013-C16 ‘D’, 144A 5.149% 15/09/2046 USD 1,474,000 1,386,416 0.11
WFRBS Commercial Mortgage Trust, FRN, Series 2014-C22 ‘D’, 144A 3.908% 15/09/2057 USD 3,735,000 2,788,923 0.21

Morgan Stanley Investment Funds 30 June 2016 174
The accompanying notes are an integral part of these financial statements.
Global Fixed Income Opportunities Fund (continued)
SCHEDULE OF INVESTMENTSAs at 30 June 2016
Investments Currency
Quantity/Nominal
Value
Market Value USD
% of Net Assets
Transferable securities and money market instruments admitted to official exchange listing or dealt in on another regulated market
Mortgage and Asset Backed Securities (continued)
United States of America (continued)WFRBS Commercial Mortgage Trust, FRN,
Series 2014-C23 ‘D’, 144A 3.992% 15/10/2057 USD 1,926,000 1,461,567 0.11
WFRBS Commercial Mortgage Trust, FRN, Series 2014-C25 ‘D’, 144A 3.803% 15/11/2047 USD 4,780,000 3,359,701 0.26
WFRBS Commercial Mortgage Trust, Series 2014-C20 ‘D’, 144A 3.986% 15/05/2047 USD 3,529,000 2,592,581 0.20
WFRBS Commercial Mortgage Trust, Series 2014-C21 ‘D’, 144A 3.497% 15/08/2047 USD 2,000,000 1,428,711 0.11
WFRBS Commercial Mortgage Trust, Series 2014-C24 ‘D’, 144A 3.692% 15/11/2047 USD 1,074,000 769,334 0.06
277,310,250 21.37
Total Mortgage and Asset Backed Securities 312,951,263 24.12
Total Transferable securities and money market instruments admitted to official exchange listing or dealt in on another regulated market 1,188,818,046 91.62
Units of authorised UCITS or other collective investment undertakings
Collective Investment Schemes – UCITS
LuxembourgMorgan Stanley Liquidity Funds US Dollar
Liquidity Fund – MS Reserve (4) USD 64,171,039 64,171,039 4.95
64,171,039 4.95
Total Collective Investment Schemes – UCITS 64,171,039 4.95
Total Units of authorised UCITS or other collective investment undertakings 64,171,039 4.95
Total Investments 1,252,989,085 96.57
Cash 51,301,932 3.96
Other Assets/(Liabilities) (6,772,432) (0.53)
Total Net Assets 1,297,518,585 100.00
(1) All or part of this position is out on loan.(2) The country in brackets represents the country of incorporation of this security.(3) Security is valued at its fair value under the direction of the Board of Directors of the SICAV.(4) Affiliate managed by an affiliate of the Investment Adviser.
Financial Futures Contracts
Security DescriptionNumber of Contracts Currency
Global Exposure
USD
Unrealised Gain/(Loss)
USD
% of Net Assets
US 10 Year Note, 21/09/2016 (846) USD (112,451,906) (3,007,265) (0.23)
Unrealised Loss on Financial Futures Contracts (3,007,265) (0.23)
Total Unrealised Loss on Financial Futures Contracts (3,007,265) (0.23)
Net Unrealised Loss on Financial Futures Contracts (3,007,265) (0.23)
Forward Currency Exchange Contracts (continued)
Currency Purchased
Amount Purchased
Currency Sold
Amount Sold
Maturity Date Counterparty
Unrealised Gain/(Loss)
USD
% of Net Assets
MXN 605,000,000 USD 31,993,993 05/07/2016 HSBC 656,042 0.05MXN 24,300,000 USD 1,301,930 05/07/2016 J.P. Morgan 9,468 0.00MXN 2,450,000 USD 129,531 05/07/2016 State Street 2,688 0.00CAD 20,479,000 USD 15,762,923 07/07/2016 RBC 8,482 0.00USD 173,826 CAD 225,000 07/07/2016 RBC 547 0.00EUR 6,415,000 USD 7,068,425 08/07/2016 J.P. Morgan 63,724 0.01USD 5,802,093 EUR 5,150,000 08/07/2016 HSBC 76,361 0.01USD 11,319,200 EUR 9,950,000 08/07/2016 RBC 256,863 0.02USD 8,287,677 EUR 7,343,000 08/07/2016 UBS 123,784 0.01USD 209,182,266 EUR 187,572,000 08/07/2016 Westpac Banking 641,114 0.04NZD 11,100,000 USD 7,534,680 11/07/2016 Commonwealth
Bank of Australia 350,567 0.03NZD 6,730,000 USD 4,720,355 11/07/2016 J.P. Morgan 60,520 0.01PLN 26,420,000 USD 6,595,898 12/07/2016 UBS 51,134 0.00USD 29,533,182 HUF 8,275,490,000 12/07/2016 HSBC 492,957 0.04USD 7,255,420 HUF 2,000,000,000 12/07/2016 UBS 237,050 0.02USD 3,557,678 PLN 13,900,000 12/07/2016 J.P. Morgan 60,564 0.01USD 19,594,345 PLN 77,250,000 12/07/2016 State Street 158,948 0.01USD 7,848,390 PLN 30,000,000 12/07/2016 UBS 300,663 0.02USD 9,656,082 RON 39,000,000 12/07/2016 J.P. Morgan 65,695 0.00USD 6,814,644 NOK 57,000,000 13/07/2016 J.P. Morgan 8,639 0.00USD 6,441,457 NOK 53,400,000 13/07/2016 UBS 65,305 0.01USD 71,803,001 GBP 50,762,000 20/07/2016 HSBC 3,584,011 0.28USD 14,947,211 GBP 10,565,000 20/07/2016 J.P. Morgan 748,920 0.06USD 8,239,579 GBP 5,800,000 20/07/2016 RBC 444,966 0.03BRL 8,900,000 USD 2,644,324 21/07/2016 J.P. Morgan 112,242 0.01IDR 91,400,000,000 USD 6,842,854 21/07/2016 HSBC 93,584 0.01MYR 27,850,000 USD 6,784,079 21/07/2016 HSBC 191,213 0.02RUB 1,755,300,000 USD 26,286,784 21/07/2016 UBS 902,553 0.07JPY 711,378,000 USD 6,848,207 25/07/2016 ANZ 78,091 0.01JPY 1,075,987,000 USD 10,136,286 25/07/2016 Westpac Banking 340,010 0.03
Unrealised Gain on Forward Currency Exchange Contracts 10,186,705 0.81
CHF Hedged Share ClassCHF 8,826,906 USD 8,997,104 08/07/2016 J.P. Morgan 60,539 0.00
EUR Hedged Share ClassEUR 303,734 USD 334,778 01/07/2016 J.P. Morgan 2,865 0.00USD 54,745,375 EUR 48,372,003 01/07/2016 J.P. Morgan 973,123 0.07EUR 353,242,055 USD 390,410,229 08/07/2016 J.P. Morgan 2,321,655 0.16USD 24,427 EUR 21,967 08/07/2016 J.P. Morgan 5 0.00
DERIVATIVES
Over-the-counter (OTC) and exchange traded derivatives as at 30 June 2016, expressed in US dollars.
175 Morgan Stanley Investment Funds 30 June 2016
The accompanying notes are an integral part of these financial statements.
Global Fixed Income Opportunities Fund (continued)
DERIVATIVES (continued)
Over-the-counter (OTC) and exchange traded derivatives as at 30 June 2016, expressed in US dollars.
DERIVATIVES (continued)
Over-the-counter (OTC) and exchange traded derivatives as at 30 June 2016, expressed in US dollars.
Forward Currency Exchange Contracts (continued)
Currency Purchased
Amount Purchased
Currency Sold
Amount Sold
Maturity Date Counterparty
Unrealised Gain/(Loss)
USD
% of Net Assets
GBP Hedged Share ClassGBP 13,989 USD 18,658 08/07/2016 J.P. Morgan 140 0.00
Unrealised Gain on NAV Hedged Share Classes Forward Currency Exchange Contracts 3,358,327 0.23
Total Unrealised Gain on Forward Currency Exchange Contracts 13,545,032 1.04
MXN 321,500,000 USD 17,358,861 05/07/2016 J.P. Morgan (8,471) 0.00USD 9,259,165 MXN 172,800,000 05/07/2016 J.P. Morgan (66,333) 0.00USD 42,067,560 MXN 780,450,000 05/07/2016 State Street (50,985) 0.00CAD 310,000 USD 244,126 07/07/2016 J.P. Morgan (5,387) 0.00CAD 5,055,000 USD 3,969,198 07/07/2016 State Street (76,213) (0.01)USD 19,663,361 CAD 25,619,000 07/07/2016 RBC (66,490) (0.01)EUR 1,100,000 USD 1,251,065 08/07/2016 Commonwealth
Bank of Australia (28,093) 0.00EUR 5,900,000 USD 6,694,624 08/07/2016 J.P. Morgan (135,048) (0.01)EUR 15,500,000 USD 17,424,884 08/07/2016 Westpac Banking (192,099) (0.02)USD 6,455,399 EUR 5,860,000 08/07/2016 J.P. Morgan (59,705) (0.01)AUD 1,090,000 USD 825,976 11/07/2016 J.P. Morgan (15,642) 0.00AUD 11,930,000 USD 8,936,548 11/07/2016 State Street (67,477) (0.01)EUR 17,615,440 NZD 29,000,000 11/07/2016 Commonwealth
Bank of Australia (1,014,365) (0.08)NZD 19,928,000 USD 14,197,425 11/07/2016 HSBC (40,920) 0.00NZD 1,700,000 USD 1,230,446 11/07/2016 J.P. Morgan (22,796) 0.00USD 16,849,421 AUD 23,258,000 11/07/2016 Commonwealth
Bank of Australia (441,180) (0.03)USD 7,766,703 AUD 10,525,000 11/07/2016 J.P. Morgan (57,856) (0.01)USD 1,617,810 AUD 2,200,000 11/07/2016 Westpac Banking (17,728) 0.00USD 2,784,550 HKD 21,620,000 11/07/2016 HSBC (2,282) 0.00USD 31,372,720 NZD 46,222,000 11/07/2016 Commonwealth
Bank of Australia (1,462,586) (0.11)USD 408,667 NZD 590,000 11/07/2016 Westpac Banking (10,459) 0.00HUF 372,400,000 USD 1,351,554 12/07/2016 J.P. Morgan (44,734) 0.00PLN 2,150,000 USD 561,456 12/07/2016 J.P. Morgan (20,536) 0.00PLN 63,050,000 USD 16,150,232 12/07/2016 UBS (287,425) (0.03)RON 1,765,000 USD 445,910 12/07/2016 J.P. Morgan (11,883) 0.00USD 9,077,044 PLN 36,150,000 12/07/2016 J.P. Morgan (17,967) 0.00EUR 4,375,000 USD 4,989,167 13/07/2016 J.P. Morgan (124,198) (0.01)NOK 54,400,000 EUR 5,860,469 13/07/2016 J.P. Morgan (21,244) 0.00NOK 209,237,000 USD 25,652,871 13/07/2016 J.P. Morgan (669,221) (0.05)NOK 17,000,000 USD 2,084,644 13/07/2016 UBS (54,783) 0.00USD 6,428,720 EUR 5,800,000 13/07/2016 Commonwealth
Bank of Australia (20,838) 0.00USD 8,659,188 ZAR 129,700,000 15/07/2016 J.P. Morgan (133,986) (0.01)USD 9,466,680 ZAR 142,625,000 15/07/2016 State Street (202,760) (0.02)USD 9,804,072 ZAR 147,190,000 15/07/2016 UBS (174,859) (0.01)ZAR 11,245,000 USD 777,005 15/07/2016 J.P. Morgan (14,636) 0.00GBP 8,300,000 USD 12,401,246 20/07/2016 J.P. Morgan (1,246,886) (0.10)GBP 4,385,000 USD 6,436,742 20/07/2016 State Street (543,745) (0.04)USD 3,085,844 GBP 2,310,000 20/07/2016 J.P. Morgan (18,563) 0.00RUB 438,800,000 USD 6,800,728 21/07/2016 UBS (3,781) 0.00USD 22,274,611 BRL 77,950,000 21/07/2016 State Street (1,868,571) (0.14)USD 6,775,389 IDR 91,400,000,000 21/07/2016 HSBC (161,048) (0.01)USD 6,777,805 MYR 27,850,000 21/07/2016 HSBC (197,486) (0.02)USD 6,802,517 RUB 454,000,000 21/07/2016 UBS (229,876) (0.02)USD 6,493,937 JPY 685,000,000 25/07/2016 State Street (175,532) (0.01)USD 15,763,626 CAD 20,479,000 05/08/2016 RBC (9,502) 0.00USD 129,121 MXN 2,450,000 05/08/2016 State Street (2,715) 0.00
Unrealised Loss on Forward Currency Exchange Contracts (10,098,890) (0.77)
Forward Currency Exchange Contracts (continued)
Currency Purchased
Amount Purchased
Currency Sold
Amount Sold
Maturity Date Counterparty
Unrealised Gain/(Loss)
USD
% of Net Assets
CHF Hedged Share ClassCHF 8,853,345 USD 9,217,031 01/07/2016 J.P. Morgan (134,534) (0.01)USD 9,019,300 CHF 8,853,345 01/07/2016 J.P. Morgan (63,196) (0.01)USD 3,565 CHF 3,488 08/07/2016 J.P. Morgan (14) 0.00
EUR Hedged Share ClassEUR 402,864,603 USD 453,843,299 01/07/2016 J.P. Morgan (6,002,910) (0.47)USD 392,013,952 EUR 354,796,334 01/07/2016 J.P. Morgan (2,391,829) (0.18)EUR 542,522 USD 603,291 08/07/2016 J.P. Morgan (119) 0.00USD 8,738,493 EUR 7,899,417 08/07/2016 J.P. Morgan (44,019) 0.00
GBP Hedged Share ClassGBP 14,032 USD 20,580 01/07/2016 J.P. Morgan (1,725) 0.00USD 18,714 GBP 14,032 01/07/2016 J.P. Morgan (141) 0.00
Unrealised Loss on NAV Hedged Share Classes Forward Currency Exchange Contracts (8,638,487) (0.67)
Total Unrealised Loss on Forward Currency Exchange Contracts (18,737,377) (1.44)
Net Unrealised Loss on Forward Currency Exchange Contracts (5,192,345) (0.40)
Credit Default Swap Contracts
Nominal Amount Ccy Counterparty Reference Entity
Buy/Sell
Interest (Paid)/
ReceivedMaturity
Date
Market Value USD
Unrealised Gain/(Loss)
USD
% of Net Assets
5,977,000 USD Deutsche Bank CMBX.NA.BB.6 Sell 5.00% 11/05/2063 (833,042) (833,042) (0.06)4,500,000 USD Goldman Sachs CMBX.NA.BBB-.6 Sell 3.00% 11/05/2063 (348,010) (348,010) (0.03)
Total Unrealised Loss on Credit Default Swap Contracts (1,181,052) (1,181,052) (0.09)
Net Unrealised Loss on Credit Default Swap Contracts (1,181,052) (1,181,052) (0.09)
Collateral received and paid by the Fund in respect of financial derivative instruments:
Type of Collateral Counterparty CurrencyCollateral Amount
receivedCollateral Amount
paid
Global Fixed Income Opportunities Fund
Cash Deutsche Bank USD - 800,000Cash Goldman Sachs USD 4,913,912 636,502Cash HSBC USD 4,698,790 -Cash UBS USD 848,269 -
10,460,971 1,436,502

Morgan Stanley Investment Funds 30 June 2016 176
The accompanying notes are an integral part of these financial statements.
Please refer to the full prospectus for the Fund’s investment objective and policy.
INVESTMENT AIM
To provide an attractive rate of return, measured in US dollars, through investments worldwide primarily in fixed income securities issued by corporations that are rated lower than “BBB-” by S&P or “Baa3” by Moody’s or similarly by another internationally recognised rating service or determined to be of similar creditworthiness by the Investment Adviser.
SCHEDULE OF INVESTMENTSAs at 30 June 2016
Investments Currency
Quantity/Nominal
Value
Market Value USD
% of Net Assets
Transferable securities and money market instruments admitted to official exchange listing or dealt in on another regulated market
Corporate Bonds
AustraliaEmeco Pty. Ltd., 144A 9.875%
15/03/2019 USD 1,250,000 656,250 0.23Lonestar Resources America, Inc., 144A
8.75% 15/04/2019 (United States of America) (2) USD 1,750,000 647,500 0.23
Origin Energy Finance Ltd., Reg. S, FRN 7.875% 16/06/2071 EUR 1,000,000 1,093,337 0.39
2,397,087 0.85
BarbadosColumbus International, Inc., 144A 7.375%
30/03/2021 USD 1,300,000 1,371,565 0.49
1,371,565 0.49
BelgiumLBC Tank Terminals Holding Netherlands
BV, 144A 6.875% 15/05/2023 (Netherlands) (2) USD 1,200,000 1,164,000 0.41
1,164,000 0.41
CanadaAir Canada, 144A 7.75% 15/04/2021 USD 1,400,000 1,459,500 0.52Baytex Energy Corp., 144A 5.625%
01/06/2024 USD 1,500,000 1,211,250 0.43Concordia Healthcare Corp., 144A 7%
15/04/2023 USD 1,050,000 895,125 0.32HudBay Minerals, Inc. 9.5% 01/10/2020 USD 1,500,000 1,260,000 0.45Lundin Mining Corp., 144A 7.5%
01/11/2020 USD 1,300,000 1,331,525 0.47 Seven Generations Energy Ltd., 144A
8.25% 15/05/2020 USD 700,000 728,875 0.26
6,886,275 2.45
ChileVTR Finance BV, 144A 6.875%
15/01/2024 (Netherlands) (2) USD 1,000,000 1,002,705 0.36
1,002,705 0.36
ChinaBCP Singapore VI Cayman Financing Co.
Ltd., 144A 8% 15/04/2021 (Cayman Islands) (2) USD 500,000 433,840 0.15
433,840 0.15
FranceAlbea Beauty Holdings SA, Reg. S 8.75%
01/11/2019 (Luxembourg) (2) EUR 1,000,000 1,176,760 0.42BNP Paribas SA, Reg. S, FRN 6.125%
Perpetual EUR 250,000 266,359 0.09Eurofins Scientific SE, Reg. S, FRN 4.875%
Perpetual (Luxembourg) (2) EUR 500,000 552,310 0.20Europcar Groupe SA, Reg. S 5.75%
15/06/2022 EUR 1,150,000 1,330,832 0.47La Financiere Atalian SAS, Reg. S 7.25%
15/01/2020 EUR 1,000,000 1,183,913 0.42
Global High Yield Bond Fund

177 Morgan Stanley Investment Funds 30 June 2016
The accompanying notes are an integral part of these financial statements.
Global High Yield Bond Fund (continued)
SCHEDULE OF INVESTMENTSAs at 30 June 2016
Investments Currency
Quantity/Nominal
Value
Market Value USD
% of Net Assets
Transferable securities and money market instruments admitted to official exchange listing or dealt in on another regulated market
Corporate Bonds (continued)
France (continued)Oberthur Technologies Holding SAS,
Reg. S 9.25% 30/04/2020 EUR 1,250,000 1,479,037 0.53SGD Group SAS, Reg. S 5.625%
15/05/2019 EUR 1,500,000 1,709,838 0.61SMCP SAS, Reg. S 8.875% 15/06/2020 EUR 1,000,000 1,166,449 0.42Verallia Packaging SASU, Reg. S 5.125%
01/08/2022 EUR 500,000 571,886 0.20
9,437,384 3.36
GermanyPaternoster Holding III GmbH, Reg. S 8.5%
15/02/2023 (1) EUR 1,250,000 1,267,790 0.45Senvion Holding GmbH, Reg. S 6.625%
15/11/2020 EUR 1,500,000 1,725,821 0.62Trionista TopCo GmbH, Reg. S 6.875%
30/04/2021 EUR 500,000 586,710 0.21Unitymedia GmbH, Reg. S 3.75%
15/01/2027 EUR 1,250,000 1,275,593 0.45
4,855,914 1.73
ItalyWind Acquisition Finance SA, 144A 7.375%
23/04/2021 (Luxembourg) (2) USD 1,000,000 953,225 0.34
953,225 0.34
LuxembourgAltice Financing SA, Reg. S 6.5%
15/01/2022 EUR 1,250,000 1,467,517 0.52Altice Luxembourg SA, Reg. S 7.25%
15/05/2022 EUR 1,500,000 1,684,985 0.60Ardagh Finance Holdings SA, 144A
8.625% 15/06/2019 USD 345,252 349,568 0.12Ardagh Finance Holdings SA, Reg. S
8.375% 15/06/2019 EUR 1,177,758 1,341,830 0.48DH Services Luxembourg SARL, 144A
7.75% 15/12/2020 USD 800,000 842,000 0.30INEOS Group Holdings SA, 144A 5.875%
15/02/2019 USD 1,050,000 1,055,927 0.38 Intelsat Jackson Holdings SA, 144A 8%
15/02/2024 USD 1,000,000 982,500 0.35
7,724,327 2.75
NetherlandsConstellium NV, Reg. S 4.625%
15/05/2021 EUR 1,000,000 887,561 0.32JLL, 144A 8.75% 01/05/2020 USD 1,050,000 1,039,500 0.37Playa Resorts Holding BV, 144A 8%
15/08/2020 USD 1,204,000 1,216,040 0.43
3,143,101 1.12
RomaniaCable Communications Systems NV,
Reg. S 7.5% 01/11/2020 (Netherlands) (2) EUR 1,250,000 1,459,041 0.52
1,459,041 0.52
SCHEDULE OF INVESTMENTSAs at 30 June 2016
Investments Currency
Quantity/Nominal
Value
Market Value USD
% of Net Assets
Transferable securities and money market instruments admitted to official exchange listing or dealt in on another regulated market
Corporate Bonds (continued)
SingaporeGlobal A&T Electronics Ltd., 144A 10%
01/02/2019 (Cayman Islands) (2) USD 1,200,000 837,000 0.30
837,000 0.30
SpainBanco Bilbao Vizcaya Argentaria SA,
Reg. S, FRN 6.75% Perpetual EUR 1,000,000 957,728 0.34Bilbao Luxembourg SA, Reg. S 11.063%
01/12/2018 (Luxembourg) (2) EUR 803,327 872,802 0.31Campofrio Food Group SA, Reg. S 3.375%
15/03/2022 EUR 1,500,000 1,691,896 0.60PortAventura Entertainment Barcelona BV,
Reg. S 7.25% 01/12/2020 (Netherlands) (2) EUR 1,000,000 1,159,668 0.41
4,682,094 1.66
SwitzerlandVistaJet Malta Finance plc, 144A 7.75%
01/06/2020 (Malta) (2) USD 1,400,000 630,000 0.22
630,000 0.22
United KingdomAlgeco Scotsman Global Finance plc, 144A
8.5% 15/10/2018 USD 800,000 652,000 0.23Algeco Scotsman Global Finance plc, 144A
10.75% 15/10/2019 USD 1,080,000 527,850 0.19CEVA Group plc, 144A 4% 01/05/2018 USD 1,825,000 1,633,375 0.58Debenhams plc, Reg. S 5.25%
15/07/2021 GBP 1,000,000 1,279,586 0.45HSS Financing plc, Reg. S 6.75%
01/08/2019 GBP 850,000 1,116,066 0.40Hydra Dutch Holdings 2 BV, Reg. S, FRN
5.251% 15/04/2019 (Netherlands) (2) EUR 536,000 596,107 0.21Hydra Dutch Holdings 2 BV, Reg. S 8%
15/04/2019 (Netherlands) (2) EUR 362,790 435,456 0.15Iceland Bondco plc, Reg. S 6.75%
15/07/2024 GBP 1,000,000 1,149,854 0.41Ineos Finance plc, Reg. S 4%
01/05/2023 EUR 1,000,000 1,069,236 0.38Interoute Finco plc, Reg. S 7.375%
15/10/2020 EUR 1,000,000 1,184,730 0.42Jaguar Land Rover Automotive plc, Reg. S
3.875% 01/03/2023 GBP 500,000 633,239 0.22Lloyds Banking Group plc, Reg. S, FRN
6.375% Perpetual EUR 1,000,000 1,043,130 0.37Melton Renewable Energy UK plc, Reg. S
6.75% 01/02/2020 GBP 900,000 1,216,716 0.43Mizzen Bondco Ltd., Reg. S 7%
01/05/2021 (Cayman Islands) (2) GBP 605,133 782,073 0.28Pizzaexpress Financing 2 plc, Reg. S
6.625% 01/08/2021 GBP 1,100,000 1,392,741 0.50Sable International Finance Ltd., 144A
6.875% 01/08/2022 (Cayman Islands) (2) USD 1,000,000 1,009,320 0.36
Virgin Media Secured Finance plc, 144A 5.5% 15/08/2026 USD 1,000,000 971,300 0.35
16,692,779 5.93

Morgan Stanley Investment Funds 30 June 2016 178
The accompanying notes are an integral part of these financial statements.
Global High Yield Bond Fund (continued)
SCHEDULE OF INVESTMENTSAs at 30 June 2016
Investments Currency
Quantity/Nominal
Value
Market Value USD
% of Net Assets
Transferable securities and money market instruments admitted to official exchange listing or dealt in on another regulated market
Corporate Bonds (continued)
United States of AmericaAcadia Healthcare Co., Inc. 5.125%
01/07/2022 USD 996,000 981,060 0.35 Acadia Healthcare Co., Inc. 5.625%
15/02/2023 USD 800,000 796,096 0.28Accuride Corp. 9.5% 01/08/2018 USD 1,515,000 1,393,800 0.50ADS Tactical, Inc., 144A 11% 01/04/2018 USD 1,250,000 1,281,250 0.46Ahern Rentals, Inc., 144A 7.375%
15/05/2023 USD 1,750,000 1,216,250 0.43Alere, Inc., 144A 6.375% 01/07/2023 USD 750,000 787,500 0.28Allied Specialty Vehicles, Inc., 144A 8.5%
01/11/2019 USD 1,250,000 1,271,875 0.45Ally Financial, Inc. 4.125% 30/03/2020 USD 500,000 500,868 0.18American Airlines Group, Inc., 144A 5.5%
01/10/2019 USD 1,200,000 1,192,500 0.42American Builders & Contractors Supply
Co., Inc., 144A 5.625% 15/04/2021 USD 1,000,000 1,037,500 0.37American Gilsonite Co., 144A 11.5%
01/09/2017 USD 1,750,000 1,058,750 0.38Amsurg Corp. 5.625% 15/07/2022 USD 1,175,000 1,203,641 0.43Apex Tool Group LLC, 144A 7%
01/02/2021 USD 1,650,000 1,431,375 0.51APX Group, Inc. 6.375% 01/12/2019 USD 1,100,000 1,085,904 0.39Aramark Services, Inc., 144A 4.75%
01/06/2026 USD 750,000 738,802 0.26Aramark Services, Inc. 5.125%
15/01/2024 USD 750,000 764,816 0.27Argos Merger Sub, Inc., 144A 7.125%
15/03/2023 USD 1,250,000 1,273,463 0.45Artesyn Embedded Technologies, Inc.,
144A 9.75% 15/10/2020 USD 1,500,000 1,327,500 0.47Associated Asphalt Partners LLC, 144A
8.5% 15/02/2018 USD 1,755,000 1,763,775 0.63Associated Materials LLC 9.125%
01/11/2017 USD 1,000,000 895,000 0.32AV Homes, Inc. 8.5% 01/07/2019 USD 1,500,000 1,481,250 0.53Bankrate, Inc., 144A 6.125%
15/08/2018 USD 1,350,000 1,356,750 0.48Beacon Roofing Supply, Inc. 6.375%
01/10/2023 USD 1,150,000 1,210,375 0.43Belden, Inc., 144A 5.25% 15/07/2024 USD 900,000 875,250 0.32 Beverages & More, Inc., 144A 10%
15/11/2018 USD 1,800,000 1,626,750 0.58BI-LO LLC, 144A 9.25% 15/02/2019 USD 1,250,000 1,068,750 0.38Blue Cube Spinco, Inc., 144A 10%
15/10/2025 USD 1,200,000 1,389,000 0.49Blue Racer Midstream LLC, 144A 6.125%
15/11/2022 USD 1,250,000 1,187,500 0.42BlueLine Rental Finance Corp., 144A 7%
01/02/2019 USD 1,500,000 1,290,000 0.46BMC Software Finance, Inc., 144A 8.125%
15/07/2021 USD 500,000 381,250 0.14Boardriders SA, Reg. S 8.875%
15/12/2017 (Luxembourg) (1) (2) EUR 1,000,000 969,684 0.34Boxer Parent Co., Inc., 144A 9%
15/10/2019 USD 800,000 680,000 0.24Brand Energy & Infrastructure Services,
Inc., 144A 8.5% 01/12/2021 USD 1,255,000 1,198,525 0.43Bumble Bee Holdco SCA, 144A 9.625%
15/03/2018 (Luxembourg) (2) USD 1,628,000 1,609,685 0.57Bumble Bee Holdings, Inc., 144A 9%
15/12/2017 USD 1,000,000 1,017,500 0.36Cable One, Inc., 144A 5.75% 15/06/2022 USD 1,500,000 1,541,250 0.55Carrizo Oil & Gas, Inc. 6.25% 15/04/2023 USD 1,275,000 1,232,071 0.44CCM Merger, Inc., 144A 9.125%
01/05/2019 USD 1,220,000 1,280,479 0.46CCO Holdings LLC 5.75% 15/01/2024 USD 1,350,000 1,394,300 0.50
SCHEDULE OF INVESTMENTSAs at 30 June 2016
Investments Currency
Quantity/Nominal
Value
Market Value USD
% of Net Assets
Transferable securities and money market instruments admitted to official exchange listing or dealt in on another regulated market
Corporate Bonds (continued)
United States of America (continued)Central Garden & Pet Co. 6.125%
15/11/2023 USD 1,050,000 1,094,625 0.39Century Communities, Inc. 6.875%
15/05/2022 USD 1,850,000 1,785,250 0.63Cenveo Corp., 144A 6% 01/08/2019 USD 1,350,000 1,113,750 0.40Chemtura Corp. 5.75% 15/07/2021 USD 1,000,000 1,011,945 0.36Chester Downs & Marina LLC, 144A
9.25% 01/02/2020 USD 1,450,000 1,283,250 0.46Churchill Downs, Inc., 144A 5.375%
15/12/2021 USD 1,250,000 1,287,500 0.46Cleaver-Brooks, Inc., 144A 8.75%
15/12/2019 USD 1,500,000 1,496,250 0.53CNO Financial Group, Inc. 4.5%
30/05/2020 USD 400,000 416,000 0.15CNO Financial Group, Inc. 5.25%
30/05/2025 USD 1,000,000 1,032,500 0.37Commercial Vehicle Group, Inc. 7.875%
15/04/2019 USD 1,000,000 975,000 0.35CommScope Technologies Finance LLC,
144A 6% 15/06/2025 USD 500,000 512,010 0.18CommScope, Inc., 144A 5.5%
15/06/2024 USD 1,100,000 1,115,125 0.39Compiler Finance Sub, Inc., 144A 7%
01/05/2021 USD 2,000,000 850,000 0.30Concho Resources, Inc. 5.5% 01/04/2023 USD 1,200,000 1,207,140 0.43Consolidated Container Co. LLC, 144A
10.125% 15/07/2020 USD 1,100,000 998,250 0.35Continental Airlines Pass Through Trust,
Series 2012-3 ‘C’ 6.125% 29/04/2018 USD 900,000 948,375 0.34Continental Resources, Inc. 5%
15/09/2022 USD 1,250,000 1,213,394 0.43Coveris Holdings SA, 144A 7.875%
01/11/2019 (Luxembourg) (2) USD 1,000,000 976,250 0.35CPG Merger Sub LLC, 144A 8%
01/10/2021 USD 1,500,000 1,455,000 0.52Crestwood Midstream Partners LP, 144A
6.25% 01/04/2023 USD 1,000,000 920,000 0.33CSC Holdings LLC 5.25% 01/06/2024 USD 1,250,000 1,133,631 0.40CTP Transportation Products LLC, 144A
8.25% 15/12/2019 USD 1,000,000 885,000 0.31CTR Partnership LP, REIT 5.875%
01/06/2021 USD 1,000,000 1,018,750 0.36DCP Midstream LLC, 144A 5.35%
15/03/2020 USD 1,050,000 1,021,020 0.36DISH DBS Corp., 144A 7.75%
01/07/2026 USD 550,000 565,122 0.20Dollar Tree, Inc., 144A 5.25%
01/03/2020 USD 950,000 986,713 0.35DPL, Inc. 6.75% 01/10/2019 USD 1,435,000 1,474,463 0.52DPx Holdings BV, 144A 7.5% 01/02/2022
(Netherlands) (2) USD 900,000 919,125 0.33DS Services of America, Inc., 144A 10%
01/09/2021 USD 900,000 1,015,875 0.36DuPont Fabros Technology LP, REIT
5.625% 15/06/2023 USD 1,020,000 1,034,086 0.37DynCorp International, Inc. 11.875%
30/11/2020 USD 861,740 728,170 0.26Eco Services Operations LLC, 144A 8.5%
01/11/2022 USD 1,200,000 1,194,000 0.42Eldorado Resorts, Inc. 7% 01/08/2023 USD 1,400,000 1,459,500 0.52EMI Music Publishing Group North America
Holdings, 144A 7.625% 15/06/2024 USD 1,100,000 1,133,000 0.40Empire Today LLC, 144A 11.375%
01/02/2017 USD 1,725,000 1,699,125 0.60Endeavor Energy Resources LP, 144A 7%
15/08/2021 USD 500,000 493,500 0.18
179 Morgan Stanley Investment Funds 30 June 2016
The accompanying notes are an integral part of these financial statements.
Global High Yield Bond Fund (continued)
SCHEDULE OF INVESTMENTSAs at 30 June 2016
Investments Currency
Quantity/Nominal
Value
Market Value USD
% of Net Assets
Transferable securities and money market instruments admitted to official exchange listing or dealt in on another regulated market
Corporate Bonds (continued)
United States of America (continued)Endeavor Energy Resources LP, 144A
8.125% 15/09/2023 USD 1,000,000 1,025,000 0.36Endo Ltd., 144A 6% 15/07/2023
(Ireland) (2) USD 1,600,000 1,412,000 0.50Ensco plc 4.5% 01/10/2024
(United Kingdom) (2) USD 1,000,000 682,710 0.24First Data Corp., 144A 7% 01/12/2023 USD 1,633,000 1,655,805 0.59Flexi-Van Leasing, Inc., 144A 7.875%
15/08/2018 USD 1,000,000 975,000 0.35GCI, Inc. 6.875% 15/04/2025 USD 500,000 508,440 0.18Gibraltar Industries, Inc. 6.25%
01/02/2021 USD 1,280,000 1,292,800 0.46Gibson Brands, Inc., 144A 8.875%
01/08/2018 USD 1,650,000 924,000 0.33Global Partners LP 6.25% 15/07/2022 USD 1,500,000 1,252,500 0.45Golden Nugget Escrow, Inc., 144A 8.5%
01/12/2021 USD 1,100,000 1,127,500 0.40Gray Television, Inc., 144A 5.875%
15/07/2026 USD 1,200,000 1,206,600 0.43Great Lakes Dredge & Dock Corp. 7.375%
01/02/2019 USD 1,305,000 1,252,800 0.45Greektown Holdings LLC, 144A 8.875%
15/03/2019 USD 1,165,000 1,211,600 0.43Guitar Center, Inc., 144A 6.5%
15/04/2019 USD 1,000,000 867,500 0.31Guitar Center, Inc., 144A 9.625%
15/04/2020 USD 1,000,000 690,000 0.25Hanesbrands, Inc., 144A 4.875%
15/05/2026 USD 1,200,000 1,201,560 0.43Harland Clarke Holdings Corp., 144A
9.75% 01/08/2018 USD 1,750,000 1,785,000 0.63HCA, Inc. 5.25% 15/06/2026 USD 1,000,000 1,039,070 0.37Hexion, Inc. 8.875% 01/02/2018 USD 1,750,000 1,513,750 0.54Hexion, Inc. 10% 15/04/2020 USD 800,000 754,000 0.27Hilcorp Energy I LP, 144A 5%
01/12/2024 USD 1,500,000 1,403,445 0.50 Horizon Pharmacies, Inc. 6.625%
01/05/2023 USD 950,000 893,000 0.32HUB International Ltd., 144A 7.875%
01/10/2021 USD 1,250,000 1,206,250 0.43 Icahn Enterprises LP 6% 01/08/2020 USD 1,030,000 1,016,342 0.36Infinity Acquisition LLC, 144A 7.25%
01/08/2022 USD 1,250,000 1,093,750 0.39inVentiv Health, Inc., 144A 9%
15/01/2018 USD 1,000,000 1,030,000 0.37Iracore International Holdings, Inc., 144A
9.5% 01/06/2018 USD 1,750,000 910,000 0.32Iron Mountain, Inc., REIT, 144A 6%
01/10/2020 USD 1,000,000 1,049,250 0.37iStar, Inc., REIT 4% 01/11/2017 USD 500,000 494,778 0.18iStar, Inc., REIT 6.5% 01/07/2021 USD 1,000,000 942,500 0.34Jac Holding Corp., 144A 11.5%
01/10/2019 USD 1,056,000 1,114,080 0.40Jaguar Holding Co. II, 144A 6.375%
01/08/2023 USD 1,250,000 1,275,000 0.45JB Poindexter & Co., Inc., 144A 9%
01/04/2022 USD 1,622,000 1,694,990 0.60JC Penney Corp., Inc., 144A 5.875%
01/07/2023 USD 600,000 603,000 0.21JC Penney Corp., Inc. 8.125%
01/10/2019 USD 1,429,000 1,473,528 0.52Jefferies Finance LLC, 144A 6.875%
15/04/2022 USD 1,085,000 938,525 0.33
SCHEDULE OF INVESTMENTSAs at 30 June 2016
Investments Currency
Quantity/Nominal
Value
Market Value USD
% of Net Assets
Transferable securities and money market instruments admitted to official exchange listing or dealt in on another regulated market
Corporate Bonds (continued)
United States of America (continued)KCG Holdings, Inc., 144A 6.875%
15/03/2020 USD 1,250,000 1,140,625 0.41Kemet Corp. 10.5% 01/05/2018 USD 1,500,000 1,447,050 0.51Kennedy-Wilson, Inc. 5.875% 01/04/2024 USD 1,250,000 1,242,119 0.44KFC Holding Co., 144A 5% 01/06/2024 USD 1,050,000 1,068,595 0.38Lamar Media Corp. 5% 01/05/2023 USD 1,000,000 1,030,455 0.37Laredo Petroleum, Inc. 5.625%
15/01/2022 USD 500,000 470,885 0.17Laredo Petroleum, Inc. 6.25%
15/03/2023 USD 750,000 714,776 0.25LMI Aerospace, Inc. 7.375% 15/07/2019 USD 1,000,000 1,012,500 0.36Logan’s Roadhouse, Inc. 10.75%
15/10/2017 USD 2,000,000 220,000 0.08Mallinckrodt International Finance SA, 144A
5.5% 15/04/2025 (Luxembourg) (2) USD 1,000,000 900,000 0.32Martin Midstream Partners LP 7.25%
15/02/2021 USD 1,762,000 1,621,040 0.58MasTec, Inc. 4.875% 15/03/2023 USD 1,375,000 1,286,622 0.46Matador Resources Co. 6.875%
15/04/2023 USD 750,000 765,000 0.27MDC Partners, Inc., 144A 6.5%
01/05/2024 (Canada) (2) USD 1,000,000 990,000 0.35Memorial Resource Development Corp.
5.875% 01/07/2022 USD 1,750,000 1,745,625 0.62Meritor, Inc. 6.25% 15/02/2024 USD 1,250,000 1,067,918 0.38 Michael Baker Holdings LLC, 144A 8.875%
15/04/2019 USD 1,094,077 891,673 0.32Michael Baker International LLC, 144A
8.25% 15/10/2018 USD 750,000 731,250 0.26Midcontinent Communications &
Midcontinent Finance Corp., 144A 6.25% 01/08/2021 USD 1,652,000 1,709,820 0.61
MPH Acquisition Holdings LLC, 144A 7.125% 01/06/2024 USD 325,000 342,062 0.12
MPT Operating Partnership LP, REIT 6.375% 01/03/2024 USD 500,000 535,000 0.19
Mustang Merger Corp., 144A 8.5% 15/08/2021 USD 1,025,000 1,073,687 0.38
Neiman Marcus Group Ltd. LLC, 144A 8.75% 15/10/2021 USD 1,000,000 760,000 0.27
Netflix, Inc. 5.5% 15/02/2022 USD 1,000,000 1,045,460 0.37Newfield Exploration Co. 5.375%
01/01/2026 USD 1,000,000 974,535 0.35NewStar Financial, Inc. 7.25%
01/05/2020 USD 1,000,000 947,230 0.34Northern Oil and Gas, Inc. 8%
01/06/2020 USD 1,255,000 934,975 0.33Northern Tier Energy LLC 7.125%
15/11/2020 USD 1,100,000 1,111,000 0.40ONEOK, Inc. 4.25% 01/02/2022 USD 1,052,000 982,373 0.35OPE KAG Finance Sub, Inc., 144A 7.875%
31/07/2023 USD 1,105,000 1,093,950 0.39Oshkosh Corp. 5.375% 01/03/2022 USD 1,400,000 1,443,400 0.51Outfront Media Capital LLC 5.625%
15/02/2024 USD 1,250,000 1,279,375 0.45Oxford Finance LLC, 144A 7.25%
15/01/2018 USD 1,575,000 1,582,875 0.56Pacific Drilling V Ltd., 144A 7.25%
01/12/2017 (British Virgin Islands) (2) USD 1,300,000 539,500 0.19Parsley Energy LLC, 144A 7.5%
15/02/2022 USD 1,000,000 1,045,000 0.37Parsley Energy LLC, 144A 6.25%
01/06/2024 USD 600,000 613,500 0.22Party City Holdings, Inc., 144A 6.125%
15/08/2023 USD 1,000,000 1,037,500 0.37

Morgan Stanley Investment Funds 30 June 2016 180
The accompanying notes are an integral part of these financial statements.
Global High Yield Bond Fund (continued)
SCHEDULE OF INVESTMENTSAs at 30 June 2016
Investments Currency
Quantity/Nominal
Value
Market Value USD
% of Net Assets
Transferable securities and money market instruments admitted to official exchange listing or dealt in on another regulated market
Corporate Bonds (continued)
United States of America (continued)Pinnacle Foods Finance LLC, 144A
5.875% 15/01/2024 USD 600,000 630,000 0.22Pinnacle Operating Corp., 144A 9%
15/11/2020 USD 850,000 718,250 0.26Plastipak Holdings, Inc., 144A 6.5%
01/10/2021 USD 1,200,000 1,224,000 0.44Prince Mineral Holding Corp., 144A 11.5%
15/12/2019 USD 1,600,000 1,400,000 0.50Provident Funding Associates LP, 144A
6.75% 15/06/2021 USD 1,000,000 955,000 0.34Quintiles Transnational Corp., 144A
4.875% 15/05/2023 USD 1,000,000 1,020,000 0.36Radian Group, Inc. 7% 15/03/2021 USD 1,250,000 1,332,812 0.47Rice Energy, Inc. 6.25% 01/05/2022 USD 1,500,000 1,494,540 0.53Rite Aid Corp., 144A 6.125% 01/04/2023 USD 1,000,000 1,063,775 0.38Rivers Pittsburgh Borrower LP, 144A 9.5%
15/06/2019 USD 1,494,000 1,544,856 0.55Rose Rock Midstream LP 5.625%
15/11/2023 USD 1,250,000 1,093,750 0.39RSI Home Products, Inc., 144A 6.5%
15/03/2023 USD 1,095,000 1,130,588 0.40Sabra Health Care LP, REIT 5.5%
01/02/2021 USD 1,000,000 1,038,215 0.37 SAExploration Holdings, Inc. 10%
15/07/2019 USD 2,000,000 930,000 0.33Safway Group Holding LLC, 144A 7%
15/05/2018 USD 1,500,000 1,503,750 0.53Sally Holdings LLC 5.625% 01/12/2025 USD 1,200,000 1,256,976 0.45SBA Telecommunications, Inc. 5.75%
15/07/2020 USD 1,100,000 1,138,709 0.40Select Medical Corp. 6.375% 01/06/2021 USD 1,000,000 955,745 0.34Seminole Hard Rock Entertainment, Inc.,
144A 5.875% 15/05/2021 USD 1,000,000 1,007,500 0.36Service Corp. International 5.375%
15/01/2022 USD 1,000,000 1,039,380 0.37Shape Technologies Group, Inc., 144A
7.625% 01/02/2020 USD 1,855,000 1,850,363 0.66Signode Industrial Group Lux SA, 144A
6.375% 01/05/2022 USD 1,550,000 1,503,500 0.53 Sonic Automotive, Inc. 5% 15/05/2023 USD 1,000,000 982,500 0.35Spectrum Brands, Inc. 5.75% 15/07/2025 USD 1,000,000 1,040,115 0.37Standard Industries, Inc., 144A 5.125%
15/02/2021 USD 950,000 973,750 0.35Sugarhouse HSP Gaming Prop Mezz LP,
144A 6.375% 01/06/2021 USD 1,510,000 1,498,675 0.53Summit Materials LLC 6.125%
15/07/2023 USD 1,250,000 1,225,975 0.44Syncreon Group BV, 144A 8.625%
01/11/2021 (Netherlands) (2) USD 1,950,000 1,472,250 0.52Syniverse Holdings, Inc. 9.125%
15/01/2019 USD 750,000 371,250 0.13Techniplas LLC, 144A 10% 01/05/2020 USD 1,500,000 1,125,000 0.40Teleflex, Inc. 4.875% 01/06/2026 USD 500,000 502,755 0.18Tempur Sealy International, Inc., 144A
5.5% 15/06/2026 USD 1,150,000 1,129,875 0.40Tenet Healthcare Corp., FRN 4.152%
15/06/2020 USD 1,000,000 997,500 0.35Tesoro Logistics LP 6.25% 15/10/2022 USD 1,000,000 1,044,535 0.37Tesoro Logistics LP 6.375% 01/05/2024 USD 450,000 470,266 0.17T-Mobile USA, Inc. 6.5% 15/01/2026 USD 1,000,000 1,053,450 0.37TMS International Corp., 144A 7.625%
15/10/2021 USD 1,525,000 1,067,500 0.38
SCHEDULE OF INVESTMENTSAs at 30 June 2016
Investments Currency
Quantity/Nominal
Value
Market Value USD
% of Net Assets
Transferable securities and money market instruments admitted to official exchange listing or dealt in on another regulated market
Corporate Bonds (continued)
United States of America (continued)Tops Holding LLC, 144A 8% 15/06/2022 USD 1,500,000 1,327,500 0.47Transworld Systems, Inc., 144A 9.5%
15/08/2021 USD 1,500,000 742,500 0.26TreeHouse Foods, Inc., 144A 6%
15/02/2024 USD 450,000 476,861 0.17United Rentals North America, Inc. 5.75%
15/11/2024 USD 1,000,000 1,006,870 0.36US Concrete, Inc., 144A 6.375%
01/06/2024 USD 850,000 852,125 0.30Valeant Pharmaceuticals International, Inc.,
Reg. S 4.5% 15/05/2023 (Canada) (2) EUR 1,600,000 1,349,246 0.48VEREIT Operating Partnership LP, REIT
4.875% 01/06/2026 USD 500,000 511,627 0.18Wells Enterprises, Inc., 144A 6.75%
01/02/2020 USD 1,100,000 1,142,625 0.41West Corp., 144A 4.75% 15/07/2021 USD 1,000,000 990,000 0.35Western Digital Corp., 144A 7.375%
01/04/2023 USD 1,000,000 1,067,310 0.38Wise Metals Intermediate Holdings LLC,
144A 9.75% 15/06/2019 USD 2,683,875 1,435,873 0.51XPO Logistics, Inc., 144A 7.875%
01/09/2019 USD 1,000,000 1,025,000 0.36Zachry Holdings, Inc., 144A 7.5%
01/02/2020 USD 1,700,000 1,691,500 0.60
214,564,378 76.29
Total Corporate Bonds 278,234,715 98.93
Total Transferable securities and money market instruments admitted to official exchange listing or dealt in on another regulated market 278,234,715 98.93
Other transferable securities and money market instruments not admitted to official exchange listing or dealt in on another regulated market
Corporate Bonds
United States of AmericaExide Technologies 8.625% 01/02/2018 USD 1,750,000 2,188 0.00
2,188 0.00
Total Corporate Bonds 2,188 0.00
Equities
United States of AmericaChassix, Inc. (3) USD 24,253 627,849 0.22Exide Technologies (3) USD 10,370 104 0.00
627,953 0.22
Total Equities 627,953 0.22

181 Morgan Stanley Investment Funds 30 June 2016
The accompanying notes are an integral part of these financial statements.
Global High Yield Bond Fund (continued)
SCHEDULE OF INVESTMENTSAs at 30 June 2016
Investments Currency
Quantity/Nominal
Value
Market Value USD
% of Net Assets
Other transferable securities and money market instruments not admitted to official exchange listing or dealt in on another regulated market
Warrants
United States of AmericaChassix, Inc. 01/08/2020 (3) USD 15,209 0 0.00
0 0.00
Total Warrants 0 0.00
Total Other transferable securities and money market instruments not admitted to official exchange listing or dealt in on another regulated market 630,141 0.22
Units of authorised UCITS or other collective investment undertakings
Collective Investment Schemes – UCITS
LuxembourgMorgan Stanley Liquidity Funds US Dollar
Liquidity Fund – MS Reserve (4) USD 1,103 1,103 0.00
1,103 0.00
Total Collective Investment Schemes – UCITS 1,103 0.00
Total Units of authorised UCITS or other collective investment undertakings 1,103 0.00
Total Investments 278,865,959 99.15
Cash (156,095) (0.06)
Other Assets/(Liabilities) 2,538,764 0.91
Total Net Assets 281,248,628 100.00
(1) All or part of this position is out on loan.(2) The country in brackets represents the country of incorporation of this security.(3) Security is valued at its fair value under the direction of the Board of Directors of the SICAV.(4) Affiliate managed by an affiliate of the Investment Adviser.
Financial Futures Contracts
Security DescriptionNumber of Contracts Currency
Global Exposure
USD
Unrealised Gain/(Loss)
USD
% of Net Assets
SEK and Duration Hedged Share ClassEuro-Bobl, 08/09/2016 (1) EUR (148,460) (1,463) 0.00Euro-Schatz, 08/09/2016 (1) EUR (124,554) (300) 0.00US 10 Year Note, 21/09/2016 (6) USD (797,531) (21,328) (0.01)US 2 Year Note, 30/09/2016 (2) USD (438,469) (2,874) 0.00US 5 Year Note, 30/09/2016 (5) USD (610,195) (10,664) 0.00
Unrealised Loss on Financial Futures Contracts (36,629) (0.01)
Total Unrealised Loss on Financial Futures Contracts (36,629) (0.01)
Net Unrealised Loss on Financial Futures Contracts (36,629) (0.01)
Forward Currency Exchange Contracts
Currency Purchased
Amount Purchased
Currency Sold
Amount Sold
Maturity Date Counterparty
Unrealised Gain/(Loss)
USD
% of Net Assets
USD 604,483 EUR 535,000 19/07/2016 State Street 9,429 0.00USD 550,000 EUR 482,800 19/07/2016 Westpac Banking 13,006 0.01
Unrealised Gain on Forward Currency Exchange Contracts 22,435 0.01
EUR Hedged Share ClassEUR 366,991 USD 405,872 01/07/2016 J.P. Morgan 2,090 0.00USD 43,110 EUR 38,154 01/07/2016 J.P. Morgan 698 0.00EUR 67,274,940 USD 74,353,609 08/07/2016 J.P. Morgan 442,167 0.15USD 1,326,604 EUR 1,192,975 08/07/2016 J.P. Morgan 263 0.00
SEK Hedged Share ClassSEK 360,153 USD 42,263 01/07/2016 J.P. Morgan 182 0.00SEK 23,240,147 USD 2,723,609 08/07/2016 J.P. Morgan 15,780 0.01
Unrealised Gain on NAV Hedged Share Classes Forward Currency Exchange Contracts 461,180 0.16
Total Unrealised Gain on Forward Currency Exchange Contracts 483,615 0.17
EUR 12,958,000 USD 14,438,453 08/07/2016 Westpac Banking (31,845) (0.01)GBP 55,000 USD 77,798 20/07/2016 HSBC (3,883) 0.00GBP 445,000 USD 653,216 20/07/2016 State Street (55,181) (0.02)
Unrealised Loss on Forward Currency Exchange Contracts (90,909) (0.03)
EUR Hedged Share ClassEUR 68,097,922 USD 76,714,989 01/07/2016 J.P. Morgan (1,014,618) (0.36)USD 75,604,487 EUR 68,426,759 01/07/2016 J.P. Morgan (461,432) (0.16)EUR 8,964 USD 9,969 08/07/2016 J.P. Morgan (2) 0.00USD 544,837 EUR 492,522 08/07/2016 J.P. Morgan (2,745) 0.00
SEK Hedged Share ClassSEK 23,379,710 USD 2,830,772 01/07/2016 J.P. Morgan (75,375) (0.03)USD 2,781,031 SEK 23,739,863 01/07/2016 J.P. Morgan (16,811) (0.01)USD 9,078 SEK 77,171 08/07/2016 J.P. Morgan (18) 0.00
Unrealised Loss on NAV Hedged Share Classes Forward Currency Exchange Contracts (1,571,001) (0.56)
Total Unrealised Loss on Forward Currency Exchange Contracts (1,661,910) (0.59)
Net Unrealised Loss on Forward Currency Exchange Contracts (1,178,295) (0.42)
DERIVATIVES
Over-the-counter (OTC) and exchange traded derivatives as at 30 June 2016, expressed in US dollars.

Morgan Stanley Investment Funds 30 June 2016 182
The accompanying notes are an integral part of these financial statements.
Global High Yield Bond Fund (continued)
Collateral received and paid by the Fund in respect of financial derivative instruments:
Type of Collateral Counterparty CurrencyCollateral Amount
receivedCollateral Amount
paid
Global High Yield Bond Fund
Cash Goldman Sachs USD 61,822 -
61,822 -
DERIVATIVES (continued)

183 Morgan Stanley Investment Funds 30 June 2016
The accompanying notes are an integral part of these financial statements.
Please refer to the full prospectus for the Fund’s investment objective and policy.
INVESTMENT AIM
To provide an attractive rate of return, measured in US dollars, through investment in a portfolio of mortgages and securitised debt instruments issued by government agencies and private institutions (“non-agency”) including mortgage-backed securities, asset-backed securities, collateralised mortgage obligations and commercial mortgage-backed securities.
SCHEDULE OF INVESTMENTSAs at 30 June 2016
Investments Currency
Quantity/Nominal
Value
Market Value USD
% of Net Assets
Transferable securities and money market instruments admitted to official exchange listing or dealt in on another regulated market
Government Bonds
United States of AmericaUS Treasury Bill 0% 11/08/2016 USD 20,510,000 20,491,484 5.22
20,491,484 5.22
Total Government Bonds 20,491,484 5.22
Mortgage and Asset Backed Securities
Cayman IslandsShenton Aircraft Investment I Ltd., Series
2015-1A ‘A’, 144A 4.75% 15/10/2042 USD 2,584,509 2,538,068 0.65
2,538,068 0.65
GermanyTaurus Ltd., Reg. S, FRN, Series 2015-DE2
‘E’ 3.4% 01/02/2026 (Ireland) (2) EUR 2,000,000 2,145,465 0.55Taurus Ltd., Reg. S, FRN, Series 2015-DE2
‘F’ 4.4% 01/02/2026 (Ireland) (2) EUR 2,100,000 2,217,722 0.56
4,363,187 1.11
GreeceGrifonas Finance plc, Reg. S, FRN, Series
1 ‘A’ 0.152% 28/08/2039 (United Kingdom) (2) EUR 4,671,417 3,609,401 0.92
3,609,401 0.92
IrelandCredit Suisse European Mortgage Capital
Ltd., FRN, Series 2015-1HWA ‘A’, 144A 2.75% 20/04/2020 (3) EUR 3,293,761 3,441,788 0.88
Credit Suisse European Mortgage Capital Ltd., IO, STEP, Series 2015-1HWA ‘AX’, 144A 0.25% 20/04/2020 (3) EUR 2,352,687 17,000 0.00
Deco Ltd., FRN, Series 2014-BONA ‘F’, 144A 4.5% 07/11/2024 EUR 770,734 848,211 0.22
Deco Ltd., FRN, Series 2015-HRPA ‘C’, 144A 2.4% 27/04/2027 EUR 1,490,951 1,626,324 0.41
DECO TULIP Ltd., FRN, Series 2014-TLPA ‘A’, 144A 0.98% 27/07/2024 EUR 209,677 232,949 0.06
Moorgate Funding Ltd., Reg. S, FRN, Series 2014-1 ‘A1’ 1.406% 15/10/2050 (United Kingdom) (2) GBP 1,597,838 2,045,410 0.52
Moorgate Funding Ltd., Reg. S, FRN, Series 2014-1 ‘B1’ 1.606% 15/10/2050 (United Kingdom) (2) GBP 1,580,000 1,845,248 0.47
10,056,930 2.56
ItalyDECO GONDOLA SRL, Reg. S, FRN, Series
2014-GNDL ‘A’ 1.192% 22/02/2026 EUR 211,027 233,647 0.06DECO GONDOLA SRL, Reg. S, FRN, Series
2014-GNDL ‘D’ 2.692% 22/02/2026 EUR 500,000 546,093 0.14Eurohome Mortgages plc, Reg. S, FRN,
Series 2007-1 ‘A’ 0% 02/08/2050 (Ireland) (2) EUR 526,799 387,844 0.10
REITALY Finance SRL, Reg. S, FRN, Series 2015-1 ‘A1’ 2.15% 22/05/2027 EUR 1,500,000 1,656,205 0.42
Global Mortgage Securities Fund

Morgan Stanley Investment Funds 30 June 2016 184
The accompanying notes are an integral part of these financial statements.
Global Mortgage Securities Fund (continued)
SCHEDULE OF INVESTMENTSAs at 30 June 2016
Investments Currency
Quantity/Nominal
Value
Market Value USD
% of Net Assets
Transferable securities and money market instruments admitted to official exchange listing or dealt in on another regulated market
Mortgage and Asset Backed Securities (continued)
Italy (continued)Taurus SRL, Reg. S, FRN, Series 2015-IT1
‘D’ 3.843% 18/02/2027 EUR 1,836,780 1,980,583 0.50Tibet CMBS SRL, Reg. S, FRN, Series 1 ‘D’
4.15% 09/12/2026 EUR 1,959,771 2,140,435 0.55
6,944,807 1.77
NetherlandsEurosail-NL BV, Reg. S, FRN,
Series 2007-NL1X ‘A’ 0.149% 17/04/2040 EUR 2,490,149 2,511,995 0.64
Leo-Mesdag BV, Reg. S, FRN, Series 2006-1 ‘E’ 1.342% 29/08/2019 EUR 1,275,000 1,348,501 0.35
3,860,496 0.99
PortugalLusitano Mortgages No. 5 plc, Reg. S,
FRN, Series 5 ‘A’ 0.011% 15/07/2059 (Ireland) (2) EUR 5,617,752 4,644,969 1.18
Magellan Mortgages No.3 plc, Reg. S, FRN, Series 3 ‘A’ 0.002% 15/05/2058 (Ireland) (2) EUR 1,374,815 1,253,944 0.32
5,898,913 1.50
SpainFondo de Titulizacion de Activos, Reg. S,
FRN, Series 16 ‘A2’ 0% 16/06/2049 EUR 3,019,250 2,614,909 0.66Hipocat 7 FTA, Reg. S, FRN, Series 7 ‘D’
0.551% 15/07/2036 EUR 1,467,336 1,007,911 0.26IM Pastor 3 FTH, Reg. S, FRN, Series 3 ‘A’
0% 22/03/2043 EUR 4,659,435 3,870,373 0.99IM Pastor 4 FTA, Reg. S, FRN, Series 4 ‘A’
0% 22/03/2044 EUR 4,043,118 3,402,856 0.87
10,896,049 2.78
United KingdomALBA plc, Reg. S, FRN, Series 2005-1 ‘B’
0.94% 25/11/2042 GBP 1,066,370 1,201,742 0.31ALBA plc, Reg. S, FRN, Series 2015-1 ‘C’
2.603% 24/04/2049 GBP 500,000 619,423 0.16ALBA plc, Reg. S, FRN, Series 2015-1 ‘E’
3.203% 24/04/2049 GBP 2,000,000 2,336,907 0.60Bluestone Securities plc, Reg. S, FRN,
Series 2007-1 ‘DB’ 3.739% 09/06/2044 EUR 1,800,000 1,431,916 0.36Dukinfield plc, Reg. S, FRN, Series 1 ‘C’
2.091% 15/08/2045 GBP 2,000,000 2,439,043 0.62Estia Mortgage Finance plc, Reg. S, FRN,
Series 1 ‘A’ 0.09% 27/04/2040 EUR 1,041,469 940,801 0.24EuroMASTR plc, Reg. S, FRN, Series
2007-1V ‘D’ 2.272% 15/06/2040 GBP 1,114,499 1,134,877 0.29Eurosail-UK plc, Reg. S, FRN, Series
2007-4X ‘A5’ 1.524% 13/06/2045 GBP 2,000,000 2,187,933 0.56Kingswood Mortgages plc, Reg. S, FRN,
Series 2015-1 ‘C’ 2.25% 27/10/2052 EUR 2,000,000 2,166,735 0.55Landmark Mortgage Securities No. 3 plc,
Reg. S, FRN, Series 3 ‘C’ 2.689% 17/04/2044 GBP 1,500,000 1,374,860 0.35
Ludgate Funding plc, Reg. S, FRN, Series 2006-1X ‘C’ 0.159% 01/12/2060 EUR 1,114,981 876,673 0.22
SCHEDULE OF INVESTMENTSAs at 30 June 2016
Investments Currency
Quantity/Nominal
Value
Market Value USD
% of Net Assets
Transferable securities and money market instruments admitted to official exchange listing or dealt in on another regulated market
Mortgage and Asset Backed Securities (continued)
United Kingdom (continued)Mansard Mortgages Parent Ltd., Reg. S,
FRN, Series 2007-1X ‘M1’ 0.888% 15/04/2049 GBP 1,281,326 1,419,731 0.36
Mansard Mortgages plc, Reg. S, FRN, Series 2007-2X ‘B1’ 3.572% 15/12/2049 GBP 1,950,000 2,137,321 0.54
Mansard Mortgages plc, Reg. S, FRN, Series 2007-2X ‘B2’ 3.572% 15/12/2049 GBP 2,000,000 2,100,144 0.54
Marble Arch Residential Securitisation No. 4 Ltd., Reg. S, FRN, Series 4X ‘B1C’ 0.886% 20/03/2040 GBP 1,380,000 1,686,786 0.43
Money Partners Securities 2 plc, Reg. S, FRN, Series 2X ‘M1A’ 1.391% 14/05/2039 GBP 728,709 875,691 0.22
Money Partners Securities 3 plc, Reg. S, FRN, Series 3X ‘B2A’ 5.372% 14/09/2039 GBP 1,998,027 2,597,696 0.66
Money Partners Securities 3 plc, Reg. S, FRN, Series 3X ‘B2B’ 4.287% 14/09/2039 EUR 1,411,596 1,506,521 0.38
Money Partners Securities 4 plc, Reg. S, FRN, Series 4X ‘B2’ 5.372% 15/03/2040 GBP 597,926 748,640 0.19
Newgate Funding, Reg. S, FRN, Series 2007-3X ‘D’ 3.572% 15/12/2050 GBP 1,182,719 1,396,532 0.36
Oncilla Mortgage Funding plc, Reg. S, FRN, Series 2016-1 ‘B’ 2.38% 12/12/2043 GBP 1,500,000 1,910,962 0.49
Paragon Mortgages No. 13 plc, Reg. S, FRN, Series 13X ‘B1A’ 0.988% 15/01/2039 GBP 1,000,000 1,037,253 0.26
Paragon Mortgages No. 13 plc, Reg. S, FRN, Series 13X ‘B1B’ 0.131% 15/01/2039 EUR 3,000,000 2,575,655 0.66
Paragon Mortgages No. 13 plc, Reg. S, FRN, Series 13X ‘C1A’ 1.388% 15/01/2039 GBP 2,000,000 1,988,917 0.51
Paragon Mortgages No. 22 plc, Reg. S, FRN, Series 22 ‘C’ 2.222% 15/09/2042 GBP 1,000,000 1,266,717 0.32
ResLoC UK plc, Reg. S, FRN, Series 2007-1X ‘C1A’ 0.187% 15/12/2043 EUR 1,434,417 1,131,764 0.29
ResLoC UK plc, Reg. S, FRN, Series 2007-1X ‘D1A’ 0.937% 15/12/2043 EUR 1,513,098 1,188,877 0.30
RMAC Securities No.1 plc, Reg. S, FRN, Series 2007-NS1X ‘M2C’ 0.208% 12/06/2044 EUR 3,292,578 2,619,756 0.67
Southern Pacific Securities plc, Reg. S, FRN, Series 2005-3X ‘D1C’ 1.475% 10/12/2043 GBP 1,000,000 924,250 0.24
Southern Pacific Securities plc, Reg. S, FRN, Series 2006-1X ‘D1C’ 1.475% 10/03/2044 GBP 1,000,000 839,942 0.21
Southern Pacific Securities plc, Reg. S, FRN, Series 2006-1X ‘E1C’ 4.325% 10/03/2044 GBP 800,000 860,203 0.22
THRONES plc, Reg. S, FRN, Series 2015-1 ‘D’ 2.836% 18/03/2050 GBP 367,000 427,477 0.11
THRONES plc, Reg. S, FRN, Series 2015-1 ‘E’ 3.536% 18/03/2050 GBP 489,000 559,392 0.14
Warwick Finance Residential Mortgages Number Two plc, Reg. S, FRN, Series 2 ‘C’ 2.388% 21/09/2049 GBP 2,030,000 2,495,635 0.64
51,006,772 13.00

185 Morgan Stanley Investment Funds 30 June 2016
The accompanying notes are an integral part of these financial statements.
Global Mortgage Securities Fund (continued)
SCHEDULE OF INVESTMENTSAs at 30 June 2016
Investments Currency
Quantity/Nominal
Value
Market Value USD
% of Net Assets
Transferable securities and money market instruments admitted to official exchange listing or dealt in on another regulated market
Mortgage and Asset Backed Securities (continued)
United States of AmericaAdjustable Rate Mortgage Trust, FRN,
Series 2004-5 ‘5A1’ 4.952% 25/04/2035 USD 1,554,810 1,497,630 0.38
Adjustable Rate Mortgage Trust, FRN, Series 2005-7 ‘7A22’ 1.093% 25/10/2035 USD 677,814 618,894 0.16
Adjustable Rate Mortgage Trust, FRN, Series 2005-11 ‘2A42’ 2.892% 25/02/2036 USD 1,084,522 923,276 0.24
Alternative Loan Trust, FRN, Series 2004-29CB ‘A10’ 0.953% 25/01/2035 USD 243,295 235,533 0.06
Alternative Loan Trust, FRN, Series 2006-14CB ‘A2’ 0.853% 25/06/2036 USD 3,081 1,710 0.00
Alternative Loan Trust, FRN, Series 2006-28CB ‘A19’ 0.853% 25/10/2036 USD 384,332 197,482 0.05
Alternative Loan Trust, FRN, Series 2006-OA14 ‘2A1’ 0.643% 25/11/2046 USD 2,655,998 2,114,596 0.54
Alternative Loan Trust, FRN, Series 2007-OA2 ‘2A1’ 0.583% 25/03/2047 USD 2,303,165 1,638,935 0.42
Alternative Loan Trust, Series 2005-21CB ‘A3’ 5.25% 25/06/2035 USD 330,039 287,071 0.07
Alternative Loan Trust, Series 2005-73CB ‘1A1’ 5.5% 25/01/2036 USD 25,107 24,156 0.01
Alternative Loan Trust, Series 2005-79CB ‘A3’ 5.5% 25/01/2036 USD 513,623 426,525 0.11
Alternative Loan Trust, Series 2005-85CB ‘2A2’ 5.5% 25/02/2036 USD 395,166 353,379 0.09
Alternative Loan Trust, Series 2005-86CB ‘A4’ 5.5% 25/02/2036 USD 5,958 4,940 0.00
Alternative Loan Trust, Series 2005-J1 ‘2A1’ 5.5% 25/02/2025 USD 89,267 91,261 0.02
Alternative Loan Trust, Series 2005-J5 ‘1A7’ 5.5% 25/05/2035 USD 554,122 492,575 0.13
Alternative Loan Trust, Series 2006-6CB ‘1A10’ 5.5% 25/05/2036 USD 55,409 46,808 0.01
Alternative Loan Trust, Series 2008-2R ‘2A1’ 6% 25/08/2037 USD 132,464 89,569 0.02
Alternative Loan Trust, Series 2008-2R ‘4A1’ 6.25% 25/08/2037 USD 288,455 223,993 0.06
American Home Mortgage Investment Trust, STEP, Series 2005-1 ‘8A2’ 6% 25/06/2035 USD 1,847,000 1,215,101 0.31
American Home Mortgage Investment Trust, IO, Series 2007-1 ‘GIOP’ 2.078% 25/05/2047 USD 6,859,933 1,253,859 0.32
American Home Mortgage Investment Trust, STEP, Series 2007-A ‘13A1’, 144A 6.1% 25/01/2037 USD 425,690 238,493 0.06
Amortizing Residential Collateral Trust, FRN, Series 2002-BC6 ‘A2’ 1.153% 25/08/2032 USD 1,587,143 1,444,483 0.37
Apollo Aviation Securitization Equity Trust, STEP, Series 2016-1A ‘A’, 144A 4.875% 17/03/2036 USD 1,950,000 1,925,625 0.49
Argent Securities, Inc., FRN, Series 2003-W1 ‘M5’ 3.681% 25/09/2033 USD 2,400,000 2,278,596 0.58
Argent Securities, Inc., FRN, Series 2004-W2 ‘M2’ 2.328% 25/04/2034 USD 898,872 847,272 0.22
BAMLL Commercial Mortgage Securities Trust, FRN, Series 2014-FL1 ‘E’, 144A 5.942% 15/12/2031 USD 1,465,000 1,232,699 0.31
SCHEDULE OF INVESTMENTSAs at 30 June 2016
Investments Currency
Quantity/Nominal
Value
Market Value USD
% of Net Assets
Transferable securities and money market instruments admitted to official exchange listing or dealt in on another regulated market
Mortgage and Asset Backed Securities (continued)
United States of America (continued)BAMLL Commercial Mortgage Securities
Trust, FRN, Series 2014-INLD ‘F’, 144A 2.971% 15/12/2029 USD 1,508,000 1,353,501 0.34
BAMLL Commercial Mortgage Securities Trust, FRN, Series 2015-ASHF ‘E’, 144A 4.442% 15/01/2028 USD 1,414,000 1,415,520 0.36
Banc of America Alternative Loan Trust, FRN, Series 2006-7 ‘A2’ 5.707% 25/10/2036 USD 808,747 505,564 0.13
Banc of America Alternative Loan Trust, Series 2005-1 ‘1CB4’ 5.5% 25/02/2035 USD 194,000 175,387 0.04
Banc of America Alternative Loan Trust, Series 2005-8 ‘2CB1’ 6% 25/09/2035 USD 594,802 571,104 0.15
Banc of America Commercial Mortgage Trust, Series 2015-UBS7 ‘D’ 3.167% 15/09/2048 USD 484,000 363,722 0.09
Banc of America Funding Trust, FRN, Series 2007-A ‘2A5’ 0.678% 20/02/2047 USD 456,968 378,642 0.10
Banc of America Funding Trust, Series 2005-7 ‘3A8’ 5.5% 25/11/2035 USD 105,000 106,282 0.03
Banc of America Funding Trust, Series 2006-2 ‘2A9’ 6% 25/03/2036 USD 67,564 64,734 0.02
Banc of America Funding Trust, Series 2006-6 ‘1A15’ 6.25% 25/08/2036 USD 40,709 39,872 0.01
Banc of America Funding Trust, Series 2007-2 ‘1A7’ 5.75% 25/03/2037 USD 235,306 206,133 0.05
Banc of America Funding Trust, Series 2007-5 ‘5A1’ 5.25% 25/07/2037 USD 420,505 422,882 0.11
Banc of America Mortgage Trust, Series 2005-10 ‘1A6’ 5.5% 25/11/2035 USD 204,374 193,302 0.05
BBCMS Trust, FRN, Series 2015-STP ‘E’, 144A 4.427% 10/09/2028 USD 1,050,000 980,210 0.25
Bear Stearns ALT-A Trust, FRN, Series 2004-6 ‘1A’ 1.093% 25/07/2034 USD 1,636,812 1,565,316 0.40
Bear Stearns ALT-A Trust, FRN, Series 2006-3 ‘1A1’ 0.833% 25/05/2036 USD 1,509,281 1,250,639 0.32
Bear Stearns Asset-Backed Securities I Trust, FRN, Series 2006-AC2 ‘1A2’ 23.493% 25/03/2036 USD 3,560,338 3,432,592 0.87
Bear Stearns Structured Products, Inc., FRN, Series 2007-R6 ‘1A1’ 2.878% 26/01/2036 USD 584,915 454,170 0.12
BWAY Mortgage Trust, Series 2013-1515 ‘A1’, 144A 2.809% 10/03/2033 USD 368,733 378,197 0.10
Carrington Mortgage Loan Trust, FRN, Series 2006-RFC1 ‘A4’ 0.693% 25/05/2036 USD 1,500,000 1,267,208 0.32
Castle Aircraft Securitization Trust, Series 2015-1A ‘A’, 144A 4.703% 15/12/2040 USD 1,315,155 1,308,169 0.33
Chase Mortgage Finance Trust, FRN, Series 2007-S1 ‘A4’ 1.053% 25/02/2037 USD 527,048 336,755 0.09
CHL Mortgage Pass-Through Trust, Series 2003-J15 ‘3A1’ 5% 25/01/2019 USD 11,533 11,700 0.00
CHL Mortgage Pass-Through Trust, Series 2007-13 ‘A6’ 6% 25/08/2037 USD 195,259 172,147 0.04
CHL Mortgage Pass-Through Trust, Series 2008-2R ‘A1’ 6% 25/12/2036 USD 767,073 699,716 0.18
Citicorp Mortgage Securities Trust, Series 2006-6 ‘A4’ 6% 25/11/2036 USD 196,414 207,516 0.05
Citicorp Residential Mortgage Trust, STEP, Series 2007-1 ‘A5’ 5.748% 25/03/2037 USD 3,000,000 3,123,329 0.80

Morgan Stanley Investment Funds 30 June 2016 186
The accompanying notes are an integral part of these financial statements.
Global Mortgage Securities Fund (continued)
SCHEDULE OF INVESTMENTSAs at 30 June 2016
Investments Currency
Quantity/Nominal
Value
Market Value USD
% of Net Assets
Transferable securities and money market instruments admitted to official exchange listing or dealt in on another regulated market
Mortgage and Asset Backed Securities (continued)
United States of America (continued)Citigroup Commercial Mortgage Trust,
FRN, Series 2015-GC33 ‘C’ 4.724% 10/09/2058 USD 825,000 828,196 0.21
Citigroup Commercial Mortgage Trust, FRN, Series 2015-GC33 ‘XA’ 1.134% 10/09/2058 USD 16,540,137 1,105,736 0.28
Citigroup Mortgage Loan Trust, FRN, Series 2004-RES1 ‘M1’ 1.428% 25/11/2034 USD 1,297,683 1,253,067 0.32
Citigroup Mortgage Loan Trust, FRN, Series 2006-AR1 ‘2A1’ 2.73% 25/03/2036 USD 106,722 102,587 0.03
Citigroup Mortgage Loan Trust, Series 2006-4 ‘2A1A’ 6% 25/12/2035 USD 1,026,343 951,237 0.24
Citigroup Mortgage Loan Trust, Series 2007-12 ‘2A1’, 144A 6.5% 25/10/2036 USD 425,661 319,629 0.08
Colony American Homes, FRN, Series 2015-1A ‘F’, 144A 4.084% 17/07/2032 USD 1,500,000 1,432,586 0.36
COMM Mortgage Trust, FRN, Series 2013-CR13 ‘D’, 144A 4.909% 10/12/2023 USD 1,618,000 1,494,129 0.38
COMM Mortgage Trust, FRN, Series 2013-LC13 ‘D’, 144A 5.213% 10/08/2046 USD 1,270,000 1,132,262 0.29
COMM Mortgage Trust, FRN, Series 2014-CR18 ‘D’, 144A 4.896% 15/07/2047 USD 306,000 240,796 0.06
COMM Mortgage Trust, FRN, Series 2014-LC17 ‘XA’ 1.152% 10/10/2047 USD 6,286,248 301,340 0.08
COMM Mortgage Trust, FRN, Series 2016-CR28 ‘D’ 4.053% 10/02/2049 USD 760,000 556,297 0.14
Commercial Mortgage Trust, FRN, Series 2014-CR14 ‘D’, 144A 4.752% 10/02/2047 USD 736,000 610,897 0.16
Commercial Mortgage Trust, FRN, Series 2014-CR14 ‘XA’ 0.851% 10/02/2047 USD 12,737,982 465,829 0.12
Commercial Mortgage Trust, Series 2007-GG9 ‘AM’ 5.475% 10/03/2039 USD 1,410,000 1,434,323 0.37
Conseco Financial Corp., FRN, Series 1995-4 ‘B1’ 7.3% 15/06/2025 USD 245,827 248,467 0.06
COOF Securitization Trust II, FRN, Series 2015-2 ‘A1’, 144A 2.226% 25/08/2041 USD 9,384,017 971,964 0.25
Countrywide Asset-Backed Certificates Trust, FRN, Series 2004-12 ‘MV4’ 1.878% 25/03/2035 USD 2,130,000 2,047,885 0.52
Countrywide Asset-Backed Certificates Trust, FRN, Series 2004-SD2 ‘M1’, 144A 1.073% 25/06/2033 USD 707,920 689,950 0.18
Credit Suisse First Boston Mortgage Securities Corp., FRN, Series 2002-AR2 ‘2B’ 3.753% 25/02/2032 USD 1,032,460 920,560 0.23
Credit Suisse First Boston Mortgage Securities Corp., FRN, Series 2004-AR5 ‘11A1’ 1.173% 25/06/2034 USD 1,233,018 1,100,145 0.28
Credit-Based Asset Servicing and Securitization LLC, FRN, Series 2002-CB1 ‘B1’ 3.528% 25/08/2030 USD 793,129 799,640 0.20
SCHEDULE OF INVESTMENTSAs at 30 June 2016
Investments Currency
Quantity/Nominal
Value
Market Value USD
% of Net Assets
Transferable securities and money market instruments admitted to official exchange listing or dealt in on another regulated market
Mortgage and Asset Backed Securities (continued)
United States of America (continued)Credit-Based Asset Servicing and
Securitization LLC, FRN, Series 2006-CB4 ‘AV3’ 0.603% 25/05/2036 USD 955,362 688,787 0.18
Credit-Based Asset Servicing and Securitization LLC, STEP, Series 2006-MH1 ‘B1’, 144A 5.34% 25/10/2036 USD 1,500,000 1,349,223 0.34
CSMC Mortgage-Backed Trust, FRN, Series 2007-3 ‘1A3A’ 5.746% 25/04/2037 USD 2,086,115 1,043,911 0.27
CSMC Mortgage-Backed Trust, Series 2007-5 ‘1A11’ 6.548% 25/08/2037 USD 311,241 240,120 0.06
CSMC Trust, FRN, Series 2015-RPL2 ‘A2’, 144A 4.715% 25/11/2057 USD 1,350,000 1,361,886 0.35
EMC Mortgage Loan Trust, FRN, Series 2004-C ‘M1’, 144A 1.446% 25/11/2030 USD 898,000 783,918 0.20
Extended Stay America Trust, Series 2013-ESH7 ‘A27’, 144A 2.958% 05/12/2031 USD 150,270 150,884 0.04
FHLMC, FRN, Series 2013-DN2 ‘M2’ 4.703% 25/11/2023 USD 1,300,000 1,303,798 0.33
FHLMC, FRN, Series 2014-DN1 ‘M3’ 4.953% 25/02/2024 USD 800,000 818,576 0.21
FHLMC, FRN, Series 2014-DN2 ‘M3’ 4.053% 25/04/2024 USD 2,000,000 1,938,991 0.49
FHLMC, FRN, Series 2014-DN3 ‘M3’ 4.453% 25/08/2024 USD 3,100,000 3,083,743 0.79
FHLMC, FRN, Series 2014-DN4 ‘M3’ 5.003% 25/10/2024 USD 2,000,000 2,040,628 0.52
FHLMC, FRN, Series 2015-DNA1 ‘M3’ 3.753% 25/10/2027 USD 500,000 492,843 0.13
FHLMC, FRN, Series 2016-DNA1 ‘M2’ 3.353% 25/07/2028 USD 1,120,000 1,151,792 0.29
FHLMC, IO, FRN, Series K152 ‘X1’ 0.952% 25/01/2031 USD 11,575,000 1,063,055 0.27
FHLMC, IO, FRN, Series K502 ‘X1A’ 1.624% 25/04/2017 USD 4,882,961 32,327 0.01
FHLMC, IO, FRN, Series K712 ‘X1’ 1.479% 25/11/2019 USD 6,628,674 236,635 0.06
FHLMC, IO, FRN, Series K714 ‘X1’ 0.841% 25/10/2020 USD 26,513,167 668,129 0.17
FHLMC 3% 15/08/2046 USD 7,360,000 7,602,650 1.94FHLMC G07848 3.5% 01/04/2044 USD 1,929,668 2,066,611 0.53FHLMC G60038 3.5% 01/01/2044 USD 1,348,897 1,422,155 0.36FHLMC Q26692 4% 01/06/2044 USD 3,191,356 3,416,639 0.87FHLMC Q29048 4% 01/10/2044 USD 1,473,990 1,578,188 0.40FHLMC Q32407 3.5% 01/06/2045 USD 1,613,586 1,721,618 0.44FHLMC Q34163 3.5% 01/06/2045 USD 1,880,902 2,005,282 0.51FHLMC V82003 4% 01/10/2045 USD 1,611,062 1,727,412 0.44FHLMC REMIC, FRN, Series 4259 ‘SB’
7.101% 15/10/2043 USD 972,748 1,016,161 0.26FHLMC REMIC, FRN, Series 4286 ‘SC’
10.782% 15/12/2043 USD 1,732,025 1,921,659 0.49FHLMC REMIC, IO, FRN, Series 2962 ‘BS’
350315 6.208% 15/03/2035 USD 3,253,868 508,465 0.13FHLMC REMIC, IO, FRN, Series 4002 ‘ES’
1.782% 15/02/2038 USD 4,748,582 314,567 0.08FHLMC REMIC, IO, FRN, Series 4265 ‘ST’
5.558% 15/11/2043 USD 6,184,240 1,034,165 0.26FHLMC REMIC, IO, FRN, Series 4314 ‘IT’
1.906% 15/04/2039 USD 5,218,870 349,043 0.09FHLMC REMIC, IO, FRN, Series 4326 ‘IA’
1.744% 15/05/2038 USD 7,180,651 473,970 0.12

187 Morgan Stanley Investment Funds 30 June 2016
The accompanying notes are an integral part of these financial statements.
Global Mortgage Securities Fund (continued)
SCHEDULE OF INVESTMENTSAs at 30 June 2016
Investments Currency
Quantity/Nominal
Value
Market Value USD
% of Net Assets
Transferable securities and money market instruments admitted to official exchange listing or dealt in on another regulated market
Mortgage and Asset Backed Securities (continued)
United States of America (continued)FHLMC REMIC, IO, FRN, Series 4348 ‘SA’
1.901% 15/10/2040 USD 14,624,899 1,011,101 0.26FHLMC REMIC, IO, FRN, Series 4363 ‘TI’
1.892% 15/10/2039 USD 4,843,890 317,060 0.08FHLMC REMIC, IO, FRN, Series 4365 ‘AI’
1.917% 15/08/2042 USD 7,950,413 482,193 0.12FHLMC REMIC, IO, Series 4259 ‘IA’ 5%
15/08/2041 USD 1,000,083 129,787 0.03FHLMC Strips, IO, FRN, Series 343 ‘S4’
1.458% 15/10/2037 USD 39,131,464 1,763,559 0.45First Horizon Alternative Mortgage
Securities Trust, FRN, Series 2005-FA2 ‘1A1’ 0.953% 25/04/2035 USD 120,021 94,708 0.02
First Horizon Alternative Mortgage Securities Trust, Series 2005-FA2 ‘1A5’ 5.5% 25/04/2035 USD 33,549 31,918 0.01
First Horizon Alternative Mortgage Securities Trust, Series 2006-FA3 ‘A6’ 6% 25/07/2036 USD 8,397 6,588 0.00
First Horizon Alternative Mortgage Securities Trust, Series 2006-FA5 ‘A3’ 6.25% 25/08/2036 USD 9,490 7,603 0.00
FNMA 2.5% 25/07/2031 USD 7,650,000 7,911,773 2.02FNMA 3% 25/07/2031 USD 1,920,000 2,012,100 0.51FNMA 3.5% 25/07/2046 USD 4,390,000 4,628,020 1.18FNMA, IO, Series 2016-15 ‘AS’ 1.649%
25/03/2046 USD 30,990,574 1,637,852 0.42FNMA AL7510 3.5% 01/10/2045 USD 1,907,177 2,035,123 0.52FNMA AL7594 3.5% 01/08/2045 USD 1,193,137 1,272,564 0.32FNMA AS4821 4% 01/04/2045 USD 2,215,257 2,417,145 0.62FNMA AS5169 3% 01/06/2040 USD 630,569 656,079 0.17FNMA AS5718 3.5% 01/08/2045 USD 1,151,927 1,231,709 0.31FNMA AS6580 3.5% 01/02/2046 USD 922,465 988,287 0.25FNMA AX1685 3.5% 01/11/2044 USD 2,117,271 2,260,182 0.58FNMA AX8337 4% 01/01/2045 USD 2,143,028 2,298,455 0.59FNMA AY6601 3.5% 01/03/2045 USD 930,373 988,325 0.25FNMA AY8760 3% 01/04/2045 USD 982,466 1,028,297 0.26FNMA AZ2897 3.5% 01/09/2045 USD 1,590,821 1,696,727 0.43FNMA AZ4750 3.5% 01/10/2045 USD 1,516,623 1,605,688 0.41FNMA BA3100 3.5% 01/01/2046 USD 1,709,093 1,815,130 0.46FNMA Connecticut Avenue Securities, FRN,
Series 2014-C04 ‘1M2’ 5.353% 25/11/2024 USD 648,000 662,225 0.17
FNMA Connecticut Avenue Securities, FRN, Series 2015-C02 ‘1M2’ 4.453% 25/05/2025 USD 831,000 831,938 0.21
FNMA Connecticut Avenue Securities, FRN, Series 2015-C03 ‘1M2’ 5.453% 25/07/2025 USD 600,000 604,265 0.15
FNMA Connecticut Avenue Securities, FRN, Series 2015-C04 ‘1M2’ 6.153% 25/04/2028 USD 1,000,000 1,019,454 0.26
FNMA REMIC, IO, FRN, Series 2012-29 ‘SJ’ 5.997% 25/04/2042 USD 854,083 157,404 0.04
FNMA REMIC, IO, FRN, Series 2012-56 ‘SQ’ 5.597% 25/06/2042 USD 7,236,231 1,314,000 0.33
FNMA REMIC, IO, FRN, Series 2013-12 ‘SP’ 5.197% 25/11/2041 USD 401,514 39,239 0.01
FNMA REMIC, IO, FRN, Series 2014-10 ‘CS’ 1.8742% 25/03/2044 USD 7,479,941 514,917 0.13
FNMA REMIC, IO, FRN, Series 2014-23 ‘SA’ 1.950% 25/10/2039 USD 10,962,387 848,026 0.22
FNMA-Aces, IO, FRN, Series 2014-M2 ‘X3’ 0.486% 25/12/2023 USD 54,969,279 1,057,131 0.27
SCHEDULE OF INVESTMENTSAs at 30 June 2016
Investments Currency
Quantity/Nominal
Value
Market Value USD
% of Net Assets
Transferable securities and money market instruments admitted to official exchange listing or dealt in on another regulated market
Mortgage and Asset Backed Securities (continued)
United States of America (continued)FREMF Mortgage Trust, FRN,
Series 2015-K48 ‘C’, 144A 3.760% 25/08/2048 USD 2,000,000 1,554,243 0.40
FREMF Mortgage Trust, FRN, Series 2015-K51 ‘B’, 144A 4.088% 25/10/2048 USD 1,500,000 1,457,052 0.37
FREMF Mortgage Trust, FRN, Series 2015-K720 ‘B’, 144A 3.506% 25/07/2022 USD 1,670,000 1,591,650 0.41
GNMA, IO, FRN, Series 2006-49 ‘SA’ 6.012% 20/02/2036 USD 3,777,559 338,059 0.09
GNMA, IO, FRN, Series 2010-157 ‘PS’ 5.602% 20/01/2040 USD 4,436,922 345,292 0.09
GNMA, IO, FRN, Series 2011-94 ‘SU’ 5.652% 20/04/2041 USD 2,104,318 307,237 0.08
GNMA, IO, FRN, Series 2013-124 ‘SB’ 5.702% 20/10/2041 USD 8,380,991 816,286 0.21
GNMA, IO, FRN, Series 2013-135 ‘SM’ 5.852% 20/09/2043 USD 8,119,384 1,774,431 0.45
GNMA, IO, FRN, Series 2013-182 ‘NS’ 5.692% 20/12/2043 USD 14,826,003 2,835,270 0.72
GNMA 3.5% 15/07/2046 USD 7,170,000 7,603,561 1.94GNMA, IO, Series 2011-48 ‘MI’ 5%
20/05/2039 USD 302,573 14,675 0.00GNMA, IO, Series 2011-136 ‘IG’ 4.5%
20/05/2040 USD 4,815,368 352,970 0.09GNMA, IO, Series 2012-57 ‘NI’ 5%
20/10/2040 USD 848,593 104,734 0.03GNMA, IO, Series 2012-122 ‘PI’ 4%
20/04/2042 USD 5,337,619 819,463 0.21GNMA, IO, Series 2012-128 ‘IG’ 3.5%
16/10/2042 USD 453,516 70,644 0.02GNMA, IO, Series 2012-140 ‘IC’ 3.5%
20/11/2042 USD 1,898,979 335,326 0.09GNMA, IO, Series 2013-18 ‘GI’ 3.5%
20/05/2041 USD 8,927,070 848,902 0.22GNMA, IO, Series 2013-41 ‘LI’ 4%
20/01/2041 USD 10,077,422 1,029,659 0.26GNMA, IO, Series 2013-60 ‘IO’ 3.5%
20/04/2043 USD 2,611,390 354,165 0.09GNMA, IO, Series 2013-71 ‘IG’ 3.5%
20/05/2043 USD 13,687,578 2,101,454 0.54GNMA, IO, Series 2013-71 ‘IN’ 3.5%
20/05/2043 USD 6,508,317 1,221,217 0.31GNMA, IO, Series 2013-71 ‘MI’ 3.5%
20/06/2041 USD 2,358,279 282,734 0.07GNMA AE8503 4% 15/07/2044 USD 1,842,618 1,997,973 0.51GNMA AJ9334 3.5% 20/10/2044 USD 1,499,688 1,601,305 0.41GNMA AM7358 3.5% 20/05/2045 USD 329,974 352,474 0.09GO Financial Auto Securitization Trust,
Series 2015-2 ‘A’, 144A 3.27% 15/11/2018 USD 809,342 807,626 0.21
GreenPoint Mortgage Funding Trust, FRN, Series 2006-OH1 ‘A1’ 0.633% 25/01/2037 USD 431,303 347,352 0.09
GreenPoint Mortgage Funding Trust, FRN, Series 2007-AR1 ‘3A2’ 0.613% 25/02/2037 USD 796,207 665,837 0.17
GS Mortgage Securities Trust, FRN, Series 2014-GC24 ‘XA’ 1.006% 10/09/2047 USD 7,984,502 399,887 0.10
GS Mortgage Securities Trust, Series 2015-GC32 ‘D’ 3.345% 10/07/2048 USD 1,700,000 1,291,351 0.33

Morgan Stanley Investment Funds 30 June 2016 188
The accompanying notes are an integral part of these financial statements.
Global Mortgage Securities Fund (continued)
SCHEDULE OF INVESTMENTSAs at 30 June 2016
Investments Currency
Quantity/Nominal
Value
Market Value USD
% of Net Assets
Transferable securities and money market instruments admitted to official exchange listing or dealt in on another regulated market
Mortgage and Asset Backed Securities (continued)
United States of America (continued)GSAA Home Equity Trust, FRN,
Series 2006-20 ‘2A1A’ 0.503% 25/12/2046 USD 1,282,464 806,123 0.21
GSAA Trust, FRN, Series 2006-5 ‘2A2’ 0.633% 25/03/2036 USD 793,252 464,712 0.12
GSAA Trust, STEP, Series 2007-2 ‘AF5A’ 6.099% 25/03/2037 USD 1,592,356 756,098 0.19
GSAMP Trust, FRN, Series 2007-FM1 ‘A2A’ 0.523% 25/12/2036 USD 707,818 376,918 0.10
GSR Mortgage Loan Trust, FRN, Series 2004-14 ‘3A1’ 3.146% 25/12/2034 USD 2,036,883 1,953,946 0.50
GSR Mortgage Loan Trust, FRN, Series 2005-AR3 ‘6A1’ 3.072% 25/05/2035 USD 27,030 25,112 0.01
HILT Mortgage Trust, FRN, Series 2014-ORL ‘F’, 144A 4.192% 15/07/2029 USD 1,400,000 1,216,751 0.31
Impac CMB Trust, FRN, Series 2004-5 ‘1M1’ 1.248% 25/10/2034 USD 241,954 226,951 0.06
Impac CMB Trust, FRN, Series 2004-6 ‘1A2’ 1.233% 25/10/2034 USD 1,072,768 990,497 0.25
Impac CMB Trust, FRN, Series 2004-11 ‘2A1’ 1.113% 25/03/2035 USD 508,008 469,089 0.12
Impac CMB Trust, FRN, Series 2005-2 ‘1M2’ 1.188% 25/04/2035 USD 358,448 281,839 0.07
Impac CMB Trust, STEP, Series 2003-4 ‘3M2’ 5.665% 25/07/2033 USD 347,104 336,876 0.09
Impac Secured Assets Trust, FRN, Series 2006-2 ‘1A2B’ 0.623% 25/08/2036 USD 1,633,094 1,176,526 0.30
IndyMac INDX Mortgage Loan Trust, FRN, Series 2004-AR11 ‘2A’ 2.837% 25/12/2034 USD 514,128 485,705 0.12
Invitation Homes Trust, FRN, Series 2014-SFR1 ‘F’, 144A 4.196% 17/06/2031 USD 3,000,000 2,888,173 0.74
Invitation Homes Trust, FRN, Series 2014-SFR3 ‘E’, 144A 4.946% 17/12/2031 USD 1,000,000 1,009,736 0.26
Invitation Homes Trust, FRN, Series 2015-SFR3 ‘F’, 144A 5.196% 17/08/2032 USD 1,460,000 1,450,364 0.37
J.P. Morgan Alternative Loan Trust, FRN, Series 2006-A5 ‘1A1’ 0.613% 25/10/2036 USD 4,336,451 3,592,471 0.92
J.P. Morgan Alternative Loan Trust, Series 2006-S1 ‘1A16’ 6% 25/03/2036 USD 321,757 266,370 0.07
J.P. Morgan Alternative Loan Trust, STEP, Series 2006-S3 ‘A3A’ 6% 25/08/2036 USD 207,193 200,421 0.05
J.P. Morgan Chase Commercial Mortgage Securities Trust, FRN, Series 2007-CB20 ‘AJ’ 6.284% 12/02/2051 USD 2,000,000 1,993,365 0.51
J.P. Morgan Chase Commercial Mortgage Securities Trust, FRN, Series 2007-LDPX ‘AM’ 5.464% 15/01/2049 USD 4,640,000 4,569,755 1.16
J.P. Morgan Chase Commercial Mortgage Securities Trust, FRN, Series 2014-C20 ‘D’, 144A 4.724% 15/07/2047 USD 1,495,000 1,146,267 0.29
J.P. Morgan Chase Commercial Mortgage Securities Trust, Series 2006-CB17 ‘AM’ 5.464% 12/12/2043 USD 2,514,000 2,453,436 0.63
J.P. Morgan Mortgage Acquisition Trust, STEP, Series 2006-CH2 ‘AF4’ 5.763% 25/10/2036 USD 212,121 160,460 0.04
SCHEDULE OF INVESTMENTSAs at 30 June 2016
Investments Currency
Quantity/Nominal
Value
Market Value USD
% of Net Assets
Transferable securities and money market instruments admitted to official exchange listing or dealt in on another regulated market
Mortgage and Asset Backed Securities (continued)
United States of America (continued)J.P. Morgan Mortgage Trust, FRN,
Series 2005-A6 ‘1A2’ 2.742% 25/09/2035 USD 297,381 284,785 0.07
J.P. Morgan Mortgage Trust, FRN, Series 2007-A2 ‘2A3’ 2.860% 25/04/2037 USD 335,638 297,246 0.08
J.P. Morgan Mortgage Trust, FRN, Series 2008-R2 ‘1A1’, 144A 2.421% 27/07/2037 USD 590,248 551,872 0.14
JPMBB Commercial Mortgage Securities Trust, FRN, Series 2014-C19 ‘D’, 144A 4.831% 15/04/2047 USD 1,025,000 832,067 0.21
JPMBB Commercial Mortgage Securities Trust, FRN, Series 2014-C21 ‘D’, 144A 4.816% 15/08/2047 USD 726,000 597,483 0.15
KGS-Alpha SBA COOF Trust, FRN, Series 2013-2 ‘A’, 144A 1.565% 25/03/2039 USD 16,910,652 803,256 0.20
KGS-Alpha SBA COOF Trust, FRN, Series 2015-2 ‘A’, 144A 2.800% 25/07/2041 USD 13,742,658 1,917,527 0.49
LB-UBS Commercial Mortgage Trust, FRN, Series 2007-C6 ‘AJ’ 6.323% 15/07/2040 USD 2,526,000 2,517,870 0.64
LB-UBS Commercial Mortgage Trust, FRN, Series 2007-C7 ‘AJ’ 6.449% 15/09/2045 USD 850,000 851,693 0.22
Lehman ABS Manufactured Housing Contract Trust, FRN, Series 2001-B ‘M1’ 6.63% 15/04/2040 USD 2,000,000 2,159,148 0.55
Lehman ABS Manufactured Housing Contract Trust, Series 2001-B ‘A2’ 3.7% 15/04/2040 USD 244,707 246,323 0.06
Lehman Manufactured Housing Asset-Backed Fund, Series 1998-1 ‘1A1’ 6.635% 15/07/2028 USD 603,234 599,243 0.15
Lehman Mortgage Trust, Series 2006-1 ‘3A5’ 5.5% 25/02/2036 USD 123,415 116,744 0.03
Long Beach Mortgage Loan Trust, FRN, Series 2004-2 ‘A1’ 0.893% 25/06/2034 USD 1,616,828 1,444,807 0.37
Mastr Asset Backed Securities Trust, FRN, Series 2004-HE1 ‘M6’ 2.928% 25/09/2034 USD 1,164,000 1,121,959 0.29
MERIT Securities Corp., FRN, Series 13 ‘M1’ 7.830% 28/12/2033 USD 1,235,000 1,293,219 0.33
Merrill Lynch Mortgage Investors Trust, FRN, Series 2005-1 ‘2A2’ 2.458% 25/04/2035 USD 147,166 142,830 0.04
MortgageIT Trust, FRN, Series 2005-4 ‘M1’ 0.903% 25/10/2035 USD 1,561,772 1,368,888 0.35
Nationstar HECM Loan Trust, Series 2015-1A ‘A’, 144A 3.844% 25/05/2018 USD 2,055,590 2,058,077 0.52
Nationstar HECM Loan Trust, Series 2015-1A ‘M’, 144A 7.021% 25/05/2018 USD 2,700,000 2,686,932 0.68
Nationstar HECM Loan Trust, Series 2015-2A ‘M1’, 144A 4.115% 25/11/2025 USD 3,367,000 3,385,822 0.86
Nationstar HECM Loan Trust, Series 2015-2A ‘M2’, 144A 6.657% 25/11/2025 USD 1,319,000 1,318,802 0.34
Nationstar HECM Loan Trust, Series 2016-1A ‘M1’, 144A 4.36% 25/02/2026 USD 2,100,000 2,108,862 0.54

189 Morgan Stanley Investment Funds 30 June 2016
The accompanying notes are an integral part of these financial statements.
Global Mortgage Securities Fund (continued)
SCHEDULE OF INVESTMENTSAs at 30 June 2016
Investments Currency
Quantity/Nominal
Value
Market Value USD
% of Net Assets
Transferable securities and money market instruments admitted to official exchange listing or dealt in on another regulated market
Mortgage and Asset Backed Securities (continued)
United States of America (continued)Nationstar HECM Loan Trust,
Series 2016-1A ‘M2’, 144A 7.385% 25/02/2026 USD 2,000,000 2,012,540 0.51
Nationstar HECM Loan Trust, Series 2016-2A ‘M1’, 144A 3.598% 25/06/2026 USD 1,100,000 1,099,998 0.28
NovaStar Mortgage Funding Trust, FRN, Series 2003-4 ‘A1’ 1.186% 25/02/2034 USD 776,196 715,501 0.18
NRZ Advance Receivables Trust, Series 2015-T1 ‘ET1’, 144A 4.68% 15/08/2046 USD 832,000 831,384 0.21
NRZ Advance Receivables Trust, Series 2015-T4 ‘AT4’, 144A 3.196% 15/11/2047 USD 2,000,000 2,014,001 0.51
Oakwood Mortgage Investors, Inc., FRN, Series 1999-D ‘A1’ 7.84% 15/11/2029 USD 2,088,631 2,092,338 0.53
Oakwood Mortgage Investors, Inc., Series 2000-C ‘A1’ 7.72% 15/04/2030 USD 530,644 563,632 0.14
OnDeck Asset Securitization Trust II LLC, Series 2016-1A ‘A’, 144A 4.21% 17/05/2020 USD 2,000,000 2,000,000 0.51
Option One Mortgage Accept Corp., FRN, Series 2003-5 ‘A2’ 1.093% 25/08/2033 USD 111,369 106,180 0.03
People’s Choice Home Loan Securities Trust, FRN, Series 2004-1 ‘A3’ 1.493% 25/06/2034 USD 912,453 841,138 0.21
Prime Mortgage Trust, Series 2006-2 ‘1A14’ 6.25% 25/11/2036 USD 294,736 279,046 0.07
Progress Residential Trust, FRN, Series 2014-SFR1 ‘E’, 144A 4.596% 17/10/2031 USD 1,000,000 1,001,480 0.26
RALI Trust, FRN, Series 2003-QA1 ‘A2’ 1.153% 25/12/2033 USD 1,070,286 931,624 0.24
RALI Trust, Series 2004-QS16 ‘1A5’ 5.5% 25/12/2034 USD 1,464,936 1,439,145 0.37
RALI Trust, Series 2006-QS4 ‘A2’ 6% 25/04/2036 USD 12,632 10,447 0.00
RALI Trust, Series 2006-QS5 ‘A6’ 6% 25/05/2036 USD 1,612,224 1,379,713 0.35
RBSSP Resecuritization Trust, FRN, Series 2009-8 ‘7A1’, 144A 15.806% 26/09/2037 USD 1,241,436 1,719,630 0.44
RMAT LLC, STEP, Series 2015-PR1 ‘A1’, 144A 4.826% 25/06/2035 USD 1,086,690 1,066,340 0.27
Saxon Asset Securities Trust, FRN, Series 1999-2 ‘BF1’ 8.41% 25/05/2029 USD 1,495,415 1,483,333 0.38
Security National Mortgage Loan Trust, FRN, Series 2006-1A ‘1A3’, 144A 6.45% 25/09/2036 USD 1,200,000 1,181,009 0.30
Skopos Auto Receivables Trust, Series 2015-2A ‘A’, 144A 3.55% 15/02/2020 USD 339,645 339,354 0.09
SPS Servicer Advance Receivables Trust, Series 2015-T3 ‘AT3’, 144A 2.92% 15/07/2047 USD 1,000,000 1,004,623 0.26
STARM Mortgage Loan Trust, FRN, Series 2007-4 ‘3A1’ 3.096% 25/10/2037 USD 331,888 296,424 0.08
Structured Adjustable Rate Mortgage Loan Trust, FRN, Series 2007-5 ‘2A1’ 3.028% 25/06/2037 USD 704,412 642,012 0.16
SCHEDULE OF INVESTMENTSAs at 30 June 2016
Investments Currency
Quantity/Nominal
Value
Market Value USD
% of Net Assets
Transferable securities and money market instruments admitted to official exchange listing or dealt in on another regulated market
Mortgage and Asset Backed Securities (continued)
United States of America (continued)SWAY Residential Trust, FRN,
Series 2014-1 ‘E’, 144A 4.746% 17/01/2032 USD 757,000 759,527 0.19
TBW Mortgage-Backed Trust, Series 2006-2 ‘1A1’ 6% 25/07/2036 USD 410,233 276,450 0.07
Tricon American Homes Trust, FRN, Series 2015-SFR1 ‘E’, 144A 3.437% 17/05/2032 USD 1,500,000 1,427,851 0.36
VOLT XIX LLC, STEP, Series 2014-NP11 ‘A2’, 144A 5% 25/04/2055 USD 500,000 485,979 0.12
VOLT XXII LLC, STEP, Series 2015-NPL4 ‘A1’, 144A 3.5% 25/02/2055 USD 402,427 401,275 0.10
VOLT XXII LLC, STEP, Series 2015-NPL4 ‘A2’, 144A 4.25% 25/02/2055 USD 698,770 670,098 0.17
VOLT XXXIX LLC, STEP, Series 2015-NP13 ‘A1’, 144A 4.125% 25/10/2045 USD 1,283,870 1,288,687 0.33
VOLT XXXIII LLC, STEP, Series 2015-NPL5 ‘A2’, 144A 4.25% 25/03/2055 USD 1,834,695 1,756,356 0.45
Wachovia Bank Commercial Mortgage Trust, FRN, Series 2006-C28 ‘AM’ 5.603% 15/10/2048 USD 385,000 387,506 0.10
Washington Mutural Asset-Backed Certificates WMABS Trust, FRN, Series 2006-HE5 ‘2A1’ 0.513% 25/10/2036 USD 2,093,450 1,075,656 0.27
Wells Fargo Commercial Mortgage Trust, Series 2014-LC16 ‘D’, 144A 3.938% 15/08/2050 USD 1,235,000 976,470 0.25
Wells Fargo Commercial Mortgage Trust, Series 2015-NXS3 ‘D’, 144A 3.153% 15/09/2057 USD 1,116,000 721,745 0.18
Wells Fargo Mortgage Backed Securities Trust, FRN, Series 2005-AR8 ‘2A1’ 2.869% 25/06/2035 USD 121,758 124,191 0.03
Wells Fargo Mortgage Backed Securities Trust, FRN, Series 2006-AR11 ‘A6’ 2.887% 25/08/2036 USD 218,045 206,182 0.05
Wells Fargo Mortgage Backed Securities Trust, Series 2007-11 ‘A85’ 6% 25/08/2037 USD 176,917 175,006 0.04
WFRBS Commercial Mortgage Trust, FRN, Series 2013-C13 ‘D’, 144A 4.275% 15/05/2045 USD 550,000 481,125 0.12
WFRBS Commercial Mortgage Trust, FRN, Series 2013-C15 ‘D’, 144A 4.629% 15/08/2046 USD 2,584,000 2,298,336 0.59
WFRBS Commercial Mortgage Trust, FRN, Series 2013-C16 ‘D’, 144A 5.149% 15/09/2046 USD 1,285,000 1,208,646 0.31
WFRBS Commercial Mortgage Trust, Series 2014-C20 ‘D’, 144A 3.986% 15/05/2047 USD 768,000 564,212 0.14
284,643,130 72.56
Total Mortgage and Asset Backed Securities 383,817,753 97.84
Total Transferable securities and money market instruments admitted to official exchange listing or dealt in on another regulated market 404,309,237 103.06
Morgan Stanley Investment Funds 30 June 2016 190
The accompanying notes are an integral part of these financial statements.
Global Mortgage Securities Fund (continued)
Financial Futures Contracts
Security DescriptionNumber of Contracts Currency
Global Exposure
USD
Unrealised Gain/(Loss)
USD
% of Net Assets
US 10 Year Note, 21/09/2016 148 USD 19,672,437 351,547 0.09US 5 Year Note, 30/09/2016 27 USD 3,295,055 22,664 0.00US Long Bond, 21/09/2016 142 USD 24,557,125 1,522,063 0.39US Ultra Bond, 21/09/2016 59 USD 11,040,375 788,664 0.20
Total Unrealised Gain on Financial Futures Contracts 2,684,938 0.68
US 2 Year Note, 30/09/2016 (464) USD (101,724,750) (667,000) (0.17)
Total Unrealised Loss on Financial Futures Contracts (667,000) (0.17)
Net Unrealised Gain on Financial Futures Contracts 2,017,938 0.51
Forward Currency Exchange Contracts
Currency Purchased
Amount Purchased
Currency Sold
Amount Sold
Maturity Date Counterparty
Unrealised Gain/(Loss)
USD
% of Net Assets
USD 78,075 EUR 69,522 08/07/2016 ANZ 781 0.00USD 56,133,336 EUR 50,331,972 08/07/2016 UBS 174,624 0.05USD 2,735,073 GBP 2,024,269 08/07/2016 Citibank 14,912 0.01USD 1,965,403 GBP 1,349,821 08/07/2016 HSBC 151,548 0.04USD 40,423,589 GBP 27,608,441 08/07/2016 UBS 3,324,069 0.85
Unrealised Gain on Forward Currency Exchange Contracts 3,665,934 0.95
EUR Hedged Share ClassEUR 520,335 USD 574,728 01/07/2016 J.P. Morgan 3,696 0.00USD 450,158 EUR 399,063 01/07/2016 J.P. Morgan 6,544 0.00EUR 292,680,319 USD 323,476,200 08/07/2016 J.P. Morgan 1,923,598 0.48USD 58,606 EUR 52,702 08/07/2016 J.P. Morgan 12 0.00
Unrealised Gain on NAV Hedged Share Classes Forward Currency Exchange Contracts 1,933,850 0.48
Total Unrealised Gain on Forward Currency Exchange Contracts 5,599,784 1.43
EUR 388,242 USD 442,204 08/07/2016 Citibank (10,560) 0.00EUR 858,523 USD 974,216 08/07/2016 HSBC (19,718) (0.01)EUR 369,107 USD 414,684 08/07/2016 UBS (4,313) 0.00GBP 148,598 USD 210,466 08/07/2016 Citibank (10,784) 0.00GBP 53,474 USD 77,014 08/07/2016 HSBC (5,156) 0.00GBP 91,997 USD 131,245 08/07/2016 UBS (7,622) 0.00USD 2,498,305 EUR 2,261,319 08/07/2016 UBS (15,812) (0.01)
Unrealised Loss on Forward Currency Exchange Contracts (73,965) (0.02)
EUR Hedged Share ClassEUR 292,077,500 USD 329,036,951 01/07/2016 J.P. Morgan (4,351,933) (1.11)USD 322,850,490 EUR 292,198,772 01/07/2016 J.P. Morgan (1,969,340) (0.50)EUR 162,198 USD 180,367 08/07/2016 J.P. Morgan (35) 0.00USD 147,284 EUR 133,142 08/07/2016 J.P. Morgan (742) 0.00
Unrealised Loss on NAV Hedged Share Classes Forward Currency Exchange Contracts (6,322,050) (1.61)
Total Unrealised Loss on Forward Currency Exchange Contracts (6,396,015) (1.63)
Net Unrealised Loss on Forward Currency Exchange Contracts (796,231) (0.20)
SCHEDULE OF INVESTMENTSAs at 30 June 2016
Investments Currency
Quantity/Nominal
Value
Market Value USD
% of Net Assets
Units of authorised UCITS or other collective investment undertakings
Collective Investment Schemes – UCITS
LuxembourgMorgan Stanley Liquidity Funds US Dollar
Liquidity Fund – MS Reserve (4) USD 15,429,650 15,429,650 3.93
15,429,650 3.93
Total Collective Investment Schemes – UCITS 15,429,650 3.93
Total Units of authorised UCITS or other collective investment undertakings 15,429,650 3.93
Total Investments 419,738,887 106.99
Cash (398,367) (0.10)
Other Assets/(Liabilities) (27,019,774) (6.89)
Total Net Assets 392,320,746 100.00
(2) The country in brackets represents the country of incorporation of this security.(3) Security is valued at its fair value under the direction of the Board of Directors of the SICAV.(4) Affiliate managed by an affiliate of the Investment Adviser.
DERIVATIVES
Over-the-counter (OTC) and exchange traded derivatives as at 30 June 2016, expressed in US dollars.

191 Morgan Stanley Investment Funds 30 June 2016
The accompanying notes are an integral part of these financial statements.
Global Mortgage Securities Fund (continued)
Interest Rate Swap Contracts
Nominal Amount Ccy Counterparty
Security Description
Maturity Date
Market Value USD
Unrealised Gain/(Loss)
USD
% of Net Assets
13,455,000 USD Barclays Pay fixed 1.124% Receive floating LIBOR
3 month 24/07/2017 (112,090) (112,090) (0.03)
Total Unrealised Loss on Interest Rate Swap Contracts (112,090) (112,090) (0.03)
Net Unrealised Loss on Interest Rate Swap Contracts (112,090) (112,090) (0.03)
Collateral received and paid by the Fund in respect of financial derivative instruments:
Type of Collateral Counterparty CurrencyCollateral Amount
receivedCollateral Amount
paid
Global Mortgage Securities Fund
Cash Goldman Sachs USD - 1,254,924
- 1,254,924
DERIVATIVES (continued)
Over-the-counter (OTC) and exchange traded derivatives as at 30 June 2016, expressed in US dollars.
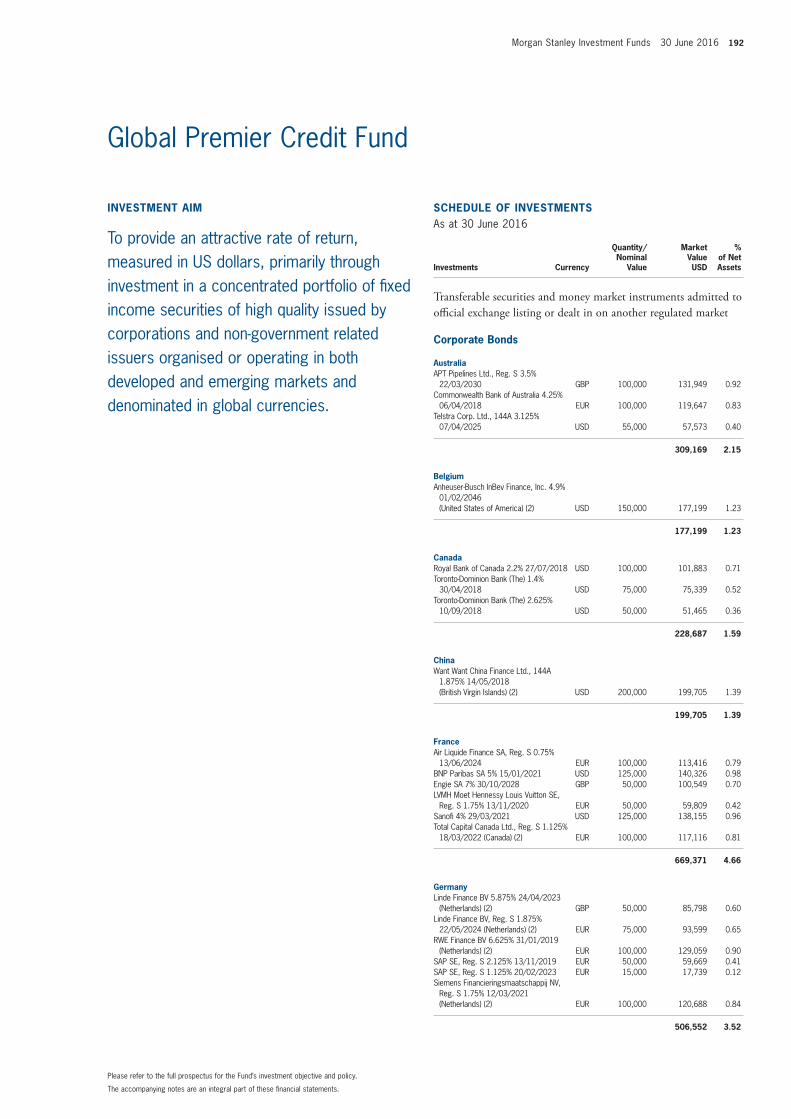
Morgan Stanley Investment Funds 30 June 2016 192
The accompanying notes are an integral part of these financial statements.
Please refer to the full prospectus for the Fund’s investment objective and policy.
INVESTMENT AIM
To provide an attractive rate of return, measured in US dollars, primarily through investment in a concentrated portfolio of fixed income securities of high quality issued by corporations and non-government related issuers organised or operating in both developed and emerging markets and denominated in global currencies.
SCHEDULE OF INVESTMENTSAs at 30 June 2016
Investments Currency
Quantity/Nominal
Value
Market Value USD
% of Net Assets
Transferable securities and money market instruments admitted to official exchange listing or dealt in on another regulated market
Corporate Bonds
AustraliaAPT Pipelines Ltd., Reg. S 3.5%
22/03/2030 GBP 100,000 131,949 0.92Commonwealth Bank of Australia 4.25%
06/04/2018 EUR 100,000 119,647 0.83Telstra Corp. Ltd., 144A 3.125%
07/04/2025 USD 55,000 57,573 0.40
309,169 2.15
BelgiumAnheuser-Busch InBev Finance, Inc. 4.9%
01/02/2046 (United States of America) (2) USD 150,000 177,199 1.23
177,199 1.23
CanadaRoyal Bank of Canada 2.2% 27/07/2018 USD 100,000 101,883 0.71Toronto-Dominion Bank (The) 1.4%
30/04/2018 USD 75,000 75,339 0.52Toronto-Dominion Bank (The) 2.625%
10/09/2018 USD 50,000 51,465 0.36
228,687 1.59
ChinaWant Want China Finance Ltd., 144A
1.875% 14/05/2018 (British Virgin Islands) (2) USD 200,000 199,705 1.39
199,705 1.39
FranceAir Liquide Finance SA, Reg. S 0.75%
13/06/2024 EUR 100,000 113,416 0.79BNP Paribas SA 5% 15/01/2021 USD 125,000 140,326 0.98Engie SA 7% 30/10/2028 GBP 50,000 100,549 0.70LVMH Moet Hennessy Louis Vuitton SE,
Reg. S 1.75% 13/11/2020 EUR 50,000 59,809 0.42Sanofi 4% 29/03/2021 USD 125,000 138,155 0.96Total Capital Canada Ltd., Reg. S 1.125%
18/03/2022 (Canada) (2) EUR 100,000 117,116 0.81
669,371 4.66
GermanyLinde Finance BV 5.875% 24/04/2023
(Netherlands) (2) GBP 50,000 85,798 0.60Linde Finance BV, Reg. S 1.875%
22/05/2024 (Netherlands) (2) EUR 75,000 93,599 0.65RWE Finance BV 6.625% 31/01/2019
(Netherlands) (2) EUR 100,000 129,059 0.90SAP SE, Reg. S 2.125% 13/11/2019 EUR 50,000 59,669 0.41SAP SE, Reg. S 1.125% 20/02/2023 EUR 15,000 17,739 0.12Siemens Financieringsmaatschappij NV,
Reg. S 1.75% 12/03/2021 (Netherlands) (2) EUR 100,000 120,688 0.84
506,552 3.52
Global Premier Credit Fund

193 Morgan Stanley Investment Funds 30 June 2016
The accompanying notes are an integral part of these financial statements.
Global Premier Credit Fund (continued)
SCHEDULE OF INVESTMENTSAs at 30 June 2016
Investments Currency
Quantity/Nominal
Value
Market Value USD
% of Net Assets
Transferable securities and money market instruments admitted to official exchange listing or dealt in on another regulated market
Corporate Bonds (continued)
JapanNippon Telegraph & Telephone Corp. 1.4%
18/07/2017 USD 100,000 100,241 0.70Sumitomo Mitsui Banking Corp., 144A
2.65% 12/01/2017 USD 200,000 201,474 1.40
301,715 2.10
NetherlandsSchlumberger Finance BV, Reg. S 1.5%
04/03/2019 EUR 100,000 115,782 0.81Shell International Finance BV 2.125%
11/05/2020 USD 150,000 152,948 1.06Unilever Capital Corp. 4.25% 10/02/2021
(United States of America) (2) USD 100,000 112,043 0.78
380,773 2.65
NorwayDNB Bank ASA, Reg. S 4.375%
24/02/2021 EUR 100,000 132,310 0.92
132,310 0.92
SwedenNordea Bank AB, Reg. S 4% 11/07/2019 EUR 100,000 124,520 0.87
124,520 0.87
SwitzerlandNestle Finance International Ltd., Reg. S
1.5% 19/07/2019 (Luxembourg) (2) EUR 100,000 116,549 0.81Roche Holdings, Inc., 144A 3.35%
30/09/2024 (United States of America) (2) USD 200,000 218,413 1.52
UBS Group Funding Jersey Ltd., 144A 2.95% 24/09/2020 (Jersey) (2) USD 200,000 203,628 1.42
538,590 3.75
TaiwanTSMC Global Ltd., 144A 1.625%
03/04/2018 (British Virgin Islands) (2) USD 200,000 200,089 1.39
200,089 1.39
United KingdomBAT International Finance plc, Reg. S
3.625% 09/11/2021 EUR 100,000 129,211 0.90BP Capital Markets plc, Reg. S 2.177%
28/09/2021 EUR 100,000 121,056 0.84GlaxoSmithKline Capital, Inc. 6.375%
15/05/2038 (United States of America) (2) USD 50,000 71,712 0.50
GlaxoSmithKline Capital, Inc. 4.2% 18/03/2043 (United States of America) (2) USD 75,000 85,299 0.60
Imperial Tobacco Finance plc, Reg. S 7.75% 24/06/2019 GBP 75,000 118,284 0.82
SCHEDULE OF INVESTMENTSAs at 30 June 2016
Investments Currency
Quantity/Nominal
Value
Market Value USD
% of Net Assets
Transferable securities and money market instruments admitted to official exchange listing or dealt in on another regulated market
Corporate Bonds (continued)
United Kingdom (continued)Santander UK Group Holdings plc 3.125%
08/01/2021 USD 125,000 125,313 0.87Standard Chartered plc, Reg. S 1.75%
29/10/2017 EUR 100,000 113,478 0.79
764,353 5.32
United States of America21st Century Fox America, Inc. 4.75%
15/09/2044 USD 125,000 138,372 0.963M Co. 2% 26/06/2022 USD 125,000 128,036 0.89Alphabet, Inc. 3.375% 25/02/2024 USD 175,000 192,947 1.34Amazon.com, Inc. 3.8% 05/12/2024 USD 100,000 112,235 0.78American Express Co. 8.125%
20/05/2019 USD 75,000 88,084 0.61American Express Credit Corp. 2.375%
26/05/2020 USD 25,000 25,571 0.18Apple, Inc. 3.85% 04/05/2043 USD 50,000 50,571 0.35Apple, Inc. 4.45% 06/05/2044 USD 100,000 110,986 0.77AT&T, Inc. 6.3% 15/01/2038 USD 125,000 151,018 1.05Automatic Data Processing, Inc. 3.375%
15/09/2025 USD 50,000 54,430 0.38Bank of America Corp. 4% 01/04/2024 USD 175,000 186,847 1.30Bank of New York Mellon Corp. (The)
2.15% 24/02/2020 USD 150,000 153,139 1.07Boston Properties LP, REIT 3.65%
01/02/2026 USD 75,000 79,773 0.55Burlington Northern Santa Fe LLC 6.15%
01/05/2037 USD 100,000 134,040 0.93Capital One Financial Corp. 2.45%
24/04/2019 USD 100,000 101,824 0.71CenterPoint Energy Houston Electric LLC
1.85% 01/06/2021 USD 100,000 100,800 0.70Chevron Corp. 2.419% 17/11/2020 USD 75,000 77,513 0.54Chevron Corp. 3.191% 24/06/2023 USD 50,000 53,082 0.37Cisco Systems, Inc. 4.45% 15/01/2020 USD 125,000 138,164 0.96Citigroup, Inc. 3.7% 12/01/2026 USD 175,000 184,287 1.28Coca-Cola Co. (The) 2.875% 27/10/2025 USD 125,000 132,304 0.92Comcast Corp. 4.6% 15/08/2045 USD 50,000 58,004 0.40CSX Corp. 4.75% 30/05/2042 USD 125,000 143,267 1.00CVS Health Corp. 4.125% 15/05/2021 USD 150,000 165,207 1.15Discover Financial Services 3.95%
06/11/2024 USD 100,000 103,269 0.72Entergy Arkansas, Inc. 3.5% 01/04/2026 USD 50,000 54,855 0.38Enterprise Products Operating LLC 4.45%
15/02/2043 USD 25,000 25,223 0.18Estee Lauder Cos., Inc. (The) 1.7%
10/05/2021 USD 75,000 75,801 0.53Exxon Mobil Corp. 2.397% 06/03/2022 USD 200,000 205,811 1.43GE Capital International Funding Co., 144A
4.418% 15/11/2035 (Ireland) (2) USD 200,000 225,935 1.57General Electric Co. 2.7% 09/10/2022 USD 150,000 156,985 1.09Gilead Sciences, Inc. 5.65% 01/12/2041 USD 100,000 126,203 0.88Goldman Sachs Group, Inc. (The) 3.625%
22/01/2023 USD 100,000 105,120 0.73Home Depot, Inc. (The) 3.35%
15/09/2025 USD 100,000 109,219 0.76Honeywell International, Inc. 1.3%
22/02/2023 EUR 100,000 115,814 0.81HSBC USA, Inc. 3.5% 23/06/2024 USD 200,000 206,442 1.44Intel Corp. 2.7% 15/12/2022 USD 100,000 104,780 0.73J.P. Morgan Chase & Co. 3.125%
23/01/2025 USD 50,000 51,231 0.36

Morgan Stanley Investment Funds 30 June 2016 194
The accompanying notes are an integral part of these financial statements.
Global Premier Credit Fund (continued)
SCHEDULE OF INVESTMENTSAs at 30 June 2016
Investments Currency
Quantity/Nominal
Value
Market Value USD
% of Net Assets
Transferable securities and money market instruments admitted to official exchange listing or dealt in on another regulated market
Corporate Bonds (continued)
United States of America (continued)J.P. Morgan Chase & Co., Reg. S 2.875%
24/05/2028 EUR 100,000 128,881 0.90Johnson & Johnson 4.5% 01/09/2040 USD 100,000 124,860 0.87McDonald’s Corp. 2.625% 15/01/2022 USD 150,000 155,207 1.08Merck & Co., Inc. 2.8% 18/05/2023 USD 150,000 157,540 1.10MetLife, Inc. 7.717% 15/02/2019 USD 175,000 202,503 1.41Microsoft Corp. 2.375% 01/05/2023 USD 100,000 102,827 0.72National Grid North America, Inc., Reg. S
1.75% 20/02/2018 EUR 100,000 114,398 0.80NBCUniversal Media LLC 4.375%
01/04/2021 USD 100,000 112,069 0.78New York Life Global Funding, 144A 1.95%
11/02/2020 USD 75,000 75,972 0.53NIKE, Inc. 2.25% 01/05/2023 USD 100,000 103,099 0.72Omnicom Group, Inc. 3.625%
01/05/2022 USD 125,000 132,844 0.92Oracle Corp. 2.25% 10/01/2021 EUR 100,000 121,934 0.85Oracle Corp. 2.95% 15/05/2025 USD 26,000 27,203 0.19Pacific Gas & Electric Co. 4.45%
15/04/2042 USD 125,000 141,945 0.99PepsiCo, Inc. 2.75% 05/03/2022 USD 125,000 130,978 0.91PNC Funding Corp. 3.3% 08/03/2022 USD 150,000 159,985 1.11Praxair, Inc. 2.7% 21/02/2023 USD 125,000 130,495 0.91Procter & Gamble Co. (The) 4.875%
11/05/2027 EUR 100,000 159,246 1.11Protective Life Global Funding, 144A 2.7%
25/11/2020 USD 150,000 155,179 1.08Simon Property Group LP, REIT 2.75%
01/02/2023 USD 150,000 154,524 1.08Starbucks Corp. 2.1% 04/02/2021 USD 125,000 128,299 0.89State Street Corp. 3.7% 20/11/2023 USD 150,000 164,803 1.15Target Corp. 2.9% 15/01/2022 USD 125,000 132,831 0.92Time Warner, Inc. 4.65% 01/06/2044 USD 75,000 79,774 0.55Travelers Cos., Inc. (The) 3.9%
01/11/2020 USD 100,000 109,507 0.76Travelers Cos., Inc. (The) 3.75%
15/05/2046 USD 25,000 26,217 0.18Union Pacific Corp. 4.3% 15/06/2042 USD 100,000 111,802 0.78United Parcel Service, Inc. 3.125%
15/01/2021 USD 125,000 134,166 0.93US Bancorp 2.95% 15/07/2022 USD 175,000 182,363 1.27USAA Capital Corp., 144A 2.125%
03/06/2019 USD 150,000 153,797 1.07Verizon Communications, Inc. 4.272%
15/01/2036 USD 40,000 41,145 0.29Verizon Communications, Inc. 4.672%
15/03/2055 USD 111,000 112,447 0.78Virginia Electric & Power Co. 2.95%
15/01/2022 USD 125,000 130,938 0.91Visa, Inc. 4.3% 14/12/2045 USD 100,000 116,582 0.81Wal-Mart Stores, Inc. 6.5% 15/08/2037 USD 100,000 145,656 1.01Walt Disney Co. (The) 2.15% 17/09/2020 USD 125,000 129,068 0.90Wells Fargo & Co. 3.9% 01/05/2045 USD 125,000 132,177 0.92
9,050,450 62.98
Total Corporate Bonds 13,583,483 94.52
Total Transferable securities and money market instruments admitted to official exchange listing or dealt in on another regulated market 13,583,483 94.52
SCHEDULE OF INVESTMENTSAs at 30 June 2016
Investments Currency
Quantity/Nominal
Value
Market Value USD
% of Net Assets
Units of authorised UCITS or other collective investment undertakings
Collective Investment Schemes – UCITS
LuxembourgMorgan Stanley Liquidity Funds US Dollar
Liquidity Fund – MS Reserve (4) USD 510,963 510,963 3.56
510,963 3.56
Total Collective Investment Schemes – UCITS 510,963 3.56
Total Units of authorised UCITS or other collective investment undertakings 510,963 3.56
Total Investments 14,094,446 98.08
Cash 354,053 2.46
Other Assets/(Liabilities) (78,257) (0.54)
Total Net Assets 14,370,242 100.00
(2) The country in brackets represents the country of incorporation of this security.(4) Affiliate managed by an affiliate of the Investment Adviser.

195 Morgan Stanley Investment Funds 30 June 2016
The accompanying notes are an integral part of these financial statements.
Global Premier Credit Fund (continued)
Forward Currency Exchange Contracts (continued)
Currency Purchased
Amount Purchased
Currency Sold
Amount Sold
Maturity Date Counterparty
Unrealised Gain/(Loss)
USD
% of Net Assets
EUR Hedged Share ClassEUR 518,664 USD 584,296 01/07/2016 J.P. Morgan (7,728) (0.06)USD 573,072 EUR 518,664 01/07/2016 J.P. Morgan (3,496) (0.03)
Unrealised Loss on NAV Hedged Share Classes Forward Currency Exchange Contracts (11,224) (0.09)
Total Unrealised Loss on Forward Currency Exchange Contracts (32,333) (0.23)
Net Unrealised Loss on Forward Currency Exchange Contracts (11,182) (0.08)
Interest Rate Swap Contracts
Nominal Amount Ccy Counterparty
Security Description
Maturity Date
Market Value USD
Unrealised Gain/(Loss)
USD
% of Net Assets
400,000 USD Barclays Pay fixed 2.435% Receive floating LIBOR
3 month 20/07/2025 (44,501) (44,501) (0.31)315,000 USD Citibank Pay fixed 2.43%
Receive floating LIBOR 3 month 17/07/2025 (34,898) (34,898) (0.24)
500,000 USD Barclays Pay fixed 1.775% Receive floating LIBOR
3 month 20/07/2020 (20,642) (20,642) (0.15)580,000 USD Barclays Pay fixed 1.715%
Receive floating LIBOR 3 month 19/03/2020 (20,430) (20,430) (0.14)
240,000 USD Societe Generale Pay fixed 1.695% Receive floating LIBOR
3 month 20/03/2020 (8,269) (8,269) (0.06)
Total Unrealised Loss on Interest Rate Swap Contracts (128,740) (128,740) (0.90)
Net Unrealised Loss on Interest Rate Swap Contracts (128,740) (128,740) (0.90)
Collateral received and paid by the Fund in respect of financial derivative instruments:
Type of Collateral Counterparty CurrencyCollateral Amount
receivedCollateral Amount
paid
Global Premier Credit Fund
Cash Goldman Sachs USD 41,014 -
41,014 -
Financial Futures Contracts
Security DescriptionNumber of Contracts Currency
Global Exposure
USD
Unrealised Gain/(Loss)
USD
% of Net Assets
Euro-Bobl, 08/09/2016 4 EUR 593,838 5,958 0.04Euro-OAT, 08/09/2016 1 EUR 178,418 4,335 0.03Australia 10 Year Bond, 15/09/2016 2 AUD 202,561 2,125 0.01Canada 10 Year Bond, 21/09/2016 2 CAD 227,586 5,314 0.04US 10 Year Ultra Note, 21/09/2016 4 USD 582,813 20,391 0.14US Long Bond, 21/09/2016 1 USD 172,937 5,500 0.04Long Gilt, 28/09/2016 2 GBP 343,919 15,050 0.10US 2 Year Note, 30/09/2016 10 USD 2,192,344 14,375 0.10
Unrealised Gain on Financial Futures Contracts 73,048 0.50
Total Unrealised Gain on Financial Futures Contracts 73,048 0.50
US 10 Year Note, 21/09/2016 (5) USD (664,609) (17,774) (0.12)US Ultra Bond, 21/09/2016 (3) USD (561,375) (36,164) (0.25)US 5 Year Note, 30/09/2016 (5) USD (610,195) (10,445) (0.07)
Unrealised Loss on Financial Futures Contracts (64,383) (0.44)
Total Unrealised Loss on Financial Futures Contracts (64,383) (0.44)
Net Unrealised Gain on Financial Futures Contracts 8,665 0.06
Forward Currency Exchange Contracts (continued)
Currency Purchased
Amount Purchased
Currency Sold
Amount Sold
Maturity Date Counterparty
Unrealised Gain/(Loss)
USD
% of Net Assets
CAD 457,000 USD 350,761 07/07/2016 RBC 1,186 0.01USD 119,718 EUR 105,000 08/07/2016 J.P. Morgan 2,980 0.02USD 79,633 EUR 70,000 08/07/2016 RBC 1,807 0.01CHF 80,000 USD 80,887 12/07/2016 UBS 1,225 0.01JPY 7,650,000 EUR 64,088 25/07/2016 RBC 3,186 0.02JPY 22,650,000 USD 213,373 25/07/2016 Westpac Banking 7,157 0.05CAD 482,000 USD 371,018 05/08/2016 RBC 224 0.00
Unrealised Gain on Forward Currency Exchange Contracts 17,765 0.12
EUR Hedged Share ClassEUR 515,255 USD 569,470 08/07/2016 J.P. Morgan 3,386 0.03
Unrealised Gain on NAV Hedged Share Classes Forward Currency Exchange Contracts 3,386 0.03
Total Unrealised Gain on Forward Currency Exchange Contracts 21,151 0.15
CAD 25,000 USD 19,619 07/07/2016 UBS (366) 0.00USD 371,001 CAD 482,000 07/07/2016 RBC (200) 0.00EUR 35,000 USD 39,098 08/07/2016 J.P. Morgan (185) 0.00EUR 85,000 USD 96,056 08/07/2016 UBS (1,554) (0.01)EUR 766,000 USD 853,352 08/07/2016 Westpac Banking (1,718) (0.01)GBP 242,000 USD 342,310 20/07/2016 HSBC (17,086) (0.12)
Unrealised Loss on Forward Currency Exchange Contracts (21,109) (0.14)
DERIVATIVES (continued)
Over-the-counter (OTC) and exchange traded derivatives as at 30 June 2016, expressed in US dollars.
DERIVATIVES
Over-the-counter (OTC) and exchange traded derivatives as at 30 June 2016, expressed in US dollars.

Morgan Stanley Investment Funds 30 June 2016 196
The accompanying notes are an integral part of these financial statements.
Please refer to the full prospectus for the Fund’s investment objective and policy.
INVESTMENT AIM
To provide an attractive rate of return, measured in Euro, through market and instrument selection. This objective will be achieved by investing in high quality fixed income securities denominated in the Euro. The Fund will invest primarily, in order to reduce volatility, in individual securities with maturity dates having a maximum unexpired term of five years.
SCHEDULE OF INVESTMENTSAs at 30 June 2016
Investments Currency
Quantity/Nominal
Value
Market Value EUR
% of Net Assets
Transferable securities and money market instruments admitted to official exchange listing or dealt in on another regulated market
Corporate Bonds
AustraliaAusNet Services Holdings Pty. Ltd., Reg. S
2.375% 24/07/2020 EUR 5,000,000 5,401,137 0.39Australia & New Zealand Banking Group
Ltd., Reg. S 5.125% 10/09/2019 (1) EUR 4,450,000 5,082,031 0.37BHP Billiton Finance Ltd., Reg. S 2.125%
29/11/2018 EUR 4,000,000 4,197,819 0.31Commonwealth Bank of Australia 5.5%
06/08/2019 (1) EUR 2,600,000 2,978,470 0.22Macquarie Bank Ltd., Reg. S 2.5%
18/09/2018 (1) EUR 1,700,000 1,787,207 0.13Macquarie Bank Ltd., Reg. S 1%
16/09/2019 (1) EUR 2,000,000 2,038,972 0.15Macquarie Bank Ltd., Reg. S 0.375%
03/03/2021 EUR 8,000,000 8,146,826 0.59National Australia Bank Ltd., Reg. S, FRN
0.231% 25/03/2019 (1) EUR 5,000,000 5,017,300 0.37National Australia Bank Ltd., Reg. S
4.625% 10/02/2020 (1) EUR 4,000,000 4,549,495 0.33Scentre Group Trust 1, REIT, Reg. S, FRN
0.399% 16/07/2018 EUR 3,250,000 3,261,489 0.24Transurban Finance Co. Pty. Ltd. 2.5%
08/10/2020 EUR 3,000,000 3,223,983 0.24Westpac Banking Corp., Reg. S 0.875%
16/02/2021 EUR 5,250,000 5,393,245 0.39
51,077,974 3.73
BelgiumAnheuser-Busch InBev SA NV, Reg. S 2%
16/12/2019 EUR 2,500,000 2,670,686 0.19Anheuser-Busch InBev SA NV, Reg. S
0.625% 17/03/2020 EUR 5,200,000 5,296,304 0.39Fluxys Belgium SA 4.25% 03/05/2018 EUR 3,255,000 3,482,524 0.25Solvay SA, Reg. S, FRN 0.559%
01/12/2017 EUR 2,300,000 2,314,709 0.17
13,764,223 1.00
CanadaBank of Nova Scotia (The), Reg. S, FRN
0.116% 10/09/2018 EUR 6,700,000 6,712,764 0.49Caisse Centrale Desjardins, Reg. S 0.375%
22/10/2019 EUR 5,850,000 5,952,940 0.43Canadian Imperial Bank of Commerce,
Reg. S, FRN 0% 08/09/2017 EUR 7,750,000 7,754,572 0.57Royal Bank of Canada, Reg. S, FRN
0.177% 06/08/2020 EUR 10,000,000 10,020,450 0.73Toronto-Dominion Bank (The), Reg. S
0.625% 08/03/2021 (1) EUR 11,500,000 11,673,168 0.85
42,113,894 3.07
ChinaBank of China Ltd., Reg. S, FRN 0.719%
30/06/2018 (1) EUR 3,100,000 3,108,665 0.23Bao-trans Enterprises Ltd., Reg. S 1.625%
23/02/2018 (Hong Kong) (2) EUR 2,000,000 2,007,673 0.15Beijing Energy Investment Holdings Ltd.,
Reg. S 1.5% 28/07/2018 (British Virgin Islands) (2) EUR 3,500,000 3,513,213 0.26
CNOOC Curtis Funding No. 1 Pty. Ltd., Reg. S 2.75% 03/10/2020 (Australia) (2) EUR 6,300,000 6,717,887 0.49
Short Maturity Euro Bond Fund

197 Morgan Stanley Investment Funds 30 June 2016
The accompanying notes are an integral part of these financial statements.
Short Maturity Euro Bond Fund (continued)
SCHEDULE OF INVESTMENTSAs at 30 June 2016
Investments Currency
Quantity/Nominal
Value
Market Value EUR
% of Net Assets
Transferable securities and money market instruments admitted to official exchange listing or dealt in on another regulated market
Corporate Bonds (continued)
China (continued)Eastern Creation II Investment Holdings
Ltd., Reg. S 1.5% 29/07/2019 (British Virgin Islands) (2) EUR 4,600,000 4,641,054 0.34
Sinopec Group Overseas Development 2013 Ltd., Reg. S 2.625% 17/10/2020 (British Virgin Islands) (2) EUR 2,000,000 2,135,936 0.15
Sinopec Group Overseas Development 2015 Ltd., Reg. S 0.5% 27/04/2018 (British Virgin Islands) (2) EUR 7,000,000 7,039,537 0.51
29,163,965 2.13
CyprusAroundtown Property Holdings plc, Reg. S
1.5% 03/05/2022 EUR 2,600,000 2,537,628 0.19
2,537,628 0.19
Czech RepublicEP Energy A/S, Reg. S 4.375%
01/05/2018 EUR 975,000 1,024,515 0.07
1,024,515 0.07
DenmarkISS Global A/S, Reg. S 1.125%
09/01/2020 EUR 4,000,000 4,086,980 0.30ISS Global A/S, Reg. S 1.125%
07/01/2021 EUR 2,250,000 2,300,101 0.17Nykredit Realkredit A/S Bond, Reg. S
0.875% 13/06/2019 EUR 2,350,000 2,370,760 0.17
8,757,841 0.64
FinlandCitycon OYJ, Reg. S 3.75% 24/06/2020 EUR 3,000,000 3,384,501 0.25OP Corporate Bank plc, Reg. S 1.25%
14/05/2018 EUR 3,000,000 3,071,141 0.22OP Corporate Bank plc, Reg. S 0.875%
21/06/2021 EUR 4,350,000 4,477,251 0.33Saastopankkien Keskuspankki Suomi OYJ,
Reg. S, FRN 0.501% 26/01/2018 EUR 7,000,000 7,001,820 0.51Saastopankkien Keskuspankki Suomi OYJ,
Reg. S 1% 06/05/2020 EUR 2,100,000 2,114,920 0.15
20,049,633 1.46
FranceALD International SA 2% 26/05/2017 EUR 2,100,000 2,135,931 0.15Banque Federative du Credit Mutuel SA,
Reg. S 0.25% 14/06/2019 (1) EUR 8,500,000 8,542,236 0.62BNP Paribas SA 5.431% 07/09/2017 EUR 2,700,000 2,863,754 0.21BNP Paribas SA, Reg. S, FRN 0.151%
15/01/2020 (1) EUR 1,275,000 1,276,039 0.09BPCE SA, Reg. S 0.625% 20/04/2020 (1) EUR 3,900,000 3,963,305 0.29Engie SA, Reg. S 1.375% 19/05/2020 EUR 1,500,000 1,586,032 0.11Engie SA, Reg. S, FRN 3% Perpetual EUR 3,300,000 3,391,909 0.25GELF Bond Issuer I SA, REIT, Reg. S
3.125% 03/04/2018 (Luxembourg) (2) EUR 950,000 997,180 0.07Infra Park SAS, Reg. S 1.25%
16/10/2020 EUR 1,400,000 1,457,223 0.11
SCHEDULE OF INVESTMENTSAs at 30 June 2016
Investments Currency
Quantity/Nominal
Value
Market Value EUR
% of Net Assets
Transferable securities and money market instruments admitted to official exchange listing or dealt in on another regulated market
Corporate Bonds (continued)
France (continued)Societe Des Autoroutes Paris-Rhin-Rhone,
Reg. S, FRN 0.469% 31/03/2019 EUR 900,000 907,232 0.07Socram Banque, Reg. S, FRN 0.442%
28/11/2017 EUR 3,000,000 3,007,560 0.22Total Capital International SA, Reg. S, FRN
0.036% 19/03/2020 EUR 3,000,000 2,997,105 0.22TOTAL SA, Reg. S, FRN 3.875% Perpetual EUR 2,250,000 2,338,594 0.17Veolia Environnement SA, Reg. S, FRN
4.45% Perpetual EUR 400,000 420,684 0.03Wendel SA 4.375% 09/08/2017 EUR 1,800,000 1,875,450 0.14
37,760,234 2.75
GermanyBayer AG, Reg. S, FRN 3%
01/07/2075 (1) EUR 3,200,000 3,226,693 0.24BMW US Capital LLC, Reg. S, FRN
0.116% 18/03/2019 (United States of America) (2) EUR 4,050,000 4,049,494 0.30
Celesio Finance BV 4.5% 26/04/2017 (Netherlands) (2) EUR 7,650,000 7,894,417 0.58
Covestro AG, Reg. S, FRN 0.336% 10/03/2018 EUR 3,000,000 3,011,070 0.22
Covestro AG, Reg. S 1% 07/10/2021 EUR 3,325,000 3,432,268 0.25Daimler AG, Reg. S 0.25% 11/05/2020 (1) EUR 4,700,000 4,728,403 0.34Daimler AG, Reg. S 0.875% 12/01/2021 EUR 2,250,000 2,320,778 0.17Deutsche Telekom International Finance BV
6% 20/01/2017 (Netherlands) (2) EUR 3,200,000 3,307,680 0.24Linde Finance BV, FRN 7.375%
14/07/2066 (Netherlands) (1) (2) EUR 2,440,000 2,445,026 0.18Vier Gas Transport GmbH, Reg. S 2%
12/06/2020 EUR 5,000,000 5,378,074 0.39Volkswagen International Finance NV,
Reg. S, FRN 0.351% 15/04/2019 (Netherlands) (2) EUR 4,000,000 3,983,600 0.29
Volkswagen Leasing GmbH, Reg. S, FRN 0.012% 11/08/2017 EUR 1,000,000 997,020 0.07
Vonovia Finance BV 2.125% 25/07/2016 (Netherlands) (2) EUR 2,700,000 2,703,497 0.20
Vonovia Finance BV, Reg. S 3.125% 25/07/2019 (Netherlands) (1) (2) EUR 5,200,000 5,650,943 0.41
53,128,963 3.88
Hong KongHutchison Whampoa Finance 09 Ltd.,
Reg. S 4.75% 14/11/2016 (Cayman Islands) (2) EUR 5,500,000 5,592,840 0.41
Hutchison Whampoa Finance 14 Ltd., Reg. S 1.375% 31/10/2021 (Cayman Islands) (2) EUR 3,000,000 3,077,845 0.22
Shanghai Electric Newage Co. Ltd., Reg. S 1.125% 22/05/2020 EUR 3,200,000 3,222,279 0.24
11,892,964 0.87
IcelandArion Banki HF, Reg. S 2.5% 26/04/2019 EUR 2,450,000 2,467,664 0.18Landsbankinn HF, Reg. S 3% 19/10/2018 EUR 2,500,000 2,550,288 0.19
5,017,952 0.37
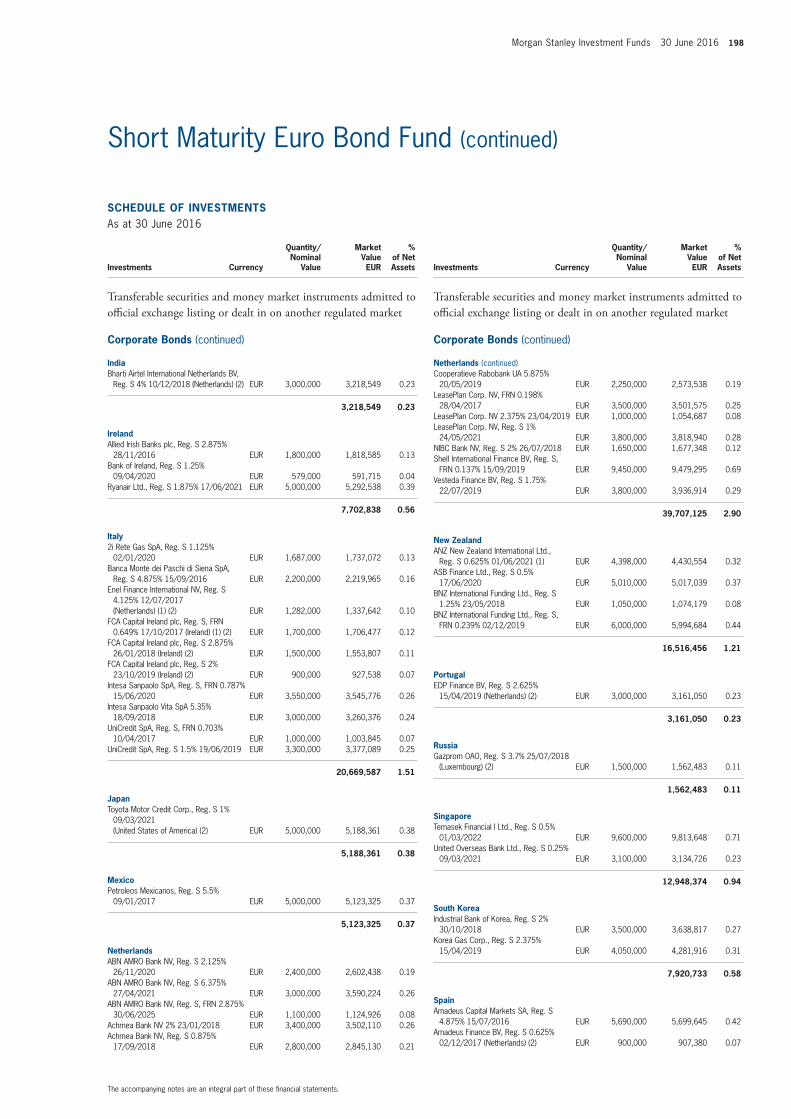
Morgan Stanley Investment Funds 30 June 2016 198
The accompanying notes are an integral part of these financial statements.
Short Maturity Euro Bond Fund (continued)
SCHEDULE OF INVESTMENTSAs at 30 June 2016
Investments Currency
Quantity/Nominal
Value
Market Value EUR
% of Net Assets
Transferable securities and money market instruments admitted to official exchange listing or dealt in on another regulated market
Corporate Bonds (continued)
IndiaBharti Airtel International Netherlands BV,
Reg. S 4% 10/12/2018 (Netherlands) (2) EUR 3,000,000 3,218,549 0.23
3,218,549 0.23
IrelandAllied Irish Banks plc, Reg. S 2.875%
28/11/2016 EUR 1,800,000 1,818,585 0.13Bank of Ireland, Reg. S 1.25%
09/04/2020 EUR 579,000 591,715 0.04Ryanair Ltd., Reg. S 1.875% 17/06/2021 EUR 5,000,000 5,292,538 0.39
7,702,838 0.56
Italy2i Rete Gas SpA, Reg. S 1.125%
02/01/2020 EUR 1,687,000 1,737,072 0.13Banca Monte dei Paschi di Siena SpA,
Reg. S 4.875% 15/09/2016 EUR 2,200,000 2,219,965 0.16Enel Finance International NV, Reg. S
4.125% 12/07/2017 (Netherlands) (1) (2) EUR 1,282,000 1,337,642 0.10
FCA Capital Ireland plc, Reg. S, FRN 0.649% 17/10/2017 (Ireland) (1) (2) EUR 1,700,000 1,706,477 0.12
FCA Capital Ireland plc, Reg. S 2.875% 26/01/2018 (Ireland) (2) EUR 1,500,000 1,553,807 0.11
FCA Capital Ireland plc, Reg. S 2% 23/10/2019 (Ireland) (2) EUR 900,000 927,538 0.07
Intesa Sanpaolo SpA, Reg. S, FRN 0.787% 15/06/2020 EUR 3,550,000 3,545,776 0.26
Intesa Sanpaolo Vita SpA 5.35% 18/09/2018 EUR 3,000,000 3,260,376 0.24
UniCredit SpA, Reg. S, FRN 0.703% 10/04/2017 EUR 1,000,000 1,003,845 0.07
UniCredit SpA, Reg. S 1.5% 19/06/2019 EUR 3,300,000 3,377,089 0.25
20,669,587 1.51
JapanToyota Motor Credit Corp., Reg. S 1%
09/03/2021 (United States of America) (2) EUR 5,000,000 5,188,361 0.38
5,188,361 0.38
MexicoPetroleos Mexicanos, Reg. S 5.5%
09/01/2017 EUR 5,000,000 5,123,325 0.37
5,123,325 0.37
NetherlandsABN AMRO Bank NV, Reg. S 2.125%
26/11/2020 EUR 2,400,000 2,602,438 0.19ABN AMRO Bank NV, Reg. S 6.375%
27/04/2021 EUR 3,000,000 3,590,224 0.26ABN AMRO Bank NV, Reg. S, FRN 2.875%
30/06/2025 EUR 1,100,000 1,124,926 0.08Achmea Bank NV 2% 23/01/2018 EUR 3,400,000 3,502,110 0.26Achmea Bank NV, Reg. S 0.875%
17/09/2018 EUR 2,800,000 2,845,130 0.21
SCHEDULE OF INVESTMENTSAs at 30 June 2016
Investments Currency
Quantity/Nominal
Value
Market Value EUR
% of Net Assets
Transferable securities and money market instruments admitted to official exchange listing or dealt in on another regulated market
Corporate Bonds (continued)
Netherlands (continued)Cooperatieve Rabobank UA 5.875%
20/05/2019 EUR 2,250,000 2,573,538 0.19LeasePlan Corp. NV, FRN 0.198%
28/04/2017 EUR 3,500,000 3,501,575 0.25LeasePlan Corp. NV 2.375% 23/04/2019 EUR 1,000,000 1,054,687 0.08LeasePlan Corp. NV, Reg. S 1%
24/05/2021 EUR 3,800,000 3,818,940 0.28NIBC Bank NV, Reg. S 2% 26/07/2018 EUR 1,650,000 1,677,348 0.12Shell International Finance BV, Reg. S,
FRN 0.137% 15/09/2019 EUR 9,450,000 9,479,295 0.69Vesteda Finance BV, Reg. S 1.75%
22/07/2019 EUR 3,800,000 3,936,914 0.29
39,707,125 2.90
New ZealandANZ New Zealand International Ltd.,
Reg. S 0.625% 01/06/2021 (1) EUR 4,398,000 4,430,554 0.32ASB Finance Ltd., Reg. S 0.5%
17/06/2020 EUR 5,010,000 5,017,039 0.37BNZ International Funding Ltd., Reg. S
1.25% 23/05/2018 EUR 1,050,000 1,074,179 0.08BNZ International Funding Ltd., Reg. S,
FRN 0.239% 02/12/2019 EUR 6,000,000 5,994,684 0.44
16,516,456 1.21
PortugalEDP Finance BV, Reg. S 2.625%
15/04/2019 (Netherlands) (2) EUR 3,000,000 3,161,050 0.23
3,161,050 0.23
RussiaGazprom OAO, Reg. S 3.7% 25/07/2018
(Luxembourg) (2) EUR 1,500,000 1,562,483 0.11
1,562,483 0.11
SingaporeTemasek Financial I Ltd., Reg. S 0.5%
01/03/2022 EUR 9,600,000 9,813,648 0.71United Overseas Bank Ltd., Reg. S 0.25%
09/03/2021 EUR 3,100,000 3,134,726 0.23
12,948,374 0.94
South KoreaIndustrial Bank of Korea, Reg. S 2%
30/10/2018 EUR 3,500,000 3,638,817 0.27Korea Gas Corp., Reg. S 2.375%
15/04/2019 EUR 4,050,000 4,281,916 0.31
7,920,733 0.58
SpainAmadeus Capital Markets SA, Reg. S
4.875% 15/07/2016 EUR 5,690,000 5,699,645 0.42Amadeus Finance BV, Reg. S 0.625%
02/12/2017 (Netherlands) (2) EUR 900,000 907,380 0.07

199 Morgan Stanley Investment Funds 30 June 2016
The accompanying notes are an integral part of these financial statements.
Short Maturity Euro Bond Fund (continued)
SCHEDULE OF INVESTMENTSAs at 30 June 2016
Investments Currency
Quantity/Nominal
Value
Market Value EUR
% of Net Assets
Transferable securities and money market instruments admitted to official exchange listing or dealt in on another regulated market
Corporate Bonds (continued)
Spain (continued)Banco Bilbao Vizcaya Argentaria SA 1%
20/01/2021 EUR 4,200,000 4,253,639 0.31Banco Bilbao Vizcaya Argentaria SA,
Reg. S 0.625% 17/05/2021 EUR 4,600,000 4,736,707 0.34Banco Popular Espanol SA 3.5%
11/09/2017 EUR 2,900,000 3,021,749 0.22CaixaBank SA, Reg. S 2.5% 18/04/2017 EUR 3,000,000 3,057,585 0.22Distribuidora Internacional de Alimentacion
SA, Reg. S 1% 28/04/2021 EUR 3,000,000 3,032,040 0.22FADE - Fondo de Amortizacion del Deficit
Electrico, Reg. S 1.875% 17/09/2017 EUR 4,300,000 4,401,649 0.32FADE - Fondo de Amortizacion del Deficit
Electrico, Reg. S 0.85% 17/09/2019 EUR 16,300,000 16,670,752 1.22Ferrovial Emisiones SA, Reg. S 3.375%
30/01/2018 EUR 5,850,000 6,157,699 0.45Inmobiliaria Colonial SA, Reg. S 1.863%
05/06/2019 EUR 3,000,000 3,104,799 0.23Prosegur Cia de Seguridad SA, Reg. S
2.75% 02/04/2018 EUR 5,000,000 5,226,100 0.38Repsol International Finance BV, Reg. S
2.125% 16/12/2020 (Netherlands) (1) (2) EUR 4,000,000 4,247,244 0.31
Santander Consumer Bank A/S, Reg. S 0.625% 20/04/2018 (Norway) (2) EUR 2,500,000 2,513,915 0.18
Santander Consumer Finance SA, Reg. S 1.5% 12/11/2020 EUR 1,900,000 1,944,351 0.14
68,975,254 5.03
Supra-NationalCorp. Andina de Fomento, Reg. S 1.875%
29/05/2021 EUR 2,750,000 2,932,586 0.21
2,932,586 0.21
SwedenAlfa Laval Treasury International AB,
Reg. S, FRN 0.288% 12/09/2019 EUR 1,350,000 1,344,593 0.10Nordea Bank AB, Reg. S, FRN 0.192%
22/02/2019 (1) EUR 5,150,000 5,169,003 0.38Nordea Bank AB, Reg. S 4.5%
26/03/2020 EUR 4,500,000 5,075,433 0.37SBAB Bank AB, Reg. S, FRN 0.031%
27/06/2018 EUR 3,500,000 3,497,463 0.26Skandinaviska Enskilda Banken AB,
Reg. S, FRN 0.207% 15/09/2020 EUR 7,850,000 7,860,676 0.57Swedbank AB, Reg. S, FRN 0.488%
11/03/2019 EUR 3,500,000 3,542,945 0.26Swedbank AB, Reg. S 0.625%
04/01/2021 EUR 3,675,000 3,754,806 0.27
30,244,919 2.21
SwitzerlandCredit Suisse AG, Reg. S, FRN 0.186%
18/06/2018 EUR 3,550,000 3,552,290 0.26Glencore Finance Europe SA, Reg. S
4.625% 03/04/2018 (Luxembourg) (1) (2) EUR 600,000 633,787 0.05
UBS AG, Reg. S 1.125% 30/06/2020 EUR 1,100,000 1,141,242 0.08
5,327,319 0.39
SCHEDULE OF INVESTMENTSAs at 30 June 2016
Investments Currency
Quantity/Nominal
Value
Market Value EUR
% of Net Assets
Transferable securities and money market instruments admitted to official exchange listing or dealt in on another regulated market
Corporate Bonds (continued)
TurkeyTurkiye Vakiflar Bankasi TAO, Reg. S
2.375% 04/05/2021 EUR 1,400,000 1,405,159 0.10
1,405,159 0.10
United KingdomAnglo American Capital plc, Reg. S
4.375% 02/12/2016 EUR 269,000 272,371 0.02BAT International Finance plc, Reg. S
0.375% 13/03/2019 EUR 5,600,000 5,642,381 0.41FCE Bank plc, Reg. S 1.75% 21/05/2018 EUR 5,500,000 5,670,021 0.41FCE Bank plc, Reg. S, FRN 0.718%
17/09/2019 EUR 4,700,000 4,733,441 0.35Heathrow Funding Ltd., Reg. S 4.375%
25/01/2019 (Jersey) (2) EUR 5,300,000 5,427,147 0.40HSBC Holdings plc, Reg. S 6%
10/06/2019 EUR 9,000,000 10,267,544 0.75Lloyds Bank plc, Reg. S, FRN 0.186%
10/09/2019 (1) EUR 3,900,000 3,844,464 0.28Lloyds Bank plc, Reg. S 6.5%
24/03/2020 EUR 3,500,000 4,038,631 0.30Lloyds Bank plc, Reg. S, FRN 11.875%
16/12/2021 EUR 2,250,000 2,354,479 0.17Nationwide Building Society, Reg. S
1.625% 03/04/2019 EUR 3,650,000 3,760,976 0.27Nationwide Building Society, Reg. S 6.75%
22/07/2020 EUR 4,300,000 5,033,340 0.37NGG Finance plc, Reg. S, FRN 4.25%
18/06/2076 EUR 3,100,000 3,299,721 0.24Royal Bank of Scotland plc (The), FRN
1.731% 25/07/2017 EUR 1,900,000 1,927,217 0.14Santander UK plc, Reg. S, FRN 0.367%
22/05/2019 EUR 2,500,000 2,478,287 0.18Santander UK plc, Reg. S 0.875%
25/11/2020 EUR 3,950,000 3,951,473 0.29Standard Chartered plc, Reg. S 1.75%
29/10/2017 EUR 31,000 31,645 0.00State Grid Europe Development 2014 plc,
Reg. S 1.5% 26/01/2022 EUR 3,000,000 3,056,386 0.22Tesco Corporate Treasury Services plc,
Reg. S 1.375% 01/07/2019 EUR 3,475,000 3,437,783 0.25Vodafone Group plc, Reg. S, FRN 0.692%
25/02/2019 EUR 10,150,000 10,254,545 0.75
79,481,852 5.80
United States of AmericaBank of America Corp., FRN 0.412%
23/05/2017 EUR 1,500,000 1,498,035 0.11Bank of America Corp., Reg. S 1.875%
10/01/2019 EUR 2,750,000 2,867,779 0.21Bank of America Corp., Reg. S, FRN
0.536% 19/06/2019 EUR 6,200,000 6,249,135 0.46Citigroup, Inc., FRN 0.379% 31/05/2017 EUR 5,000,000 4,995,025 0.36Citigroup, Inc., Reg. S, FRN 0.572%
24/05/2021 EUR 6,250,000 6,260,531 0.46DH Europe Finance SA, FRN 0.169%
30/06/2017 (Luxembourg) (2) EUR 4,000,000 4,008,100 0.29General Motors Financial International BV,
Reg. S 1.875% 15/10/2019 (Netherlands) (2) EUR 400,000 415,910 0.03
Goldman Sachs Group, Inc. (The), Reg. S, FRN 0.436% 18/12/2017 (1) EUR 2,000,000 2,010,590 0.15
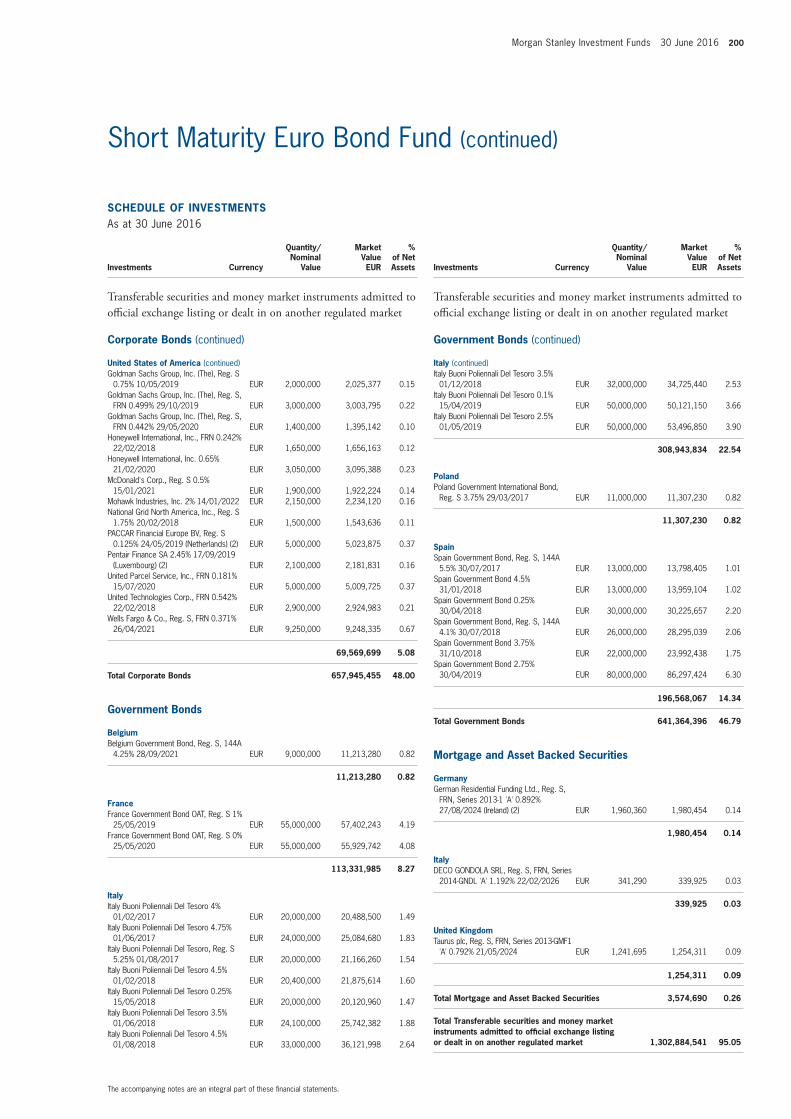
Morgan Stanley Investment Funds 30 June 2016 200
The accompanying notes are an integral part of these financial statements.
Short Maturity Euro Bond Fund (continued)
SCHEDULE OF INVESTMENTSAs at 30 June 2016
Investments Currency
Quantity/Nominal
Value
Market Value EUR
% of Net Assets
Transferable securities and money market instruments admitted to official exchange listing or dealt in on another regulated market
Corporate Bonds (continued)
United States of America (continued)Goldman Sachs Group, Inc. (The), Reg. S
0.75% 10/05/2019 EUR 2,000,000 2,025,377 0.15Goldman Sachs Group, Inc. (The), Reg. S,
FRN 0.499% 29/10/2019 EUR 3,000,000 3,003,795 0.22Goldman Sachs Group, Inc. (The), Reg. S,
FRN 0.442% 29/05/2020 EUR 1,400,000 1,395,142 0.10Honeywell International, Inc., FRN 0.242%
22/02/2018 EUR 1,650,000 1,656,163 0.12Honeywell International, Inc. 0.65%
21/02/2020 EUR 3,050,000 3,095,388 0.23McDonald's Corp., Reg. S 0.5%
15/01/2021 EUR 1,900,000 1,922,224 0.14Mohawk Industries, Inc. 2% 14/01/2022 EUR 2,150,000 2,234,120 0.16National Grid North America, Inc., Reg. S
1.75% 20/02/2018 EUR 1,500,000 1,543,636 0.11PACCAR Financial Europe BV, Reg. S
0.125% 24/05/2019 (Netherlands) (2) EUR 5,000,000 5,023,875 0.37Pentair Finance SA 2.45% 17/09/2019
(Luxembourg) (2) EUR 2,100,000 2,181,831 0.16United Parcel Service, Inc., FRN 0.181%
15/07/2020 EUR 5,000,000 5,009,725 0.37United Technologies Corp., FRN 0.542%
22/02/2018 EUR 2,900,000 2,924,983 0.21Wells Fargo & Co., Reg. S, FRN 0.371%
26/04/2021 EUR 9,250,000 9,248,335 0.67
69,569,699 5.08
Total Corporate Bonds 657,945,455 48.00
Government Bonds
BelgiumBelgium Government Bond, Reg. S, 144A
4.25% 28/09/2021 EUR 9,000,000 11,213,280 0.82
11,213,280 0.82
FranceFrance Government Bond OAT, Reg. S 1%
25/05/2019 EUR 55,000,000 57,402,243 4.19France Government Bond OAT, Reg. S 0%
25/05/2020 EUR 55,000,000 55,929,742 4.08
113,331,985 8.27
ItalyItaly Buoni Poliennali Del Tesoro 4%
01/02/2017 EUR 20,000,000 20,488,500 1.49Italy Buoni Poliennali Del Tesoro 4.75%
01/06/2017 EUR 24,000,000 25,084,680 1.83Italy Buoni Poliennali Del Tesoro, Reg. S
5.25% 01/08/2017 EUR 20,000,000 21,166,260 1.54Italy Buoni Poliennali Del Tesoro 4.5%
01/02/2018 EUR 20,400,000 21,875,614 1.60Italy Buoni Poliennali Del Tesoro 0.25%
15/05/2018 EUR 20,000,000 20,120,960 1.47Italy Buoni Poliennali Del Tesoro 3.5%
01/06/2018 EUR 24,100,000 25,742,382 1.88Italy Buoni Poliennali Del Tesoro 4.5%
01/08/2018 EUR 33,000,000 36,121,998 2.64
SCHEDULE OF INVESTMENTSAs at 30 June 2016
Investments Currency
Quantity/Nominal
Value
Market Value EUR
% of Net Assets
Transferable securities and money market instruments admitted to official exchange listing or dealt in on another regulated market
Government Bonds (continued)
Italy (continued)Italy Buoni Poliennali Del Tesoro 3.5%
01/12/2018 EUR 32,000,000 34,725,440 2.53Italy Buoni Poliennali Del Tesoro 0.1%
15/04/2019 EUR 50,000,000 50,121,150 3.66Italy Buoni Poliennali Del Tesoro 2.5%
01/05/2019 EUR 50,000,000 53,496,850 3.90
308,943,834 22.54
PolandPoland Government International Bond,
Reg. S 3.75% 29/03/2017 EUR 11,000,000 11,307,230 0.82
11,307,230 0.82
SpainSpain Government Bond, Reg. S, 144A
5.5% 30/07/2017 EUR 13,000,000 13,798,405 1.01Spain Government Bond 4.5%
31/01/2018 EUR 13,000,000 13,959,104 1.02Spain Government Bond 0.25%
30/04/2018 EUR 30,000,000 30,225,657 2.20Spain Government Bond, Reg. S, 144A
4.1% 30/07/2018 EUR 26,000,000 28,295,039 2.06Spain Government Bond 3.75%
31/10/2018 EUR 22,000,000 23,992,438 1.75Spain Government Bond 2.75%
30/04/2019 EUR 80,000,000 86,297,424 6.30
196,568,067 14.34
Total Government Bonds 641,364,396 46.79
Mortgage and Asset Backed Securities
GermanyGerman Residential Funding Ltd., Reg. S,
FRN, Series 2013-1 'A' 0.892% 27/08/2024 (Ireland) (2) EUR 1,960,360 1,980,454 0.14
1,980,454 0.14
ItalyDECO GONDOLA SRL, Reg. S, FRN, Series
2014-GNDL 'A' 1.192% 22/02/2026 EUR 341,290 339,925 0.03
339,925 0.03
United KingdomTaurus plc, Reg. S, FRN, Series 2013-GMF1
'A' 0.792% 21/05/2024 EUR 1,241,695 1,254,311 0.09
1,254,311 0.09
Total Mortgage and Asset Backed Securities 3,574,690 0.26
Total Transferable securities and money market instruments admitted to official exchange listing or dealt in on another regulated market 1,302,884,541 95.05

201 Morgan Stanley Investment Funds 30 June 2016
The accompanying notes are an integral part of these financial statements.
Short Maturity Euro Bond Fund (continued)
Financial Futures Contracts
Security DescriptionNumber of Contracts Currency
Global Exposure
EUR
Unrealised Gain/(Loss)
EUR
% of Net Assets
Euro-Schatz, 08/09/2016 3,052 EUR 341,961,340 816,410 0.06
Unrealised Gain on Financial Futures Contracts 816,410 0.06
Total Unrealised Gain on Financial Futures Contracts 816,410 0.06
Euro-Bobl, 08/09/2016 (2,394) EUR (319,718,700) (2,976,635) (0.22)
Unrealised Loss on Financial Futures Contracts (2,976,635) (0.22)
Total Unrealised Loss on Financial Futures Contracts (2,976,635) (0.22)
Net Unrealised Loss on Financial Futures Contracts (2,160,225) (0.16)
Forward Currency Exchange Contracts
Currency Purchased
Amount Purchased
Currency Sold
Amount Sold
Maturity Date Counterparty
Unrealised Gain/(Loss)
EUR
% of Net Assets
SEK Hedged Share ClassEUR 11,804 SEK 111,321 01/07/2016 J.P. Morgan 2 0.00SEK 3,501 EUR 371 08/07/2016 J.P. Morgan 0 0.00
USD Hedged Share ClassEUR 1,840,219 USD 2,033,258 01/07/2016 J.P. Morgan 11,157 0.00USD 2,033,258 EUR 1,804,870 01/07/2016 J.P. Morgan 24,192 0.00
Unrealised Gain on NAV Hedged Share Classes Forward Currency Exchange Contracts 35,351 0.00
Total Unrealised Gain on Forward Currency Exchange Contracts 35,351 0.00
SEK Hedged Share ClassSEK 111,321 EUR 11,965 01/07/2016 J.P. Morgan (162) 0.00SEK 111,233 EUR 11,795 08/07/2016 J.P. Morgan (2) 0.00
USD Hedged Share ClassUSD 2,032,438 EUR 1,838,945 08/07/2016 J.P. Morgan (10,871) 0.00
Unrealised Loss on NAV Hedged Share Classes Forward Currency Exchange Contracts (11,035) 0.00
Total Unrealised Loss on Forward Currency Exchange Contracts (11,035) 0.00
Net Unrealised Gain on Forward Currency Exchange Contracts 24,316 0.00
Collateral received and paid by the Fund in respect of financial derivative instruments:
Type of Collateral Counterparty CurrencyCollateral Amount
receivedCollateral Amount
paid
Short Maturity Euro Bond Fund
Cash Goldman Sachs EUR 4,417,936 -
4,417,936 -
DERIVATIVES
Over-the-counter (OTC) and exchange traded derivatives as at 30 June 2016, expressed in Euro.
SCHEDULE OF INVESTMENTSAs at 30 June 2016
Investments Currency
Quantity/Nominal
Value
Market Value EUR
% of Net Assets
Units of authorised UCITS or other collective investment undertakings
Collective Investment Schemes – UCITS
LuxembourgMorgan Stanley Liquidity Funds Euro
Liquidity Fund – MS Reserve (4) EUR 56,058,514 56,058,515 4.09
56,058,515 4.09
Total Collective Investment Schemes – UCITS 56,058,515 4.09
Total Units of authorised UCITS or other collective investment undertakings 56,058,515 4.09
Total Investments 1,358,943,056 99.14
Cash 4,827,584 0.35
Other Assets/(Liabilities) 6,922,770 0.51
Total Net Assets 1,370,693,410 100.00
(1) All or part of this position is out on loan.(2) The country in brackets represents the country of incorporation of this security.(4) Affiliate managed by an affiliate of the Investment Adviser.
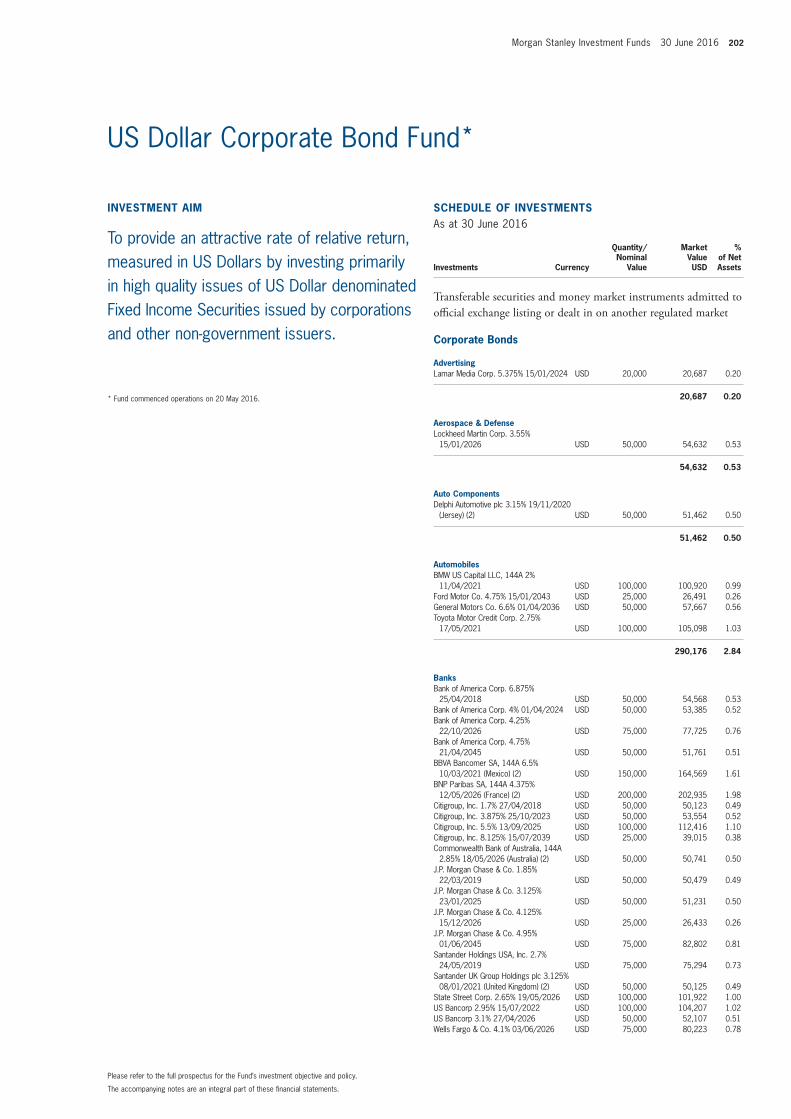
Morgan Stanley Investment Funds 30 June 2016 202
The accompanying notes are an integral part of these financial statements.
Please refer to the full prospectus for the Fund’s investment objective and policy.
* Fund commenced operations on 20 May 2016.
INVESTMENT AIM
To provide an attractive rate of relative return, measured in US Dollars by investing primarily in high quality issues of US Dollar denominated Fixed Income Securities issued by corporations and other non-government issuers.
US Dollar Corporate Bond Fund*
SCHEDULE OF INVESTMENTSAs at 30 June 2016
Investments Currency
Quantity/Nominal
Value
Market Value USD
% of Net Assets
Transferable securities and money market instruments admitted to official exchange listing or dealt in on another regulated market
Corporate Bonds
AdvertisingLamar Media Corp. 5.375% 15/01/2024 USD 20,000 20,687 0.20
20,687 0.20
Aerospace & DefenseLockheed Martin Corp. 3.55%
15/01/2026 USD 50,000 54,632 0.53
54,632 0.53
Auto ComponentsDelphi Automotive plc 3.15% 19/11/2020
(Jersey) (2) USD 50,000 51,462 0.50
51,462 0.50
AutomobilesBMW US Capital LLC, 144A 2%
11/04/2021 USD 100,000 100,920 0.99Ford Motor Co. 4.75% 15/01/2043 USD 25,000 26,491 0.26General Motors Co. 6.6% 01/04/2036 USD 50,000 57,667 0.56Toyota Motor Credit Corp. 2.75%
17/05/2021 USD 100,000 105,098 1.03
290,176 2.84
BanksBank of America Corp. 6.875%
25/04/2018 USD 50,000 54,568 0.53Bank of America Corp. 4% 01/04/2024 USD 50,000 53,385 0.52Bank of America Corp. 4.25%
22/10/2026 USD 75,000 77,725 0.76Bank of America Corp. 4.75%
21/04/2045 USD 50,000 51,761 0.51BBVA Bancomer SA, 144A 6.5%
10/03/2021 (Mexico) (2) USD 150,000 164,569 1.61BNP Paribas SA, 144A 4.375%
12/05/2026 (France) (2) USD 200,000 202,935 1.98Citigroup, Inc. 1.7% 27/04/2018 USD 50,000 50,123 0.49Citigroup, Inc. 3.875% 25/10/2023 USD 50,000 53,554 0.52Citigroup, Inc. 5.5% 13/09/2025 USD 100,000 112,416 1.10Citigroup, Inc. 8.125% 15/07/2039 USD 25,000 39,015 0.38Commonwealth Bank of Australia, 144A
2.85% 18/05/2026 (Australia) (2) USD 50,000 50,741 0.50J.P. Morgan Chase & Co. 1.85%
22/03/2019 USD 50,000 50,479 0.49J.P. Morgan Chase & Co. 3.125%
23/01/2025 USD 50,000 51,231 0.50J.P. Morgan Chase & Co. 4.125%
15/12/2026 USD 25,000 26,433 0.26J.P. Morgan Chase & Co. 4.95%
01/06/2045 USD 75,000 82,802 0.81Santander Holdings USA, Inc. 2.7%
24/05/2019 USD 75,000 75,294 0.73Santander UK Group Holdings plc 3.125%
08/01/2021 (United Kingdom) (2) USD 50,000 50,125 0.49State Street Corp. 2.65% 19/05/2026 USD 100,000 101,922 1.00US Bancorp 2.95% 15/07/2022 USD 100,000 104,207 1.02US Bancorp 3.1% 27/04/2026 USD 50,000 52,107 0.51Wells Fargo & Co. 4.1% 03/06/2026 USD 75,000 80,223 0.78
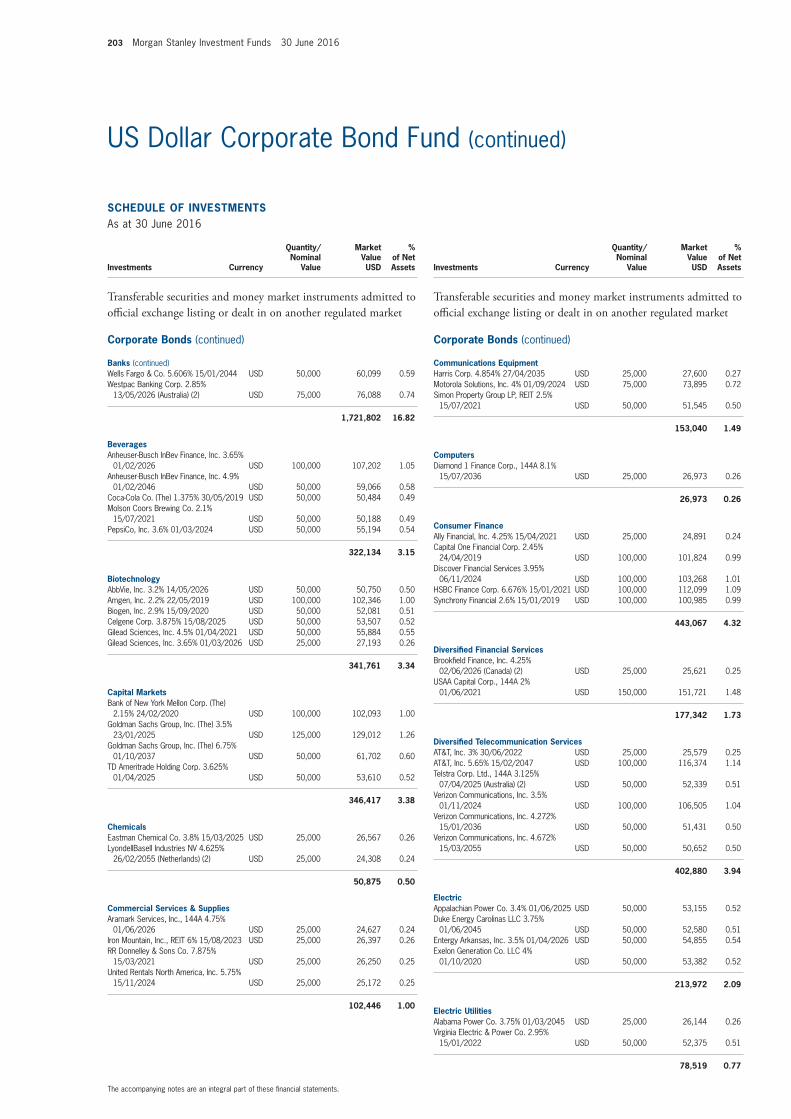
203 Morgan Stanley Investment Funds 30 June 2016
The accompanying notes are an integral part of these financial statements.
US Dollar Corporate Bond Fund (continued)
SCHEDULE OF INVESTMENTSAs at 30 June 2016
Investments Currency
Quantity/Nominal
Value
Market Value USD
% of Net Assets
Transferable securities and money market instruments admitted to official exchange listing or dealt in on another regulated market
Corporate Bonds (continued)
Banks (continued)Wells Fargo & Co. 5.606% 15/01/2044 USD 50,000 60,099 0.59Westpac Banking Corp. 2.85%
13/05/2026 (Australia) (2) USD 75,000 76,088 0.74
1,721,802 16.82
BeveragesAnheuser-Busch InBev Finance, Inc. 3.65%
01/02/2026 USD 100,000 107,202 1.05Anheuser-Busch InBev Finance, Inc. 4.9%
01/02/2046 USD 50,000 59,066 0.58Coca-Cola Co. (The) 1.375% 30/05/2019 USD 50,000 50,484 0.49Molson Coors Brewing Co. 2.1%
15/07/2021 USD 50,000 50,188 0.49PepsiCo, Inc. 3.6% 01/03/2024 USD 50,000 55,194 0.54
322,134 3.15
BiotechnologyAbbVie, Inc. 3.2% 14/05/2026 USD 50,000 50,750 0.50Amgen, Inc. 2.2% 22/05/2019 USD 100,000 102,346 1.00Biogen, Inc. 2.9% 15/09/2020 USD 50,000 52,081 0.51Celgene Corp. 3.875% 15/08/2025 USD 50,000 53,507 0.52Gilead Sciences, Inc. 4.5% 01/04/2021 USD 50,000 55,884 0.55Gilead Sciences, Inc. 3.65% 01/03/2026 USD 25,000 27,193 0.26
341,761 3.34
Capital MarketsBank of New York Mellon Corp. (The)
2.15% 24/02/2020 USD 100,000 102,093 1.00Goldman Sachs Group, Inc. (The) 3.5%
23/01/2025 USD 125,000 129,012 1.26Goldman Sachs Group, Inc. (The) 6.75%
01/10/2037 USD 50,000 61,702 0.60TD Ameritrade Holding Corp. 3.625%
01/04/2025 USD 50,000 53,610 0.52
346,417 3.38
ChemicalsEastman Chemical Co. 3.8% 15/03/2025 USD 25,000 26,567 0.26LyondellBasell Industries NV 4.625%
26/02/2055 (Netherlands) (2) USD 25,000 24,308 0.24
50,875 0.50
Commercial Services & SuppliesAramark Services, Inc., 144A 4.75%
01/06/2026 USD 25,000 24,627 0.24Iron Mountain, Inc., REIT 6% 15/08/2023 USD 25,000 26,397 0.26RR Donnelley & Sons Co. 7.875%
15/03/2021 USD 25,000 26,250 0.25United Rentals North America, Inc. 5.75%
15/11/2024 USD 25,000 25,172 0.25
102,446 1.00
SCHEDULE OF INVESTMENTSAs at 30 June 2016
Investments Currency
Quantity/Nominal
Value
Market Value USD
% of Net Assets
Transferable securities and money market instruments admitted to official exchange listing or dealt in on another regulated market
Corporate Bonds (continued)
Communications EquipmentHarris Corp. 4.854% 27/04/2035 USD 25,000 27,600 0.27Motorola Solutions, Inc. 4% 01/09/2024 USD 75,000 73,895 0.72Simon Property Group LP, REIT 2.5%
15/07/2021 USD 50,000 51,545 0.50
153,040 1.49
ComputersDiamond 1 Finance Corp., 144A 8.1%
15/07/2036 USD 25,000 26,973 0.26
26,973 0.26
Consumer FinanceAlly Financial, Inc. 4.25% 15/04/2021 USD 25,000 24,891 0.24Capital One Financial Corp. 2.45%
24/04/2019 USD 100,000 101,824 0.99Discover Financial Services 3.95%
06/11/2024 USD 100,000 103,268 1.01HSBC Finance Corp. 6.676% 15/01/2021 USD 100,000 112,099 1.09Synchrony Financial 2.6% 15/01/2019 USD 100,000 100,985 0.99
443,067 4.32
Diversified Financial ServicesBrookfield Finance, Inc. 4.25%
02/06/2026 (Canada) (2) USD 25,000 25,621 0.25USAA Capital Corp., 144A 2%
01/06/2021 USD 150,000 151,721 1.48
177,342 1.73
Diversified Telecommunication ServicesAT&T, Inc. 3% 30/06/2022 USD 25,000 25,579 0.25AT&T, Inc. 5.65% 15/02/2047 USD 100,000 116,374 1.14Telstra Corp. Ltd., 144A 3.125%
07/04/2025 (Australia) (2) USD 50,000 52,339 0.51Verizon Communications, Inc. 3.5%
01/11/2024 USD 100,000 106,505 1.04Verizon Communications, Inc. 4.272%
15/01/2036 USD 50,000 51,431 0.50Verizon Communications, Inc. 4.672%
15/03/2055 USD 50,000 50,652 0.50
402,880 3.94
ElectricAppalachian Power Co. 3.4% 01/06/2025 USD 50,000 53,155 0.52Duke Energy Carolinas LLC 3.75%
01/06/2045 USD 50,000 52,580 0.51Entergy Arkansas, Inc. 3.5% 01/04/2026 USD 50,000 54,855 0.54Exelon Generation Co. LLC 4%
01/10/2020 USD 50,000 53,382 0.52
213,972 2.09
Electric UtilitiesAlabama Power Co. 3.75% 01/03/2045 USD 25,000 26,144 0.26Virginia Electric & Power Co. 2.95%
15/01/2022 USD 50,000 52,375 0.51
78,519 0.77

Morgan Stanley Investment Funds 30 June 2016 204
The accompanying notes are an integral part of these financial statements.
US Dollar Corporate Bond Fund (continued)
SCHEDULE OF INVESTMENTSAs at 30 June 2016
Investments Currency
Quantity/Nominal
Value
Market Value USD
% of Net Assets
Transferable securities and money market instruments admitted to official exchange listing or dealt in on another regulated market
Corporate Bonds (continued)
Energy Equipment & ServicesEnsco plc 5.75% 01/10/2044
(United Kingdom) (2) USD 50,000 30,086 0.29
30,086 0.29
Engineering & ConstructionMasTec, Inc. 4.875% 15/03/2023 USD 25,000 23,393 0.23
23,393 0.23
Food & Staples RetailingCVS Health Corp. 5.125% 20/07/2045 USD 50,000 62,334 0.61Walgreens Boots Alliance, Inc. 3.45%
01/06/2026 USD 25,000 25,716 0.25Wal-Mart Stores, Inc. 5.25% 01/09/2035 USD 50,000 65,986 0.65Whole Foods Market, Inc., 144A 5.2%
03/12/2025 USD 25,000 26,879 0.26
180,915 1.77
Food ProductsKraft Heinz Foods Co., 144A 4.375%
01/06/2046 USD 25,000 26,408 0.26Mead Johnson Nutrition Co. 3%
15/11/2020 USD 50,000 52,248 0.51Tyson Foods, Inc. 4.875% 15/08/2034 USD 50,000 55,585 0.54Wm Wrigley Jr Co., 144A 2.9%
21/10/2019 USD 50,000 51,964 0.51
186,205 1.82
Health Care Equipment & SuppliesBoston Scientific Corp. 3.85%
15/05/2025 USD 25,000 26,505 0.26Mallinckrodt International Finance SA, 144A
5.5% 15/04/2025 (Luxembourg) (2) USD 25,000 22,500 0.22
49,005 0.48
Health Care Providers & ServicesExpress Scripts Holding Co. 4.5%
25/02/2026 USD 25,000 27,545 0.27HCA, Inc. 4.75% 01/05/2023 USD 25,000 25,618 0.25UnitedHealth Group, Inc. 3.75%
15/07/2025 USD 75,000 82,372 0.80
135,535 1.32
Hotels, Restaurants & LeisureKFC Holding Co., 144A 5.25%
01/06/2026 USD 25,000 25,425 0.25McDonald’s Corp. 3.7% 30/01/2026 USD 50,000 54,196 0.53Starbucks Corp. 2.1% 04/02/2021 USD 50,000 51,320 0.50
130,941 1.28
Household DurablesNewell Brands, Inc. 3.85% 01/04/2023 USD 75,000 79,509 0.78
79,509 0.78
SCHEDULE OF INVESTMENTSAs at 30 June 2016
Investments Currency
Quantity/Nominal
Value
Market Value USD
% of Net Assets
Transferable securities and money market instruments admitted to official exchange listing or dealt in on another regulated market
Corporate Bonds (continued)
Industrial ConglomeratesGeneral Electric Co. 4.5% 11/03/2044 USD 50,000 58,410 0.57
58,410 0.57
Industrial Power and Renewable Electricity ProducersTransAlta Corp. 4.5% 15/11/2022
(Canada) (2) USD 50,000 45,743 0.45
45,743 0.45
InsuranceAmerican International Group, Inc. 4.875%
01/06/2022 USD 50,000 55,550 0.54Chubb INA Holdings, Inc. 3.35%
15/05/2024 USD 50,000 53,646 0.52CNA Financial Corp. 5.75% 15/08/2021 USD 50,000 57,091 0.56Liberty Mutual Group, Inc., 144A 4.85%
01/08/2044 USD 25,000 25,573 0.25MetLife, Inc. 3% 01/03/2025 USD 50,000 50,748 0.50Prudential Financial, Inc., FRN 5.625%
15/06/2043 USD 75,000 78,250 0.76Travelers Cos., Inc. (The) 3.75%
15/05/2046 USD 25,000 26,217 0.26
347,075 3.39
Internet & Catalog RetailAmazon.com, Inc. 1.2% 29/11/2017 USD 50,000 50,192 0.49Amazon.com, Inc. 3.8% 05/12/2024 USD 50,000 56,117 0.55Netflix, Inc. 5.5% 15/02/2022 USD 25,000 26,137 0.25
132,446 1.29
Internet Software & ServicesAlphabet, Inc. 3.375% 25/02/2024 USD 25,000 27,564 0.27eBay, Inc. 2.5% 09/03/2018 USD 50,000 50,938 0.50
78,502 0.77
IT ServicesAutomatic Data Processing, Inc. 3.375%
15/09/2025 USD 50,000 54,437 0.53International Business Machines Corp.
1.95% 12/02/2019 USD 100,000 102,508 1.00Visa, Inc. 3.15% 14/12/2025 USD 50,000 53,449 0.53
210,394 2.06
MachineryCNH Industrial Capital LLC 4.375%
06/11/2020 USD 25,000 25,135 0.25
25,135 0.25
Media21st Century Fox America, Inc. 3.7%
15/10/2025 USD 25,000 27,123 0.2721st Century Fox America, Inc. 4.75%
15/09/2044 USD 25,000 27,674 0.27CBS Corp. 4.6% 15/01/2045 USD 25,000 24,854 0.24

205 Morgan Stanley Investment Funds 30 June 2016
The accompanying notes are an integral part of these financial statements.
US Dollar Corporate Bond Fund (continued)
SCHEDULE OF INVESTMENTSAs at 30 June 2016
Investments Currency
Quantity/Nominal
Value
Market Value USD
% of Net Assets
Transferable securities and money market instruments admitted to official exchange listing or dealt in on another regulated market
Corporate Bonds (continued)
Media (continued)Charter Communications Operating LLC,
144A 4.908% 23/07/2025 USD 100,000 109,242 1.07Charter Communications Operating LLC,
144A 6.484% 23/10/2045 USD 25,000 30,152 0.29Comcast Corp. 3.6% 01/03/2024 USD 100,000 110,077 1.08NBCUniversal Media LLC 5.95%
01/04/2041 USD 25,000 33,588 0.33Omnicom Group, Inc. 3.6% 15/04/2026 USD 50,000 52,548 0.51Time Warner, Inc. 2.95% 15/07/2026 USD 50,000 50,420 0.49
465,678 4.55
Metals & MiningBarrick Gold Corp. 4.1% 01/05/2023
(Canada) (2) USD 50,000 52,756 0.52BHP Billiton Finance USA Ltd. 3.85%
30/09/2023 (Australia) (2) USD 25,000 27,178 0.27BHP Billiton Finance USA Ltd. 5%
30/09/2043 (Australia) (2) USD 25,000 28,860 0.28Southern Copper Corp. 5.25%
08/11/2042 USD 50,000 43,936 0.43Vale Overseas Ltd. 6.875% 21/11/2036
(Cayman Islands) (2) USD 25,000 22,938 0.22
175,668 1.72
Miscellaneous ManufacturersTyco International Finance SA 3.9%
14/02/2026 (Luxembourg) (2) USD 25,000 27,035 0.26
27,035 0.26
Multi-UtilitiesPuget Energy, Inc. 6.5% 15/12/2020 USD 50,000 58,081 0.57Sempra Energy 6% 15/10/2039 USD 25,000 31,397 0.31WEC Energy Group, Inc. 3.55%
15/06/2025 USD 50,000 53,773 0.53
143,251 1.41
Multiline RetailTarget Corp. 2.3% 26/06/2019 USD 50,000 51,649 0.50
51,649 0.50
Oil, Gas & Consumable FuelsAnadarko Petroleum Corp. 6.45%
15/09/2036 USD 25,000 28,643 0.28BP Capital Markets plc 3.119%
04/05/2026 (United Kingdom) (2) USD 50,000 51,035 0.50Carrizo Oil & Gas, Inc. 6.25%
15/04/2023 USD 25,000 24,158 0.23Chevron Corp. 2.1% 16/05/2021 USD 75,000 76,375 0.75Cimarex Energy Co. 5.875%
01/05/2022 USD 25,000 26,220 0.26ConocoPhillips Co. 4.95% 15/03/2026 USD 25,000 28,442 0.28Enable Midstream Partners LP 3.9%
15/05/2024 USD 25,000 22,197 0.22
SCHEDULE OF INVESTMENTSAs at 30 June 2016
Investments Currency
Quantity/Nominal
Value
Market Value USD
% of Net Assets
Transferable securities and money market instruments admitted to official exchange listing or dealt in on another regulated market
Corporate Bonds (continued)
Oil, Gas & Consumable Fuels (continued)Energy Transfer Partners LP 6.125%
15/12/2045 USD 50,000 51,887 0.51Exxon Mobil Corp. 2.397% 06/03/2022 USD 50,000 51,453 0.50Hess Corp. 6% 15/01/2040 USD 25,000 26,034 0.25Kinder Morgan, Inc. 4.3% 01/06/2025 USD 50,000 51,304 0.5Kinder Morgan, Inc. 5.55% 01/06/2045 USD 25,000 25,466 0.25MPLX LP 4% 15/02/2025 USD 50,000 45,945 0.45Noble Energy, Inc. 5.05% 15/11/2044 USD 25,000 25,501 0.25Occidental Petroleum Corp. 4.4%
15/04/2046 USD 25,000 27,623 0.27Phillips 66 Partners LP 4.68%
15/02/2045 USD 25,000 23,243 0.23Shell International Finance BV 2.875%
10/05/2026 (Netherlands) (2) USD 50,000 50,836 0.50Williams Partners LP 4.875%
15/05/2023 USD 25,000 24,157 0.23
660,519 6.46
Packaging & ContainersBall Corp. 4% 15/11/2023 USD 25,000 24,598 0.24
24,598 0.24
PharmaceuticalsActavis Funding SCS 3.8% 15/03/2025
(Luxembourg) (2) USD 50,000 52,125 0.51EMD Finance LLC, 144A 3.25%
19/03/2025 USD 50,000 51,383 0.50Merck & Co., Inc. 2.8% 18/05/2023 USD 50,000 52,513 0.51Mylan NV, 144A 3.95% 15/06/2026
(Netherlands) (2) USD 50,000 50,516 0.50
206,537 2.02
PipelinesAPT Pipelines Ltd., 144A 4.2%
23/03/2025 (Australia) (2) USD 50,000 51,255 0.50Enterprise Products Operating LLC
4.45% 15/02/2043 USD 50,000 50,447 0.49
101,702 0.99
Real Estate Investment Trusts (REITs)Alexandria Real Estate Equities, Inc., REIT
3.95% 15/01/2027 USD 25,000 25,854 0.25American Tower Corp., REIT 3.375%
15/10/2026 USD 50,000 50,391 0.49AvalonBay Communities, Inc., REIT 2.95%
11/05/2026 USD 25,000 25,219 0.25Boston Properties LP, REIT 3.65%
01/02/2026 USD 50,000 53,182 0.52Brixmor Operating Partnership LP, REIT
3.85% 01/02/2025 USD 50,000 49,982 0.49Crown Castle International Corp., REIT
4.45% 15/02/2026 USD 50,000 54,370 0.53
258,998 2.53

Morgan Stanley Investment Funds 30 June 2016 206
The accompanying notes are an integral part of these financial statements.
US Dollar Corporate Bond Fund (continued)
SCHEDULE OF INVESTMENTSAs at 30 June 2016
Investments Currency
Quantity/Nominal
Value
Market Value USD
% of Net Assets
Transferable securities and money market instruments admitted to official exchange listing or dealt in on another regulated market
Corporate Bonds (continued)
RetailQVC, Inc. 4.375% 15/03/2023 USD 50,000 50,806 0.50Sally Holdings LLC 5.625% 01/12/2025 USD 25,000 26,187 0.25
76,993 0.75
Road & RailBurlington Northern Santa Fe LLC 4.55%
01/09/2044 USD 25,000 28,776 0.28
28,776 0.28
Semiconductors & Semiconductor EquipmentIntel Corp. 2.7% 15/12/2022 USD 25,000 26,195 0.25Lam Research Corp. 3.9% 15/06/2026 USD 25,000 26,386 0.26
52,581 0.51
SoftwareMicrosoft Corp. 3.125% 03/11/2025 USD 100,000 107,467 1.05Oracle Corp. 2.95% 15/05/2025 USD 75,000 78,470 0.77
185,937 1.82
Specialty RetailHome Depot, Inc. (The) 3.35%
15/09/2025 USD 50,000 54,609 0.53Lowe’s Cos, Inc. 2.5% 15/04/2026 USD 50,000 51,046 0.50
105,655 1.03
Tech Hardware, Storage & PeripheralsApple, Inc. 4.5% 23/02/2036 USD 50,000 56,489 0.55Apple, Inc. 3.85% 04/05/2043 USD 25,000 25,285 0.25
81,774 0.80
Textiles, Apparel & Luxury GoodsUnder Armour, Inc. 3.25% 15/06/2026 USD 25,000 25,269 0.25
25,269 0.25
Trading Companies & DistributorsAir Lease Corp. 3.375% 01/06/2021 USD 50,000 51,307 0.50
51,307 0.50
Wireless Telecommunication ServicesVodafone Group plc 4.375% 19/02/2043
(United Kingdom) (2) USD 25,000 23,868 0.23
23,868 0.23
Total Corporate Bonds 9,259,274 90.46
SCHEDULE OF INVESTMENTSAs at 30 June 2016
Investments Currency
Quantity/Nominal
Value
Market Value USD
% of Net Assets
Transferable securities and money market instruments admitted to official exchange listing or dealt in on another regulated market
Government Bonds
US Treasury Inflation Indexed 0.25% 15/01/2025 USD 125,000 128,277 1.25
128,277 1.25
Total Government Bonds 128,277 1.25
Total Transferable securities and money market instruments admitted to official exchange listing or dealt in on another regulated market 9,387,551 91.71
Total Investments 9,387,551 91.71
Cash 793,629 7.75
Other Assets/(Liabilities) 54,928 0.54
Total Net Assets 10,236,108 100.00
(2) The country in brackets represents the country of incorporation of this security.

207 Morgan Stanley Investment Funds 30 June 2016
The accompanying notes are an integral part of these financial statements.
US Dollar Corporate Bond Fund (continued)
Financial Futures Contracts
Security DescriptionNumber of Contracts Currency
Global Exposure
USD
Unrealised Gain/(Loss)
USD
% of Net Assets
US 2 Year Note, 30/09/2016 7 USD 1,534,641 9,625 0.09US Long Bond, 21/09/2016 3 USD 518,813 23,781 0.23US Ultra Bond, 21/09/2016 2 USD 374,250 9,563 0.09
Total Unrealised Gain on Financial Futures Contracts 42,969 0.41
US 10 Year Note, 21/09/2016 (2) USD (265,844) (4,688) (0.04)US 10 Year Ultra Note, 21/09/2016 (12) USD (1,748,438) (19,875) (0.19)
Total Unrealised Loss on Financial Futures Contracts (24,563) (0.23)
Net Unrealised Gain on Financial Futures Contracts 18,406 0.18
Collateral received and paid by the Fund in respect of financial derivative instruments:
Type of Collateral Counterparty CurrencyCollateral Amount
receivedCollateral Amount
paid
US Dollar Corporate Bond Fund
Cash Goldman Sachs USD 3,172 -
3,172 -
DERIVATIVES
Over-the-counter (OTC) and exchange traded derivatives as at 30 June 2016, expressed in US dollars.

Morgan Stanley Investment Funds 30 June 2016 208
The accompanying notes are an integral part of these financial statements.
Please refer to the full prospectus for the Fund’s investment objective and policy.
INVESTMENT AIM
To achieve its investment objective by investing in lower quality bonds issued in US Dollars. These bonds usually offer a higher yield than high quality bonds. Lower quality bonds are defined as being rated lower than BBB- by S&P or Baa3 by Moody’s.
SCHEDULE OF INVESTMENTSAs at 30 June 2016
Investments Currency
Quantity/Nominal
Value
Market Value USD
% of Net Assets
Transferable securities and money market instruments admitted to official exchange listing or dealt in on another regulated market
Corporate Bonds
AdvertisinginVentiv Health, Inc., 144A 9%
15/01/2018 USD 50,000 51,500 0.47Lamar Media Corp., 144A 5.75%
01/02/2026 USD 50,000 52,250 0.47MDC Partners, Inc., 144A 6.5%
01/05/2024 (Canada) (2) USD 50,000 49,500 0.45Outfront Media Capital LLC 5.625%
15/02/2024 USD 50,000 51,175 0.46
204,425 1.85
Aerospace & DefenseADS Tactical, Inc., 144A 11% 01/04/2018 USD 50,000 51,250 0.46LMI Aerospace, Inc. 7.375% 15/07/2019 USD 50,000 50,625 0.46
101,875 0.92
AgriculturePinnacle Operating Corp., 144A 9%
15/11/2020 USD 50,000 42,250 0.38
42,250 0.38
AirlinesAir Canada, 144A 7.75% 15/04/2021
(Canada) (2) USD 100,000 104,250 0.94American Airlines Group, Inc., 144A 5.5%
01/10/2019 USD 100,000 99,375 0.90United Continental Holdings, Inc. 6.375%
01/06/2018 USD 75,000 78,660 0.71
282,285 2.55
ApparelHanesbrands, Inc., 144A 4.875%
15/05/2026 USD 50,000 50,065 0.45
50,065 0.45
Auto ManufacturersAllied Specialty Vehicles, Inc., 144A 8.5%
01/11/2019 USD 85,000 86,488 0.78
86,488 0.78
Auto Parts & EquipmentAccuride Corp. 9.5% 01/08/2018 USD 50,000 46,000 0.41Commercial Vehicle Group, Inc. 7.875%
15/04/2019 USD 50,000 48,750 0.44Meritor, Inc. 6.25% 15/02/2024 USD 50,000 42,717 0.39
137,467 1.24
BanksInterface Security Systems Holdings, Inc.
9.25% 15/01/2018 USD 50,000 48,438 0.44Provident Funding Associates LP, 144A
6.75% 15/06/2021 USD 50,000 47,750 0.43
96,188 0.87
US Dollar High Yield Bond Fund

209 Morgan Stanley Investment Funds 30 June 2016
The accompanying notes are an integral part of these financial statements.
US Dollar High Yield Bond Fund (continued)
SCHEDULE OF INVESTMENTSAs at 30 June 2016
Investments Currency
Quantity/Nominal
Value
Market Value USD
% of Net Assets
Transferable securities and money market instruments admitted to official exchange listing or dealt in on another regulated market
Corporate Bonds (continued)
BeveragesBeverages & More, Inc., 144A 10%
15/11/2018 USD 100,000 90,375 0.82
90,375 0.82
BiotechnologyConcordia Healthcare Corp., 144A 7%
15/04/2023 (Canada) (2) USD 50,000 42,625 0.39
42,625 0.39
Building MaterialsAssociated Asphalt Partners LLC, 144A
8.5% 15/02/2018 USD 94,000 94,470 0.86Associated Materials LLC 9.125%
01/11/2017 USD 25,000 22,375 0.20CPG Merger Sub LLC, 144A 8%
01/10/2021 USD 50,000 48,500 0.44GCP Applied Technologies, Inc., 144A
9.5% 01/02/2023 USD 100,000 111,875 1.01Gibraltar Industries, Inc. 6.25%
01/02/2021 USD 50,000 50,500 0.46Standard Industries, Inc., 144A 5.5%
15/02/2023 USD 50,000 51,375 0.47Summit Materials LLC 6.125%
15/07/2023 USD 50,000 49,039 0.44US Concrete, Inc., 144A 6.375%
01/06/2024 USD 50,000 50,125 0.45
478,259 4.33
ChemicalsBlue Cube Spinco, Inc., 144A 10%
15/10/2025 USD 50,000 57,875 0.52Chemtura Corp. 5.75% 15/07/2021 USD 50,000 50,597 0.46Eco Services Operations LLC, 144A 8.5%
01/11/2022 USD 50,000 49,750 0.45Hexion, Inc. 8.875% 01/02/2018 USD 100,000 86,500 0.78
244,722 2.21
Commercial ServicesAhern Rentals, Inc., 144A 7.375%
15/05/2023 USD 50,000 34,750 0.32APX Group, Inc. 6.375% 01/12/2019 USD 50,000 49,359 0.45Brand Energy & Infrastructure Services,
Inc., 144A 8.5% 01/12/2021 USD 50,000 47,750 0.43Great Lakes Dredge & Dock Corp. 7.375%
01/02/2019 USD 50,000 48,000 0.43Harland Clarke Holdings Corp., 144A
9.75% 01/08/2018 USD 75,000 76,500 0.69Jaguar Holding Co. II, 144A 6.375%
01/08/2023 USD 50,000 51,000 0.46Safway Group Holding LLC, 144A 7%
15/05/2018 USD 100,000 100,250 0.91Service Corp. International 5.375%
15/01/2022 USD 50,000 51,969 0.47TMS International Corp., 144A 7.625%
15/10/2021 USD 100,000 70,000 0.63United Rentals North America, Inc. 5.75%
15/11/2024 USD 50,000 50,344 0.46
579,922 5.25
SCHEDULE OF INVESTMENTSAs at 30 June 2016
Investments Currency
Quantity/Nominal
Value
Market Value USD
% of Net Assets
Transferable securities and money market instruments admitted to official exchange listing or dealt in on another regulated market
Corporate Bonds (continued)
ComputersDynCorp International, Inc. 11.875%
30/11/2020 USD 44,587 37,676 0.34Western Digital Corp., 144A 7.375%
01/04/2023 USD 50,000 53,366 0.48
91,042 0.82
Distribution/WholesaleAmerican Builders & Contractors Supply
Co., Inc., 144A 5.625% 15/04/2021 USD 50,000 51,875 0.47Beacon Roofing Supply, Inc. 6.375%
01/10/2023 USD 50,000 52,625 0.48Global Partners LP 6.25% 15/07/2022 USD 50,000 41,750 0.38HD Supply, Inc. 7.5% 15/07/2020 USD 50,000 52,460 0.47
198,710 1.80
Diversified Financial ServicesAlly Financial, Inc. 4.125% 30/03/2020 USD 50,000 50,087 0.45KCG Holdings, Inc., 144A 6.875%
15/03/2020 USD 100,000 91,250 0.83NewStar Financial, Inc. 7.25% 01/05/2020 USD 50,000 47,362 0.43Oxford Finance LLC, 144A 7.25%
15/01/2018 USD 100,000 100,500 0.91Rivers Pittsburgh Borrower LP, 144A 9.5%
15/06/2019 USD 109,000 112,710 1.02
401,909 3.64
ElectricDPL, Inc. 6.75% 01/10/2019 USD 50,000 51,375 0.46
51,375 0.46
Electrical Components & EquipmentsArtesyn Embedded Technologies, Inc.,
144A 9.75% 15/10/2020 USD 100,000 88,500 0.80Belden, Inc., 144A 5.25% 15/07/2024 USD 50,000 48,625 0.44
137,125 1.24
ElectronicsKemet Corp. 10.5% 01/05/2018 USD 100,000 96,470 0.87
96,470 0.87
Engineering & ConstructionMasTec, Inc. 4.875% 15/03/2023 USD 50,000 46,786 0.43Michael Baker International LLC, 144A
8.25% 15/10/2018 USD 100,000 97,500 0.88Zachry Holdings, Inc., 144A 7.5%
01/02/2020 USD 50,000 49,750 0.45
194,036 1.76
EntertainmentChurchill Downs, Inc., 144A 5.375%
15/12/2021 USD 50,000 51,500 0.47Downstream Development Authority of the
Quapaw Tribe of Oklahoma, 144A 10.5% 01/07/2019 USD 75,000 71,062 0.64

Morgan Stanley Investment Funds 30 June 2016 210
The accompanying notes are an integral part of these financial statements.
US Dollar High Yield Bond Fund (continued)
SCHEDULE OF INVESTMENTSAs at 30 June 2016
Investments Currency
Quantity/Nominal
Value
Market Value USD
% of Net Assets
Transferable securities and money market instruments admitted to official exchange listing or dealt in on another regulated market
Corporate Bonds (continued)
Entertainment (continued)Eldorado Resorts, Inc. 7% 01/08/2023 USD 50,000 52,125 0.47EMI Music Publishing Group North America
Holdings, 144A 7.625% 15/06/2024 USD 50,000 51,500 0.47Gibson Brands, Inc., 144A 8.875%
01/08/2018 USD 75,000 42,000 0.38Greektown Holdings LLC, 144A 8.875%
15/03/2019 USD 52,000 54,080 0.49
322,267 2.92
Environmental ControlSAExploration Holdings, Inc. 10%
15/07/2019 USD 75,000 34,875 0.32
34,875 0.32
FoodBumble Bee Holdco SCA, 144A 9.625%
15/03/2018 (Luxembourg) (2) USD 93,000 91,954 0.83Pinnacle Foods Finance LLC, 144A
5.875% 15/01/2024 USD 50,000 52,500 0.48TreeHouse Foods, Inc., 144A 6%
15/02/2024 USD 50,000 52,984 0.48Wells Enterprises, Inc., 144A 6.75%
01/02/2020 USD 44,000 45,705 0.41
243,143 2.20
Food ServiceAramark Services, Inc., 144A 4.75%
01/06/2026 USD 50,000 49,254 0.45
49,254 0.45
GasLBC Tank Terminals Holding Netherlands
BV, 144A 6.875% 15/05/2023 (Netherlands) (2) USD 50,000 48,500 0.44
48,500 0.44
Healthcare ProductsAlere, Inc., 144A 6.375% 01/07/2023 USD 50,000 52,500 0.47Mallinckrodt International Finance SA, 144A
5.5% 15/04/2025 (Luxembourg) (2) USD 50,000 45,000 0.41Teleflex, Inc. 4.875% 01/06/2026 USD 50,000 50,275 0.46
147,775 1.34
Healthcare ServicesAcadia Healthcare Co., Inc. 5.625%
15/02/2023 USD 50,000 49,756 0.45Amsurg Corp. 5.625% 15/07/2022 USD 50,000 51,219 0.46HCA, Inc. 5.25% 15/06/2026 USD 50,000 51,954 0.47MPH Acquisition Holdings LLC, 144A
7.125% 01/06/2024 USD 25,000 26,312 0.24Select Medical Corp. 6.375% 01/06/2021 USD 50,000 47,787 0.43Tenet Healthcare Corp., FRN 4.152%
15/06/2020 USD 50,000 49,875 0.45
276,903 2.50
SCHEDULE OF INVESTMENTSAs at 30 June 2016
Investments Currency
Quantity/Nominal
Value
Market Value USD
% of Net Assets
Transferable securities and money market instruments admitted to official exchange listing or dealt in on another regulated market
Corporate Bonds (continued)
Holding Companies – DiversifiedArgos Merger Sub, Inc., 144A 7.125%
15/03/2023 USD 50,000 50,939 0.46
50,939 0.46
Home BuildersAV Homes, Inc. 8.5% 01/07/2019 USD 100,000 98,750 0.90Century Communities, Inc. 6.875%
15/05/2022 USD 46,000 44,390 0.40
143,140 1.30
Home FurnishingsTempur Sealy International, Inc., 144A
5.5% 15/06/2026 USD 50,000 49,125 0.44
49,125 0.44
Household ProductsCentral Garden & Pet Co. 6.125%
15/11/2023 USD 50,000 52,125 0.47RSI Home Products, Inc., 144A 6.5%
15/03/2023 USD 50,000 51,625 0.47Spectrum Brands, Inc. 5.75% 15/07/2025 USD 50,000 52,006 0.47
155,756 1.41
InsuranceBaytex Energy Corp., 144A 5.625%
01/06/2024 (Canada) (2) USD 50,000 40,500 0.37CNO Financial Group, Inc. 4.5%
30/05/2020 USD 50,000 52,000 0.47HUB International Ltd., 144A 7.875%
01/10/2021 USD 50,000 48,250 0.44Radian Group, Inc. 7% 15/03/2021 USD 50,000 53,313 0.48
194,063 1.76
InternetBankrate, Inc., 144A 6.125% 15/08/2018 USD 75,000 75,375 0.68
75,375 0.68
Iron/SteelSignode Industrial Group Lux SA, 144A
6.375% 01/05/2022 USD 100,000 97,000 0.88
97,000 0.88
LodgingFelCor Lodging LP 6% 01/06/2025 USD 50,000 50,125 0.45Golden Nugget Escrow, Inc., 144A 8.5%
01/12/2021 USD 50,000 51,250 0.46Playa Resorts Holding BV, 144A 8%
15/08/2020 (Netherlands) (2) USD 100,000 101,000 0.92Seminole Hard Rock Entertainment, Inc.,
144A 5.875% 15/05/2021 USD 50,000 50,375 0.46Sugarhouse HSP Gaming Prop Mezz LP,
144A 6.375% 01/06/2021 USD 50,000 49,625 0.45
302,375 2.74
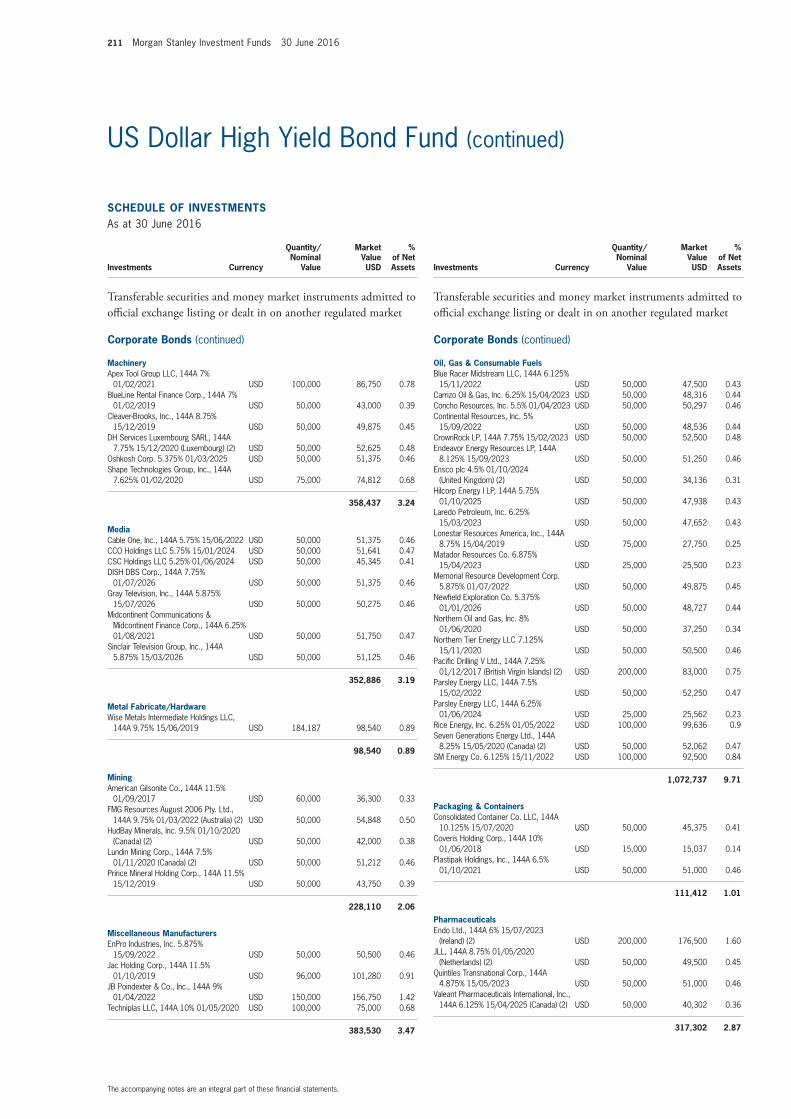
211 Morgan Stanley Investment Funds 30 June 2016
The accompanying notes are an integral part of these financial statements.
US Dollar High Yield Bond Fund (continued)
SCHEDULE OF INVESTMENTSAs at 30 June 2016
Investments Currency
Quantity/Nominal
Value
Market Value USD
% of Net Assets
Transferable securities and money market instruments admitted to official exchange listing or dealt in on another regulated market
Corporate Bonds (continued)
MachineryApex Tool Group LLC, 144A 7%
01/02/2021 USD 100,000 86,750 0.78BlueLine Rental Finance Corp., 144A 7%
01/02/2019 USD 50,000 43,000 0.39Cleaver-Brooks, Inc., 144A 8.75%
15/12/2019 USD 50,000 49,875 0.45DH Services Luxembourg SARL, 144A
7.75% 15/12/2020 (Luxembourg) (2) USD 50,000 52,625 0.48Oshkosh Corp. 5.375% 01/03/2025 USD 50,000 51,375 0.46Shape Technologies Group, Inc., 144A
7.625% 01/02/2020 USD 75,000 74,812 0.68
358,437 3.24
MediaCable One, Inc., 144A 5.75% 15/06/2022 USD 50,000 51,375 0.46CCO Holdings LLC 5.75% 15/01/2024 USD 50,000 51,641 0.47CSC Holdings LLC 5.25% 01/06/2024 USD 50,000 45,345 0.41DISH DBS Corp., 144A 7.75%
01/07/2026 USD 50,000 51,375 0.46Gray Television, Inc., 144A 5.875%
15/07/2026 USD 50,000 50,275 0.46Midcontinent Communications &
Midcontinent Finance Corp., 144A 6.25% 01/08/2021 USD 50,000 51,750 0.47
Sinclair Television Group, Inc., 144A 5.875% 15/03/2026 USD 50,000 51,125 0.46
352,886 3.19
Metal Fabricate/HardwareWise Metals Intermediate Holdings LLC,
144A 9.75% 15/06/2019 USD 184,187 98,540 0.89
98,540 0.89
MiningAmerican Gilsonite Co., 144A 11.5%
01/09/2017 USD 60,000 36,300 0.33FMG Resources August 2006 Pty. Ltd.,
144A 9.75% 01/03/2022 (Australia) (2) USD 50,000 54,848 0.50HudBay Minerals, Inc. 9.5% 01/10/2020
(Canada) (2) USD 50,000 42,000 0.38Lundin Mining Corp., 144A 7.5%
01/11/2020 (Canada) (2) USD 50,000 51,212 0.46Prince Mineral Holding Corp., 144A 11.5%
15/12/2019 USD 50,000 43,750 0.39
228,110 2.06
Miscellaneous ManufacturersEnPro Industries, Inc. 5.875%
15/09/2022 USD 50,000 50,500 0.46Jac Holding Corp., 144A 11.5%
01/10/2019 USD 96,000 101,280 0.91JB Poindexter & Co., Inc., 144A 9%
01/04/2022 USD 150,000 156,750 1.42Techniplas LLC, 144A 10% 01/05/2020 USD 100,000 75,000 0.68
383,530 3.47
SCHEDULE OF INVESTMENTSAs at 30 June 2016
Investments Currency
Quantity/Nominal
Value
Market Value USD
% of Net Assets
Transferable securities and money market instruments admitted to official exchange listing or dealt in on another regulated market
Corporate Bonds (continued)
Oil, Gas & Consumable FuelsBlue Racer Midstream LLC, 144A 6.125%
15/11/2022 USD 50,000 47,500 0.43Carrizo Oil & Gas, Inc. 6.25% 15/04/2023 USD 50,000 48,316 0.44Concho Resources, Inc. 5.5% 01/04/2023 USD 50,000 50,297 0.46Continental Resources, Inc. 5%
15/09/2022 USD 50,000 48,536 0.44CrownRock LP, 144A 7.75% 15/02/2023 USD 50,000 52,500 0.48Endeavor Energy Resources LP, 144A
8.125% 15/09/2023 USD 50,000 51,250 0.46Ensco plc 4.5% 01/10/2024
(United Kingdom) (2) USD 50,000 34,136 0.31Hilcorp Energy I LP, 144A 5.75%
01/10/2025 USD 50,000 47,938 0.43Laredo Petroleum, Inc. 6.25%
15/03/2023 USD 50,000 47,652 0.43Lonestar Resources America, Inc., 144A
8.75% 15/04/2019 USD 75,000 27,750 0.25Matador Resources Co. 6.875%
15/04/2023 USD 25,000 25,500 0.23Memorial Resource Development Corp.
5.875% 01/07/2022 USD 50,000 49,875 0.45Newfield Exploration Co. 5.375%
01/01/2026 USD 50,000 48,727 0.44Northern Oil and Gas, Inc. 8%
01/06/2020 USD 50,000 37,250 0.34Northern Tier Energy LLC 7.125%
15/11/2020 USD 50,000 50,500 0.46Pacific Drilling V Ltd., 144A 7.25%
01/12/2017 (British Virgin Islands) (2) USD 200,000 83,000 0.75Parsley Energy LLC, 144A 7.5%
15/02/2022 USD 50,000 52,250 0.47Parsley Energy LLC, 144A 6.25%
01/06/2024 USD 25,000 25,562 0.23Rice Energy, Inc. 6.25% 01/05/2022 USD 100,000 99,636 0.9Seven Generations Energy Ltd., 144A
8.25% 15/05/2020 (Canada) (2) USD 50,000 52,062 0.47SM Energy Co. 6.125% 15/11/2022 USD 100,000 92,500 0.84
1,072,737 9.71
Packaging & ContainersConsolidated Container Co. LLC, 144A
10.125% 15/07/2020 USD 50,000 45,375 0.41Coveris Holding Corp., 144A 10%
01/06/2018 USD 15,000 15,037 0.14Plastipak Holdings, Inc., 144A 6.5%
01/10/2021 USD 50,000 51,000 0.46
111,412 1.01
PharmaceuticalsEndo Ltd., 144A 6% 15/07/2023
(Ireland) (2) USD 200,000 176,500 1.60JLL, 144A 8.75% 01/05/2020
(Netherlands) (2) USD 50,000 49,500 0.45Quintiles Transnational Corp., 144A
4.875% 15/05/2023 USD 50,000 51,000 0.46Valeant Pharmaceuticals International, Inc.,
144A 6.125% 15/04/2025 (Canada) (2) USD 50,000 40,302 0.36
317,302 2.87

Morgan Stanley Investment Funds 30 June 2016 212
The accompanying notes are an integral part of these financial statements.
US Dollar High Yield Bond Fund (continued)
SCHEDULE OF INVESTMENTSAs at 30 June 2016
Investments Currency
Quantity/Nominal
Value
Market Value USD
% of Net Assets
Transferable securities and money market instruments admitted to official exchange listing or dealt in on another regulated market
Corporate Bonds (continued)
PipelinesDCP Midstream LLC, 144A 5.35%
15/03/2020 USD 50,000 48,620 0.44ONEOK, Inc. 4.25% 01/02/2022 USD 50,000 46,691 0.42Rose Rock Midstream LP 5.625%
15/11/2023 USD 50,000 43,750 0.40Tesoro Logistics LP 6.375% 01/05/2024 USD 50,000 52,251 0.47
191,312 1.73
Real EstateKennedy-Wilson, Inc. 5.875% 01/04/2024 USD 50,000 49,685 0.45
49,685 0.45
Real Estate Investment Trusts (REITs)CTR Partnership LP, REIT 5.875%
01/06/2021 USD 50,000 50,937 0.46DuPont Fabros Technology LP, REIT
5.625% 15/06/2023 USD 50,000 50,691 0.46Iron Mountain, Inc., REIT, 144A 6%
01/10/2020 USD 50,000 52,462 0.48iStar, Inc., REIT 6.5% 01/07/2021 USD 50,000 47,125 0.43MPT Operating Partnership LP, REIT
6.375% 01/03/2024 USD 50,000 53,500 0.48Sabra Health Care LP, REIT 5.5%
01/02/2021 USD 50,000 51,911 0.47VEREIT Operating Partnership LP, REIT
4.875% 01/06/2026 USD 50,000 51,163 0.46
357,789 3.24
RetailCarrols Restaurant Group, Inc. 8%
01/05/2022 USD 50,000 53,500 0.48Dollar Tree, Inc., 144A 5.75%
01/03/2023 USD 50,000 53,532 0.48Guitar Center, Inc., 144A 6.5%
15/04/2019 USD 100,000 86,750 0.79JC Penney Corp., Inc. 8.125%
01/10/2019 USD 50,000 51,558 0.47KFC Holding Co., 144A 5% 01/06/2024 USD 50,000 50,885 0.46Logan’s Roadhouse, Inc. 10.75%
15/10/2017 USD 100,000 11,000 0.10Neiman Marcus Group Ltd. LLC, 144A
8.75% 15/10/2021 USD 50,000 38,000 0.34Rite Aid Corp., 144A 6.125% 01/04/2023 USD 50,000 53,189 0.48Sally Holdings LLC 5.625% 01/12/2025 USD 50,000 52,374 0.47Sonic Automotive, Inc. 5% 15/05/2023 USD 50,000 49,125 0.45Tops Holding LLC, 144A 8% 15/06/2022 USD 100,000 88,500 0.80
588,413 5.32
SoftwareFirst Data Corp., 144A 7% 01/12/2023 USD 50,000 50,698 0.46
50,698 0.46
Storage/WarehousingAlgeco Scotsman Global Finance plc, 144A
8.5% 15/10/2018 (United Kingdom) (2) USD 200,000 163,000 1.47
163,000 1.47
SCHEDULE OF INVESTMENTSAs at 30 June 2016
Investments Currency
Quantity/Nominal
Value
Market Value USD
% of Net Assets
Transferable securities and money market instruments admitted to official exchange listing or dealt in on another regulated market
Corporate Bonds (continued)
TelecommunicationsCommScope, Inc., 144A 5.5%
15/06/2024 USD 50,000 50,688 0.46GCI, Inc. 6.75% 01/06/2021 USD 50,000 50,875 0.46Intelsat Jackson Holdings SA, 144A 8%
15/02/2024 (Luxembourg) (2) USD 50,000 49,125 0.44SBA Telecommunications, Inc. 5.75%
15/07/2020 USD 50,000 51,759 0.47Syniverse Holdings, Inc. 9.125%
15/01/2019 USD 50,000 24,750 0.22T-Mobile USA, Inc. 6.836% 28/04/2023 USD 50,000 52,852 0.48West Corp., 144A 4.75% 15/07/2021 USD 50,000 49,500 0.45
329,549 2.98
TextilesEmpire Today LLC, 144A 11.375%
01/02/2017 USD 50,000 49,250 0.45
49,250 0.45
TransportationCEVA Group plc, 144A 4% 01/05/2018
(United Kingdom) (2) USD 75,000 67,125 0.61Martin Midstream Partners LP 7.25%
15/02/2021 USD 100,000 92,000 0.83OPE KAG Finance Sub, Inc., 144A 7.875%
31/07/2023 USD 50,000 49,500 0.45XPO Logistics, Inc., 144A 7.875%
01/09/2019 USD 50,000 51,250 0.46
259,875 2.35
Trucking and LeasingFlexi-Van Leasing, Inc., 144A 7.875%
15/08/2018 USD 50,000 48,750 0.44
48,750 0.44
Total Corporate Bonds 10,809,378 97.80
Total Transferable securities and money market instruments admitted to official exchange listing or dealt in on another regulated market 10,809,378 97.80
Total Investments 10,809,378 97.80
Cash 42,106 0.38
Other Assets/(Liabilities) 200,858 1.82
Total Net Assets 11,052,342 100.00
(2) The country in brackets represents the country of incorporation of this security.

213 Morgan Stanley Investment Funds 30 June 2016
The accompanying notes are an integral part of these financial statements.
Please refer to the full prospectus for the Fund’s investment objective and policy.
US Dollar Short Duration Bond Fund*
* Fund commenced operations on 22 April 2016.
INVESTMENT AIM
To provide an attractive rate of return, measured in US Dollars by investing primarily in high quality USD denominated Fixed Income Securities, including asset backed securities.
SCHEDULE OF INVESTMENTSAs at 30 June 2016
Investments Currency
Quantity/Nominal
Value
Market Value USD
% of Net Assets
Transferable securities and money market instruments admitted to official exchange listing or dealt in on another regulated market
Corporate Bonds
Aerospace & DefenseLockheed Martin Corp. 1.85%
23/11/2018 USD 100,000 101,501 0.89
101,501 0.89
AutomobilesAmerican Honda Finance Corp. 1.5%
13/03/2018 USD 100,000 100,960 0.88BMW US Capital LLC, 144A 1.5%
11/04/2019 USD 100,000 100,508 0.88Hyundai Capital America, 144A 2.55%
06/02/2019 USD 110,000 112,139 0.98Nissan Motor Acceptance Corp., 144A
2.35% 04/03/2019 USD 100,000 102,175 0.89Toyota Motor Credit Corp. 1.4%
20/05/2019 USD 150,000 150,956 1.31
566,738 4.94
BanksABN AMRO Bank NV, 144A 2.5%
30/10/2018 (Netherlands) (2) USD 200,000 204,665 1.78Bank Nederlandse Gemeenten NV, 144A
1.125% 25/05/2018 (Netherlands) (2) USD 70,000 70,255 0.61Bank of America Corp. 2.6% 15/01/2019 USD 100,000 102,289 0.89Bank of Montreal 1.4% 10/04/2018
(Canada) (2) USD 100,000 100,332 0.87Bank of Nova Scotia (The) 1.7%
11/06/2018 (Canada) (2) USD 100,000 100,921 0.88Bank of Nova Scotia (The) 1.65%
14/06/2019 (Canada) (2) USD 50,000 50,251 0.44BB&T Corp. 1.45% 12/01/2018 USD 100,000 100,291 0.87BNP Paribas SA 2.4% 12/12/2018
(France) (2) USD 100,000 102,018 0.89Citigroup, Inc. 2.15% 30/07/2018 USD 100,000 101,043 0.88Commonwealth Bank of Australia 1.625%
12/03/2018 (Australia) (2) USD 250,000 251,699 2.19HSBC USA, Inc. 2.625% 24/09/2018 USD 100,000 101,779 0.89J.P. Morgan Chase & Co. 1.8%
25/01/2018 USD 50,000 50,336 0.44J.P. Morgan Chase & Co. 2.35%
28/01/2019 USD 100,000 102,266 0.89PNC Bank NA 1.8% 05/11/2018 USD 250,000 252,916 2.21Royal Bank of Canada 1.5% 16/01/2018
(Canada) (2) USD 100,000 100,477 0.88Royal Bank of Canada 2.15% 15/03/2019
(Canada) (2) USD 50,000 51,059 0.45Santander Holdings USA, Inc. 2.7%
24/05/2019 USD 50,000 50,196 0.44Santander UK plc 2% 24/08/2018
(United Kingdom) (2) USD 100,000 100,275 0.87Skandinaviska Enskilda Banken AB, 144A
1.75% 19/03/2018 (Sweden) (2) USD 200,000 201,388 1.76Toronto-Dominion Bank (The) 1.4%
30/04/2018 (Canada) (2) USD 50,000 50,226 0.44Toronto-Dominion Bank (The) 1.95%
22/01/2019 (Canada) (2) USD 100,000 101,598 0.89US Bank NA 1.45% 29/01/2018 USD 250,000 251,685 2.19Wells Fargo & Co. 1.5% 16/01/2018 USD 50,000 50,237 0.44Wells Fargo & Co. 2.15% 15/01/2019 USD 100,000 102,148 0.89Westpac Banking Corp. 1.95%
23/11/2018 (Australia) (2) USD 100,000 101,292 0.88

Morgan Stanley Investment Funds 30 June 2016 214
The accompanying notes are an integral part of these financial statements.
US Dollar Short Duration Bond Fund (continued)
SCHEDULE OF INVESTMENTSAs at 30 June 2016
Investments Currency
Quantity/Nominal
Value
Market Value USD
% of Net Assets
Transferable securities and money market instruments admitted to official exchange listing or dealt in on another regulated market
Corporate Bonds (continued)
Banks (continued)Westpac Banking Corp. 1.65%
13/05/2019 (Australia) (2) USD 25,000 25,101 0.22
2,876,743 25.08
BeveragesAnheuser-Busch InBev Finance, Inc. 1.25%
17/01/2018 USD 100,000 100,305 0.88Coca-Cola Co. (The) 1.65% 14/03/2018 USD 100,000 101,375 0.88Coca-Cola Co. (The) 1.375% 30/05/2019 USD 75,000 75,726 0.66Molson Coors Brewing Co. 1.45%
15/07/2019 USD 50,000 50,099 0.44
327,505 2.86
BiotechnologyAbbVie, Inc. 1.8% 14/05/2018 USD 100,000 100,699 0.88Baxalta, Inc. 2% 22/06/2018 USD 100,000 99,757 0.87Celgene Corp. 2.25% 15/05/2019 USD 50,000 50,925 0.44
251,381 2.19
Capital MarketsGoldman Sachs Group, Inc. (The) 2.9%
19/07/2018 USD 100,000 102,641 0.89
102,641 0.89
Communications EquipmentCisco Systems, Inc. 2.125% 01/03/2019 USD 110,000 113,041 0.99
113,041 0.99
Consumer FinanceAmerican Express Credit Corp. 1.8%
31/07/2018 USD 100,000 100,928 0.88Capital One Financial Corp. 2.45%
24/04/2019 USD 100,000 101,824 0.89General Motors Financial Co., Inc. 2.4%
10/04/2018 USD 100,000 100,749 0.88
303,501 2.65
Diversified Financial ServicesBerkshire Hathaway, Inc. 1.55%
09/02/2018 USD 100,000 101,065 0.88Protective Life Global Funding, 144A
1.722% 15/04/2019 USD 150,000 150,852 1.32
251,917 2.20
Diversified Telecommunication ServicesAT&T, Inc. 2.3% 11/03/2019 USD 100,000 102,034 0.89Orange SA 2.75% 06/02/2019
(France) (2) USD 100,000 103,324 0.90Verizon Communications, Inc. 2.55%
17/06/2019 USD 100,000 103,604 0.90
308,962 2.69
SCHEDULE OF INVESTMENTSAs at 30 June 2016
Investments Currency
Quantity/Nominal
Value
Market Value USD
% of Net Assets
Transferable securities and money market instruments admitted to official exchange listing or dealt in on another regulated market
Corporate Bonds (continued)
Electric UtilitiesSouthern Co. (The) 1.85% 01/07/2019 USD 110,000 111,343 0.97
111,343 0.97
Food & Staples RetailingCVS Health Corp. 1.9% 20/07/2018 USD 110,000 111,585 0.97Kroger Co. (The) 2% 15/01/2019 USD 50,000 50,774 0.44Walgreens Boots Alliance, Inc. 1.75%
30/05/2018 USD 50,000 50,372 0.44
212,731 1.85
Health Care Equipment & SuppliesBoston Scientific Corp. 2.65%
01/10/2018 USD 80,000 81,857 0.71
81,857 0.71
Hotels, Restaurants & LeisureMcDonald’s Corp. 2.1% 07/12/2018 USD 100,000 102,060 0.89Starbucks Corp. 2% 05/12/2018 USD 110,000 112,416 0.98
214,476 1.87
InsuranceMetropolitan Life Global Funding I, 144A
1.875% 22/06/2018 USD 150,000 151,452 1.32New York Life Global Funding, 144A 1.3%
27/04/2018 USD 100,000 100,369 0.87New York Life Global Funding, 144A 1.55%
02/11/2018 USD 100,000 100,847 0.88Pricoa Global Funding I, 144A 1.9%
21/09/2018 USD 150,000 152,089 1.33Principal Life Global Funding II, 144A
2.25% 15/10/2018 USD 100,000 101,967 0.89Suncorp-Metway Ltd., 144A 2.1%
03/05/2019 (Australia) (2) USD 50,000 50,552 0.44
657,276 5.73
MachineryCaterpillar Financial Services Corp. 1.3%
01/03/2018 USD 100,000 100,285 0.87
100,285 0.87
MediaThomson Reuters Corp. 1.65%
29/09/2017 (Canada) (2) USD 50,000 50,187 0.44Viacom, Inc. 2.5% 01/09/2018 USD 100,000 101,293 0.88
151,480 1.32
Oil, Gas & Consumable FuelsChevron Corp. 1.718% 24/06/2018 USD 100,000 101,148 0.88Marathon Petroleum Corp. 2.7%
14/12/2018 USD 50,000 51,154 0.45Shell International Finance BV 1.9%
10/08/2018 (Netherlands) (2) USD 100,000 101,603 0.89
253,905 2.22

215 Morgan Stanley Investment Funds 30 June 2016
The accompanying notes are an integral part of these financial statements.
US Dollar Short Duration Bond Fund (continued)
SCHEDULE OF INVESTMENTSAs at 30 June 2016
Investments Currency
Quantity/Nominal
Value
Market Value USD
% of Net Assets
Transferable securities and money market instruments admitted to official exchange listing or dealt in on another regulated market
Corporate Bonds (continued)
PharmaceuticalsActavis Funding SCS 2.45% 15/06/2019
(Luxembourg) (2) USD 50,000 50,834 0.44AstraZeneca plc 1.75% 16/11/2018
(United Kingdom) (2) USD 100,000 101,368 0.89
152,202 1.33
Specialty RetailAutoZone, Inc. 1.625% 21/04/2019 USD 100,000 100,543 0.88
100,543 0.88
TelecommunicationsDeutsche Telekom International Finance BV
6% 08/07/2019 (Netherlands) (2) USD 75,000 84,931 0.74
84,931 0.74
TobaccoReynolds American, Inc. 2.3%
12/06/2018 USD 100,000 101,761 0.89
101,761 0.89
Wireless Telecommunication ServicesVodafone Group plc 1.25% 26/09/2017
(United Kingdom) (2) USD 100,000 99,945 0.87Vodafone Group plc 1.5% 19/02/2018
(United Kingdom) (2) USD 100,000 100,145 0.87
200,090 1.74
Total Corporate Bonds 7,626,810 66.50
Government Bonds
US Treasury 0.875% 30/04/2017 USD 700,000 702,242 6.12US Treasury 0.875% 15/04/2019 USD 200,000 200,844 1.76US Treasury 0.875% 15/06/2019 USD 475,000 477,060 4.16US Treasury Bill 0% 28/07/2016 USD 1,425,000 1,424,785 12.42
2,804,931 24.46
Total Government Bonds 2,804,931 24.46
Mortgage and Asset Backed Securities
AutomobilesAlly Auto Receivables Trust,
Series 2015-1 ‘A3’ 1.39% 16/09/2019 USD 100,000 100,308 0.87Ford Credit Auto Lease Trust,
Series 2015-B ‘A3’ 1.38% 15/12/2018 USD 100,000 100,349 0.88GM Financial Automobile Leasing Trust,
Series 2015-3 ‘A3’ 1.69% 20/03/2019 USD 100,000 100,851 0.88Mercedes-Benz Auto Receivables Trust,
Series 2015-1 ‘A3’ 1.34% 16/12/2019 USD 100,000 100,517 0.88
402,025 3.51
SCHEDULE OF INVESTMENTSAs at 30 June 2016
Investments Currency
Quantity/Nominal
Value
Market Value USD
% of Net Assets
Transferable securities and money market instruments admitted to official exchange listing or dealt in on another regulated market
Mortgage and Asset Backed Securities (continued)
BanksCapital One Multi-Asset Execution Trust,
FRN, Series 2016-A1 ‘A1’ 0.9% 15/02/2022 USD 80,000 80,185 0.70
80,185 0.70
Diversified Financial ServicesNationstar HECM Loan Trust,
Series 2016-2A ‘A’, 144A 2.239% 25/06/2026 USD 100,000 100,000 0.87
Nissan Auto Lease Trust, Series 2016-A ‘A3’ 1.49% 15/03/2019 USD 50,000 50,164 0.44
NRZ Advance Receivables Trust, Series 2016-T1 ‘AT1’, 144A 2.751% 15/06/2049 USD 100,000 100,417 0.87
Toyota Auto Receivables Owner Trust, Series 2016-B ‘A3’ 1.3% 15/04/2020 USD 10,000 10,041 0.09
260,622 2.27
Total Mortgage and Asset Backed Securities 742,832 6.48
Total Transferable securities and money market instruments admitted to official exchange listing or dealt in on another regulated market 11,174,573 97.44
Total Investments 11,174,573 97.44
Cash 1,603,767 13.98
Other Assets/(Liabilities) (1,310,235) (11.42)
Total Net Assets 11,468,105 100.00
(2) The country in brackets represents the country of incorporation of this security.

Morgan Stanley Investment Funds 30 June 2016 216
The accompanying notes are an integral part of these financial statements.
US Dollar Short Duration Bond Fund (continued)
Financial Futures Contracts
Security DescriptionNumber of Contracts Currency
Global Exposure
USD
Unrealised Gain/(Loss)
USD
% of Net Assets
US 2 Year Note, 30/09/2016 (16) USD (3,507,750) (20,188) (0.18)US 5 Year Note, 30/09/2016 (6) USD (732,234) (12,703) (0.11)
Total Unrealised Loss on Financial Futures Contracts (32,891) (0.29)
Net Unrealised Loss on Financial Futures Contracts (32,891) (0.29)
Collateral received and paid by the Fund in respect of financial derivative instruments:
Type of Collateral Counterparty CurrencyCollateral Amount
receivedCollateral Amount
paid
US Dollar Short Duration Bond Fund
Cash Goldman Sachs USD 58,367 -
58,367 -
DERIVATIVES
Over-the-counter (OTC) and exchange traded derivatives as at 30 June 2016, expressed in US dollars.

217 Morgan Stanley Investment Funds 30 June 2016
The accompanying notes are an integral part of these financial statements.
Please refer to the full prospectus for the Fund’s investment objective and policy.
US Dollar Short Duration High Yield Bond Fund
INVESTMENT AIM
To achieve its investment objective by investing in lower quality bonds issued in US Dollars. These bonds usually offer a higher yield than high quality bonds. Lower quality bonds are defined as being rated lower than BBB- by S&P or Baa3 by Moody’s. The weighted average duration of the Fund will normally be less than 3 years, although this may be higher under certain market conditions.
SCHEDULE OF INVESTMENTSAs at 30 June 2016
Investments Currency
Quantity/Nominal
Value
Market Value USD
% of Net Assets
Transferable securities and money market instruments admitted to official exchange listing or dealt in on another regulated market
Corporate Bonds
AdvertisinginVentiv Health, Inc., 144A 9%
15/01/2018 USD 100,000 103,000 0.99
103,000 0.99
Aerospace & DefenseADS Tactical, Inc., 144A 11% 01/04/2018 USD 50,000 51,250 0.49LMI Aerospace, Inc. 7.375% 15/07/2019 USD 100,000 101,250 0.98TransDigm, Inc. 5.5% 15/10/2020 USD 50,000 50,965 0.49
203,465 1.96
AgriculturePinnacle Operating Corp., 144A 9%
15/11/2020 USD 50,000 42,250 0.41
42,250 0.41
AirlinesAir Canada, 144A 7.75% 15/04/2021
(Canada) (2) USD 50,000 52,125 0.51American Airlines Group, Inc. 6.125%
01/06/2018 USD 100,000 103,558 1.00United Continental Holdings, Inc. 6.375%
01/06/2018 USD 100,000 104,879 1.01
260,562 2.52
Auto ManufacturersAllied Specialty Vehicles, Inc., 144A 8.5%
01/11/2019 USD 135,000 137,363 1.33
137,363 1.33
Auto Parts & EquipmentAccuride Corp. 9.5% 01/08/2018 USD 100,000 92,000 0.89Commercial Vehicle Group, Inc. 7.875%
15/04/2019 USD 100,000 97,500 0.94
189,500 1.83
BanksCIT Group, Inc., 144A 6.625%
01/04/2018 USD 50,000 52,675 0.51Interface Security Systems Holdings, Inc.
9.25% 15/01/2018 USD 100,000 96,875 0.94Mallinckrodt International Finance SA 3.5%
15/04/2018 (Luxembourg) (2) USD 50,000 49,190 0.47
198,740 1.92
BeveragesBeverages & More, Inc., 144A 10%
15/11/2018 USD 100,000 90,375 0.87Constellation Brands, Inc. 3.875%
15/11/2019 USD 25,000 26,253 0.26
116,628 1.13
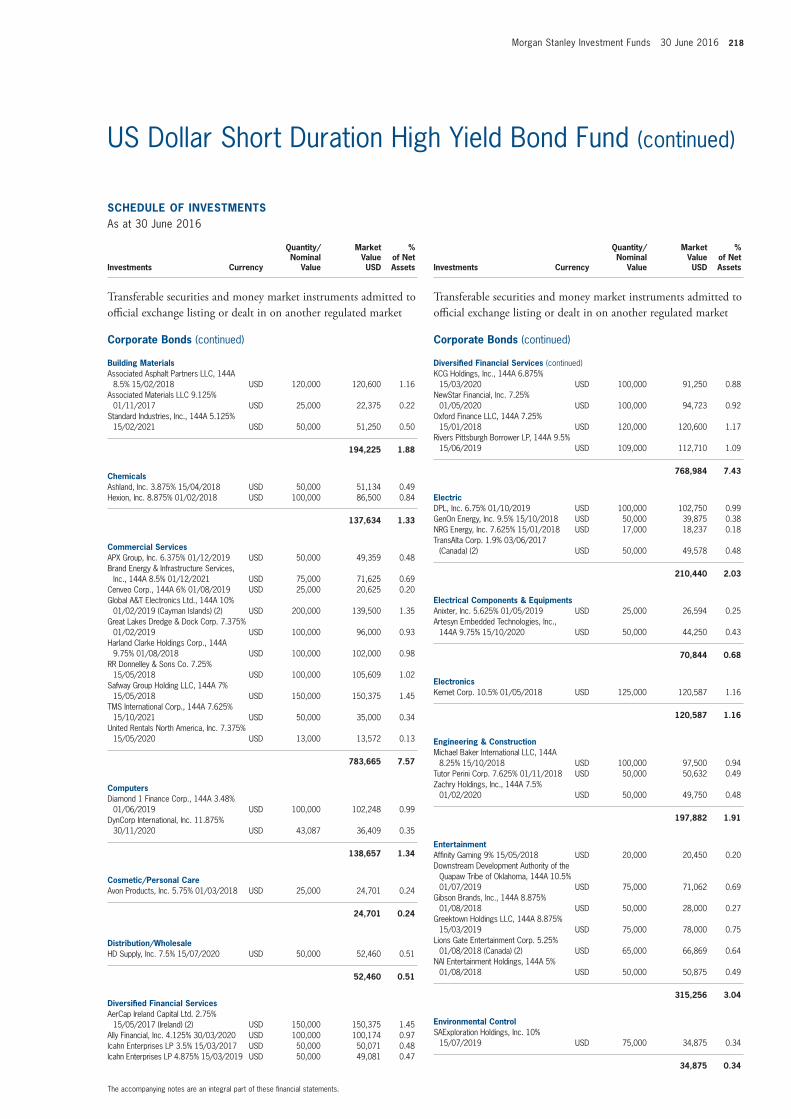
Morgan Stanley Investment Funds 30 June 2016 218
The accompanying notes are an integral part of these financial statements.
US Dollar Short Duration High Yield Bond Fund (continued)
SCHEDULE OF INVESTMENTSAs at 30 June 2016
Investments Currency
Quantity/Nominal
Value
Market Value USD
% of Net Assets
Transferable securities and money market instruments admitted to official exchange listing or dealt in on another regulated market
Corporate Bonds (continued)
Building MaterialsAssociated Asphalt Partners LLC, 144A
8.5% 15/02/2018 USD 120,000 120,600 1.16Associated Materials LLC 9.125%
01/11/2017 USD 25,000 22,375 0.22Standard Industries, Inc., 144A 5.125%
15/02/2021 USD 50,000 51,250 0.50
194,225 1.88
ChemicalsAshland, Inc. 3.875% 15/04/2018 USD 50,000 51,134 0.49Hexion, Inc. 8.875% 01/02/2018 USD 100,000 86,500 0.84
137,634 1.33
Commercial ServicesAPX Group, Inc. 6.375% 01/12/2019 USD 50,000 49,359 0.48Brand Energy & Infrastructure Services,
Inc., 144A 8.5% 01/12/2021 USD 75,000 71,625 0.69Cenveo Corp., 144A 6% 01/08/2019 USD 25,000 20,625 0.20Global A&T Electronics Ltd., 144A 10%
01/02/2019 (Cayman Islands) (2) USD 200,000 139,500 1.35Great Lakes Dredge & Dock Corp. 7.375%
01/02/2019 USD 100,000 96,000 0.93Harland Clarke Holdings Corp., 144A
9.75% 01/08/2018 USD 100,000 102,000 0.98RR Donnelley & Sons Co. 7.25%
15/05/2018 USD 100,000 105,609 1.02Safway Group Holding LLC, 144A 7%
15/05/2018 USD 150,000 150,375 1.45TMS International Corp., 144A 7.625%
15/10/2021 USD 50,000 35,000 0.34United Rentals North America, Inc. 7.375%
15/05/2020 USD 13,000 13,572 0.13
783,665 7.57
ComputersDiamond 1 Finance Corp., 144A 3.48%
01/06/2019 USD 100,000 102,248 0.99DynCorp International, Inc. 11.875%
30/11/2020 USD 43,087 36,409 0.35
138,657 1.34
Cosmetic/Personal CareAvon Products, Inc. 5.75% 01/03/2018 USD 25,000 24,701 0.24
24,701 0.24
Distribution/WholesaleHD Supply, Inc. 7.5% 15/07/2020 USD 50,000 52,460 0.51
52,460 0.51
Diversified Financial ServicesAerCap Ireland Capital Ltd. 2.75%
15/05/2017 (Ireland) (2) USD 150,000 150,375 1.45Ally Financial, Inc. 4.125% 30/03/2020 USD 100,000 100,174 0.97Icahn Enterprises LP 3.5% 15/03/2017 USD 50,000 50,071 0.48Icahn Enterprises LP 4.875% 15/03/2019 USD 50,000 49,081 0.47
SCHEDULE OF INVESTMENTSAs at 30 June 2016
Investments Currency
Quantity/Nominal
Value
Market Value USD
% of Net Assets
Transferable securities and money market instruments admitted to official exchange listing or dealt in on another regulated market
Corporate Bonds (continued)
Diversified Financial Services (continued)KCG Holdings, Inc., 144A 6.875%
15/03/2020 USD 100,000 91,250 0.88NewStar Financial, Inc. 7.25%
01/05/2020 USD 100,000 94,723 0.92Oxford Finance LLC, 144A 7.25%
15/01/2018 USD 120,000 120,600 1.17Rivers Pittsburgh Borrower LP, 144A 9.5%
15/06/2019 USD 109,000 112,710 1.09
768,984 7.43
ElectricDPL, Inc. 6.75% 01/10/2019 USD 100,000 102,750 0.99GenOn Energy, Inc. 9.5% 15/10/2018 USD 50,000 39,875 0.38NRG Energy, Inc. 7.625% 15/01/2018 USD 17,000 18,237 0.18TransAlta Corp. 1.9% 03/06/2017
(Canada) (2) USD 50,000 49,578 0.48
210,440 2.03
Electrical Components & EquipmentsAnixter, Inc. 5.625% 01/05/2019 USD 25,000 26,594 0.25Artesyn Embedded Technologies, Inc.,
144A 9.75% 15/10/2020 USD 50,000 44,250 0.43
70,844 0.68
ElectronicsKemet Corp. 10.5% 01/05/2018 USD 125,000 120,587 1.16
120,587 1.16
Engineering & ConstructionMichael Baker International LLC, 144A
8.25% 15/10/2018 USD 100,000 97,500 0.94Tutor Perini Corp. 7.625% 01/11/2018 USD 50,000 50,632 0.49Zachry Holdings, Inc., 144A 7.5%
01/02/2020 USD 50,000 49,750 0.48
197,882 1.91
EntertainmentAffinity Gaming 9% 15/05/2018 USD 20,000 20,450 0.20Downstream Development Authority of the
Quapaw Tribe of Oklahoma, 144A 10.5% 01/07/2019 USD 75,000 71,062 0.69
Gibson Brands, Inc., 144A 8.875% 01/08/2018 USD 50,000 28,000 0.27
Greektown Holdings LLC, 144A 8.875% 15/03/2019 USD 75,000 78,000 0.75
Lions Gate Entertainment Corp. 5.25% 01/08/2018 (Canada) (2) USD 65,000 66,869 0.64
NAI Entertainment Holdings, 144A 5% 01/08/2018 USD 50,000 50,875 0.49
315,256 3.04
Environmental ControlSAExploration Holdings, Inc. 10%
15/07/2019 USD 75,000 34,875 0.34
34,875 0.34

219 Morgan Stanley Investment Funds 30 June 2016
The accompanying notes are an integral part of these financial statements.
US Dollar Short Duration High Yield Bond Fund (continued)
SCHEDULE OF INVESTMENTSAs at 30 June 2016
Investments Currency
Quantity/Nominal
Value
Market Value USD
% of Net Assets
Transferable securities and money market instruments admitted to official exchange listing or dealt in on another regulated market
Corporate Bonds (continued)
FoodBI-LO LLC, 144A 9.25% 15/02/2019 USD 75,000 64,125 0.62Bumble Bee Holdings, Inc., 144A 9%
15/12/2017 USD 100,000 101,750 0.98Dole Food Co., Inc., 144A 7.25%
01/05/2019 USD 50,000 50,125 0.49Wells Enterprises, Inc., 144A 6.75%
01/02/2020 USD 87,000 90,371 0.87
306,371 2.96
Healthcare ProductsAlere, Inc. 7.25% 01/07/2018 USD 100,000 102,687 0.99Kinetic Concepts, Inc. 10.5% 01/11/2018 USD 100,000 97,021 0.94Mallinckrodt International Finance SA, 144A
4.875% 15/04/2020 (Luxembourg) (2) USD 50,000 48,250 0.46
247,958 2.39
Healthcare ServicesFresenius Medical Care US Finance II, Inc.,
144A 6.5% 15/09/2018 USD 50,000 54,293 0.53HCA, Inc. 8% 01/10/2018 USD 100,000 112,025 1.08Tenet Healthcare Corp., FRN 4.152%
15/06/2020 USD 100,000 99,750 0.96
266,068 2.57
Home BuildersAV Homes, Inc. 8.5% 01/07/2019 USD 100,000 98,750 0.95
98,750 0.95
InsuranceCNO Financial Group, Inc. 4.5%
30/05/2020 USD 50,000 52,000 0.50Genworth Holdings, Inc. 6.515%
22/05/2018 USD 25,000 24,514 0.24Radian Group, Inc. 7% 15/03/2021 USD 50,000 53,312 0.51
129,826 1.25
InternetBankrate, Inc., 144A 6.125% 15/08/2018 USD 100,000 100,500 0.97IAC 4.875% 30/11/2018 USD 48,000 48,847 0.47Netflix, Inc. 5.375% 01/02/2021 USD 100,000 106,026 1.03
255,373 2.47
Iron/SteelArcelorMittal 6.125% 01/06/2018
(Luxembourg) (2) USD 50,000 52,399 0.51ArcelorMittal 5.125% 01/06/2020
(Luxembourg) (2) USD 50,000 51,673 0.50
104,072 1.01
LodgingMGM Resorts International 7.625%
15/01/2017 USD 50,000 51,479 0.50Playa Resorts Holding BV, 144A 8%
15/08/2020 (Netherlands) (2) USD 100,000 101,000 0.97
SCHEDULE OF INVESTMENTSAs at 30 June 2016
Investments Currency
Quantity/Nominal
Value
Market Value USD
% of Net Assets
Transferable securities and money market instruments admitted to official exchange listing or dealt in on another regulated market
Corporate Bonds (continued)
Lodging (continued)Seminole Hard Rock Entertainment, Inc.,
144A 5.875% 15/05/2021 USD 50,000 50,375 0.49Sugarhouse HSP Gaming Prop Mezz LP,
144A 6.375% 01/06/2021 USD 50,000 49,625 0.48
252,479 2.44
MachineryBlueLine Rental Finance Corp., 144A 7%
01/02/2019 USD 100,000 86,000 0.83Cleaver-Brooks, Inc., 144A 8.75%
15/12/2019 USD 50,000 49,875 0.48CNH Industrial Capital LLC 3.625%
15/04/2018 USD 50,000 50,520 0.49CNH Industrial Capital LLC 4.375%
06/11/2020 USD 25,000 25,135 0.24DH Services Luxembourg SARL, 144A
7.75% 15/12/2020 (Luxembourg) (2) USD 50,000 52,625 0.51Shape Technologies Group, Inc., 144A
7.625% 01/02/2020 USD 75,000 74,812 0.72
338,967 3.27
MediaCablevision Systems Corp. 7.75%
15/04/2018 USD 50,000 53,228 0.51DISH DBS Corp. 4.25% 01/04/2018 USD 75,000 76,726 0.74Sinclair Television Group, Inc. 5.375%
01/04/2021 USD 25,000 25,623 0.25
155,577 1.50
Metal Fabricate/HardwareWise Metals Intermediate Holdings LLC,
144A 9.75% 15/06/2019 USD 184,187 98,540 0.95
98,540 0.95
MiningAmerican Gilsonite Co., 144A 11.5%
01/09/2017 USD 72,000 43,560 0.42HudBay Minerals, Inc. 9.5% 01/10/2020
(Canada) (2) USD 50,000 42,000 0.41Lundin Mining Corp., 144A 7.5%
01/11/2020 (Canada) (2) USD 100,000 102,425 0.99Novelis, Inc. 8.375% 15/12/2017
(Canada) (2) USD 50,000 51,179 0.49Prince Mineral Holding Corp., 144A 11.5%
15/12/2019 USD 50,000 43,750 0.42
282,914 2.73
Miscellaneous ManufacturersBombardier, Inc., 144A 5.5% 15/09/2018
(Canada) (2) USD 50,000 49,531 0.48Jac Holding Corp., 144A 11.5%
01/10/2019 USD 70,000 73,850 0.71Techniplas LLC, 144A 10% 01/05/2020 USD 100,000 75,000 0.73
198,381 1.92
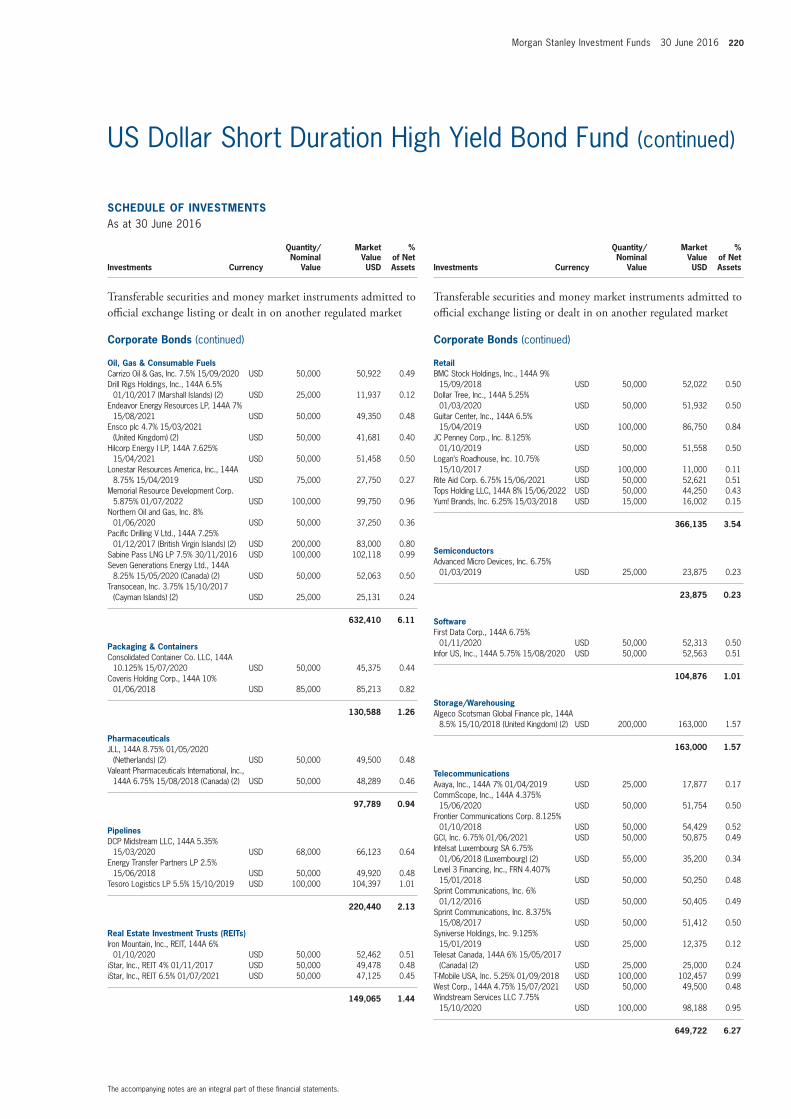
Morgan Stanley Investment Funds 30 June 2016 220
The accompanying notes are an integral part of these financial statements.
US Dollar Short Duration High Yield Bond Fund (continued)
SCHEDULE OF INVESTMENTSAs at 30 June 2016
Investments Currency
Quantity/Nominal
Value
Market Value USD
% of Net Assets
Transferable securities and money market instruments admitted to official exchange listing or dealt in on another regulated market
Corporate Bonds (continued)
Oil, Gas & Consumable FuelsCarrizo Oil & Gas, Inc. 7.5% 15/09/2020 USD 50,000 50,922 0.49Drill Rigs Holdings, Inc., 144A 6.5%
01/10/2017 (Marshall Islands) (2) USD 25,000 11,937 0.12Endeavor Energy Resources LP, 144A 7%
15/08/2021 USD 50,000 49,350 0.48Ensco plc 4.7% 15/03/2021
(United Kingdom) (2) USD 50,000 41,681 0.40Hilcorp Energy I LP, 144A 7.625%
15/04/2021 USD 50,000 51,458 0.50Lonestar Resources America, Inc., 144A
8.75% 15/04/2019 USD 75,000 27,750 0.27Memorial Resource Development Corp.
5.875% 01/07/2022 USD 100,000 99,750 0.96Northern Oil and Gas, Inc. 8%
01/06/2020 USD 50,000 37,250 0.36Pacific Drilling V Ltd., 144A 7.25%
01/12/2017 (British Virgin Islands) (2) USD 200,000 83,000 0.80Sabine Pass LNG LP 7.5% 30/11/2016 USD 100,000 102,118 0.99Seven Generations Energy Ltd., 144A
8.25% 15/05/2020 (Canada) (2) USD 50,000 52,063 0.50Transocean, Inc. 3.75% 15/10/2017
(Cayman Islands) (2) USD 25,000 25,131 0.24
632,410 6.11
Packaging & ContainersConsolidated Container Co. LLC, 144A
10.125% 15/07/2020 USD 50,000 45,375 0.44Coveris Holding Corp., 144A 10%
01/06/2018 USD 85,000 85,213 0.82
130,588 1.26
PharmaceuticalsJLL, 144A 8.75% 01/05/2020
(Netherlands) (2) USD 50,000 49,500 0.48Valeant Pharmaceuticals International, Inc.,
144A 6.75% 15/08/2018 (Canada) (2) USD 50,000 48,289 0.46
97,789 0.94
PipelinesDCP Midstream LLC, 144A 5.35%
15/03/2020 USD 68,000 66,123 0.64Energy Transfer Partners LP 2.5%
15/06/2018 USD 50,000 49,920 0.48Tesoro Logistics LP 5.5% 15/10/2019 USD 100,000 104,397 1.01
220,440 2.13
Real Estate Investment Trusts (REITs)Iron Mountain, Inc., REIT, 144A 6%
01/10/2020 USD 50,000 52,462 0.51iStar, Inc., REIT 4% 01/11/2017 USD 50,000 49,478 0.48iStar, Inc., REIT 6.5% 01/07/2021 USD 50,000 47,125 0.45
149,065 1.44
SCHEDULE OF INVESTMENTSAs at 30 June 2016
Investments Currency
Quantity/Nominal
Value
Market Value USD
% of Net Assets
Transferable securities and money market instruments admitted to official exchange listing or dealt in on another regulated market
Corporate Bonds (continued)
RetailBMC Stock Holdings, Inc., 144A 9%
15/09/2018 USD 50,000 52,022 0.50Dollar Tree, Inc., 144A 5.25%
01/03/2020 USD 50,000 51,932 0.50Guitar Center, Inc., 144A 6.5%
15/04/2019 USD 100,000 86,750 0.84JC Penney Corp., Inc. 8.125%
01/10/2019 USD 50,000 51,558 0.50Logan’s Roadhouse, Inc. 10.75%
15/10/2017 USD 100,000 11,000 0.11Rite Aid Corp. 6.75% 15/06/2021 USD 50,000 52,621 0.51Tops Holding LLC, 144A 8% 15/06/2022 USD 50,000 44,250 0.43Yum! Brands, Inc. 6.25% 15/03/2018 USD 15,000 16,002 0.15
366,135 3.54
SemiconductorsAdvanced Micro Devices, Inc. 6.75%
01/03/2019 USD 25,000 23,875 0.23
23,875 0.23
SoftwareFirst Data Corp., 144A 6.75%
01/11/2020 USD 50,000 52,313 0.50Infor US, Inc., 144A 5.75% 15/08/2020 USD 50,000 52,563 0.51
104,876 1.01
Storage/WarehousingAlgeco Scotsman Global Finance plc, 144A
8.5% 15/10/2018 (United Kingdom) (2) USD 200,000 163,000 1.57
163,000 1.57
TelecommunicationsAvaya, Inc., 144A 7% 01/04/2019 USD 25,000 17,877 0.17CommScope, Inc., 144A 4.375%
15/06/2020 USD 50,000 51,754 0.50Frontier Communications Corp. 8.125%
01/10/2018 USD 50,000 54,429 0.52GCI, Inc. 6.75% 01/06/2021 USD 50,000 50,875 0.49Intelsat Luxembourg SA 6.75%
01/06/2018 (Luxembourg) (2) USD 55,000 35,200 0.34Level 3 Financing, Inc., FRN 4.407%
15/01/2018 USD 50,000 50,250 0.48Sprint Communications, Inc. 6%
01/12/2016 USD 50,000 50,405 0.49Sprint Communications, Inc. 8.375%
15/08/2017 USD 50,000 51,412 0.50Syniverse Holdings, Inc. 9.125%
15/01/2019 USD 25,000 12,375 0.12Telesat Canada, 144A 6% 15/05/2017
(Canada) (2) USD 25,000 25,000 0.24T-Mobile USA, Inc. 5.25% 01/09/2018 USD 100,000 102,457 0.99West Corp., 144A 4.75% 15/07/2021 USD 50,000 49,500 0.48Windstream Services LLC 7.75%
15/10/2020 USD 100,000 98,188 0.95
649,722 6.27

221 Morgan Stanley Investment Funds 30 June 2016
The accompanying notes are an integral part of these financial statements.
US Dollar Short Duration High Yield Bond Fund (continued)
SCHEDULE OF INVESTMENTSAs at 30 June 2016
Investments Currency
Quantity/Nominal
Value
Market Value USD
% of Net Assets
Transferable securities and money market instruments admitted to official exchange listing or dealt in on another regulated market
Corporate Bonds (continued)
TextilesEmpire Today LLC, 144A 11.375%
01/02/2017 USD 100,000 98,500 0.95
98,500 0.95
TransportationCEVA Group plc, 144A 4% 01/05/2018
(United Kingdom) (2) USD 150,000 134,250 1.30Florida East Coast Holdings Corp., 144A
6.75% 01/05/2019 USD 75,000 75,000 0.72Martin Midstream Partners LP 7.25%
15/02/2021 USD 50,000 46,000 0.44XPO Logistics, Inc., 144A 7.875%
01/09/2019 USD 100,000 102,500 0.99
357,750 3.45
Trucking and LeasingFlexi-Van Leasing, Inc., 144A 7.875%
15/08/2018 USD 100,000 97,500 0.94
97,500 0.94
Total Corporate Bonds 10,128,644 97.80
Total Transferable securities and money market instruments admitted to official exchange listing or dealt in on another regulated market 10,128,644 97.80
Total Investments 10,128,644 97.80
Cash 68,279 0.66
Other Assets/(Liabilities) 159,754 1.54
Total Net Assets 10,356,677 100.00
(2) The country in brackets represents the country of incorporation of this security.

Morgan Stanley Investment Funds 30 June 2016 222
The accompanying notes are an integral part of these financial statements.
Please refer to the full prospectus for the Fund’s investment objective and policy.
US Dollar Liquidity Fund
INVESTMENT AIM
The US Dollar Liquidity Fund (the “Feeder Fund”) is a feeder fund of the Morgan Stanley Liquidity Funds - US Dollar Liquidity Fund (the “Master Fund”). The Feeder Fund will at all times invest at least 85% of its assets in shares of the Master Fund whilst it may hold up to 15% of its assets in ancillary liquid assets, including cash, cash equivalents and short term bank deposits.
SCHEDULE OF INVESTMENTSAs at 30 June 2016
Investments Currency
Quantity/Nominal
Value
Market Value USD
% of Net Assets
Units of authorised UCITS or other collective investment undertakings
Mutual Funds
LuxembourgMorgan Stanley Liquidity Funds US Dollar
Liquidity Fund – MS Reserve (4) USD 4,207,272,527 4,207,272,527 99.99
4,207,272,527 99.99
Total Mutual Funds 4,207,272,527 99.99
Total Units of authorised UCITS or other collective investment undertakings 4,207,272,527 99.99
Total Investments 4,207,272,527 99.99
Cash 197,259 0.01
Other Assets/(Liabilities) 29,653 0.00
Total Net Assets 4,207,499,439 100.00
(4) Affiliate managed by an affiliate of the Investment Adviser.
Liquidity Funds

223 Morgan Stanley Investment Funds 30 June 2016
The accompanying notes are an integral part of these financial statements.
Please refer to the full prospectus for the Fund’s investment objective and policy.
Diversified Alpha Plus Fund
INVESTMENT AIM
To seek to provide an absolute return while actively managing total portfolio risk. The Fund will invest in baskets of stocks, ETFs, bonds and derivatives, with the asset allocation based on a top-down investment approach focusing on asset class, sector, region and country selection. The Fund aims to manage downside risk and targets below market volatility.
SCHEDULE OF INVESTMENTSAs at 30 June 2016
Investments Currency
Quantity/Nominal
Value
Market Value EUR
% of Net Assets
Transferable securities and money market instruments admitted to official exchange listing or dealt in on another regulated market
Corporate Bonds
AustraliaFMG Resources August 2006 Pty. Ltd.,
144A 9.75% 01/03/2022 USD 2,025,000 1,998,249 0.05
1,998,249 0.05
Canada1011778 BC ULC, 144A 6%
01/04/2022 USD 1,925,000 1,789,808 0.05Bombardier, Inc., 144A 7.5%
15/03/2025 USD 1,525,000 1,198,521 0.03First Quantum Minerals Ltd., 144A 7%
15/02/2021 USD 1,350,000 971,538 0.03MEG Energy Corp., 144A 7%
31/03/2024 USD 1,350,000 922,961 0.02
4,882,828 0.13
FranceNumericable-SFR SA, 144A 6%
15/05/2022 USD 3,500,000 3,072,937 0.08
3,072,937 0.08
GermanyDeutsche Bank AG 4.5% 01/04/2025 USD 1,275,000 1,063,129 0.03Schaeffler Holding Finance BV, 144A
6.875% 15/08/2018 (Netherlands) (2) USD 320,958 295,221 0.01
1,358,350 0.04
IrelandGrifols Worldwide Operations Ltd. 5.25%
01/04/2022 USD 1,000,000 918,760 0.03
918,760 0.03
ItalyEnel SpA, FRN, 144A 8.75%
24/09/2073 USD 1,550,000 1,595,894 0.04Telecom Italia SpA, 144A 5.303%
30/05/2024 USD 1,250,000 1,131,144 0.03Wind Acquisition Finance SA, 144A
7.375% 23/04/2021 (Luxembourg) (2) USD 3,600,000 3,086,980 0.08
5,814,018 0.15
JapanSoftBank Group Corp., 144A 4.5%
15/04/2020 USD 1,350,000 1,251,942 0.03
1,251,942 0.03
LuxembourgAltice Financing SA, 144A 6.625%
15/02/2023 USD 2,450,000 2,160,192 0.06Altice Luxembourg SA, 144A 7.75%
15/05/2022 USD 3,000,000 2,725,581 0.07
Asset Allocation Funds

Morgan Stanley Investment Funds 30 June 2016 224
The accompanying notes are an integral part of these financial statements.
Diversified Alpha Plus Fund (continued)
SCHEDULE OF INVESTMENTSAs at 30 June 2016
Investments Currency
Quantity/Nominal
Value
Market Value EUR
% of Net Assets
Transferable securities and money market instruments admitted to official exchange listing or dealt in on another regulated market
Corporate Bonds (continued)
Luxembourg (continued)Intelsat Jackson Holdings SA 7.25%
01/04/2019 USD 1,825,000 1,190,246 0.03Quicken Loans, Inc., 144A 5.75%
01/05/2025 (United States of America) (2) USD 1,350,000 1,171,917 0.03
7,247,936 0.19
NetherlandsAerCap Ireland Capital Ltd. 4.5%
15/05/2021 (Ireland) (2) USD 1,350,000 1,243,956 0.03Neptune Finco Corp., 144A 10.875%
15/10/2025 (United States of America) (2) USD 2,000,000 2,051,024 0.05
Schaeffler Finance BV, 144A 4.75% 15/05/2023 USD 1,000,000 921,562 0.03
4,216,542 0.11
United KingdomFiat Chrysler Automobiles NV 5.25%
15/04/2023 (Netherlands) (2) USD 1,550,000 1,386,152 0.04Inmarsat Finance plc, 144A 4.875%
15/05/2022 USD 1,000,000 822,546 0.02International Game Technology plc, 144A
6.25% 15/02/2022 USD 1,000,000 917,563 0.02Royal Bank of Scotland Group plc 5.125%
28/05/2024 USD 1,675,000 1,472,692 0.04Virgin Media Secured Finance plc, 144A
5.25% 15/01/2026 USD 750,000 651,912 0.02
5,250,865 0.14
United States of AmericaAcadia Healthcare Co., Inc. 5.625%
15/02/2023 USD 1,325,000 1,186,116 0.03Acosta, Inc., 144A 7.75% 01/10/2022 USD 900,000 718,533 0.02ADT Corp. (The) 6.25% 15/10/2021 USD 1,350,000 1,288,890 0.03Advanced Micro Devices, Inc. 6.75%
01/03/2019 USD 925,000 794,659 0.02AECOM 5.875% 15/10/2024 USD 900,000 831,879 0.02AES Corp. 7.375% 01/07/2021 USD 650,000 657,017 0.02Alcoa, Inc. 5.125% 01/10/2024 USD 1,575,000 1,426,304 0.04Ally Financial, Inc. 5.75% 20/11/2025 USD 850,000 766,127 0.02Altice US Finance I Corp., 144A 5.375%
15/07/2023 USD 1,800,000 1,607,085 0.04American Tire Distributors, Inc., 144A
10.25% 01/03/2022 USD 875,000 696,606 0.02Amsurg Corp. 5.625% 15/07/2022 USD 1,350,000 1,244,024 0.03Antero Resources Corp. 5.125%
01/12/2022 USD 1,350,000 1,162,718 0.03Argos Merger Sub, Inc., 144A 7.125%
15/03/2023 USD 2,475,000 2,268,231 0.06Avaya, Inc., 144A 7% 01/04/2019 USD 900,000 578,955 0.02Ball Corp. 5.25% 01/07/2025 USD 1,250,000 1,178,164 0.03Blue Racer Midstream LLC, 144A 6.125%
15/11/2022 USD 875,000 747,769 0.02Bumble Bee Holdings, Inc., 144A 9%
15/12/2017 USD 1,350,000 1,235,674 0.03Cablevision Systems Corp. 7.75%
15/04/2018 USD 1,375,000 1,316,760 0.04Caesars Entertainment Resort Properties
LLC 11% 01/10/2021 USD 1,825,000 1,615,238 0.04
SCHEDULE OF INVESTMENTSAs at 30 June 2016
Investments Currency
Quantity/Nominal
Value
Market Value EUR
% of Net Assets
Transferable securities and money market instruments admitted to official exchange listing or dealt in on another regulated market
Corporate Bonds (continued)
United States of America (continued)California Resources Corp., 144A 8%
15/12/2022 USD 1,925,000 1,235,984 0.03Calpine Corp. 5.75% 15/01/2025 USD 1,250,000 1,089,010 0.03Calumet Specialty Products Partners LP
6.5% 15/04/2021 USD 900,000 572,871 0.02Capsugel SA, 144A 7% 15/05/2019
(Luxembourg) (2) USD 869,000 784,660 0.02CCO Holdings LLC, 144A 5.75%
15/02/2026 USD 3,000,000 2,772,930 0.07Centene Corp., 144A 5.625%
15/02/2021 USD 1,800,000 1,693,099 0.05Central Garden & Pet Co. 6.125%
15/11/2023 USD 900,000 844,023 0.02CenturyLink, Inc. 5.625% 01/04/2020 USD 1,250,000 1,163,568 0.03Cenveo Corp., 144A 6% 01/08/2019 USD 900,000 667,932 0.02Cequel Communications Holdings I LLC,
144A 6.375% 15/09/2020 USD 900,000 816,569 0.02Chemours Co. (The) 6.625% 15/05/2023 USD 1,800,000 1,368,921 0.04Chesapeake Energy Corp., 144A 8%
15/12/2022 USD 1,900,000 1,454,945 0.04CIT Group, Inc. 3.875% 19/02/2019 USD 800,000 724,195 0.02CNO Financial Group, Inc. 5.25%
30/05/2025 USD 900,000 835,927 0.02CommScope Technologies Finance LLC,
144A 6% 15/06/2025 USD 2,025,000 1,865,389 0.05Communications Sales & Leasing, Inc.,
REIT 8.25% 15/10/2023 USD 1,350,000 1,225,048 0.03Community Health Systems, Inc. 6.875%
01/02/2022 USD 3,500,000 2,751,224 0.07CONSOL Energy, Inc. 5.875%
15/04/2022 USD 2,475,000 1,917,522 0.05Constellation Brands, Inc. 4.25%
01/05/2023 USD 100,000 92,715 0.00Continental Resources, Inc. 4.5%
15/04/2023 USD 1,025,000 858,453 0.02Crestwood Midstream Partners LP, 144A
6.25% 01/04/2023 USD 450,000 372,423 0.01DaVita HealthCare Partners, Inc. 5.125%
15/07/2024 USD 2,000,000 1,820,913 0.05DCP Midstream Operating LP 3.875%
15/03/2023 USD 900,000 740,797 0.02Denbury Resources, Inc. 4.625%
15/07/2023 USD 900,000 529,630 0.01DFC Finance Corp., 144A 10.5%
15/06/2020 USD 900,000 493,865 0.01DISH DBS Corp. 5.875% 15/11/2024 USD 2,500,000 2,100,523 0.06Dollar Tree, Inc., 144A 5.75%
01/03/2023 USD 2,375,000 2,287,383 0.06DuPont Fabros Technology LP, REIT
5.875% 15/09/2021 USD 450,000 421,544 0.01Dynegy, Inc. 6.75% 01/11/2019 USD 2,200,000 1,977,010 0.05Endo Ltd., 144A 6% 15/07/2023
(Ireland) (2) USD 1,500,000 1,190,808 0.03Energy Transfer Equity LP 5.875%
15/01/2024 USD 1,350,000 1,184,177 0.03Equinix, Inc., REIT 5.875% 15/01/2026 USD 2,250,000 2,112,791 0.06First Data Corp., 144A 7% 01/12/2023 USD 3,750,000 3,420,504 0.09FirstEnergy Corp. 4.25% 15/03/2023 USD 500,000 462,670 0.01Florida East Coast Holdings Corp., 144A
6.75% 01/05/2019 USD 1,125,000 1,012,018 0.03Freeport-McMoRan, Inc. 5.45%
15/03/2043 USD 2,700,000 1,926,778 0.05Frontier Communications Corp. 11%
15/09/2025 USD 3,475,000 3,217,073 0.09Gates Global LLC, 144A 6% 15/07/2022 USD 1,350,000 1,071,837 0.03

225 Morgan Stanley Investment Funds 30 June 2016
The accompanying notes are an integral part of these financial statements.
Diversified Alpha Plus Fund (continued)
SCHEDULE OF INVESTMENTSAs at 30 June 2016
Investments Currency
Quantity/Nominal
Value
Market Value EUR
% of Net Assets
Transferable securities and money market instruments admitted to official exchange listing or dealt in on another regulated market
Corporate Bonds (continued)
United States of America (continued)GLP Capital LP 4.875% 01/11/2020 USD 1,250,000 1,172,524 0.03Goodyear Tire & Rubber Co. (The) 5.125%
15/11/2023 USD 1,350,000 1,256,441 0.03HCA, Inc. 5.375% 01/02/2025 USD 3,000,000 2,766,858 0.07Hilcorp Energy I LP, 144A 5% 01/12/2024 USD 600,000 505,000 0.01Hilton Worldwide Finance LLC 5.625%
15/10/2021 USD 1,025,000 954,780 0.03Hologic, Inc., 144A 5.25% 15/07/2022 USD 1,000,000 943,651 0.03Icahn Enterprises LP 6% 01/08/2020 USD 1,500,000 1,331,465 0.04iHeartCommunications, Inc. 9%
15/12/2019 USD 2,025,000 1,374,823 0.04Infor US, Inc. 6.5% 15/05/2022 USD 2,000,000 1,709,187 0.05inVentiv Health, Inc., 144A 9%
15/01/2018 USD 450,000 416,952 0.01Iron Mountain, Inc., REIT, 144A 6%
01/10/2020 USD 1,250,000 1,179,845 0.03iStar, Inc., REIT 5% 01/07/2019 USD 1,350,000 1,141,520 0.03Jaguar Holding Co. II, 144A 6.375%
01/08/2023 USD 1,325,000 1,215,771 0.03JBS USA LLC, 144A 5.75% 15/06/2025 USD 175,000 149,811 0.00JC Penney Corp., Inc. 8.125%
01/10/2019 USD 900,000 834,842 0.02Kennedy-Wilson, Inc. 5.875% 01/04/2024 USD 650,000 581,035 0.02Kindred Healthcare, Inc. 8% 15/01/2020 USD 1,350,000 1,210,414 0.03KLX, Inc., 144A 5.875% 01/12/2022 USD 1,575,000 1,384,947 0.04L Brands, Inc. 5.625% 15/02/2022 USD 1,125,000 1,083,619 0.03Level 3 Financing, Inc. 5.375%
15/08/2022 USD 1,000,000 903,134 0.02LifePoint Health, Inc. 5.5% 01/12/2021 USD 750,000 701,852 0.02Mallinckrodt International Finance SA, 144A
5.75% 01/08/2022 (Luxembourg) (2) USD 875,000 745,801 0.02MGM Resorts International 6%
15/03/2023 USD 1,575,000 1,497,932 0.04Micron Technology, Inc. 5.5% 01/02/2025 USD 1,125,000 858,267 0.02Momentive Performance Materials, Inc.
3.88% 24/10/2021 USD 1,350,000 964,670 0.03MSCI, Inc., 144A 5.75% 15/08/2025 USD 1,125,000 1,057,559 0.03Navient Corp. 5.5% 15/01/2019 USD 1,595,000 1,425,197 0.04Neiman Marcus Group Ltd. LLC, 144A 8%
15/10/2021 USD 1,250,000 910,816 0.02Netflix, Inc. 5.75% 01/03/2024 USD 900,000 846,047 0.02Nielsen Finance LLC, 144A 5%
15/04/2022 USD 2,250,000 2,062,817 0.06NRG Energy, Inc. 6.25% 15/07/2022 USD 1,100,000 964,999 0.03Oasis Petroleum, Inc. 6.875%
15/03/2022 USD 1,100,000 912,826 0.03Platform Specialty Products Corp., 144A
6.5% 01/02/2022 USD 1,350,000 1,074,763 0.03Post Holdings, Inc., 144A 6.75%
01/12/2021 USD 900,000 853,366 0.02Quintiles Transnational Corp., 144A
4.875% 15/05/2023 USD 900,000 825,807 0.02Radian Group, Inc. 5.25% 15/06/2020 USD 1,350,000 1,237,478 0.03Reynolds Group Issuer, Inc. 5.75%
15/10/2020 USD 900,000 833,013 0.02Rice Energy, Inc. 6.25% 01/05/2022 USD 1,175,000 1,053,149 0.03Rite Aid Corp., 144A 6.125% 01/04/2023 USD 250,000 239,236 0.01Sabine Pass Liquefaction LLC 5.75%
15/05/2024 USD 2,000,000 1,790,436 0.05Sabra Health Care LP, REIT 5.5%
01/02/2021 USD 1,100,000 1,027,344 0.03Sabre GLBL, Inc., 144A 5.25%
15/11/2023 USD 900,000 828,843 0.02
SCHEDULE OF INVESTMENTSAs at 30 June 2016
Investments Currency
Quantity/Nominal
Value
Market Value EUR
% of Net Assets
Transferable securities and money market instruments admitted to official exchange listing or dealt in on another regulated market
Corporate Bonds (continued)
United States of America (continued)SBA Communications Corp. 4.875%
15/07/2022 USD 750,000 672,945 0.02Scientific Games International, Inc. 10%
01/12/2022 USD 2,925,000 2,121,364 0.06Select Medical Corp. 6.375% 01/06/2021 USD 900,000 773,785 0.02Service Corp. International 5.375%
15/05/2024 USD 900,000 836,899 0.02Sirius XM Radio, Inc., 144A 6%
15/07/2024 USD 1,250,000 1,157,355 0.03Solera LLC, 144A 10.5% 01/03/2024 USD 1,800,000 1,707,477 0.05Southwestern Energy Co. 4.95%
23/01/2025 USD 1,250,000 1,080,515 0.03Spectrum Brands, Inc. 5.75% 15/07/2025 USD 900,000 842,092 0.02Sprint Corp. 7.875% 15/09/2023 USD 3,625,000 2,663,151 0.07Standard Industries, Inc., 144A 5.5%
15/02/2023 USD 1,800,000 1,663,758 0.04Suburban Propane Partners LP 5.5%
01/06/2024 USD 562,000 498,320 0.01Sugarhouse HSP Gaming Prop Mezz LP,
144A 6.375% 01/06/2021 USD 900,000 803,543 0.02Targa Resources Partners LP 4.125%
15/11/2019 USD 1,000,000 893,486 0.02Tenet Healthcare Corp. 8.125%
01/04/2022 USD 3,000,000 2,765,374 0.07Terraform Global Operating LLC, 144A
9.75% 15/08/2022 USD 500,000 409,305 0.01TerraForm Power Operating LLC, 144A
5.875% 01/02/2023 USD 500,000 429,546 0.01Tesoro Logistics LP 6.25% 15/10/2022 USD 800,000 751,707 0.02TIBCO Software, Inc., 144A 11.375%
01/12/2021 USD 1,125,000 814,675 0.02T-Mobile USA, Inc. 6.5% 15/01/2026 USD 2,000,000 1,895,308 0.05TransDigm, Inc. 6.5% 15/07/2024 USD 1,350,000 1,230,294 0.03Tribune Media Co. 5.875% 15/07/2022 USD 1,000,000 894,741 0.02Tronox Finance LLC 6.375% 15/08/2020 USD 900,000 598,240 0.02United Rentals North America, Inc. 4.625%
15/07/2023 USD 1,250,000 1,137,194 0.03Univision Communications, Inc., 144A
5.125% 15/02/2025 USD 2,025,000 1,799,254 0.05Valeant Pharmaceuticals International, Inc.,
144A 6.125% 15/04/2025 (Canada) (2) USD 3,025,000 2,193,414 0.06West Corp., 144A 5.375% 15/07/2022 USD 1,350,000 1,122,733 0.03Whiting Petroleum Corp. 5.75%
15/03/2021 USD 1,450,000 1,177,137 0.03Williams Cos., Inc. (The) 4.55%
24/06/2024 USD 2,000,000 1,664,397 0.04Wynn Las Vegas LLC, 144A 5.5%
01/03/2025 USD 2,250,000 1,955,725 0.05XPO Logistics, Inc., 144A 6.5%
15/06/2022 USD 1,500,000 1,289,581 0.03Zayo Group LLC 6% 01/04/2023 USD 1,250,000 1,151,879 0.03Zebra Technologies Corp. 7.25%
15/10/2022 USD 900,000 862,240 0.02ZF North America Capital, Inc., 144A
4.75% 29/04/2025 USD 1,525,000 1,376,278 0.04
158,461,027 4.19
Total Corporate Bonds 194,473,454 5.14

Morgan Stanley Investment Funds 30 June 2016 226
The accompanying notes are an integral part of these financial statements.
Diversified Alpha Plus Fund (continued)
SCHEDULE OF INVESTMENTSAs at 30 June 2016
Investments Currency
Quantity/Nominal
Value
Market Value EUR
% of Net Assets
Transferable securities and money market instruments admitted to official exchange listing or dealt in on another regulated market
Equities
AustraliaShopping Centres Australasia Property
Group, REIT AUD 59 90 0.00Stockland, REIT AUD 1,008 3,176 0.00
3,266 0.00
DenmarkDSV A/S DKK 110,411 4,136,019 0.11ISS A/S DKK 153,585 5,202,146 0.14
9,338,165 0.25
FranceAccor SA EUR 356,427 12,302,078 0.33Aeroports de Paris EUR 15,799 1,552,568 0.04Atos SE EUR 121,435 9,059,051 0.24Bouygues SA EUR 338,003 8,715,407 0.23Capgemini SA EUR 207,247 16,152,831 0.43Cie de Saint-Gobain EUR 690,272 23,510,664 0.62Groupe Eurotunnel SE EUR 321,301 3,026,977 0.08Metropole Television SA EUR 55,631 833,909 0.02Peugeot SA EUR 1,471,166 15,947,439 0.42Rexel SA EUR 303,704 3,389,337 0.09Television Francaise 1 EUR 183,533 1,749,253 0.05Vinci SA EUR 503,663 31,896,978 0.84
128,136,492 3.39
GermanyDeutsche Boerse AG EUR 202,879 14,765,534 0.39Fraport AG Frankfurt Airport Services
Worldwide EUR 41,572 1,988,181 0.05ProSiebenSat.1 Media SE EUR 175,754 6,813,104 0.18Stroeer SE & Co. KGaA EUR 31,049 1,273,164 0.04
24,839,983 0.66
Hong KongG-Resources Group Ltd. (Bermuda) (2) HKD 2,615,723 44,884 0.00
44,884 0.00
IrelandCRH plc EUR 333,742 8,578,838 0.23
8,578,838 0.23
ItalyAtlantia SpA EUR 679,281 15,018,903 0.40Mediaset SpA EUR 3,810,007 11,932,942 0.31Mediobanca SpA EUR 2,064,523 10,425,841 0.28
37,377,686 0.99
NetherlandsRandstad Holding NV EUR 246,698 9,014,345 0.24
9,014,345 0.24
SCHEDULE OF INVESTMENTSAs at 30 June 2016
Investments Currency
Quantity/Nominal
Value
Market Value EUR
% of Net Assets
Transferable securities and money market instruments admitted to official exchange listing or dealt in on another regulated market
Equities (continued)
PortugalBanco Espirito Santo SA (3) EUR 11,540,015 0 0.00
0 0.00
SpainMediaset Espana Comunicacion SA EUR 590,116 5,865,753 0.15
5,865,753 0.15
SwitzerlandAdecco Group AG CHF 307,365 13,867,818 0.36
13,867,818 0.36
United KingdomInternational Consolidated Airlines Group SA
(Spain) (2) GBP 2,111,017 9,349,782 0.25
9,349,782 0.25
United States of AmericaAlexandria Real Estate Equities, Inc., REIT USD 32,600 2,973,954 0.08Allergan plc (Ireland) (2) USD 69,900 14,336,656 0.38American Capital Agency Corp., REIT USD 149,800 2,629,087 0.07American Tower Corp., REIT USD 188,000 18,954,914 0.50Annaly Capital Management, Inc., REIT USD 409,100 4,002,161 0.11Boston Properties, Inc., REIT USD 68,300 8,028,464 0.21Bristol-Myers Squibb Co. USD 297,300 19,480,527 0.52Brixmor Property Group, Inc., REIT USD 93,700 2,198,280 0.06CBRE Group, Inc. ‘A’ USD 133,900 3,135,383 0.08Crown Castle International Corp., REIT USD 148,900 13,398,643 0.35Digital Realty Trust, Inc., REIT USD 66,600 6,469,242 0.17Duke Realty Corp., REIT USD 154,400 3,625,131 0.10Eli Lilly & Co. USD 169,800 11,847,080 0.31Endo International plc (Ireland) (2) USD 34,900 485,368 0.01Equinix, Inc., REIT USD 30,700 10,659,002 0.28Extra Space Storage, Inc., REIT USD 55,100 4,534,335 0.12Federal Realty Investment Trust, REIT USD 31,000 4,545,815 0.12General Growth Properties, Inc., REIT USD 256,800 6,854,068 0.18HCP, Inc., REIT USD 207,900 6,530,773 0.17Host Hotels & Resorts, Inc., REIT USD 336,200 4,802,685 0.13Iron Mountain, Inc., REIT USD 112,600 3,990,896 0.11Johnson & Johnson USD 487,700 52,286,791 1.38Jones Lang LaSalle, Inc. USD 19,800 1,742,501 0.05Kimco Realty Corp., REIT USD 184,400 5,105,819 0.13Liberty Property Trust, REIT USD 65,100 2,279,824 0.06Macerich Co. (The), REIT USD 56,500 4,277,500 0.11Mallinckrodt plc (Ireland) (2) USD 19,300 1,038,579 0.03Merck & Co., Inc. USD 487,100 24,971,960 0.66Mylan NV (Netherlands) (2) USD 71,900 2,765,036 0.07Perrigo Co. plc (Ireland) (2) USD 26,000 2,097,280 0.06Pfizer, Inc. USD 1,056,700 33,260,709 0.88Prologis, Inc., REIT USD 233,300 10,172,404 0.27Public Storage, REIT USD 65,700 14,923,222 0.39Realogy Holdings Corp. USD 64,800 1,680,566 0.04Realty Income Corp., REIT USD 111,200 6,844,216 0.18Regency Centers Corp., REIT USD 43,500 3,236,165 0.09Simon Property Group, Inc., REIT USD 137,700 26,562,906 0.70SL Green Realty Corp., REIT USD 44,300 4,108,243 0.11Ventas, Inc., REIT USD 150,100 9,712,401 0.26VEREIT, Inc., REIT USD 379,900 3,396,969 0.09Vornado Realty Trust, REIT USD 75,100 6,676,066 0.18
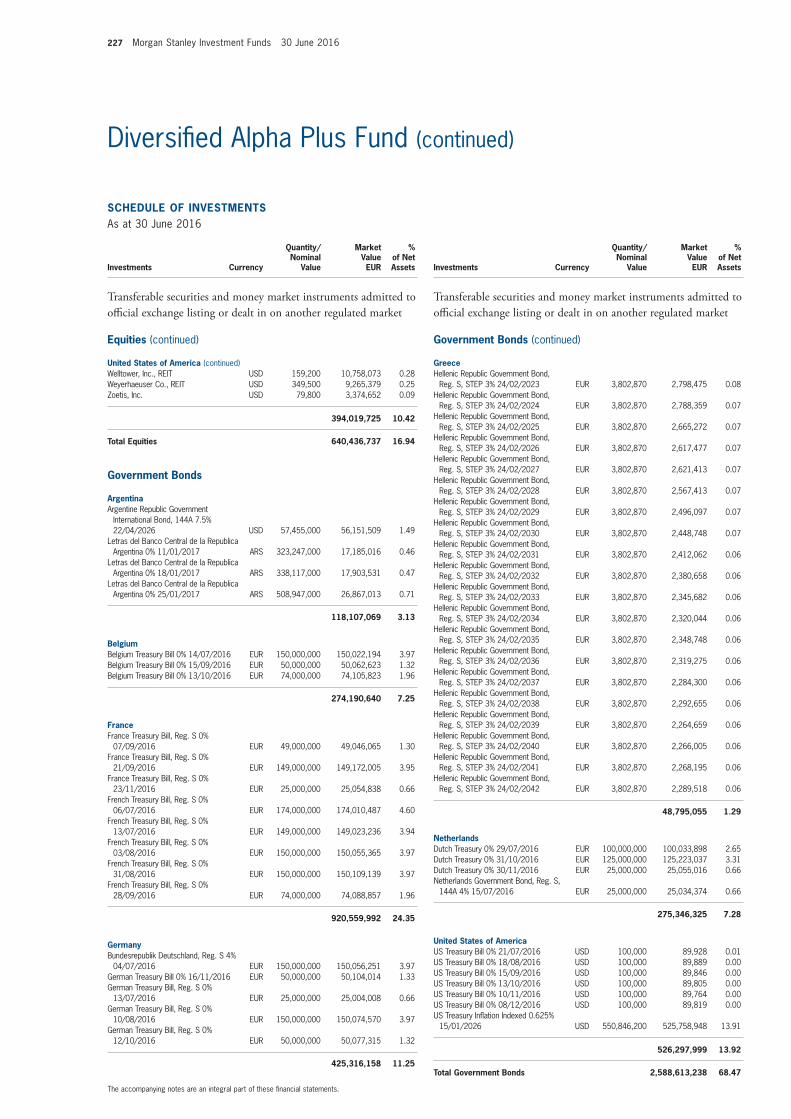
227 Morgan Stanley Investment Funds 30 June 2016
The accompanying notes are an integral part of these financial statements.
Diversified Alpha Plus Fund (continued)
SCHEDULE OF INVESTMENTSAs at 30 June 2016
Investments Currency
Quantity/Nominal
Value
Market Value EUR
% of Net Assets
Transferable securities and money market instruments admitted to official exchange listing or dealt in on another regulated market
Equities (continued)
United States of America (continued)Welltower, Inc., REIT USD 159,200 10,758,073 0.28Weyerhaeuser Co., REIT USD 349,500 9,265,379 0.25Zoetis, Inc. USD 79,800 3,374,652 0.09
394,019,725 10.42
Total Equities 640,436,737 16.94
Government Bonds
ArgentinaArgentine Republic Government
International Bond, 144A 7.5% 22/04/2026 USD 57,455,000 56,151,509 1.49
Letras del Banco Central de la Republica Argentina 0% 11/01/2017 ARS 323,247,000 17,185,016 0.46
Letras del Banco Central de la Republica Argentina 0% 18/01/2017 ARS 338,117,000 17,903,531 0.47
Letras del Banco Central de la Republica Argentina 0% 25/01/2017 ARS 508,947,000 26,867,013 0.71
118,107,069 3.13
BelgiumBelgium Treasury Bill 0% 14/07/2016 EUR 150,000,000 150,022,194 3.97Belgium Treasury Bill 0% 15/09/2016 EUR 50,000,000 50,062,623 1.32Belgium Treasury Bill 0% 13/10/2016 EUR 74,000,000 74,105,823 1.96
274,190,640 7.25
FranceFrance Treasury Bill, Reg. S 0%
07/09/2016 EUR 49,000,000 49,046,065 1.30France Treasury Bill, Reg. S 0%
21/09/2016 EUR 149,000,000 149,172,005 3.95France Treasury Bill, Reg. S 0%
23/11/2016 EUR 25,000,000 25,054,838 0.66French Treasury Bill, Reg. S 0%
06/07/2016 EUR 174,000,000 174,010,487 4.60French Treasury Bill, Reg. S 0%
13/07/2016 EUR 149,000,000 149,023,236 3.94French Treasury Bill, Reg. S 0%
03/08/2016 EUR 150,000,000 150,055,365 3.97French Treasury Bill, Reg. S 0%
31/08/2016 EUR 150,000,000 150,109,139 3.97French Treasury Bill, Reg. S 0%
28/09/2016 EUR 74,000,000 74,088,857 1.96
920,559,992 24.35
GermanyBundesrepublik Deutschland, Reg. S 4%
04/07/2016 EUR 150,000,000 150,056,251 3.97German Treasury Bill 0% 16/11/2016 EUR 50,000,000 50,104,014 1.33German Treasury Bill, Reg. S 0%
13/07/2016 EUR 25,000,000 25,004,008 0.66German Treasury Bill, Reg. S 0%
10/08/2016 EUR 150,000,000 150,074,570 3.97German Treasury Bill, Reg. S 0%
12/10/2016 EUR 50,000,000 50,077,315 1.32
425,316,158 11.25
SCHEDULE OF INVESTMENTSAs at 30 June 2016
Investments Currency
Quantity/Nominal
Value
Market Value EUR
% of Net Assets
Transferable securities and money market instruments admitted to official exchange listing or dealt in on another regulated market
Government Bonds (continued)
GreeceHellenic Republic Government Bond,
Reg. S, STEP 3% 24/02/2023 EUR 3,802,870 2,798,475 0.08Hellenic Republic Government Bond,
Reg. S, STEP 3% 24/02/2024 EUR 3,802,870 2,788,359 0.07Hellenic Republic Government Bond,
Reg. S, STEP 3% 24/02/2025 EUR 3,802,870 2,665,272 0.07Hellenic Republic Government Bond,
Reg. S, STEP 3% 24/02/2026 EUR 3,802,870 2,617,477 0.07Hellenic Republic Government Bond,
Reg. S, STEP 3% 24/02/2027 EUR 3,802,870 2,621,413 0.07Hellenic Republic Government Bond,
Reg. S, STEP 3% 24/02/2028 EUR 3,802,870 2,567,413 0.07Hellenic Republic Government Bond,
Reg. S, STEP 3% 24/02/2029 EUR 3,802,870 2,496,097 0.07Hellenic Republic Government Bond,
Reg. S, STEP 3% 24/02/2030 EUR 3,802,870 2,448,748 0.07Hellenic Republic Government Bond,
Reg. S, STEP 3% 24/02/2031 EUR 3,802,870 2,412,062 0.06Hellenic Republic Government Bond,
Reg. S, STEP 3% 24/02/2032 EUR 3,802,870 2,380,658 0.06Hellenic Republic Government Bond,
Reg. S, STEP 3% 24/02/2033 EUR 3,802,870 2,345,682 0.06Hellenic Republic Government Bond,
Reg. S, STEP 3% 24/02/2034 EUR 3,802,870 2,320,044 0.06Hellenic Republic Government Bond,
Reg. S, STEP 3% 24/02/2035 EUR 3,802,870 2,348,748 0.06Hellenic Republic Government Bond,
Reg. S, STEP 3% 24/02/2036 EUR 3,802,870 2,319,275 0.06Hellenic Republic Government Bond,
Reg. S, STEP 3% 24/02/2037 EUR 3,802,870 2,284,300 0.06Hellenic Republic Government Bond,
Reg. S, STEP 3% 24/02/2038 EUR 3,802,870 2,292,655 0.06Hellenic Republic Government Bond,
Reg. S, STEP 3% 24/02/2039 EUR 3,802,870 2,264,659 0.06Hellenic Republic Government Bond,
Reg. S, STEP 3% 24/02/2040 EUR 3,802,870 2,266,005 0.06Hellenic Republic Government Bond,
Reg. S, STEP 3% 24/02/2041 EUR 3,802,870 2,268,195 0.06Hellenic Republic Government Bond,
Reg. S, STEP 3% 24/02/2042 EUR 3,802,870 2,289,518 0.06
48,795,055 1.29
NetherlandsDutch Treasury 0% 29/07/2016 EUR 100,000,000 100,033,898 2.65Dutch Treasury 0% 31/10/2016 EUR 125,000,000 125,223,037 3.31Dutch Treasury 0% 30/11/2016 EUR 25,000,000 25,055,016 0.66Netherlands Government Bond, Reg. S,
144A 4% 15/07/2016 EUR 25,000,000 25,034,374 0.66
275,346,325 7.28
United States of AmericaUS Treasury Bill 0% 21/07/2016 USD 100,000 89,928 0.01US Treasury Bill 0% 18/08/2016 USD 100,000 89,889 0.00US Treasury Bill 0% 15/09/2016 USD 100,000 89,846 0.00US Treasury Bill 0% 13/10/2016 USD 100,000 89,805 0.00US Treasury Bill 0% 10/11/2016 USD 100,000 89,764 0.00US Treasury Bill 0% 08/12/2016 USD 100,000 89,819 0.00US Treasury Inflation Indexed 0.625%
15/01/2026 USD 550,846,200 525,758,948 13.91
526,297,999 13.92
Total Government Bonds 2,588,613,238 68.47

Morgan Stanley Investment Funds 30 June 2016 228
The accompanying notes are an integral part of these financial statements.
Diversified Alpha Plus Fund (continued)
SCHEDULE OF INVESTMENTSAs at 30 June 2016
Investments Currency
Quantity/Nominal
Value
Market Value EUR
% of Net Assets
Transferable securities and money market instruments admitted to official exchange listing or dealt in on another regulated market
Participation Notes
United States of AmericaS&P GSCI Brent Crude Oil 27/01/2017,
issued by Deutsche Bank (Germany) (2) USD 1,635 21,824,892 0.58
21,824,892 0.58
Total Participation Notes 21,824,892 0.58
Total Transferable securities and money market instruments admitted to official exchange listing or dealt in on another regulated market 3,445,348,321 91.13
Other transferable securities and money market instruments not admitted to official exchange listing or dealt in on another regulated market
Equities
ChinaHanergy Thin Film Power Group Ltd.
(Bermuda) (2) (3) HKD 2,644,000 33,720 0.00
33,720 0.00
South AfricaMota-Engil Africa NV (Netherlands) (2) (3) EUR 4,193 24,060 0.00
24,060 0.00
United States of AmericaSafeway PDC LLC Rights (3) USD 15,018 13,711 0.00Safeway PDC LLC Rights (3) USD 15,018 659 0.00
14,370 0.00
Total Equities 72,150 0.00
Total Other transferable securities and money market instruments not admitted to official exchange listing or dealt in on another regulated market 72,150 0.00
SCHEDULE OF INVESTMENTSAs at 30 June 2016
Investments Currency
Quantity/Nominal
Value
Market Value EUR
% of Net Assets
Units of authorised UCITS or other collective investment undertakings
Collective Investment Schemes – UCITS
LuxembourgMorgan Stanley Liquidity Funds Euro
Liquidity Fund – MS Reserve (4) EUR 160,863,944 160,863,944 4.26
160,863,944 4.26
Total Collective Investment Schemes – UCITS 160,863,944 4.26
Total Units of authorised UCITS or other collective investment undertakings 160,863,944 4.26
Total Investments 3,606,284,415 95.39
Cash 361,486,419 9.56
Other Assets/(Liabilities) (187,075,390) (4.95)
Total Net Assets 3,780,695,444 100.00
(2) The country in brackets represents the country of incorporation of this security.(3) Security is valued at its fair value under the direction of the Board of Directors of the SICAV.(4) Affiliate managed by an affiliate of the Investment Adviser.
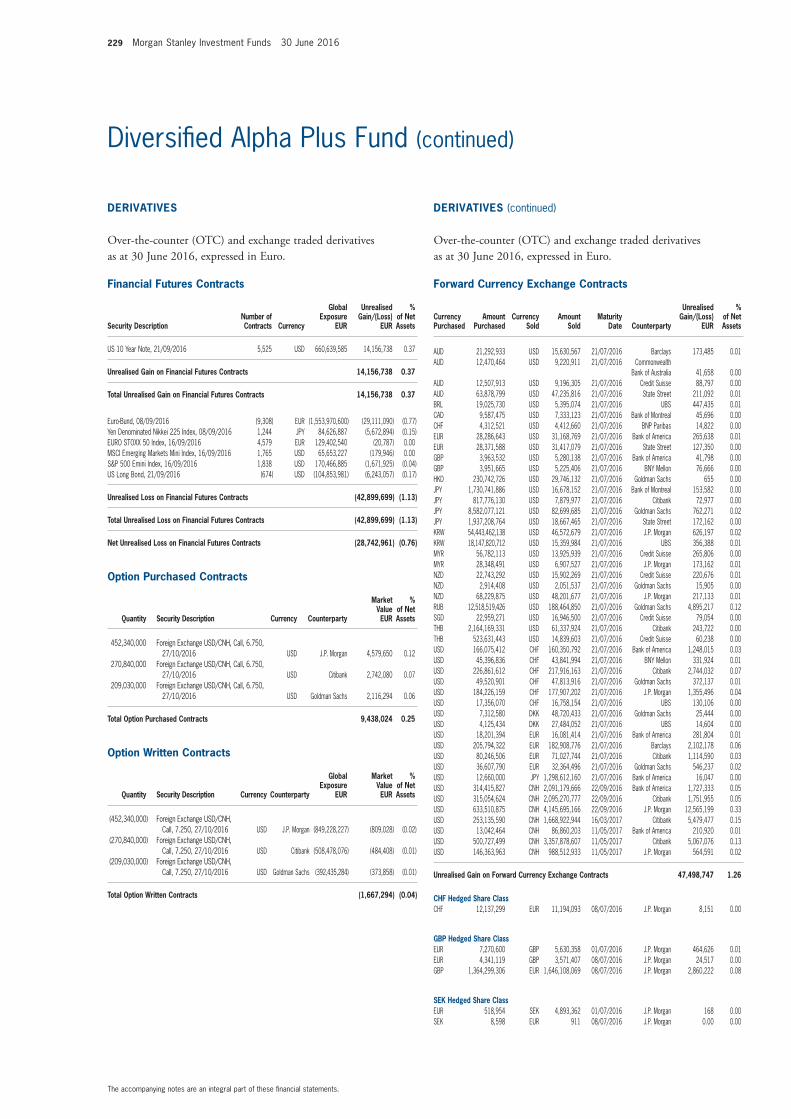
229 Morgan Stanley Investment Funds 30 June 2016
The accompanying notes are an integral part of these financial statements.
Diversified Alpha Plus Fund (continued)
Financial Futures Contracts
Security DescriptionNumber of Contracts Currency
Global Exposure
EUR
Unrealised Gain/(Loss)
EUR
% of Net Assets
US 10 Year Note, 21/09/2016 5,525 USD 660,639,585 14,156,738 0.37
Unrealised Gain on Financial Futures Contracts 14,156,738 0.37
Total Unrealised Gain on Financial Futures Contracts 14,156,738 0.37
Euro-Bund, 08/09/2016 (9,308) EUR (1,553,970,600) (29,111,090) (0.77)Yen Denominated Nikkei 225 Index, 08/09/2016 1,244 JPY 84,626,887 (5,672,894) (0.15)EURO STOXX 50 Index, 16/09/2016 4,579 EUR 129,402,540 (20,787) 0.00MSCI Emerging Markets Mini Index, 16/09/2016 1,765 USD 65,653,227 (179,946) 0.00S&P 500 Emini Index, 16/09/2016 1,838 USD 170,466,885 (1,671,925) (0.04)US Long Bond, 21/09/2016 (674) USD (104,853,981) (6,243,057) (0.17)
Unrealised Loss on Financial Futures Contracts (42,899,699) (1.13)
Total Unrealised Loss on Financial Futures Contracts (42,899,699) (1.13)
Net Unrealised Loss on Financial Futures Contracts (28,742,961) (0.76)
Option Purchased Contracts
Quantity Security Description Currency Counterparty
Market Value EUR
% of Net Assets
452,340,000 Foreign Exchange USD/CNH, Call, 6.750, 27/10/2016 USD J.P. Morgan 4,579,650 0.12
270,840,000 Foreign Exchange USD/CNH, Call, 6.750, 27/10/2016 USD Citibank 2,742,080 0.07
209,030,000 Foreign Exchange USD/CNH, Call, 6.750, 27/10/2016 USD Goldman Sachs 2,116,294 0.06
Total Option Purchased Contracts 9,438,024 0.25
Option Written Contracts
Quantity Security Description Currency Counterparty
Global Exposure
EUR
Market Value EUR
% of Net Assets
(452,340,000) Foreign Exchange USD/CNH, Call, 7.250, 27/10/2016 USD J.P. Morgan (849,228,227) (809,028) (0.02)
(270,840,000) Foreign Exchange USD/CNH, Call, 7.250, 27/10/2016 USD Citibank (508,478,076) (484,408) (0.01)
(209,030,000) Foreign Exchange USD/CNH, Call, 7.250, 27/10/2016 USD Goldman Sachs (392,435,284) (373,858) (0.01)
Total Option Written Contracts (1,667,294) (0.04)
Forward Currency Exchange Contracts (continued)
Currency Purchased
Amount Purchased
Currency Sold
Amount Sold
Maturity Date Counterparty
Unrealised Gain/(Loss)
EUR
% of Net Assets
AUD 21,292,933 USD 15,630,567 21/07/2016 Barclays 173,485 0.01AUD 12,470,464 USD 9,220,911 21/07/2016 Commonwealth
Bank of Australia 41,658 0.00AUD 12,507,913 USD 9,196,305 21/07/2016 Credit Suisse 88,797 0.00AUD 63,878,799 USD 47,235,816 21/07/2016 State Street 211,092 0.01BRL 19,025,730 USD 5,395,074 21/07/2016 UBS 447,435 0.01CAD 9,587,475 USD 7,333,123 21/07/2016 Bank of Montreal 45,696 0.00CHF 4,312,521 USD 4,412,660 21/07/2016 BNP Paribas 14,822 0.00EUR 28,286,643 USD 31,168,769 21/07/2016 Bank of America 265,638 0.01EUR 28,371,588 USD 31,417,079 21/07/2016 State Street 127,350 0.00GBP 3,963,532 USD 5,280,138 21/07/2016 Bank of America 41,798 0.00GBP 3,951,665 USD 5,225,406 21/07/2016 BNY Mellon 76,666 0.00HKD 230,742,726 USD 29,746,132 21/07/2016 Goldman Sachs 655 0.00JPY 1,730,741,886 USD 16,678,152 21/07/2016 Bank of Montreal 153,582 0.00JPY 817,776,130 USD 7,879,977 21/07/2016 Citibank 72,977 0.00JPY 8,582,077,121 USD 82,699,685 21/07/2016 Goldman Sachs 762,271 0.02JPY 1,937,208,764 USD 18,667,465 21/07/2016 State Street 172,162 0.00KRW 54,443,462,138 USD 46,572,679 21/07/2016 J.P. Morgan 626,197 0.02KRW 18,147,820,712 USD 15,359,984 21/07/2016 UBS 356,388 0.01MYR 56,782,113 USD 13,925,939 21/07/2016 Credit Suisse 265,806 0.00MYR 28,348,491 USD 6,907,527 21/07/2016 J.P. Morgan 173,162 0.01NZD 22,743,292 USD 15,902,269 21/07/2016 Credit Suisse 220,676 0.01NZD 2,914,408 USD 2,051,537 21/07/2016 Goldman Sachs 15,905 0.00NZD 68,229,875 USD 48,201,677 21/07/2016 J.P. Morgan 217,133 0.01RUB 12,518,519,426 USD 188,464,850 21/07/2016 Goldman Sachs 4,895,217 0.12SGD 22,959,271 USD 16,946,500 21/07/2016 Credit Suisse 79,054 0.00THB 2,164,169,331 USD 61,337,924 21/07/2016 Citibank 243,722 0.00THB 523,631,443 USD 14,839,603 21/07/2016 Credit Suisse 60,238 0.00USD 166,075,412 CHF 160,350,792 21/07/2016 Bank of America 1,248,015 0.03USD 45,396,836 CHF 43,841,994 21/07/2016 BNY Mellon 331,924 0.01USD 226,861,612 CHF 217,916,163 21/07/2016 Citibank 2,744,032 0.07USD 49,520,901 CHF 47,813,916 21/07/2016 Goldman Sachs 372,137 0.01USD 184,226,159 CHF 177,907,202 21/07/2016 J.P. Morgan 1,355,496 0.04USD 17,356,070 CHF 16,758,154 21/07/2016 UBS 130,106 0.00USD 7,312,580 DKK 48,720,433 21/07/2016 Goldman Sachs 25,444 0.00USD 4,125,434 DKK 27,484,052 21/07/2016 UBS 14,604 0.00USD 18,201,394 EUR 16,081,414 21/07/2016 Bank of America 281,804 0.01USD 205,794,322 EUR 182,908,776 21/07/2016 Barclays 2,102,178 0.06USD 80,246,506 EUR 71,027,744 21/07/2016 Citibank 1,114,590 0.03USD 36,607,790 EUR 32,364,496 21/07/2016 Goldman Sachs 546,237 0.02USD 12,660,000 JPY 1,298,612,160 21/07/2016 Bank of America 16,047 0.00USD 314,415,827 CNH 2,091,179,666 22/09/2016 Bank of America 1,727,333 0.05USD 315,054,624 CNH 2,095,270,777 22/09/2016 Citibank 1,751,955 0.05USD 633,510,875 CNH 4,145,695,166 22/09/2016 J.P. Morgan 12,565,199 0.33USD 253,135,590 CNH 1,668,922,944 16/03/2017 Citibank 5,479,477 0.15USD 13,042,464 CNH 86,860,203 11/05/2017 Bank of America 210,920 0.01USD 500,727,499 CNH 3,357,878,607 11/05/2017 Citibank 5,067,076 0.13USD 146,363,963 CNH 988,512,933 11/05/2017 J.P. Morgan 564,591 0.02
Unrealised Gain on Forward Currency Exchange Contracts 47,498,747 1.26
CHF Hedged Share ClassCHF 12,137,299 EUR 11,194,093 08/07/2016 J.P. Morgan 8,151 0.00
GBP Hedged Share ClassEUR 7,270,600 GBP 5,630,358 01/07/2016 J.P. Morgan 464,626 0.01EUR 4,341,119 GBP 3,571,407 08/07/2016 J.P. Morgan 24,517 0.00GBP 1,364,299,306 EUR 1,646,108,069 08/07/2016 J.P. Morgan 2,860,222 0.08
SEK Hedged Share ClassEUR 518,954 SEK 4,893,362 01/07/2016 J.P. Morgan 168 0.00SEK 8,598 EUR 911 08/07/2016 J.P. Morgan 0.00 0.00
DERIVATIVES
Over-the-counter (OTC) and exchange traded derivatives as at 30 June 2016, expressed in Euro.
DERIVATIVES (continued)
Over-the-counter (OTC) and exchange traded derivatives as at 30 June 2016, expressed in Euro.

Morgan Stanley Investment Funds 30 June 2016 230
The accompanying notes are an integral part of these financial statements.
Diversified Alpha Plus Fund (continued)
Forward Currency Exchange Contracts (continued)
Currency Purchased
Amount Purchased
Currency Sold
Amount Sold
Maturity Date Counterparty
Unrealised Gain/(Loss)
EUR
% of Net Assets
SGD Hedged Share ClassEUR 16,632 SGD 24,906 01/07/2016 J.P. Morgan 7 0.00SGD 24,906 EUR 16,474 01/07/2016 J.P. Morgan 150 0.00
USD Hedged Share ClassEUR 122,384,874 USD 135,222,140 01/07/2016 J.P. Morgan 742,844 0.02USD 136,299,279 EUR 120,989,294 01/07/2016 J.P. Morgan 1,621,698 0.04EUR 1,034,554 USD 1,144,444 08/07/2016 J.P. Morgan 5,186 0.00
Unrealised Gain on NAV Hedged Share Classes Forward Currency Exchange Contracts 5,727,569 0.15
Total Unrealised Gain on Forward Currency Exchange Contracts 53,226,316 1.41
AUD 12,470,464 USD 9,291,618 21/07/2016 Commonwealth Bank of Australia (21,909) 0.00
CAD 4,786,550 USD 3,695,910 21/07/2016 Bank of Montreal (8,512) 0.00CHF 2,153,028 USD 2,220,303 21/07/2016 BNP Paribas (8,136) 0.00CHF 78,550,068 USD 82,057,707 21/07/2016 Citibank (1,243,679) (0.03)CHF 78,550,068 USD 81,491,927 21/07/2016 J.P. Morgan (735,038) (0.02)EUR 65,156,092 USD 72,723,321 21/07/2016 Bank of America (222,830) (0.01)EUR 280,037,797 USD 312,562,787 21/07/2016 Bank of Montreal (958,971) (0.03)EUR 544,588,031 USD 607,839,208 21/07/2016 Barclays (1,864,906) (0.05)EUR 201,262,550 USD 224,584,854 21/07/2016 BNP Paribas (641,262) (0.02)EUR 110,055,298 USD 122,835,470 21/07/2016 BNY Mellon (374,898) (0.01)EUR 117,572,475 USD 131,214,997 21/07/2016 Commonwealth
Bank of Australia (390,992) (0.01)EUR 153,077,658 USD 170,835,010 21/07/2016 Goldman Sachs (504,558) (0.01)EUR 332,805,604 USD 371,467,137 21/07/2016 J.P. Morgan (1,146,707) (0.03)EUR 139,651,892 USD 156,635,119 21/07/2016 State Street (1,164,495) (0.03)EUR 81,770,626 USD 91,267,466 21/07/2016 UBS (279,651) (0.01)GBP 3,801,206 USD 5,348,993 21/07/2016 Bank of Montreal (216,223) (0.01)GBP 3,951,665 USD 5,428,241 21/07/2016 Citibank (105,685) 0.00GBP 2,734,453 USD 3,847,785 21/07/2016 Goldman Sachs (155,462) 0.00GBP 21,433,797 USD 30,161,103 21/07/2016 UBS (1,219,059) (0.03)JPY 2,339,396,076 USD 22,797,154 21/07/2016 Bank of Montreal (20,536) 0.00JPY 4,664,783,790 USD 45,848,007 21/07/2016 Goldman Sachs (391,751) (0.01)NZD 1,455,019 USD 1,034,519 21/07/2016 Credit Suisse (1,308) 0.00SEK 2,882,902,261 USD 342,582,739 21/07/2016 Bank of America (2,310,299) (0.06)SEK 88,690,491 USD 10,538,444 21/07/2016 BNY Mellon (70,287) 0.00SEK 3,925,517,162 USD 471,333,323 21/07/2016 Citibank (7,509,581) (0.20)SEK 1,457,949,196 USD 173,241,584 21/07/2016 J.P. Morgan (1,159,117) (0.03)USD 183,454,870 AUD 251,361,412 21/07/2016 Barclays (3,003,403) (0.08)USD 380,163,093 AUD 520,837,001 21/07/2016 Commonwealth
Bank of Australia (6,193,746) (0.16)USD 30,880,891 AUD 42,313,894 21/07/2016 J.P. Morgan (507,111) (0.01)USD 1,365,538 CAD 1,779,984 21/07/2016 Bank of Montreal (4,806) 0.00USD 21,100,000 EUR 19,005,499 21/07/2016 Bank of America (36,408) 0.00USD 78,975,039 EUR 71,027,744 21/07/2016 Barclays (28,471) 0.00USD 45,475,513 EUR 41,057,704 21/07/2016 Credit Suisse (174,807) (0.01)USD 15,089,938 EUR 13,685,901 21/07/2016 J.P. Morgan (119,911) 0.00USD 31,688,819 EUR 28,549,155 21/07/2016 State Street (60,620) 0.00USD 42,822,978 GBP 32,069,906 21/07/2016 Credit Suisse (248,216) (0.01)USD 14,099,453 GBP 10,689,969 21/07/2016 UBS (239,951) (0.01)USD 10,931,663 JPY 1,139,842,347 21/07/2016 Bank of America (148,196) 0.00USD 61,572,826 KRW 72,591,282,850 21/07/2016 UBS (1,306,082) (0.04)USD 1,960,948 MXN 37,399,200 21/07/2016 Credit Suisse (49,017) 0.00USD 544,947 MXN 10,395,497 21/07/2016 J.P. Morgan (13,732) 0.00USD 63,922,885 NZD 91,706,851 21/07/2016 Credit Suisse (1,068,893) (0.03)USD 49,089,122 THB 1,730,784,252 21/07/2016 Citibank (163,984) 0.00USD 13,693,224 THB 484,343,026 21/07/2016 Credit Suisse (85,343) 0.00CNH 117,409,415 USD 17,872,026 22/09/2016 Bank of America (293,513) (0.01)CNH 1,035,473,563 USD 157,184,952 22/09/2016 Citibank (2,198,884) (0.06)
DERIVATIVES (continued)
Over-the-counter (OTC) and exchange traded derivatives as at 30 June 2016, expressed in Euro.
Forward Currency Exchange Contracts (continued)
Currency Purchased
Amount Purchased
Currency Sold
Amount Sold
Maturity Date Counterparty
Unrealised Gain/(Loss)
EUR
% of Net Assets
CNH 7,179,262,629 USD 1,094,680,779 22/09/2016 J.P. Morgan (19,611,794) (0.52)CNH 1,668,922,944 USD 250,288,384 16/03/2017 Citibank (2,943,536) (0.08)CNH 159,193,969 USD 23,652,621 11/05/2017 Citibank (163,436) 0.00USD 291,582,898 CNH 1,979,994,373 11/05/2017 Citibank (277,210) (0.01)
Unrealised Loss on Forward Currency Exchange Contracts (61,666,922) (1.63)
CHF Hedged Share ClassCHF 12,367,256 EUR 11,429,225 01/07/2016 J.P. Morgan (16,035) 0.00EUR 11,403,648 CHF 12,367,256 01/07/2016 J.P. Morgan (9,542) 0.00
GBP Hedged Share ClassEUR 1,686,612,605 GBP 1,397,527,318 01/07/2016 J.P. Morgan (2,717,887) (0.07)GBP 1,403,157,676 EUR 1,826,795,117 01/07/2016 J.P. Morgan (130,658,650) (3.46)
SEK Hedged Share ClassSEK 4,893,362 EUR 525,929 01/07/2016 J.P. Morgan (7,143) 0.00SEK 4,695,722 EUR 497,919 08/07/2016 J.P. Morgan (75) 0.00
SGD Hedged Share ClassSGD 24,338 EUR 16,249 08/07/2016 J.P. Morgan (5) 0.00
USD Hedged Share ClassEUR 954,685 USD 1,077,139 01/07/2016 J.P. Morgan (14,279) 0.00EUR 2,465,118 USD 2,741,252 08/07/2016 J.P. Morgan (496) 0.00USD 130,964,330 EUR 118,496,164 08/07/2016 J.P. Morgan (700,507) (0.02)
Unrealised Loss on NAV Hedged Share Classes Forward Currency Exchange Contracts (134,124,619) (3.55)
Total Unrealised Loss on Forward Currency Exchange Contracts (195,791,541) (5.18)
Net Unrealised Loss on Forward Currency Exchange Contracts (142,565,225) (3.77)
Interest Rate Swap Contracts (continued)
Nominal Amount Ccy Counterparty
Security Description
Maturity Date
Market Value EUR
Unrealised Gain/(Loss)
EUR
% of Net Assets
215,137,000 AUD J.P. Morgan Pay floating BBR 6 month
Receive fixed 2.436% 20/05/2026 3,039,121 3,039,121 0.08143,370,000 AUD J.P. Morgan Pay floating BBR
6 month Receive fixed 2.538% 05/05/2026 2,899,469 2,899,469 0.08
143,731,000 AUD Bank of America Pay floating BBR 6 month
Receive fixed 2.49% 06/05/2026 2,498,069 2,498,069 0.0790,219,000 AUD Citibank Pay floating BBR
6 month Receive fixed 2.5% 06/05/2026 1,622,485 1,622,485 0.04
4,750,000 AUD Citibank Pay floating BBR 6 month
Receive fixed 2.413% 31/05/2026 62,489 62,489 0.00
Total Unrealised Gain on Interest Rate Swap Contracts 10,121,633 10,121,633 0.27
DERIVATIVES (continued)
Over-the-counter (OTC) and exchange traded derivatives as at 30 June 2016, expressed in Euro.

231 Morgan Stanley Investment Funds 30 June 2016
The accompanying notes are an integral part of these financial statements.
Diversified Alpha Plus Fund (continued)
Interest Rate Swap Contracts (continued)
Nominal Amount Ccy Counterparty
Security Description
Maturity Date
Market Value EUR
Unrealised Gain/(Loss)
EUR
% of Net Assets
335,797,000 USD Goldman Sachs Pay fixed 1.708% Receive floating LIBOR
3 month 11/03/2026 (11,829,632) (11,829,632) (0.31)299,103,000 USD Citibank Pay fixed 1.71%
Receive floating LIBOR 3 month 11/03/2026 (10,587,916) (10,587,916) (0.28)
371,800,000 USD Goldman Sachs Pay fixed 1.592% Receive floating LIBOR
3 month 13/05/2026 (8,152,398) (8,152,398) (0.22)700,319,000 SEK Citibank Pay fixed 1.278%
Receive floating STIBOR 3 month 06/10/2025 (4,645,316) (4,645,316) (0.12)
356,790,000 SEK Citibank Pay fixed 1.393% Receive floating STIBOR
3 month 13/10/2025 (2,778,465) (2,778,465) (0.07)379,447,000 SEK Citibank Pay fixed 1.338%
Receive floating STIBOR 3 month 12/10/2025 (2,737,528) (2,737,528) (0.07)
296,548,000 SEK Barclays Pay fixed 1.373% Receive floating STIBOR
3 month 14/10/2025 (2,243,293) (2,243,293) (0.06)267,924,000 SEK BNP Paribas Pay fixed 1.338%
Receive floating STIBOR 3 month 12/10/2025 (1,932,943) (1,932,943) (0.05)
302,503,400 SEK J.P. Morgan Pay fixed 1.254% Receive floating STIBOR
3 month 06/10/2025 (1,931,389) (1,931,389) (0.05)244,166,000 SEK Citibank Pay fixed 1.37%
Receive floating STIBOR 3 month 14/10/2025 (1,840,653) (1,840,653) (0.05)
251,060,000 SEK Barclays Pay fixed 1.338% Receive floating STIBOR
3 month 12/10/2025 (1,811,278) (1,811,278) (0.05)54,550,000 USD Barclays Pay fixed 1.64%
Receive floating LIBOR 3 month 06/04/2026 (1,488,934) (1,488,934) (0.04)
220,983,000 SEK J.P. Morgan Pay fixed 1.286% Receive floating STIBOR
3 month 07/10/2025 (1,483,346) (1,483,346) (0.04)200,000,000 SEK Goldman Sachs Pay fixed 1.288%
Receive floating STIBOR 3 month 07/10/2025 (1,345,114) (1,345,114) (0.04)
116,335,000 SEK J.P. Morgan Pay fixed 1.385% Receive floating STIBOR
3 month 13/10/2025 (895,601) (895,601) (0.02)103,819,000 SEK Goldman Sachs Pay fixed 1.388%
Receive floating STIBOR 3 month 13/10/2025 (802,506) (802,506) (0.02)
26,470,000 SEK J.P. Morgan Pay fixed 1.335% Receive floating STIBOR
3 month 12/10/2025 (190,276) (190,276) (0.01)
Total Unrealised Loss on Interest Rate Swap Contracts (56,696,588) (56,696,588) (1.50)
Net Unrealised Loss on Interest Rate Swap Contracts (46,574,955) (46,574,955) (1.23)
DERIVATIVES (continued)
Over-the-counter (OTC) and exchange traded derivatives as at 30 June 2016, expressed in Euro.

Morgan Stanley Investment Funds 30 June 2016 232
The accompanying notes are an integral part of these financial statements.
Diversified Alpha Plus Fund (continued)
DERIVATIVES (continued)
Over-the-counter (OTC) and exchange traded derivatives as at 30 June 2016, expressed in Euro.
Total Return Swap Contracts
Nominal Amount Currency Counterparty Security Description Maturity Date
Global Exposure
Unrealised Gain/(Loss)
EUR
% of Net Assets
5,490,002 USD Bank of America Pay Bank of America- Merrill Lynch US Apt REITS Custom Basket Index Receive USD LIBOR 3 month + - 24.00bp 15/04/2017 4,121 4,121 0.0028,529,334 USD Goldman Sachs Pay Goldman Sachs Copper Miners Custom Basket Index Receive USD LIBOR 3 month + - 110.00bp 10/05/2017 46,986 46,986 0.00
490,510,055 USD Goldman Sachs Pay Goldman Sachs Global Aerospace Custom Basket Index Receive USD LIBOR 3 month + - 25.00bp 01/04/2017 5,806,274 5,806,274 0.1616,109,239 USD Goldman Sachs Pay Brent Crude Total Return Index Receive a fixed revenue of 1.15% 06/06/2017 674,481 674,481 0.0224,501,403 USD Goldman Sachs Pay Brent Crude Total Return Index Receive a fixed revenue of 1.15% 06/06/2017 426,658 426,658 0.01
Total Unrealised Gain on Total Return Swap Contracts 6,958,520 6,958,520 0.19
241,428,005 USD Bank of America Pay Bank of America- Merrill Lynch US Apt REITS Custom Basket Index Receive USD LIBOR 3 month + - 24.00bp 15/04/2017 (4,916,075) (4,916,075) (0.13)304,009,793 USD Citibank Pay Citibank US Media Custom Basket Index Receive USD LIBOR 3 month + - 13.00bp 03/02/2017 (9,969,946) (9,969,946) (0.26)
31,658,261 USD Goldman Sachs Pay Goldman Sachs Iron & Ore Miners Custom Basket Index Receive USD LIBOR 3 month + - 65.00bp 10/05/2017 (2,859,831) (2,859,831) (0.08)91,902,242 USD Goldman Sachs Pay Goldman Sachs US Consumer Staples Custom Basket Index Receive USD LIBOR 3 month + - 15.00bp 26/02/2017 (2,318,818) (2,318,818) (0.06)89,504,700 USD J.P. Morgan Pay JP Morgan Chinese Internets Custom Basket Index Receive USD LIBOR 3 month + - 1.00bp 05/05/2017 (2,894,170) (2,894,170) (0.08)
Total Unrealised Loss on Total Return Swap Contracts (22,958,840) (22,958,840) (0.61)
Net Unrealised Loss on Total Return Swap Contracts (16,000,320) (16,000,320) (0.42)
Collateral received and paid by the Fund in respect of financial derivative instruments:
Type of Collateral Counterparty CurrencyCollateral Amount
receivedCollateral Amount
paid
Diversified Alpha Plus Fund
Cash Bank of America EUR - 10,616,889Cash Barclays EUR - 9,492,000Cash BNP Paribas EUR - 1,799,000Cash Citibank EUR - 4,850,411Cash Citigroup Global Market Ltd. EUR - 1,576,336Cash Goldman Sachs EUR 117,424,645 26,291,611Cash J.P. Morgan EUR - 1,316,982Cash State Street EUR - 2,253,000Cash UBS EUR - 2,170,000
117,424,645 60,366,229

233 Morgan Stanley Investment Funds 30 June 2016
The accompanying notes are an integral part of these financial statements.
Please refer to the full prospectus for the Fund’s investment objective and policy.
INVESTMENT AIM
To provide an absolute return while actively managing total portfolio risk. The Investment Adviser seeks to manage downside risk and to target volatility below that of the Diversified Alpha Plus Fund. The Fund will seek to achieve its investment objective by investing in baskets of stocks, ETFs, bonds and derivatives.
SCHEDULE OF INVESTMENTSAs at 30 June 2016
Investments Currency
Quantity/Nominal
Value
Market Value EUR
% of Net Assets
Transferable securities and money market instruments admitted to official exchange listing or dealt in on another regulated market
Equities
DenmarkDSV A/S DKK 296 11,088 0.06ISS A/S DKK 439 14,870 0.07
25,958 0.13
FranceAccor SA EUR 953 32,893 0.17Aeroports de Paris EUR 43 4,226 0.02Atos SE EUR 325 24,245 0.13Bouygues SA EUR 907 23,387 0.12Capgemini SA EUR 555 43,257 0.22Cie de Saint-Gobain EUR 1,847 62,909 0.32Groupe Eurotunnel SE EUR 860 8,102 0.04Metropole Television SA EUR 150 2,248 0.01Peugeot SA EUR 3,939 42,699 0.22Rexel SA EUR 812 9,062 0.05Television Francaise 1 EUR 492 4,689 0.02Vinci SA EUR 1,347 85,305 0.44
343,022 1.76
GermanyDeutsche Boerse AG EUR 543 39,520 0.20Fraport AG Frankfurt Airport Services
Worldwide EUR 112 5,356 0.03ProSiebenSat.1 Media SE EUR 470 18,220 0.09Stroeer SE & Co. KGaA EUR 82 3,362 0.02
66,458 0.34
Hong KongG-Resources Group Ltd. (Bermuda) (2) HKD 10,950 188 0.00
188 0.00
IrelandCRH plc EUR 893 22,955 0.12
22,955 0.12
ItalyAtlantia SpA EUR 1,817 40,174 0.21Mediaset SpA EUR 10,196 31,934 0.16Mediobanca SpA EUR 5,521 27,881 0.14
99,989 0.51
NetherlandsRandstad Holding NV EUR 661 24,153 0.13
24,153 0.13
PortugalBanco Espirito Santo SA (3) EUR 13,613 0 0.00
0 0.00
Diversified Alpha Plus Low Volatility Fund
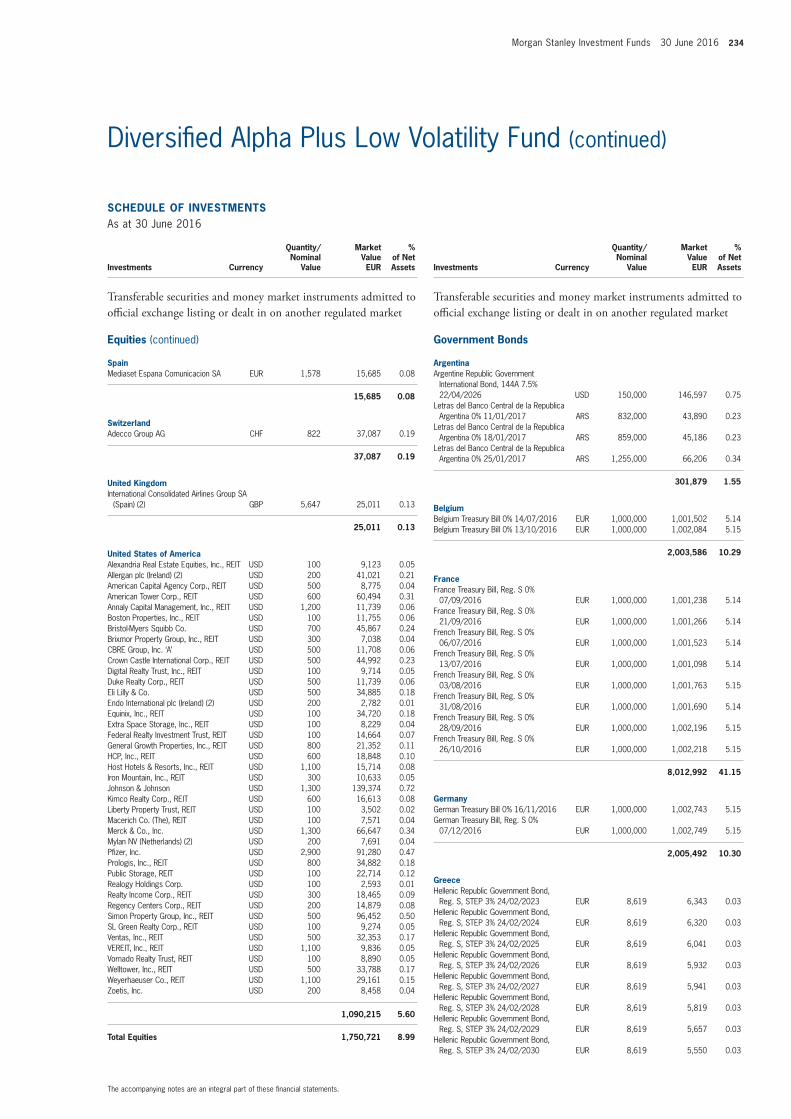
Morgan Stanley Investment Funds 30 June 2016 234
The accompanying notes are an integral part of these financial statements.
Diversified Alpha Plus Low Volatility Fund (continued)
SCHEDULE OF INVESTMENTSAs at 30 June 2016
Investments Currency
Quantity/Nominal
Value
Market Value EUR
% of Net Assets
Transferable securities and money market instruments admitted to official exchange listing or dealt in on another regulated market
Equities (continued)
SpainMediaset Espana Comunicacion SA EUR 1,578 15,685 0.08
15,685 0.08
SwitzerlandAdecco Group AG CHF 822 37,087 0.19
37,087 0.19
United KingdomInternational Consolidated Airlines Group SA
(Spain) (2) GBP 5,647 25,011 0.13
25,011 0.13
United States of AmericaAlexandria Real Estate Equities, Inc., REIT USD 100 9,123 0.05Allergan plc (Ireland) (2) USD 200 41,021 0.21American Capital Agency Corp., REIT USD 500 8,775 0.04American Tower Corp., REIT USD 600 60,494 0.31Annaly Capital Management, Inc., REIT USD 1,200 11,739 0.06Boston Properties, Inc., REIT USD 100 11,755 0.06Bristol-Myers Squibb Co. USD 700 45,867 0.24Brixmor Property Group, Inc., REIT USD 300 7,038 0.04CBRE Group, Inc. ‘A’ USD 500 11,708 0.06Crown Castle International Corp., REIT USD 500 44,992 0.23Digital Realty Trust, Inc., REIT USD 100 9,714 0.05Duke Realty Corp., REIT USD 500 11,739 0.06Eli Lilly & Co. USD 500 34,885 0.18Endo International plc (Ireland) (2) USD 200 2,782 0.01Equinix, Inc., REIT USD 100 34,720 0.18Extra Space Storage, Inc., REIT USD 100 8,229 0.04Federal Realty Investment Trust, REIT USD 100 14,664 0.07General Growth Properties, Inc., REIT USD 800 21,352 0.11HCP, Inc., REIT USD 600 18,848 0.10Host Hotels & Resorts, Inc., REIT USD 1,100 15,714 0.08Iron Mountain, Inc., REIT USD 300 10,633 0.05Johnson & Johnson USD 1,300 139,374 0.72Kimco Realty Corp., REIT USD 600 16,613 0.08Liberty Property Trust, REIT USD 100 3,502 0.02Macerich Co. (The), REIT USD 100 7,571 0.04Merck & Co., Inc. USD 1,300 66,647 0.34Mylan NV (Netherlands) (2) USD 200 7,691 0.04Pfizer, Inc. USD 2,900 91,280 0.47Prologis, Inc., REIT USD 800 34,882 0.18Public Storage, REIT USD 100 22,714 0.12Realogy Holdings Corp. USD 100 2,593 0.01Realty Income Corp., REIT USD 300 18,465 0.09Regency Centers Corp., REIT USD 200 14,879 0.08Simon Property Group, Inc., REIT USD 500 96,452 0.50SL Green Realty Corp., REIT USD 100 9,274 0.05Ventas, Inc., REIT USD 500 32,353 0.17VEREIT, Inc., REIT USD 1,100 9,836 0.05Vornado Realty Trust, REIT USD 100 8,890 0.05Welltower, Inc., REIT USD 500 33,788 0.17Weyerhaeuser Co., REIT USD 1,100 29,161 0.15Zoetis, Inc. USD 200 8,458 0.04
1,090,215 5.60
Total Equities 1,750,721 8.99
SCHEDULE OF INVESTMENTSAs at 30 June 2016
Investments Currency
Quantity/Nominal
Value
Market Value EUR
% of Net Assets
Transferable securities and money market instruments admitted to official exchange listing or dealt in on another regulated market
Government Bonds
ArgentinaArgentine Republic Government
International Bond, 144A 7.5% 22/04/2026 USD 150,000 146,597 0.75
Letras del Banco Central de la Republica Argentina 0% 11/01/2017 ARS 832,000 43,890 0.23
Letras del Banco Central de la Republica Argentina 0% 18/01/2017 ARS 859,000 45,186 0.23
Letras del Banco Central de la Republica Argentina 0% 25/01/2017 ARS 1,255,000 66,206 0.34
301,879 1.55
BelgiumBelgium Treasury Bill 0% 14/07/2016 EUR 1,000,000 1,001,502 5.14Belgium Treasury Bill 0% 13/10/2016 EUR 1,000,000 1,002,084 5.15
2,003,586 10.29
FranceFrance Treasury Bill, Reg. S 0%
07/09/2016 EUR 1,000,000 1,001,238 5.14France Treasury Bill, Reg. S 0%
21/09/2016 EUR 1,000,000 1,001,266 5.14French Treasury Bill, Reg. S 0%
06/07/2016 EUR 1,000,000 1,001,523 5.14French Treasury Bill, Reg. S 0%
13/07/2016 EUR 1,000,000 1,001,098 5.14French Treasury Bill, Reg. S 0%
03/08/2016 EUR 1,000,000 1,001,763 5.15French Treasury Bill, Reg. S 0%
31/08/2016 EUR 1,000,000 1,001,690 5.14French Treasury Bill, Reg. S 0%
28/09/2016 EUR 1,000,000 1,002,196 5.15French Treasury Bill, Reg. S 0%
26/10/2016 EUR 1,000,000 1,002,218 5.15
8,012,992 41.15
GermanyGerman Treasury Bill 0% 16/11/2016 EUR 1,000,000 1,002,743 5.15German Treasury Bill, Reg. S 0%
07/12/2016 EUR 1,000,000 1,002,749 5.15
2,005,492 10.30
GreeceHellenic Republic Government Bond,
Reg. S, STEP 3% 24/02/2023 EUR 8,619 6,343 0.03Hellenic Republic Government Bond,
Reg. S, STEP 3% 24/02/2024 EUR 8,619 6,320 0.03Hellenic Republic Government Bond,
Reg. S, STEP 3% 24/02/2025 EUR 8,619 6,041 0.03Hellenic Republic Government Bond,
Reg. S, STEP 3% 24/02/2026 EUR 8,619 5,932 0.03Hellenic Republic Government Bond,
Reg. S, STEP 3% 24/02/2027 EUR 8,619 5,941 0.03Hellenic Republic Government Bond,
Reg. S, STEP 3% 24/02/2028 EUR 8,619 5,819 0.03Hellenic Republic Government Bond,
Reg. S, STEP 3% 24/02/2029 EUR 8,619 5,657 0.03Hellenic Republic Government Bond,
Reg. S, STEP 3% 24/02/2030 EUR 8,619 5,550 0.03
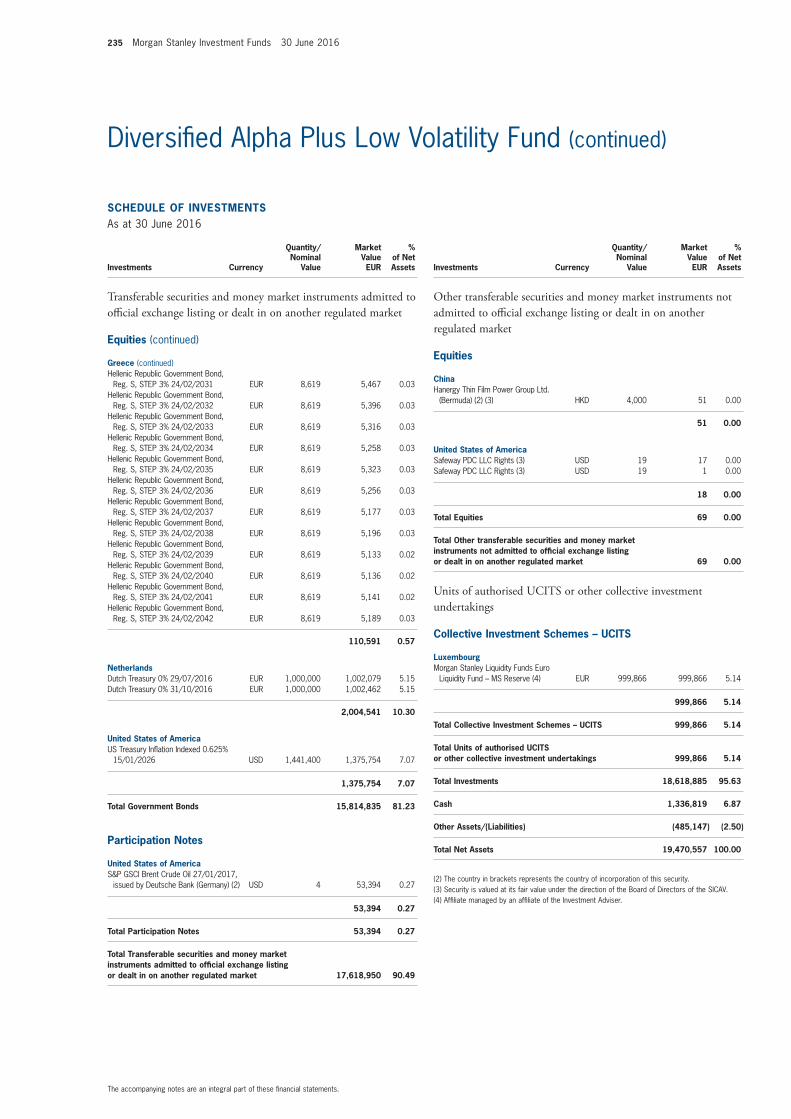
235 Morgan Stanley Investment Funds 30 June 2016
The accompanying notes are an integral part of these financial statements.
Diversified Alpha Plus Low Volatility Fund (continued)
SCHEDULE OF INVESTMENTSAs at 30 June 2016
Investments Currency
Quantity/Nominal
Value
Market Value EUR
% of Net Assets
Transferable securities and money market instruments admitted to official exchange listing or dealt in on another regulated market
Equities (continued)
Greece (continued)Hellenic Republic Government Bond,
Reg. S, STEP 3% 24/02/2031 EUR 8,619 5,467 0.03Hellenic Republic Government Bond,
Reg. S, STEP 3% 24/02/2032 EUR 8,619 5,396 0.03Hellenic Republic Government Bond,
Reg. S, STEP 3% 24/02/2033 EUR 8,619 5,316 0.03Hellenic Republic Government Bond,
Reg. S, STEP 3% 24/02/2034 EUR 8,619 5,258 0.03Hellenic Republic Government Bond,
Reg. S, STEP 3% 24/02/2035 EUR 8,619 5,323 0.03Hellenic Republic Government Bond,
Reg. S, STEP 3% 24/02/2036 EUR 8,619 5,256 0.03Hellenic Republic Government Bond,
Reg. S, STEP 3% 24/02/2037 EUR 8,619 5,177 0.03Hellenic Republic Government Bond,
Reg. S, STEP 3% 24/02/2038 EUR 8,619 5,196 0.03Hellenic Republic Government Bond,
Reg. S, STEP 3% 24/02/2039 EUR 8,619 5,133 0.02Hellenic Republic Government Bond,
Reg. S, STEP 3% 24/02/2040 EUR 8,619 5,136 0.02Hellenic Republic Government Bond,
Reg. S, STEP 3% 24/02/2041 EUR 8,619 5,141 0.02Hellenic Republic Government Bond,
Reg. S, STEP 3% 24/02/2042 EUR 8,619 5,189 0.03
110,591 0.57
NetherlandsDutch Treasury 0% 29/07/2016 EUR 1,000,000 1,002,079 5.15Dutch Treasury 0% 31/10/2016 EUR 1,000,000 1,002,462 5.15
2,004,541 10.30
United States of AmericaUS Treasury Inflation Indexed 0.625%
15/01/2026 USD 1,441,400 1,375,754 7.07
1,375,754 7.07
Total Government Bonds 15,814,835 81.23
Participation Notes
United States of AmericaS&P GSCI Brent Crude Oil 27/01/2017,
issued by Deutsche Bank (Germany) (2) USD 4 53,394 0.27
53,394 0.27
Total Participation Notes 53,394 0.27
Total Transferable securities and money market instruments admitted to official exchange listing or dealt in on another regulated market 17,618,950 90.49
SCHEDULE OF INVESTMENTSAs at 30 June 2016
Investments Currency
Quantity/Nominal
Value
Market Value EUR
% of Net Assets
Other transferable securities and money market instruments not admitted to official exchange listing or dealt in on another regulated market
Equities
ChinaHanergy Thin Film Power Group Ltd.
(Bermuda) (2) (3) HKD 4,000 51 0.00
51 0.00
United States of AmericaSafeway PDC LLC Rights (3) USD 19 17 0.00Safeway PDC LLC Rights (3) USD 19 1 0.00
18 0.00
Total Equities 69 0.00
Total Other transferable securities and money market instruments not admitted to official exchange listing or dealt in on another regulated market 69 0.00
Units of authorised UCITS or other collective investment undertakings
Collective Investment Schemes – UCITS
LuxembourgMorgan Stanley Liquidity Funds Euro
Liquidity Fund – MS Reserve (4) EUR 999,866 999,866 5.14
999,866 5.14
Total Collective Investment Schemes – UCITS 999,866 5.14
Total Units of authorised UCITS or other collective investment undertakings 999,866 5.14
Total Investments 18,618,885 95.63
Cash 1,336,819 6.87
Other Assets/(Liabilities) (485,147) (2.50)
Total Net Assets 19,470,557 100.00
(2) The country in brackets represents the country of incorporation of this security.(3) Security is valued at its fair value under the direction of the Board of Directors of the SICAV.(4) Affiliate managed by an affiliate of the Investment Adviser.
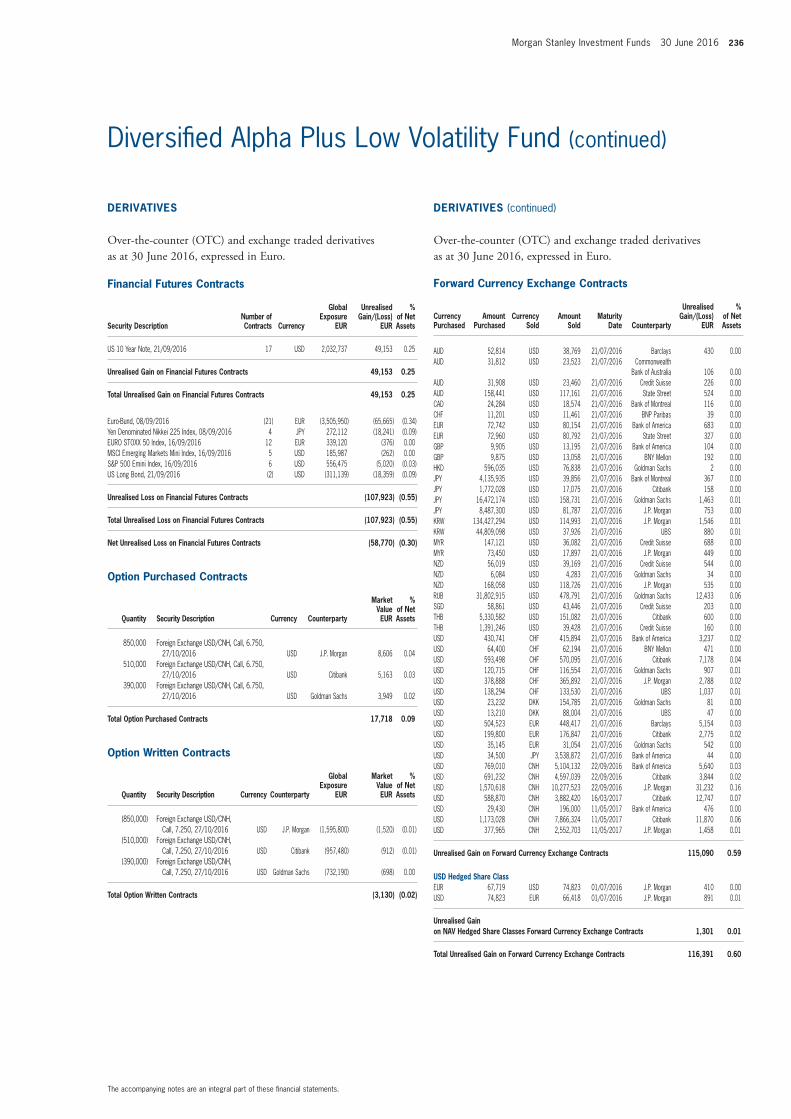
Morgan Stanley Investment Funds 30 June 2016 236
The accompanying notes are an integral part of these financial statements.
Diversified Alpha Plus Low Volatility Fund (continued)
Financial Futures Contracts
Security DescriptionNumber of Contracts Currency
Global Exposure
EUR
Unrealised Gain/(Loss)
EUR
% of Net Assets
US 10 Year Note, 21/09/2016 17 USD 2,032,737 49,153 0.25
Unrealised Gain on Financial Futures Contracts 49,153 0.25
Total Unrealised Gain on Financial Futures Contracts 49,153 0.25
Euro-Bund, 08/09/2016 (21) EUR (3,505,950) (65,665) (0.34)Yen Denominated Nikkei 225 Index, 08/09/2016 4 JPY 272,112 (18,241) (0.09)EURO STOXX 50 Index, 16/09/2016 12 EUR 339,120 (376) 0.00MSCI Emerging Markets Mini Index, 16/09/2016 5 USD 185,987 (262) 0.00S&P 500 Emini Index, 16/09/2016 6 USD 556,475 (5,020) (0.03)US Long Bond, 21/09/2016 (2) USD (311,139) (18,359) (0.09)
Unrealised Loss on Financial Futures Contracts (107,923) (0.55)
Total Unrealised Loss on Financial Futures Contracts (107,923) (0.55)
Net Unrealised Loss on Financial Futures Contracts (58,770) (0.30)
Option Purchased Contracts
Quantity Security Description Currency Counterparty
Market Value EUR
% of Net Assets
850,000 Foreign Exchange USD/CNH, Call, 6.750, 27/10/2016 USD J.P. Morgan 8,606 0.04
510,000 Foreign Exchange USD/CNH, Call, 6.750, 27/10/2016 USD Citibank 5,163 0.03
390,000 Foreign Exchange USD/CNH, Call, 6.750, 27/10/2016 USD Goldman Sachs 3,949 0.02
Total Option Purchased Contracts 17,718 0.09
Option Written Contracts
Quantity Security Description Currency Counterparty
Global Exposure
EUR
Market Value EUR
% of Net Assets
(850,000) Foreign Exchange USD/CNH, Call, 7.250, 27/10/2016 USD J.P. Morgan (1,595,800) (1,520) (0.01)
(510,000) Foreign Exchange USD/CNH, Call, 7.250, 27/10/2016 USD Citibank (957,480) (912) (0.01)
(390,000) Foreign Exchange USD/CNH, Call, 7.250, 27/10/2016 USD Goldman Sachs (732,190) (698) 0.00
Total Option Written Contracts (3,130) (0.02)
Forward Currency Exchange Contracts (continued)
Currency Purchased
Amount Purchased
Currency Sold
Amount Sold
Maturity Date Counterparty
Unrealised Gain/(Loss)
EUR
% of Net Assets
AUD 52,814 USD 38,769 21/07/2016 Barclays 430 0.00AUD 31,812 USD 23,523 21/07/2016 Commonwealth
Bank of Australia 106 0.00AUD 31,908 USD 23,460 21/07/2016 Credit Suisse 226 0.00AUD 158,441 USD 117,161 21/07/2016 State Street 524 0.00CAD 24,284 USD 18,574 21/07/2016 Bank of Montreal 116 0.00CHF 11,201 USD 11,461 21/07/2016 BNP Paribas 39 0.00EUR 72,742 USD 80,154 21/07/2016 Bank of America 683 0.00EUR 72,960 USD 80,792 21/07/2016 State Street 327 0.00GBP 9,905 USD 13,195 21/07/2016 Bank of America 104 0.00GBP 9,875 USD 13,058 21/07/2016 BNY Mellon 192 0.00HKD 596,035 USD 76,838 21/07/2016 Goldman Sachs 2 0.00JPY 4,135,935 USD 39,856 21/07/2016 Bank of Montreal 367 0.00JPY 1,772,028 USD 17,075 21/07/2016 Citibank 158 0.00JPY 16,472,174 USD 158,731 21/07/2016 Goldman Sachs 1,463 0.01JPY 8,487,300 USD 81,787 21/07/2016 J.P. Morgan 753 0.00KRW 134,427,294 USD 114,993 21/07/2016 J.P. Morgan 1,546 0.01KRW 44,809,098 USD 37,926 21/07/2016 UBS 880 0.01MYR 147,121 USD 36,082 21/07/2016 Credit Suisse 688 0.00MYR 73,450 USD 17,897 21/07/2016 J.P. Morgan 449 0.00NZD 56,019 USD 39,169 21/07/2016 Credit Suisse 544 0.00NZD 6,084 USD 4,283 21/07/2016 Goldman Sachs 34 0.00NZD 168,058 USD 118,726 21/07/2016 J.P. Morgan 535 0.00RUB 31,802,915 USD 478,791 21/07/2016 Goldman Sachs 12,433 0.06SGD 58,861 USD 43,446 21/07/2016 Credit Suisse 203 0.00THB 5,330,582 USD 151,082 21/07/2016 Citibank 600 0.00THB 1,391,246 USD 39,428 21/07/2016 Credit Suisse 160 0.00USD 430,741 CHF 415,894 21/07/2016 Bank of America 3,237 0.02USD 64,400 CHF 62,194 21/07/2016 BNY Mellon 471 0.00USD 593,498 CHF 570,095 21/07/2016 Citibank 7,178 0.04USD 120,715 CHF 116,554 21/07/2016 Goldman Sachs 907 0.01USD 378,888 CHF 365,892 21/07/2016 J.P. Morgan 2,788 0.02USD 138,294 CHF 133,530 21/07/2016 UBS 1,037 0.01USD 23,232 DKK 154,785 21/07/2016 Goldman Sachs 81 0.00USD 13,210 DKK 88,004 21/07/2016 UBS 47 0.00USD 504,523 EUR 448,417 21/07/2016 Barclays 5,154 0.03USD 199,800 EUR 176,847 21/07/2016 Citibank 2,775 0.02USD 35,145 EUR 31,054 21/07/2016 Goldman Sachs 542 0.00USD 34,500 JPY 3,538,872 21/07/2016 Bank of America 44 0.00USD 769,010 CNH 5,104,132 22/09/2016 Bank of America 5,640 0.03USD 691,232 CNH 4,597,039 22/09/2016 Citibank 3,844 0.02USD 1,570,618 CNH 10,277,523 22/09/2016 J.P. Morgan 31,232 0.16USD 588,870 CNH 3,882,420 16/03/2017 Citibank 12,747 0.07USD 29,430 CNH 196,000 11/05/2017 Bank of America 476 0.00USD 1,173,028 CNH 7,866,324 11/05/2017 Citibank 11,870 0.06USD 377,965 CNH 2,552,703 11/05/2017 J.P. Morgan 1,458 0.01
Unrealised Gain on Forward Currency Exchange Contracts 115,090 0.59
USD Hedged Share ClassEUR 67,719 USD 74,823 01/07/2016 J.P. Morgan 410 0.00USD 74,823 EUR 66,418 01/07/2016 J.P. Morgan 891 0.01
Unrealised Gain on NAV Hedged Share Classes Forward Currency Exchange Contracts 1,301 0.01
Total Unrealised Gain on Forward Currency Exchange Contracts 116,391 0.60
DERIVATIVES
Over-the-counter (OTC) and exchange traded derivatives as at 30 June 2016, expressed in Euro.
DERIVATIVES (continued)
Over-the-counter (OTC) and exchange traded derivatives as at 30 June 2016, expressed in Euro.

237 Morgan Stanley Investment Funds 30 June 2016
The accompanying notes are an integral part of these financial statements.
Diversified Alpha Plus Low Volatility Fund (continued)
DERIVATIVES (continued)
Over-the-counter (OTC) and exchange traded derivatives as at 30 June 2016, expressed in Euro.
Forward Currency Exchange Contracts (continued)
Currency Purchased
Amount Purchased
Currency Sold
Amount Sold
Maturity Date Counterparty
Unrealised Gain/(Loss)
EUR
% of Net Assets
AUD 31,812 USD 23,703 21/07/2016 Commonwealth Bank of Australia (56) 0.00
CAD 12,124 USD 9,361 21/07/2016 Bank of Montreal (22) 0.00CHF 5,592 USD 5,767 21/07/2016 BNP Paribas (21) 0.00CHF 195,013 USD 203,721 21/07/2016 Citibank (3,088) (0.02)CHF 195,013 USD 202,317 21/07/2016 J.P. Morgan (1,825) (0.01)EUR 346,482 USD 386,723 21/07/2016 Bank of America (1,185) (0.01)EUR 335,158 USD 374,085 21/07/2016 Bank of Montreal (1,148) (0.01)EUR 1,241,061 USD 1,385,204 21/07/2016 Barclays (4,250) (0.02)EUR 382,617 USD 426,955 21/07/2016 BNP Paribas (1,219) (0.01)EUR 318,739 USD 355,752 21/07/2016 BNY Mellon (1,086) (0.01)EUR 170,727 USD 190,537 21/07/2016 Commonwealth
Bank of Australia (568) 0.00EUR 589,854 USD 658,302 21/07/2016 Goldman Sachs (1,966) (0.01)EUR 633,351 USD 706,961 21/07/2016 J.P. Morgan (2,214) (0.01)EUR 130,179 USD 146,457 21/07/2016 State Street (1,487) (0.01)EUR 332,066 USD 370,632 21/07/2016 UBS (1,136) (0.01)GBP 17,660 USD 24,851 21/07/2016 Bank of Montreal (1,004) (0.01)GBP 9,875 USD 13,565 21/07/2016 Citibank (264) 0.00GBP 3,436 USD 4,834 21/07/2016 Goldman Sachs (195) 0.00GBP 52,959 USD 74,522 21/07/2016 UBS (3,012) (0.02)JPY 6,046,452 USD 58,922 21/07/2016 Bank of Montreal (53) 0.00JPY 12,056,700 USD 118,500 21/07/2016 Goldman Sachs (1,013) 0.00NZD 3,037 USD 2,160 21/07/2016 Credit Suisse (3) 0.00SEK 7,593,488 USD 902,354 21/07/2016 Bank of America (6,085) (0.03)SEK 560,278 USD 66,574 21/07/2016 BNY Mellon (444) 0.00SEK 9,774,657 USD 1,174,251 21/07/2016 Citibank (19,252) (0.10)SEK 2,959,239 USD 351,633 21/07/2016 J.P. Morgan (2,353) (0.01)USD 455,310 AUD 623,845 21/07/2016 Barclays (7,454) (0.04)USD 939,909 AUD 1,287,709 21/07/2016 Commonwealth
Bank of Australia (15,313) (0.08)USD 75,631 AUD 103,631 21/07/2016 J.P. Morgan (1,242) (0.01)USD 5,609 BRL 19,781 21/07/2016 UBS (465) 0.00USD 25,003 CAD 32,592 21/07/2016 Bank of Montreal (88) 0.00USD 57,500 EUR 51,792 21/07/2016 Bank of America (99) 0.00USD 196,634 EUR 176,847 21/07/2016 Barclays (71) 0.00USD 112,011 EUR 101,130 21/07/2016 Credit Suisse (431) 0.00USD 37,168 EUR 33,710 21/07/2016 J.P. Morgan (295) 0.00USD 89,150 EUR 80,317 21/07/2016 State Street (170) 0.00USD 106,295 GBP 79,604 21/07/2016 Credit Suisse (616) 0.00USD 34,998 GBP 26,535 21/07/2016 UBS (596) 0.00USD 152,031 KRW 179,236,392 21/07/2016 UBS (3,225) (0.02)USD 35,708 MXN 681,029 21/07/2016 Credit Suisse (893) 0.00USD 1,408 NZD 2,020 21/07/2016 Bank of Montreal (24) 0.00USD 155,401 NZD 222,946 21/07/2016 Credit Suisse (2,598) (0.01)USD 126,528 THB 4,461,115 21/07/2016 Citibank (423) 0.00USD 27,284 THB 965,072 21/07/2016 Credit Suisse (170) 0.00CNH 196,000 USD 29,747 22/09/2016 Bank of America (411) 0.00CNH 2,524,703 USD 383,252 22/09/2016 Citibank (5,363) (0.03)CNH 17,257,990 USD 2,631,268 22/09/2016 J.P. Morgan (46,966) (0.24)CNH 3,882,420 USD 582,247 16/03/2017 Citibank (6,847) (0.04)USD 752,974 CNH 5,113,071 11/05/2017 Citibank (716) 0.00
Unrealised Loss on Forward Currency Exchange Contracts (149,425) (0.77)
USD Hedged Share ClassUSD 73,908 EUR 66,872 08/07/2016 J.P. Morgan (396) 0.00
Unrealised Loss on NAV Hedged Share Classes Forward Currency Exchange Contracts (396) 0.00
Total Unrealised Loss on Forward Currency Exchange Contracts (149,821) (0.77)
Net Unrealised Loss on Forward Currency Exchange Contracts (33,430) (0.17)
Credit Default Swap Contracts
Nominal Amount Ccy Counterparty
Reference Entity
Buy/Sell
Interest (Paid)/
ReceivedMaturity
Date
Market Value EUR
Unrealised Gain/(Loss)
EUR
% of Net Assets
324,000 USD Barclays Russian Foreign Bond 7.5% 31/03/2030 Sell 1.00% 20/06/2021 (17,592) (17,592) (0.09)
Total Unrealised Loss on Credit Default Swap Contracts (17,592) (17,592) (0.09)
Net Unrealised Loss on Credit Default Swap Contracts (17,592) (17,592) (0.09)
Interest Rate Swap Contracts (continued)
Nominal Amount Ccy Counterparty
Security Description
Maturity Date
Market Value EUR
Unrealised Gain/(Loss)
EUR
% of Net Assets
608,000 AUD J.P. Morgan Pay floating BBR 6 month
Receive fixed 2.436% 20/05/2026 8,589 8,589 0.04334,000 AUD J.P. Morgan Pay floating BBR
6 month Receive fixed 2.538% 05/05/2026 6,755 6,755 0.04
334,000 AUD Bank of America Pay floating BBR 6 month
Receive fixed 2.49% 06/05/2026 5,805 5,805 0.03294,000 AUD Citibank Pay floating BBR
6 month Receive fixed 2.5% 06/05/2026 5,287 5,287 0.03
Total Unrealised Gain on Interest Rate Swap Contracts 26,436 26,436 0.14
832,000 USD Goldman Sachs Pay fixed 1.708% Receive floating LIBOR
3 month 11/03/2026 (29,310) (29,310) (0.15)658,000 USD Citibank Pay fixed 1.71%
Receive floating LIBOR 3 month 11/03/2026 (23,293) (23,293) (0.12)
920,000 USD Goldman Sachs Pay fixed 1.592% Receive floating LIBOR
3 month 13/05/2026 (20,173) (20,173) (0.10)670,000 USD Goldman Sachs Pay fixed 1.276%
Receive floating LIBOR 3 month 07/03/2021 (10,546) (10,546) (0.05)
1,242,000 SEK J.P. Morgan Pay fixed 1.385% Receive floating STIBOR
3 month 13/10/2025 (9,561) (9,561) (0.05)1,387,000 SEK Citibank Pay fixed 1.278%
Receive floating STIBOR 3 month 06/10/2025 (9,200) (9,200) (0.05)
1,037,900 SEK J.P. Morgan Pay fixed 1.286% Receive floating STIBOR
3 month 07/10/2025 (6,967) (6,967) (0.03)1,004,600 SEK J.P. Morgan Pay fixed 1.254%
Receive floating STIBOR 3 month 06/10/2025 (6,414) (6,414) (0.03)
210,000 USD Barclays Pay fixed 1.64% Receive floating LIBOR
3 month 06/04/2026 (5,732) (5,732) (0.03)680,000 SEK Citibank Pay fixed 1.393%
Receive floating STIBOR 3 month 13/10/2025 (5,295) (5,295) (0.03)
707,000 SEK Citibank Pay fixed 1.338% Receive floating STIBOR
3 month 12/10/2025 (5,101) (5,101) (0.03)537,000 SEK Barclays Pay fixed 1.373%
Receive floating STIBOR 3 month 14/10/2025 (4,062) (4,062) (0.02)
DERIVATIVES (continued)
Over-the-counter (OTC) and exchange traded derivatives as at 30 June 2016, expressed in Euro.

Morgan Stanley Investment Funds 30 June 2016 238
The accompanying notes are an integral part of these financial statements.
Diversified Alpha Plus Low Volatility Fund (continued)
DERIVATIVES (continued)
Over-the-counter (OTC) and exchange traded derivatives as at 30 June 2016, expressed in Euro.
DERIVATIVES (continued)
Over-the-counter (OTC) and exchange traded derivatives as at 30 June 2016, expressed in Euro.
Interest Rate Swap Contracts (continued)
Nominal Amount Ccy Counterparty
Security Description
Maturity Date
Market Value EUR
Unrealised Gain/(Loss)
EUR
% of Net Assets
499,000 SEK BNP Paribas Pay fixed 1.338% Receive floating STIBOR
3 month 12/10/2025 (3,600) (3,600) (0.02)469,000 SEK Barclays Pay fixed 1.338%
Receive floating STIBOR 3 month 12/10/2025 (3,384) (3,384) (0.02)
442,000 SEK Citibank Pay fixed 1.37% Receive floating STIBOR
3 month 14/10/2025 (3,332) (3,332) (0.02)500,100 SEK Goldman Sachs Pay fixed 1.253%
Receive floating STIBOR 3 month 06/10/2025 (3,183) (3,183) (0.02)
320,600 SEK J.P. Morgan Pay fixed 1.335% Receive floating STIBOR
3 month 12/10/2025 (2,305) (2,305) (0.01)150,000 USD Goldman Sachs Pay fixed 1.474%
Receive floating LIBOR 3 month 16/06/2026 (1,623) (1,623) (0.01)
Total Return Swap Contracts
Nominal Amount Currency Counterparty Security Description Maturity Date
Global Exposure
Unrealised Gain/(Loss)
EUR
% of Net Assets
30,007 USD Bank of America Pay Bank of America- Merrill Lynch US Apt REITS Custom Basket Index Receive USD LIBOR 3 month + - 24.00bp 15/04/2017 23 23 0.0069,755 USD Goldman Sachs Pay Goldman Sachs Copper Miners Custom Basket Index Receive USD LIBOR 3 month + - 110.00bp 10/05/2017 115 115 0.00
1,280,106 USD Goldman Sachs Pay Goldman Sachs Global Aerospace Custom Basket Index Receive USD LIBOR 3 month + - 25.00bp 01/04/2017 15,125 15,125 0.07570,000 USD Goldman Sachs Pay USD LIBOR 3 month Receive Markit iBoxx USD Liquid High Yield Index 20/12/2016 7,261 7,261 0.04
40,137 USD Goldman Sachs Pay Brent Crude Total Return Index Receive a fixed revenue of 1.15% 06/06/2017 1,681 1,681 0.0161,047 USD Goldman Sachs Pay Brent Crude Total Return Index Receive a fixed revenue of 1.15% 06/06/2017 1,063 1,063 0.01
Total Unrealised Gain on Total Return Swap Contracts 25,268 25,268 0.13
647,376 USD Bank of America Pay Bank of America- Merrill Lynch US Apt REITS Custom Basket Index Receive USD LIBOR 3 month + - 24.00bp 15/04/2017 (13,182) (13,182) (0.07)800,737 USD Citibank Pay Citibank US Media Custom Basket Index Receive USD LIBOR 3 month + - 13.00bp 03/02/2017 (26,260) (26,260) (0.14)
89,477 USD Goldman Sachs Pay Goldman Sachs Iron & Ore Miners Custom Basket Index Receive USD LIBOR 3 month + - 65.00bp 10/05/2017 (8,083) (8,083) (0.04)254,345 USD Goldman Sachs Pay Goldman Sachs US Consumer Staples Custom Basket Index Receive USD LIBOR 3 month + - 15.00bp 26/02/2017 (6,417) (6,417) (0.03)244,839 USD J.P. Morgan Pay JPMorgan Chinese Internets Custom Basket Index Receive USD LIBOR 3 month + - 1.00bp 05/05/2017 (7,917) (7,917) (0.04)
Total Unrealised Loss on Total Return Swap Contracts (61,859) (61,859) (0.32)
Net Unrealised Loss on Total Return Swap Contracts (36,591) (36,591) (0.19)
Interest Rate Swap Contracts (continued)
Nominal Amount Ccy Counterparty
Security Description
Maturity Date
Market Value EUR
Unrealised Gain/(Loss)
EUR
% of Net Assets
50,000 USD Goldman Sachs Pay fixed 1.661% Receive floating LIBOR 3
month 04/04/2026 (1,456) (1,456) (0.01)178,000 SEK Goldman Sachs Pay fixed 1.388%
Receive floating STIBOR 3 month 13/10/2025 (1,376) (1,376) (0.01)
125,000 SEK Goldman Sachs Pay fixed 1.288% Receive floating STIBOR
3 month 07/10/2025 (841) (841) 0.00
Total Unrealised Loss on Interest Rate Swap Contracts (156,754) (156,754) (0.81)
Net Unrealised Loss on Interest Rate Swap Contracts (130,318) (130,318) (0.67)
Collateral received and paid by the Fund in respect of financial derivative instruments:
Type of Collateral Counterparty CurrencyCollateral Amount
receivedCollateral Amount
paid
Diversified Alpha Plus Low Volatility Fund
Cash Goldman Sachs EUR 318,564 165,871
318,564 165,871

239 Morgan Stanley Investment Funds 30 June 2016
The accompanying notes are an integral part of these financial statements.
Please refer to the full prospectus for the Fund’s investment objective and policy.
INVESTMENT AIM
To provide regular income through investing primarily in a portfolio of transferable securities and money market instruments globally and through the use of financial derivative instruments.
SCHEDULE OF INVESTMENTSAs at 30 June 2016
Investments Currency
Quantity/Nominal
Value
Market Value EUR
% of Net Assets
Transferable securities and money market instruments admitted to official exchange listing or dealt in on another regulated market
Equities
AustraliaSouth32 Ltd. GBP 3,964 4,169 0.00
4,169 0.00
BelgiumAnheuser-Busch InBev SA NV EUR 1,969 229,388 0.06
229,388 0.06
BrazilAmbev SA BRL 33,800 178,661 0.05Banco Bradesco SA Preference BRL 27,500 191,349 0.05Cielo SA BRL 17,040 160,666 0.04Itau Unibanco Holding SA Preference BRL 22,240 184,528 0.05Itausa - Investimentos Itau SA Preference BRL 59,070 121,948 0.03Petroleo Brasileiro SA BRL 52,800 166,982 0.04Ultrapar Participacoes SA BRL 7,300 142,936 0.04Vale SA BRL 26,400 117,287 0.03
1,264,357 0.33
ChileEmpresa Nacional de Electricidad SA CLP 112,529 92,183 0.02Endesa Americas SA CLP 112,529 46,024 0.01Enersis Americas SA CLP 555,766 85,106 0.02Enersis Chile SA CLP 555,766 58,051 0.02
281,364 0.07
ChinaAlibaba Group Holding Ltd., ADR
(Cayman Islands) (2) USD 5,800 410,723 0.11Baidu, Inc., ADR (Cayman Islands) (2) USD 1,800 263,206 0.07Bank of China Ltd. ‘H’ HKD 985,000 352,883 0.09China Cinda Asset Management Co. Ltd. ‘H’ HKD 375,000 113,477 0.03China Construction Bank Corp. ‘H’ HKD 926,000 549,688 0.15China Everbright International Ltd.
(Hong Kong) (2) HKD 92,000 91,732 0.02China Life Insurance Co. Ltd. ‘H’ HKD 130,000 250,501 0.07China Mengniu Dairy Co. Ltd.
(Cayman Islands) (2) HKD 33,000 51,575 0.01China Merchants Bank Co. Ltd. ‘H’ HKD 30,500 61,318 0.02China Merchants Holdings International Co.
Ltd. (Hong Kong) (2) HKD 70,215 167,700 0.04China Mobile Ltd. (Hong Kong) (2) HKD 69,500 714,331 0.19China Overseas Land & Investment Ltd.
(Hong Kong) (2) HKD 72,000 204,519 0.05China Pacific Insurance Group Co. Ltd. ‘H’ HKD 63,400 191,852 0.05China Petroleum & Chemical Corp. ‘H’ HKD 416,000 270,095 0.07China Resources Land Ltd.
(Cayman Islands) (2) HKD 74,000 155,291 0.04China Shenhua Energy Co. Ltd. ‘H’ HKD 64,000 105,812 0.03China Telecom Corp. Ltd. ‘H’ HKD 348,000 139,602 0.04China Unicom Hong Kong Ltd.
(Hong Kong) (2) HKD 150,000 139,477 0.04CITIC Ltd. (Hong Kong) (2) HKD 41,000 53,620 0.01CNOOC Ltd. (Hong Kong) (2) HKD 319,000 355,796 0.09Global Logistic Properties Ltd.
(Singapore) (2) SGD 53,700 64,698 0.02Guangdong Investment Ltd.
(Hong Kong) (2) HKD 40,000 54,631 0.02
Global Balanced Income Fund
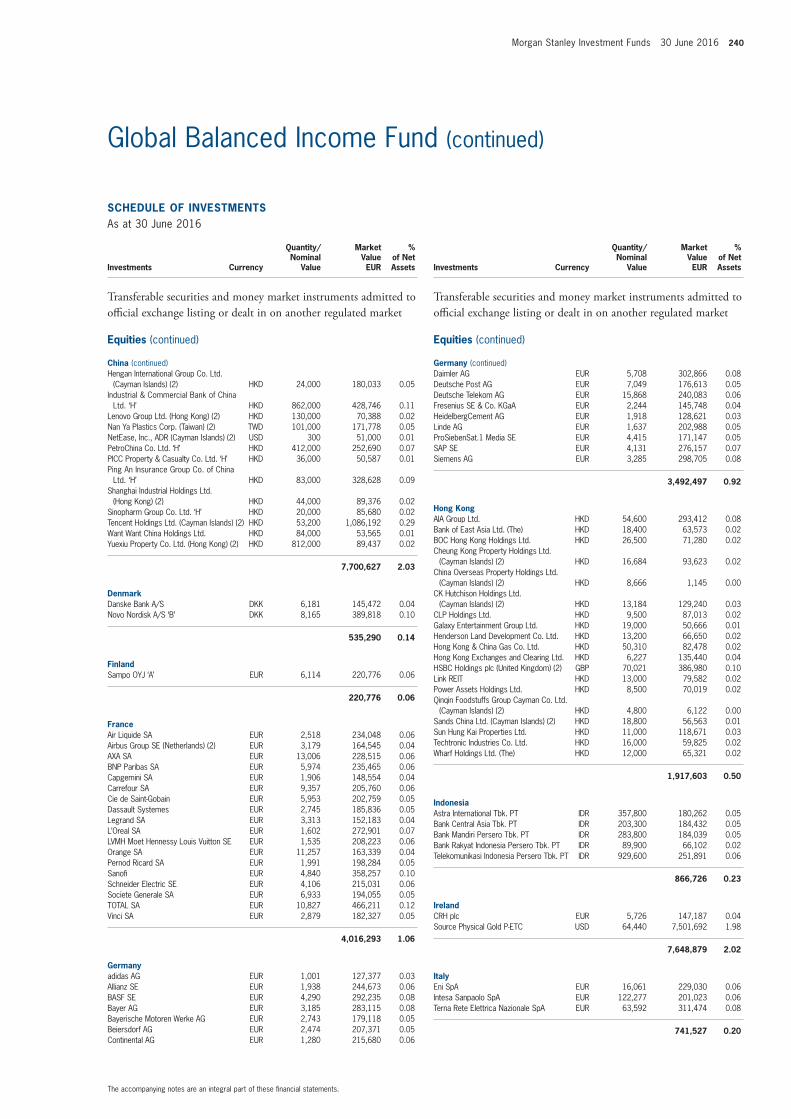
Morgan Stanley Investment Funds 30 June 2016 240
The accompanying notes are an integral part of these financial statements.
Global Balanced Income Fund (continued)
SCHEDULE OF INVESTMENTSAs at 30 June 2016
Investments Currency
Quantity/Nominal
Value
Market Value EUR
% of Net Assets
Transferable securities and money market instruments admitted to official exchange listing or dealt in on another regulated market
Equities (continued)
China (continued)Hengan International Group Co. Ltd.
(Cayman Islands) (2) HKD 24,000 180,033 0.05Industrial & Commercial Bank of China
Ltd. ‘H’ HKD 862,000 428,746 0.11Lenovo Group Ltd. (Hong Kong) (2) HKD 130,000 70,388 0.02Nan Ya Plastics Corp. (Taiwan) (2) TWD 101,000 171,778 0.05NetEase, Inc., ADR (Cayman Islands) (2) USD 300 51,000 0.01PetroChina Co. Ltd. ‘H’ HKD 412,000 252,690 0.07PICC Property & Casualty Co. Ltd. ‘H’ HKD 36,000 50,587 0.01Ping An Insurance Group Co. of China
Ltd. ‘H’ HKD 83,000 328,628 0.09Shanghai Industrial Holdings Ltd.
(Hong Kong) (2) HKD 44,000 89,376 0.02Sinopharm Group Co. Ltd. ‘H’ HKD 20,000 85,680 0.02Tencent Holdings Ltd. (Cayman Islands) (2) HKD 53,200 1,086,192 0.29Want Want China Holdings Ltd. HKD 84,000 53,565 0.01Yuexiu Property Co. Ltd. (Hong Kong) (2) HKD 812,000 89,437 0.02
7,700,627 2.03
DenmarkDanske Bank A/S DKK 6,181 145,472 0.04Novo Nordisk A/S ‘B’ DKK 8,165 389,818 0.10
535,290 0.14
FinlandSampo OYJ ‘A’ EUR 6,114 220,776 0.06
220,776 0.06
FranceAir Liquide SA EUR 2,518 234,048 0.06Airbus Group SE (Netherlands) (2) EUR 3,179 164,545 0.04AXA SA EUR 13,006 228,515 0.06BNP Paribas SA EUR 5,974 235,465 0.06Capgemini SA EUR 1,906 148,554 0.04Carrefour SA EUR 9,357 205,760 0.06Cie de Saint-Gobain EUR 5,953 202,759 0.05Dassault Systemes EUR 2,745 185,836 0.05Legrand SA EUR 3,313 152,183 0.04L’Oreal SA EUR 1,602 272,901 0.07LVMH Moet Hennessy Louis Vuitton SE EUR 1,535 208,223 0.06Orange SA EUR 11,257 163,339 0.04Pernod Ricard SA EUR 1,991 198,284 0.05Sanofi EUR 4,840 358,257 0.10Schneider Electric SE EUR 4,106 215,031 0.06Societe Generale SA EUR 6,933 194,055 0.05TOTAL SA EUR 10,827 466,211 0.12Vinci SA EUR 2,879 182,327 0.05
4,016,293 1.06
Germanyadidas AG EUR 1,001 127,377 0.03Allianz SE EUR 1,938 244,673 0.06BASF SE EUR 4,290 292,235 0.08Bayer AG EUR 3,185 283,115 0.08Bayerische Motoren Werke AG EUR 2,743 179,118 0.05Beiersdorf AG EUR 2,474 207,371 0.05Continental AG EUR 1,280 215,680 0.06
SCHEDULE OF INVESTMENTSAs at 30 June 2016
Investments Currency
Quantity/Nominal
Value
Market Value EUR
% of Net Assets
Transferable securities and money market instruments admitted to official exchange listing or dealt in on another regulated market
Equities (continued)
Germany (continued)Daimler AG EUR 5,708 302,866 0.08Deutsche Post AG EUR 7,049 176,613 0.05Deutsche Telekom AG EUR 15,868 240,083 0.06Fresenius SE & Co. KGaA EUR 2,244 145,748 0.04HeidelbergCement AG EUR 1,918 128,621 0.03Linde AG EUR 1,637 202,988 0.05ProSiebenSat.1 Media SE EUR 4,415 171,147 0.05SAP SE EUR 4,131 276,157 0.07Siemens AG EUR 3,285 298,705 0.08
3,492,497 0.92
Hong KongAIA Group Ltd. HKD 54,600 293,412 0.08Bank of East Asia Ltd. (The) HKD 18,400 63,573 0.02BOC Hong Kong Holdings Ltd. HKD 26,500 71,280 0.02Cheung Kong Property Holdings Ltd.
(Cayman Islands) (2) HKD 16,684 93,623 0.02China Overseas Property Holdings Ltd.
(Cayman Islands) (2) HKD 8,666 1,145 0.00CK Hutchison Holdings Ltd.
(Cayman Islands) (2) HKD 13,184 129,240 0.03CLP Holdings Ltd. HKD 9,500 87,013 0.02Galaxy Entertainment Group Ltd. HKD 19,000 50,666 0.01Henderson Land Development Co. Ltd. HKD 13,200 66,650 0.02Hong Kong & China Gas Co. Ltd. HKD 50,310 82,478 0.02Hong Kong Exchanges and Clearing Ltd. HKD 6,227 135,440 0.04HSBC Holdings plc (United Kingdom) (2) GBP 70,021 386,980 0.10Link REIT HKD 13,000 79,582 0.02Power Assets Holdings Ltd. HKD 8,500 70,019 0.02Qinqin Foodstuffs Group Cayman Co. Ltd.
(Cayman Islands) (2) HKD 4,800 6,122 0.00Sands China Ltd. (Cayman Islands) (2) HKD 18,800 56,563 0.01Sun Hung Kai Properties Ltd. HKD 11,000 118,671 0.03Techtronic Industries Co. Ltd. HKD 16,000 59,825 0.02Wharf Holdings Ltd. (The) HKD 12,000 65,321 0.02
1,917,603 0.50
IndonesiaAstra International Tbk. PT IDR 357,800 180,262 0.05Bank Central Asia Tbk. PT IDR 203,300 184,432 0.05Bank Mandiri Persero Tbk. PT IDR 283,800 184,039 0.05Bank Rakyat Indonesia Persero Tbk. PT IDR 89,900 66,102 0.02Telekomunikasi Indonesia Persero Tbk. PT IDR 929,600 251,891 0.06
866,726 0.23
IrelandCRH plc EUR 5,726 147,187 0.04Source Physical Gold P-ETC USD 64,440 7,501,692 1.98
7,648,879 2.02
ItalyEni SpA EUR 16,061 229,030 0.06Intesa Sanpaolo SpA EUR 122,277 201,023 0.06Terna Rete Elettrica Nazionale SpA EUR 63,592 311,474 0.08
741,527 0.20

241 Morgan Stanley Investment Funds 30 June 2016
The accompanying notes are an integral part of these financial statements.
Global Balanced Income Fund (continued)
SCHEDULE OF INVESTMENTSAs at 30 June 2016
Investments Currency
Quantity/Nominal
Value
Market Value EUR
% of Net Assets
Transferable securities and money market instruments admitted to official exchange listing or dealt in on another regulated market
Equities (continued)
JapanAeon Co. Ltd. JPY 9,100 126,320 0.03Aisin Seiki Co. Ltd. JPY 4,100 148,384 0.04Ajinomoto Co., Inc. JPY 8,000 168,466 0.04Asahi Group Holdings Ltd. JPY 5,500 159,145 0.04Asahi Kasei Corp. JPY 19,000 117,737 0.03Astellas Pharma, Inc. JPY 25,900 362,700 0.10Bridgestone Corp. JPY 8,000 228,893 0.06Canon, Inc. JPY 16,900 430,804 0.11Central Japan Railway Co. JPY 1,800 285,547 0.08Concordia Financial Group Ltd. JPY 41,000 143,109 0.04Dai-ichi Life Insurance Co. Ltd. (The) JPY 14,500 143,027 0.04Daiichi Sankyo Co. Ltd. JPY 9,400 203,501 0.05Daikin Industries Ltd. JPY 3,300 245,909 0.07Daito Trust Construction Co. Ltd. JPY 1,100 160,204 0.04Daiwa House Industry Co. Ltd. JPY 7,800 203,577 0.05Denso Corp. JPY 6,800 212,890 0.06Dentsu, Inc. JPY 4,400 183,695 0.05East Japan Railway Co. JPY 4,400 363,270 0.10Eisai Co. Ltd. JPY 3,300 164,286 0.04FANUC Corp. JPY 2,300 332,858 0.09Fast Retailing Co. Ltd. JPY 700 167,258 0.04Fuji Heavy Industries Ltd. JPY 7,700 234,395 0.06FUJIFILM Holdings Corp. JPY 7,700 265,800 0.07Hitachi Ltd. JPY 62,000 230,029 0.06Honda Motor Co. Ltd. JPY 18,600 418,789 0.11Hoya Corp. JPY 5,500 174,934 0.05ITOCHU Corp. JPY 21,100 228,906 0.06Japan Exchange Group, Inc. JPY 10,200 104,273 0.03Japan Real Estate Investment Corp., REIT JPY 25 138,726 0.04Japan Retail Fund Investment Corp., REIT JPY 60 137,640 0.04Japan Tobacco, Inc. JPY 12,100 434,524 0.11JFE Holdings, Inc. JPY 9,900 113,943 0.03Joyo Bank Ltd. (The) JPY 67,000 223,423 0.06JX Holdings, Inc. JPY 73,700 257,182 0.07Kansai Electric Power Co., Inc. (The) JPY 15,700 136,231 0.04Kao Corp. JPY 6,400 332,115 0.09KDDI Corp. JPY 19,100 520,403 0.14Keyence Corp. JPY 600 363,085 0.10Kirin Holdings Co. Ltd. JPY 12,400 186,997 0.05Komatsu Ltd. JPY 14,500 224,567 0.06Kubota Corp. JPY 17,600 210,653 0.06Kyocera Corp. JPY 4,700 199,182 0.05Kyushu Electric Power Co., Inc. JPY 13,600 121,651 0.03Lawson, Inc. JPY 1,600 114,411 0.03LIXIL Group Corp. JPY 5,800 85,537 0.02Makita Corp. JPY 2,200 130,166 0.03Marubeni Corp. JPY 32,800 131,913 0.03Mazda Motor Corp. JPY 9,400 111,808 0.03MEIJI Holdings Co. Ltd. JPY 2,100 191,704 0.05Mitsubishi Chemical Holdings Corp. JPY 26,300 106,968 0.03Mitsubishi Corp. JPY 17,800 278,558 0.07Mitsubishi Electric Corp. JPY 29,000 306,614 0.08Mitsubishi Estate Co. Ltd. JPY 16,000 262,292 0.07Mitsubishi Heavy Industries Ltd. JPY 52,000 185,418 0.05Mitsui & Co. Ltd. JPY 24,800 263,402 0.07Mitsui Fudosan Co. Ltd. JPY 12,000 244,875 0.06Mizuho Financial Group, Inc. JPY 283,800 368,367 0.10MS&AD Insurance Group Holdings, Inc. JPY 7,300 167,494 0.04Murata Manufacturing Co. Ltd. JPY 2,500 249,006 0.07Nagoya Railroad Co. Ltd. JPY 31,000 156,554 0.04Nidec Corp. JPY 3,100 209,517 0.06Nintendo Co. Ltd. JPY 1,400 178,715 0.05Nippon Building Fund, Inc., REIT JPY 28 155,128 0.04
SCHEDULE OF INVESTMENTSAs at 30 June 2016
Investments Currency
Quantity/Nominal
Value
Market Value EUR
% of Net Assets
Transferable securities and money market instruments admitted to official exchange listing or dealt in on another regulated market
Equities (continued)
Japan (continued)Nippon Steel & Sumitomo Metal Corp. JPY 13,600 233,066 0.06Nippon Telegraph & Telephone Corp. JPY 200 8,402 0.00Nippon Yusen KK JPY 66,000 103,401 0.03Nissan Motor Co. Ltd. JPY 28,900 232,178 0.06Nisshin Seifun Group, Inc. JPY 9,000 129,028 0.03Nitori Holdings Co. Ltd. JPY 1,800 194,408 0.05Nitto Denko Corp. JPY 2,300 129,560 0.03Nomura Holdings, Inc. JPY 52,300 167,171 0.04NTT Data Corp. JPY 4,700 198,688 0.05NTT DOCOMO, Inc. JPY 11,700 283,298 0.07Obayashi Corp. JPY 15,400 146,244 0.04Odakyu Electric Railway Co. Ltd. JPY 14,000 146,550 0.04Olympus Corp. JPY 5,000 166,077 0.04Ono Pharmaceutical Co. Ltd. JPY 5,000 193,953 0.05Oriental Land Co. Ltd. JPY 2,600 150,737 0.04ORIX Corp. JPY 21,500 246,135 0.07Otsuka Holdings Co. Ltd. JPY 5,400 223,034 0.06Panasonic Corp. JPY 28,100 216,675 0.06Rakuten, Inc. JPY 15,100 145,708 0.04Resona Holdings, Inc. JPY 41,100 133,817 0.04Santen Pharmaceutical Co. Ltd. JPY 8,100 113,431 0.03Secom Co. Ltd. JPY 3,200 211,542 0.06Sekisui House Ltd. JPY 13,000 202,474 0.05Seven & i Holdings Co. Ltd. JPY 8,700 325,981 0.09Shimano, Inc. JPY 1,200 163,110 0.04Shin-Etsu Chemical Co. Ltd. JPY 6,200 323,527 0.09Shionogi & Co. Ltd. JPY 4,100 199,807 0.05Shiseido Co. Ltd. JPY 5,400 124,633 0.03Shizuoka Bank Ltd. (The) JPY 27,000 169,438 0.04SMC Corp. JPY 800 174,383 0.05SoftBank Group Corp. JPY 10,800 547,211 0.14Sony Corp. JPY 15,800 413,204 0.11Sumitomo Chemical Co. Ltd. JPY 26,000 95,121 0.03Sumitomo Electric Industries Ltd. JPY 17,700 207,667 0.05Sumitomo Mitsui Financial Group, Inc. JPY 15,400 394,387 0.10Sumitomo Mitsui Trust Holdings, Inc. JPY 68,000 196,285 0.05Sumitomo Realty & Development Co. Ltd. JPY 6,000 144,651 0.04Suzuki Motor Corp. JPY 7,000 168,698 0.04Sysmex Corp. JPY 2,500 152,948 0.04Taisei Corp. JPY 27,000 198,032 0.05Takeda Pharmaceutical Co. Ltd. JPY 9,700 375,590 0.10TDK Corp. JPY 2,100 104,215 0.03Terumo Corp. JPY 4,500 171,131 0.05Tohoku Electric Power Co., Inc. JPY 12,800 144,184 0.04Tokio Marine Holdings, Inc. JPY 9,400 277,012 0.07Tokyo Electric Power Co. Holdings, Inc. JPY 21,400 80,914 0.02Tokyo Electron Ltd. JPY 2,800 210,145 0.06Tokyo Gas Co. Ltd. JPY 37,000 136,142 0.04Toray Industries, Inc. JPY 22,000 167,406 0.04Toshiba Corp. JPY 55,000 133,054 0.04Toyota Motor Corp. JPY 28,200 1,246,923 0.33Unicharm Corp. JPY 5,500 109,996 0.03West Japan Railway Co. JPY 2,800 158,485 0.04Yamaha Motor Co. Ltd. JPY 6,200 83,622 0.02Yamato Holdings Co. Ltd. JPY 6,800 139,298 0.04
25,220,252 6.66
MalaysiaCIMB Group Holdings Bhd. MYR 151 147 0.00Dialog Group Bhd. MYR 194,200 66,799 0.02Gamuda Bhd. MYR 197,300 214,173 0.05

Morgan Stanley Investment Funds 30 June 2016 242
The accompanying notes are an integral part of these financial statements.
Global Balanced Income Fund (continued)
SCHEDULE OF INVESTMENTSAs at 30 June 2016
Investments Currency
Quantity/Nominal
Value
Market Value EUR
% of Net Assets
Transferable securities and money market instruments admitted to official exchange listing or dealt in on another regulated market
Equities (continued)
Malaysia (continued)Genting Bhd. MYR 80,000 146,522 0.04IJM Corp. Bhd. MYR 278,000 216,706 0.06IOI Corp. Bhd. MYR 165,100 160,043 0.04Sime Darby Bhd. MYR 104,520 177,191 0.05Tenaga Nasional Bhd. MYR 21,100 66,451 0.02
1,048,032 0.28
MexicoAmerica Movil SAB de CV MXN 242,000 132,767 0.03Cemex SAB de CV MXN 3,893 2,085 0.00Fomento Economico Mexicano SAB de CV MXN 18,000 148,347 0.04Grupo Aeroportuario del Sureste SAB
de CV ‘B’ MXN 8,445 118,624 0.03Grupo Bimbo SAB de CV MXN 43,500 122,620 0.03Grupo Financiero Banorte SAB de CV ‘O’ MXN 19,900 96,616 0.03Grupo Mexico SAB de CV MXN 1,100 2,219 0.00Grupo Televisa SAB MXN 23,100 106,881 0.03Telesites SAB de CV MXN 290 157 0.00Wal-Mart de Mexico SAB de CV MXN 44,500 96,229 0.03
826,545 0.22
NetherlandsASML Holding NV EUR 2,604 228,163 0.06ING Groep NV, CVA EUR 23,483 214,823 0.06Koninklijke Philips NV EUR 8,860 196,736 0.05Unilever NV, CVA EUR 6,736 279,813 0.08Wolters Kluwer NV EUR 4,429 161,681 0.04
1,081,216 0.29
PeruCredicorp Ltd. (Bermuda) (2) USD 900 125,110 0.03
125,110 0.03
PhilippinesAyala Corp. PHP 14,820 240,345 0.06Ayala Land, Inc. PHP 299,700 222,125 0.06JG Summit Holdings, Inc. PHP 33,420 54,902 0.02
517,372 0.14
PolandPowszechna Kasa Oszczednosci Bank
Polski SA PLN 28,606 150,819 0.04
150,819 0.04
QatarCommercial Bank QSC (The) QAR 9,701 88,669 0.02
88,669 0.02
SingaporeCapitaLand Mall Trust, REIT SGD 50,200 71,371 0.02DBS Group Holdings Ltd. SGD 9,091 95,633 0.03Jardine Matheson Holdings Ltd.
(Bermuda) (2) USD 1,500 78,681 0.02
SCHEDULE OF INVESTMENTSAs at 30 June 2016
Investments Currency
Quantity/Nominal
Value
Market Value EUR
% of Net Assets
Transferable securities and money market instruments admitted to official exchange listing or dealt in on another regulated market
Equities (continued)
Singapore (continued)Oversea-Chinese Banking Corp. Ltd. SGD 15,252 88,468 0.02Singapore Press Holdings Ltd. SGD 28,400 74,878 0.02Singapore Telecommunications Ltd. SGD 43,100 118,814 0.03United Overseas Bank Ltd. SGD 6,948 85,426 0.02
613,271 0.16
South AfricaAngloGold Ashanti Ltd. ZAR 7,653 125,477 0.03Aspen Pharmacare Holdings Ltd. ZAR 5,703 127,099 0.03Bid Corp. Ltd. ZAR 4,975 84,658 0.02Bidvest Group Ltd. (The) ZAR 4,975 42,224 0.01FirstRand Ltd. ZAR 38,975 107,159 0.03MTN Group Ltd. ZAR 14,122 124,226 0.03Naspers Ltd. ‘N’ ZAR 2,253 309,508 0.08SABMiller plc (United Kingdom) (2) GBP 2,922 153,329 0.04Sasol Ltd. ZAR 4,166 100,062 0.03Shoprite Holdings Ltd. ZAR 9,826 100,598 0.03Standard Bank Group Ltd. ZAR 13,301 104,345 0.03Steinhoff International Holdings NV
(Netherlands) (2) ZAR 22,810 117,119 0.03
1,495,804 0.39
South KoreaAmorepacific Corp. KRW 623 210,045 0.06Coway Co. Ltd. KRW 1,957 159,790 0.04Hana Financial Group, Inc. KRW 3,183 57,823 0.02Hyundai Heavy Industries Co. Ltd. KRW 567 46,739 0.01Hyundai Mobis Co. Ltd. KRW 1,046 205,957 0.05Hyundai Motor Co. KRW 2,132 225,720 0.06Kangwon Land, Inc. KRW 5,313 173,109 0.05KB Financial Group, Inc. KRW 6,629 168,853 0.04Kia Motors Corp. KRW 4,239 143,084 0.04Korea Electric Power Corp. KRW 4,116 194,248 0.05Korea Zinc Co. Ltd. KRW 300 119,077 0.03KT&G Corp. KRW 2,166 231,012 0.06LG Chem Ltd. KRW 793 161,098 0.04LG Corp. KRW 2,967 147,673 0.04LG Household & Health Care Ltd. KRW 76 66,330 0.02NAVER Corp. KRW 416 230,778 0.06POSCO KRW 1,460 229,864 0.06Samsung C&T Corp. KRW 535 51,417 0.01Samsung Electronics Co. Ltd. KRW 1,029 1,145,707 0.30Samsung Electronics Co. Ltd. Preference KRW 205 189,488 0.05Samsung Fire & Marine Insurance Co. Ltd. KRW 671 138,149 0.04Samsung Life Insurance Co. Ltd. KRW 522 40,990 0.01Shinhan Financial Group Co. Ltd. KRW 6,023 178,830 0.05SK Holdings Co. Ltd. KRW 289 45,726 0.01SK Hynix, Inc. KRW 9,310 235,688 0.06SK Innovation Co. Ltd. KRW 534 58,622 0.02
4,855,817 1.28
SpainBanco Bilbao Vizcaya Argentaria SA EUR 53,648 268,508 0.07Banco Santander SA EUR 107,276 364,309 0.10Iberdrola SA EUR 429 2,569 0.00Industria de Diseno Textil SA EUR 5,952 176,864 0.05Telefonica SA EUR 29,050 241,115 0.06
1,053,365 0.28

243 Morgan Stanley Investment Funds 30 June 2016
The accompanying notes are an integral part of these financial statements.
Global Balanced Income Fund (continued)
SCHEDULE OF INVESTMENTSAs at 30 June 2016
Investments Currency
Quantity/Nominal
Value
Market Value EUR
% of Net Assets
Transferable securities and money market instruments admitted to official exchange listing or dealt in on another regulated market
Equities (continued)
SwedenAtlas Copco AB ‘A’ SEK 12,888 294,861 0.08Industrivarden AB ‘C’ SEK 16,302 233,840 0.06Investor AB ‘B’ SEK 12,971 381,608 0.10Swedish Match AB SEK 7,081 218,909 0.06
1,129,218 0.30
SwitzerlandABB Ltd. CHF 10,393 182,521 0.05Adecco Group AG CHF 5,213 235,202 0.06Cie Financiere Richemont SA CHF 3,120 162,681 0.04Givaudan SA CHF 70 126,164 0.03Kuehne + Nagel International AG CHF 2,804 349,855 0.09Nestle SA CHF 9,755 674,734 0.18Novartis AG CHF 7,810 571,195 0.15Pargesa Holding SA CHF 3,658 214,532 0.06Roche Holding AG CHF 2,302 538,539 0.14Schindler Holding AG CHF 1,062 171,121 0.05SGS SA CHF 69 141,681 0.04Syngenta AG CHF 338 116,660 0.03UBS Group AG CHF 17,355 202,284 0.06Zurich Insurance Group AG CHF 726 158,520 0.04
3,845,689 1.02
TaiwanAdvanced Semiconductor Engineering, Inc. TWD 52,000 53,137 0.01Asustek Computer, Inc. TWD 6,000 44,415 0.01China Steel Corp. TWD 93,000 54,193 0.01Chunghwa Telecom Co. Ltd. TWD 18,000 58,468 0.02Delta Electronics, Inc. TWD 38,000 165,282 0.04Far Eastern New Century Corp. TWD 282,120 188,783 0.05Formosa Chemicals & Fibre Corp. TWD 28,000 63,235 0.02Formosa Plastics Corp. TWD 83,000 180,043 0.05Fubon Financial Holding Co. Ltd. TWD 48,000 50,388 0.01Hon Hai Precision Industry Co. Ltd. TWD 181,700 417,952 0.11Largan Precision Co. Ltd. TWD 1,000 82,111 0.02Lite-On Technology Corp. TWD 143,000 175,830 0.05MediaTek, Inc. TWD 24,000 163,275 0.04Quanta Computer, Inc. TWD 102,000 173,479 0.05SinoPac Financial Holdings Co. Ltd. TWD 617,000 163,600 0.04Taishin Financial Holding Co. Ltd. TWD 525,000 181,509 0.05Taiwan Cement Corp. TWD 109,000 97,403 0.03Taiwan Semiconductor Manufacturing
Co. Ltd. TWD 253,000 1,146,282 0.30Uni-President Enterprises Corp. TWD 96,240 170,391 0.04Yuanta Financial Holding Co. Ltd. TWD 608,862 176,551 0.05
3,806,327 1.00
ThailandBTS Group Holdings PCL THB 33,400 8,212 0.00CP ALL PCL THB 154,300 198,562 0.05Kasikornbank PCL THB 43,800 193,490 0.05PTT PCL THB 9,200 73,744 0.02Siam Commercial Bank PCL (The) THB 56,600 201,477 0.06
675,485 0.18
SCHEDULE OF INVESTMENTSAs at 30 June 2016
Investments Currency
Quantity/Nominal
Value
Market Value EUR
% of Net Assets
Transferable securities and money market instruments admitted to official exchange listing or dealt in on another regulated market
Equities (continued)
TurkeyAkbank TAS TRY 37,315 95,192 0.02Haci Omer Sabanci Holding A/S TRY 34,383 100,473 0.03Turkiye Garanti Bankasi A/S TRY 43,151 102,006 0.03
297,671 0.08
United Arab EmiratesEmaar Properties PJSC AED 99,982 151,820 0.04
151,820 0.04
United KingdomAstraZeneca plc GBP 4,771 251,017 0.07Aviva plc GBP 41,084 190,902 0.05Barclays plc GBP 135,866 224,509 0.06BHP Billiton plc GBP 16,217 181,584 0.05BP plc GBP 82,900 428,446 0.11British American Tobacco plc GBP 7,815 447,210 0.12British Land Co. plc (The), REIT GBP 81 585 0.00BT Group plc GBP 44,906 219,626 0.06Bunzl plc GBP 8,264 226,762 0.06Compass Group plc GBP 9,694 164,171 0.04Diageo plc GBP 12,149 297,165 0.08Dixons Carphone plc GBP 34,109 133,918 0.04Experian plc (Jersey) (2) GBP 13,208 220,807 0.06GlaxoSmithKline plc GBP 18,148 342,990 0.09Hammerson plc, REIT GBP 45,190 282,415 0.07Imperial Brands plc GBP 4,911 236,388 0.06Lloyds Banking Group plc GBP 347,246 226,540 0.06Prudential plc GBP 16,503 245,670 0.07RELX plc GBP 10,822 176,297 0.05Rio Tinto plc GBP 8,111 221,240 0.06Royal Dutch Shell plc ‘A’ GBP 14,927 361,777 0.10Royal Dutch Shell plc ‘B’ GBP 14,629 356,323 0.09Severn Trent plc GBP 15,136 436,918 0.12Shire plc (Jersey) (2) GBP 4,216 230,760 0.06Smith & Nephew plc GBP 11,693 174,844 0.05St James’s Place plc GBP 13,324 125,063 0.03Standard Chartered plc GBP 19,578 131,677 0.03Vodafone Group plc GBP 104,673 280,324 0.07WPP plc (Jersey) (2) GBP 9,025 168,551 0.04
6,984,479 1.85
United States of America3M Co. USD 1,200 186,190 0.05Abbott Laboratories USD 3,000 104,359 0.03AbbVie, Inc. USD 2,100 116,029 0.03Accenture plc ‘A’ (Ireland) (2) USD 1,200 121,453 0.03Adobe Systems, Inc. USD 1,300 110,606 0.03Alexion Pharmaceuticals, Inc. USD 700 71,836 0.02Allergan plc (Ireland) (2) USD 600 123,061 0.03Alphabet, Inc. ‘C’ USD 700 431,433 0.11Altria Group, Inc. USD 3,100 189,323 0.05Amazon.com, Inc. USD 500 320,819 0.08Ameriprise Financial, Inc. USD 1,600 126,948 0.03Amgen, Inc. USD 900 121,426 0.03Amphenol Corp. ‘A’ USD 2,500 126,772 0.03

Morgan Stanley Investment Funds 30 June 2016 244
The accompanying notes are an integral part of these financial statements.
Global Balanced Income Fund (continued)
SCHEDULE OF INVESTMENTSAs at 30 June 2016
Investments Currency
Quantity/Nominal
Value
Market Value EUR
% of Net Assets
Transferable securities and money market instruments admitted to official exchange listing or dealt in on another regulated market
Equities (continued)
United States of America (continued)Anadarko Petroleum Corp. USD 1,400 65,652 0.02Apple, Inc. USD 6,200 527,171 0.14Applied Materials, Inc. USD 3,900 82,867 0.02AT&T, Inc. USD 6,500 249,267 0.07AutoZone, Inc. USD 200 141,495 0.04Bank of America Corp. USD 14,400 170,744 0.05Berkshire Hathaway, Inc. ‘B’ USD 2,200 281,620 0.07Biogen, Inc. USD 400 85,362 0.02Boeing Co. (The) USD 1,200 138,250 0.04Boston Properties, Inc., REIT USD 1,600 188,075 0.05Boston Scientific Corp. USD 4,400 91,472 0.02Bristol-Myers Squibb Co. USD 2,100 137,602 0.04Broadcom Ltd. (Singapore) (2) USD 700 97,635 0.03California Resources Corp. USD 14 158 0.00Caterpillar, Inc. USD 2,100 140,247 0.04Celgene Corp. USD 1,300 114,255 0.03Chevron Corp. USD 2,100 195,409 0.05Cigna Corp. USD 1,000 114,839 0.03Cisco Systems, Inc. USD 7,300 185,284 0.05Citigroup, Inc. USD 4,300 163,120 0.04Clorox Co. (The) USD 1,400 169,994 0.05CMS Energy Corp. USD 4,100 165,860 0.04Coca-Cola Co. (The) USD 4,900 196,945 0.05Comcast Corp. ‘A’ USD 3,400 196,603 0.05ConocoPhillips USD 2,500 97,469 0.03Costco Wholesale Corp. USD 800 112,763 0.03CVS Health Corp. USD 1,500 127,582 0.03Devon Energy Corp. USD 2,200 71,206 0.02Dow Chemical Co. (The) USD 2,000 88,788 0.02Dr Pepper Snapple Group, Inc. USD 2,000 170,415 0.05DTE Energy Co. USD 2,100 184,282 0.05EI du Pont de Nemours & Co. USD 1,400 80,274 0.02Eli Lilly & Co. USD 1,500 104,656 0.03EMC Corp. USD 3,700 90,267 0.02Emerson Electric Co. USD 2,700 123,458 0.03Entergy Corp. USD 2,400 171,250 0.05EOG Resources, Inc. USD 1,100 82,388 0.02Express Scripts Holding Co. USD 1,400 94,934 0.03Exxon Mobil Corp. USD 4,500 374,649 0.10Facebook, Inc. ‘A’ USD 2,700 277,495 0.07FedEx Corp. USD 800 107,294 0.03Fifth Third Bancorp USD 7,700 119,139 0.03Ford Motor Co. USD 9,800 108,523 0.03General Electric Co. USD 11,600 321,503 0.09Gilead Sciences, Inc. USD 1,600 117,779 0.03Goldman Sachs Group, Inc. (The) USD 1,100 144,630 0.04Halliburton Co. USD 2,300 92,319 0.02Home Depot, Inc. (The) USD 1,500 170,397 0.05Intel Corp. USD 5,800 167,900 0.04International Business Machines Corp. USD 1,100 147,371 0.04International Paper Co. USD 2,400 88,583 0.02Interval Leisure Group, Inc. USD 560 7,743 0.00J.P. Morgan Chase & Co. USD 4,000 220,719 0.06Johnson & Johnson USD 3,000 321,633 0.09Johnson Controls, Inc. USD 2,400 94,002 0.02Kellogg Co. USD 2,200 155,495 0.04KeyCorp USD 11,900 116,898 0.03Kinder Morgan, Inc. USD 4,100 67,753 0.02Level 3 Communications, Inc. USD 1,900 86,365 0.02Lincoln National Corp. USD 4,100 139,305 0.04Lowe’s Cos., Inc. USD 1,800 126,057 0.03
SCHEDULE OF INVESTMENTSAs at 30 June 2016
Investments Currency
Quantity/Nominal
Value
Market Value EUR
% of Net Assets
Transferable securities and money market instruments admitted to official exchange listing or dealt in on another regulated market
Equities (continued)
United States of America (continued)Martin Marietta Materials, Inc. USD 500 83,467 0.02MasterCard, Inc. ‘A’ USD 1,600 132,302 0.04McDonald’s Corp. USD 1,300 140,228 0.04McKesson Corp. USD 600 98,832 0.03Medtronic plc (Ireland) (2) USD 2,400 185,369 0.05Merck & Co., Inc. USD 3,200 164,053 0.04Microsoft Corp. USD 9,000 409,017 0.11Mondelez International, Inc. ‘A’ USD 2,700 104,780 0.03Monsanto Co. USD 1,100 101,931 0.03NIKE, Inc. ‘B’ USD 2,200 109,046 0.03Northrop Grumman Corp. USD 800 157,310 0.04NVIDIA Corp. USD 1,600 67,173 0.02Occidental Petroleum Corp. USD 1,600 107,977 0.03Oracle Corp. USD 3,800 138,957 0.04Parker-Hannifin Corp. USD 1,400 131,658 0.03PayPal Holdings, Inc. USD 1,900 60,984 0.02Pfizer, Inc. USD 6,600 207,742 0.05Philip Morris International, Inc. USD 2,100 187,304 0.05PPG Industries, Inc. USD 1,400 128,686 0.03PPL Corp. USD 4,600 153,935 0.04Priceline Group, Inc. (The) USD 100 112,807 0.03Procter & Gamble Co. (The) USD 3,000 226,395 0.06Public Storage, REIT USD 600 136,285 0.04QUALCOMM, Inc. USD 2,500 118,406 0.03Regions Financial Corp. USD 15,600 118,161 0.03salesforce.com, Inc. USD 1,500 106,869 0.03Schlumberger Ltd. (Curacao) (2) USD 1,600 112,813 0.03Spectra Energy Corp. USD 2,200 70,751 0.02Starbucks Corp. USD 2,500 127,537 0.03State Street Corp. USD 2,900 138,212 0.04Target Corp. USD 1,800 113,314 0.03Time Warner, Inc. USD 1,600 104,221 0.03TJX Cos., Inc. (The) USD 2,100 144,214 0.04Travelers Cos., Inc. (The) USD 1,800 190,162 0.05Union Pacific Corp. USD 1,600 123,033 0.03United Continental Holdings, Inc. USD 2,300 84,250 0.02United Technologies Corp. USD 1,400 127,439 0.03UnitedHealth Group, Inc. USD 1,300 164,237 0.04Verizon Communications, Inc. USD 4,800 237,487 0.06VF Corp. USD 1,800 98,109 0.03Visa, Inc. ‘A’ USD 2,400 165,291 0.04Vornado Realty Trust, REIT USD 2,000 177,791 0.05Walgreens Boots Alliance, Inc. USD 1,200 89,079 0.02Wal-Mart Stores, Inc. USD 1,800 117,605 0.03Walt Disney Co. (The) USD 2,200 192,206 0.05Waste Management, Inc. USD 2,500 146,630 0.04Wells Fargo & Co. USD 4,200 176,782 0.05Yahoo!, Inc. USD 2,400 80,076 0.02
17,894,378 4.73
Total Equities 100,780,835 26.61

245 Morgan Stanley Investment Funds 30 June 2016
The accompanying notes are an integral part of these financial statements.
Global Balanced Income Fund (continued)
SCHEDULE OF INVESTMENTSAs at 30 June 2016
Investments Currency
Quantity/Nominal
Value
Market Value EUR
% of Net Assets
Transferable securities and money market instruments admitted to official exchange listing or dealt in on another regulated market
Government Bonds
FranceFrance Government Bond OAT, Reg. S
0.25% 25/11/2016 EUR 8,450,000 8,477,251 2.24France Government Bond OAT, Reg. S
3.75% 25/04/2017 EUR 6,700,000 6,934,165 1.83France Government Bond OAT, Reg. S 1%
25/05/2019 EUR 2,900,000 3,026,664 0.80France Government Bond OAT, Reg. S
1.3% 25/07/2019 EUR 130,000 149,187 0.04France Government Bond OAT, Reg. S
2.25% 25/07/2020 EUR 3,100,000 4,307,306 1.14France Government Bond OAT, Reg. S
0.25% 25/11/2020 EUR 6,000,000 6,170,644 1.63France Government Bond OAT, Reg. S
0.1% 25/07/2021 EUR 10,000,000 10,680,407 2.82France Government Bond OAT, Reg. S
2.25% 25/10/2022 EUR 4,500,000 5,207,040 1.37France Government Bond OAT, Reg. S
0.5% 25/05/2025 EUR 4,700,000 4,873,085 1.29
49,825,749 13.16
GermanyBundesobligation, Reg. S 0.5%
07/04/2017 EUR 15,800,000 15,939,040 4.21Bundesobligation, Reg. S 0.25%
13/04/2018 EUR 10,850,000 11,026,530 2.91Bundesobligation, Reg. S 0.25%
16/10/2020 EUR 6,400,000 6,637,744 1.75Bundesrepublik Deutschland, Reg. S 3.75%
04/01/2017 EUR 280,000 286,272 0.08Bundesrepublik Deutschland, Reg. S 1.5%
04/09/2022 EUR 3,000,000 3,373,659 0.89Bundesrepublik Deutschland, Reg. S 1.5%
15/05/2024 EUR 2,065,000 2,369,319 0.63Bundesrepublik Deutschland, Reg. S 1%
15/08/2025 EUR 2,400,000 2,663,247 0.70
42,295,811 11.17
ItalyItaly Buoni Poliennali Del Tesoro 4.75%
01/05/2017 EUR 9,800,000 10,203,760 2.69Italy Buoni Poliennali Del Tesoro 0.25%
15/05/2018 EUR 7,000,000 7,042,336 1.86Italy Buoni Poliennali Del Tesoro 2.5%
01/05/2019 EUR 5,610,000 6,002,346 1.59Italy Buoni Poliennali Del Tesoro 1.45%
15/09/2022 EUR 6,400,000 6,716,141 1.77Italy Buoni Poliennali Del Tesoro 1.5%
01/06/2025 EUR 4,650,000 4,778,498 1.26
34,743,081 9.17
SCHEDULE OF INVESTMENTSAs at 30 June 2016
Investments Currency
Quantity/Nominal
Value
Market Value EUR
% of Net Assets
Transferable securities and money market instruments admitted to official exchange listing or dealt in on another regulated market
Government Bonds (continued)
SpainSpain Government Bond 2.1%
30/04/2017 EUR 11,500,000 11,723,100 3.10Spain Government Bond 1.15%
30/07/2020 EUR 5,800,000 6,057,738 1.60Spain Government Bond, Reg. S, 144A
4.1% 30/07/2018 EUR 525,000 571,342 0.15Spain Government Bond, Reg. S, 144A
5.4% 31/01/2023 EUR 5,000,000 6,561,224 1.73Spain Government Bond, Reg. S, 144A
2.15% 31/10/2025 EUR 4,450,000 4,836,160 1.28
29,749,564 7.86
United States of AmericaUS Treasury 0.875% 15/09/2016 USD 1,115,000 1,004,355 0.26US Treasury 0.875% 15/05/2017 USD 1,000,000 902,524 0.24US Treasury 0.625% 31/05/2017 USD 6,840,000 6,159,801 1.63US Treasury 0.875% 15/01/2018 USD 285,000 257,490 0.07US Treasury 1% 30/06/2019 USD 4,000,000 3,627,523 0.96US Treasury 1.375% 31/08/2020 USD 4,400,000 4,027,383 1.06US Treasury 2.25% 31/03/2021 USD 5,200,000 4,946,745 1.31
20,925,821 5.53
Total Government Bonds 177,540,026 46.89
Total Transferable securities and money market instruments admitted to official exchange listing or dealt in on another regulated market 278,320,861 73.50
Other transferable securities and money market instruments not admitted to official exchange listing or dealt in on another regulated market
Equities
ChinaHanergy Thin Film Power Group Ltd.
(Bermuda) (2) (3) HKD 18,000 230 0.00
230 0.00
Total Equities 230 0.00
Total Other transferable securities and money market instruments not admitted to official exchange listing or dealt in on another regulated market 230 0.00

Morgan Stanley Investment Funds 30 June 2016 246
The accompanying notes are an integral part of these financial statements.
Global Balanced Income Fund (continued)
Financial Futures Contracts
Security DescriptionNumber of Contracts Currency
Global Exposure
EUR
Unrealised Gain/(Loss)
EUR
% of Net Assets
EURO STOXX 50 Index, 16/09/2016 262 EUR 7,404,120 78,006 0.02MSCI Emerging Markets Mini Index, 16/09/2016 250 USD 9,299,324 189,126 0.05
Unrealised Gain on Financial Futures Contracts 267,132 0.07
Total Unrealised Gain on Financial Futures Contracts 267,132 0.07
Yen Denominated Nikkei 225 Index, 08/09/2016 (121) JPY (8,231,393) (258,968) (0.07)S&P 500 Emini Index, 16/09/2016 (72) USD (6,677,702) (163,528) (0.04)
Unrealised Loss on Financial Futures Contracts (422,496) (0.11)
Total Unrealised Loss on Financial Futures Contracts (422,496) (0.11)
Net Unrealised Loss on Financial Futures Contracts (155,364) (0.04)
Option Written Contracts
Quantity Security Description Currency Counterparty
Global Exposure
EUR
Market Value EUR
% of Net Assets
(685) EURO STOXX 50 Index, Put, 2,800.000, 15/07/2016 EUR Goldman Sachs 7,123,319 (331,540) (0.09)
(110) NIKKEI 225 Index, Put, 15,250.000, 08/07/2016 JPY Goldman Sachs 4,888,676 (110,718) (0.03)
(40) NIKKEI 225 Index, Put, 16,625.000, 08/07/2016 JPY Goldman Sachs 5,453,068 (371,102) (0.10)
(135) S&P 500 Emini Index, Put, 2,000.000, 22/07/2016 USD Goldman Sachs 1,751,527 (62,239) (0.01)
(155) S&P 500 Emini Index, Put, 2,100.000, 01/07/2016 USD Goldman Sachs 8,175,205 (237,037) (0.06)
Total Option Written Contracts (1,112,636) (0.29)
Forward Currency Exchange Contracts (continued)
Currency Purchased
Amount Purchased
Currency Sold
Amount Sold
Maturity Date Counterparty
Unrealised Gain/(Loss)
EUR
% of Net Assets
EUR 1,129,156 GBP 875,000 25/07/2016 HSBC 72,118 0.02EUR 1,231,986 SEK 11,500,000 25/07/2016 UBS 12,604 0.00JPY 306,000,000 EUR 2,591,510 25/07/2016 J.P. Morgan 86,543 0.02JPY 265,800,000 EUR 2,245,936 25/07/2016 State Street 80,294 0.02USD 9,340,000 EUR 8,259,858 25/07/2016 J.P. Morgan 135,591 0.04
Unrealised Gain on Forward Currency Exchange Contracts 387,150 0.10
GBP Hedged Share ClassGBP 37,595 EUR 45,360 08/07/2016 J.P. Morgan 79 0.00
USD Hedged Share ClassEUR 7,744,094 USD 8,558,310 01/07/2016 J.P. Morgan 45,280 0.01USD 8,523,310 EUR 7,565,919 01/07/2016 J.P. Morgan 101,411 0.03
Unrealised Gain on NAV Hedged Share Classes Forward Currency Exchange Contracts 146,770 0.04
Total Unrealised Gain on Forward Currency Exchange Contracts 533,920 0.14
SCHEDULE OF INVESTMENTSAs at 30 June 2016
Investments Currency
Quantity/Nominal
Value
Market Value EUR
% of Net Assets
Units of authorised UCITS or other collective investment undertakings
Collective Investment Schemes – UCITS
LuxembourgMorgan Stanley Investment Funds Global
Fixed Income Opportunities Fund – Class Z (4) USD 202,886 5,795,309 1.53
Morgan Stanley Investment Funds Global Infrastructure Fund – Class Z (4) USD 201,115 9,689,186 2.56
Morgan Stanley Investment Funds Global Property Fund – Class Z (4) USD 237,487 7,643,597 2.02
Morgan Stanley Investment Funds Indian Equity Fund – Class Z (4) USD 268,836 9,724,902 2.57
32,852,994 8.68
Total Collective Investment Schemes – UCITS 32,852,994 8.68
Exchange Traded Funds
IrelandiShares MSCI Japan SmallCap UCITS Fund
– DIST EUR 128,216 3,754,164 0.99
3,754,164 0.99
ItalyETFS Copper (Jersey) (2) EUR 200,812 3,910,814 1.03
3,910,814 1.03
Total Exchange Traded Funds 7,664,978 2.02
Total Units of authorised UCITS or other collective investment undertakings 40,517,972 10.70
Total Investments 318,839,063 84.20
Cash 58,041,051 15.33
Other Assets/(Liabilities) 1,768,776 0.47
Total Net Assets 378,648,890 100.00
(2) The country in brackets represents the country of incorporation of this security.(3) Security is valued at its fair value under the direction of the Board of Directors of the SICAV.(4) Affiliate managed by an affiliate of the Investment Adviser.
DERIVATIVES
Over-the-counter (OTC) and exchange traded derivatives as at 30 June 2016, expressed in Euro.

247 Morgan Stanley Investment Funds 30 June 2016
The accompanying notes are an integral part of these financial statements.
Global Balanced Income Fund (continued)
Forward Currency Exchange Contracts (continued)
Currency Purchased
Amount Purchased
Currency Sold
Amount Sold
Maturity Date Counterparty
Unrealised Gain/(Loss)
EUR
% of Net Assets
CHF 1,098,600 EUR 1,016,235 25/07/2016 J.P. Morgan (1,751) 0.00EUR 2,107,957 CHF 2,290,000 25/07/2016 UBS (6,707) 0.00EUR 9,217,871 HKD 81,080,000 25/07/2016 Commonwealth
Bank of Australia (178,218) (0.05)EUR 18,021,283 USD 20,435,000 25/07/2016 J.P. Morgan (347,132) (0.09)EUR 3,959,529 USD 4,515,000 25/07/2016 State Street (98,870) (0.03)GBP 578,700 EUR 751,811 25/07/2016 J.P. Morgan (52,717) (0.01)JPY 75,000,000 EUR 661,063 25/07/2016 State Street (4,677) 0.00
Unrealised Loss on Forward Currency Exchange Contracts (690,072) (0.18)
GBP Hedged Share ClassEUR 45,935 GBP 38,062 01/07/2016 J.P. Morgan (74) 0.00GBP 38,062 EUR 49,554 01/07/2016 J.P. Morgan (3,544) 0.00
USD Hedged Share ClassUSD 35,000 EUR 31,617 01/07/2016 J.P. Morgan (132) 0.00USD 7,486,874 EUR 6,774,103 08/07/2016 J.P. Morgan (40,046) (0.01)
Unrealised Loss on NAV Hedged Share Classes Forward Currency Exchange Contracts (43,796) (0.01)
Total Unrealised Loss on Forward Currency Exchange Contracts (733,868) (0.19)
Net Unrealised Loss on Forward Currency Exchange Contracts (199,948) (0.05)
Credit Default Swap Contracts
Nominal Amount Ccy Counterparty
Reference Entity
Buy/Sell
Interest (Paid)/
ReceivedMaturity
Date
Market Value EUR
Unrealised Gain/(Loss)
EUR
% of Net Assets
3,500,000 USD Goldman Sachs CDX.NA.HY.25-V2 Sell 5.00% 20/12/2020 120,929 120,929 0.035,000,000 EUR Goldman Sachs iTraxx Europe Crossover
Series 23 Version 3 Sell 5.00% 20/06/2020 230,039 230,039 0.07400,000 EUR Barclays iTraxx Europe Crossover
Series 23 Version 3 Sell 5.00% 20/06/2020 18,403 18,403 0.008,600,000 EUR Barclays iTraxx Europe Crossover
Series 24 Version 1 Sell 5.00% 20/12/2020 364,306 364,306 0.101,300,000 EUR Goldman Sachs iTraxx Europe Crossover
Series 24 Version 1 Sell 5.00% 20/12/2020 55,070 55,070 0.022,000,000 EUR Goldman Sachs iTraxx Europe Crossover
Series 25 Version 1 Sell 5.00% 20/06/2021 112,048 112,048 0.0226,200,000 EUR Goldman Sachs iTraxx Europe Series 23
Version 1 Sell 1.00% 20/06/2020 219,037 219,037 0.0420,500,000 EUR Barclays iTraxx Europe Series 24
Version 1 Sell 1.00% 20/12/2020 144,745 144,745 0.0519,500,000 EUR Goldman Sachs iTraxx Europe Series 24
Version 1 Sell 1.00% 20/12/2020 137,685 137,685 0.045,800,000 EUR Goldman Sachs iTraxx Europe Series 25
Version 1 Sell 1.00% 20/06/2021 41,900 41,900 0.01
Total Unrealised Gain on Credit Default Swap Contracts 1,444,162 1,444,162 0.38
Net Unrealised Gain on Credit Default Swap Contracts 1,444,162 1,444,162 0.38
Collateral received and paid by the Fund in respect of financial derivative instruments:
Type of Collateral Counterparty CurrencyCollateral Amount
receivedCollateral Amount
paid
Global Balanced Income Fund
Cash Barclays EUR 244,000 -Cash Goldman Sachs EUR 6,896,726 862,312
7,140,726 862,312
DERIVATIVES (continued)
Over-the-counter (OTC) and exchange traded derivatives as at 30 June 2016, expressed in Euro.
DERIVATIVES (continued)

Morgan Stanley Investment Funds 30 June 2016 248
The accompanying notes are an integral part of these financial statements.
Please refer to the full prospectus for the Fund’s investment objective and policy.
INVESTMENT AIM
To provide an attractive level of total return, measured in Euro, by investing primarily in UCIs (including the Company’s Funds), ETFs, futures, investment funds managed by the investment adviser or its affiliates and other collective investment schemes.
SCHEDULE OF INVESTMENTSAs at 30 June 2016
Investments Currency
Quantity/Nominal
Value
Market Value EUR
% of Net Assets
Units of authorised UCITS or other collective investment undertakings
Collective Investment Schemes – UCITS – Bond Funds
LuxembourgMorgan Stanley Investment Funds
Emerging Markets Corporate Debt Fund – Class Z (4) USD 1,494,413 45,518,633 2.05
Morgan Stanley Investment Funds Euro Corporate Bond Fund – Class Z (4) EUR 5,578,911 228,952,561 10.29
Morgan Stanley Investment Funds Euro Corporate Bond Fund – Class ZD (4) EUR 3,898,252 110,017,294 4.94
Morgan Stanley Investment Funds Euro Strategic Bond Fund – Class Z (4) EUR 4,354,490 175,464,859 7.89
Morgan Stanley Investment Funds European Currencies High Yield Bond Fund – Class Z (4) EUR 1,982,304 100,121,786 4.5
Morgan Stanley Investment Funds Global Fixed Income Opportunities Fund – Class Z (4) USD 2,396,847 68,464,534 3.08
Morgan Stanley Investment Funds Global High Yield Bond Fund – Class Z (4) USD 1,429,228 45,016,205 2.02
Morgan Stanley Investment Funds Short Maturity Euro Bond Fund – Class Z (4) EUR 6,517,896 199,083,031 8.95
972,638,903 43.72
Total Collective Investment Schemes – UCITS – Bond Funds 972,638,903 43.72
Collective Investment Schemes – UCITS – Equity Funds
IrelandFirst State Asian Growth Fund – Class III
(Accumulation) USD USD 1,083,163 46,244,222 2.08First State Asian Growth Fund – Class VI
(Accumulation) USD USD 1,173,917 10,908,712 0.49
57,152,934 2.57
LuxembourgMorgan Stanley Investment Funds
Emerging Markets Equity Fund – Class Z (4) USD 2,561,599 50,797,894 2.28
Morgan Stanley Investment Funds European Equity Alpha Fund – Class Z (4) EUR 1,467,998 54,580,396 2.45
Morgan Stanley Investment Funds Eurozone Equity Alpha Fund – Class Z (4) EUR 2,815,166 102,357,607 4.6
Morgan Stanley Investment Funds Global Infrastructure Fund – Class Z (4) USD 1,195,483 57,595,357 2.59
Morgan Stanley Investment Funds Global Property Fund – Class Z (4) USD 1,260,745 40,577,539 1.82
Morgan Stanley Investment Funds Indian Equity Fund – Class Z (4) USD 1,614,441 58,400,976 2.62
Morgan Stanley Investment Funds Japanese Equity Fund – Class Z (4) JPY 3,865,431 112,097,529 5.04
Morgan Stanley Investment Funds Latin American Equity Fund – Class Z (4) USD 1,133,551 35,994,931 1.62
Morgan Stanley Investment Funds US Advantage Fund – Class ZH (4) EUR 1,599,148 109,797,494 4.93
Morgan Stanley Investment Funds US Growth Fund – Class ZH (4) EUR 2,565,209 121,077,868 5.44
743,277,591 33.39
Total Collective Investment Schemes – UCITS – Equity Funds 800,430,525 35.96
Global Balanced Risk Control Fund of Funds

249 Morgan Stanley Investment Funds 30 June 2016
The accompanying notes are an integral part of these financial statements.
Global Balanced Risk Control Fund of Funds (continued)
SCHEDULE OF INVESTMENTSAs at 30 June 2016
Investments Currency
Quantity/Nominal
Value
Market Value EUR
% of Net Assets
Units of authorised UCITS or other collective investment undertakings
Collective Investment Schemes – UCITS – Liquidity Funds
LuxembourgMorgan Stanley Liquidity Funds Euro
Liquidity Fund – MS Reserve (4) EUR 58,061,359 58,061,359 2.61
58,061,359 2.61
Total Collective Investment Schemes – UCITS – Liquidity Funds 58,061,359 2.61
Exchange Traded Funds
Irelandishares Core MSCI Japan IMI Fund EUR 1,542,503 44,694,024 2.01iShares Euro Inflation Linked Government
Bond Fund EUR 444,521 91,571,326 4.12iShares MSCI Emerging Markets UCITS
Fund – DIST EUR 1,165,194 33,790,626 1.52iShares MSCI Europe Fund –
(Accumulation) EUR 1,634,300 66,074,749 2.97iShares MSCI Japan SmallCap UCITS Fund
– DIST EUR 792,302 23,198,603 1.04
259,329,328 11.66
ItalyETFS Copper (Jersey) (2) EUR 1,169,532 22,776,636 1.02
22,776,636 1.02
Total Exchange Traded Funds 282,105,964 12.68
Total Units of authorised UCITS or other collective investment undertakings 2,113,236,751 94.97
Transferable securities and money market instruments admitted to official exchange listing or dealt in on another regulated market
Equities
IrelandSource Physical Gold P-ETC USD 383,738 44,672,319 2.01
44,672,319 2.01
Total Equities 44,672,319 2.01
Total Transferable securities and money market instruments admitted to official exchange listing or dealt in on another regulated market 44,672,319 2.01
Total Investments 2,157,909,070 96.98
Cash 63,800,347 2.87
Other Assets/(Liabilities) 3,354,716 0.15
Total Net Assets 2,225,064,133 100.00
(2) The country in brackets represents the country of incorporation of this security. (4) Affiliate managed by an affiliate of the Investment Adviser.
Financial Futures Contracts
Security DescriptionNumber of Contracts Currency
Global Exposure
EUR
Unrealised Gain/(Loss)
EUR
% of Net Assets
EURO STOXX 50 Index, 16/09/2016 94 EUR 2,656,440 9,847 0.00
Unrealised Gain on Financial Futures Contracts 9,847 0.00
Total Unrealised Gain on Financial Futures Contracts 9,847 0.00
Yen Denominated Nikkei 225 Index, 08/09/2016 (347) JPY (23,605,731) (781,036) (0.03)S&P 500 Emini Index, 16/09/2016 (720) USD (66,777,017) (1,987,978) (0.09)
Unrealised Loss on Financial Futures Contracts (2,769,014) (0.12)
Total Unrealised Loss on Financial Futures Contracts (2,769,014) (0.12)
Net Unrealised Loss on Financial Futures Contracts (2,759,167) (0.12)
Option Purchased Contracts
Quantity Security Description Currency Counterparty
Market Value EUR
% of Net Assets
4,438 EURO STOXX 50 Index, Call, 3,050.000, 15/07/2016 EUR Goldman Sachs 124,264 0.01
363 NIKKEI 225 Index, Call, 16,500.000, 08/07/2016 JPY Goldman Sachs 38,125 0.00
295 NIKKEI 225 Index, Call, 16,750.000, 08/07/2016 JPY Goldman Sachs 20,656 0.00
Total Option Purchased Contracts 183,045 0.01
Forward Currency Exchange Contracts
Currency Purchased
Amount Purchased
Currency Sold
Amount Sold
Maturity Date Counterparty
Unrealised Gain/(Loss)
EUR
% of Net Assets
COP Hedged Share ClassCOP 14,701,494,241 EUR 4,405,602 29/07/2016 J.P. Morgan 82,949 0.00
USD Hedged Share ClassEUR 162,905,582 USD 179,995,011 01/07/2016 J.P. Morgan 987,139 0.05USD 179,915,011 EUR 159,705,083 01/07/2016 J.P. Morgan 2,141,394 0.09EUR 2,835,528 USD 3,136,718 08/07/2016 J.P. Morgan 14,212 0.00
Unrealised Gain on NAV Hedged Share Classes Forward Currency Exchange Contracts 3,225,694 0.14
Total Unrealised Gain on Forward Currency Exchange Contracts 3,225,694 0.14
USD Hedged Share ClassUSD 80,000 EUR 72,504 01/07/2016 J.P. Morgan (538) 0.00EUR 732,333 USD 814,486 08/07/2016 J.P. Morgan (255) 0.00USD 177,362,444 EUR 160,477,003 08/07/2016 J.P. Morgan (948,640) (0.04)
Unrealised Loss on NAV Hedged Share Classes Forward Currency Exchange Contracts (949,433) (0.04)
Total Unrealised Loss on Forward Currency Exchange Contracts (949,433) (0.04)
Net Unrealised Gain on Forward Currency Exchange Contracts 2,276,261 0.10
DERIVATIVES
Over-the-counter (OTC) and exchange traded derivatives as at 30 June 2016, expressed in Euro.

Morgan Stanley Investment Funds 30 June 2016 250
The accompanying notes are an integral part of these financial statements.
Global Balanced Risk Control Fund of Funds (continued)
Collateral received and paid by the Fund in respect of financial derivative instruments:
Type of Collateral Counterparty CurrencyCollateral Amount
receivedCollateral Amount
paid
Global Balanced Risk Control Fund of Funds
Cash Goldman Sachs EUR 15,117,295 1,012,989
15,117,295 1,012,989
DERIVATIVES (continued)
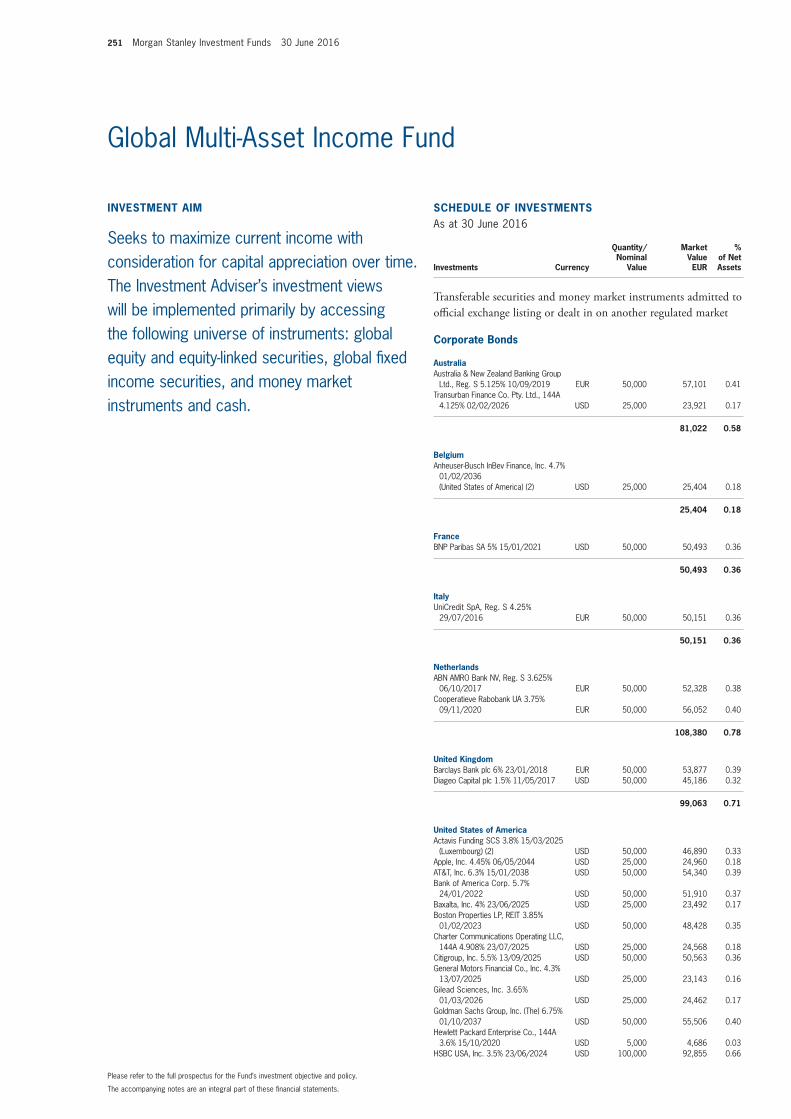
251 Morgan Stanley Investment Funds 30 June 2016
The accompanying notes are an integral part of these financial statements.
Please refer to the full prospectus for the Fund’s investment objective and policy.
Global Multi-Asset Income Fund
SCHEDULE OF INVESTMENTSAs at 30 June 2016
Investments Currency
Quantity/Nominal
Value
Market Value EUR
% of Net Assets
Transferable securities and money market instruments admitted to official exchange listing or dealt in on another regulated market
Corporate Bonds
AustraliaAustralia & New Zealand Banking Group
Ltd., Reg. S 5.125% 10/09/2019 EUR 50,000 57,101 0.41Transurban Finance Co. Pty. Ltd., 144A
4.125% 02/02/2026 USD 25,000 23,921 0.17
81,022 0.58
BelgiumAnheuser-Busch InBev Finance, Inc. 4.7%
01/02/2036 (United States of America) (2) USD 25,000 25,404 0.18
25,404 0.18
FranceBNP Paribas SA 5% 15/01/2021 USD 50,000 50,493 0.36
50,493 0.36
ItalyUniCredit SpA, Reg. S 4.25%
29/07/2016 EUR 50,000 50,151 0.36
50,151 0.36
NetherlandsABN AMRO Bank NV, Reg. S 3.625%
06/10/2017 EUR 50,000 52,328 0.38Cooperatieve Rabobank UA 3.75%
09/11/2020 EUR 50,000 56,052 0.40
108,380 0.78
United KingdomBarclays Bank plc 6% 23/01/2018 EUR 50,000 53,877 0.39Diageo Capital plc 1.5% 11/05/2017 USD 50,000 45,186 0.32
99,063 0.71
United States of AmericaActavis Funding SCS 3.8% 15/03/2025
(Luxembourg) (2) USD 50,000 46,890 0.33Apple, Inc. 4.45% 06/05/2044 USD 25,000 24,960 0.18AT&T, Inc. 6.3% 15/01/2038 USD 50,000 54,340 0.39Bank of America Corp. 5.7%
24/01/2022 USD 50,000 51,910 0.37Baxalta, Inc. 4% 23/06/2025 USD 25,000 23,492 0.17Boston Properties LP, REIT 3.85%
01/02/2023 USD 50,000 48,428 0.35Charter Communications Operating LLC,
144A 4.908% 23/07/2025 USD 25,000 24,568 0.18Citigroup, Inc. 5.5% 13/09/2025 USD 50,000 50,563 0.36General Motors Financial Co., Inc. 4.3%
13/07/2025 USD 25,000 23,143 0.16Gilead Sciences, Inc. 3.65%
01/03/2026 USD 25,000 24,462 0.17Goldman Sachs Group, Inc. (The) 6.75%
01/10/2037 USD 50,000 55,506 0.40Hewlett Packard Enterprise Co., 144A
3.6% 15/10/2020 USD 5,000 4,686 0.03HSBC USA, Inc. 3.5% 23/06/2024 USD 100,000 92,855 0.66
INVESTMENT AIM
Seeks to maximize current income with consideration for capital appreciation over time.The Investment Adviser’s investment views will be implemented primarily by accessing the following universe of instruments: global equity and equity-linked securities, global fixed income securities, and money market instruments and cash.

Morgan Stanley Investment Funds 30 June 2016 252
The accompanying notes are an integral part of these financial statements.
Global Multi-Asset Income Fund (continued)
SCHEDULE OF INVESTMENTSAs at 30 June 2016
Investments Currency
Quantity/Nominal
Value
Market Value EUR
% of Net Assets
Transferable securities and money market instruments admitted to official exchange listing or dealt in on another regulated market
Corporate Bonds (continued)
United States of America (continued)J.P. Morgan Chase & Co. 2.7%
18/05/2023 USD 50,000 45,384 0.32McDonald’s Corp. 3.375% 26/05/2025 USD 50,000 47,811 0.34Merck & Co., Inc. 2.8% 18/05/2023 USD 50,000 47,240 0.34Monongahela Power Co., 144A 5.4%
15/12/2043 USD 50,000 56,756 0.41MPLX LP 4% 15/02/2025 USD 50,000 41,331 0.30NBCUniversal Media LLC 4.375%
01/04/2021 USD 50,000 50,407 0.36Omnicom Group, Inc. 3.625%
01/05/2022 USD 50,000 47,801 0.34Prudential Financial, Inc. 6.625%
01/12/2037 USD 50,000 58,226 0.42UnitedHealth Group, Inc. 2.875%
15/03/2023 USD 25,000 23,442 0.17Verizon Communications, Inc. 3.5%
01/11/2024 USD 25,000 23,952 0.17Visa, Inc. 3.15% 14/12/2025 USD 25,000 24,041 0.17Wal-Mart Stores, Inc. 2.55%
11/04/2023 USD 25,000 23,509 0.17Wells Fargo & Co. 3.45% 13/02/2023 USD 50,000 46,592 0.33
1,062,295 7.59
Total Corporate Bonds 1,476,808 10.56
Equities
AustraliaAnsell Ltd. AUD 236 2,868 0.02APA Group Stapled Security AUD 748 4,623 0.03ARB Corp. Ltd. AUD 654 7,324 0.05AusNet Services AUD 1,214 1,332 0.01Automotive Holdings Group Ltd. AUD 1,822 4,583 0.03BlueScope Steel Ltd. AUD 1,619 6,899 0.05BWP Trust, REIT AUD 2,620 6,380 0.05Challenger Ltd. AUD 1,252 7,228 0.05Downer EDI Ltd. AUD 1,463 3,719 0.03DUET Group Stapled Security AUD 4,056 6,783 0.05Goodman Group, REIT AUD 954 4,537 0.03GPT Group (The), REIT AUD 1,284 4,647 0.03GrainCorp Ltd. ‘A’ AUD 720 4,156 0.03InvoCare Ltd. AUD 501 4,404 0.03IOOF Holdings Ltd. AUD 1,871 9,800 0.07JB Hi-Fi Ltd. AUD 348 5,610 0.04Macquarie Atlas Roads Group Stapled
Security AUD 284 984 0.01Oil Search Ltd. AUD 777 3,467 0.03Perpetual Ltd. AUD 326 8,967 0.06Primary Health Care Ltd. AUD 1,131 2,988 0.02Scentre Group, REIT AUD 2,178 7,168 0.05Shopping Centres Australasia Property
Group, REIT AUD 4,362 6,653 0.05Sims Metal Management Ltd. AUD 540 2,825 0.02Spark Infrastructure Group Stapled
Security AUD 3,836 6,261 0.05Stockland, REIT AUD 1,485 4,679 0.03Sydney Airport Stapled Security AUD 742 3,445 0.02Transurban Group Stapled Security AUD 1,314 10,539 0.08Westfield Corp., REIT AUD 768 5,471 0.04
148,340 1.06
SCHEDULE OF INVESTMENTSAs at 30 June 2016
Investments Currency
Quantity/Nominal
Value
Market Value EUR
% of Net Assets
Transferable securities and money market instruments admitted to official exchange listing or dealt in on another regulated market
Equities (continued)
BelgiumAnheuser-Busch InBev SA NV EUR 300 34,950 0.25Cofinimmo SA, REIT EUR 48 5,107 0.03Elia System Operator SA NV EUR 24 1,202 0.01KBC Groep NV EUR 158 6,892 0.05
48,151 0.34
BrazilCia de Saneamento Basico do Estado
de Sao Paulo, ADR USD 200 1,608 0.01
1,608 0.01
CanadaCominar Real Estate Investment Trust CAD 400 4,672 0.03Enbridge, Inc. CAD 600 22,575 0.16Fortis, Inc. CAD 200 5,974 0.04Inter Pipeline Ltd. CAD 200 3,765 0.03Keyera Corp. CAD 100 2,697 0.02RioCan Real Estate Investment Trust CAD 200 4,013 0.03Veresen, Inc. CAD 200 1,484 0.01
45,180 0.32
ChinaBeijing Enterprises Holdings Ltd.
(Hong Kong) (2) HKD 500 2,539 0.02China Gas Holdings Ltd. (Bermuda) (2) HKD 2,000 2,741 0.02Global Logistic Properties Ltd.
(Singapore) (2) SGD 1,900 2,289 0.02Hutchison Port Holdings Trust
(Singapore) (2) SGD 3,900 1,588 0.01
9,157 0.07
DenmarkDSV A/S DKK 113 4,233 0.03ISS A/S DKK 157 5,318 0.04
9,551 0.07
FinlandKone OYJ ‘B’ EUR 177 7,234 0.05Nokia OYJ EUR 1,509 7,605 0.06Sampo OYJ ‘A’ EUR 241 8,702 0.06UPM-Kymmene OYJ EUR 341 5,569 0.04
29,110 0.21
FranceAccor SA EUR 478 16,498 0.12Aeroports de Paris EUR 38 3,734 0.03Air Liquide SA EUR 156 14,500 0.10Airbus Group SE (Netherlands) (2) EUR 221 11,439 0.08Alcatel-Lucent SA EUR 1,304 4,538 0.03Atos SE EUR 118 8,803 0.06AXA SA EUR 682 11,983 0.09BNP Paribas SA EUR 389 15,332 0.11Bouygues SA EUR 329 8,483 0.06Capgemini SA EUR 285 22,213 0.16Carrefour SA EUR 267 5,871 0.04

253 Morgan Stanley Investment Funds 30 June 2016
The accompanying notes are an integral part of these financial statements.
Global Multi-Asset Income Fund (continued)
SCHEDULE OF INVESTMENTSAs at 30 June 2016
Investments Currency
Quantity/Nominal
Value
Market Value EUR
% of Net Assets
Transferable securities and money market instruments admitted to official exchange listing or dealt in on another regulated market
Equities (continued)
France (continued)Cie de Saint-Gobain EUR 886 30,177 0.22Cie Generale des Etablissements Michelin EUR 84 7,169 0.05Credit Agricole SA EUR 480 3,613 0.03Danone SA EUR 247 15,346 0.11Engie SA EUR 572 8,240 0.06Essilor International SA EUR 98 11,628 0.08Eutelsat Communications SA EUR 113 1,917 0.01Gecina SA, REIT EUR 33 4,039 0.03Groupe Eurotunnel SE EUR 693 6,529 0.05Kering EUR 33 4,772 0.03Klepierre, REIT EUR 85 3,393 0.02Legrand SA EUR 163 7,487 0.05L’Oreal SA EUR 91 15,502 0.11LVMH Moet Hennessy Louis Vuitton SE EUR 98 13,294 0.10Metropole Television SA EUR 55 824 0.01Orange SA EUR 741 10,752 0.08Pernod Ricard SA EUR 98 9,760 0.07Peugeot SA EUR 1,432 15,523 0.11Publicis Groupe SA EUR 111 6,723 0.05Renault SA EUR 84 5,716 0.04Rexel SA EUR 295 3,292 0.02Safran SA EUR 163 9,930 0.07Sanofi EUR 416 30,792 0.22Schneider Electric SE EUR 214 11,207 0.08SES SA (Luxembourg) (2) EUR 489 9,482 0.07Societe Generale SA EUR 286 8,005 0.06Sodexo SA EUR 91 8,756 0.06Television Francaise 1 EUR 179 1,706 0.01TOTAL SA EUR 760 32,726 0.23Unibail-Rodamco SE, REIT EUR 82 19,192 0.14Valeo SA EUR 156 6,253 0.05Vinci SA EUR 704 44,584 0.32Vivendi SA EUR 506 8,544 0.06
500,267 3.58
Germanyadidas AG EUR 81 10,307 0.07Allianz SE EUR 135 17,044 0.12BASF SE EUR 269 18,324 0.13Bayer AG EUR 237 21,067 0.15Bayerische Motoren Werke AG EUR 98 6,399 0.05Commerzbank AG EUR 459 2,658 0.02Continental AG EUR 38 6,403 0.05Daimler AG EUR 269 14,273 0.10Deutsche Bank AG EUR 452 5,537 0.04Deutsche Boerse AG EUR 295 21,470 0.15Deutsche EuroShop AG EUR 82 3,347 0.02Deutsche Post AG EUR 329 8,243 0.06Deutsche Telekom AG EUR 932 14,101 0.10Deutsche Wohnen AG EUR 147 4,470 0.03E.ON SE EUR 662 5,920 0.04Fraport AG Frankfurt Airport Services
Worldwide EUR 67 3,204 0.02Fresenius Medical Care AG & Co. KGaA EUR 75 5,824 0.04Fresenius SE & Co. KGaA EUR 119 7,729 0.06Hamburger Hafen und Logistik AG EUR 16 213 0.00HeidelbergCement AG EUR 81 5,432 0.04Henkel AG & Co. KGaA EUR 48 4,619 0.03Henkel AG & Co. KGaA Preference EUR 65 7,056 0.05Infineon Technologies AG EUR 512 6,620 0.05Johnson Electric Holdings Ltd.
(Bermuda) (2) HKD 1,750 3,510 0.03Linde AG EUR 59 7,316 0.05
SCHEDULE OF INVESTMENTSAs at 30 June 2016
Investments Currency
Quantity/Nominal
Value
Market Value EUR
% of Net Assets
Transferable securities and money market instruments admitted to official exchange listing or dealt in on another regulated market
Equities (continued)
Germany (continued)Merck KGaA EUR 70 6,311 0.05Muenchener Rueckversicherungs-
Gesellschaft AG EUR 58 8,613 0.06Porsche Automobil Holding SE Preference EUR 77 3,167 0.02ProSiebenSat.1 Media SE EUR 290 11,242 0.08RWE AG EUR 221 3,119 0.02SAP SE EUR 269 17,983 0.13Siemens AG EUR 238 21,641 0.16Stroeer SE & Co. KGaA EUR 30 1,230 0.01ThyssenKrupp AG EUR 237 4,245 0.03Volkswagen AG Preference EUR 50 5,365 0.04Vonovia SE EUR 263 8,620 0.06
302,622 2.16
Hong KongBeijing Enterprises Water Group Ltd.
(Bermuda) (2) HKD 2,000 1,081 0.01Champion REIT HKD 9,000 4,570 0.03Great Eagle Holdings Ltd. (Bermuda) (2) HKD 3,000 10,730 0.08G-Resources Group Ltd. (Bermuda) (2) HKD 3,990 68 0.00Hang Lung Group Ltd. HKD 1,000 2,696 0.02Hang Lung Properties Ltd. HKD 1,000 1,811 0.01Hong Kong & China Gas Co. Ltd. HKD 5,500 9,017 0.07Hongkong & Shanghai Hotels Ltd. (The) HKD 3,562 3,246 0.02Hongkong Land Holdings Ltd.
(Bermuda) (2) USD 400 2,191 0.02Hopewell Holdings Ltd. HKD 1,500 4,269 0.03HSBC Holdings plc (United Kingdom) (2) HKD 1,600 8,784 0.06Kowloon Development Co. Ltd. HKD 7,000 6,006 0.04Link REIT HKD 1,000 6,122 0.04New World Development Co. Ltd. HKD 4,235 3,854 0.03Stella International Holdings Ltd.
(Cayman Islands) (2) HKD 1,500 2,386 0.02
66,831 0.48
IrelandBank of Ireland EUR 12,012 2,222 0.02CRH plc GBP 610 15,684 0.11CRH plc EUR 324 8,329 0.06Kerry Group plc ‘A’ EUR 59 4,665 0.03
30,900 0.22
ItalyAssicurazioni Generali SpA EUR 519 5,346 0.04Atlantia SpA EUR 1,212 26,797 0.19Enel SpA EUR 2,739 10,737 0.08Eni SpA EUR 1,019 14,531 0.10Ferrari NV (Netherlands) (2) EUR 38 1,374 0.01Intesa Sanpaolo SpA EUR 4,954 8,144 0.06Luxottica Group SpA EUR 104 4,522 0.03Mediaset SpA EUR 3,707 11,610 0.08Mediobanca SpA EUR 2,007 10,135 0.07Rizzoli Corriere Della Sera Mediagroup SpA EUR 31 25 0.00Snam SpA EUR 2,832 14,996 0.11Societa Iniziative Autostradali e Servizi SpA EUR 47 363 0.00Telecom Italia SpA EUR 5,201 3,823 0.03Terna Rete Elettrica Nazionale SpA EUR 972 4,761 0.03UniCredit SpA EUR 1,805 3,462 0.03
120,626 0.86

Morgan Stanley Investment Funds 30 June 2016 254
The accompanying notes are an integral part of these financial statements.
Global Multi-Asset Income Fund (continued)
SCHEDULE OF INVESTMENTSAs at 30 June 2016
Investments Currency
Quantity/Nominal
Value
Market Value EUR
% of Net Assets
Transferable securities and money market instruments admitted to official exchange listing or dealt in on another regulated market
Equities (continued)
JapanJapan Real Estate Investment Corp., REIT JPY 1 5,549 0.04Japan Retail Fund Investment Corp., REIT JPY 2 4,588 0.03Nippon Building Fund, Inc., REIT JPY 1 5,540 0.04Tokyo Gas Co. Ltd. JPY 1,000 3,680 0.03United Urban Investment Corp., REIT JPY 2 3,240 0.02
22,597 0.16
MexicoEmpresas ICA SAB de CV, ADR USD 100 57 0.00
57 0.00
NetherlandsAegon NV EUR 922 3,248 0.02Akzo Nobel NV EUR 143 7,989 0.06ArcelorMittal (Luxembourg) (2) EUR 625 2,564 0.02ASML Holding NV EUR 123 10,777 0.08Fiat Chrysler Automobiles NV EUR 382 2,074 0.01Heineken NV EUR 117 9,681 0.07ING Groep NV, CVA EUR 1,383 12,652 0.09Koninklijke Ahold NV EUR 513 10,152 0.07Koninklijke KPN NV EUR 1,766 5,701 0.04Koninklijke Philips NV EUR 442 9,815 0.07Koninklijke Vopak NV EUR 49 2,189 0.02Randstad Holding NV EUR 241 8,806 0.06RELX NV EUR 610 9,455 0.07Unilever NV, CVA EUR 577 23,969 0.17Wolters Kluwer NV EUR 254 9,272 0.07
128,344 0.92
New ZealandAuckland International Airport Ltd. NZD 652 2,709 0.02
2,709 0.02
PortugalEDP – Energias de Portugal SA EUR 2,026 5,545 0.04
5,545 0.04
SingaporeCapitaLand Ltd. SGD 1,700 3,484 0.03City Developments Ltd. SGD 600 3,260 0.02
6,744 0.05
SpainAbertis Infraestructuras SA EUR 271 3,555 0.03Amadeus IT Holding SA ‘A’ EUR 240 9,419 0.07Banco Bilbao Vizcaya Argentaria SA EUR 2,598 13,003 0.09Banco de Sabadell SA EUR 2,646 3,098 0.02Banco Santander SA EUR 4,940 16,776 0.12CaixaBank SA EUR 1,479 2,872 0.02Enagas SA EUR 150 4,046 0.03Ferrovial SA EUR 292 5,056 0.04Iberdrola SA EUR 2,642 15,818 0.11Industria de Diseno Textil SA EUR 422 12,540 0.09Mediaset Espana Comunicacion SA EUR 574 5,706 0.04Obrascon Huarte Lain SA EUR 26 81 0.00Red Electrica Corp. SA EUR 77 6,105 0.05
SCHEDULE OF INVESTMENTSAs at 30 June 2016
Investments Currency
Quantity/Nominal
Value
Market Value EUR
% of Net Assets
Transferable securities and money market instruments admitted to official exchange listing or dealt in on another regulated market
Equities (continued)
Spain (continued)Repsol SA EUR 656 7,459 0.05Telefonica SA EUR 1,733 14,384 0.10
119,918 0.86
SwedenCastellum AB SEK 228 2,896 0.02
2,896 0.02
SwitzerlandAdecco Group AG CHF 298 13,445 0.10Flughafen Zuerich AG CHF 10 1,588 0.01LafargeHolcim Ltd. EUR 140 5,208 0.04Swiss Prime Site AG CHF 42 3,413 0.02
23,654 0.17
United KingdomBritish Land Co. plc (The), REIT GBP 567 4,095 0.03Capital & Counties Properties plc GBP 629 2,231 0.02Hammerson plc, REIT GBP 624 3,900 0.03Henderson Group plc, CDI AUD 510 1,286 0.01International Consolidated Airlines Group SA
(Spain) (2) GBP 2,053 9,093 0.06Land Securities Group plc, REIT GBP 408 5,055 0.04National Grid plc GBP 2,704 35,186 0.25Pennon Group plc GBP 275 3,121 0.02Severn Trent plc GBP 167 4,821 0.03United Utilities Group plc GBP 477 5,899 0.04
74,687 0.53
United States of AmericaAbbott Laboratories USD 200 6,957 0.05AbbVie, Inc. USD 400 22,101 0.16AGL Resources, Inc. USD 100 5,935 0.04Alcoa, Inc. USD 200 1,634 0.01Alexandria Real Estate Equities, Inc., REIT USD 100 9,123 0.07Allergan plc (Ireland) (2) USD 200 41,020 0.29Altria Group, Inc. USD 300 18,322 0.13American Campus Communities, Inc., REIT USD 100 4,672 0.03American Capital Agency Corp., REIT USD 200 3,510 0.03American International Group, Inc. USD 200 9,284 0.07American Tower Corp., REIT USD 300 30,247 0.22American Water Works Co., Inc. USD 100 7,436 0.05Annaly Capital Management, Inc., REIT USD 700 6,848 0.05Apple, Inc. USD 1,500 127,541 0.91Applied Materials, Inc. USD 200 4,250 0.03Aqua America, Inc. USD 100 3,142 0.02AT&T, Inc. USD 1,000 38,349 0.27Atmos Energy Corp. USD 100 7,120 0.05Bank of America Corp. USD 3,100 36,757 0.26Bank of New York Mellon Corp. (The) USD 200 6,909 0.05Berkshire Hathaway, Inc. ‘B’ USD 200 25,602 0.18Boston Properties, Inc., REIT USD 300 35,264 0.25Boston Scientific Corp. USD 200 4,158 0.03Bristol-Myers Squibb Co. USD 700 45,867 0.33Brixmor Property Group, Inc., REIT USD 200 4,692 0.03CBRE Group, Inc. ‘A’ USD 200 4,683 0.03CenterPoint Energy, Inc. USD 200 4,298 0.03Charles Schwab Corp. (The) USD 200 4,496 0.03Cheniere Energy, Inc. USD 100 3,269 0.02
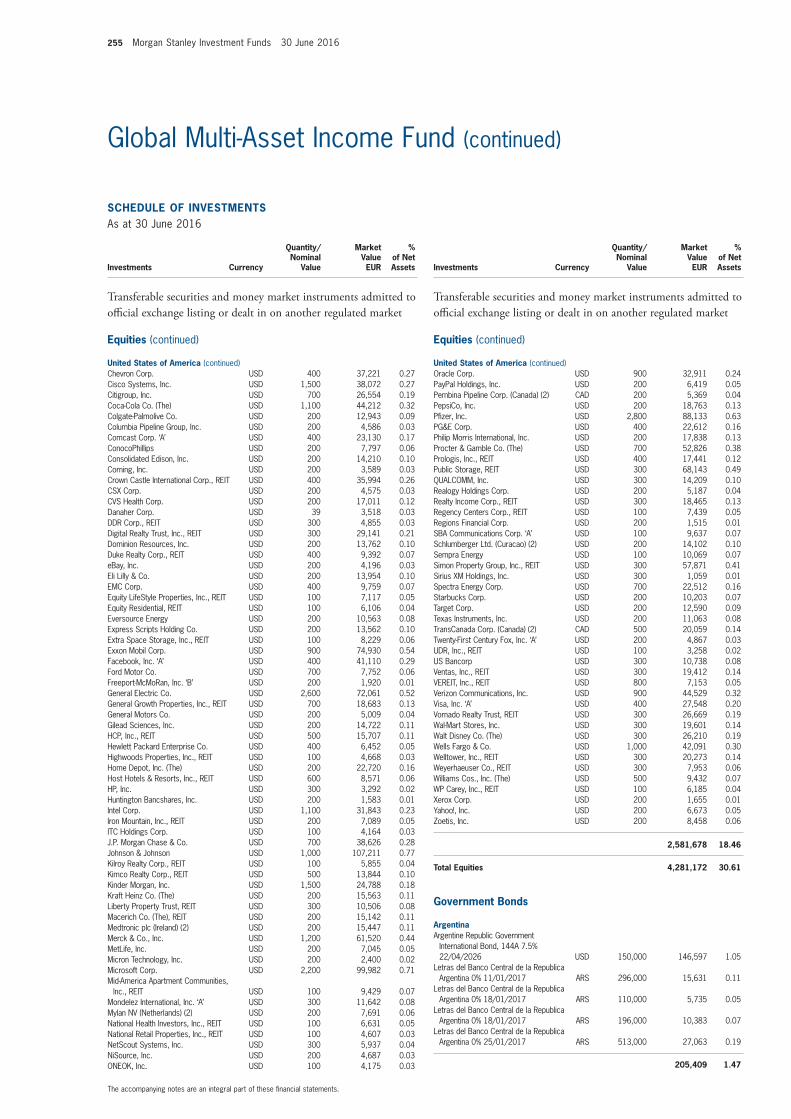
255 Morgan Stanley Investment Funds 30 June 2016
The accompanying notes are an integral part of these financial statements.
Global Multi-Asset Income Fund (continued)
SCHEDULE OF INVESTMENTSAs at 30 June 2016
Investments Currency
Quantity/Nominal
Value
Market Value EUR
% of Net Assets
Transferable securities and money market instruments admitted to official exchange listing or dealt in on another regulated market
Equities (continued)
United States of America (continued)Chevron Corp. USD 400 37,221 0.27Cisco Systems, Inc. USD 1,500 38,072 0.27Citigroup, Inc. USD 700 26,554 0.19Coca-Cola Co. (The) USD 1,100 44,212 0.32Colgate-Palmolive Co. USD 200 12,943 0.09Columbia Pipeline Group, Inc. USD 200 4,586 0.03Comcast Corp. ‘A’ USD 400 23,130 0.17ConocoPhillips USD 200 7,797 0.06Consolidated Edison, Inc. USD 200 14,210 0.10Corning, Inc. USD 200 3,589 0.03Crown Castle International Corp., REIT USD 400 35,994 0.26CSX Corp. USD 200 4,575 0.03CVS Health Corp. USD 200 17,011 0.12Danaher Corp. USD 39 3,518 0.03DDR Corp., REIT USD 300 4,855 0.03Digital Realty Trust, Inc., REIT USD 300 29,141 0.21Dominion Resources, Inc. USD 200 13,762 0.10Duke Realty Corp., REIT USD 400 9,392 0.07eBay, Inc. USD 200 4,196 0.03Eli Lilly & Co. USD 200 13,954 0.10EMC Corp. USD 400 9,759 0.07Equity LifeStyle Properties, Inc., REIT USD 100 7,117 0.05Equity Residential, REIT USD 100 6,106 0.04Eversource Energy USD 200 10,563 0.08Express Scripts Holding Co. USD 200 13,562 0.10Extra Space Storage, Inc., REIT USD 100 8,229 0.06Exxon Mobil Corp. USD 900 74,930 0.54Facebook, Inc. ‘A’ USD 400 41,110 0.29Ford Motor Co. USD 700 7,752 0.06Freeport-McMoRan, Inc. ‘B’ USD 200 1,920 0.01General Electric Co. USD 2,600 72,061 0.52General Growth Properties, Inc., REIT USD 700 18,683 0.13General Motors Co. USD 200 5,009 0.04Gilead Sciences, Inc. USD 200 14,722 0.11HCP, Inc., REIT USD 500 15,707 0.11Hewlett Packard Enterprise Co. USD 400 6,452 0.05Highwoods Properties, Inc., REIT USD 100 4,668 0.03Home Depot, Inc. (The) USD 200 22,720 0.16Host Hotels & Resorts, Inc., REIT USD 600 8,571 0.06HP, Inc. USD 300 3,292 0.02Huntington Bancshares, Inc. USD 200 1,583 0.01Intel Corp. USD 1,100 31,843 0.23Iron Mountain, Inc., REIT USD 200 7,089 0.05ITC Holdings Corp. USD 100 4,164 0.03J.P. Morgan Chase & Co. USD 700 38,626 0.28Johnson & Johnson USD 1,000 107,211 0.77Kilroy Realty Corp., REIT USD 100 5,855 0.04Kimco Realty Corp., REIT USD 500 13,844 0.10Kinder Morgan, Inc. USD 1,500 24,788 0.18Kraft Heinz Co. (The) USD 200 15,563 0.11Liberty Property Trust, REIT USD 300 10,506 0.08Macerich Co. (The), REIT USD 200 15,142 0.11Medtronic plc (Ireland) (2) USD 200 15,447 0.11Merck & Co., Inc. USD 1,200 61,520 0.44MetLife, Inc. USD 200 7,045 0.05Micron Technology, Inc. USD 200 2,400 0.02Microsoft Corp. USD 2,200 99,982 0.71Mid-America Apartment Communities,
Inc., REIT USD 100 9,429 0.07Mondelez International, Inc. ‘A’ USD 300 11,642 0.08Mylan NV (Netherlands) (2) USD 200 7,691 0.06National Health Investors, Inc., REIT USD 100 6,631 0.05National Retail Properties, Inc., REIT USD 100 4,607 0.03NetScout Systems, Inc. USD 300 5,937 0.04NiSource, Inc. USD 200 4,687 0.03ONEOK, Inc. USD 100 4,175 0.03
SCHEDULE OF INVESTMENTSAs at 30 June 2016
Investments Currency
Quantity/Nominal
Value
Market Value EUR
% of Net Assets
Transferable securities and money market instruments admitted to official exchange listing or dealt in on another regulated market
Equities (continued)
United States of America (continued)Oracle Corp. USD 900 32,911 0.24PayPal Holdings, Inc. USD 200 6,419 0.05Pembina Pipeline Corp. (Canada) (2) CAD 200 5,369 0.04PepsiCo, Inc. USD 200 18,763 0.13Pfizer, Inc. USD 2,800 88,133 0.63PG&E Corp. USD 400 22,612 0.16Philip Morris International, Inc. USD 200 17,838 0.13Procter & Gamble Co. (The) USD 700 52,826 0.38Prologis, Inc., REIT USD 400 17,441 0.12Public Storage, REIT USD 300 68,143 0.49QUALCOMM, Inc. USD 300 14,209 0.10Realogy Holdings Corp. USD 200 5,187 0.04Realty Income Corp., REIT USD 300 18,465 0.13Regency Centers Corp., REIT USD 100 7,439 0.05Regions Financial Corp. USD 200 1,515 0.01SBA Communications Corp. ‘A’ USD 100 9,637 0.07Schlumberger Ltd. (Curacao) (2) USD 200 14,102 0.10Sempra Energy USD 100 10,069 0.07Simon Property Group, Inc., REIT USD 300 57,871 0.41Sirius XM Holdings, Inc. USD 300 1,059 0.01Spectra Energy Corp. USD 700 22,512 0.16Starbucks Corp. USD 200 10,203 0.07Target Corp. USD 200 12,590 0.09Texas Instruments, Inc. USD 200 11,063 0.08TransCanada Corp. (Canada) (2) CAD 500 20,059 0.14Twenty-First Century Fox, Inc. ‘A’ USD 200 4,867 0.03UDR, Inc., REIT USD 100 3,258 0.02US Bancorp USD 300 10,738 0.08Ventas, Inc., REIT USD 300 19,412 0.14VEREIT, Inc., REIT USD 800 7,153 0.05Verizon Communications, Inc. USD 900 44,529 0.32Visa, Inc. ‘A’ USD 400 27,548 0.20Vornado Realty Trust, REIT USD 300 26,669 0.19Wal-Mart Stores, Inc. USD 300 19,601 0.14Walt Disney Co. (The) USD 300 26,210 0.19Wells Fargo & Co. USD 1,000 42,091 0.30Welltower, Inc., REIT USD 300 20,273 0.14Weyerhaeuser Co., REIT USD 300 7,953 0.06Williams Cos., Inc. (The) USD 500 9,432 0.07WP Carey, Inc., REIT USD 100 6,185 0.04Xerox Corp. USD 200 1,655 0.01Yahoo!, Inc. USD 200 6,673 0.05Zoetis, Inc. USD 200 8,458 0.06
2,581,678 18.46
Total Equities 4,281,172 30.61
Government Bonds
ArgentinaArgentine Republic Government
International Bond, 144A 7.5% 22/04/2026 USD 150,000 146,597 1.05
Letras del Banco Central de la Republica Argentina 0% 11/01/2017 ARS 296,000 15,631 0.11
Letras del Banco Central de la Republica Argentina 0% 18/01/2017 ARS 110,000 5,735 0.05
Letras del Banco Central de la Republica Argentina 0% 18/01/2017 ARS 196,000 10,383 0.07
Letras del Banco Central de la Republica Argentina 0% 25/01/2017 ARS 513,000 27,063 0.19
205,409 1.47

Morgan Stanley Investment Funds 30 June 2016 256
The accompanying notes are an integral part of these financial statements.
Global Multi-Asset Income Fund (continued)
SCHEDULE OF INVESTMENTSAs at 30 June 2016
Investments Currency
Quantity/Nominal
Value
Market Value EUR
% of Net Assets
Transferable securities and money market instruments admitted to official exchange listing or dealt in on another regulated market
Government Bonds (continued)
AustraliaAustralia Government Bond, Reg. S 3.25%
21/04/2025 AUD 90,000 66,526 0.48
66,526 0.48
AustriaAustria Government Bond, Reg. S, 144A
1.2% 20/10/2025 EUR 30,000 33,193 0.24
33,193 0.24
BelgiumBelgium Government Bond, Reg. S, 144A
0.8% 22/06/2025 EUR 130,000 138,025 0.99
138,025 0.99
BrazilBrazil Letras do Tesouro Nacional 0%
01/01/2019 BRL 40,000 83,995 0.60
83,995 0.60
CanadaCanadian Government Bond 3.25%
01/06/2021 CAD 290,000 226,614 1.62Canadian Government Bond 1.5%
01/06/2023 CAD 27,000 19,601 0.14
246,215 1.76
FranceFrance Government Bond OAT, Reg. S
0.5% 25/05/2025 EUR 100,000 103,683 0.74France Government Bond OAT, Reg. S
5.5% 25/04/2029 EUR 30,000 49,451 0.35France Government Bond OAT, Reg. S
3.25% 25/05/2045 EUR 50,000 79,145 0.57
232,279 1.66
GermanyBundesrepublik Deutschland, Reg. S 1%
15/08/2025 EUR 110,000 122,065 0.87Bundesrepublik Deutschland, Reg. S 4.75%
04/07/2034 EUR 30,000 54,756 0.39Bundesrepublik Deutschland, Reg. S 4.25%
04/07/2039 EUR 25,000 47,309 0.34
224,130 1.60
GreeceHellenic Republic Government Bond,
Reg. S, STEP 3% 24/02/2023 EUR 2,050 1,509 0.01Hellenic Republic Government Bond,
Reg. S, STEP 3% 24/02/2024 EUR 2,050 1,503 0.01Hellenic Republic Government Bond,
Reg. S, STEP 3% 24/02/2025 EUR 2,050 1,437 0.01Hellenic Republic Government Bond,
Reg. S, STEP 3% 24/02/2026 EUR 2,050 1,411 0.01
SCHEDULE OF INVESTMENTSAs at 30 June 2016
Investments Currency
Quantity/Nominal
Value
Market Value EUR
% of Net Assets
Transferable securities and money market instruments admitted to official exchange listing or dealt in on another regulated market
Government Bonds (continued)
Greece (continued)Hellenic Republic Government Bond,
Reg. S, STEP 3% 24/02/2027 EUR 2,050 1,413 0.01Hellenic Republic Government Bond,
Reg. S, STEP 3% 24/02/2028 EUR 2,050 1,384 0.01Hellenic Republic Government Bond,
Reg. S, STEP 3% 24/02/2029 EUR 2,050 1,346 0.01Hellenic Republic Government Bond,
Reg. S, STEP 3% 24/02/2030 EUR 2,050 1,320 0.01Hellenic Republic Government Bond,
Reg. S, STEP 3% 24/02/2031 EUR 2,050 1,300 0.01Hellenic Republic Government Bond,
Reg. S, STEP 3% 24/02/2032 EUR 2,050 1,283 0.01Hellenic Republic Government Bond,
Reg. S, STEP 3% 24/02/2033 EUR 2,050 1,264 0.01Hellenic Republic Government Bond,
Reg. S, STEP 3% 24/02/2034 EUR 2,050 1,251 0.01Hellenic Republic Government Bond,
Reg. S, STEP 3% 24/02/2035 EUR 2,050 1,266 0.01Hellenic Republic Government Bond,
Reg. S, STEP 3% 24/02/2036 EUR 2,050 1,250 0.01Hellenic Republic Government Bond,
Reg. S, STEP 3% 24/02/2037 EUR 2,050 1,231 0.01Hellenic Republic Government Bond,
Reg. S, STEP 3% 24/02/2038 EUR 2,050 1,236 0.01Hellenic Republic Government Bond,
Reg. S, STEP 3% 24/02/2039 EUR 2,050 1,221 0.00Hellenic Republic Government Bond,
Reg. S, STEP 3% 24/02/2040 EUR 2,050 1,222 0.01Hellenic Republic Government Bond,
Reg. S, STEP 3% 24/02/2041 EUR 2,050 1,223 0.01Hellenic Republic Government Bond,
Reg. S, STEP 3% 24/02/2042 EUR 2,050 1,234 0.01
26,304 0.19
HungaryHungary Government International Bond
5.75% 22/11/2023 USD 50,000 51,268 0.37
51,268 0.37
IrelandIreland Government Bond 5.4%
13/03/2025 EUR 10,000 14,173 0.10
14,173 0.10
ItalyItaly Buoni Poliennali Del Tesoro 1.5%
01/06/2025 EUR 150,000 154,145 1.10Italy Buoni Poliennali Del Tesoro, Reg. S,
144A 2.35% 15/09/2024 EUR 80,000 92,290 0.66Italy Buoni Poliennali Del Tesoro, Reg. S,
144A 1.65% 01/03/2032 EUR 30,000 29,763 0.21Italy Buoni Poliennali Del Tesoro, Reg. S
5% 01/09/2040 EUR 10,000 15,168 0.11
291,366 2.08
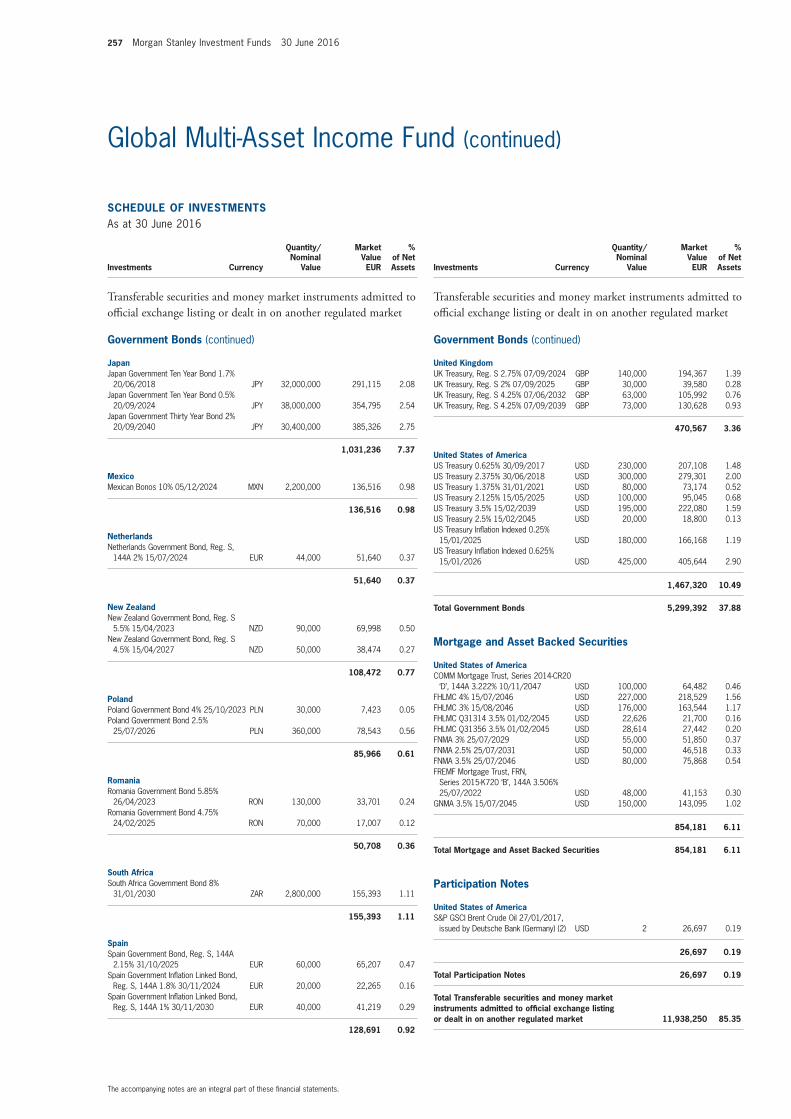
257 Morgan Stanley Investment Funds 30 June 2016
The accompanying notes are an integral part of these financial statements.
Global Multi-Asset Income Fund (continued)
SCHEDULE OF INVESTMENTSAs at 30 June 2016
Investments Currency
Quantity/Nominal
Value
Market Value EUR
% of Net Assets
Transferable securities and money market instruments admitted to official exchange listing or dealt in on another regulated market
Government Bonds (continued)
JapanJapan Government Ten Year Bond 1.7%
20/06/2018 JPY 32,000,000 291,115 2.08Japan Government Ten Year Bond 0.5%
20/09/2024 JPY 38,000,000 354,795 2.54Japan Government Thirty Year Bond 2%
20/09/2040 JPY 30,400,000 385,326 2.75
1,031,236 7.37
MexicoMexican Bonos 10% 05/12/2024 MXN 2,200,000 136,516 0.98
136,516 0.98
NetherlandsNetherlands Government Bond, Reg. S,
144A 2% 15/07/2024 EUR 44,000 51,640 0.37
51,640 0.37
New ZealandNew Zealand Government Bond, Reg. S
5.5% 15/04/2023 NZD 90,000 69,998 0.50New Zealand Government Bond, Reg. S
4.5% 15/04/2027 NZD 50,000 38,474 0.27
108,472 0.77
PolandPoland Government Bond 4% 25/10/2023 PLN 30,000 7,423 0.05Poland Government Bond 2.5%
25/07/2026 PLN 360,000 78,543 0.56
85,966 0.61
RomaniaRomania Government Bond 5.85%
26/04/2023 RON 130,000 33,701 0.24Romania Government Bond 4.75%
24/02/2025 RON 70,000 17,007 0.12
50,708 0.36
South AfricaSouth Africa Government Bond 8%
31/01/2030 ZAR 2,800,000 155,393 1.11
155,393 1.11
SpainSpain Government Bond, Reg. S, 144A
2.15% 31/10/2025 EUR 60,000 65,207 0.47Spain Government Inflation Linked Bond,
Reg. S, 144A 1.8% 30/11/2024 EUR 20,000 22,265 0.16Spain Government Inflation Linked Bond,
Reg. S, 144A 1% 30/11/2030 EUR 40,000 41,219 0.29
128,691 0.92
SCHEDULE OF INVESTMENTSAs at 30 June 2016
Investments Currency
Quantity/Nominal
Value
Market Value EUR
% of Net Assets
Transferable securities and money market instruments admitted to official exchange listing or dealt in on another regulated market
Government Bonds (continued)
United KingdomUK Treasury, Reg. S 2.75% 07/09/2024 GBP 140,000 194,367 1.39UK Treasury, Reg. S 2% 07/09/2025 GBP 30,000 39,580 0.28UK Treasury, Reg. S 4.25% 07/06/2032 GBP 63,000 105,992 0.76UK Treasury, Reg. S 4.25% 07/09/2039 GBP 73,000 130,628 0.93
470,567 3.36
United States of AmericaUS Treasury 0.625% 30/09/2017 USD 230,000 207,108 1.48US Treasury 2.375% 30/06/2018 USD 300,000 279,301 2.00US Treasury 1.375% 31/01/2021 USD 80,000 73,174 0.52US Treasury 2.125% 15/05/2025 USD 100,000 95,045 0.68US Treasury 3.5% 15/02/2039 USD 195,000 222,080 1.59US Treasury 2.5% 15/02/2045 USD 20,000 18,800 0.13US Treasury Inflation Indexed 0.25%
15/01/2025 USD 180,000 166,168 1.19US Treasury Inflation Indexed 0.625%
15/01/2026 USD 425,000 405,644 2.90
1,467,320 10.49
Total Government Bonds 5,299,392 37.88
Mortgage and Asset Backed Securities
United States of AmericaCOMM Mortgage Trust, Series 2014-CR20
‘D’, 144A 3.222% 10/11/2047 USD 100,000 64,482 0.46FHLMC 4% 15/07/2046 USD 227,000 218,529 1.56FHLMC 3% 15/08/2046 USD 176,000 163,544 1.17FHLMC Q31314 3.5% 01/02/2045 USD 22,626 21,700 0.16FHLMC Q31356 3.5% 01/02/2045 USD 28,614 27,442 0.20FNMA 3% 25/07/2029 USD 55,000 51,850 0.37FNMA 2.5% 25/07/2031 USD 50,000 46,518 0.33FNMA 3.5% 25/07/2046 USD 80,000 75,868 0.54FREMF Mortgage Trust, FRN,
Series 2015-K720 ‘B’, 144A 3.506% 25/07/2022 USD 48,000 41,153 0.30
GNMA 3.5% 15/07/2045 USD 150,000 143,095 1.02
854,181 6.11
Total Mortgage and Asset Backed Securities 854,181 6.11
Participation Notes
United States of AmericaS&P GSCI Brent Crude Oil 27/01/2017,
issued by Deutsche Bank (Germany) (2) USD 2 26,697 0.19
26,697 0.19
Total Participation Notes 26,697 0.19
Total Transferable securities and money market instruments admitted to official exchange listing or dealt in on another regulated market 11,938,250 85.35

Morgan Stanley Investment Funds 30 June 2016 258
The accompanying notes are an integral part of these financial statements.
Global Multi-Asset Income Fund (continued)
Units of authorised UCITS or other collective investment undertakings
Collective Investment Schemes – UCITS
LuxembourgMorgan Stanley Investment Funds
Emerging Markets Debt Fund – Class AX (4) USD 15,497 721,943 5.16
Morgan Stanley Investment Funds Global High Yield Bond Fund – Class IX (4) USD 31,361 585,214 4.18
1,307,157 9.34
Total Collective Investment Schemes – UCITS 1,307,157 9.34
Total Units of authorised UCITS or other collective investment undertakings 1,307,157 9.34
Total Investments 13,245,407 94.69
Cash 1,610,668 11.52
Other Assets/(Liabilities) (868,528) (6.21)
Total Net Assets 13,987,547 100.00
(2) The country in brackets represents the country of incorporation of this security.(4) Affiliate managed by an affiliate of the Investment Adviser.
SCHEDULE OF INVESTMENTSAs at 30 June 2016
Investments Currency
Quantity/Nominal
Value
Market Value EUR
% of Net Assets
Financial Futures Contracts
Security DescriptionNumber of Contracts Currency
Global Exposure
EUR
Unrealised Gain/(Loss)
EUR
% of Net Assets
EURO STOXX 50 Index, 16/09/2016 (9) EUR (254,340) 3,060 0.02FTSE 100 Index, 16/09/2016 3 GBP 229,333 16,808 0.12MSCI Emerging Markets Mini Index, 16/09/2016 13 USD 483,565 10,352 0.07US 10 Year Note, 21/09/2016 11 USD 1,315,301 33,940 0.24US 2 Year Note, 30/09/2016 2 USD 394,434 2,559 0.02US 5 Year Note, 30/09/2016 2 USD 219,566 3,732 0.03
Total Unrealised Gain on Financial Futures Contracts 70,451 0.50
Euro-Bund, 08/09/2016 (9) EUR (1,502,550) (26,207) (0.19)Long Gilt, 28/09/2016 (1) GBP (154,690) (6,262) (0.04)S&P 500 Emini Index, 16/09/2016 5 USD 463,729 (5,326) (0.04)S&P/TSX 60 Index, 15/09/2016 1 CAD 112,161 (1,822) (0.01)US 10 Year Note, 21/09/2016 (6) USD (717,437) (19,144) (0.13)US Long Bond, 21/09/2016 (2) USD (311,139) (18,517) (0.13)Yen Denominated Nikkei 225 Index, 08/09/2016 6 JPY 408,168 (27,361) (0.20)
Total Unrealised Loss on Financial Futures Contracts (104,639) (0.74)
Net Unrealised Loss on Financial Futures Contracts (34,188) (0.24)
Option Purchased Contracts
Quantity Security Description Currency Counterparty
Market Value EUR
% of Net Assets
540,000 Foreign Exchange USD/CNH, Call, 6.750, 27/10/2016 USD J.P. Morgan 5,467 0.04
Total Option Purchased Contracts 5,467 0.04
Option Written Contracts
Quantity Security Description Currency Counterparty
Global Exposure
EUR
Market Value EUR
% of Net Assets
(969,000) EURO STOXX 50 Index, Call, 2,850.000, 15/07/2016 EUR Goldman Sachs (1,407,398,061) (19,010) (0.13)
(540,000) Foreign Exchange USD/CNH, Call, 7.250, 27/10/2016 USD J.P. Morgan (1,013,802) (966) (0.01)
(1,127,000) MSCI Emerging Markets Index, Call, 805.000, 15/07/2016 USD Goldman Sachs (438,879,451) (43,437) (0.31)
(114,625,000) NIKKEI 225 Index, Call, 16,375.000, 08/07/2016 JPY Goldman Sachs (1,000,092,727) (1,438) (0.01)
(6) S&P 500 Emini Index, Call, 2,070.000, 15/07/2016 USD Goldman Sachs (778,265) (12,090) (0.09)
Total Option Written Contracts (76,941) (0.55)
DERIVATIVES
Over-the-counter (OTC) and exchange traded derivatives as at 30 June 2016, expressed in Euro.
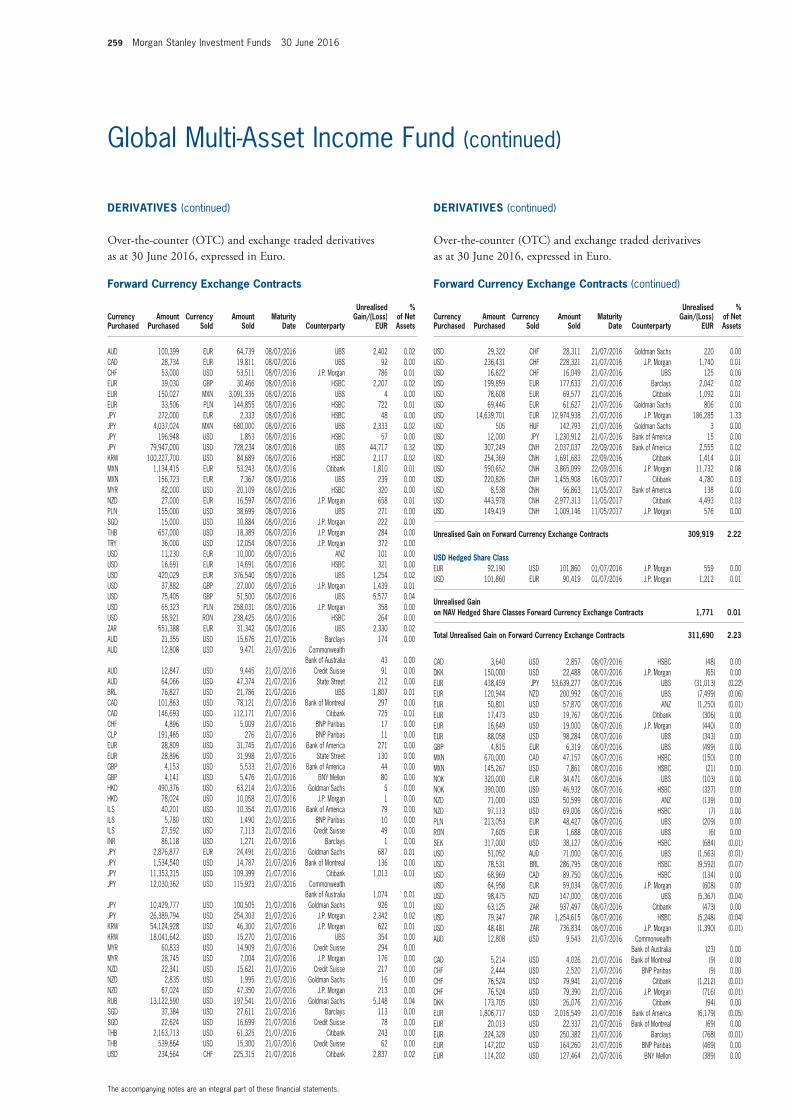
259 Morgan Stanley Investment Funds 30 June 2016
The accompanying notes are an integral part of these financial statements.
Global Multi-Asset Income Fund (continued)
Forward Currency Exchange Contracts (continued)
Currency Purchased
Amount Purchased
Currency Sold
Amount Sold
Maturity Date Counterparty
Unrealised Gain/(Loss)
EUR
% of Net Assets
AUD 100,399 EUR 64,739 08/07/2016 UBS 2,402 0.02CAD 28,734 EUR 19,811 08/07/2016 UBS 92 0.00CHF 53,000 USD 53,511 08/07/2016 J.P. Morgan 786 0.01EUR 39,030 GBP 30,466 08/07/2016 HSBC 2,207 0.02EUR 150,027 MXN 3,091,335 08/07/2016 UBS 4 0.00EUR 33,506 PLN 144,855 08/07/2016 HSBC 722 0.01JPY 272,000 EUR 2,333 08/07/2016 HSBC 48 0.00JPY 4,037,024 MXN 680,000 08/07/2016 UBS 2,333 0.02JPY 196,948 USD 1,853 08/07/2016 HSBC 57 0.00JPY 79,947,000 USD 728,234 08/07/2016 UBS 44,717 0.32KRW 100,227,700 USD 84,689 08/07/2016 HSBC 2,117 0.02MXN 1,134,415 EUR 53,243 08/07/2016 Citibank 1,810 0.01MXN 156,723 EUR 7,367 08/07/2016 UBS 239 0.00MYR 82,000 USD 20,109 08/07/2016 HSBC 320 0.00NZD 27,000 EUR 16,597 08/07/2016 J.P. Morgan 658 0.01PLN 155,000 USD 38,699 08/07/2016 UBS 271 0.00SGD 15,000 USD 10,884 08/07/2016 J.P. Morgan 222 0.00THB 657,000 USD 18,389 08/07/2016 J.P. Morgan 284 0.00TRY 36,000 USD 12,054 08/07/2016 J.P. Morgan 372 0.00USD 11,230 EUR 10,000 08/07/2016 ANZ 101 0.00USD 16,691 EUR 14,691 08/07/2016 HSBC 321 0.00USD 420,029 EUR 376,540 08/07/2016 UBS 1,254 0.02USD 37,882 GBP 27,000 08/07/2016 J.P. Morgan 1,439 0.01USD 75,405 GBP 51,500 08/07/2016 UBS 5,577 0.04USD 65,323 PLN 258,031 08/07/2016 J.P. Morgan 358 0.00USD 58,921 RON 238,425 08/07/2016 HSBC 264 0.00ZAR 551,388 EUR 31,342 08/07/2016 UBS 2,330 0.02AUD 21,355 USD 15,676 21/07/2016 Barclays 174 0.00AUD 12,808 USD 9,471 21/07/2016 Commonwealth
Bank of Australia 43 0.00AUD 12,847 USD 9,445 21/07/2016 Credit Suisse 91 0.00AUD 64,066 USD 47,374 21/07/2016 State Street 212 0.00BRL 76,827 USD 21,786 21/07/2016 UBS 1,807 0.01CAD 101,863 USD 78,121 21/07/2016 Bank of Montreal 297 0.00CAD 146,693 USD 112,171 21/07/2016 Citibank 725 0.01CHF 4,896 USD 5,009 21/07/2016 BNP Paribas 17 0.00CLP 191,465 USD 276 21/07/2016 BNP Paribas 11 0.00EUR 28,809 USD 31,745 21/07/2016 Bank of America 271 0.00EUR 28,896 USD 31,998 21/07/2016 State Street 130 0.00GBP 4,153 USD 5,533 21/07/2016 Bank of America 44 0.00GBP 4,141 USD 5,476 21/07/2016 BNY Mellon 80 0.00HKD 490,376 USD 63,214 21/07/2016 Goldman Sachs 5 0.00HKD 78,024 USD 10,058 21/07/2016 J.P. Morgan 1 0.00ILS 40,201 USD 10,354 21/07/2016 Bank of America 79 0.00ILS 5,780 USD 1,490 21/07/2016 BNP Paribas 10 0.00ILS 27,592 USD 7,113 21/07/2016 Credit Suisse 49 0.00INR 86,118 USD 1,271 21/07/2016 Barclays 1 0.00JPY 2,876,877 EUR 24,491 21/07/2016 Goldman Sachs 687 0.01JPY 1,534,540 USD 14,787 21/07/2016 Bank of Montreal 136 0.00JPY 11,353,315 USD 109,399 21/07/2016 Citibank 1,013 0.01JPY 12,030,362 USD 115,923 21/07/2016 Commonwealth
Bank of Australia 1,074 0.01JPY 10,429,777 USD 100,505 21/07/2016 Goldman Sachs 926 0.01JPY 26,389,794 USD 254,303 21/07/2016 J.P. Morgan 2,342 0.02KRW 54,124,928 USD 46,300 21/07/2016 J.P. Morgan 622 0.01KRW 18,041,642 USD 15,270 21/07/2016 UBS 354 0.00MYR 60,833 USD 14,909 21/07/2016 Credit Suisse 294 0.00MYR 28,745 USD 7,004 21/07/2016 J.P. Morgan 176 0.00NZD 22,341 USD 15,621 21/07/2016 Credit Suisse 217 0.00NZD 2,835 USD 1,995 21/07/2016 Goldman Sachs 16 0.00NZD 67,024 USD 47,350 21/07/2016 J.P. Morgan 213 0.00RUB 13,122,590 USD 197,541 21/07/2016 Goldman Sachs 5,148 0.04SGD 37,384 USD 27,611 21/07/2016 Barclays 113 0.00SGD 22,624 USD 16,699 21/07/2016 Credit Suisse 78 0.00THB 2,163,713 USD 61,325 21/07/2016 Citibank 243 0.00THB 539,864 USD 15,300 21/07/2016 Credit Suisse 62 0.00USD 234,564 CHF 225,315 21/07/2016 Citibank 2,837 0.02
Forward Currency Exchange Contracts (continued)
Currency Purchased
Amount Purchased
Currency Sold
Amount Sold
Maturity Date Counterparty
Unrealised Gain/(Loss)
EUR
% of Net Assets
USD 29,322 CHF 28,311 21/07/2016 Goldman Sachs 220 0.00USD 236,431 CHF 228,321 21/07/2016 J.P. Morgan 1,740 0.01USD 16,622 CHF 16,049 21/07/2016 UBS 125 0.00USD 199,859 EUR 177,633 21/07/2016 Barclays 2,042 0.02USD 78,608 EUR 69,577 21/07/2016 Citibank 1,092 0.01USD 69,446 EUR 61,627 21/07/2016 Goldman Sachs 806 0.00USD 14,639,701 EUR 12,974,938 21/07/2016 J.P. Morgan 186,285 1.33USD 505 HUF 142,793 21/07/2016 Goldman Sachs 3 0.00USD 12,000 JPY 1,230,912 21/07/2016 Bank of America 15 0.00USD 307,249 CNH 2,037,037 22/09/2016 Bank of America 2,555 0.02USD 254,369 CNH 1,691,683 22/09/2016 Citibank 1,414 0.01USD 590,652 CNH 3,865,099 22/09/2016 J.P. Morgan 11,732 0.08USD 220,826 CNH 1,455,908 16/03/2017 Citibank 4,780 0.03USD 8,538 CNH 56,863 11/05/2017 Bank of America 138 0.00USD 443,978 CNH 2,977,313 11/05/2017 Citibank 4,493 0.03USD 149,419 CNH 1,009,146 11/05/2017 J.P. Morgan 576 0.00
Unrealised Gain on Forward Currency Exchange Contracts 309,919 2.22
USD Hedged Share ClassEUR 92,190 USD 101,860 01/07/2016 J.P. Morgan 559 0.00USD 101,860 EUR 90,419 01/07/2016 J.P. Morgan 1,212 0.01
Unrealised Gain on NAV Hedged Share Classes Forward Currency Exchange Contracts 1,771 0.01
Total Unrealised Gain on Forward Currency Exchange Contracts 311,690 2.23
CAD 3,640 USD 2,857 08/07/2016 HSBC (48) 0.00DKK 150,000 USD 22,488 08/07/2016 J.P. Morgan (65) 0.00EUR 438,459 JPY 53,639,277 08/07/2016 UBS (31,013) (0.22)EUR 120,944 NZD 200,992 08/07/2016 UBS (7,499) (0.06)EUR 50,801 USD 57,870 08/07/2016 ANZ (1,250) (0.01)EUR 17,473 USD 19,767 08/07/2016 Citibank (306) 0.00EUR 16,649 USD 19,000 08/07/2016 J.P. Morgan (440) 0.00EUR 88,058 USD 98,284 08/07/2016 UBS (343) 0.00GBP 4,815 EUR 6,319 08/07/2016 UBS (499) 0.00MXN 670,000 CAD 47,157 08/07/2016 HSBC (150) 0.00MXN 145,267 USD 7,861 08/07/2016 HSBC (21) 0.00NOK 320,000 EUR 34,471 08/07/2016 UBS (103) 0.00NOK 390,000 USD 46,932 08/07/2016 HSBC (327) 0.00NZD 71,000 USD 50,599 08/07/2016 ANZ (139) 0.00NZD 97,113 USD 69,006 08/07/2016 HSBC (7) 0.00PLN 213,053 EUR 48,427 08/07/2016 UBS (209) 0.00RON 7,605 EUR 1,688 08/07/2016 UBS (6) 0.00SEK 317,000 USD 38,127 08/07/2016 HSBC (684) (0.01)USD 51,052 AUD 71,000 08/07/2016 UBS (1,563) (0.01)USD 78,531 BRL 286,795 08/07/2016 HSBC (9,592) (0.07)USD 68,969 CAD 89,750 08/07/2016 HSBC (134) 0.00USD 64,958 EUR 59,034 08/07/2016 J.P. Morgan (608) 0.00USD 98,475 NZD 147,000 08/07/2016 UBS (5,367) (0.04)USD 63,125 ZAR 937,497 08/07/2016 Citibank (473) 0.00USD 79,347 ZAR 1,254,615 08/07/2016 HSBC (5,248) (0.04)USD 48,481 ZAR 736,834 08/07/2016 J.P. Morgan (1,390) (0.01)AUD 12,808 USD 9,543 21/07/2016 Commonwealth
Bank of Australia (23) 0.00CAD 5,214 USD 4,026 21/07/2016 Bank of Montreal (9) 0.00CHF 2,444 USD 2,520 21/07/2016 BNP Paribas (9) 0.00CHF 76,524 USD 79,941 21/07/2016 Citibank (1,212) (0.01)CHF 76,524 USD 79,390 21/07/2016 J.P. Morgan (716) (0.01)DKK 173,705 USD 26,076 21/07/2016 Citibank (94) 0.00EUR 1,806,717 USD 2,016,549 21/07/2016 Bank of America (6,179) (0.05)EUR 20,013 USD 22,337 21/07/2016 Bank of Montreal (69) 0.00EUR 224,328 USD 250,382 21/07/2016 Barclays (768) (0.01)EUR 147,202 USD 164,260 21/07/2016 BNP Paribas (469) 0.00EUR 114,202 USD 127,464 21/07/2016 BNY Mellon (389) 0.00
DERIVATIVES (continued)
Over-the-counter (OTC) and exchange traded derivatives as at 30 June 2016, expressed in Euro.
DERIVATIVES (continued)
Over-the-counter (OTC) and exchange traded derivatives as at 30 June 2016, expressed in Euro.
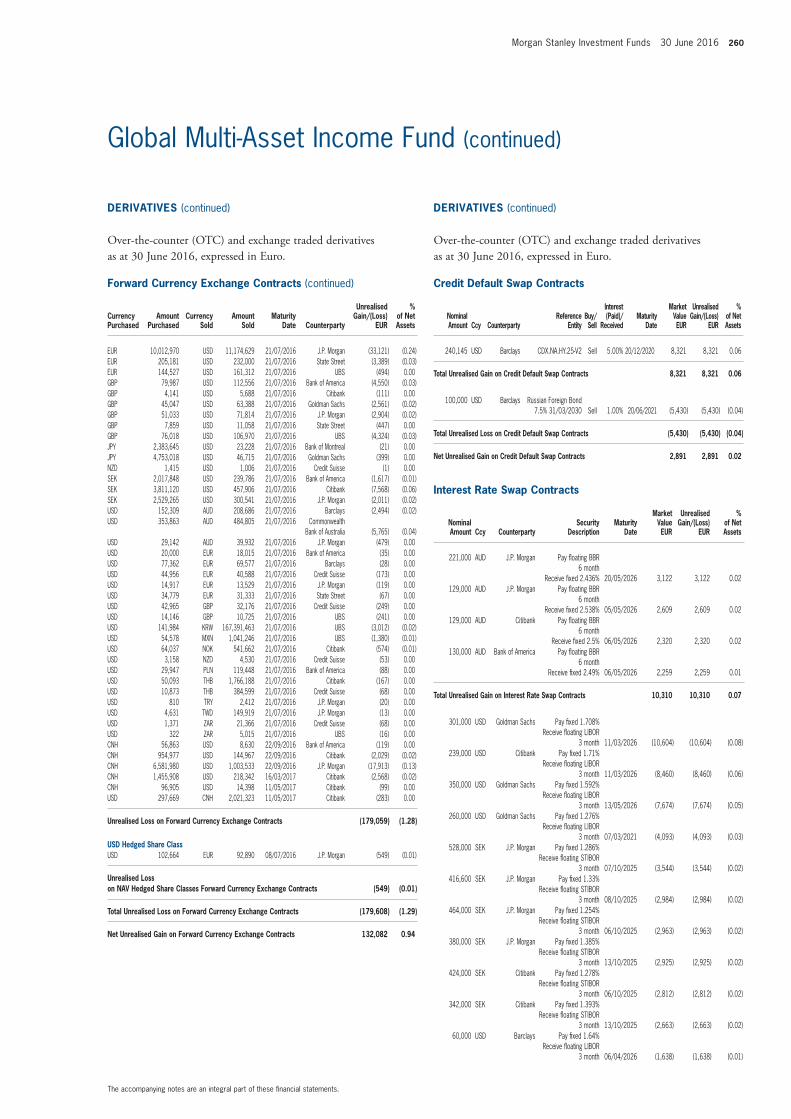
Morgan Stanley Investment Funds 30 June 2016 260
The accompanying notes are an integral part of these financial statements.
Global Multi-Asset Income Fund (continued)
Forward Currency Exchange Contracts (continued)
Currency Purchased
Amount Purchased
Currency Sold
Amount Sold
Maturity Date Counterparty
Unrealised Gain/(Loss)
EUR
% of Net Assets
EUR 10,012,970 USD 11,174,629 21/07/2016 J.P. Morgan (33,121) (0.24)EUR 205,181 USD 232,000 21/07/2016 State Street (3,389) (0.03)EUR 144,527 USD 161,312 21/07/2016 UBS (494) 0.00GBP 79,987 USD 112,556 21/07/2016 Bank of America (4,550) (0.03)GBP 4,141 USD 5,688 21/07/2016 Citibank (111) 0.00GBP 45,047 USD 63,388 21/07/2016 Goldman Sachs (2,561) (0.02)GBP 51,033 USD 71,814 21/07/2016 J.P. Morgan (2,904) (0.02)GBP 7,859 USD 11,058 21/07/2016 State Street (447) 0.00GBP 76,018 USD 106,970 21/07/2016 UBS (4,324) (0.03)JPY 2,383,645 USD 23,228 21/07/2016 Bank of Montreal (21) 0.00JPY 4,753,018 USD 46,715 21/07/2016 Goldman Sachs (399) 0.00NZD 1,415 USD 1,006 21/07/2016 Credit Suisse (1) 0.00SEK 2,017,848 USD 239,786 21/07/2016 Bank of America (1,617) (0.01)SEK 3,811,120 USD 457,906 21/07/2016 Citibank (7,568) (0.06)SEK 2,529,265 USD 300,541 21/07/2016 J.P. Morgan (2,011) (0.02)USD 152,309 AUD 208,686 21/07/2016 Barclays (2,494) (0.02)USD 353,863 AUD 484,805 21/07/2016 Commonwealth
Bank of Australia (5,765) (0.04)USD 29,142 AUD 39,932 21/07/2016 J.P. Morgan (479) 0.00USD 20,000 EUR 18,015 21/07/2016 Bank of America (35) 0.00USD 77,362 EUR 69,577 21/07/2016 Barclays (28) 0.00USD 44,956 EUR 40,588 21/07/2016 Credit Suisse (173) 0.00USD 14,917 EUR 13,529 21/07/2016 J.P. Morgan (119) 0.00USD 34,779 EUR 31,333 21/07/2016 State Street (67) 0.00USD 42,965 GBP 32,176 21/07/2016 Credit Suisse (249) 0.00USD 14,146 GBP 10,725 21/07/2016 UBS (241) 0.00USD 141,984 KRW 167,391,463 21/07/2016 UBS (3,012) (0.02)USD 54,578 MXN 1,041,246 21/07/2016 UBS (1,380) (0.01)USD 64,037 NOK 541,662 21/07/2016 Citibank (574) (0.01)USD 3,158 NZD 4,530 21/07/2016 Credit Suisse (53) 0.00USD 29,947 PLN 119,448 21/07/2016 Bank of America (88) 0.00USD 50,093 THB 1,766,188 21/07/2016 Citibank (167) 0.00USD 10,873 THB 384,599 21/07/2016 Credit Suisse (68) 0.00USD 810 TRY 2,412 21/07/2016 J.P. Morgan (20) 0.00USD 4,631 TWD 149,919 21/07/2016 J.P. Morgan (13) 0.00USD 1,371 ZAR 21,366 21/07/2016 Credit Suisse (68) 0.00USD 322 ZAR 5,015 21/07/2016 UBS (16) 0.00CNH 56,863 USD 8,630 22/09/2016 Bank of America (119) 0.00CNH 954,977 USD 144,967 22/09/2016 Citibank (2,029) (0.02)CNH 6,581,980 USD 1,003,533 22/09/2016 J.P. Morgan (17,913) (0.13)CNH 1,455,908 USD 218,342 16/03/2017 Citibank (2,568) (0.02)CNH 96,905 USD 14,398 11/05/2017 Citibank (99) 0.00USD 297,669 CNH 2,021,323 11/05/2017 Citibank (283) 0.00
Unrealised Loss on Forward Currency Exchange Contracts (179,059) (1.28)
USD Hedged Share ClassUSD 102,664 EUR 92,890 08/07/2016 J.P. Morgan (549) (0.01)
Unrealised Loss on NAV Hedged Share Classes Forward Currency Exchange Contracts (549) (0.01)
Total Unrealised Loss on Forward Currency Exchange Contracts (179,608) (1.29)
Net Unrealised Gain on Forward Currency Exchange Contracts 132,082 0.94
Credit Default Swap Contracts
Nominal Amount Ccy Counterparty
Reference Entity
Buy/Sell
Interest (Paid)/
ReceivedMaturity
Date
Market Value EUR
Unrealised Gain/(Loss)
EUR
% of Net Assets
240,145 USD Barclays CDX.NA.HY.25-V2 Sell 5.00% 20/12/2020 8,321 8,321 0.06
Total Unrealised Gain on Credit Default Swap Contracts 8,321 8,321 0.06
100,000 USD Barclays Russian Foreign Bond 7.5% 31/03/2030 Sell 1.00% 20/06/2021 (5,430) (5,430) (0.04)
Total Unrealised Loss on Credit Default Swap Contracts (5,430) (5,430) (0.04)
Net Unrealised Gain on Credit Default Swap Contracts 2,891 2,891 0.02
Interest Rate Swap Contracts (continued)
Nominal Amount Ccy Counterparty
Security Description
Maturity Date
Market Value EUR
Unrealised Gain/(Loss)
EUR
% of Net Assets
221,000 AUD J.P. Morgan Pay floating BBR 6 month
Receive fixed 2.436% 20/05/2026 3,122 3,122 0.02129,000 AUD J.P. Morgan Pay floating BBR
6 month Receive fixed 2.538% 05/05/2026 2,609 2,609 0.02
129,000 AUD Citibank Pay floating BBR 6 month
Receive fixed 2.5% 06/05/2026 2,320 2,320 0.02130,000 AUD Bank of America Pay floating BBR
6 month Receive fixed 2.49% 06/05/2026 2,259 2,259 0.01
Total Unrealised Gain on Interest Rate Swap Contracts 10,310 10,310 0.07
301,000 USD Goldman Sachs Pay fixed 1.708% Receive floating LIBOR
3 month 11/03/2026 (10,604) (10,604) (0.08)239,000 USD Citibank Pay fixed 1.71%
Receive floating LIBOR 3 month 11/03/2026 (8,460) (8,460) (0.06)
350,000 USD Goldman Sachs Pay fixed 1.592% Receive floating LIBOR
3 month 13/05/2026 (7,674) (7,674) (0.05)260,000 USD Goldman Sachs Pay fixed 1.276%
Receive floating LIBOR 3 month 07/03/2021 (4,093) (4,093) (0.03)
528,000 SEK J.P. Morgan Pay fixed 1.286% Receive floating STIBOR
3 month 07/10/2025 (3,544) (3,544) (0.02)416,600 SEK J.P. Morgan Pay fixed 1.33%
Receive floating STIBOR 3 month 08/10/2025 (2,984) (2,984) (0.02)
464,000 SEK J.P. Morgan Pay fixed 1.254% Receive floating STIBOR
3 month 06/10/2025 (2,963) (2,963) (0.02)380,000 SEK J.P. Morgan Pay fixed 1.385%
Receive floating STIBOR 3 month 13/10/2025 (2,925) (2,925) (0.02)
424,000 SEK Citibank Pay fixed 1.278% Receive floating STIBOR
3 month 06/10/2025 (2,812) (2,812) (0.02)342,000 SEK Citibank Pay fixed 1.393%
Receive floating STIBOR 3 month 13/10/2025 (2,663) (2,663) (0.02)
60,000 USD Barclays Pay fixed 1.64% Receive floating LIBOR
3 month 06/04/2026 (1,638) (1,638) (0.01)
DERIVATIVES (continued)
Over-the-counter (OTC) and exchange traded derivatives as at 30 June 2016, expressed in Euro.
DERIVATIVES (continued)
Over-the-counter (OTC) and exchange traded derivatives as at 30 June 2016, expressed in Euro.
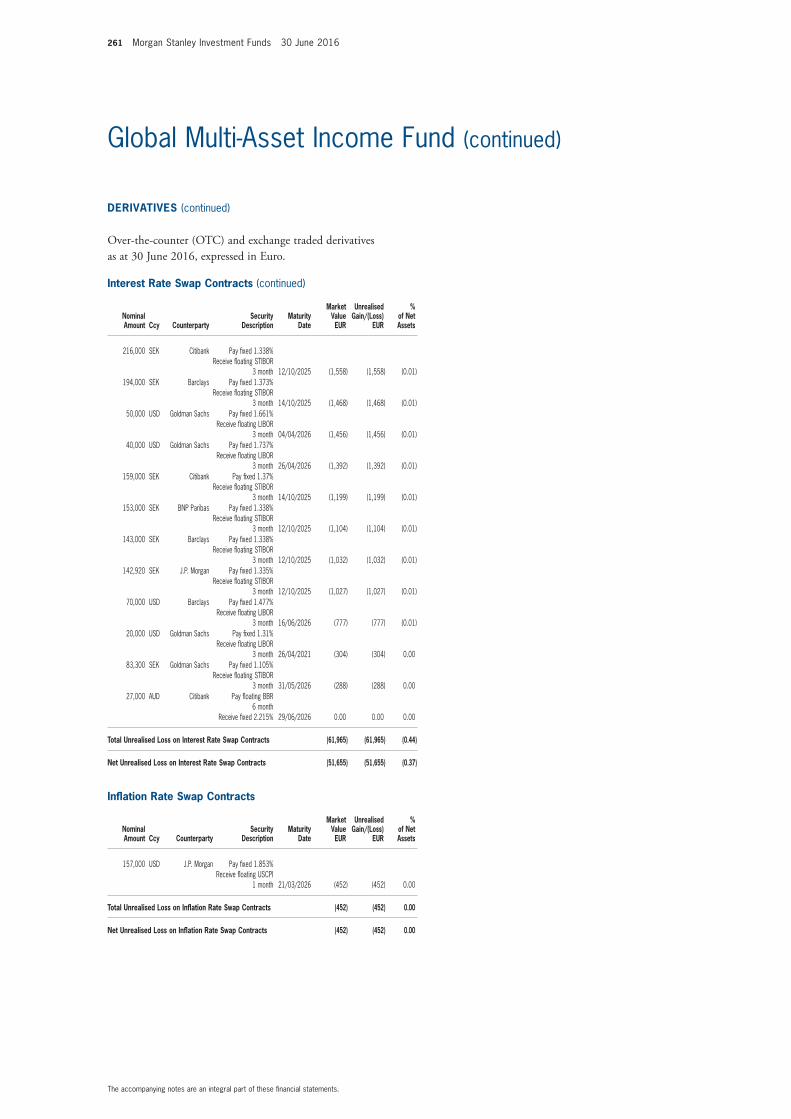
261 Morgan Stanley Investment Funds 30 June 2016
The accompanying notes are an integral part of these financial statements.
Global Multi-Asset Income Fund (continued)
Interest Rate Swap Contracts (continued)
Nominal Amount Ccy Counterparty
Security Description
Maturity Date
Market Value EUR
Unrealised Gain/(Loss)
EUR
% of Net Assets
216,000 SEK Citibank Pay fixed 1.338% Receive floating STIBOR
3 month 12/10/2025 (1,558) (1,558) (0.01)194,000 SEK Barclays Pay fixed 1.373%
Receive floating STIBOR 3 month 14/10/2025 (1,468) (1,468) (0.01)
50,000 USD Goldman Sachs Pay fixed 1.661% Receive floating LIBOR
3 month 04/04/2026 (1,456) (1,456) (0.01)40,000 USD Goldman Sachs Pay fixed 1.737%
Receive floating LIBOR 3 month 26/04/2026 (1,392) (1,392) (0.01)
159,000 SEK Citibank Pay fixed 1.37% Receive floating STIBOR
3 month 14/10/2025 (1,199) (1,199) (0.01)153,000 SEK BNP Paribas Pay fixed 1.338%
Receive floating STIBOR 3 month 12/10/2025 (1,104) (1,104) (0.01)
143,000 SEK Barclays Pay fixed 1.338% Receive floating STIBOR
3 month 12/10/2025 (1,032) (1,032) (0.01)142,920 SEK J.P. Morgan Pay fixed 1.335%
Receive floating STIBOR 3 month 12/10/2025 (1,027) (1,027) (0.01)
70,000 USD Barclays Pay fixed 1.477% Receive floating LIBOR
3 month 16/06/2026 (777) (777) (0.01)20,000 USD Goldman Sachs Pay fixed 1.31%
Receive floating LIBOR 3 month 26/04/2021 (304) (304) 0.00
83,300 SEK Goldman Sachs Pay fixed 1.105% Receive floating STIBOR
3 month 31/05/2026 (288) (288) 0.0027,000 AUD Citibank Pay floating BBR
6 month Receive fixed 2.215% 29/06/2026 0.00 0.00 0.00
Total Unrealised Loss on Interest Rate Swap Contracts (61,965) (61,965) (0.44)
Net Unrealised Loss on Interest Rate Swap Contracts (51,655) (51,655) (0.37)
Inflation Rate Swap Contracts
Nominal Amount Ccy Counterparty
Security Description
Maturity Date
Market Value EUR
Unrealised Gain/(Loss)
EUR
% of Net Assets
157,000 USD J.P. Morgan Pay fixed 1.853% Receive floating USCPI
1 month 21/03/2026 (452) (452) 0.00
Total Unrealised Loss on Inflation Rate Swap Contracts (452) (452) 0.00
Net Unrealised Loss on Inflation Rate Swap Contracts (452) (452) 0.00
DERIVATIVES (continued)
Over-the-counter (OTC) and exchange traded derivatives as at 30 June 2016, expressed in Euro.

Morgan Stanley Investment Funds 30 June 2016 262
The accompanying notes are an integral part of these financial statements.
Global Multi-Asset Income Fund (continued)
Total Return Swap Contracts
Nominal Amount Currency Counterparty Security Description Maturity Date
Global Exposure
Unrealised Gain/(Loss)
EUR
% of Net Assets
30,007 USD Bank of America Pay Bank of America- Merrill Lynch US Apt REITS Custom Basket Index Receive USD LIBOR 3 month + - 24.00bp 15/04/2017 23 23 0.0029,882 USD Goldman Sachs Pay Goldman Sachs Copper Miners Custom Basket Index Receive USD LIBOR 3 month + - 110.00bp 10/05/2017 49 49 0.00
503,581 USD Goldman Sachs Pay Goldman Sachs Global Aerospace Custom Basket Index Receive USD LIBOR 3 month + - 25.00bp 01/04/2017 5,941 5,941 0.04230,000 USD Goldman Sachs Pay USD LIBOR 3 month Receive Markit iBoxx USD Liquid High Yield Index 20/12/2016 2,957 2,957 0.02
13,379 USD Goldman Sachs Pay Brent Crude Total Return Index Receive a fixed revenue of 1.15% 06/06/2017 560 560 0.0120,349 USD Goldman Sachs Pay Brent Crude Total Return Index Receive a fixed revenue of 1.15% 06/06/2017 354 354 0.00
Total Unrealised Gain on Total Return Swap Contracts 9,884 9,884 0.07
244,123 USD Bank of America Pay Bank of America- Merrill Lynch US Apt REITS Custom Basket Index Receive USD LIBOR 3 month + - 24.00bp 15/04/2017 (4,971) (4,971) (0.03)308,747 USD Citibank Pay Citibank US Media Custom Basket Index Receive USD LIBOR 3 month + - 13.00bp 03/02/2017 (10,125) (10,125) (0.07)
39,716 USD Goldman Sachs Pay Goldman Sachs Iron & Ore Miners Custom Basket Index Receive USD LIBOR 3 month + - 65.00bp 10/05/2017 (3,588) (3,588) (0.03)96,029 USD Goldman Sachs Pay Goldman Sachs US Consumer Staples Custom Basket Index Receive USD LIBOR 3 month + - 15.00bp 26/02/2017 (2,423) (2,423) (0.02)89,963 USD J.P. Morgan Pay JPMorgan Chinese Internets Custom Basket Index Receive USD LIBOR 3 month + - 1.00bp 05/05/2017 (2,909) (2,909) (0.02)
Total Unrealised Loss on Total Return Swap Contracts (24,016) (24,016) (0.17)
Net Unrealised Loss on Total Return Swap Contracts (14,132) (14,132) (0.10)
Collateral received and paid by the Fund in respect of financial derivative instruments:
Type of Collateral Counterparty CurrencyCollateral Amount
receivedCollateral Amount
paid
Global Multi-Asset Income Fund
Cash Goldman Sachs EUR 426,813 1,632
426,813 1,632
DERIVATIVES (continued)
Over-the-counter (OTC) and exchange traded derivatives as at 30 June 2016, expressed in Euro.

263 Morgan Stanley Investment Funds 30 June 2016
The accompanying notes are an integral part of these financial statements.
Please refer to the full prospectus for the Fund’s investment objective and policy.
INVESTMENT AIM
To provide an attractive level of total return primarily through investment in a global portfolio of securities including equity securities, fixed income securities, derivatives, ETFs and exchange traded notes. These securities will be used in order to gain exposure to the performance of a range of strategies commonly used by hedge funds including, but not limited to, long short security selection (“alpha strategies”) and alternative beta or trading strategies (“alternative beta strategies”). The Fund intends to provide access to this hedge fund performance by investing only in securities whose liquidity profile is consistent with that of a daily dealing fund.
SCHEDULE OF INVESTMENTSAs at 30 June 2016
Investments Currency
Quantity/Nominal
Value
Market Value USD
% of Net Assets
Transferable securities and money market instruments admitted to official exchange listing or dealt in on another regulated market
Equities
CanadaCanadian Pacific Railway Ltd. USD 7,682 966,703 3.84Cott Corp. USD 29,732 411,193 1.63
1,377,896 5.47
IsraelTeva Pharmaceutical Industries Ltd., ADR USD 6,962 347,822 1.38
347,822 1.38
United KingdomNomad Foods Ltd.
(British Virgin Islands) (2) USD 51,585 411,648 1.63
411,648 1.63
United States of AmericaAdobe Systems, Inc. USD 2,966 280,524 1.11AGCO Corp. USD 2,620 122,223 0.49Air Products & Chemicals, Inc. USD 2,101 292,606 1.16Alliance Data Systems Corp. USD 2,025 387,707 1.54Aramark USD 8,481 278,092 1.11Autodesk, Inc. USD 22,221 1,184,157 4.70Bank of America Corp. USD 23,156 305,219 1.21Bank of New York Mellon Corp. (The) USD 31,197 1,197,965 4.76Baxter International, Inc. USD 20,246 907,426 3.60Berkshire Hathaway, Inc. ‘B’ USD 2,067 294,134 1.17Broadcom Ltd. (Singapore) (2) USD 3,931 609,502 2.42BWX Technologies, Inc. USD 16,721 592,091 2.35Comcast Corp. ‘A’ USD 10,511 675,647 2.68Dow Chemical Co. (The) USD 7,298 360,156 1.43Expedia, Inc. USD 2,892 300,681 1.19FleetCor Technologies, Inc. USD 1,909 269,952 1.07Gaming and Leisure Properties, Inc., REIT USD 13,120 448,048 1.78Goldman Sachs Group, Inc. (The) USD 3,106 453,973 1.80Home Depot, Inc. (The) USD 2,051 259,000 1.03Investors Bancorp, Inc. USD 48,978 536,309 2.13Johnson & Johnson USD 2,258 269,108 1.07MasterCard, Inc. ‘A’ USD 6,569 603,823 2.40Mohawk Industries, Inc. USD 1,382 259,014 1.03Moody’s Corp. USD 5,003 458,775 1.82O’Reilly Automotive, Inc. USD 1,752 474,757 1.89PayPal Holdings, Inc. USD 8,361 298,320 1.19Priceline Group, Inc. (The) USD 446 559,288 2.22Restaurant Brands International, Inc.
(Canada) (2) USD 4,431 182,025 0.72Roper Technologies, Inc. USD 2,150 361,179 1.43Sabre Corp. USD 16,568 441,040 1.75Six Flags Entertainment Corp. USD 4,460 258,725 1.03Southwest Airlines Co. USD 7,608 294,810 1.17Spirit AeroSystems Holdings, Inc. ‘A’ USD 12,265 521,385 2.07TJX Cos., Inc. (The) USD 9,512 726,146 2.88United Therapeutics Corp. USD 3,749 388,734 1.54US Bancorp USD 9,502 378,085 1.50
Liquid Alpha Capture Fund
Alternative Investment Funds

Morgan Stanley Investment Funds 30 June 2016 264
The accompanying notes are an integral part of these financial statements.
Liquid Alpha Capture Fund (continued)
SCHEDULE OF INVESTMENTSAs at 30 June 2016
Investments Currency
Quantity/Nominal
Value
Market Value USD
% of Net Assets
Transferable securities and money market instruments admitted to official exchange listing or dealt in on another regulated market
Equities (continued)
United States of America (continued)Visa, Inc. ‘A’ USD 7,609 582,545 2.31Wells Fargo & Co. USD 14,792 692,118 2.75Willis Towers Watson plc (Ireland) (2) USD 5,786 704,677 2.80
18,209,966 72.30
Total Equities 20,347,332 80.78
Total Transferable securities and money market instruments admitted to official exchange listing or dealt in on another regulated market 20,347,332 80.78
Units of authorised UCITS or other collective investment undertakings
Collective Investment Schemes – UCITS
LuxembourgMorgan Stanley Liquidity Funds US Dollar
Liquidity Fund – MS Reserve (4) USD 2,422,404 2,422,404 9.62
2,422,404 9.62
Total Collective Investment Schemes – UCITS 2,422,404 9.62
Total Units of authorised UCITS or other collective investment undertakings 2,422,404 9.62
Total Investments 22,769,736 90.40
Cash 2,325,980 9.23
Other Assets/(Liabilities) 91,090 0.37
Total Net Assets 25,186,806 100.00
(2) The country in brackets represents the country of incorporation of this security.(4) Affiliate managed by an affiliate of the Investment Adviser.
Financial Futures Contracts
Security DescriptionNumber of Contracts Currency
Global Exposure
USD
Unrealised Gain/(Loss)
USD
% of Net Assets
Russell 1000 Value Index, 16/09/2016 (6) USD (594,300) 12,240 0.05S&P 500 Emini Index, 16/09/2016 (63) USD (6,495,300) 35,717 0.14
Unrealised Gain on Financial Futures Contracts 47,957 0.19
Total Unrealised Gain on Financial Futures Contracts 47,957 0.19
Russell 1000 Growth Index, 16/09/2016 7 USD 693,910 (16,660) (0.07)
Unrealised Loss on Financial Futures Contracts (16,660) (0.07)
Total Unrealised Loss on Financial Futures Contracts (16,660) (0.07)
Net Unrealised Gain on Financial Futures Contracts 31,297 0.12
Forward Currency Exchange Contracts
Currency Purchased
Amount Purchased
Currency Sold
Amount Sold
Maturity Date Counterparty
Unrealised Gain/(Loss)
USD
% of Net Assets
EUR Hedged Share ClassEUR 527,924 USD 583,472 08/07/2016 J.P. Morgan 3,470 0.02
GBP Hedged Share ClassGBP 53,903 USD 71,893 08/07/2016 J.P. Morgan 540 0.00
Unrealised Gain on NAV Hedged Share Classes Forward Currency Exchange Contracts 4,010 0.02
Total Unrealised Gain on Forward Currency Exchange Contracts 4,010 0.02
EUR Hedged Share ClassEUR 549,326 USD 618,837 01/07/2016 J.P. Morgan (8,185) (0.04)USD 606,950 EUR 549,326 01/07/2016 J.P. Morgan (3,702) (0.01)
GBP Hedged Share ClassGBP 56,171 USD 82,386 01/07/2016 J.P. Morgan (6,906) (0.03)USD 74,915 GBP 56,171 01/07/2016 J.P. Morgan (565) 0.00
Unrealised Loss on NAV Hedged Share Classes Forward Currency Exchange Contracts (19,358) (0.08)
Total Unrealised Loss on Forward Currency Exchange Contracts (19,358) (0.08)
Net Unrealised Loss on Forward Currency Exchange Contracts (15,348) (0.06)
DERIVATIVES
Over-the-counter (OTC) and exchange traded derivatives as at 30 June 2016, expressed in US dollars.
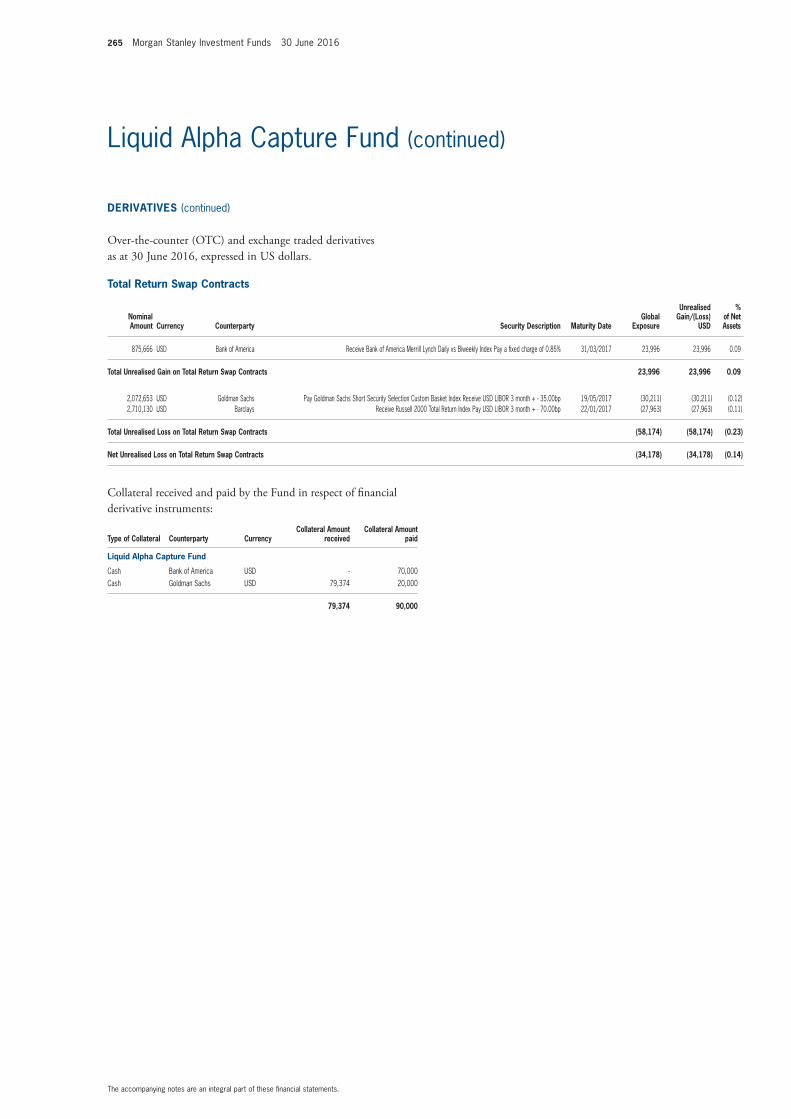
265 Morgan Stanley Investment Funds 30 June 2016
The accompanying notes are an integral part of these financial statements.
Liquid Alpha Capture Fund (continued)
Total Return Swap Contracts
Nominal Amount Currency Counterparty Security Description Maturity Date
Global Exposure
Unrealised Gain/(Loss)
USD
% of Net Assets
875,666 USD Bank of America Receive Bank of America Merrill Lynch Daily vs Biweekly Index Pay a fixed charge of 0.85% 31/03/2017 23,996 23,996 0.09
Total Unrealised Gain on Total Return Swap Contracts 23,996 23,996 0.09
2,072,653 USD Goldman Sachs Pay Goldman Sachs Short Security Selection Custom Basket Index Receive USD LIBOR 3 month + - 35.00bp 19/05/2017 (30,211) (30,211) (0.12)2,710,130 USD Barclays Receive Russell 2000 Total Return Index Pay USD LIBOR 3 month + - 70.00bp 22/01/2017 (27,963) (27,963) (0.11)
Total Unrealised Loss on Total Return Swap Contracts (58,174) (58,174) (0.23)
Net Unrealised Loss on Total Return Swap Contracts (34,178) (34,178) (0.14)
Collateral received and paid by the Fund in respect of financial derivative instruments:
Type of Collateral Counterparty CurrencyCollateral Amount
receivedCollateral Amount
paid
Liquid Alpha Capture Fund
Cash Bank of America USD - 70,000Cash Goldman Sachs USD 79,374 20,000
79,374 90,000
DERIVATIVES (continued)
Over-the-counter (OTC) and exchange traded derivatives as at 30 June 2016, expressed in US dollars.

Morgan Stanley Investment Funds 30 June 2016 266
The accompanying notes are an integral part of these financial statements.
Please refer to the full prospectus for the Fund’s investment objective and policy.
SCHEDULE OF INVESTMENTSAs at 30 June 2016
Investments Currency
Quantity/Nominal
Value
Market Value USD
% of Net Assets
Transferable securities and money market instruments admitted to official exchange listing or dealt in on another regulated market
Equities
CanadaCanadian Pacific Railway Ltd. USD 760 97,881 0.99Cott Corp. USD 2,268 31,661 0.32Enbridge, Inc. USD 146 6,185 0.06Inter Pipeline Ltd. CAD 13 274 0.00
136,001 1.37
IsraelTeva Pharmaceutical Industries Ltd., ADR USD 706 35,462 0.36
35,462 0.36
United KingdomNomad Foods Ltd.
(British Virgin Islands) (2) USD 3,956 31,569 0.32
31,569 0.32
United States of AmericaAdobe Systems, Inc. USD 301 28,833 0.29AGCO Corp. USD 259 12,207 0.12AGL Resources, Inc. USD 3 198 0.00Air Products & Chemicals, Inc. USD 213 30,254 0.30Alliance Data Systems Corp. USD 154 30,172 0.30American Capital Ltd. USD 5,793 91,703 0.92American Capital Senior Floating Ltd.A140 USD 491 5,038 0.05American States Water Co. USD 183 8,019 0.08American Tower Corp., REIT USD 93 10,566 0.11American Water Works Co., Inc. USD 186 15,719 0.16Apollo Investment Corp. USD 7,487 41,478 0.42Aqua America, Inc. USD 299 10,662 0.11Aramark USD 861 28,775 0.29Ares Capital Corp. USD 7,820 111,044 1.12Atmos Energy Corp. USD 2 163 0.00Autodesk, Inc. USD 2,199 119,054 1.20Bank of America Corp. USD 2,350 31,184 0.31Bank of New York Mellon Corp. (The) USD 3,087 119,930 1.21Baxter International, Inc. USD 2,004 90,621 0.91Berkshire Hathaway, Inc. ‘B’ USD 210 30,406 0.31BlackRock Capital Investment Corp. USD 2,601 20,236 0.20Broadcom Ltd. (Singapore) (2) USD 399 62,005 0.62BWX Technologies, Inc. USD 1,655 59,199 0.60California Water Service Group USD 195 6,811 0.07Capital Southwest Corp. USD 416 5,687 0.06Capitala Finance Corp. USD 445 6,230 0.06CenterPoint Energy, Inc. USD 287 6,888 0.07Cheniere Energy, Inc. USD 65 2,441 0.02Columbia Pipeline Group, Inc. USD 4 102 0.00Comcast Corp. ‘A’ USD 1,067 69,558 0.70Consolidated Edison, Inc. USD 124 9,975 0.10Crown Castle International Corp., REIT USD 169 17,142 0.17Dow Chemical Co. (The) USD 722 35,891 0.36Eversource Energy USD 163 9,764 0.10Expedia, Inc. USD 294 31,252 0.31Fidus Investment Corp. USD 360 5,497 0.06Fifth Street Finance Corp. USD 7,139 34,624 0.35Fifth Street Senior Floating Rate Corp. USD 1,287 10,244 0.10FleetCor Technologies, Inc. USD 194 27,767 0.28
Liquid Alternatives Fund
INVESTMENT AIM
To provide an attractive level of return while managing total portfolio risk. The Fund will seek to achieve its investment objective through investment primarily in non-traditional asset classes either by investment in collective investment schemes or direct investment in eligible assets including equity securities, debt securities, derivatives, ETFs and exchange traded notes.

267 Morgan Stanley Investment Funds 30 June 2016
The accompanying notes are an integral part of these financial statements.
Liquid Alternatives Fund (continued)
SCHEDULE OF INVESTMENTSAs at 30 June 2016
Investments Currency
Quantity/Nominal
Value
Market Value USD
% of Net Assets
Transferable securities and money market instruments admitted to official exchange listing or dealt in on another regulated market
Equities (continued)
United States of America (continued)FS Investment Corp. USD 6,268 56,725 0.57Gaming and Leisure Properties, Inc., REIT USD 991 34,170 0.34Garrison Capital, Inc. USD 347 3,501 0.04Gladstone Capital Corp. USD 1,082 7,834 0.08Gladstone Investment Corp. USD 1,403 10,045 0.10Goldman Sachs BDC, Inc. USD 682 13,633 0.14Goldman Sachs Group, Inc. (The) USD 315 46,803 0.47Golub Capital BDC, Inc. USD 1,322 23,889 0.24Hercules Capital, Inc. USD 2,627 32,627 0.33Home Depot, Inc. (The) USD 208 26,559 0.27Horizon Technology Finance Corp. USD 393 4,795 0.05Investors Bancorp, Inc. USD 4,847 53,705 0.54ITC Holdings Corp. USD 177 8,287 0.08Johnson & Johnson USD 229 27,778 0.28KCAP Financial, Inc. USD 890 3,489 0.04Kinder Morgan, Inc. USD 213 3,987 0.04Main Street Capital Corp. USD 1,999 65,667 0.66MasterCard, Inc. ‘A’ USD 667 58,736 0.59Medallion Financial Corp. USD 656 4,841 0.05Medley Capital Corp. USD 3,753 25,145 0.25Mohawk Industries, Inc. USD 140 26,566 0.27Monroe Capital Corp. USD 388 5,754 0.06Moody’s Corp. USD 508 47,605 0.48MVC Capital, Inc. USD 376 3,023 0.03New Jersey Resources Corp. USD 12 463 0.00New Mountain Finance Corp. USD 3,429 44,234 0.45Newtek Business Services Corp. USD 818 10,405 0.11NiSource, Inc. USD 56 1,485 0.02Northwest Natural Gas Co. USD 63 4,084 0.04NorthWestern Corp. USD 154 9,713 0.10ONE Gas, Inc. USD 155 10,321 0.10ONEOK, Inc. USD 96 4,555 0.05O’Reilly Automotive, Inc. USD 178 48,256 0.49PayPal Holdings, Inc. USD 849 30,997 0.31Pembina Pipeline Corp. (Canada) (2) USD 358 10,862 0.11PennantPark Floating Rate Capital Ltd. USD 881 10,924 0.11PennantPark Investment Corp. USD 2,996 20,463 0.21PG&E Corp. USD 159 10,163 0.10Piedmont Natural Gas Co., Inc. USD 3 180 0.00Priceline Group, Inc. (The) USD 45 56,178 0.56Prospect Capital Corp. USD 11,488 89,836 0.90Restaurant Brands International, Inc.
(Canada) (2) USD 438 18,221 0.18Roper Technologies, Inc. USD 218 37,182 0.37Sabre Corp. USD 1,681 45,034 0.45SBA Communications Corp. ‘A’ USD 73 7,880 0.08SemGroup Corp. ‘A’ USD 1 33 0.00Sempra Energy USD 32 3,649 0.04Six Flags Entertainment Corp. USD 453 26,251 0.26Solar Capital Ltd. USD 1,305 24,860 0.25Solar Senior Capital Ltd. USD 212 3,415 0.03Southwest Airlines Co. USD 772 30,270 0.30Southwest Gas Corp. USD 18 1,417 0.01Spectra Energy Corp. USD 229 8,388 0.08Spire, Inc. USD 112 7,934 0.08Spirit AeroSystems Holdings, Inc. ‘A’ USD 1,245 53,535 0.54Stellus Capital Investment Corp. USD 378 3,871 0.04Targa Resources Corp. USD 51 2,149 0.02TCP Capital Corp. USD 1,424 21,759 0.22THL Credit, Inc. USD 685 7,624 0.08
SCHEDULE OF INVESTMENTSAs at 30 June 2016
Investments Currency
Quantity/Nominal
Value
Market Value USD
% of Net Assets
Transferable securities and money market instruments admitted to official exchange listing or dealt in on another regulated market
Equities (continued)
United States of America (continued)TICC Capital Corp. USD 1,880 9,908 0.10TJX Cos., Inc. (The) USD 965 74,527 0.75TPG Specialty Lending, Inc. USD 1,043 17,324 0.17TransCanada Corp. (Canada) (2) USD 139 6,286 0.06Triangle Capital Corp. USD 1,145 22,190 0.22United Therapeutics Corp. USD 381 40,355 0.41US Bancorp USD 964 38,878 0.39Visa, Inc. ‘A’ USD 772 57,259 0.58Wells Fargo & Co. USD 1,501 71,042 0.72WGL Holdings, Inc. USD 11 779 0.01WhiteHorse Finance, Inc. USD 249 2,694 0.03Williams Cos., Inc. (The) USD 164 3,547 0.04Willis Towers Watson plc (Ireland) (2) USD 498 61,906 0.62
2,905,789 29.23
Total Equities 3,108,821 31.28
Total Transferable securities and money market instruments admitted to official exchange listing or dealt in on another regulated market 3,108,821 31.28
Units of authorised UCITS or other collective investment undertakings
Collective Investment Schemes – UCITS
IrelandFundlogic MS Ascend UCITS Fund –
Class P USD (4) USD 705 770,094 7.75Morgan Stanley Long Term Trends Fund –
Class B USD (4) USD 811 926,047 9.31
1,696,141 17.06
LuxembourgBlackRock Global High Yield Bond Fund –
Class I2-USD USD 14,359 319,353 3.21Deutsche DB Platinum Ivory Optimal –
I1C-U USD 7,079 643,954 6.48Deutsche Global Real Estate Securities
Fund – USD FC USD 1,616 263,128 2.65HSBC Frontier Markets Fund – Class IC USD 5,144 673,551 6.78Morgan Stanley Investment Funds
European Currencies High Yield Bond Fund – Class Z (4) EUR 7,635 428,397 4.31
Morgan Stanley Investment Funds Global Convertible Bond Fund – Class Z (4) USD 15,421 487,783 4.91
Schroder GAIA Paulson Merger Arbitrage - Class E (Accumulation) USD USD 4,867 350,869 3.53
TCW Emerging Markets Local Currency Income Fund – IU USD 130 106,560 1.07
3,273,595 32.94
Total Collective Investment Schemes – UCITS 4,969,736 50.00

Morgan Stanley Investment Funds 30 June 2016 268
The accompanying notes are an integral part of these financial statements.
Liquid Alternatives Fund (continued)
DERIVATIVES
Over-the-counter (OTC) and exchange traded derivatives as at 30 June 2016, expressed in US dollars.
Financial Futures Contracts
Security DescriptionNumber of Contracts Currency
Global Exposure
USD
Unrealised Gain/(Loss)
USD
% of Net Assets
S&P 500 Emini Index, 16/09/2016 (10) USD (1,045,125) (8,516) (0.09)
Total Unrealised Loss on Financial Futures Contracts (8,516) (0.09)
Net Unrealised Loss on Financial Futures Contracts (8,516) (0.09)
Forward Currency Exchange Contracts
Currency Purchased
Amount Purchased
Currency Sold
Amount Sold
Maturity Date Counterparty
Unrealised Gain/(Loss)
USD
% of Net Assets
USD 393,344 EUR 352,456 21/07/2016 J.P. Morgan 1,541 0.02
Unrealised Gain on Forward Currency Exchange Contracts 1,541 0.02
EUR Hedged Share ClassEUR 764,849 USD 847,831 08/07/2016 J.P. Morgan 1,991 0.02
GBP Hedged Share ClassGBP 55,221 USD 73,644 08/07/2016 J.P. Morgan 177 0.00
Unrealised Gain on NAV Hedged Share Classes Forward Currency Exchange Contracts 2,168 0.02
Total Unrealised Gain on Forward Currency Exchange Contracts 3,709 0.04
EUR Hedged Share ClassEUR 535,645 USD 606,371 01/07/2016 J.P. Morgan (11,296) (0.11)USD 593,120 EUR 535,645 01/07/2016 J.P. Morgan (1,955) (0.02)
GBP Hedged Share ClassGBP 56,423 USD 83,153 01/07/2016 J.P. Morgan (7,726) (0.08)USD 75,240 GBP 56,423 01/07/2016 J.P. Morgan (186) –
Unrealised Loss on NAV Hedged Share Classes Forward Currency Exchange Contracts (21,163) (0.21)
Total Unrealised Loss on Forward Currency Exchange Contracts (21,163) (0.21)
Net Unrealised Loss on Forward Currency Exchange Contracts (17,454) (0.17)
SCHEDULE OF INVESTMENTSAs at 30 June 2016
Investments Currency
Quantity/Nominal
Value
Market Value USD
% of Net Assets
Units of authorised UCITS or other collective investment undertakings
Exchange Traded Funds
United States of AmericaE-TRACS Bloomberg Commodity Index
Total Return Fund (Jersey) (2) USD 10,600 171,931 1.73
171,931 1.73
Total Exchange Traded Funds 171,931 1.73
Total Units of authorised UCITS or other collective investment undertakings 5,141,667 51.73
Total Investments 8,250,488 83.01
Cash 1,432,375 14.41
Other Assets/(Liabilities) 256,739 2.58
Total Net Assets 9,939,602 100.00
(2) The country in brackets represents the country of incorporation of this security.(4) Affiliate managed by an affiliate of the Investment Adviser.
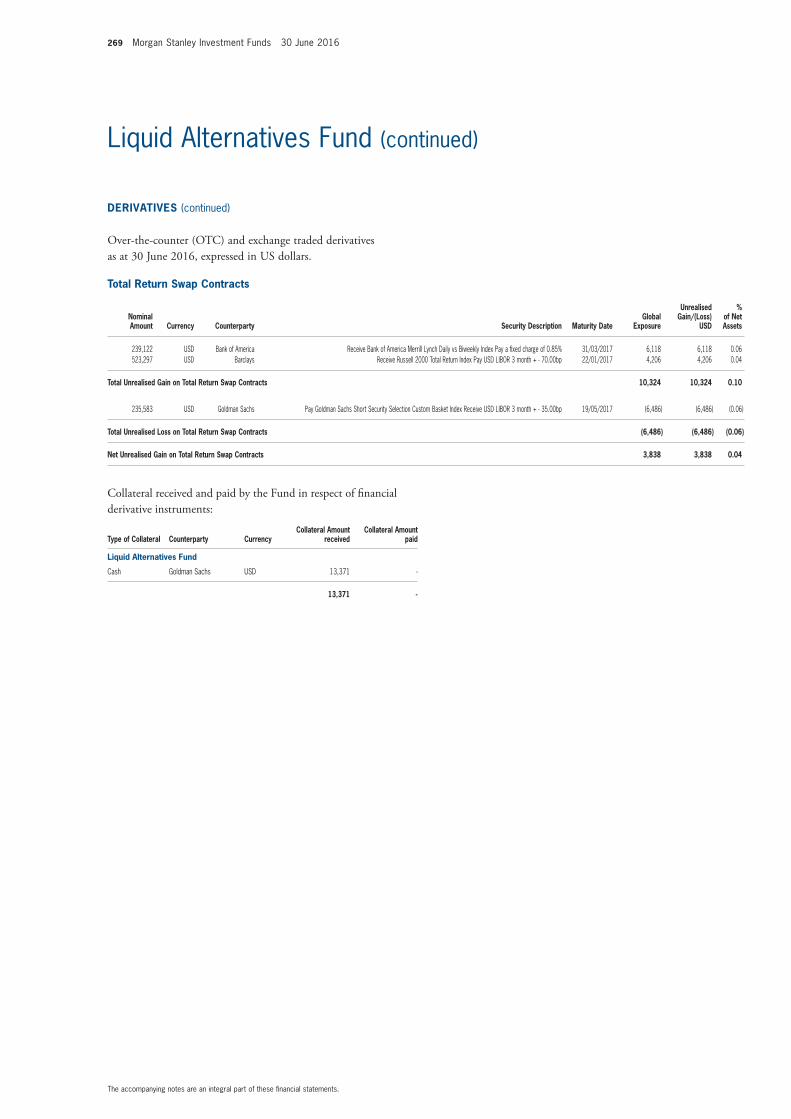
269 Morgan Stanley Investment Funds 30 June 2016
The accompanying notes are an integral part of these financial statements.
Liquid Alternatives Fund (continued)
Total Return Swap Contracts
Nominal Amount Currency Counterparty Security Description Maturity Date
Global Exposure
Unrealised Gain/(Loss)
USD
% of Net Assets
239,122 USD Bank of America Receive Bank of America Merrill Lynch Daily vs Biweekly Index Pay a fixed charge of 0.85% 31/03/2017 6,118 6,118 0.06523,297 USD Barclays Receive Russell 2000 Total Return Index Pay USD LIBOR 3 month + - 70.00bp 22/01/2017 4,206 4,206 0.04
Total Unrealised Gain on Total Return Swap Contracts 10,324 10,324 0.10
235,583 USD Goldman Sachs Pay Goldman Sachs Short Security Selection Custom Basket Index Receive USD LIBOR 3 month + - 35.00bp 19/05/2017 (6,486) (6,486) (0.06)
Total Unrealised Loss on Total Return Swap Contracts (6,486) (6,486) (0.06)
Net Unrealised Gain on Total Return Swap Contracts 3,838 3,838 0.04
DERIVATIVES (continued)
Over-the-counter (OTC) and exchange traded derivatives as at 30 June 2016, expressed in US dollars.
Collateral received and paid by the Fund in respect of financial derivative instruments:
Type of Collateral Counterparty CurrencyCollateral Amount
receivedCollateral Amount
paid
Liquid Alternatives Fund
Cash Goldman Sachs USD 13,371 -
13,371 -
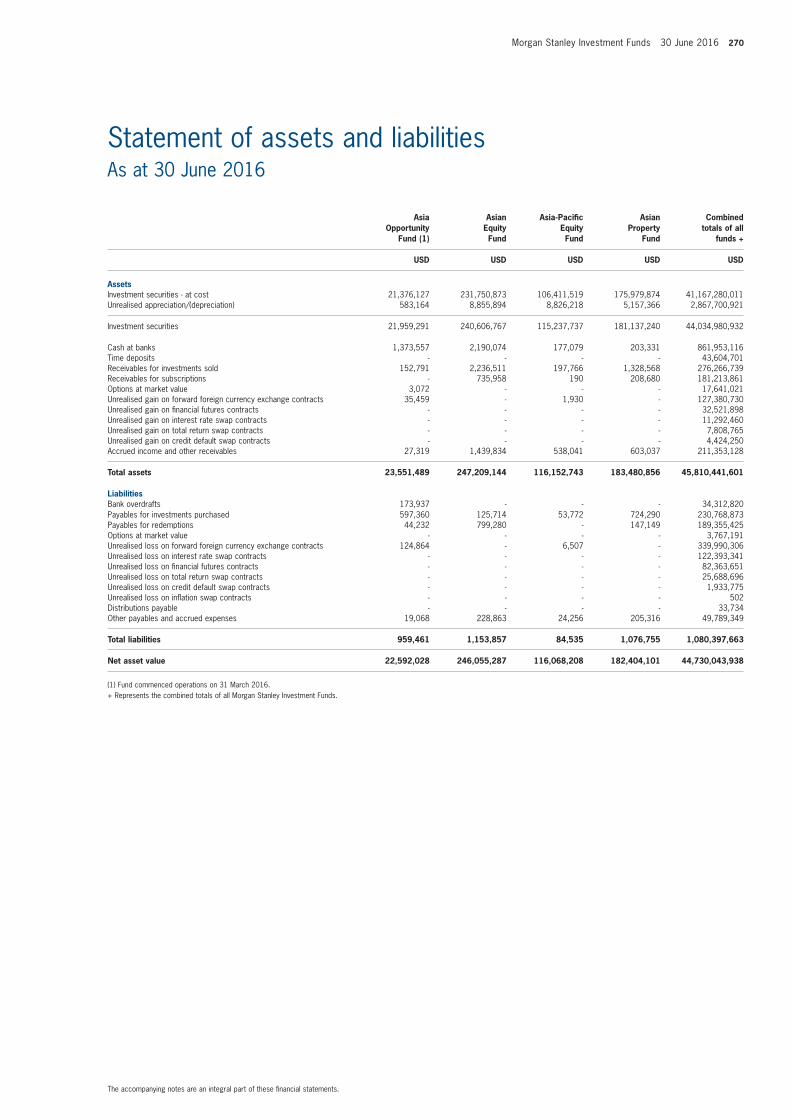
Morgan Stanley Investment Funds 30 June 2016 270
The accompanying notes are an integral part of these financial statements.
Statement of assets and liabilitiesAs at 30 June 2016
Asia Opportunity
Fund (1)
Asian
Equity Fund
Asia-Pacific Equity Fund
Asian Property
Fund
Combined totals of all
funds +
USD USD USD USD USD
AssetsInvestment securities - at cost 21,376,127 231,750,873 106,411,519 175,979,874 41,167,280,011 Unrealised appreciation/(depreciation) 583,164 8,855,894 8,826,218 5,157,366 2,867,700,921
Investment securities 21,959,291 240,606,767 115,237,737 181,137,240 44,034,980,932
Cash at banks 1,373,557 2,190,074 177,079 203,331 861,953,116 Time deposits - - - - 43,604,701 Receivables for investments sold 152,791 2,236,511 197,766 1,328,568 276,266,739 Receivables for subscriptions - 735,958 190 208,680 181,213,861 Options at market value 3,072 - - - 17,641,021 Unrealised gain on forward foreign currency exchange contracts 35,459 - 1,930 - 127,380,730 Unrealised gain on financial futures contracts - - - - 32,521,898 Unrealised gain on interest rate swap contracts - - - - 11,292,460 Unrealised gain on total return swap contracts - - - - 7,808,765 Unrealised gain on credit default swap contracts - - - - 4,424,250 Accrued income and other receivables 27,319 1,439,834 538,041 603,037 211,353,128
Total assets 23,551,489 247,209,144 116,152,743 183,480,856 45,810,441,601
LiabilitiesBank overdrafts 173,937 - - - 34,312,820 Payables for investments purchased 597,360 125,714 53,772 724,290 230,768,873 Payables for redemptions 44,232 799,280 - 147,149 189,355,425 Options at market value - - - - 3,767,191 Unrealised loss on forward foreign currency exchange contracts 124,864 - 6,507 - 339,990,306 Unrealised loss on interest rate swap contracts - - - - 122,393,341 Unrealised loss on financial futures contracts - - - - 82,363,651 Unrealised loss on total return swap contracts - - - - 25,688,696 Unrealised loss on credit default swap contracts - - - - 1,933,775 Unrealised loss on inflation swap contracts - - - - 502 Distributions payable - - - - 33,734 Other payables and accrued expenses 19,068 228,863 24,256 205,316 49,789,349
Total liabilities 959,461 1,153,857 84,535 1,076,755 1,080,397,663
Net asset value 22,592,028 246,055,287 116,068,208 182,404,101 44,730,043,938
(1) Fund commenced operations on 31 March 2016.+ Represents the combined totals of all Morgan Stanley Investment Funds.
Statements and Notes
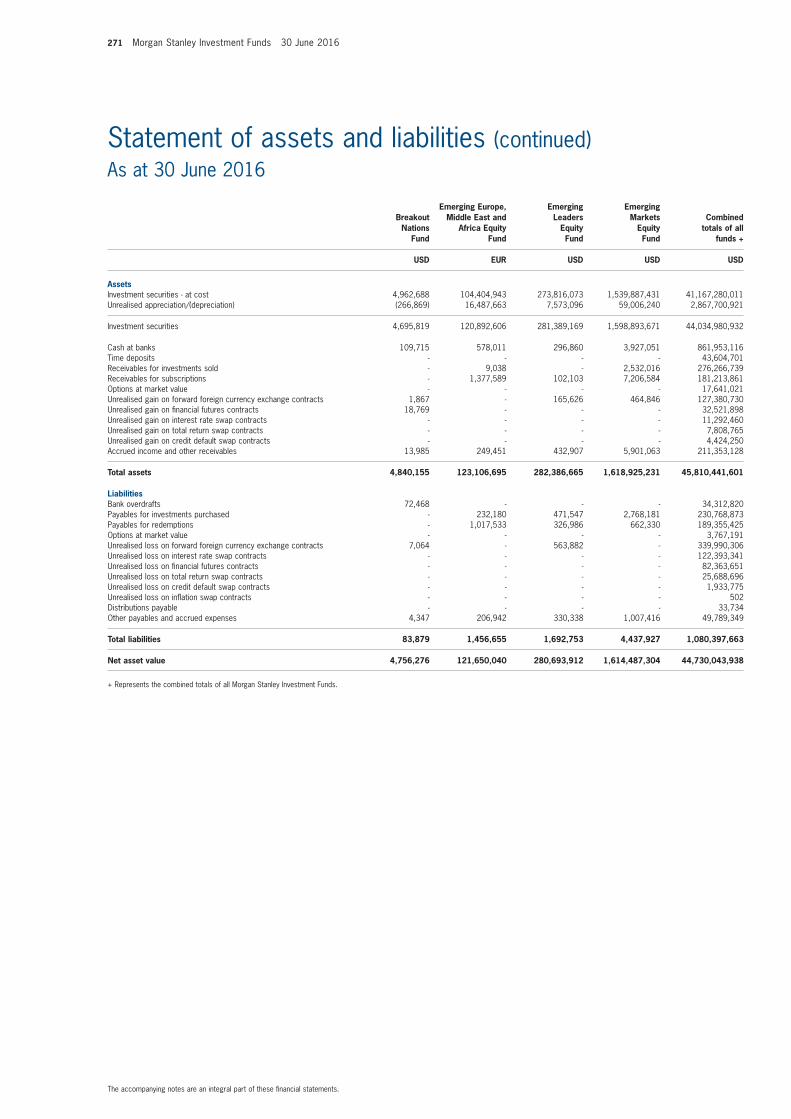
271 Morgan Stanley Investment Funds 30 June 2016
The accompanying notes are an integral part of these financial statements.
Statement of assets and liabilities (continued)As at 30 June 2016
Breakout Nations
Fund
Emerging Europe, Middle East and
Africa Equity Fund
Emerging Leaders
Equity Fund
Emerging Markets
Equity Fund
Combined totals of all
funds +
USD EUR USD USD USD
AssetsInvestment securities - at cost 4,962,688 104,404,943 273,816,073 1,539,887,431 41,167,280,011 Unrealised appreciation/(depreciation) (266,869) 16,487,663 7,573,096 59,006,240 2,867,700,921
Investment securities 4,695,819 120,892,606 281,389,169 1,598,893,671 44,034,980,932
Cash at banks 109,715 578,011 296,860 3,927,051 861,953,116 Time deposits - - - - 43,604,701 Receivables for investments sold - 9,038 - 2,532,016 276,266,739 Receivables for subscriptions - 1,377,589 102,103 7,206,584 181,213,861 Options at market value - - - - 17,641,021 Unrealised gain on forward foreign currency exchange contracts 1,867 - 165,626 464,846 127,380,730 Unrealised gain on financial futures contracts 18,769 - - - 32,521,898 Unrealised gain on interest rate swap contracts - - - - 11,292,460 Unrealised gain on total return swap contracts - - - - 7,808,765 Unrealised gain on credit default swap contracts - - - - 4,424,250 Accrued income and other receivables 13,985 249,451 432,907 5,901,063 211,353,128
Total assets 4,840,155 123,106,695 282,386,665 1,618,925,231 45,810,441,601
LiabilitiesBank overdrafts 72,468 - - - 34,312,820 Payables for investments purchased - 232,180 471,547 2,768,181 230,768,873 Payables for redemptions - 1,017,533 326,986 662,330 189,355,425 Options at market value - - - - 3,767,191 Unrealised loss on forward foreign currency exchange contracts 7,064 - 563,882 - 339,990,306 Unrealised loss on interest rate swap contracts - - - - 122,393,341 Unrealised loss on financial futures contracts - - - - 82,363,651 Unrealised loss on total return swap contracts - - - - 25,688,696 Unrealised loss on credit default swap contracts - - - - 1,933,775 Unrealised loss on inflation swap contracts - - - - 502 Distributions payable - - - - 33,734 Other payables and accrued expenses 4,347 206,942 330,338 1,007,416 49,789,349
Total liabilities 83,879 1,456,655 1,692,753 4,437,927 1,080,397,663
Net asset value 4,756,276 121,650,040 280,693,912 1,614,487,304 44,730,043,938
+ Represents the combined totals of all Morgan Stanley Investment Funds.
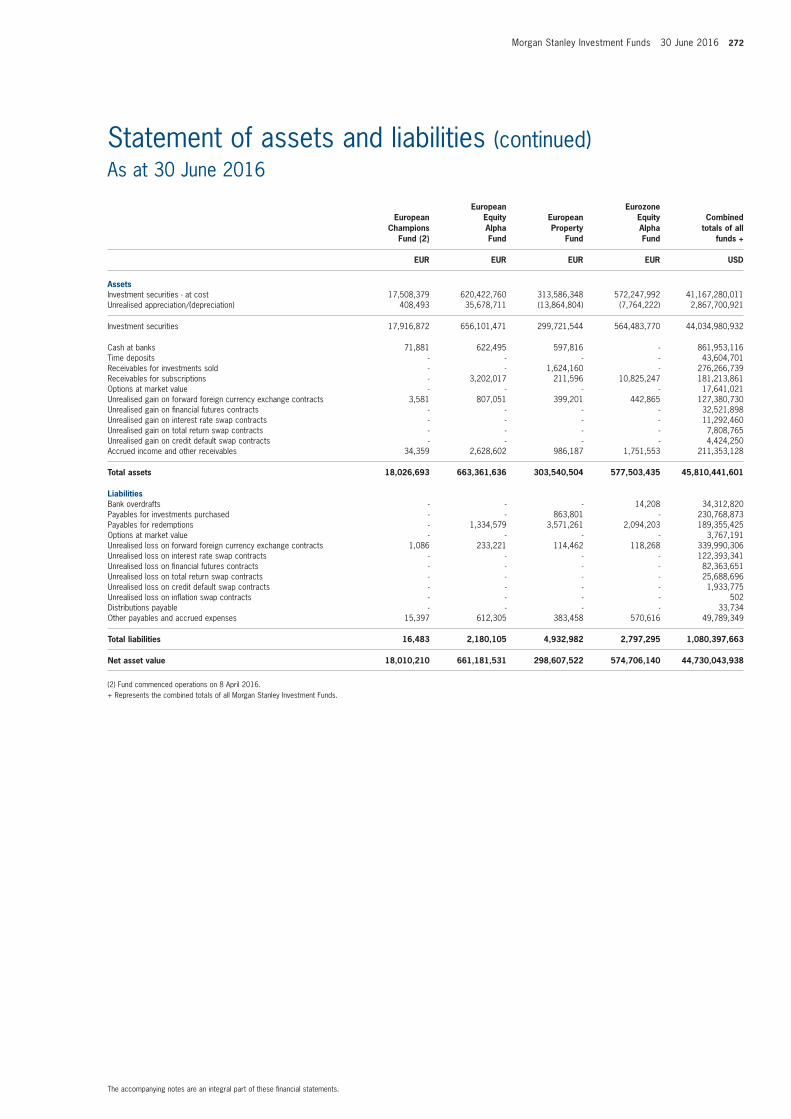
Morgan Stanley Investment Funds 30 June 2016 272
The accompanying notes are an integral part of these financial statements.
Statement of assets and liabilities (continued)As at 30 June 2016
European Champions
Fund (2)
European Equity Alpha Fund
European Property
Fund
Eurozone Equity Alpha Fund
Combined totals of all
funds +
EUR EUR EUR EUR USD
AssetsInvestment securities - at cost 17,508,379 620,422,760 313,586,348 572,247,992 41,167,280,011 Unrealised appreciation/(depreciation) 408,493 35,678,711 (13,864,804) (7,764,222) 2,867,700,921
Investment securities 17,916,872 656,101,471 299,721,544 564,483,770 44,034,980,932
Cash at banks 71,881 622,495 597,816 - 861,953,116 Time deposits - - - - 43,604,701 Receivables for investments sold - - 1,624,160 - 276,266,739 Receivables for subscriptions - 3,202,017 211,596 10,825,247 181,213,861 Options at market value - - - - 17,641,021 Unrealised gain on forward foreign currency exchange contracts 3,581 807,051 399,201 442,865 127,380,730 Unrealised gain on financial futures contracts - - - - 32,521,898 Unrealised gain on interest rate swap contracts - - - - 11,292,460 Unrealised gain on total return swap contracts - - - - 7,808,765 Unrealised gain on credit default swap contracts - - - - 4,424,250 Accrued income and other receivables 34,359 2,628,602 986,187 1,751,553 211,353,128
Total assets 18,026,693 663,361,636 303,540,504 577,503,435 45,810,441,601
LiabilitiesBank overdrafts - - - 14,208 34,312,820 Payables for investments purchased - - 863,801 - 230,768,873 Payables for redemptions - 1,334,579 3,571,261 2,094,203 189,355,425 Options at market value - - - - 3,767,191 Unrealised loss on forward foreign currency exchange contracts 1,086 233,221 114,462 118,268 339,990,306 Unrealised loss on interest rate swap contracts - - - - 122,393,341 Unrealised loss on financial futures contracts - - - - 82,363,651 Unrealised loss on total return swap contracts - - - - 25,688,696 Unrealised loss on credit default swap contracts - - - - 1,933,775 Unrealised loss on inflation swap contracts - - - - 502 Distributions payable - - - - 33,734 Other payables and accrued expenses 15,397 612,305 383,458 570,616 49,789,349
Total liabilities 16,483 2,180,105 4,932,982 2,797,295 1,080,397,663
Net asset value 18,010,210 661,181,531 298,607,522 574,706,140 44,730,043,938
(2) Fund commenced operations on 8 April 2016.+ Represents the combined totals of all Morgan Stanley Investment Funds.
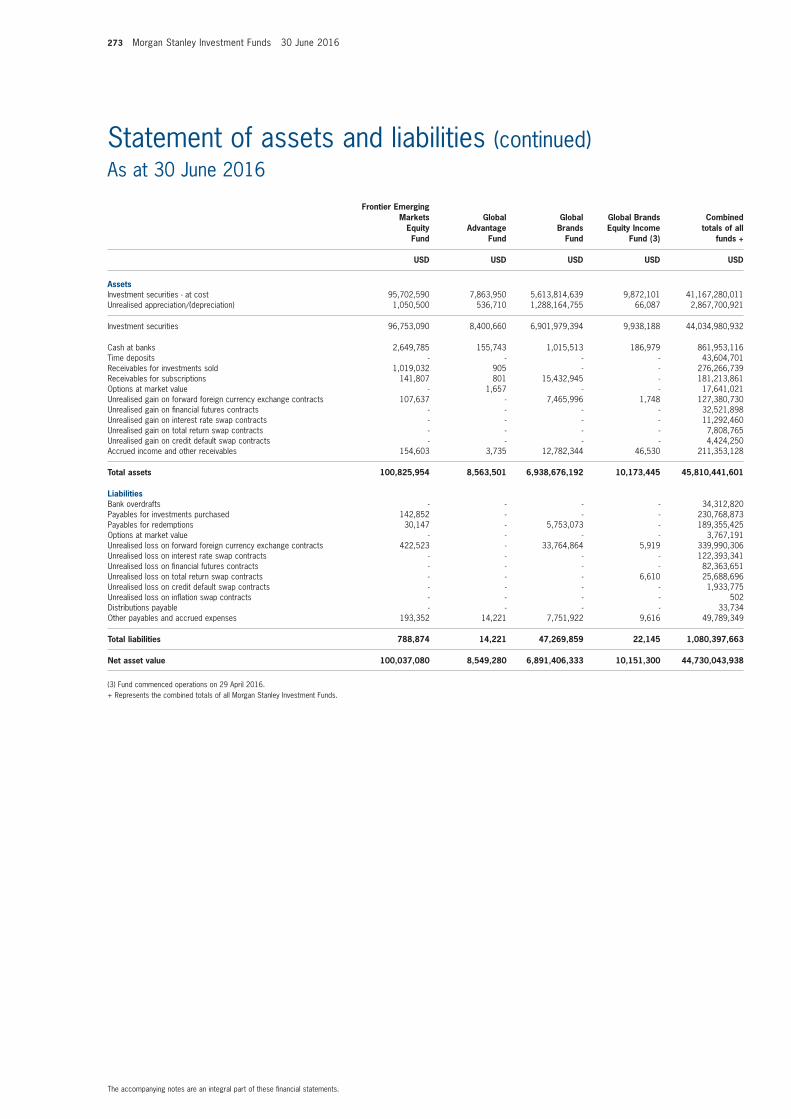
273 Morgan Stanley Investment Funds 30 June 2016
The accompanying notes are an integral part of these financial statements.
Statement of assets and liabilities (continued)As at 30 June 2016
Frontier Emerging Markets
Equity Fund
Global Advantage
Fund
Global Brands
Fund
Global Brands Equity Income
Fund (3)
Combined totals of all
funds +
USD USD USD USD USD
AssetsInvestment securities - at cost 95,702,590 7,863,950 5,613,814,639 9,872,101 41,167,280,011 Unrealised appreciation/(depreciation) 1,050,500 536,710 1,288,164,755 66,087 2,867,700,921
Investment securities 96,753,090 8,400,660 6,901,979,394 9,938,188 44,034,980,932
Cash at banks 2,649,785 155,743 1,015,513 186,979 861,953,116 Time deposits - - - - 43,604,701 Receivables for investments sold 1,019,032 905 - - 276,266,739 Receivables for subscriptions 141,807 801 15,432,945 - 181,213,861 Options at market value - 1,657 - - 17,641,021 Unrealised gain on forward foreign currency exchange contracts 107,637 - 7,465,996 1,748 127,380,730 Unrealised gain on financial futures contracts - - - - 32,521,898 Unrealised gain on interest rate swap contracts - - - - 11,292,460 Unrealised gain on total return swap contracts - - - - 7,808,765 Unrealised gain on credit default swap contracts - - - - 4,424,250 Accrued income and other receivables 154,603 3,735 12,782,344 46,530 211,353,128
Total assets 100,825,954 8,563,501 6,938,676,192 10,173,445 45,810,441,601
LiabilitiesBank overdrafts - - - - 34,312,820 Payables for investments purchased 142,852 - - - 230,768,873 Payables for redemptions 30,147 - 5,753,073 - 189,355,425 Options at market value - - - - 3,767,191 Unrealised loss on forward foreign currency exchange contracts 422,523 - 33,764,864 5,919 339,990,306 Unrealised loss on interest rate swap contracts - - - - 122,393,341 Unrealised loss on financial futures contracts - - - - 82,363,651 Unrealised loss on total return swap contracts - - - 6,610 25,688,696 Unrealised loss on credit default swap contracts - - - - 1,933,775 Unrealised loss on inflation swap contracts - - - - 502 Distributions payable - - - - 33,734 Other payables and accrued expenses 193,352 14,221 7,751,922 9,616 49,789,349
Total liabilities 788,874 14,221 47,269,859 22,145 1,080,397,663
Net asset value 100,037,080 8,549,280 6,891,406,333 10,151,300 44,730,043,938
(3) Fund commenced operations on 29 April 2016.+ Represents the combined totals of all Morgan Stanley Investment Funds.

Morgan Stanley Investment Funds 30 June 2016 274
The accompanying notes are an integral part of these financial statements.
Statement of assets and liabilities (continued)As at 30 June 2016
Global
Discovery Fund
Global Infrastructure
Fund
Global Opportunity
Fund
Global Property
Fund
Combined totals of all
funds +
USD USD USD USD USD
AssetsInvestment securities - at cost 5,445,316 620,854,703 867,403,728 1,047,241,353 41,167,280,011 Unrealised appreciation/(depreciation) (27,804) 56,613,863 66,385,188 43,884,687 2,867,700,921
Investment securities 5,417,512 677,468,566 933,788,916 1,091,126,040 44,034,980,932
Cash at banks 170,385 987,531 58 4,638,621 861,953,116 Time deposits - - - - 43,604,701 Receivables for investments sold - 4,116,894 - 16,892,147 276,266,739 Receivables for subscriptions 1,019 3,019,466 2,917,104 1,543,142 181,213,861 Options at market value - - 170,401 - 17,641,021 Unrealised gain on forward foreign currency exchange contracts - 393,605 189,062 121,510 127,380,730 Unrealised gain on financial futures contracts - - - - 32,521,898 Unrealised gain on interest rate swap contracts - - - - 11,292,460 Unrealised gain on total return swap contracts - - - - 7,808,765 Unrealised gain on credit default swap contracts - - - - 4,424,250 Accrued income and other receivables 728 2,664,406 26,500 3,319,066 211,353,128
Total assets 5,589,644 688,650,468 937,092,041 1,117,640,526 45,810,441,601
LiabilitiesBank overdrafts - - 32,510 - 34,312,820 Payables for investments purchased - 4,629,366 - 2,488,339 230,768,873 Payables for redemptions - 1,337,279 895,948 7,725,323 189,355,425 Options at market value - - - - 3,767,191 Unrealised loss on forward foreign currency exchange contracts - 1,298,348 641,857 435,454 339,990,306 Unrealised loss on interest rate swap contracts - - - - 122,393,341 Unrealised loss on financial futures contracts - - - - 82,363,651 Unrealised loss on total return swap contracts - - - - 25,688,696 Unrealised loss on credit default swap contracts - - - - 1,933,775 Unrealised loss on inflation swap contracts - - - - 502 Distributions payable - - - - 33,734 Other payables and accrued expenses 4,719 822,949 1,161,099 1,153,390 49,789,349
Total liabilities 4,719 8,087,942 2,731,414 11,802,506 1,080,397,663
Net asset value 5,584,925 680,562,526 934,360,627 1,105,838,020 44,730,043,938
+ Represents the combined totals of all Morgan Stanley Investment Funds.

275 Morgan Stanley Investment Funds 30 June 2016
The accompanying notes are an integral part of these financial statements.
Statement of assets and liabilities (continued)As at 30 June 2016
Global Quality
Fund
Indian Equity Fund
International Equity
(ex US) Fund
Japanese Equity Fund
Combined totals of all
funds +
USD USD USD JPY000’s USD
AssetsInvestment securities - at cost 1,372,191,810 268,776,637 73,036,717 44,294,805 41,167,280,011 Unrealised appreciation/(depreciation) 104,847,605 22,490,814 (3,054,099) (5,690,319) 2,867,700,921
Investment securities 1,477,039,415 291,267,451 69,982,618 38,604,486 44,034,980,932
Cash at banks 149,084 13,876,579 313,012 480,760 861,953,116 Time deposits - - - - 43,604,701 Receivables for investments sold - 56,460 1,163,460 793,222 276,266,739 Receivables for subscriptions 4,759,076 4,282,251 - 645,038 181,213,861 Options at market value - - - - 17,641,021 Unrealised gain on forward foreign currency exchange contracts 562,880 - - 9,295 127,380,730 Unrealised gain on financial futures contracts - - - - 32,521,898 Unrealised gain on interest rate swap contracts - - - - 11,292,460 Unrealised gain on total return swap contracts - - - - 7,808,765 Unrealised gain on credit default swap contracts - - - - 4,424,250 Accrued income and other receivables 2,258,015 434,118 128,715 27,901 211,353,128
Total assets 1,484,768,470 309,916,859 71,587,805 40,560,702 45,810,441,601
LiabilitiesBank overdrafts - - - - 34,312,820 Payables for investments purchased - 302,774 855,366 610,006 230,768,873 Payables for redemptions 1,190,551 5,070,557 - 686,522 189,355,425 Options at market value - - - - 3,767,191 Unrealised loss on forward foreign currency exchange contracts 1,797,715 - 111,738 77,191 339,990,306 Unrealised loss on interest rate swap contracts - - - - 122,393,341 Unrealised loss on financial futures contracts - - - - 82,363,651 Unrealised loss on total return swap contracts - - - - 25,688,696 Unrealised loss on credit default swap contracts - - - - 1,933,775 Unrealised loss on inflation swap contracts - - - - 502 Distributions payable - - - - 33,734 Other payables and accrued expenses 1,711,668 482,769 96,447 37,442 49,789,349
Total liabilities 4,699,934 5,856,100 1,063,551 1,411,161 1,080,397,663
Net asset value 1,480,068,536 304,060,759 70,524,254 39,149,541 44,730,043,938
+ Represents the combined totals of all Morgan Stanley Investment Funds.
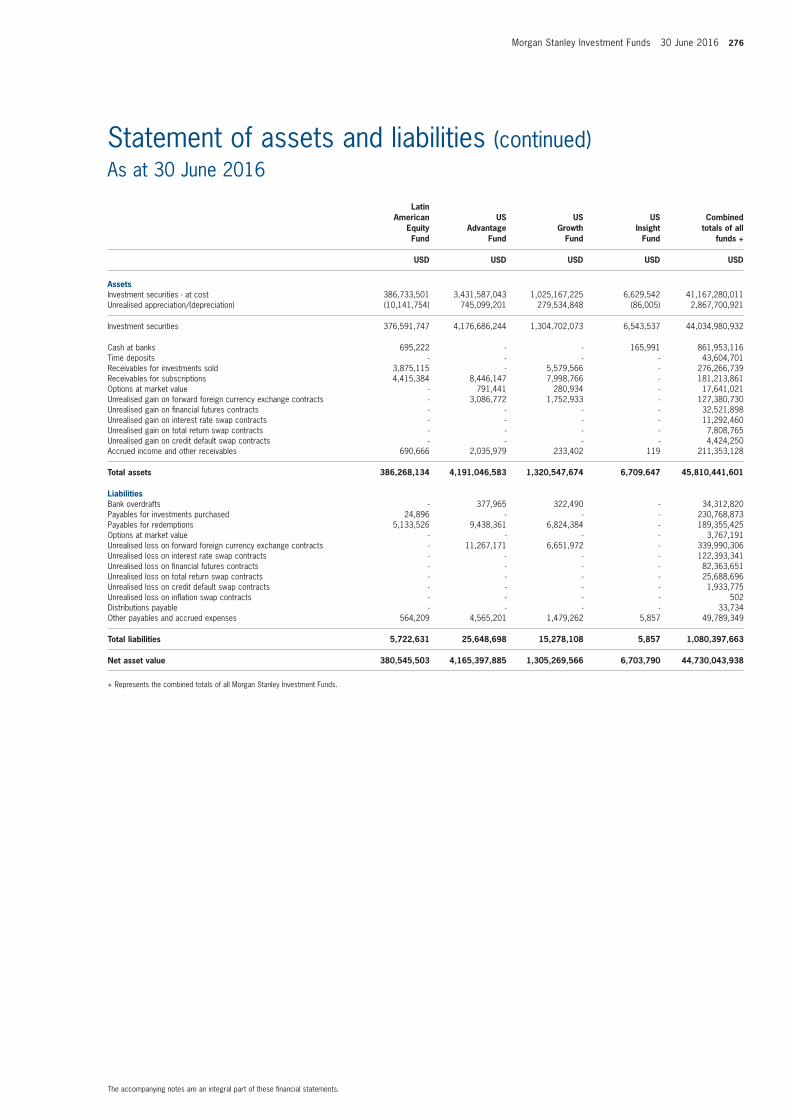
Morgan Stanley Investment Funds 30 June 2016 276
The accompanying notes are an integral part of these financial statements.
Statement of assets and liabilities (continued)As at 30 June 2016
Latin American
Equity Fund
US Advantage
Fund
US Growth
Fund
US Insight
Fund
Combined totals of all
funds +
USD USD USD USD USD
AssetsInvestment securities - at cost 386,733,501 3,431,587,043 1,025,167,225 6,629,542 41,167,280,011 Unrealised appreciation/(depreciation) (10,141,754) 745,099,201 279,534,848 (86,005) 2,867,700,921
Investment securities 376,591,747 4,176,686,244 1,304,702,073 6,543,537 44,034,980,932
Cash at banks 695,222 - - 165,991 861,953,116 Time deposits - - - - 43,604,701 Receivables for investments sold 3,875,115 - 5,579,566 - 276,266,739 Receivables for subscriptions 4,415,384 8,446,147 7,998,766 - 181,213,861 Options at market value - 791,441 280,934 - 17,641,021 Unrealised gain on forward foreign currency exchange contracts - 3,086,772 1,752,933 - 127,380,730 Unrealised gain on financial futures contracts - - - - 32,521,898 Unrealised gain on interest rate swap contracts - - - - 11,292,460 Unrealised gain on total return swap contracts - - - - 7,808,765 Unrealised gain on credit default swap contracts - - - - 4,424,250 Accrued income and other receivables 690,666 2,035,979 233,402 119 211,353,128
Total assets 386,268,134 4,191,046,583 1,320,547,674 6,709,647 45,810,441,601
LiabilitiesBank overdrafts - 377,965 322,490 - 34,312,820 Payables for investments purchased 24,896 - - - 230,768,873 Payables for redemptions 5,133,526 9,438,361 6,824,384 - 189,355,425 Options at market value - - - - 3,767,191 Unrealised loss on forward foreign currency exchange contracts - 11,267,171 6,651,972 - 339,990,306 Unrealised loss on interest rate swap contracts - - - - 122,393,341 Unrealised loss on financial futures contracts - - - - 82,363,651 Unrealised loss on total return swap contracts - - - - 25,688,696 Unrealised loss on credit default swap contracts - - - - 1,933,775 Unrealised loss on inflation swap contracts - - - - 502 Distributions payable - - - - 33,734 Other payables and accrued expenses 564,209 4,565,201 1,479,262 5,857 49,789,349
Total liabilities 5,722,631 25,648,698 15,278,108 5,857 1,080,397,663
Net asset value 380,545,503 4,165,397,885 1,305,269,566 6,703,790 44,730,043,938
+ Represents the combined totals of all Morgan Stanley Investment Funds.
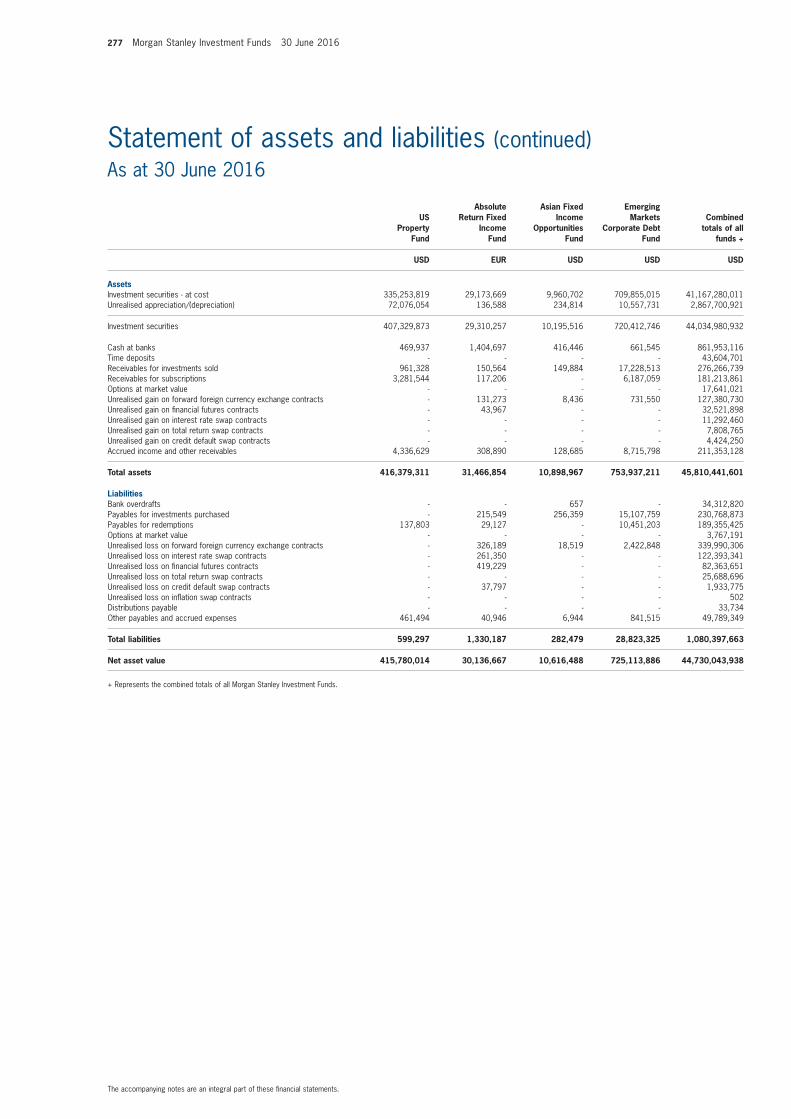
277 Morgan Stanley Investment Funds 30 June 2016
The accompanying notes are an integral part of these financial statements.
Statement of assets and liabilities (continued)As at 30 June 2016
US Property
Fund
Absolute Return Fixed
Income Fund
Asian Fixed Income
Opportunities Fund
Emerging Markets
Corporate Debt Fund
Combined totals of all
funds +
USD EUR USD USD USD
AssetsInvestment securities - at cost 335,253,819 29,173,669 9,960,702 709,855,015 41,167,280,011 Unrealised appreciation/(depreciation) 72,076,054 136,588 234,814 10,557,731 2,867,700,921
Investment securities 407,329,873 29,310,257 10,195,516 720,412,746 44,034,980,932
Cash at banks 469,937 1,404,697 416,446 661,545 861,953,116 Time deposits - - - - 43,604,701 Receivables for investments sold 961,328 150,564 149,884 17,228,513 276,266,739 Receivables for subscriptions 3,281,544 117,206 - 6,187,059 181,213,861 Options at market value - - - - 17,641,021 Unrealised gain on forward foreign currency exchange contracts - 131,273 8,436 731,550 127,380,730 Unrealised gain on financial futures contracts - 43,967 - - 32,521,898 Unrealised gain on interest rate swap contracts - - - - 11,292,460 Unrealised gain on total return swap contracts - - - - 7,808,765 Unrealised gain on credit default swap contracts - - - - 4,424,250 Accrued income and other receivables 4,336,629 308,890 128,685 8,715,798 211,353,128
Total assets 416,379,311 31,466,854 10,898,967 753,937,211 45,810,441,601
LiabilitiesBank overdrafts - - 657 - 34,312,820 Payables for investments purchased - 215,549 256,359 15,107,759 230,768,873 Payables for redemptions 137,803 29,127 - 10,451,203 189,355,425 Options at market value - - - - 3,767,191 Unrealised loss on forward foreign currency exchange contracts - 326,189 18,519 2,422,848 339,990,306 Unrealised loss on interest rate swap contracts - 261,350 - - 122,393,341 Unrealised loss on financial futures contracts - 419,229 - - 82,363,651 Unrealised loss on total return swap contracts - - - - 25,688,696 Unrealised loss on credit default swap contracts - 37,797 - - 1,933,775 Unrealised loss on inflation swap contracts - - - - 502 Distributions payable - - - - 33,734 Other payables and accrued expenses 461,494 40,946 6,944 841,515 49,789,349
Total liabilities 599,297 1,330,187 282,479 28,823,325 1,080,397,663
Net asset value 415,780,014 30,136,667 10,616,488 725,113,886 44,730,043,938
+ Represents the combined totals of all Morgan Stanley Investment Funds.

Morgan Stanley Investment Funds 30 June 2016 278
The accompanying notes are an integral part of these financial statements.
Statement of assets and liabilities (continued)As at 30 June 2016
Emerging Markets
Debt Fund
Emerging Markets
Domestic Debt Fund
Emerging Markets Fixed Income Opportunities
Fund
Euro Bond Fund
Combined totals of all
funds +
USD USD USD EUR USD
AssetsInvestment securities - at cost 245,916,123 180,576,114 17,657,477 218,674,354 41,167,280,011 Unrealised appreciation/(depreciation) 215,283 (10,096,436) 497,495 13,410,428 2,867,700,921
Investment securities 246,131,406 170,479,678 18,154,972 232,084,782 44,034,980,932
Cash at banks 883,530 1,084,391 376,755 1,043,915 861,953,116 Time deposits - - - - 43,604,701 Receivables for investments sold - 4,408,028 - 7,360,370 276,266,739 Receivables for subscriptions 972,976 314,176 277,403 9,685,251 181,213,861 Options at market value - - - - 17,641,021 Unrealised gain on forward foreign currency exchange contracts 340,175 2,325,494 144,355 - 127,380,730 Unrealised gain on financial futures contracts - - - 27,285 32,521,898 Unrealised gain on interest rate swap contracts - - - - 11,292,460 Unrealised gain on total return swap contracts - - - - 7,808,765 Unrealised gain on credit default swap contracts - - - 62,511 4,424,250 Accrued income and other receivables 3,809,340 3,076,385 315,108 2,400,327 211,353,128
Total assets 252,137,427 181,688,152 19,268,593 252,664,441 45,810,441,601
LiabilitiesBank overdrafts - 126,533 9,199 - 34,312,820 Payables for investments purchased 1,148,018 6,730,533 253,717 5,150,681 230,768,873 Payables for redemptions 3,416,727 354,208 - 7,848,079 189,355,425 Options at market value - - - - 3,767,191 Unrealised loss on forward foreign currency exchange contracts 1,030,093 3,416,956 269,687 - 339,990,306 Unrealised loss on interest rate swap contracts - - - - 122,393,341 Unrealised loss on financial futures contracts 302,984 4,926 821 415,932 82,363,651 Unrealised loss on total return swap contracts - - - - 25,688,696 Unrealised loss on credit default swap contracts - - - - 1,933,775 Unrealised loss on inflation swap contracts - - - - 502 Distributions payable - - - - 33,734 Other payables and accrued expenses 366,855 275,637 19,328 192,096 49,789,349
Total liabilities 6,264,677 10,908,793 552,752 13,606,788 1,080,397,663
Net asset value 245,872,750 170,779,359 18,715,841 239,057,653 44,730,043,938
+ Represents the combined totals of all Morgan Stanley Investment Funds.

279 Morgan Stanley Investment Funds 30 June 2016
The accompanying notes are an integral part of these financial statements.
Statement of assets and liabilities (continued)As at 30 June 2016
Euro Corporate
Bond Fund
Euro Strategic
Bond Fund
European Currencies High
Yield Bond Fund
Global Bond Fund
Combined totals of all
funds +
EUR EUR EUR USD USD
AssetsInvestment securities - at cost 3,340,883,927 770,260,489 1,225,998,941 445,072,245 41,167,280,011 Unrealised appreciation/(depreciation) 158,761,352 47,151,233 (45,664,646) 12,339,914 2,867,700,921
Investment securities 3,499,645,279 817,411,722 1,180,334,295 457,412,159 44,034,980,932
Cash at banks 73,974,382 17,624,880 44,600,250 27,479,011 861,953,116 Time deposits - - 24,934,811 15,886,169 43,604,701 Receivables for investments sold 8,295,001 757,508 670,000 12,536,131 276,266,739 Receivables for subscriptions 37,719,074 5,676,173 7,673,652 710,841 181,213,861 Options at market value - - - - 17,641,021 Unrealised gain on forward foreign currency exchange contracts 1,542,300 1,293,584 8,569,349 2,818,497 127,380,730 Unrealised gain on financial futures contracts 7,032,981 2,403,191 - 1,334,544 32,521,898 Unrealised gain on interest rate swap contracts - - - - 11,292,460 Unrealised gain on total return swap contracts - - - - 7,808,765 Unrealised gain on credit default swap contracts 1,205,140 - 1,259,797 - 4,424,250 Accrued income and other receivables 42,907,052 9,028,964 20,539,169 3,798,474 211,353,128
Total assets 3,672,321,209 854,196,022 1,288,581,323 521,975,826 45,810,441,601
LiabilitiesBank overdrafts - 4,922 - 237 34,312,820 Payables for investments purchased - 1,014,315 - 41,986,908 230,768,873 Payables for redemptions 17,535,586 5,957,841 18,157,681 755,336 189,355,425 Options at market value - - - - 3,767,191 Unrealised loss on forward foreign currency exchange contracts 5,868,120 4,496,746 3,267,868 2,324,974 339,990,306 Unrealised loss on interest rate swap contracts 40,241,501 9,376,970 - 2,841,319 122,393,341 Unrealised loss on financial futures contracts 15,763,747 2,337,280 442,732 897,209 82,363,651 Unrealised loss on total return swap contracts - - - - 25,688,696 Unrealised loss on credit default swap contracts - - - 349,182 1,933,775 Unrealised loss on inflation swap contracts - - - - 502 Distributions payable - - - - 33,734 Other payables and accrued expenses 2,309,153 740,504 1,018,136 346,700 49,789,349
Total liabilities 81,718,107 23,928,578 22,886,417 49,501,865 1,080,397,663
Net asset value 3,590,603,102 830,267,444 1,265,694,906 472,473,961 44,730,043,938
+ Represents the combined totals of all Morgan Stanley Investment Funds.
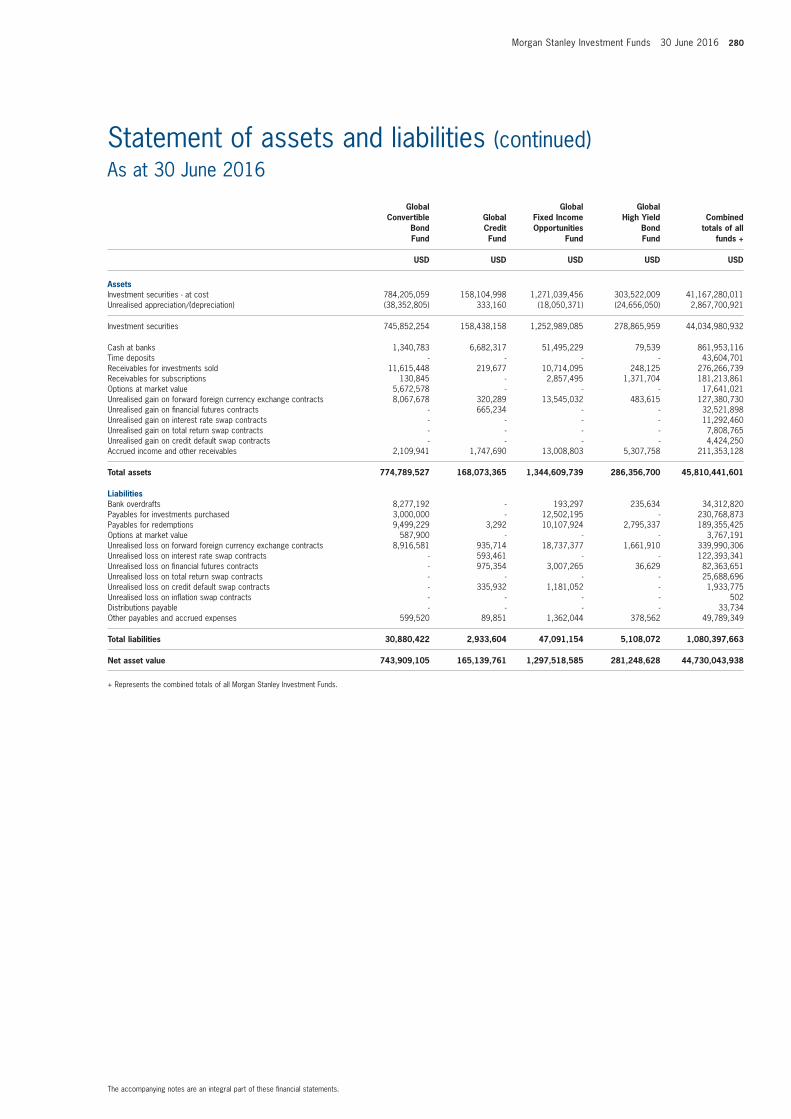
Morgan Stanley Investment Funds 30 June 2016 280
The accompanying notes are an integral part of these financial statements.
Statement of assets and liabilities (continued)As at 30 June 2016
Global Convertible
Bond Fund
Global Credit Fund
Global Fixed Income Opportunities
Fund
Global High Yield
Bond Fund
Combined totals of all
funds +
USD USD USD USD USD
AssetsInvestment securities - at cost 784,205,059 158,104,998 1,271,039,456 303,522,009 41,167,280,011 Unrealised appreciation/(depreciation) (38,352,805) 333,160 (18,050,371) (24,656,050) 2,867,700,921
Investment securities 745,852,254 158,438,158 1,252,989,085 278,865,959 44,034,980,932
Cash at banks 1,340,783 6,682,317 51,495,229 79,539 861,953,116 Time deposits - - - - 43,604,701 Receivables for investments sold 11,615,448 219,677 10,714,095 248,125 276,266,739 Receivables for subscriptions 130,845 - 2,857,495 1,371,704 181,213,861 Options at market value 5,672,578 - - - 17,641,021 Unrealised gain on forward foreign currency exchange contracts 8,067,678 320,289 13,545,032 483,615 127,380,730 Unrealised gain on financial futures contracts - 665,234 - - 32,521,898 Unrealised gain on interest rate swap contracts - - - - 11,292,460 Unrealised gain on total return swap contracts - - - - 7,808,765 Unrealised gain on credit default swap contracts - - - - 4,424,250 Accrued income and other receivables 2,109,941 1,747,690 13,008,803 5,307,758 211,353,128
Total assets 774,789,527 168,073,365 1,344,609,739 286,356,700 45,810,441,601
LiabilitiesBank overdrafts 8,277,192 - 193,297 235,634 34,312,820 Payables for investments purchased 3,000,000 - 12,502,195 - 230,768,873 Payables for redemptions 9,499,229 3,292 10,107,924 2,795,337 189,355,425 Options at market value 587,900 - - - 3,767,191 Unrealised loss on forward foreign currency exchange contracts 8,916,581 935,714 18,737,377 1,661,910 339,990,306 Unrealised loss on interest rate swap contracts - 593,461 - - 122,393,341 Unrealised loss on financial futures contracts - 975,354 3,007,265 36,629 82,363,651 Unrealised loss on total return swap contracts - - - - 25,688,696 Unrealised loss on credit default swap contracts - 335,932 1,181,052 - 1,933,775 Unrealised loss on inflation swap contracts - - - - 502 Distributions payable - - - - 33,734 Other payables and accrued expenses 599,520 89,851 1,362,044 378,562 49,789,349
Total liabilities 30,880,422 2,933,604 47,091,154 5,108,072 1,080,397,663
Net asset value 743,909,105 165,139,761 1,297,518,585 281,248,628 44,730,043,938
+ Represents the combined totals of all Morgan Stanley Investment Funds.
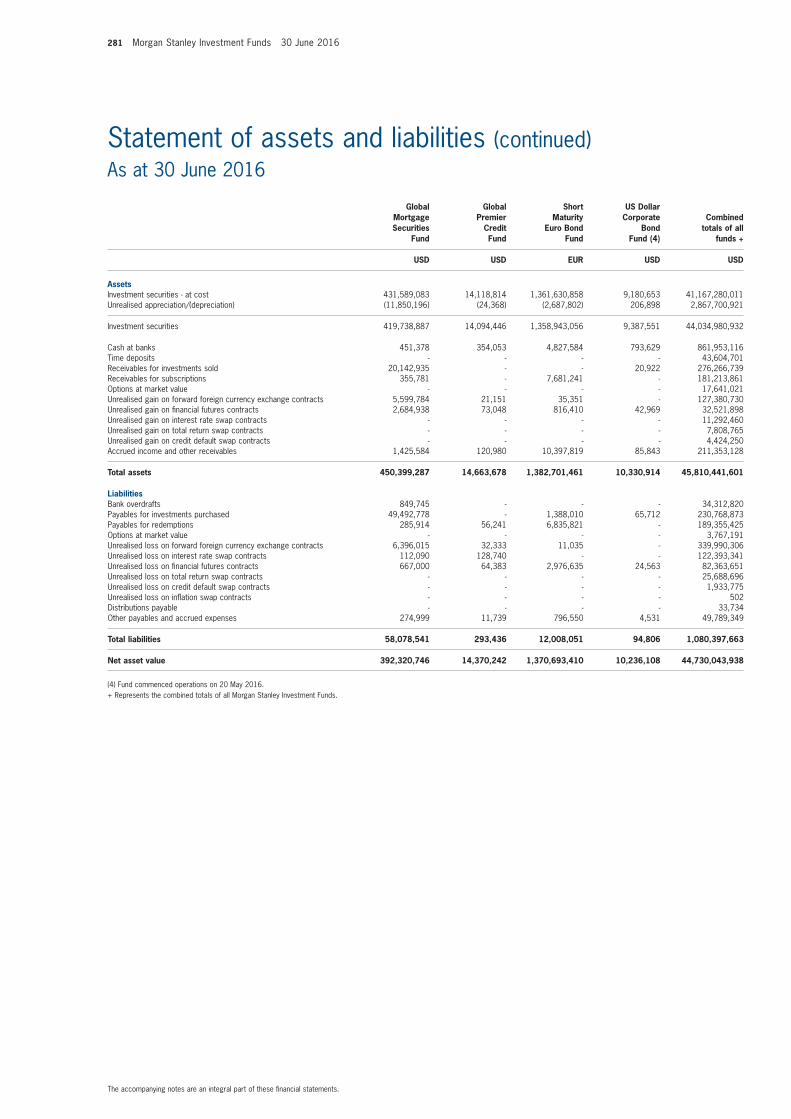
281 Morgan Stanley Investment Funds 30 June 2016
The accompanying notes are an integral part of these financial statements.
Statement of assets and liabilities (continued)As at 30 June 2016
Global Mortgage Securities
Fund
Global Premier
Credit Fund
Short Maturity
Euro Bond Fund
US Dollar Corporate
Bond Fund (4)
Combined totals of all
funds +
USD USD EUR USD USD
AssetsInvestment securities - at cost 431,589,083 14,118,814 1,361,630,858 9,180,653 41,167,280,011 Unrealised appreciation/(depreciation) (11,850,196) (24,368) (2,687,802) 206,898 2,867,700,921
Investment securities 419,738,887 14,094,446 1,358,943,056 9,387,551 44,034,980,932
Cash at banks 451,378 354,053 4,827,584 793,629 861,953,116 Time deposits - - - - 43,604,701 Receivables for investments sold 20,142,935 - - 20,922 276,266,739 Receivables for subscriptions 355,781 - 7,681,241 - 181,213,861 Options at market value - - - - 17,641,021 Unrealised gain on forward foreign currency exchange contracts 5,599,784 21,151 35,351 - 127,380,730 Unrealised gain on financial futures contracts 2,684,938 73,048 816,410 42,969 32,521,898 Unrealised gain on interest rate swap contracts - - - - 11,292,460 Unrealised gain on total return swap contracts - - - - 7,808,765 Unrealised gain on credit default swap contracts - - - - 4,424,250 Accrued income and other receivables 1,425,584 120,980 10,397,819 85,843 211,353,128
Total assets 450,399,287 14,663,678 1,382,701,461 10,330,914 45,810,441,601
LiabilitiesBank overdrafts 849,745 - - - 34,312,820 Payables for investments purchased 49,492,778 - 1,388,010 65,712 230,768,873 Payables for redemptions 285,914 56,241 6,835,821 - 189,355,425 Options at market value - - - - 3,767,191 Unrealised loss on forward foreign currency exchange contracts 6,396,015 32,333 11,035 - 339,990,306 Unrealised loss on interest rate swap contracts 112,090 128,740 - - 122,393,341 Unrealised loss on financial futures contracts 667,000 64,383 2,976,635 24,563 82,363,651 Unrealised loss on total return swap contracts - - - - 25,688,696 Unrealised loss on credit default swap contracts - - - - 1,933,775 Unrealised loss on inflation swap contracts - - - - 502 Distributions payable - - - - 33,734 Other payables and accrued expenses 274,999 11,739 796,550 4,531 49,789,349
Total liabilities 58,078,541 293,436 12,008,051 94,806 1,080,397,663
Net asset value 392,320,746 14,370,242 1,370,693,410 10,236,108 44,730,043,938
(4) Fund commenced operations on 20 May 2016.+ Represents the combined totals of all Morgan Stanley Investment Funds.
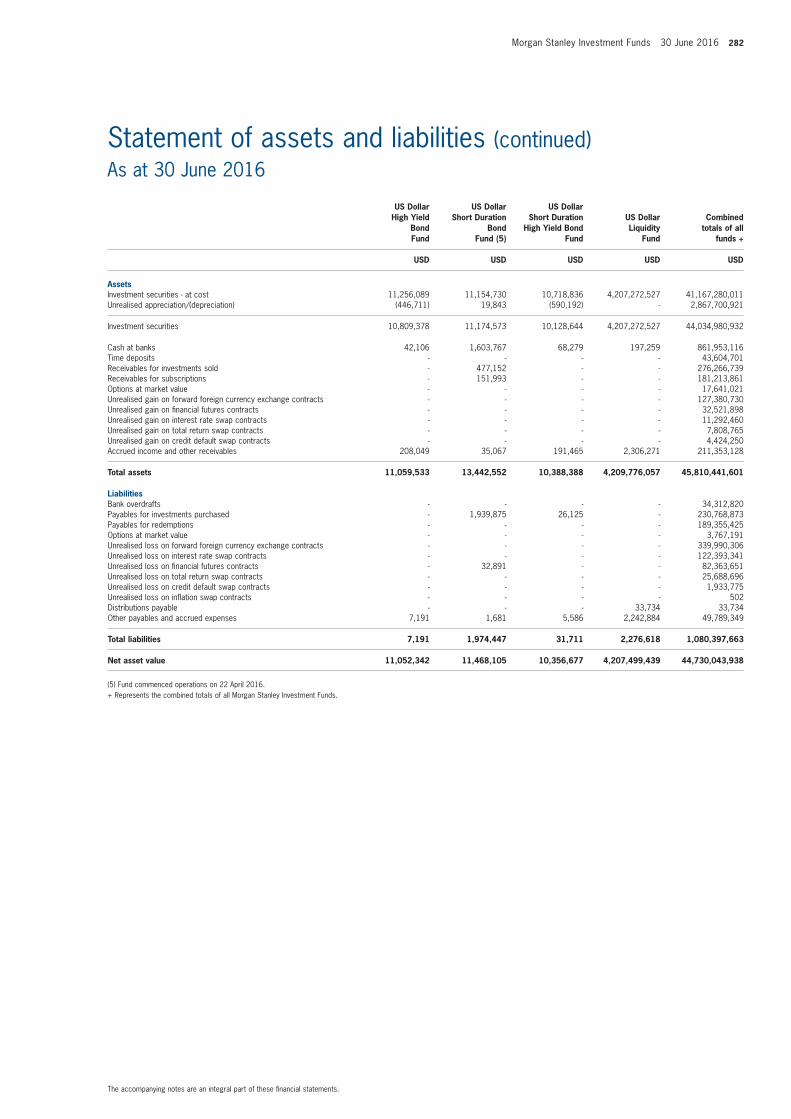
Morgan Stanley Investment Funds 30 June 2016 282
The accompanying notes are an integral part of these financial statements.
Statement of assets and liabilities (continued)As at 30 June 2016
US Dollar High Yield
Bond Fund
US Dollar Short Duration
Bond Fund (5)
US Dollar Short Duration
High Yield Bond Fund
US Dollar Liquidity
Fund
Combined totals of all
funds +
USD USD USD USD USD
AssetsInvestment securities - at cost 11,256,089 11,154,730 10,718,836 4,207,272,527 41,167,280,011 Unrealised appreciation/(depreciation) (446,711) 19,843 (590,192) - 2,867,700,921
Investment securities 10,809,378 11,174,573 10,128,644 4,207,272,527 44,034,980,932
Cash at banks 42,106 1,603,767 68,279 197,259 861,953,116 Time deposits - - - - 43,604,701 Receivables for investments sold - 477,152 - - 276,266,739 Receivables for subscriptions - 151,993 - - 181,213,861 Options at market value - - - - 17,641,021 Unrealised gain on forward foreign currency exchange contracts - - - - 127,380,730 Unrealised gain on financial futures contracts - - - - 32,521,898 Unrealised gain on interest rate swap contracts - - - - 11,292,460 Unrealised gain on total return swap contracts - - - - 7,808,765 Unrealised gain on credit default swap contracts - - - - 4,424,250 Accrued income and other receivables 208,049 35,067 191,465 2,306,271 211,353,128
Total assets 11,059,533 13,442,552 10,388,388 4,209,776,057 45,810,441,601
LiabilitiesBank overdrafts - - - - 34,312,820 Payables for investments purchased - 1,939,875 26,125 - 230,768,873 Payables for redemptions - - - - 189,355,425 Options at market value - - - - 3,767,191 Unrealised loss on forward foreign currency exchange contracts - - - - 339,990,306 Unrealised loss on interest rate swap contracts - - - - 122,393,341 Unrealised loss on financial futures contracts - 32,891 - - 82,363,651 Unrealised loss on total return swap contracts - - - - 25,688,696 Unrealised loss on credit default swap contracts - - - - 1,933,775 Unrealised loss on inflation swap contracts - - - - 502 Distributions payable - - - 33,734 33,734 Other payables and accrued expenses 7,191 1,681 5,586 2,242,884 49,789,349
Total liabilities 7,191 1,974,447 31,711 2,276,618 1,080,397,663
Net asset value 11,052,342 11,468,105 10,356,677 4,207,499,439 44,730,043,938
(5) Fund commenced operations on 22 April 2016.+ Represents the combined totals of all Morgan Stanley Investment Funds.

283 Morgan Stanley Investment Funds 30 June 2016
The accompanying notes are an integral part of these financial statements.
Statement of assets and liabilities (continued)As at 30 June 2016
Diversified Alpha Plus
Fund
Diversified Alpha Plus
Low Volatility Fund
Global Balanced
Income Fund
Global Balanced
Risk Control Fund of Funds
Combined totals of all
funds +
EUR EUR EUR EUR USD
AssetsInvestment securities - at cost 3,598,340,550 18,597,661 315,779,084 2,108,244,346 41,167,280,011 Unrealised appreciation/(depreciation) 7,943,865 21,224 3,059,979 49,664,724 2,867,700,921
Investment securities 3,606,284,415 18,618,885 318,839,063 2,157,909,070 44,034,980,932
Cash at banks 379,944,051 1,381,861 59,771,364 64,813,336 861,953,116 Time deposits - - - - 43,604,701 Receivables for investments sold 115,853,853 - 1,120,126 9,580,514 276,266,739 Receivables for subscriptions 656,610 8,789 1,610,044 12,289,766 181,213,861 Options at market value 9,438,024 17,718 - 183,045 17,641,021 Unrealised gain on forward foreign currency exchange contracts 53,226,316 116,391 533,920 3,225,694 127,380,730 Unrealised gain on financial futures contracts 14,156,738 49,153 267,132 9,847 32,521,898 Unrealised gain on interest rate swap contracts 10,121,633 26,436 - - 11,292,460 Unrealised gain on total return swap contracts 6,958,520 25,268 - - 7,808,765 Unrealised gain on credit default swap contracts - - 1,444,162 - 4,424,250 Accrued income and other receivables 20,403,153 9,331 1,133,579 947,106 211,353,128
Total assets 4,217,043,313 20,253,832 384,719,390 2,248,958,378 45,810,441,601
LiabilitiesBank overdrafts 18,457,632 45,042 1,730,313 1,012,989 34,312,820 Payables for investments purchased 60,338,602 193,107 496,255 11,612,700 230,768,873 Payables for redemptions 31,404,070 21,570 651,228 3,286,462 189,355,425 Options at market value 1,667,294 3,130 1,112,636 - 3,767,191 Unrealised loss on forward foreign currency exchange contracts 195,791,541 149,821 733,868 949,433 339,990,306 Unrealised loss on interest rate swap contracts 56,696,588 156,754 - - 122,393,341 Unrealised loss on financial futures contracts 42,899,699 107,923 422,496 2,769,014 82,363,651 Unrealised loss on total return swap contracts 22,958,840 61,859 - - 25,688,696 Unrealised loss on credit default swap contracts - 17,592 - - 1,933,775 Unrealised loss on inflation swap contracts - - - - 502 Distributions payable - - - - 33,734 Other payables and accrued expenses 6,133,603 26,477 923,704 4,263,647 49,789,349
Total liabilities 436,347,869 783,275 6,070,500 23,894,245 1,080,397,663
Net asset value 3,780,695,444 19,470,557 378,648,890 2,225,064,133 44,730,043,938
+ Represents the combined totals of all Morgan Stanley Investment Funds.
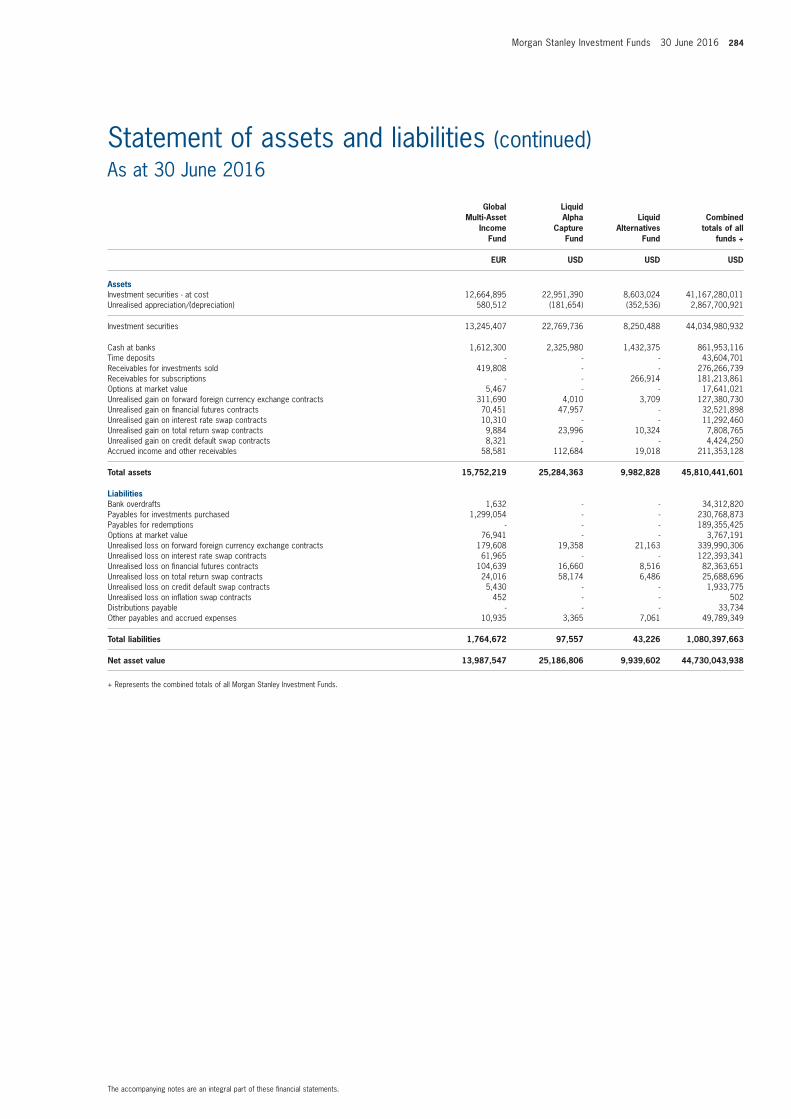
Morgan Stanley Investment Funds 30 June 2016 284
The accompanying notes are an integral part of these financial statements.
Statement of assets and liabilities (continued)As at 30 June 2016
Global Multi-Asset
Income Fund
Liquid Alpha
Capture Fund
Liquid Alternatives
Fund
Combined totals of all
funds +
EUR USD USD USD
AssetsInvestment securities - at cost 12,664,895 22,951,390 8,603,024 41,167,280,011 Unrealised appreciation/(depreciation) 580,512 (181,654) (352,536) 2,867,700,921
Investment securities 13,245,407 22,769,736 8,250,488 44,034,980,932
Cash at banks 1,612,300 2,325,980 1,432,375 861,953,116 Time deposits - - - 43,604,701 Receivables for investments sold 419,808 - - 276,266,739 Receivables for subscriptions - - 266,914 181,213,861 Options at market value 5,467 - - 17,641,021 Unrealised gain on forward foreign currency exchange contracts 311,690 4,010 3,709 127,380,730 Unrealised gain on financial futures contracts 70,451 47,957 - 32,521,898 Unrealised gain on interest rate swap contracts 10,310 - - 11,292,460 Unrealised gain on total return swap contracts 9,884 23,996 10,324 7,808,765 Unrealised gain on credit default swap contracts 8,321 - - 4,424,250 Accrued income and other receivables 58,581 112,684 19,018 211,353,128
Total assets 15,752,219 25,284,363 9,982,828 45,810,441,601
LiabilitiesBank overdrafts 1,632 - - 34,312,820 Payables for investments purchased 1,299,054 - - 230,768,873 Payables for redemptions - - - 189,355,425 Options at market value 76,941 - - 3,767,191 Unrealised loss on forward foreign currency exchange contracts 179,608 19,358 21,163 339,990,306 Unrealised loss on interest rate swap contracts 61,965 - - 122,393,341 Unrealised loss on financial futures contracts 104,639 16,660 8,516 82,363,651 Unrealised loss on total return swap contracts 24,016 58,174 6,486 25,688,696 Unrealised loss on credit default swap contracts 5,430 - - 1,933,775 Unrealised loss on inflation swap contracts 452 - - 502 Distributions payable - - - 33,734 Other payables and accrued expenses 10,935 3,365 7,061 49,789,349
Total liabilities 1,764,672 97,557 43,226 1,080,397,663
Net asset value 13,987,547 25,186,806 9,939,602 44,730,043,938
+ Represents the combined totals of all Morgan Stanley Investment Funds.
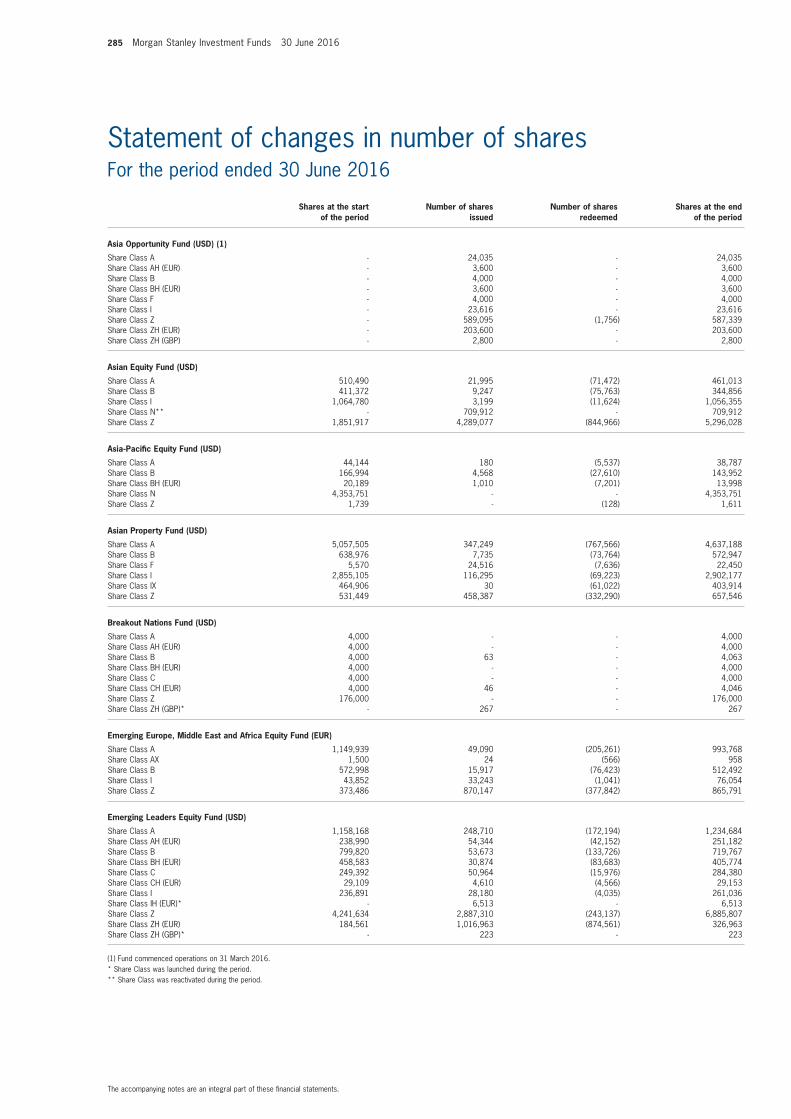
285 Morgan Stanley Investment Funds 30 June 2016
The accompanying notes are an integral part of these financial statements.
Statement of changes in number of sharesFor the period ended 30 June 2016
Shares at the start of the period
Number of shares issued
Number of shares redeemed
Shares at the end of the period
Asia Opportunity Fund (USD) (1)
Share Class A - 24,035 - 24,035Share Class AH (EUR) - 3,600 - 3,600Share Class B - 4,000 - 4,000Share Class BH (EUR) - 3,600 - 3,600Share Class F - 4,000 - 4,000Share Class I - 23,616 - 23,616Share Class Z - 589,095 (1,756) 587,339Share Class ZH (EUR) - 203,600 - 203,600Share Class ZH (GBP) - 2,800 - 2,800
Asian Equity Fund (USD)
Share Class A 510,490 21,995 (71,472) 461,013Share Class B 411,372 9,247 (75,763) 344,856Share Class I 1,064,780 3,199 (11,624) 1,056,355Share Class N** - 709,912 - 709,912Share Class Z 1,851,917 4,289,077 (844,966) 5,296,028
Asia-Pacific Equity Fund (USD)
Share Class A 44,144 180 (5,537) 38,787Share Class B 166,994 4,568 (27,610) 143,952Share Class BH (EUR) 20,189 1,010 (7,201) 13,998Share Class N 4,353,751 - - 4,353,751Share Class Z 1,739 - (128) 1,611
Asian Property Fund (USD)
Share Class A 5,057,505 347,249 (767,566) 4,637,188Share Class B 638,976 7,735 (73,764) 572,947Share Class F 5,570 24,516 (7,636) 22,450Share Class I 2,855,105 116,295 (69,223) 2,902,177Share Class IX 464,906 30 (61,022) 403,914Share Class Z 531,449 458,387 (332,290) 657,546
Breakout Nations Fund (USD)
Share Class A 4,000 - - 4,000Share Class AH (EUR) 4,000 - - 4,000Share Class B 4,000 63 - 4,063Share Class BH (EUR) 4,000 - - 4,000Share Class C 4,000 - - 4,000Share Class CH (EUR) 4,000 46 - 4,046Share Class Z 176,000 - - 176,000Share Class ZH (GBP)* - 267 - 267
Emerging Europe, Middle East and Africa Equity Fund (EUR)
Share Class A 1,149,939 49,090 (205,261) 993,768Share Class AX 1,500 24 (566) 958Share Class B 572,998 15,917 (76,423) 512,492Share Class I 43,852 33,243 (1,041) 76,054Share Class Z 373,486 870,147 (377,842) 865,791
Emerging Leaders Equity Fund (USD)
Share Class A 1,158,168 248,710 (172,194) 1,234,684Share Class AH (EUR) 238,990 54,344 (42,152) 251,182Share Class B 799,820 53,673 (133,726) 719,767Share Class BH (EUR) 458,583 30,874 (83,683) 405,774Share Class C 249,392 50,964 (15,976) 284,380Share Class CH (EUR) 29,109 4,610 (4,566) 29,153Share Class I 236,891 28,180 (4,035) 261,036Share Class IH (EUR)* - 6,513 - 6,513Share Class Z 4,241,634 2,887,310 (243,137) 6,885,807Share Class ZH (EUR) 184,561 1,016,963 (874,561) 326,963Share Class ZH (GBP)* - 223 - 223
(1) Fund commenced operations on 31 March 2016.* Share Class was launched during the period.** Share Class was reactivated during the period.
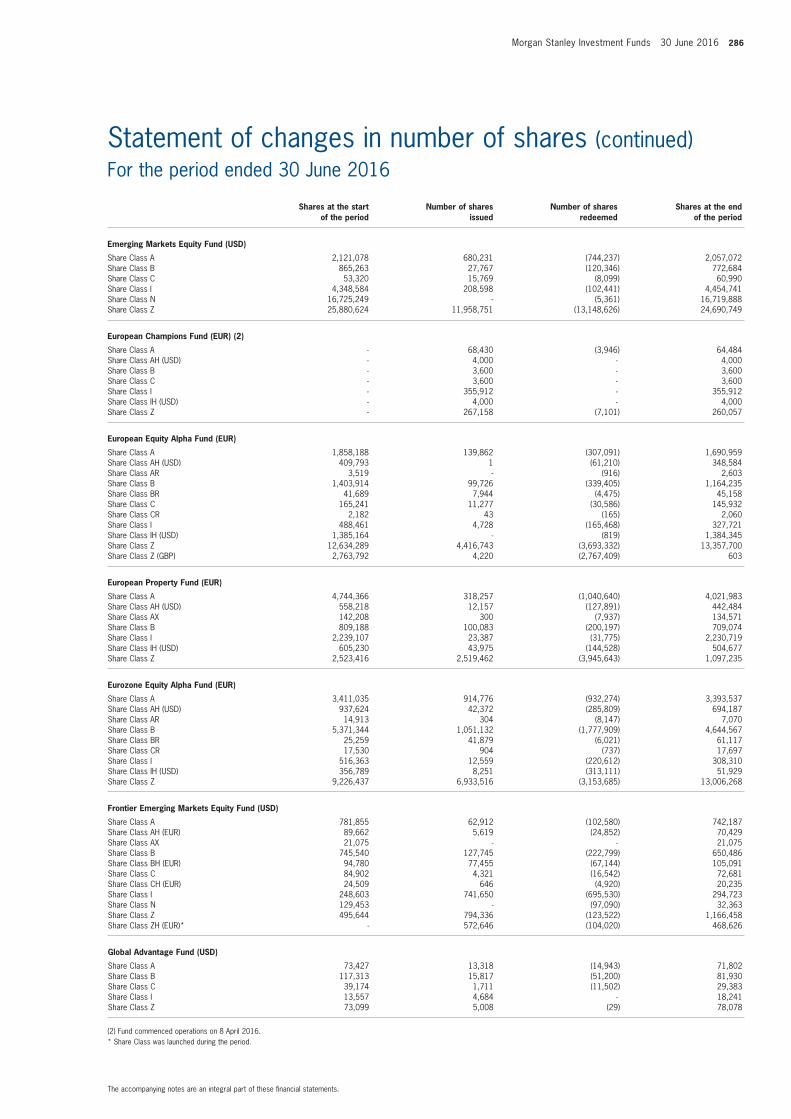
Morgan Stanley Investment Funds 30 June 2016 286
The accompanying notes are an integral part of these financial statements.
Statement of changes in number of shares (continued)For the period ended 30 June 2016
Shares at the start of the period
Number of shares issued
Number of shares redeemed
Shares at the end of the period
Emerging Markets Equity Fund (USD)
Share Class A 2,121,078 680,231 (744,237) 2,057,072Share Class B 865,263 27,767 (120,346) 772,684Share Class C 53,320 15,769 (8,099) 60,990Share Class I 4,348,584 208,598 (102,441) 4,454,741Share Class N 16,725,249 - (5,361) 16,719,888Share Class Z 25,880,624 11,958,751 (13,148,626) 24,690,749
European Champions Fund (EUR) (2)
Share Class A - 68,430 (3,946) 64,484Share Class AH (USD) - 4,000 - 4,000Share Class B - 3,600 - 3,600Share Class C - 3,600 - 3,600Share Class I - 355,912 - 355,912Share Class IH (USD) - 4,000 - 4,000Share Class Z - 267,158 (7,101) 260,057
European Equity Alpha Fund (EUR)
Share Class A 1,858,188 139,862 (307,091) 1,690,959Share Class AH (USD) 409,793 1 (61,210) 348,584Share Class AR 3,519 - (916) 2,603Share Class B 1,403,914 99,726 (339,405) 1,164,235Share Class BR 41,689 7,944 (4,475) 45,158Share Class C 165,241 11,277 (30,586) 145,932Share Class CR 2,182 43 (165) 2,060Share Class I 488,461 4,728 (165,468) 327,721Share Class IH (USD) 1,385,164 - (819) 1,384,345Share Class Z 12,634,289 4,416,743 (3,693,332) 13,357,700Share Class Z (GBP) 2,763,792 4,220 (2,767,409) 603
European Property Fund (EUR)
Share Class A 4,744,366 318,257 (1,040,640) 4,021,983Share Class AH (USD) 558,218 12,157 (127,891) 442,484Share Class AX 142,208 300 (7,937) 134,571Share Class B 809,188 100,083 (200,197) 709,074Share Class I 2,239,107 23,387 (31,775) 2,230,719Share Class IH (USD) 605,230 43,975 (144,528) 504,677Share Class Z 2,523,416 2,519,462 (3,945,643) 1,097,235
Eurozone Equity Alpha Fund (EUR)
Share Class A 3,411,035 914,776 (932,274) 3,393,537Share Class AH (USD) 937,624 42,372 (285,809) 694,187Share Class AR 14,913 304 (8,147) 7,070Share Class B 5,371,344 1,051,132 (1,777,909) 4,644,567Share Class BR 25,259 41,879 (6,021) 61,117Share Class CR 17,530 904 (737) 17,697Share Class I 516,363 12,559 (220,612) 308,310Share Class IH (USD) 356,789 8,251 (313,111) 51,929Share Class Z 9,226,437 6,933,516 (3,153,685) 13,006,268
Frontier Emerging Markets Equity Fund (USD)
Share Class A 781,855 62,912 (102,580) 742,187Share Class AH (EUR) 89,662 5,619 (24,852) 70,429Share Class AX 21,075 - - 21,075Share Class B 745,540 127,745 (222,799) 650,486Share Class BH (EUR) 94,780 77,455 (67,144) 105,091Share Class C 84,902 4,321 (16,542) 72,681Share Class CH (EUR) 24,509 646 (4,920) 20,235Share Class I 248,603 741,650 (695,530) 294,723Share Class N 129,453 - (97,090) 32,363Share Class Z 495,644 794,336 (123,522) 1,166,458Share Class ZH (EUR)* - 572,646 (104,020) 468,626
Global Advantage Fund (USD)
Share Class A 73,427 13,318 (14,943) 71,802Share Class B 117,313 15,817 (51,200) 81,930Share Class C 39,174 1,711 (11,502) 29,383Share Class I 13,557 4,684 - 18,241Share Class Z 73,099 5,008 (29) 78,078
(2) Fund commenced operations on 8 April 2016.* Share Class was launched during the period.
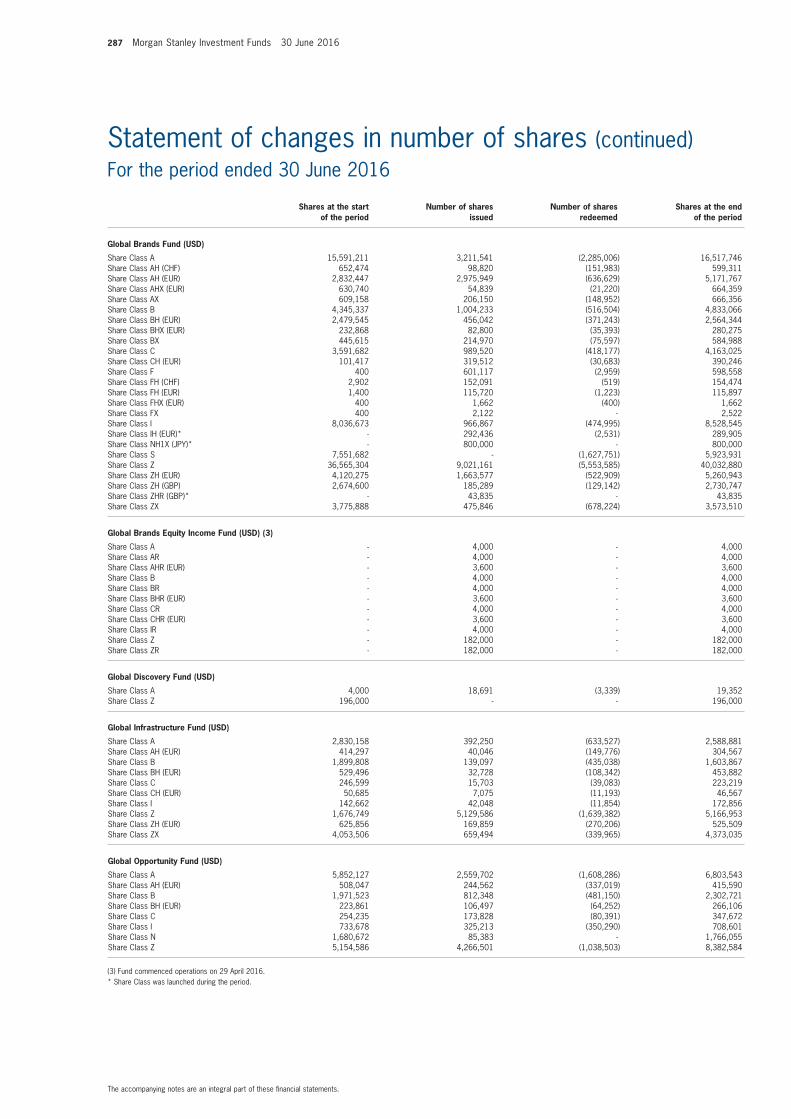
287 Morgan Stanley Investment Funds 30 June 2016
The accompanying notes are an integral part of these financial statements.
Statement of changes in number of shares (continued)For the period ended 30 June 2016
Shares at the start of the period
Number of shares issued
Number of shares redeemed
Shares at the end of the period
Global Brands Fund (USD)
Share Class A 15,591,211 3,211,541 (2,285,006) 16,517,746Share Class AH (CHF) 652,474 98,820 (151,983) 599,311Share Class AH (EUR) 2,832,447 2,975,949 (636,629) 5,171,767Share Class AHX (EUR) 630,740 54,839 (21,220) 664,359Share Class AX 609,158 206,150 (148,952) 666,356Share Class B 4,345,337 1,004,233 (516,504) 4,833,066Share Class BH (EUR) 2,479,545 456,042 (371,243) 2,564,344Share Class BHX (EUR) 232,868 82,800 (35,393) 280,275Share Class BX 445,615 214,970 (75,597) 584,988Share Class C 3,591,682 989,520 (418,177) 4,163,025Share Class CH (EUR) 101,417 319,512 (30,683) 390,246Share Class F 400 601,117 (2,959) 598,558Share Class FH (CHF) 2,902 152,091 (519) 154,474Share Class FH (EUR) 1,400 115,720 (1,223) 115,897Share Class FHX (EUR) 400 1,662 (400) 1,662Share Class FX 400 2,122 - 2,522Share Class I 8,036,673 966,867 (474,995) 8,528,545Share Class IH (EUR)* - 292,436 (2,531) 289,905Share Class NH1X (JPY)* - 800,000 - 800,000Share Class S 7,551,682 - (1,627,751) 5,923,931Share Class Z 36,565,304 9,021,161 (5,553,585) 40,032,880Share Class ZH (EUR) 4,120,275 1,663,577 (522,909) 5,260,943Share Class ZH (GBP) 2,674,600 185,289 (129,142) 2,730,747Share Class ZHR (GBP)* - 43,835 - 43,835Share Class ZX 3,775,888 475,846 (678,224) 3,573,510
Global Brands Equity Income Fund (USD) (3)
Share Class A - 4,000 - 4,000Share Class AR - 4,000 - 4,000Share Class AHR (EUR) - 3,600 - 3,600Share Class B - 4,000 - 4,000Share Class BR - 4,000 - 4,000Share Class BHR (EUR) - 3,600 - 3,600Share Class CR - 4,000 - 4,000Share Class CHR (EUR) - 3,600 - 3,600Share Class IR - 4,000 - 4,000Share Class Z - 182,000 - 182,000Share Class ZR - 182,000 - 182,000
Global Discovery Fund (USD)
Share Class A 4,000 18,691 (3,339) 19,352Share Class Z 196,000 - - 196,000
Global Infrastructure Fund (USD)
Share Class A 2,830,158 392,250 (633,527) 2,588,881Share Class AH (EUR) 414,297 40,046 (149,776) 304,567Share Class B 1,899,808 139,097 (435,038) 1,603,867Share Class BH (EUR) 529,496 32,728 (108,342) 453,882Share Class C 246,599 15,703 (39,083) 223,219Share Class CH (EUR) 50,685 7,075 (11,193) 46,567Share Class I 142,662 42,048 (11,854) 172,856Share Class Z 1,676,749 5,129,586 (1,639,382) 5,166,953Share Class ZH (EUR) 625,856 169,859 (270,206) 525,509Share Class ZX 4,053,506 659,494 (339,965) 4,373,035
Global Opportunity Fund (USD)
Share Class A 5,852,127 2,559,702 (1,608,286) 6,803,543Share Class AH (EUR) 508,047 244,562 (337,019) 415,590Share Class B 1,971,523 812,348 (481,150) 2,302,721Share Class BH (EUR) 223,861 106,497 (64,252) 266,106Share Class C 254,235 173,828 (80,391) 347,672Share Class I 733,678 325,213 (350,290) 708,601Share Class N 1,680,672 85,383 - 1,766,055Share Class Z 5,154,586 4,266,501 (1,038,503) 8,382,584
(3) Fund commenced operations on 29 April 2016.* Share Class was launched during the period.

Morgan Stanley Investment Funds 30 June 2016 288
The accompanying notes are an integral part of these financial statements.
Statement of changes in number of shares (continued)For the period ended 30 June 2016
Shares at the start of the period
Number of shares issued
Number of shares redeemed
Shares at the end of the period
Global Property Fund (USD)
Share Class A 6,707,566 1,008,424 (1,239,802) 6,476,188Share Class AH (EUR) 310,671 431,320 (215,151) 526,840Share Class B 620,618 55,483 (134,495) 541,606Share Class BH (EUR) 52,833 1,518 (11,547) 42,804Share Class C 212,485 25,067 (35,388) 202,164Share Class CH (EUR) 11,451 472 (3,337) 8,586Share Class I 2,943,575 147,327 (1,412,492) 1,678,410Share Class IX 281,705 38,386 (32,475) 287,616Share Class Z 22,051,012 7,125,390 (6,104,447) 23,071,955
Global Quality Fund (USD)
Share Class A 17,989,748 1,094,970 (5,238,756) 13,845,962Share Class AH (CHF) 1,399 89 - 1,488Share Class AH (EUR) 732,717 316,112 (128,495) 920,334Share Class AH (SGD) 229,885 - (41,290) 188,595Share Class AX 379,150 24,268 (15,109) 388,309Share Class B 2,840,856 389,735 (429,255) 2,801,336Share Class BH (EUR) 507,006 67,921 (88,870) 486,057Share Class C 1,110,444 82,728 (241,064) 952,108Share Class CH (EUR) 103,083 4,984 (14,826) 93,241Share Class E 799 - - 799Share Class I 5,581,558 1,528,602 (1,024,940) 6,085,220Share Class Z 17,726,388 4,133,275 (6,487,208) 15,372,455Share Class ZH (CHF) 117,354 3,010 (4,960) 115,404Share Class ZH (EUR) 1,559,669 439,138 (851,208) 1,147,599Share Class ZX 5,170,836 2,470,092 (180,470) 7,460,458
Indian Equity Fund (USD)
Share Class A 1,646,749 724,901 (864,000) 1,507,650Share Class B 994,829 106,862 (186,648) 915,043Share Class I 44,454 82,506 (797) 126,163Share Class N 1,502,131 1,179,723 (981,569) 1,700,285Share Class Z 2,694,164 2,166,025 (1,096,620) 3,763,569
International Equity (ex US) Fund (USD)
Share Class A 1,691,519 794,628 (257,575) 2,228,572Share Class B 4,000 - - 4,000Share Class C 22,104 - - 22,104Share Class I 562,712 74,760 (14,945) 622,527Share Class Z 191,957 - - 191,957
Japanese Equity Fund (JPY)
Share Class A 224,659 41,670 (131,035) 135,294Share Class AH (USD) 81,543 26,718 (49,312) 58,949Share Class B 222,640 19,759 (58,997) 183,402Share Class C 47,556 1,317 (24,150) 24,723Share Class I 21,749 16,716 (4,519) 33,946Share Class Z 6,610,445 7,826,319 (3,441,446) 10,995,318Share Class ZH (EUR) 1,201,113 800,990 (1,632,115) 369,988
Latin American Equity Fund (USD)
Share Class A 5,736,121 681,856 (571,859) 5,846,118Share Class B 335,427 103,756 (86,949) 352,234Share Class C 13,624 2,006 - 15,630Share Class I 429,862 25,071 (25,810) 429,123Share Class Z 1,057,601 3,455,490 (1,903,029) 2,610,062
US Advantage Fund (USD)
Share Class A 27,766,876 4,037,927 (6,951,652) 24,853,151Share Class AH (EUR) 2,352,964 849,640 (1,188,868) 2,013,736Share Class B 3,008,283 254,434 (546,455) 2,716,262Share Class BH (EUR) 458,595 48,835 (106,036) 401,394Share Class C 2,339,670 270,041 (472,323) 2,137,388Share Class I 10,045,575 2,422,418 (2,190,986) 10,277,007Share Class IH (EUR)** - 1,345 - 1,345Share Class Z 17,351,429 5,488,555 (6,943,741) 15,896,243Share Class ZH (EUR) 3,563,954 3,938,391 (2,185,881) 5,316,464Share Class ZH (GBP)* - 5,174 - 5,174Share Class ZX 7,397,080 162,622 (302,267) 7,257,435
* Share Class was launched during the period.** Share Class was reactivated during the period.

289 Morgan Stanley Investment Funds 30 June 2016
The accompanying notes are an integral part of these financial statements.
Statement of changes in number of shares (continued)For the period ended 30 June 2016
Shares at the start of the period
Number of shares issued
Number of shares redeemed
Shares at the end of the period
US Growth Fund (USD)
Share Class A 8,039,853 489,409 (1,654,473) 6,874,789Share Class AH (EUR) 640,985 43,269 (144,963) 539,291Share Class AX 361,549 9,699 (39,125) 332,123Share Class B 1,234,584 57,330 (177,486) 1,114,428Share Class BH (EUR) 70,806 7,969 (9,542) 69,233Share Class C 457,535 18,754 (134,429) 341,860Share Class CH (EUR) 4,861 25,621 (1,434) 29,048Share Class F 199,948 132,837 (107,820) 224,965Share Class FH (EUR) 360 - - 360Share Class I 2,464,185 200,623 (775,258) 1,889,550Share Class IX 115,502 21,695 (87,624) 49,573Share Class Z 4,885,599 1,929,286 (2,724,149) 4,090,736Share Class ZH (EUR) 3,019,103 4,862,034 (2,710,189) 5,170,948Share Class ZX 5,849,791 451,422 (1,729,683) 4,571,530
US Insight Fund (USD)
Share Class A 4,000 60,530 - 64,530Share Class Z 196,000 - - 196,000
US Property Fund (USD)
Share Class A 3,381,342 218,224 (807,587) 2,791,979Share Class B 296,921 23,530 (64,486) 255,965Share Class F 9,219 114,759 (32,110) 91,868Share Class I 743,591 701,148 (320,261) 1,124,478Share Class Z 1,603,947 392,510 (475,557) 1,520,900
Absolute Return Fixed Income Fund (EUR)
Share Class A 153,548 5,141 (17,676) 141,013Share Class AH (USD) 347 - - 347Share Class AR 43,261 2,659 (12,393) 33,527Share Class B 396,453 116,359 (130,716) 382,096Share Class BR 236,595 65,816 (48,903) 253,508Share Class C 133,244 1,387 (41,944) 92,687Share Class CR 35,875 14,503 (11,348) 39,030Share Class IH (USD) 348 - - 348Share Class Z 312,276 - (1,750) 310,526
Asian Fixed Income Opportunities Fund (USD)
Share Class A 4,000 - - 4,000Share Class AX 4,000 - - 4,000Share Class I 4,000 - - 4,000Share Class IX 4,000 - - 4,000Share Class Z 380,000 - - 380,000Share Class ZX 4,000 - - 4,000
Emerging Markets Corporate Debt Fund (USD)
Share Class A 1,717,428 276,879 (476,909) 1,517,398Share Class AH (EUR) 388,748 30,587 (205,369) 213,966Share Class AHX (EUR) 2,391,341 141,414 (289,381) 2,243,374Share Class AX 378,029 37,502 (88,103) 327,428Share Class B 878,512 84,306 (113,379) 849,439Share Class BH (EUR) 294,818 28,716 (49,832) 273,702Share Class BHX (EUR) 393,519 27,653 (74,433) 346,739Share Class BX 597,435 43,123 (140,268) 500,290Share Class C 558,394 17,825 (49,678) 526,541Share Class CH (EUR) 43,563 6,489 (4,756) 45,296Share Class I 319,630 115,049 (104,195) 330,484Share Class IH (EUR)* - 2,018 - 2,018Share Class Z 9,607,732 7,917,255 (3,296,249) 14,228,738Share Class ZH (EUR) 559,416 495,090 (161,102) 893,404
* Share Class was launched during the period.

Morgan Stanley Investment Funds 30 June 2016 290
The accompanying notes are an integral part of these financial statements.
Statement of changes in number of shares (continued)For the period ended 30 June 2016
Shares at the start of the period
Number of shares issued
Number of shares redeemed
Shares at the end of the period
Emerging Markets Debt Fund (USD)
Share Class A 608,293 102,742 (157,130) 553,905Share Class AH (EUR) 116,728 12,393 (11,547) 117,574Share Class AHX (EUR) 43,310 6,166 (359) 49,117Share Class ARM 1,026,599 37,851 (89,016) 975,434Share Class AX 46,187 10,603 (6,244) 50,546Share Class B 733,510 72,680 (131,792) 674,398Share Class BH (EUR) 391,413 28,605 (56,675) 363,343Share Class BHX (EUR) 384,247 65,547 (38,528) 411,266Share Class BX 521,631 56,168 (106,215) 471,584Share Class C 41,199 13,854 (7,246) 47,807Share Class I 396,929 7,638 (4,094) 400,473Share Class Z 958,376 472,256 (549,763) 880,869Share Class ZH (EUR) 195,110 450,781 (228,146) 417,745
Emerging Markets Domestic Debt Fund (USD)
Share Class A 1,007,560 154,123 (206,685) 954,998Share Class AH (EUR) 59,401 18,125 (5,162) 72,364Share Class AHX (EUR) 46,509 8,235 (2,969) 51,775Share Class ARM 216,385 252,449 (218,143) 250,691Share Class AX 91,993 4,217 (5,725) 90,485Share Class B 1,788,763 114,779 (240,496) 1,663,046Share Class BH (EUR) 539,859 88,665 (94,376) 534,148Share Class BHX (EUR) 284,688 35,626 (39,397) 280,917Share Class BX 1,449,861 109,323 (242,058) 1,317,126Share Class C 69,306 5,034 (10,298) 64,042Share Class I 110,280 233,152 (200,021) 143,411Share Class Z 1,779,360 781,536 (982,814) 1,578,082Share Class ZH (EUR) 102 104,941 (98,711) 6,332Share Class ZX 163,864 11 (43,579) 120,296
Emerging Markets Fixed Income Opportunities Fund (USD)
Share Class A 4,000 - - 4,000Share Class AH (EUR) 4,000 229,073 - 233,073Share Class AHR (EUR) 4,000 - - 4,000Share Class B 4,000 221 - 4,221Share Class BH (EUR) 4,000 2,167 - 6,167Share Class BHR (EUR) 4,000 35,409 (2) 39,407Share Class C 4,000 - - 4,000Share Class CH (EUR) 4,000 726 - 4,726Share Class CHR (EUR) 4,000 150 - 4,150Share Class Z 364,000 - - 364,000
Euro Bond Fund (EUR)
Share Class A 2,918,713 1,067,513 (1,153,899) 2,832,327Share Class B 2,682,725 1,482,782 (453,302) 3,712,205Share Class C 66,309 14,174 (9,453) 71,030Share Class I 955,489 1,164,684 (1,814,085) 306,088Share Class Z 3,991,535 2,641,471 (3,274,556) 3,358,450
Euro Corporate Bond Fund (EUR)
Share Class A 13,461,060 2,347,971 (3,163,758) 12,645,273Share Class AD 894,914 204,169 (272,306) 826,777Share Class ADX 237,927 3,889 (83,743) 158,073Share Class AH (USD) 188,187 40,241 (65,843) 162,585Share Class AX 1,736,622 206,263 (316,606) 1,626,279Share Class B 2,175,110 373,004 (332,546) 2,215,568Share Class BD 708,949 19,793 (151,419) 577,323Share Class BDX 559,864 25,937 (191,722) 394,079Share Class BH (USD) 38,749 - (16,743) 22,006Share Class BX 1,499,865 166,440 (208,748) 1,457,557Share Class C 110,281 26,295 (22,040) 114,536Share Class CD 51,884 2,669 (368) 54,185Share Class F 400 51,125 - 51,525Share Class FX 400 941 (37) 1,304Share Class I 2,849,914 1,361,603 (788,414) 3,423,103Share Class IH (USD) 662,260 24,203 (29,524) 656,939Share Class ID 1,601,554 - (1,572,445) 29,109Share Class IX 400,421 22,523 (66,185) 356,759Share Class S 10,148,029 5,859,251 (2,336,360) 13,670,920Share Class Z 54,841,547 15,879,860 (31,230,675) 39,490,732Share Class ZD 10,259,357 10,814,348 (6,306,282) 14,767,423Share Class ZOX 1,591,339 - (793,082) 798,257

291 Morgan Stanley Investment Funds 30 June 2016
The accompanying notes are an integral part of these financial statements.
Statement of changes in number of shares (continued)For the period ended 30 June 2016
Shares at the start of the period
Number of shares issued
Number of shares redeemed
Shares at the end of the period
Euro Corporate Bond (ex Financials) Fund (EUR) (4)
Share Class A 34,898 632 (35,530) -Share Class N 2,253,179 15,964 (2,269,143) -Share Class Z 55,461 7,728 (63,189) -
Euro Strategic Bond Fund (EUR)
Share Class A 3,762,333 711,818 (717,766) 3,756,385Share Class AD 169,053 8,533 (46,917) 130,669Share Class ADX 147,783 7,337 (23,886) 131,234Share Class AX 1,327,968 103,599 (350,062) 1,081,505Share Class B 2,879,045 684,163 (417,118) 3,146,090Share Class BD 556,426 13,282 (143,456) 426,252Share Class BDX 822,498 45,673 (183,241) 684,930Share Class BX 1,577,902 422,244 (277,749) 1,722,397Share Class C 119,790 52,986 (27,688) 145,088Share Class I 548,379 94,148 (181,393) 461,134Share Class Z 10,380,619 3,293,794 (4,020,097) 9,654,316Share Class ZD 666,878 - (120,739) 546,139
European Currencies High Yield Bond Fund (EUR)
Share Class A 9,879,283 1,468,184 (2,661,119) 8,686,348Share Class ADX 255,010 19,740 (40,689) 234,061Share Class AH (USD) 508,411 151,627 (499,388) 160,650Share Class AX 572,776 42,333 (56,632) 558,477Share Class B 4,198,781 645,880 (945,029) 3,899,632Share Class BD 122,962 8,155 (24,280) 106,837Share Class BDX 946,231 76,485 (169,420) 853,296Share Class BX 2,148,848 266,119 (395,291) 2,019,676Share Class C 158,295 18,404 (18,686) 158,013Share Class I 3,068,194 2,622,120 (2,016,475) 3,673,839Share Class IH (USD) 57,340 56,959 - 114,299Share Class Z 13,644,944 3,554,553 (4,532,415) 12,667,082Share Class ZH (USD) 400 - - 400Share Class ZX 6,469,496 334,156 (7,749) 6,795,903
Global Bond Fund (USD)
Share Class A 1,596,147 393,814 (410,330) 1,579,631Share Class AH (EUR) 25,541 25,823 (6,097) 45,267Share Class AHX (EUR) 22,866 1,025 (240) 23,651Share Class AX 47,674 8,945 (5,732) 50,887Share Class B 1,269,793 205,123 (211,479) 1,263,437Share Class BH (EUR) 215,879 44,522 (53,589) 206,812Share Class BHX (EUR) 156,220 29,492 (43,640) 142,072Share Class BX 386,787 100,340 (57,069) 430,058Share Class C 47,367 6,044 (6,696) 46,715Share Class I 1,978,521 583,647 (917,304) 1,644,864Share Class Z 8,310,656 1,413,405 (1,794,178) 7,929,883Share Class ZH (EUR)* - 32,043 (27) 32,016
Global Convertible Bond Fund (USD)
Share Class A 4,443,581 120,966 (2,282,719) 2,281,828Share Class AH (CHF) 18,149 242 (11,945) 6,446Share Class AH (EUR) 1,570,263 35,373 (679,764) 925,872Share Class B 909,221 213,241 (380,516) 741,946Share Class BH (EUR) 679,863 193,233 (309,488) 563,608Share Class CH (EUR) 122,488 742 (28,421) 94,809Share Class I 3,059,907 73,268 (2,800,239) 332,936Share Class IH (EUR) 3,030,636 136,815 (557,162) 2,610,289Share Class NH (CHF) 3,398,282 - - 3,398,282Share Class Z 11,418,240 164,657 (7,174,349) 4,408,548Share Class ZH (CHF) 120,000 - (120,000) -Share Class ZH (EUR) 4,144,702 98,889 (3,445,957) 797,634Share Class ZHX (EUR) 2,538,138 2,064 (615) 2,539,587Share Class ZX 5,176,264 543,230 (2,206,141) 3,513,353
Global Credit Fund (USD)
Share Class A 29,477 17,228 (20,715) 25,990Share Class B 71,734 32,591 (13,282) 91,043Share Class C 7,197 3,278 (2,050) 8,425Share Class I 2,101 10,720 (169) 12,652Share Class Z 3,650,413 812,699 (385,541) 4,077,571Share Class ZH1 (CHF) 1,798,050 - - 1,798,050
(4) Fund was closed on 2 May 2016.* Share Class was launched during the period.

Morgan Stanley Investment Funds 30 June 2016 292
The accompanying notes are an integral part of these financial statements.
Statement of changes in number of shares (continued)For the period ended 30 June 2016
Shares at the start of the period
Number of shares issued
Number of shares redeemed
Shares at the end of the period
Global Fixed Income Opportunities Fund (USD)
Share Class A 5,586,495 882,486 (1,661,611) 4,807,370Share Class AH (CHF) 14,512 - (10,812) 3,700Share Class AH (EUR) 1,043,830 74,126 (263,157) 854,799Share Class AHR (EUR) 7,604 4,073 (4,007) 7,670Share Class AHX (EUR) 1,121,171 121,107 (185,954) 1,056,324Share Class ARM 413,057 1,118 (78,755) 335,420Share Class AX 1,442,806 140,051 (219,467) 1,363,390Share Class B 4,656,052 607,218 (867,869) 4,395,401Share Class BH (EUR) 1,518,096 240,200 (273,174) 1,485,122Share Class BHR (EUR) 88,353 73,989 (4,734) 157,608Share Class BHX (EUR) 2,811,868 238,666 (549,590) 2,500,944Share Class BX 3,005,120 390,257 (522,828) 2,872,549Share Class C 1,473,721 524,585 (270,937) 1,727,369Share Class CH (EUR) 121,980 9,912 (17,240) 114,652Share Class CHR (EUR) 29,981 1,967 (8,771) 23,177Share Class CHX (EUR) 211,311 37,454 (50,772) 197,993Share Class I 1,988,027 725,575 (640,937) 2,072,665Share Class IH (CHF) 4,022 10,444 (144) 14,322Share Class IX 11,793 4 (418) 11,379Share Class Z 11,048,877 3,528,182 (4,244,267) 10,332,792Share Class ZH (CHF) 347,093 - - 347,093Share Class ZH (EUR) 4,201,290 4,881,891 (2,456,259) 6,626,922Share Class ZH (GBP) 280 - - 280Share Class ZHX (EUR)* - 401 - 401Share Class ZHX (GBP) 284 6 - 290Share Class ZX 3,154,912 154,427 (4,858) 3,304,481
Global High Yield Bond Fund (USD)
Share Class A 550,764 138,339 (165,169) 523,934Share Class AH (EUR) 439,088 141,602 (203,382) 377,308Share Class AHX (EUR) 240,101 29,796 (27,699) 242,198Share Class AO (SEK) 672,866 399,340 (90,648) 981,558Share Class AX 347,673 51,089 (66,091) 332,671Share Class B 786,573 146,453 (130,602) 802,424Share Class BH (EUR) 351,864 96,755 (69,441) 379,178Share Class BHX (EUR) 1,374,867 140,723 (271,328) 1,244,262Share Class BX 2,224,167 420,452 (314,312) 2,330,307Share Class C 108,779 24,675 (13,798) 119,656Share Class CH (EUR) 20,847 4,513 (2,194) 23,166Share Class I 82,859 45,907 (44,649) 84,117Share Class IX 33,626 4,469 (35) 38,060Share Class Z 2,816,315 236,372 (612,514) 2,440,173Share Class ZH (EUR) 69,952 148,102 (10,107) 207,947
Global Mortgage Securities Fund (USD)
Share Class A 497,104 185,024 (54,527) 627,601Share Class AH (EUR) 20,711 52,540 (21,723) 51,528Share Class B 75,735 85,772 (27,601) 133,906Share Class BH (EUR) 7,954 44,523 (10,480) 41,997Share Class BHR (EUR) 14,502 20,426 (14,356) 20,572Share Class BHX (EUR) 43,912 19,205 (4,123) 58,994Share Class C 237,646 10,710 (19,203) 229,153Share Class CH (EUR) 1,502 52,340 (22,202) 31,640Share Class CHX (EUR) 5,902 1,718 - 7,620Share Class CX 85,361 5,289 (1,398) 89,252Share Class I 365,646 23,071 (43,979) 344,738Share Class IH (EUR) 6,256,366 499,350 (538,120) 6,217,596Share Class IHX (EUR) 4,685,683 124,826 (327,704) 4,482,805Share Class Z 160,857 882,182 (78,645) 964,394
Global Premier Credit Fund (USD)
Share Class A 15,316 6,031 (6,735) 14,612Share Class B 92,029 30,634 (3,544) 119,119Share Class BH (EUR) 9,737 11,700 - 21,437Share Class Z 383,256 15,943 - 399,199Share Class ZX 4,005 - - 4,005
* Share Class was launched during the period.

293 Morgan Stanley Investment Funds 30 June 2016
The accompanying notes are an integral part of these financial statements.
Statement of changes in number of shares (continued)For the period ended 30 June 2016
Shares at the start of the period
Number of shares issued
Number of shares redeemed
Shares at the end of the period
Short Maturity Euro Bond Fund (EUR)
Share Class A 8,440,392 739,780 (6,596,307) 2,583,865Share Class AH (SEK) 3,950 1,110 (442) 4,618Share Class AH (USD) 1,761 - (1,361) 400Share Class B 4,286,818 6,402,040 (2,757,069) 7,931,789Share Class C 46,863 75,858 (35,747) 86,974Share Class I 2,485,543 1,260,368 (326,611) 3,419,300Share Class IH (USD) 79,302 - - 79,302Share Class Z 27,519,868 25,531,905 (16,950,326) 36,101,447
US Dollar Corporate Bond Fund (USD) (5)
Share Class A - 4,000 - 4,000Share Class I - 4,000 - 4,000Share Class Z - 392,000 - 392,000
US Dollar High Yield Bond Fund (USD)
Share Class A 4,477 762 (615) 4,624Share Class AX 13,894 1,940 - 15,834Share Class B 4,000 - - 4,000Share Class BX 4,000 - - 4,000Share Class C 4,000 2,111 - 6,111Share Class CX 4,000 - - 4,000Share Class I 7,750 4,131 - 11,881Share Class Z 372,000 - - 372,000
US Dollar Short Duration Bond Fund (USD) (6)
Share Class A - 49,967 - 49,967Share Class I - 15,966 - 15,966Share Class Z - 392,000 - 392,000
US Dollar Short Duration High Yield Bond Fund (USD)
Share Class A 4,219 917 (308) 4,828Share Class AX 4,000 - - 4,000Share Class B 4,000 - - 4,000Share Class BX 4,000 - - 4,000Share Class C 4,000 - - 4,000Share Class CX 4,000 - - 4,000Share Class I 4,000 - - 4,000Share Class Z 372,000 - - 372,000
US Dollar Liquidity Fund (USD)
Share Class A 3,753,830 4,260,117 (4,751,366) 3,262,581Share Class AX 3,781,798,273 1,571,676,872 (1,325,053,414) 4,028,421,731Share Class I 7,710,844 5,920,587 (5,465,044) 8,166,387Share Class Z 189,900 4,579,507 (3,740,451) 1,028,956
Diversified Alpha Plus Fund (EUR)
Share Class A 12,695,893 1,328,393 (5,322,618) 8,701,668Share Class AH (CHF) 46,732 94 (26,934) 19,892Share Class AH (SEK) 165,978 123,165 (53,620) 235,523Share Class AH (SGD) 500 - - 500Share Class AH (USD) 6,404,151 55,540 (2,923,319) 3,536,372Share Class AX 11,886 - (6,341) 5,545Share Class B 59,437,755 838,267 (6,988,528) 53,287,494Share Class BH (USD) 148,056 4,184 (24,372) 127,868Share Class C 2,148,946 23,323 (663,969) 1,508,300Share Class F 360 - - 360Share Class FH (CHF) 400 - - 400Share Class FH (GBP) 220 - - 220Share Class FH (SGD) 600 - - 600Share Class FH (USD) 61,470 - - 61,470Share Class I 926,029 13,632 (476,725) 462,936Share Class IH (GBP) 473 - - 473Share Class IH (USD) 593,254 28,927 (208,290) 413,891Share Class N 977,648 - (780,497) 197,151Share Class Z 22,011,814 1,365,185 (10,906,098) 12,470,901Share Class ZH (CHF) 597,974 7,076 (38,286) 566,764Share Class ZH (GBP) 62,971,702 561,554 (14,976,699) 48,556,557Share Class ZH (USD) 2,327,321 43,669 (1,935,390) 435,600Share Class ZHX (GBP) 3,275,781 331 (2,401,014) 875,098
(5) Fund commenced operations on 20 May 2016.(6) Fund commenced operations on 22 April 2016.
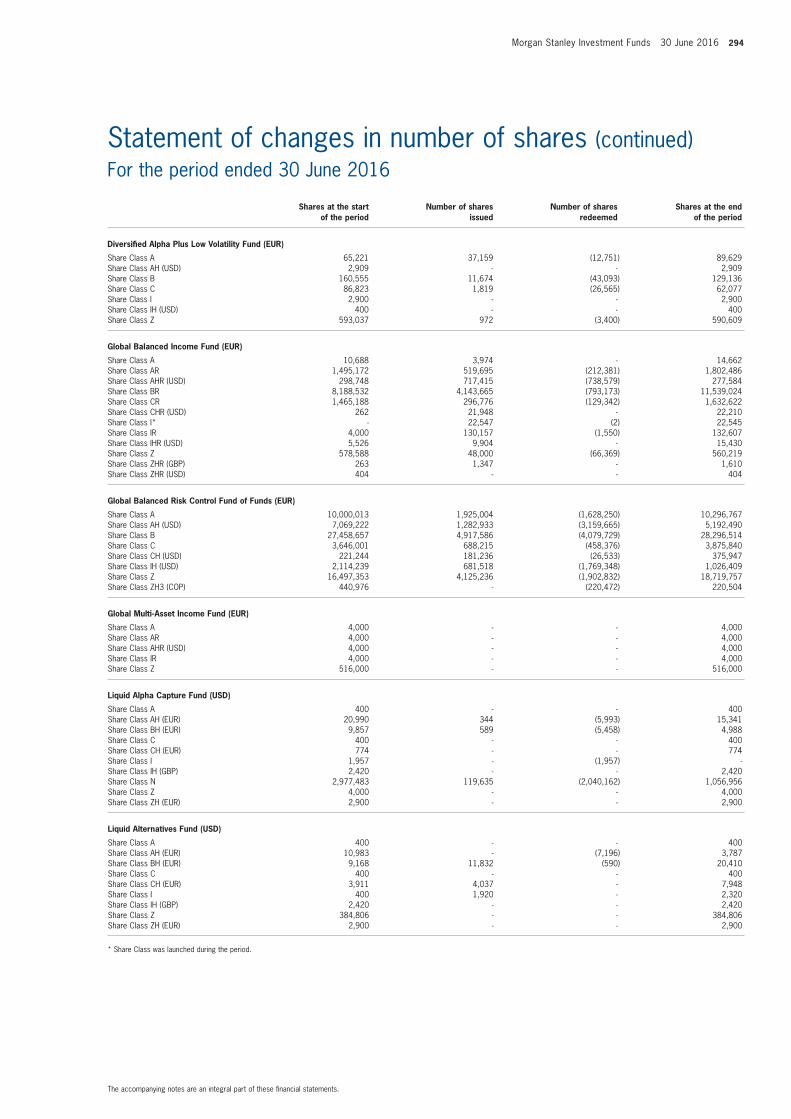
Morgan Stanley Investment Funds 30 June 2016 294
The accompanying notes are an integral part of these financial statements.
Statement of changes in number of shares (continued)For the period ended 30 June 2016
Shares at the start of the period
Number of shares issued
Number of shares redeemed
Shares at the end of the period
Diversified Alpha Plus Low Volatility Fund (EUR)
Share Class A 65,221 37,159 (12,751) 89,629Share Class AH (USD) 2,909 - - 2,909Share Class B 160,555 11,674 (43,093) 129,136Share Class C 86,823 1,819 (26,565) 62,077Share Class I 2,900 - - 2,900Share Class IH (USD) 400 - - 400Share Class Z 593,037 972 (3,400) 590,609
Global Balanced Income Fund (EUR)
Share Class A 10,688 3,974 - 14,662Share Class AR 1,495,172 519,695 (212,381) 1,802,486Share Class AHR (USD) 298,748 717,415 (738,579) 277,584Share Class BR 8,188,532 4,143,665 (793,173) 11,539,024Share Class CR 1,465,188 296,776 (129,342) 1,632,622Share Class CHR (USD) 262 21,948 - 22,210Share Class I* - 22,547 (2) 22,545Share Class IR 4,000 130,157 (1,550) 132,607Share Class IHR (USD) 5,526 9,904 - 15,430Share Class Z 578,588 48,000 (66,369) 560,219Share Class ZHR (GBP) 263 1,347 - 1,610Share Class ZHR (USD) 404 - - 404
Global Balanced Risk Control Fund of Funds (EUR)
Share Class A 10,000,013 1,925,004 (1,628,250) 10,296,767Share Class AH (USD) 7,069,222 1,282,933 (3,159,665) 5,192,490Share Class B 27,458,657 4,917,586 (4,079,729) 28,296,514Share Class C 3,646,001 688,215 (458,376) 3,875,840Share Class CH (USD) 221,244 181,236 (26,533) 375,947Share Class IH (USD) 2,114,239 681,518 (1,769,348) 1,026,409Share Class Z 16,497,353 4,125,236 (1,902,832) 18,719,757Share Class ZH3 (COP) 440,976 - (220,472) 220,504
Global Multi-Asset Income Fund (EUR)
Share Class A 4,000 - - 4,000Share Class AR 4,000 - - 4,000Share Class AHR (USD) 4,000 - - 4,000Share Class IR 4,000 - - 4,000Share Class Z 516,000 - - 516,000
Liquid Alpha Capture Fund (USD)
Share Class A 400 - - 400Share Class AH (EUR) 20,990 344 (5,993) 15,341Share Class BH (EUR) 9,857 589 (5,458) 4,988Share Class C 400 - - 400Share Class CH (EUR) 774 - - 774Share Class I 1,957 - (1,957) -Share Class IH (GBP) 2,420 - - 2,420Share Class N 2,977,483 119,635 (2,040,162) 1,056,956Share Class Z 4,000 - - 4,000Share Class ZH (EUR) 2,900 - - 2,900
Liquid Alternatives Fund (USD)
Share Class A 400 - - 400Share Class AH (EUR) 10,983 - (7,196) 3,787Share Class BH (EUR) 9,168 11,832 (590) 20,410Share Class C 400 - - 400Share Class CH (EUR) 3,911 4,037 - 7,948Share Class I 400 1,920 - 2,320Share Class IH (GBP) 2,420 - - 2,420Share Class Z 384,806 - - 384,806Share Class ZH (EUR) 2,900 - - 2,900
* Share Class was launched during the period.
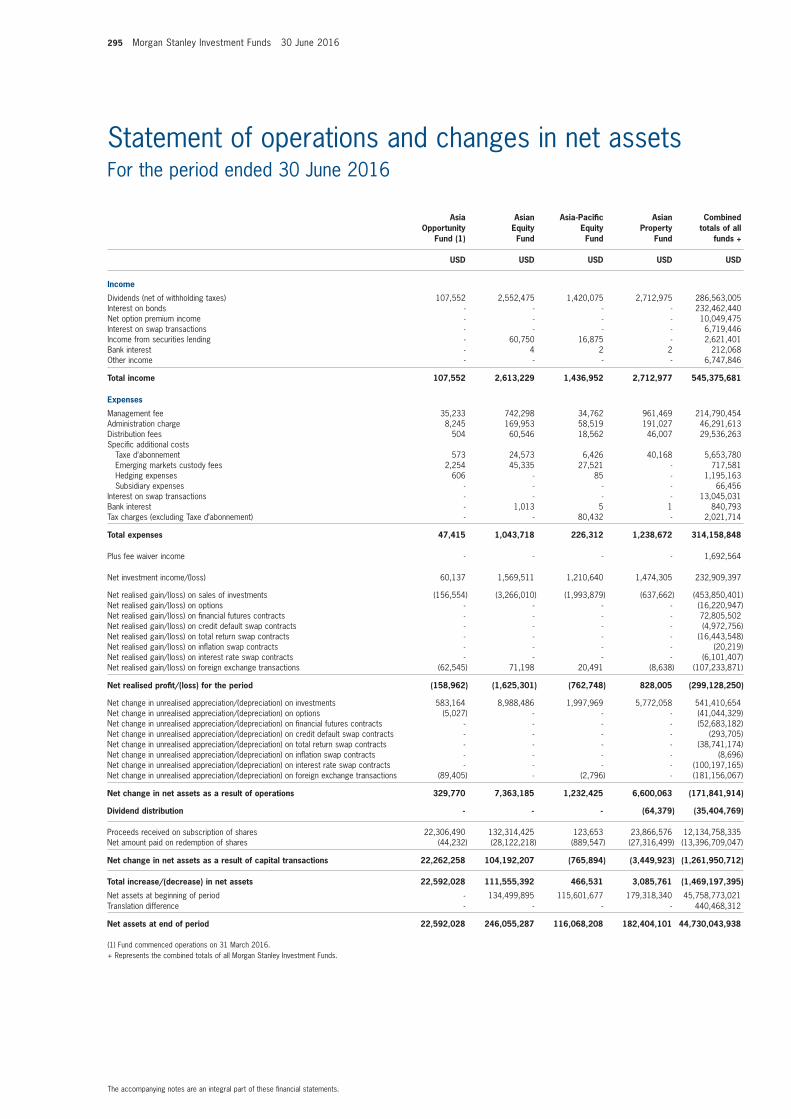
295 Morgan Stanley Investment Funds 30 June 2016
The accompanying notes are an integral part of these financial statements.
Statement of operations and changes in net assetsFor the period ended 30 June 2016
Asia Opportunity
Fund (1)
Asian
Equity Fund
Asia-Pacific Equity Fund
Asian Property
Fund
Combined totals of all
funds +
USD USD USD USD USD
Income
Dividends (net of withholding taxes) 107,552 2,552,475 1,420,075 2,712,975 286,563,005Interest on bonds - - - - 232,462,440Net option premium income - - - - 10,049,475Interest on swap transactions - - - - 6,719,446Income from securities lending - 60,750 16,875 - 2,621,401Bank interest - 4 2 2 212,068Other income - - - - 6,747,846
Total income 107,552 2,613,229 1,436,952 2,712,977 545,375,681
Expenses
Management fee 35,233 742,298 34,762 961,469 214,790,454Administration charge 8,245 169,953 58,519 191,027 46,291,613Distribution fees 504 60,546 18,562 46,007 29,536,263Specific additional costs Taxe d’abonnement 573 24,573 6,426 40,168 5,653,780 Emerging markets custody fees 2,254 45,335 27,521 - 717,581 Hedging expenses 606 - 85 - 1,195,163 Subsidiary expenses - - - - 66,456Interest on swap transactions - - - - 13,045,031Bank interest - 1,013 5 1 840,793Tax charges (excluding Taxe d’abonnement) - - 80,432 - 2,021,714
Total expenses 47,415 1,043,718 226,312 1,238,672 314,158,848
Plus fee waiver income - - - - 1,692,564
Net investment income/(loss) 60,137 1,569,511 1,210,640 1,474,305 232,909,397
Net realised gain/(loss) on sales of investments (156,554) (3,266,010) (1,993,879) (637,662) (453,850,401)Net realised gain/(loss) on options - - - - (16,220,947)Net realised gain/(loss) on financial futures contracts - - - - 72,805,502Net realised gain/(loss) on credit default swap contracts - - - - (4,972,756)Net realised gain/(loss) on total return swap contracts - - - - (16,443,548)Net realised gain/(loss) on inflation swap contracts - - - - (20,219)Net realised gain/(loss) on interest rate swap contracts - - - - (6,101,407)Net realised gain/(loss) on foreign exchange transactions (62,545) 71,198 20,491 (8,638) (107,233,871)
Net realised profit/(loss) for the period (158,962) (1,625,301) (762,748) 828,005 (299,128,250)
Net change in unrealised appreciation/(depreciation) on investments 583,164 8,988,486 1,997,969 5,772,058 541,410,654Net change in unrealised appreciation/(depreciation) on options (5,027) - - - (41,044,329)Net change in unrealised appreciation/(depreciation) on financial futures contracts - - - - (52,683,182)Net change in unrealised appreciation/(depreciation) on credit default swap contracts - - - - (293,705)Net change in unrealised appreciation/(depreciation) on total return swap contracts - - - - (38,741,174)Net change in unrealised appreciation/(depreciation) on inflation swap contracts - - - - (8,696)Net change in unrealised appreciation/(depreciation) on interest rate swap contracts - - - - (100,197,165)Net change in unrealised appreciation/(depreciation) on foreign exchange transactions (89,405) - (2,796) - (181,156,067)
Net change in net assets as a result of operations 329,770 7,363,185 1,232,425 6,600,063 (171,841,914)
Dividend distribution - - - (64,379) (35,404,769)
Proceeds received on subscription of shares 22,306,490 132,314,425 123,653 23,866,576 12,134,758,335Net amount paid on redemption of shares (44,232) (28,122,218) (889,547) (27,316,499) (13,396,709,047)
Net change in net assets as a result of capital transactions 22,262,258 104,192,207 (765,894) (3,449,923) (1,261,950,712)
Total increase/(decrease) in net assets 22,592,028 111,555,392 466,531 3,085,761 (1,469,197,395)
Net assets at beginning of period - 134,499,895 115,601,677 179,318,340 45,758,773,021Translation difference - - - - 440,468,312
Net assets at end of period 22,592,028 246,055,287 116,068,208 182,404,101 44,730,043,938
(1) Fund commenced operations on 31 March 2016.+ Represents the combined totals of all Morgan Stanley Investment Funds.
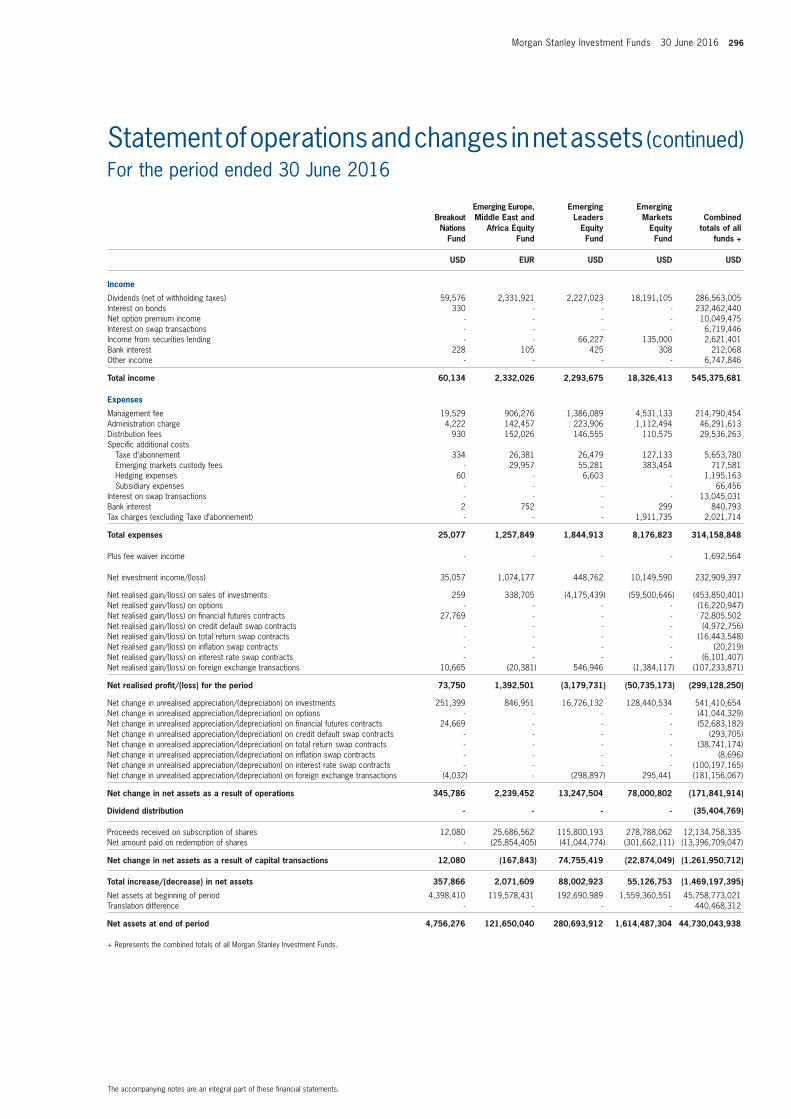
Morgan Stanley Investment Funds 30 June 2016 296
The accompanying notes are an integral part of these financial statements.
Statement of operations and changes in net assets (continued)For the period ended 30 June 2016
Breakout Nations
Fund
Emerging Europe, Middle East and
Africa Equity Fund
Emerging Leaders
Equity Fund
Emerging Markets
Equity Fund
Combined totals of all
funds +
USD EUR USD USD USD
Income
Dividends (net of withholding taxes) 59,576 2,331,921 2,227,023 18,191,105 286,563,005Interest on bonds 330 - - - 232,462,440Net option premium income - - - - 10,049,475Interest on swap transactions - - - - 6,719,446Income from securities lending - - 66,227 135,000 2,621,401Bank interest 228 105 425 308 212,068Other income - - - - 6,747,846
Total income 60,134 2,332,026 2,293,675 18,326,413 545,375,681
Expenses
Management fee 19,529 906,276 1,386,089 4,531,133 214,790,454Administration charge 4,222 142,457 223,906 1,112,494 46,291,613Distribution fees 930 152,026 146,555 110,575 29,536,263Specific additional costs Taxe d’abonnement 334 26,381 26,479 127,133 5,653,780 Emerging markets custody fees - 29,957 55,281 383,454 717,581 Hedging expenses 60 - 6,603 - 1,195,163 Subsidiary expenses - - - - 66,456Interest on swap transactions - - - - 13,045,031Bank interest 2 752 - 299 840,793Tax charges (excluding Taxe d’abonnement) - - - 1,911,735 2,021,714
Total expenses 25,077 1,257,849 1,844,913 8,176,823 314,158,848
Plus fee waiver income - - - - 1,692,564
Net investment income/(loss) 35,057 1,074,177 448,762 10,149,590 232,909,397
Net realised gain/(loss) on sales of investments 259 338,705 (4,175,439) (59,500,646) (453,850,401)Net realised gain/(loss) on options - - - - (16,220,947)Net realised gain/(loss) on financial futures contracts 27,769 - - - 72,805,502Net realised gain/(loss) on credit default swap contracts - - - - (4,972,756)Net realised gain/(loss) on total return swap contracts - - - - (16,443,548)Net realised gain/(loss) on inflation swap contracts - - - - (20,219)Net realised gain/(loss) on interest rate swap contracts - - - - (6,101,407)Net realised gain/(loss) on foreign exchange transactions 10,665 (20,381) 546,946 (1,384,117) (107,233,871)
Net realised profit/(loss) for the period 73,750 1,392,501 (3,179,731) (50,735,173) (299,128,250)
Net change in unrealised appreciation/(depreciation) on investments 251,399 846,951 16,726,132 128,440,534 541,410,654Net change in unrealised appreciation/(depreciation) on options - - - - (41,044,329)Net change in unrealised appreciation/(depreciation) on financial futures contracts 24,669 - - - (52,683,182)Net change in unrealised appreciation/(depreciation) on credit default swap contracts - - - - (293,705)Net change in unrealised appreciation/(depreciation) on total return swap contracts - - - - (38,741,174)Net change in unrealised appreciation/(depreciation) on inflation swap contracts - - - - (8,696)Net change in unrealised appreciation/(depreciation) on interest rate swap contracts - - - - (100,197,165)Net change in unrealised appreciation/(depreciation) on foreign exchange transactions (4,032) - (298,897) 295,441 (181,156,067)
Net change in net assets as a result of operations 345,786 2,239,452 13,247,504 78,000,802 (171,841,914)
Dividend distribution - - - - (35,404,769)
Proceeds received on subscription of shares 12,080 25,686,562 115,800,193 278,788,062 12,134,758,335Net amount paid on redemption of shares - (25,854,405) (41,044,774) (301,662,111) (13,396,709,047)
Net change in net assets as a result of capital transactions 12,080 (167,843) 74,755,419 (22,874,049) (1,261,950,712)
Total increase/(decrease) in net assets 357,866 2,071,609 88,002,923 55,126,753 (1,469,197,395)
Net assets at beginning of period 4,398,410 119,578,431 192,690,989 1,559,360,551 45,758,773,021Translation difference - - - - 440,468,312
Net assets at end of period 4,756,276 121,650,040 280,693,912 1,614,487,304 44,730,043,938
+ Represents the combined totals of all Morgan Stanley Investment Funds.

297 Morgan Stanley Investment Funds 30 June 2016
The accompanying notes are an integral part of these financial statements.
Statement of operations and changes in net assets (continued)For the period ended 30 June 2016
European Champions
Fund (2)
European Equity Alpha Fund
European Property
Fund
Eurozone Equity Alpha Fund
Combined totals of all
funds +
EUR EUR EUR EUR USD
Income
Dividends (net of withholding taxes) 133,978 21,973,889 8,402,326 16,333,575 286,563,005Interest on bonds - - - - 232,462,440Net option premium income - - - - 10,049,475Interest on swap transactions - - - - 6,719,446Income from securities lending - 271,169 8,848 248,090 2,621,401Bank interest - - 4 - 212,068Other income - - - - 6,747,846
Total income 133,978 22,245,058 8,411,178 16,581,665 545,375,681
Expenses
Management fee 30,753 2,986,358 2,106,109 2,395,239 214,790,454Administration charge 6,903 731,417 428,331 526,708 46,291,613Distribution fees 187 218,585 109,957 247,897 29,536,263Specific additional costs Taxe d’abonnement 1,237 73,069 76,326 51,003 5,653,780 Emerging markets custody fees - - - - 717,581 Hedging expenses 8 2,016 2,099 4,663 1,195,163 Subsidiary expenses - - - - 66,456Interest on swap transactions - - - - 13,045,031Bank interest 149 1,783 521 938 840,793Tax charges (excluding Taxe d’abonnement) - - - - 2,021,714
Total expenses 39,237 4,013,228 2,723,343 3,226,448 314,158,848
Plus fee waiver income - - - - 1,692,564
Net investment income/(loss) 94,741 18,231,830 5,687,835 13,355,217 232,909,397
Net realised gain/(loss) on sales of investments 34,481 (785,458) 8,620,346 (12,582,447) (453,850,401)Net realised gain/(loss) on options - - - - (16,220,947)Net realised gain/(loss) on financial futures contracts - - - - 72,805,502Net realised gain/(loss) on credit default swap contracts - - - - (4,972,756)Net realised gain/(loss) on total return swap contracts - - - - (16,443,548)Net realised gain/(loss) on inflation swap contracts - - - - (20,219)Net realised gain/(loss) on interest rate swap contracts - - - - (6,101,407)Net realised gain/(loss) on foreign exchange transactions 4,359 (1,508,158) (663,581) (891,403) (107,233,871)
Net realised profit/(loss) for the period 133,581 15,938,214 13,644,600 (118,633) (299,128,250)
Net change in unrealised appreciation/(depreciation) on investments 408,493 (83,150,810) (43,559,584) (61,117,315) 541,410,654Net change in unrealised appreciation/(depreciation) on options - - - - (41,044,329)Net change in unrealised appreciation/(depreciation) on financial futures contracts - - - - (52,683,182)Net change in unrealised appreciation/(depreciation) on credit default swap contracts - - - - (293,705)Net change in unrealised appreciation/(depreciation) on total return swap contracts - - - - (38,741,174)Net change in unrealised appreciation/(depreciation) on inflation swap contracts - - - - (8,696)Net change in unrealised appreciation/(depreciation) on interest rate swap contracts - - - - (100,197,165)Net change in unrealised appreciation/(depreciation) on foreign exchange transactions 2,495 384,530 177,428 167,536 (181,156,067)
Net change in net assets as a result of operations 544,569 (66,828,066) (29,737,556) (61,068,412) (171,841,914)
Dividend distribution - (9,802) - (7,869) (35,404,769)
Proceeds received on subscription of shares 17,744,023 173,434,188 122,111,618 281,727,800 12,134,758,335Net amount paid on redemption of shares (278,382) (258,536,950) (219,749,483) (157,725,981) (13,396,709,047)
Net change in net assets as a result of capital transactions 17,465,641 (85,102,762) (97,637,865) 124,001,819 (1,261,950,712)
Total increase/(decrease) in net assets 18,010,210 (151,940,630) (127,375,421) 62,925,538 (1,469,197,395)
Net assets at beginning of period - 813,122,161 425,982,943 511,780,602 45,758,773,021Translation difference - - - - 440,468,312
Net assets at end of period 18,010,210 661,181,531 298,607,522 574,706,140 44,730,043,938
(2) Fund commenced operations on 8 April 2016.+ Represents the combined totals of all Morgan Stanley Investment Funds.

Morgan Stanley Investment Funds 30 June 2016 298
The accompanying notes are an integral part of these financial statements.
Statement of operations and changes in net assets (continued)For the period ended 30 June 2016
Frontier Emerging
Markets Equity Fund
Global Advantage
Fund
Global Brands
Fund
Global Brands Equity
Income Fund (3)
Combined totals of all
funds +
USD USD USD USD USD
Income
Dividends (net of withholding taxes) 2,079,874 49,554 81,510,163 35,513 286,563,005Interest on bonds - - - - 232,462,440Net option premium income - - - - 10,049,475Interest on swap transactions - - - 36,554 6,719,446Income from securities lending 549 - - - 2,621,401Bank interest 159 - - - 212,068Other income - - - - 6,747,846
Total income 2,080,582 49,554 81,510,163 72,067 545,375,681
Expenses
Management fee 790,758 64,575 32,557,254 15,918 214,790,454Administration charge 92,280 10,321 6,487,503 3,152 46,291,613Distribution fees 107,398 14,930 2,812,835 511 29,536,263Specific additional costs Taxe d’abonnement 16,403 1,784 1,028,128 232 5,653,780 Emerging markets custody fees 21,213 - - - 717,581 Hedging expenses 1,951 - 188,169 20 1,195,163 Subsidiary expenses - - - - 66,456Interest on swap transactions - - - - 13,045,031Bank interest 12 - 5,336 - 840,793Tax charges (excluding Taxe d’abonnement) - - - - 2,021,714
Total expenses 1,030,015 91,610 43,079,225 19,833 314,158,848
Plus fee waiver income - - - - 1,692,564
Net investment income/(loss) 1,050,567 (42,056) 38,430,938 52,234 232,909,397
Net realised gain/(loss) on sales of investments (4,762,361) (248,233) 105,737,333 52,655 (453,850,401)Net realised gain/(loss) on options - (3,919) - - (16,220,947)Net realised gain/(loss) on financial futures contracts - - - - 72,805,502Net realised gain/(loss) on credit default swap contracts - - - - (4,972,756)Net realised gain/(loss) on total return swap contracts - - - (7,644) (16,443,548)Net realised gain/(loss) on inflation swap contracts - - - - (20,219)Net realised gain/(loss) on interest rate swap contracts - - - - (6,101,407)Net realised gain/(loss) on foreign exchange transactions (185,703) (1,598) 13,977,833 (10,129) (107,233,871)
Net realised profit/(loss) for the period (3,897,497) (295,806) 158,146,104 87,116 (299,128,250)
Net change in unrealised appreciation/(depreciation) on investments 3,519,344 (197,048) 134,370,215 66,087 541,410,654Net change in unrealised appreciation/(depreciation) on options - (17,471) - - (41,044,329)Net change in unrealised appreciation/(depreciation) on financial futures contracts - - - - (52,683,182)Net change in unrealised appreciation/(depreciation) on credit default swap contracts - - - - (293,705)Net change in unrealised appreciation/(depreciation) on total return swap contracts - - - (6,610) (38,741,174)Net change in unrealised appreciation/(depreciation) on inflation swap contracts - - - - (8,696)Net change in unrealised appreciation/(depreciation) on interest rate swap contracts - - - - (100,197,165)Net change in unrealised appreciation/(depreciation) on foreign exchange transactions (290,125) - (20,755,524) (4,171) (181,156,067)
Net change in net assets as a result of operations (668,278) (510,325) 271,760,795 142,422 (171,841,914)
Dividend distribution - - (934,384) - (35,404,769)
Proceeds received on subscription of shares 66,592,548 1,202,044 1,463,562,624 10,008,880 12,134,758,335Net amount paid on redemption of shares (39,234,895) (2,236,585) (819,175,573) (2) (13,396,709,047)
Net change in net assets as a result of capital transactions 27,357,653 (1,034,541) 644,387,051 10,008,878 (1,261,950,712)
Total increase/(decrease) in net assets 26,689,375 (1,544,866) 915,213,462 10,151,300 (1,469,197,395)
Net assets at beginning of period 73,347,705 10,094,146 5,976,192,871 - 45,758,773,021Translation difference - - - - 440,468,312
Net assets at end of period 100,037,080 8,549,280 6,891,406,333 10,151,300 44,730,043,938
(3) Fund commenced operations on 29 April 2016.+ Represents the combined totals of all Morgan Stanley Investment Funds.

299 Morgan Stanley Investment Funds 30 June 2016
The accompanying notes are an integral part of these financial statements.
Statement of operations and changes in net assets (continued)For the period ended 30 June 2016
Global Discovery
Fund
Global Infrastructure
Fund
Global
Opportunity Fund
Global Property
Fund
Combined totals of all
funds +
USD USD USD USD USD
Income
Dividends (net of withholding taxes) 50,402 9,264,236 2,250,200 19,056,918 286,563,005Interest on bonds - - - - 232,462,440Net option premium income - - - - 10,049,475Interest on swap transactions - - - - 6,719,446Income from securities lending - 338,117 25,905 - 2,621,401Bank interest 10 1,730 1,526 182 212,068Other income - - - - 6,747,846
Total income 50,412 9,604,083 2,277,631 19,057,100 545,375,681
Expenses
Management fee 20,371 3,163,312 4,710,194 5,271,004 214,790,454Administration charge 4,687 576,874 865,854 1,038,428 46,291,613Distribution fees - 485,829 521,278 79,233 29,536,263Specific additional costs Taxe d’abonnement 315 77,443 130,276 110,700 5,653,780 Emerging markets custody fees - - - - 717,581 Hedging expenses - 12,983 6,242 3,082 1,195,163 Subsidiary expenses - - - - 66,456Interest on swap transactions - - - - 13,045,031Bank interest - 1,456 1,997 12,466 840,793Tax charges (excluding Taxe d’abonnement) - - 1,154 - 2,021,714
Total expenses 25,373 4,317,897 6,236,995 6,514,913 314,158,848
Plus fee waiver income - - - - 1,692,564
Net investment income/(loss) 25,039 5,286,186 (3,959,364) 12,542,187 232,909,397
Net realised gain/(loss) on sales of investments 34,851 (8,879,765) (15,567,413) 2,187,842 (453,850,401)Net realised gain/(loss) on options - - (129,972) - (16,220,947)Net realised gain/(loss) on financial futures contracts - - - - 72,805,502Net realised gain/(loss) on credit default swap contracts - - - - (4,972,756)Net realised gain/(loss) on total return swap contracts - - - - (16,443,548)Net realised gain/(loss) on inflation swap contracts - - - - (20,219)Net realised gain/(loss) on interest rate swap contracts - - - - (6,101,407)Net realised gain/(loss) on foreign exchange transactions 327 2,277,684 609,115 280,752 (107,233,871)
Net realised profit/(loss) for the period 60,217 (1,315,895) (19,047,634) 15,010,781 (299,128,250)
Net change in unrealised appreciation/(depreciation) on investments 424,152 85,673,634 (1,231,767) 3,499,455 541,410,654Net change in unrealised appreciation/(depreciation) on options - - (768,324) - (41,044,329)Net change in unrealised appreciation/(depreciation) on financial futures contracts - - - - (52,683,182)Net change in unrealised appreciation/(depreciation) on credit default swap contracts - - - - (293,705)Net change in unrealised appreciation/(depreciation) on total return swap contracts - - - - (38,741,174)Net change in unrealised appreciation/(depreciation) on inflation swap contracts - - - - (8,696)Net change in unrealised appreciation/(depreciation) on interest rate swap contracts - - - - (100,197,165)Net change in unrealised appreciation/(depreciation) on foreign exchange transactions - (613,654) (305,235) (263,829) (181,156,067)
Net change in net assets as a result of operations 484,369 83,744,085 (21,352,960) 18,246,407 (171,841,914)
Dividend distribution - (900,906) - (45,207) (35,404,769)
Proceeds received on subscription of shares 468,804 302,257,683 385,434,297 301,947,785 12,134,758,335Net amount paid on redemption of shares (84,987) (161,571,556) (175,716,621) (302,747,083) (13,396,709,047)
Net change in net assets as a result of capital transactions 383,817 140,686,127 209,717,676 (799,298) (1,261,950,712)
Total increase/(decrease) in net assets 868,186 223,529,306 188,364,716 17,401,902 (1,469,197,395)
Net assets at beginning of period 4,716,739 457,033,220 745,995,911 1,088,436,118 45,758,773,021Translation difference - - - - 440,468,312
Net assets at end of period 5,584,925 680,562,526 934,360,627 1,105,838,020 44,730,043,938
+ Represents the combined totals of all Morgan Stanley Investment Funds.
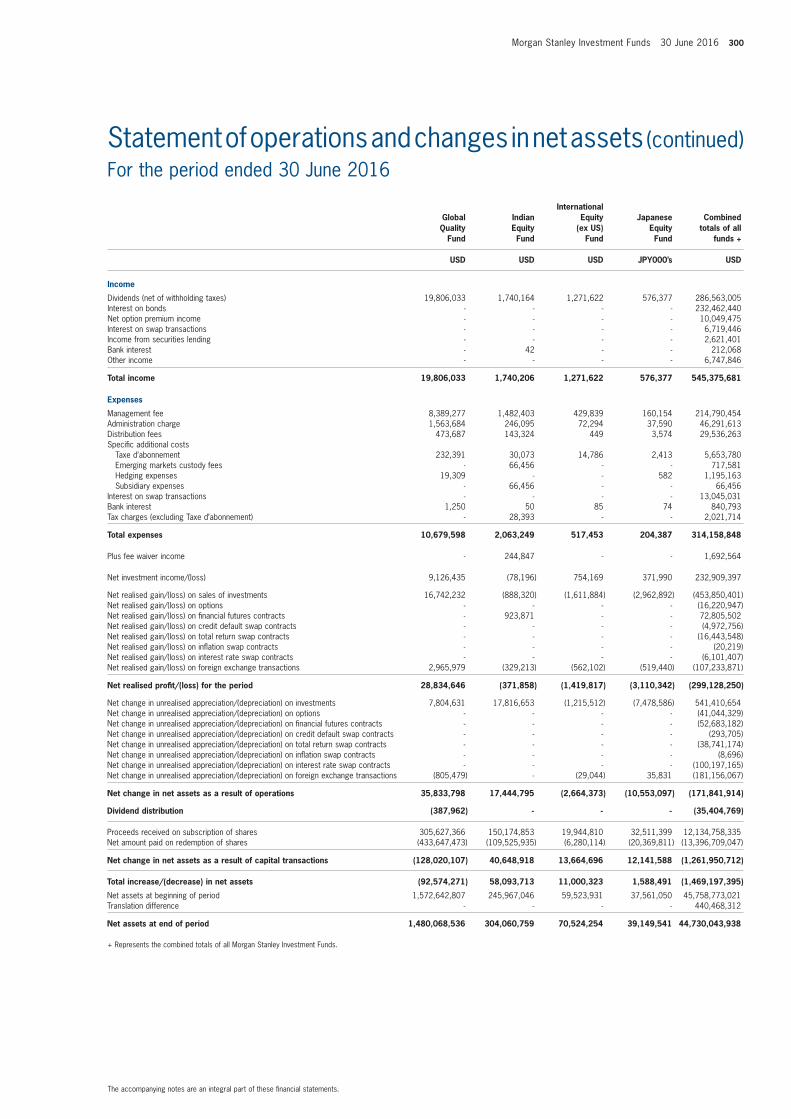
Morgan Stanley Investment Funds 30 June 2016 300
The accompanying notes are an integral part of these financial statements.
Statement of operations and changes in net assets (continued)For the period ended 30 June 2016
Global Quality
Fund
Indian Equity Fund
International Equity
(ex US) Fund
Japanese Equity Fund
Combined totals of all
funds +
USD USD USD JPY000’s USD
Income
Dividends (net of withholding taxes) 19,806,033 1,740,164 1,271,622 576,377 286,563,005Interest on bonds - - - - 232,462,440Net option premium income - - - - 10,049,475Interest on swap transactions - - - - 6,719,446Income from securities lending - - - - 2,621,401Bank interest - 42 - - 212,068Other income - - - - 6,747,846
Total income 19,806,033 1,740,206 1,271,622 576,377 545,375,681
Expenses
Management fee 8,389,277 1,482,403 429,839 160,154 214,790,454Administration charge 1,563,684 246,095 72,294 37,590 46,291,613Distribution fees 473,687 143,324 449 3,574 29,536,263Specific additional costs Taxe d’abonnement 232,391 30,073 14,786 2,413 5,653,780 Emerging markets custody fees - 66,456 - - 717,581 Hedging expenses 19,309 - - 582 1,195,163 Subsidiary expenses - 66,456 - - 66,456Interest on swap transactions - - - - 13,045,031Bank interest 1,250 50 85 74 840,793Tax charges (excluding Taxe d’abonnement) - 28,393 - - 2,021,714
Total expenses 10,679,598 2,063,249 517,453 204,387 314,158,848
Plus fee waiver income - 244,847 - - 1,692,564
Net investment income/(loss) 9,126,435 (78,196) 754,169 371,990 232,909,397
Net realised gain/(loss) on sales of investments 16,742,232 (888,320) (1,611,884) (2,962,892) (453,850,401)Net realised gain/(loss) on options - - - - (16,220,947)Net realised gain/(loss) on financial futures contracts - 923,871 - - 72,805,502Net realised gain/(loss) on credit default swap contracts - - - - (4,972,756)Net realised gain/(loss) on total return swap contracts - - - - (16,443,548)Net realised gain/(loss) on inflation swap contracts - - - - (20,219)Net realised gain/(loss) on interest rate swap contracts - - - - (6,101,407)Net realised gain/(loss) on foreign exchange transactions 2,965,979 (329,213) (562,102) (519,440) (107,233,871)
Net realised profit/(loss) for the period 28,834,646 (371,858) (1,419,817) (3,110,342) (299,128,250)
Net change in unrealised appreciation/(depreciation) on investments 7,804,631 17,816,653 (1,215,512) (7,478,586) 541,410,654Net change in unrealised appreciation/(depreciation) on options - - - - (41,044,329)Net change in unrealised appreciation/(depreciation) on financial futures contracts - - - - (52,683,182)Net change in unrealised appreciation/(depreciation) on credit default swap contracts - - - - (293,705)Net change in unrealised appreciation/(depreciation) on total return swap contracts - - - - (38,741,174)Net change in unrealised appreciation/(depreciation) on inflation swap contracts - - - - (8,696)Net change in unrealised appreciation/(depreciation) on interest rate swap contracts - - - - (100,197,165)Net change in unrealised appreciation/(depreciation) on foreign exchange transactions (805,479) - (29,044) 35,831 (181,156,067)
Net change in net assets as a result of operations 35,833,798 17,444,795 (2,664,373) (10,553,097) (171,841,914)
Dividend distribution (387,962) - - - (35,404,769)
Proceeds received on subscription of shares 305,627,366 150,174,853 19,944,810 32,511,399 12,134,758,335Net amount paid on redemption of shares (433,647,473) (109,525,935) (6,280,114) (20,369,811) (13,396,709,047)
Net change in net assets as a result of capital transactions (128,020,107) 40,648,918 13,664,696 12,141,588 (1,261,950,712)
Total increase/(decrease) in net assets (92,574,271) 58,093,713 11,000,323 1,588,491 (1,469,197,395)
Net assets at beginning of period 1,572,642,807 245,967,046 59,523,931 37,561,050 45,758,773,021Translation difference - - - - 440,468,312
Net assets at end of period 1,480,068,536 304,060,759 70,524,254 39,149,541 44,730,043,938
+ Represents the combined totals of all Morgan Stanley Investment Funds.
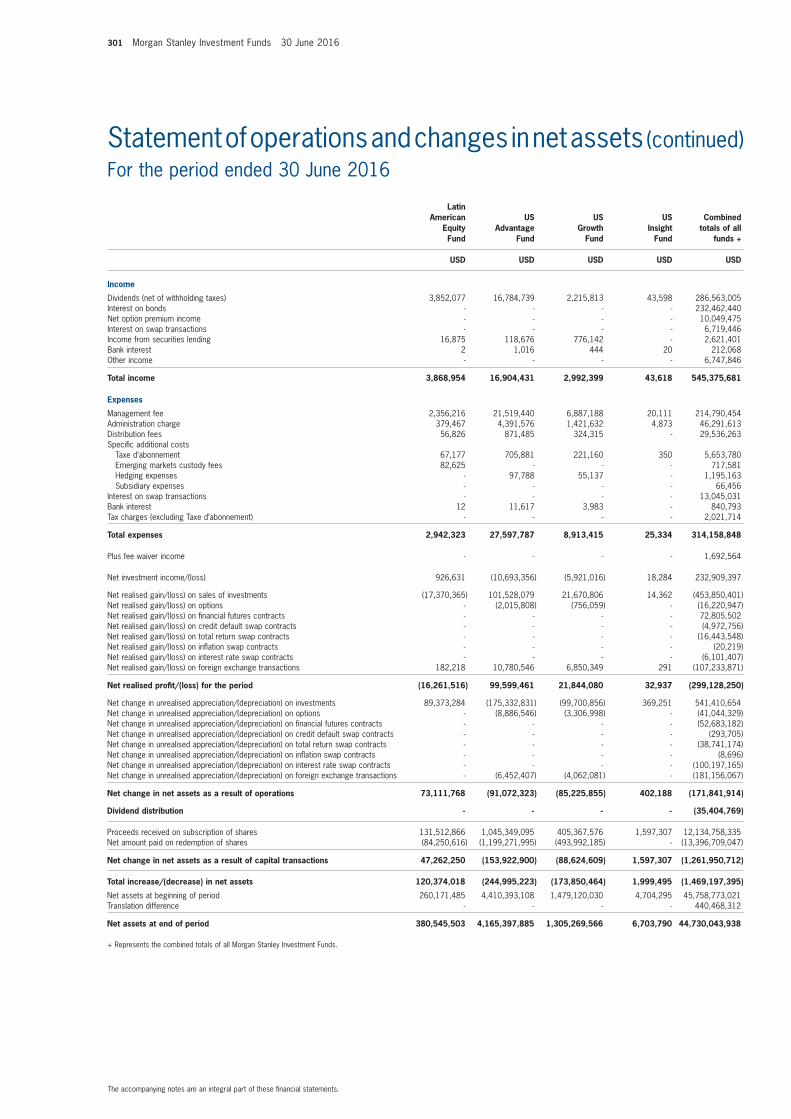
301 Morgan Stanley Investment Funds 30 June 2016
The accompanying notes are an integral part of these financial statements.
Statement of operations and changes in net assets (continued)For the period ended 30 June 2016
Latin American
Equity Fund
US Advantage
Fund
US Growth
Fund
US Insight
Fund
Combined totals of all
funds +
USD USD USD USD USD
Income
Dividends (net of withholding taxes) 3,852,077 16,784,739 2,215,813 43,598 286,563,005Interest on bonds - - - - 232,462,440Net option premium income - - - - 10,049,475Interest on swap transactions - - - - 6,719,446Income from securities lending 16,875 118,676 776,142 - 2,621,401Bank interest 2 1,016 444 20 212,068Other income - - - - 6,747,846
Total income 3,868,954 16,904,431 2,992,399 43,618 545,375,681
Expenses
Management fee 2,356,216 21,519,440 6,887,188 20,111 214,790,454Administration charge 379,467 4,391,576 1,421,632 4,873 46,291,613Distribution fees 56,826 871,485 324,315 - 29,536,263Specific additional costs Taxe d’abonnement 67,177 705,881 221,160 350 5,653,780 Emerging markets custody fees 82,625 - - - 717,581 Hedging expenses - 97,788 55,137 - 1,195,163 Subsidiary expenses - - - - 66,456Interest on swap transactions - - - - 13,045,031Bank interest 12 11,617 3,983 - 840,793Tax charges (excluding Taxe d’abonnement) - - - - 2,021,714
Total expenses 2,942,323 27,597,787 8,913,415 25,334 314,158,848
Plus fee waiver income - - - - 1,692,564
Net investment income/(loss) 926,631 (10,693,356) (5,921,016) 18,284 232,909,397
Net realised gain/(loss) on sales of investments (17,370,365) 101,528,079 21,670,806 14,362 (453,850,401)Net realised gain/(loss) on options - (2,015,808) (756,059) - (16,220,947)Net realised gain/(loss) on financial futures contracts - - - - 72,805,502Net realised gain/(loss) on credit default swap contracts - - - - (4,972,756)Net realised gain/(loss) on total return swap contracts - - - - (16,443,548)Net realised gain/(loss) on inflation swap contracts - - - - (20,219)Net realised gain/(loss) on interest rate swap contracts - - - - (6,101,407)Net realised gain/(loss) on foreign exchange transactions 182,218 10,780,546 6,850,349 291 (107,233,871)
Net realised profit/(loss) for the period (16,261,516) 99,599,461 21,844,080 32,937 (299,128,250)
Net change in unrealised appreciation/(depreciation) on investments 89,373,284 (175,332,831) (99,700,856) 369,251 541,410,654Net change in unrealised appreciation/(depreciation) on options - (8,886,546) (3,306,998) - (41,044,329)Net change in unrealised appreciation/(depreciation) on financial futures contracts - - - - (52,683,182)Net change in unrealised appreciation/(depreciation) on credit default swap contracts - - - - (293,705)Net change in unrealised appreciation/(depreciation) on total return swap contracts - - - - (38,741,174)Net change in unrealised appreciation/(depreciation) on inflation swap contracts - - - - (8,696)Net change in unrealised appreciation/(depreciation) on interest rate swap contracts - - - - (100,197,165)Net change in unrealised appreciation/(depreciation) on foreign exchange transactions - (6,452,407) (4,062,081) - (181,156,067)
Net change in net assets as a result of operations 73,111,768 (91,072,323) (85,225,855) 402,188 (171,841,914)
Dividend distribution - - - - (35,404,769)
Proceeds received on subscription of shares 131,512,866 1,045,349,095 405,367,576 1,597,307 12,134,758,335Net amount paid on redemption of shares (84,250,616) (1,199,271,995) (493,992,185) - (13,396,709,047)
Net change in net assets as a result of capital transactions 47,262,250 (153,922,900) (88,624,609) 1,597,307 (1,261,950,712)
Total increase/(decrease) in net assets 120,374,018 (244,995,223) (173,850,464) 1,999,495 (1,469,197,395)
Net assets at beginning of period 260,171,485 4,410,393,108 1,479,120,030 4,704,295 45,758,773,021Translation difference - - - - 440,468,312
Net assets at end of period 380,545,503 4,165,397,885 1,305,269,566 6,703,790 44,730,043,938
+ Represents the combined totals of all Morgan Stanley Investment Funds.

Morgan Stanley Investment Funds 30 June 2016 302
The accompanying notes are an integral part of these financial statements.
Statement of operations and changes in net assets (continued)For the period ended 30 June 2016
US Property
Fund
Absolute Return Fixed
Income Fund
Asian Fixed Income
Opportunities Fund
Emerging Markets
Corporate Debt Fund
Combined totals of all
funds +
USD EUR USD USD USD
Income
Dividends (net of withholding taxes) 6,898,099 - 334 73,201 286,563,005Interest on bonds - 517,251 276,401 18,268,354 232,462,440Net option premium income - - - - 10,049,475Interest on swap transactions - 3,789 - - 6,719,446Income from securities lending - - - 15,317 2,621,401Bank interest 1 22 1 4 212,068Other income 454,442 - - - 6,747,846
Total income 7,352,542 521,062 276,736 18,356,876 545,375,681
Expenses
Management fee 2,201,689 136,250 31,248 3,534,443 214,790,454Administration charge 431,464 34,877 9,266 632,362 46,291,613Distribution fees 78,926 73,260 - 295,433 29,536,263Specific additional costs Taxe d’abonnement 79,532 5,976 592 74,517 5,653,780 Emerging markets custody fees - - - - 717,581 Hedging expenses - 2 - 23,825 1,195,163 Subsidiary expenses - - - - 66,456Interest on swap transactions - 31,737 - - 13,045,031Bank interest - 1,051 - 63 840,793Tax charges (excluding Taxe d’abonnement) - - - - 2,021,714
Total expenses 2,791,611 283,153 41,106 4,560,643 314,158,848
Plus fee waiver income - - - - 1,692,564
Net investment income/(loss) 4,560,931 237,909 235,630 13,796,233 232,909,397
Net realised gain/(loss) on sales of investments 9,444,357 2,142 (100,719) (12,898,867) (453,850,401)Net realised gain/(loss) on options - - - - (16,220,947)Net realised gain/(loss) on financial futures contracts - (537,410) - (1,653,322) 72,805,502Net realised gain/(loss) on credit default swap contracts - 15,472 - - (4,972,756)Net realised gain/(loss) on total return swap contracts - - - - (16,443,548)Net realised gain/(loss) on inflation swap contracts - - - - (20,219)Net realised gain/(loss) on interest rate swap contracts - - - - (6,101,407)Net realised gain/(loss) on foreign exchange transactions (1,514) 237,338 (16,018) 2,965,194 (107,233,871)
Net realised profit/(loss) for the period 14,003,774 (44,549) 118,893 2,209,238 (299,128,250)
Net change in unrealised appreciation/(depreciation) on investments 12,435,815 333,871 540,537 45,051,534 541,410,654Net change in unrealised appreciation/(depreciation) on options - - - - (41,044,329)Net change in unrealised appreciation/(depreciation) on financial futures contracts - (549,939) - (29,844) (52,683,182)Net change in unrealised appreciation/(depreciation) on credit default swap contracts - (32,566) - - (293,705)Net change in unrealised appreciation/(depreciation) on total return swap contracts - - - - (38,741,174)Net change in unrealised appreciation/(depreciation) on inflation swap contracts - - - - (8,696)Net change in unrealised appreciation/(depreciation) on interest rate swap contracts - (186,196) - - (100,197,165)Net change in unrealised appreciation/(depreciation) on foreign exchange transactions - (214,884) (11,008) (1,201,954) (181,156,067)
Net change in net assets as a result of operations 26,439,589 (694,263) 648,422 46,028,974 (171,841,914)
Dividend distribution - (116,246) (6,350) (1,988,518) (35,404,769)
Proceeds received on subscription of shares 98,853,081 4,909,166 - 294,851,366 12,134,758,335Net amount paid on redemption of shares (111,963,239) (6,342,172) - (157,902,170) (13,396,709,047)
Net change in net assets as a result of capital transactions (13,110,158) (1,433,006) - 136,949,196 (1,261,950,712)
Total increase/(decrease) in net assets 13,329,431 (2,243,515) 642,072 180,989,652 (1,469,197,395)
Net assets at beginning of period 402,450,583 32,380,182 9,974,416 544,124,234 45,758,773,021Translation difference - - - - 440,468,312
Net assets at end of period 415,780,014 30,136,667 10,616,488 725,113,886 44,730,043,938
+ Represents the combined totals of all Morgan Stanley Investment Funds.
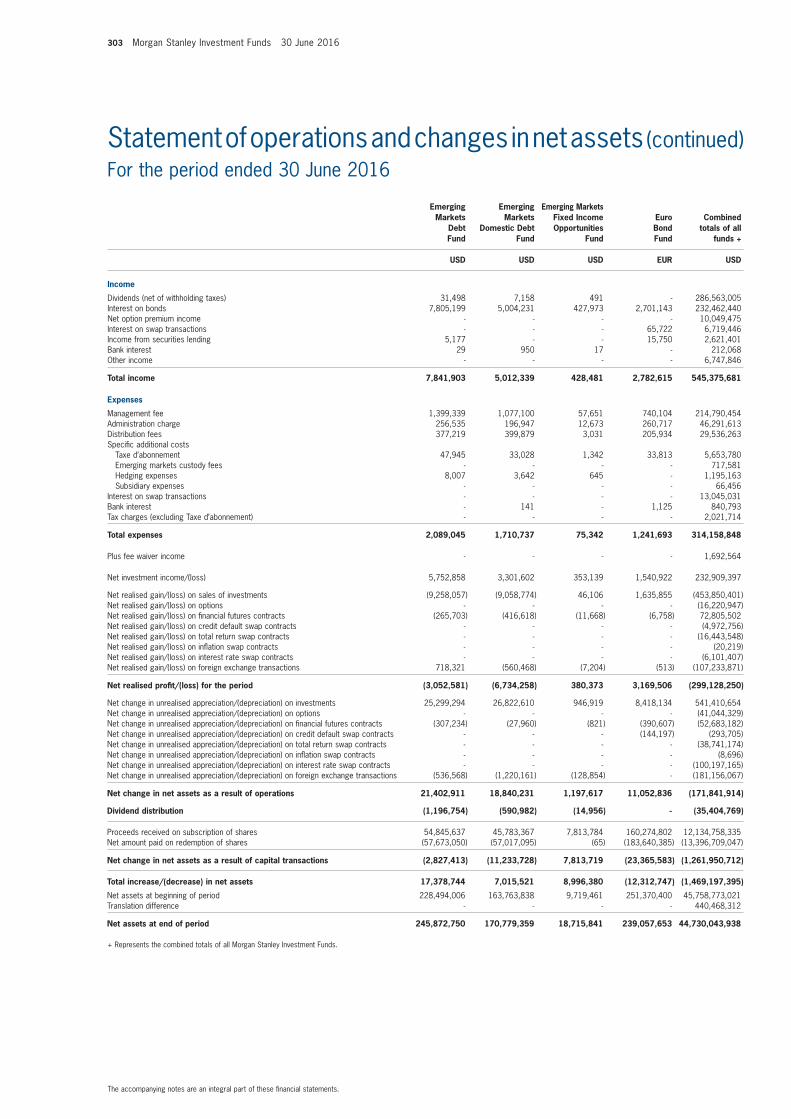
303 Morgan Stanley Investment Funds 30 June 2016
The accompanying notes are an integral part of these financial statements.
Statement of operations and changes in net assets (continued)For the period ended 30 June 2016
Emerging Markets
Debt Fund
Emerging Markets
Domestic Debt Fund
Emerging Markets Fixed Income Opportunities
Fund
Euro Bond Fund
Combined totals of all
funds +
USD USD USD EUR USD
Income
Dividends (net of withholding taxes) 31,498 7,158 491 - 286,563,005Interest on bonds 7,805,199 5,004,231 427,973 2,701,143 232,462,440Net option premium income - - - - 10,049,475Interest on swap transactions - - - 65,722 6,719,446Income from securities lending 5,177 - - 15,750 2,621,401Bank interest 29 950 17 - 212,068Other income - - - - 6,747,846
Total income 7,841,903 5,012,339 428,481 2,782,615 545,375,681
Expenses
Management fee 1,399,339 1,077,100 57,651 740,104 214,790,454Administration charge 256,535 196,947 12,673 260,717 46,291,613Distribution fees 377,219 399,879 3,031 205,934 29,536,263Specific additional costs Taxe d’abonnement 47,945 33,028 1,342 33,813 5,653,780 Emerging markets custody fees - - - - 717,581 Hedging expenses 8,007 3,642 645 - 1,195,163 Subsidiary expenses - - - - 66,456Interest on swap transactions - - - - 13,045,031Bank interest - 141 - 1,125 840,793Tax charges (excluding Taxe d’abonnement) - - - - 2,021,714
Total expenses 2,089,045 1,710,737 75,342 1,241,693 314,158,848
Plus fee waiver income - - - - 1,692,564
Net investment income/(loss) 5,752,858 3,301,602 353,139 1,540,922 232,909,397
Net realised gain/(loss) on sales of investments (9,258,057) (9,058,774) 46,106 1,635,855 (453,850,401)Net realised gain/(loss) on options - - - - (16,220,947)Net realised gain/(loss) on financial futures contracts (265,703) (416,618) (11,668) (6,758) 72,805,502Net realised gain/(loss) on credit default swap contracts - - - - (4,972,756)Net realised gain/(loss) on total return swap contracts - - - - (16,443,548)Net realised gain/(loss) on inflation swap contracts - - - - (20,219)Net realised gain/(loss) on interest rate swap contracts - - - - (6,101,407)Net realised gain/(loss) on foreign exchange transactions 718,321 (560,468) (7,204) (513) (107,233,871)
Net realised profit/(loss) for the period (3,052,581) (6,734,258) 380,373 3,169,506 (299,128,250)
Net change in unrealised appreciation/(depreciation) on investments 25,299,294 26,822,610 946,919 8,418,134 541,410,654Net change in unrealised appreciation/(depreciation) on options - - - - (41,044,329)Net change in unrealised appreciation/(depreciation) on financial futures contracts (307,234) (27,960) (821) (390,607) (52,683,182)Net change in unrealised appreciation/(depreciation) on credit default swap contracts - - - (144,197) (293,705)Net change in unrealised appreciation/(depreciation) on total return swap contracts - - - - (38,741,174)Net change in unrealised appreciation/(depreciation) on inflation swap contracts - - - - (8,696)Net change in unrealised appreciation/(depreciation) on interest rate swap contracts - - - - (100,197,165)Net change in unrealised appreciation/(depreciation) on foreign exchange transactions (536,568) (1,220,161) (128,854) - (181,156,067)
Net change in net assets as a result of operations 21,402,911 18,840,231 1,197,617 11,052,836 (171,841,914)
Dividend distribution (1,196,754) (590,982) (14,956) - (35,404,769)
Proceeds received on subscription of shares 54,845,637 45,783,367 7,813,784 160,274,802 12,134,758,335Net amount paid on redemption of shares (57,673,050) (57,017,095) (65) (183,640,385) (13,396,709,047)
Net change in net assets as a result of capital transactions (2,827,413) (11,233,728) 7,813,719 (23,365,583) (1,261,950,712)
Total increase/(decrease) in net assets 17,378,744 7,015,521 8,996,380 (12,312,747) (1,469,197,395)
Net assets at beginning of period 228,494,006 163,763,838 9,719,461 251,370,400 45,758,773,021Translation difference - - - - 440,468,312
Net assets at end of period 245,872,750 170,779,359 18,715,841 239,057,653 44,730,043,938
+ Represents the combined totals of all Morgan Stanley Investment Funds.

Morgan Stanley Investment Funds 30 June 2016 304
The accompanying notes are an integral part of these financial statements.
Statement of operations and changes in net assets (continued)For the period ended 30 June 2016
Euro Corporate
Bond Fund
Euro Corporate Bond
(ex Financials) Fund (4)
Euro Strategic
Bond Fund
European Currencies High
Yield Bond Fund
Combined totals of all
funds +
EUR EUR EUR EUR USD
Income
Dividends (net of withholding taxes) - - - - 286,563,005Interest on bonds 50,707,504 328,426 11,895,014 36,113,382 232,462,440Net option premium income - - - - 10,049,475Interest on swap transactions 745,694 - - 1,263,889 6,719,446Income from securities lending 15,750 1,320 88,200 139,497 2,621,401Bank interest - - 392 91,835 212,068Other income - - - - 6,747,846
Total income 51,468,948 329,746 11,983,606 37,608,603 545,375,681
Expenses
Management fee 9,481,468 2,723 2,556,541 4,027,349 214,790,454Administration charge 3,475,831 11,976 881,306 1,333,981 46,291,613Distribution fees 770,224 - 903,156 744,006 29,536,263Specific additional costs Taxe d’abonnement 386,480 1,192 123,903 163,197 5,653,780 Emerging markets custody fees - - - - 717,581 Hedging expenses 898 - - 2,568 1,195,163 Subsidiary expenses - - - - 66,456Interest on swap transactions 5,728,815 - 1,633,689 - 13,045,031Bank interest 55,856 2,785 20,738 5,491 840,793Tax charges (excluding Taxe d’abonnement) - - - - 2,021,714
Total expenses 19,899,572 18,676 6,119,333 6,276,592 314,158,848
Plus fee waiver income - - - - 1,692,564
Net investment income/(loss) 31,569,376 311,070 5,864,273 31,332,011 232,909,397
Net realised gain/(loss) on sales of investments 53,806,855 1,995,030 5,671,192 (3,655,142) (453,850,401)Net realised gain/(loss) on options - - - - (16,220,947)Net realised gain/(loss) on financial futures contracts (17,585,086) (53,269) (834,872) (643,706) 72,805,502Net realised gain/(loss) on credit default swap contracts (650,969) - - (3,396,678) (4,972,756)Net realised gain/(loss) on total return swap contracts - - - - (16,443,548)Net realised gain/(loss) on inflation swap contracts - - - - (20,219)Net realised gain/(loss) on interest rate swap contracts - - - - (6,101,407)Net realised gain/(loss) on foreign exchange transactions 11,451,146 169,830 2,436,337 26,327,684 (107,233,871)
Net realised profit/(loss) for the period 78,591,322 2,422,661 13,136,930 49,964,169 (299,128,250)
Net change in unrealised appreciation/(depreciation) on investments 57,004,765 (1,690,468) 26,306,164 (9,834,350) 541,410,654Net change in unrealised appreciation/(depreciation) on options - - - - (41,044,329)Net change in unrealised appreciation/(depreciation) on financial futures contracts (13,804,722) (503) 57,900 (703,015) (52,683,182)Net change in unrealised appreciation/(depreciation) on credit default swap contracts (431,653) - - 1,741,735 (293,705)Net change in unrealised appreciation/(depreciation) on total return swap contracts - - - - (38,741,174)Net change in unrealised appreciation/(depreciation) on inflation swap contracts - - - - (8,696)Net change in unrealised appreciation/(depreciation) on interest rate swap contracts (22,883,405) - (6,076,231) - (100,197,165)Net change in unrealised appreciation/(depreciation) on foreign exchange transactions (3,666,114) (60,538) (2,922,588) (3,425,486) (181,156,067)
Net change in net assets as a result of operations 94,810,193 671,152 30,502,175 37,743,053 (171,841,914)
Dividend distribution (1,037,509) - (455,670) (6,128,570) (35,404,769)
Proceeds received on subscription of shares 1,370,266,161 743,180 208,235,441 302,001,210 12,134,758,335Net amount paid on redemption of shares (1,816,803,028) (74,644,671) (244,710,201) (375,885,373) (13,396,709,047)
Net change in net assets as a result of capital transactions (446,536,867) (73,901,491) (36,474,760) (73,884,163) (1,261,950,712)
Total increase/(decrease) in net assets (352,764,183) (73,230,339) (6,428,255) (42,269,680) (1,469,197,395)
Net assets at beginning of period 3,943,367,285 73,230,339 836,695,699 1,307,964,586 45,758,773,021Translation difference - - - - 440,468,312
Net assets at end of period 3,590,603,102 - 830,267,444 1,265,694,906 44,730,043,938
(4) Fund closed on 2 May 2016.+ Represents the combined totals of all Morgan Stanley Investment Funds.
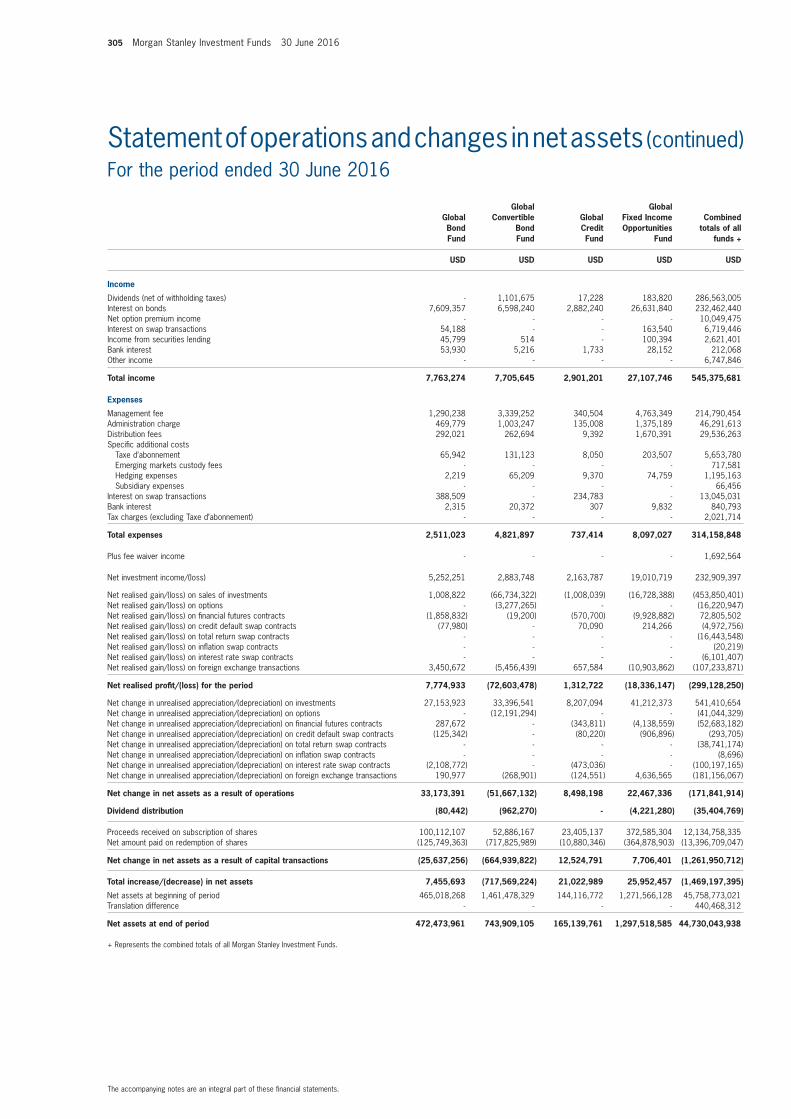
305 Morgan Stanley Investment Funds 30 June 2016
The accompanying notes are an integral part of these financial statements.
Statement of operations and changes in net assets (continued)For the period ended 30 June 2016
Global Bond Fund
Global Convertible
Bond Fund
Global Credit Fund
Global Fixed Income Opportunities
Fund
Combined totals of all
funds +
USD USD USD USD USD
Income
Dividends (net of withholding taxes) - 1,101,675 17,228 183,820 286,563,005Interest on bonds 7,609,357 6,598,240 2,882,240 26,631,840 232,462,440Net option premium income - - - - 10,049,475Interest on swap transactions 54,188 - - 163,540 6,719,446Income from securities lending 45,799 514 - 100,394 2,621,401Bank interest 53,930 5,216 1,733 28,152 212,068Other income - - - - 6,747,846
Total income 7,763,274 7,705,645 2,901,201 27,107,746 545,375,681
Expenses
Management fee 1,290,238 3,339,252 340,504 4,763,349 214,790,454Administration charge 469,779 1,003,247 135,008 1,375,189 46,291,613Distribution fees 292,021 262,694 9,392 1,670,391 29,536,263Specific additional costs Taxe d’abonnement 65,942 131,123 8,050 203,507 5,653,780 Emerging markets custody fees - - - - 717,581 Hedging expenses 2,219 65,209 9,370 74,759 1,195,163 Subsidiary expenses - - - - 66,456Interest on swap transactions 388,509 - 234,783 - 13,045,031Bank interest 2,315 20,372 307 9,832 840,793Tax charges (excluding Taxe d’abonnement) - - - - 2,021,714
Total expenses 2,511,023 4,821,897 737,414 8,097,027 314,158,848
Plus fee waiver income - - - - 1,692,564
Net investment income/(loss) 5,252,251 2,883,748 2,163,787 19,010,719 232,909,397
Net realised gain/(loss) on sales of investments 1,008,822 (66,734,322) (1,008,039) (16,728,388) (453,850,401)Net realised gain/(loss) on options - (3,277,265) - - (16,220,947)Net realised gain/(loss) on financial futures contracts (1,858,832) (19,200) (570,700) (9,928,882) 72,805,502Net realised gain/(loss) on credit default swap contracts (77,980) - 70,090 214,266 (4,972,756)Net realised gain/(loss) on total return swap contracts - - - - (16,443,548)Net realised gain/(loss) on inflation swap contracts - - - - (20,219)Net realised gain/(loss) on interest rate swap contracts - - - - (6,101,407)Net realised gain/(loss) on foreign exchange transactions 3,450,672 (5,456,439) 657,584 (10,903,862) (107,233,871)
Net realised profit/(loss) for the period 7,774,933 (72,603,478) 1,312,722 (18,336,147) (299,128,250)
Net change in unrealised appreciation/(depreciation) on investments 27,153,923 33,396,541 8,207,094 41,212,373 541,410,654Net change in unrealised appreciation/(depreciation) on options - (12,191,294) - - (41,044,329)Net change in unrealised appreciation/(depreciation) on financial futures contracts 287,672 - (343,811) (4,138,559) (52,683,182)Net change in unrealised appreciation/(depreciation) on credit default swap contracts (125,342) - (80,220) (906,896) (293,705)Net change in unrealised appreciation/(depreciation) on total return swap contracts - - - - (38,741,174)Net change in unrealised appreciation/(depreciation) on inflation swap contracts - - - - (8,696)Net change in unrealised appreciation/(depreciation) on interest rate swap contracts (2,108,772) - (473,036) - (100,197,165)Net change in unrealised appreciation/(depreciation) on foreign exchange transactions 190,977 (268,901) (124,551) 4,636,565 (181,156,067)
Net change in net assets as a result of operations 33,173,391 (51,667,132) 8,498,198 22,467,336 (171,841,914)
Dividend distribution (80,442) (962,270) - (4,221,280) (35,404,769)
Proceeds received on subscription of shares 100,112,107 52,886,167 23,405,137 372,585,304 12,134,758,335Net amount paid on redemption of shares (125,749,363) (717,825,989) (10,880,346) (364,878,903) (13,396,709,047)
Net change in net assets as a result of capital transactions (25,637,256) (664,939,822) 12,524,791 7,706,401 (1,261,950,712)
Total increase/(decrease) in net assets 7,455,693 (717,569,224) 21,022,989 25,952,457 (1,469,197,395)
Net assets at beginning of period 465,018,268 1,461,478,329 144,116,772 1,271,566,128 45,758,773,021Translation difference - - - - 440,468,312
Net assets at end of period 472,473,961 743,909,105 165,139,761 1,297,518,585 44,730,043,938
+ Represents the combined totals of all Morgan Stanley Investment Funds.

Morgan Stanley Investment Funds 30 June 2016 306
The accompanying notes are an integral part of these financial statements.
Statement of operations and changes in net assets (continued)For the period ended 30 June 2016
Global High Yield
Bond Fund
Global Mortgage Securities
Fund
Global Premier
Credit Fund
Short Maturity
Euro Bond Fund
Combined totals of all
funds +
USD USD USD EUR USD
Income
Dividends (net of withholding taxes) 3,502 69,650 858 - 286,563,005Interest on bonds 10,469,266 6,988,363 205,896 11,918,774 232,462,440Net option premium income - - - - 10,049,475Interest on swap transactions - - - - 6,719,446Income from securities lending 1,145 - - 15,750 2,621,401Bank interest 97 232 8 - 212,068Other income - - - - 6,747,846
Total income 10,474,010 7,058,245 206,762 11,934,524 545,375,681
Expenses
Management fee 1,186,907 1,064,868 35,346 2,688,672 214,790,454Administration charge 308,045 394,998 12,970 1,012,180 46,291,613Distribution fees 643,387 28,681 14,469 513,512 29,536,263Specific additional costs Taxe d’abonnement 49,922 91,758 1,323 102,014 5,653,780 Emerging markets custody fees - - - - 717,581 Hedging expenses 13,898 26,494 85 4 1,195,163 Subsidiary expenses - - - - 66,456Interest on swap transactions - 44,101 14,830 - 13,045,031Bank interest 163 1,144 31 5,559 840,793Tax charges (excluding Taxe d’abonnement) - - - - 2,021,714
Total expenses 2,202,322 1,652,044 79,054 4,321,941 314,158,848
Plus fee waiver income - - - - 1,692,564
Net investment income/(loss) 8,271,688 5,406,201 127,708 7,612,583 232,909,397
Net realised gain/(loss) on sales of investments (7,821,104) 1,960,630 12,892 (5,785,248) (453,850,401)Net realised gain/(loss) on options - - - - (16,220,947)Net realised gain/(loss) on financial futures contracts (23,272) 5,434,322 (37,874) (3,109,300) 72,805,502Net realised gain/(loss) on credit default swap contracts - - - - (4,972,756)Net realised gain/(loss) on total return swap contracts - - - - (16,443,548)Net realised gain/(loss) on inflation swap contracts - - - - (20,219)Net realised gain/(loss) on interest rate swap contracts - - - - (6,101,407)Net realised gain/(loss) on foreign exchange transactions 1,827,390 8,434,841 53,385 (52,857) (107,233,871)
Net realised profit/(loss) for the period 2,254,702 21,235,994 156,111 (1,334,822) (299,128,250)
Net change in unrealised appreciation/(depreciation) on investments 10,548,361 (7,622,253) 626,533 4,779,598 541,410,654Net change in unrealised appreciation/(depreciation) on options - - - - (41,044,329)Net change in unrealised appreciation/(depreciation) on financial futures contracts (40,667) 1,825,717 11,000 (3,389,705) (52,683,182)Net change in unrealised appreciation/(depreciation) on credit default swap contracts - - - - (293,705)Net change in unrealised appreciation/(depreciation) on total return swap contracts - - - - (38,741,174)Net change in unrealised appreciation/(depreciation) on inflation swap contracts - - - - (8,696)Net change in unrealised appreciation/(depreciation) on interest rate swap contracts - (36,559) (96,044) - (100,197,165)Net change in unrealised appreciation/(depreciation) on foreign exchange transactions (1,071,442) (645,816) (14,208) 16,277 (181,156,067)
Net change in net assets as a result of operations 11,690,954 14,757,083 683,392 71,348 (171,841,914)
Dividend distribution (3,052,627) (1,921,100) (1,103) - (35,404,769)
Proceeds received on subscription of shares 49,311,259 58,229,031 1,612,050 933,376,257 12,134,758,335Net amount paid on redemption of shares (59,139,715) (34,269,868) (257,256) (705,608,997) (13,396,709,047)
Net change in net assets as a result of capital transactions (9,828,456) 23,959,163 1,354,794 227,767,260 (1,261,950,712)
Total increase/(decrease) in net assets (1,190,129) 36,795,146 2,037,083 227,838,608 (1,469,197,395)
Net assets at beginning of period 282,438,757 355,525,600 12,333,159 1,142,854,802 45,758,773,021Translation difference - - - - 440,468,312
Net assets at end of period 281,248,628 392,320,746 14,370,242 1,370,693,410 44,730,043,938
+ Represents the combined totals of all Morgan Stanley Investment Funds.
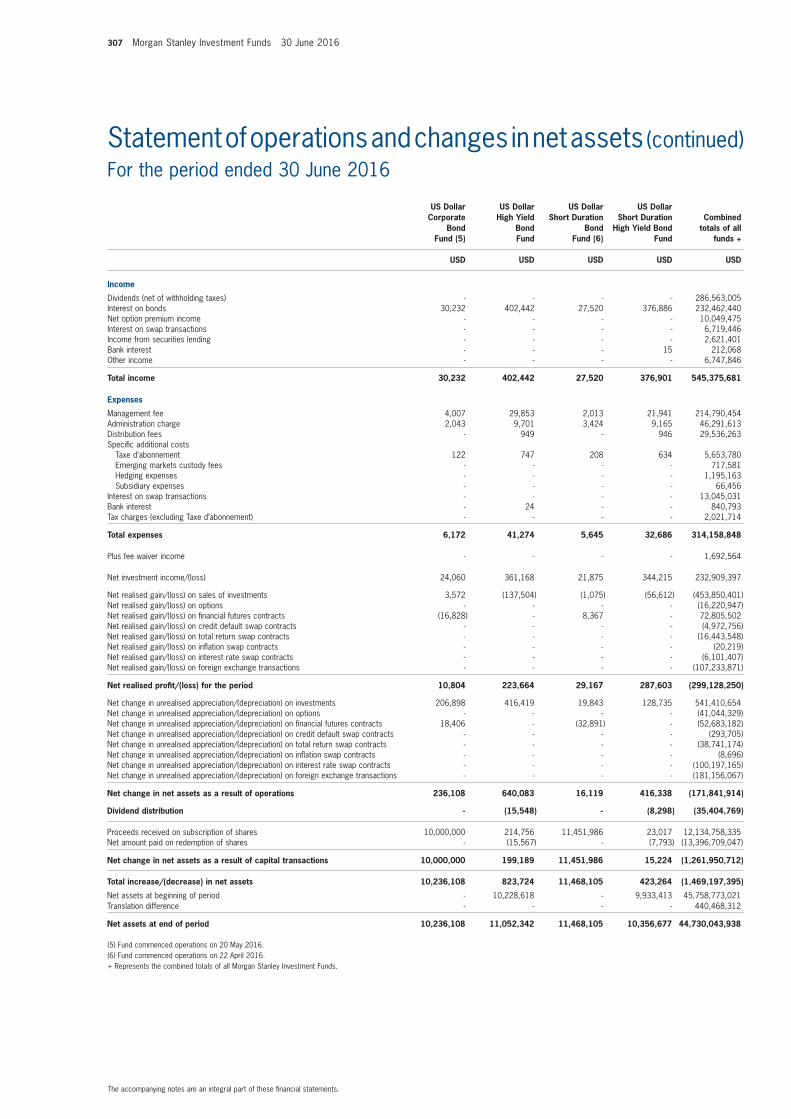
307 Morgan Stanley Investment Funds 30 June 2016
The accompanying notes are an integral part of these financial statements.
Statement of operations and changes in net assets (continued)For the period ended 30 June 2016
US Dollar Corporate
Bond Fund (5)
US Dollar High Yield
Bond Fund
US Dollar Short Duration
Bond Fund (6)
US Dollar Short Duration
High Yield Bond Fund
Combined totals of all
funds +
USD USD USD USD USD
Income
Dividends (net of withholding taxes) - - - - 286,563,005Interest on bonds 30,232 402,442 27,520 376,886 232,462,440Net option premium income - - - - 10,049,475Interest on swap transactions - - - - 6,719,446Income from securities lending - - - - 2,621,401Bank interest - - - 15 212,068Other income - - - - 6,747,846
Total income 30,232 402,442 27,520 376,901 545,375,681
Expenses
Management fee 4,007 29,853 2,013 21,941 214,790,454Administration charge 2,043 9,701 3,424 9,165 46,291,613Distribution fees - 949 - 946 29,536,263Specific additional costs Taxe d’abonnement 122 747 208 634 5,653,780 Emerging markets custody fees - - - - 717,581 Hedging expenses - - - - 1,195,163 Subsidiary expenses - - - - 66,456Interest on swap transactions - - - - 13,045,031Bank interest - 24 - - 840,793Tax charges (excluding Taxe d’abonnement) - - - - 2,021,714
Total expenses 6,172 41,274 5,645 32,686 314,158,848
Plus fee waiver income - - - - 1,692,564
Net investment income/(loss) 24,060 361,168 21,875 344,215 232,909,397
Net realised gain/(loss) on sales of investments 3,572 (137,504) (1,075) (56,612) (453,850,401)Net realised gain/(loss) on options - - - - (16,220,947)Net realised gain/(loss) on financial futures contracts (16,828) - 8,367 - 72,805,502Net realised gain/(loss) on credit default swap contracts - - - - (4,972,756)Net realised gain/(loss) on total return swap contracts - - - - (16,443,548)Net realised gain/(loss) on inflation swap contracts - - - - (20,219)Net realised gain/(loss) on interest rate swap contracts - - - - (6,101,407)Net realised gain/(loss) on foreign exchange transactions - - - - (107,233,871)
Net realised profit/(loss) for the period 10,804 223,664 29,167 287,603 (299,128,250)
Net change in unrealised appreciation/(depreciation) on investments 206,898 416,419 19,843 128,735 541,410,654Net change in unrealised appreciation/(depreciation) on options - - - - (41,044,329)Net change in unrealised appreciation/(depreciation) on financial futures contracts 18,406 - (32,891) - (52,683,182)Net change in unrealised appreciation/(depreciation) on credit default swap contracts - - - - (293,705)Net change in unrealised appreciation/(depreciation) on total return swap contracts - - - - (38,741,174)Net change in unrealised appreciation/(depreciation) on inflation swap contracts - - - - (8,696)Net change in unrealised appreciation/(depreciation) on interest rate swap contracts - - - - (100,197,165)Net change in unrealised appreciation/(depreciation) on foreign exchange transactions - - - - (181,156,067)
Net change in net assets as a result of operations 236,108 640,083 16,119 416,338 (171,841,914)
Dividend distribution - (15,548) - (8,298) (35,404,769)
Proceeds received on subscription of shares 10,000,000 214,756 11,451,986 23,017 12,134,758,335Net amount paid on redemption of shares - (15,567) - (7,793) (13,396,709,047)
Net change in net assets as a result of capital transactions 10,000,000 199,189 11,451,986 15,224 (1,261,950,712)
Total increase/(decrease) in net assets 10,236,108 823,724 11,468,105 423,264 (1,469,197,395)
Net assets at beginning of period - 10,228,618 - 9,933,413 45,758,773,021Translation difference - - - - 440,468,312
Net assets at end of period 10,236,108 11,052,342 11,468,105 10,356,677 44,730,043,938
(5) Fund commenced operations on 20 May 2016.(6) Fund commenced operations on 22 April 2016.+ Represents the combined totals of all Morgan Stanley Investment Funds.

Morgan Stanley Investment Funds 30 June 2016 308
The accompanying notes are an integral part of these financial statements.
Statement of operations and changes in net assets (continued)For the period ended 30 June 2016
US Dollar Liquidity
Fund
Diversified Alpha Plus
Fund
Diversified Alpha Plus
Low Volatility Fund
Global Balanced
Income Fund
Combined totals of all
funds +
USD EUR EUR EUR USD
Income
Dividends (net of withholding taxes) 11,962,946 13,415,649 21,371 1,480,478 286,563,005Interest on bonds - 8,436,492 - 1,329,942 232,462,440Net option premium income - - - 8,893,367 10,049,475Interest on swap transactions - 2,847,420 8,466 847,723 6,719,446Income from securities lending - - - - 2,621,401Bank interest - 8,891 146 1,840 212,068Other income - - - 115,630 6,747,846
Total income 11,962,946 24,708,452 29,983 12,668,980 545,375,681
Expenses
Management fee 9,995,416 28,529,596 108,041 3,362,822 214,790,454Administration charge 3,057,934 4,945,482 20,474 411,195 46,291,613Distribution fees - 7,554,912 15,853 1,138,756 29,536,263Specific additional costs Taxe d’abonnement - 642,766 2,335 80,227 5,653,780 Emerging markets custody fees - - - - 717,581 Hedging expenses - 459,441 12 2,279 1,195,163 Subsidiary expenses - - - - 66,456Interest on swap transactions - 3,659,666 7,549 - 13,045,031Bank interest 2,794 392,978 2,361 73,271 840,793Tax charges (excluding Taxe d’abonnement) - - - - 2,021,714
Total expenses 13,056,144 46,184,841 156,625 5,068,550 314,158,848
Plus fee waiver income 1,447,717 - - - 1,692,564
Net investment income/(loss) 354,519 (21,476,389) (126,642) 7,600,430 232,909,397
Net realised gain/(loss) on sales of investments - (436,204,704) (169,036) (1,457,809) (453,850,401)Net realised gain/(loss) on options - 837,219 1,925 (8,963,596) (16,220,947)Net realised gain/(loss) on financial futures contracts - 98,972,039 (42,897) (4,331,245) 72,805,502Net realised gain/(loss) on credit default swap contracts - 680,683 (18,335) (1,263,026) (4,972,756)Net realised gain/(loss) on total return swap contracts - (16,256,419) (32,796) - (16,443,548)Net realised gain/(loss) on inflation swap contracts - - - - (20,219)Net realised gain/(loss) on interest rate swap contracts - (5,458,984) (5,690) - (6,101,407)Net realised gain/(loss) on foreign exchange transactions - (157,083,132) (27,638) (824,828) (107,233,871)
Net realised profit/(loss) for the period 354,519 (535,989,687) (421,109) (9,240,074) (299,128,250)
Net change in unrealised appreciation/(depreciation) on investments - 220,407,728 7,609 4,055,885 541,410,654Net change in unrealised appreciation/(depreciation) on options - (8,723,887) (16,326) 206,766 (41,044,329)Net change in unrealised appreciation/(depreciation) on financial futures contracts - (24,005,566) (87,632) 54,731 (52,683,182)Net change in unrealised appreciation/(depreciation) on credit default swap contracts - (466,366) 30,909 21,685 (293,705)Net change in unrealised appreciation/(depreciation) on total return swap contracts - (35,061,690) (72,442) - (38,741,174)Net change in unrealised appreciation/(depreciation) on inflation swap contracts - - - - (8,696)Net change in unrealised appreciation/(depreciation) on interest rate swap contracts - (57,969,969) (150,164) - (100,197,165)Net change in unrealised appreciation/(depreciation) on foreign exchange transactions - (123,403,107) (61,693) (199,416) (181,156,067)
Net change in net assets as a result of operations 354,519 (565,212,544) (770,848) (5,100,423) (171,841,914)
Dividend distribution (195,803) - - (9,129,138) (35,404,769)
Proceeds received on subscription of shares 1,822,116,791 129,887,150 1,163,383 138,717,032 12,134,758,335Net amount paid on redemption of shares (1,554,721,727) (1,486,419,874) (1,913,419) (44,183,881) (13,396,709,047)
Net change in net assets as a result of capital transactions 267,395,064 (1,356,532,724) (750,036) 94,533,151 (1,261,950,712)
Total increase/(decrease) in net assets 267,553,780 (1,921,745,268) (1,520,884) 80,303,590 (1,469,197,395)
Net assets at beginning of period 3,939,945,659 5,702,440,712 20,991,441 298,345,300 45,758,773,021Translation difference - - - - 440,468,312
Net assets at end of period 4,207,499,439 3,780,695,444 19,470,557 378,648,890 44,730,043,938
+ Represents the combined totals of all Morgan Stanley Investment Funds.

309 Morgan Stanley Investment Funds 30 June 2016
The accompanying notes are an integral part of these financial statements.
Statement of operations and changes in net assets (continued)For the period ended 30 June 2016
Global Balanced
Risk Control Fund of Funds
Global Multi-Asset
Income Fund
Liquid Alpha
Capture Fund
Liquid Alternatives
Fund
Combined totals of all
funds +
EUR EUR USD USD USD
Income
Dividends (net of withholding taxes) 1,765,046 104,946 118,843 42,883 286,563,005Interest on bonds - 82,453 - - 232,462,440Net option premium income - 108,953 - - 10,049,475Interest on swap transactions - 8,285 478 87 6,719,446Income from securities lending - - - - 2,621,401Bank interest - 96 127 105 212,068Other income 5,512,345 7,100 - 2,854 6,747,846
Total income 7,277,391 311,833 119,448 45,929 545,375,681
Expenses
Management fee 18,319,474 51,634 5,376 31,795 214,790,454Administration charge 2,497,998 12,147 17,109 8,811 46,291,613Distribution fees 4,505,588 - 724 1,070 29,536,263Specific additional costs Taxe d’abonnement - 746 1,802 616 5,653,780 Emerging markets custody fees - - - - 717,581 Hedging expenses 36,128 18 148 128 1,195,163 Subsidiary expenses - - - - 66,456Interest on swap transactions - 2,608 10,378 1,387 13,045,031Bank interest 116,956 1,261 268 6 840,793Tax charges (excluding Taxe d’abonnement) - - - - 2,021,714
Total expenses 25,476,144 68,414 35,805 43,813 314,158,848
Plus fee waiver income - - - - 1,692,564
Net investment income/(loss) (18,198,753) 243,419 83,643 2,116 232,909,397
Net realised gain/(loss) on sales of investments (6,371,071) (52,610) (5,766,050) (371,776) (453,850,401)Net realised gain/(loss) on options (859,196) (8,324) - - (16,220,947)Net realised gain/(loss) on financial futures contracts 2,545,757 30,287 (1,937,147) 93,014 72,805,502Net realised gain/(loss) on credit default swap contracts - (6,613) - - (4,972,756)Net realised gain/(loss) on total return swap contracts - (14,100) 1,855,658 (91,835) (16,443,548)Net realised gain/(loss) on inflation swap contracts - (18,112) - - (20,219)Net realised gain/(loss) on interest rate swap contracts - (966) - - (6,101,407)Net realised gain/(loss) on foreign exchange transactions (4,974,248) 200,029 17,508 4,053 (107,233,871)
Net realised profit/(loss) for the period (27,857,511) 373,010 (5,746,388) (364,428) (299,128,250)
Net change in unrealised appreciation/(depreciation) on investments 33,869,129 252,683 1,097,228 253,352 541,410,654Net change in unrealised appreciation/(depreciation) on options (5,701,967) 20,260 - - (41,044,329)Net change in unrealised appreciation/(depreciation) on financial futures contracts (2,095,046) (38,911) 261,546 (8,428) (52,683,182)Net change in unrealised appreciation/(depreciation) on credit default swap contracts - 13,892 - - (293,705)Net change in unrealised appreciation/(depreciation) on total return swap contracts - (25,987) 507,534 7,867 (38,741,174)Net change in unrealised appreciation/(depreciation) on inflation swap contracts - (7,790) - - (8,696)Net change in unrealised appreciation/(depreciation) on interest rate swap contracts - (59,086) - - (100,197,165)Net change in unrealised appreciation/(depreciation) on foreign exchange transactions 998,328 182,540 (10,152) (8,452) (181,156,067)
Net change in net assets as a result of operations (787,067) 710,611 (3,890,232) (120,089) (171,841,914)
Dividend distribution - (6,226) - - (35,404,769)
Proceeds received on subscription of shares 439,194,189 - 2,905,948 431,685 12,134,758,335Net amount paid on redemption of shares (387,325,880) - (46,536,203) (194,509) (13,396,709,047)
Net change in net assets as a result of capital transactions 51,868,309 - (43,630,255) 237,176 (1,261,950,712)
Total increase/(decrease) in net assets 51,081,242 704,385 (47,520,487) 117,087 (1,469,197,395)
Net assets at beginning of period 2,173,982,891 13,283,162 72,707,293 9,822,515 45,758,773,021Translation difference - - - - 440,468,312
Net assets at end of period 2,225,064,133 13,987,547 25,186,806 9,939,602 44,730,043,938
+ Represents the combined totals of all Morgan Stanley Investment Funds.

Morgan Stanley Investment Funds 30 June 2016 310
Statement of share and net assets statistics
As at 30 June 2016 31 December 2015 31 December 2014
Asia Opportunity Fund (USD) (1) - Net asset value per:
Share Class A 25.61 - -Share Class AH (EUR) 25.50 - -Share Class B 25.55 - -Share Class BH (EUR) 25.44 - -Share Class F 25.67 - -Share Class I 25.67 - -Share Class Z 25.67 - -Share Class ZH (EUR) 25.56 - -Share Class ZH (GBP) 25.58 - -
Net Assets 22,592,028 - -
Asian Equity Fund (USD) - Net asset value per:
Share Class A 40.93 40.51 43.86Share Class B 33.80 33.62 36.76Share Class I 46.62 45.98 49.42Share Class N*** 25.77 - -Share Class Z 27.94 27.55 29.60
Net Assets 246,055,287 134,499,895 233,143,225
Asia-Pacific Equity Fund (USD) - Net asset value per:
Share Class A 23.45 23.38 24.80Share Class B 22.26 22.31 23.90Share Class BH (EUR) 21.54 21.75 23.26Share Class N 25.63 25.34 26.42Share Class Z 24.41 24.25 25.52
Net Assets 116,068,208 115,601,677 119,485,290
Asian Property Fund (USD) - Net asset value per:
Share Class A 18.20 17.50 18.89Share Class AX - - 17.52Share Class B 15.81 15.28 16.66Share Class F 26.49 25.38 -Share Class I 20.72 19.85 21.28Share Class IX 17.70 17.09 18.54Share Class Z 32.01 30.66 32.85
Net Assets 182,404,101 179,318,340 266,923,531
Breakout Nations Fund (USD) - Net asset value per:
Share Class A 23.43 21.81 -Share Class AH (EUR) 23.24 21.81 -Share Class B 23.21 21.72 -Share Class BH (EUR) 23.03 21.72 -Share Class C 23.28 21.75 -Share Class CH (EUR) 23.09 21.75 -Share Class Z 23.61 21.89 -Share Class ZH (GBP)* 28.11 - -
Net Assets 4,756,276 4,398,410 -
Emerging Europe, Middle East and Africa Equity Fund (EUR) - Net asset value per:
Share Class A 66.06 64.90 61.38Share Class AX 61.55 60.47 57.33Share Class B 58.55 57.80 55.22Share Class I 72.31 70.83 66.61Share Class Z 23.60 23.11 21.72
Net Assets 121,650,040 119,578,431 137,016,281
(1) Fund commenced operations on 31 March 2016.* Share Class was launched during the period.*** Share Class was reactivated during the period.
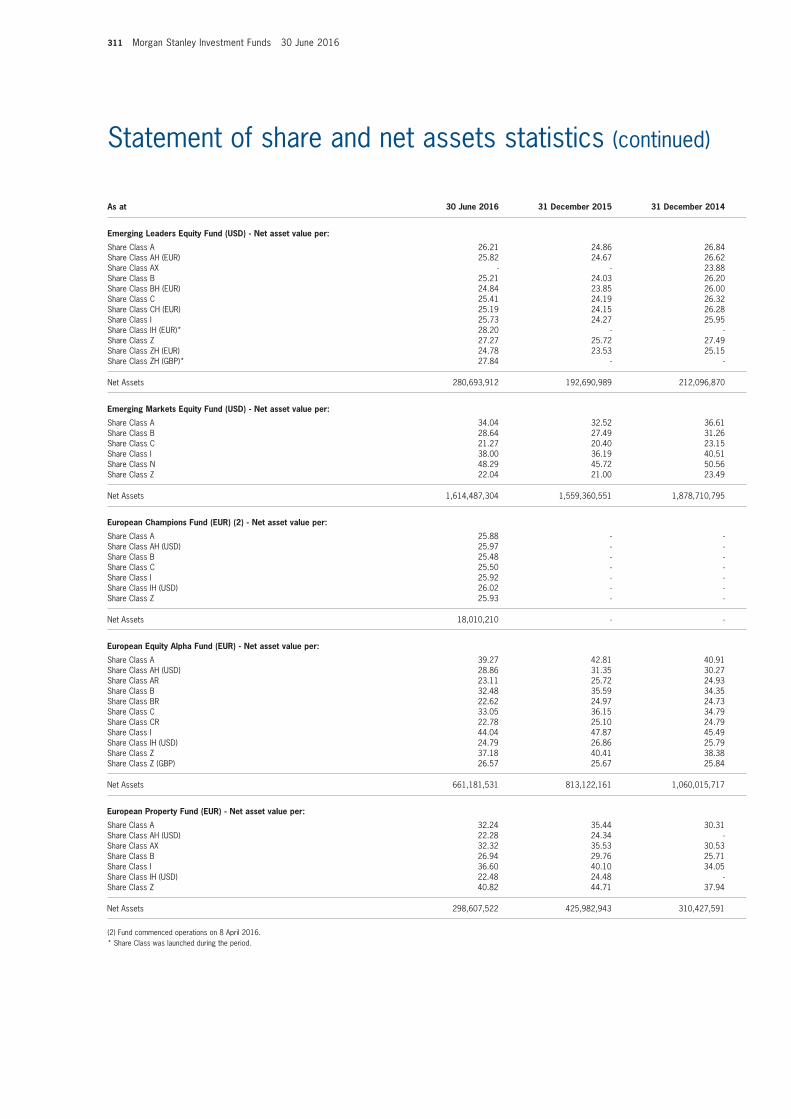
311 Morgan Stanley Investment Funds 30 June 2016
Statement of share and net assets statistics (continued)
As at 30 June 2016 31 December 2015 31 December 2014
Emerging Leaders Equity Fund (USD) - Net asset value per:
Share Class A 26.21 24.86 26.84Share Class AH (EUR) 25.82 24.67 26.62Share Class AX - - 23.88Share Class B 25.21 24.03 26.20Share Class BH (EUR) 24.84 23.85 26.00Share Class C 25.41 24.19 26.32Share Class CH (EUR) 25.19 24.15 26.28Share Class I 25.73 24.27 25.95Share Class IH (EUR)* 28.20 - -Share Class Z 27.27 25.72 27.49Share Class ZH (EUR) 24.78 23.53 25.15Share Class ZH (GBP)* 27.84 - -
Net Assets 280,693,912 192,690,989 212,096,870
Emerging Markets Equity Fund (USD) - Net asset value per:
Share Class A 34.04 32.52 36.61Share Class B 28.64 27.49 31.26Share Class C 21.27 20.40 23.15Share Class I 38.00 36.19 40.51Share Class N 48.29 45.72 50.56Share Class Z 22.04 21.00 23.49
Net Assets 1,614,487,304 1,559,360,551 1,878,710,795
European Champions Fund (EUR) (2) - Net asset value per:
Share Class A 25.88 - -Share Class AH (USD) 25.97 - -Share Class B 25.48 - -Share Class C 25.50 - -Share Class I 25.92 - -Share Class IH (USD) 26.02 - -Share Class Z 25.93 - -
Net Assets 18,010,210 - -
European Equity Alpha Fund (EUR) - Net asset value per:
Share Class A 39.27 42.81 40.91Share Class AH (USD) 28.86 31.35 30.27Share Class AR 23.11 25.72 24.93Share Class B 32.48 35.59 34.35Share Class BR 22.62 24.97 24.73Share Class C 33.05 36.15 34.79Share Class CR 22.78 25.10 24.79Share Class I 44.04 47.87 45.49Share Class IH (USD) 24.79 26.86 25.79Share Class Z 37.18 40.41 38.38Share Class Z (GBP) 26.57 25.67 25.84
Net Assets 661,181,531 813,122,161 1,060,015,717
European Property Fund (EUR) - Net asset value per:
Share Class A 32.24 35.44 30.31Share Class AH (USD) 22.28 24.34 -Share Class AX 32.32 35.53 30.53Share Class B 26.94 29.76 25.71Share Class I 36.60 40.10 34.05Share Class IH (USD) 22.48 24.48 -Share Class Z 40.82 44.71 37.94
Net Assets 298,607,522 425,982,943 310,427,591
(2) Fund commenced operations on 8 April 2016.* Share Class was launched during the period.
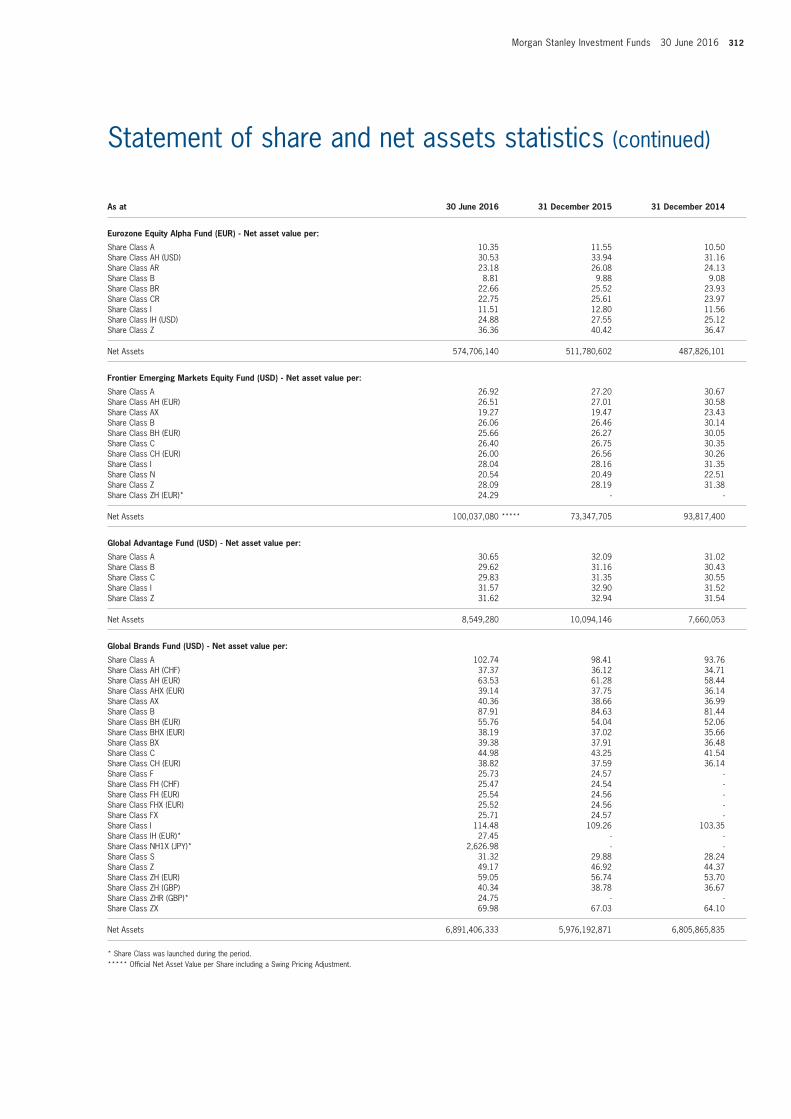
Morgan Stanley Investment Funds 30 June 2016 312
Statement of share and net assets statistics (continued)
As at 30 June 2016 31 December 2015 31 December 2014
Eurozone Equity Alpha Fund (EUR) - Net asset value per:
Share Class A 10.35 11.55 10.50Share Class AH (USD) 30.53 33.94 31.16Share Class AR 23.18 26.08 24.13Share Class B 8.81 9.88 9.08Share Class BR 22.66 25.52 23.93Share Class CR 22.75 25.61 23.97Share Class I 11.51 12.80 11.56Share Class IH (USD) 24.88 27.55 25.12Share Class Z 36.36 40.42 36.47
Net Assets 574,706,140 511,780,602 487,826,101
Frontier Emerging Markets Equity Fund (USD) - Net asset value per:
Share Class A 26.92 27.20 30.67Share Class AH (EUR) 26.51 27.01 30.58Share Class AX 19.27 19.47 23.43Share Class B 26.06 26.46 30.14Share Class BH (EUR) 25.66 26.27 30.05Share Class C 26.40 26.75 30.35Share Class CH (EUR) 26.00 26.56 30.26Share Class I 28.04 28.16 31.35Share Class N 20.54 20.49 22.51Share Class Z 28.09 28.19 31.38Share Class ZH (EUR)* 24.29 - -
Net Assets 100,037,080 ***** 73,347,705 93,817,400
Global Advantage Fund (USD) - Net asset value per:
Share Class A 30.65 32.09 31.02Share Class B 29.62 31.16 30.43Share Class C 29.83 31.35 30.55Share Class I 31.57 32.90 31.52Share Class Z 31.62 32.94 31.54
Net Assets 8,549,280 10,094,146 7,660,053
Global Brands Fund (USD) - Net asset value per:
Share Class A 102.74 98.41 93.76Share Class AH (CHF) 37.37 36.12 34.71Share Class AH (EUR) 63.53 61.28 58.44Share Class AHX (EUR) 39.14 37.75 36.14Share Class AX 40.36 38.66 36.99Share Class B 87.91 84.63 81.44Share Class BH (EUR) 55.76 54.04 52.06Share Class BHX (EUR) 38.19 37.02 35.66Share Class BX 39.38 37.91 36.48Share Class C 44.98 43.25 41.54Share Class CH (EUR) 38.82 37.59 36.14Share Class F 25.73 24.57 -Share Class FH (CHF) 25.47 24.54 -Share Class FH (EUR) 25.54 24.56 -Share Class FHX (EUR) 25.52 24.56 -Share Class FX 25.71 24.57 -Share Class I 114.48 109.26 103.35Share Class IH (EUR)* 27.45 - -Share Class NH1X (JPY)* 2,626.98 - -Share Class S 31.32 29.88 28.24Share Class Z 49.17 46.92 44.37Share Class ZH (EUR) 59.05 56.74 53.70Share Class ZH (GBP) 40.34 38.78 36.67Share Class ZHR (GBP)* 24.75 - -Share Class ZX 69.98 67.03 64.10
Net Assets 6,891,406,333 5,976,192,871 6,805,865,835
* Share Class was launched during the period.***** Official Net Asset Value per Share including a Swing Pricing Adjustment.

313 Morgan Stanley Investment Funds 30 June 2016
Statement of share and net assets statistics (continued)
As at 30 June 2016 31 December 2015 31 December 2014
Global Brands Equity Income Fund (USD) (3) - Net asset value per:
Share Class A 25.34 - -Share Class AR 25.34 - -Share Class AHR (EUR) 25.25 - -Share Class B 25.30 - -Share Class BR 25.30 - -Share Class BHR (EUR) 25.21 - -Share Class CR 25.31 - -Share Class CHR (EUR) 25.22 - -Share Class IR 25.38 - -Share Class Z 25.39 - -Share Class ZR 25.39 - -
Net Assets 10,151,300 - -
Global Discovery Fund (USD) - Net asset value per:
Share Class A 25.58 23.34 24.35Share Class Z 25.97 23.59 24.37
Net Assets 5,584,925 4,716,739 4,874,725
Global Equity Allocation Fund (USD) - Net asset value per:
Share Class A - - 36.35Share Class B - - 35.25Share Class Z - - 37.55
Net Assets - - 26,026,959
Global Infrastructure Fund (USD) - Net asset value per:
Share Class A 51.06 44.29 52.26Share Class AH (EUR) 49.21 43.02 50.91Share Class B 48.06 41.89 49.93Share Class BH (EUR) 46.37 40.74 48.69Share Class C 48.64 42.36 50.39Share Class CH (EUR) 33.18 29.12 34.74Share Class I 33.66 29.09 34.08Share Class Z 53.56 46.28 54.20Share Class ZH (EUR) 43.75 38.10 44.75Share Class ZX 25.28 22.07 26.09
Net Assets 680,562,526 457,033,220 796,361,446
Global Opportunity Fund (USD) - Net asset value per:
Share Class A 45.17 46.83 39.48Share Class AH (EUR) 43.71 45.61 38.38Share Class B 42.72 44.51 37.90Share Class BH (EUR) 41.34 43.35 36.85Share Class C 43.19 44.96 38.21Share Class I 44.34 45.75 38.22Share Class N 29.66 30.48 25.24Share Class Z 47.42 48.93 40.85
Net Assets 934,360,627 745,995,911 181,709,785
Global Property Fund (USD) - Net asset value per:
Share Class A 28.13 27.69 28.28Share Class AH (EUR) 31.16 30.93 31.66Share Class B 25.50 25.23 26.03Share Class BH (EUR) 29.47 29.39 30.39Share Class C 31.34 30.97 31.89Share Class CH (EUR) 29.75 29.65 30.59Share Class I 30.15 29.57 29.99Share Class IX 25.97 25.64 26.26Share Class Z 35.78 35.09 35.56
Net Assets 1,105,838,020 1,088,436,118 1,158,790,389
(3) Fund commenced operations on 29 April 2016.

Morgan Stanley Investment Funds 30 June 2016 314
Statement of share and net assets statistics (continued)
As at 30 June 2016 31 December 2015 31 December 2014
Global Quality Fund (USD) - Net asset value per:
Share Class A 29.60 29.00 27.79Share Class AH (CHF) 26.99 26.67 25.78Share Class AH (EUR) 29.29 28.90 27.71Share Class AH (SGD) 28.23 27.69 26.44Share Class AX 29.17 28.57 27.45Share Class B 28.76 28.31 27.40Share Class BH (EUR) 28.47 28.23 27.34Share Class C 28.92 28.44 27.47Share Class CH (EUR) 28.61 28.34 27.39Share Class E 27.36 26.64 25.22Share Class I 30.41 29.65 28.15Share Class Z 30.46 29.70 28.18Share Class ZH (CHF) 27.62 27.17 26.00Share Class ZH (EUR) 28.39 27.88 26.48Share Class ZX 27.56 26.95 25.82
Net Assets 1,480,068,536 1,572,642,807 1,405,648,487
Indian Equity Fund (USD) - Net asset value per:
Share Class A 36.16 34.56 34.98Share Class B 32.85 31.55 32.28Share Class I 39.00 37.13 37.24Share Class N 37.18 35.22 34.88Share Class Z 40.21 38.28 38.39
Net Assets 304,060,759 245,967,046 131,307,833
International Equity (ex US) Fund (USD) - Net asset value per:
Share Class A 22.89 24.00 24.13Share Class B 22.52 23.74 24.10Share Class C 22.60 23.79 24.11Share Class I 23.23 24.25 24.15Share Class Z 23.25 24.26 24.16
Net Assets 70,524,254 59,523,931 4,857,637
Japanese Equity Fund (JPY) - Net asset value per:
Share Class A 3,163.21 4,119.07 3,812.11Share Class AH (USD) 22.05 29.14 27.24Share Class B 3,234.67 4,233.03 3,956.95Share Class C 3,269.80 4,274.73 3,987.95Share Class I 3,513.18 4,558.28 4,188.34Share Class Z 3,313.38 4,298.18 3,947.77Share Class ZH (EUR) 32.24 42.56 39.18
Net Assets 39,149,541 ** 37,561,050 ** 33,754,377 **
Latin American Equity Fund (USD) - Net asset value per:
Share Class A 43.52 35.36 51.43Share Class B 35.82 29.25 42.96Share Class C 14.35 11.70 17.16Share Class I 49.22 39.86 57.58Share Class Z 35.30 28.58 41.28
Net Assets 380,545,503 260,171,485 409,449,838
US Advantage Fund (USD) - Net asset value per:
Share Class A 57.59 58.93 53.24Share Class AH (EUR) 41.44 42.65 38.46Share Class B 51.83 53.30 48.64Share Class BH (EUR) 67.84 70.18 63.91Share Class C 54.20 55.69 50.72Share Class I 62.36 63.56 56.99Share Class IH (EUR)*** 28.00 - -Share Class Z 59.20 60.33 54.07Share Class ZH (EUR) 68.66 70.39 62.96Share Class ZH (GBP)* 26.06 - -Share Class ZX 50.52 51.49 46.15
Net Assets 4,165,397,885 4,410,393,108 3,964,684,171
* Share Class was launched during the period.** JPY000’s.*** Share Class was reactivated during the period.

315 Morgan Stanley Investment Funds 30 June 2016
Statement of share and net assets statistics (continued)
As at 30 June 2016 31 December 2015 31 December 2014
US Growth Fund (USD) - Net asset value per:
Share Class A 65.51 69.41 62.80Share Class AH (EUR) 45.14 48.09 43.43Share Class AX 65.51 69.41 62.80Share Class B 54.27 57.78 52.81Share Class BH (EUR) 42.90 45.93 41.89Share Class C 45.50 48.40 44.14Share Class CH (EUR) 41.37 44.25 40.28Share Class F 27.72 29.27 26.30Share Class FH (EUR) 25.06 26.60 -Share Class I 75.02 79.18 71.09Share Class IX 74.89 79.05 70.97Share Class Z 48.39 51.07 45.83Share Class ZH (EUR) 47.20 50.08 44.86Share Class ZX 22.84 24.11 -
Net Assets 1,305,269,566 1,479,120,030 1,549,930,716
US Insight Fund (USD) - Net asset value per:
Share Class A 25.46 23.29 24.82Share Class Z 25.82 23.53 24.84
Net Assets 6,703,790 4,704,295 4,967,544
US Property Fund (USD) - Net asset value per:
Share Class A 74.70 69.55 70.37Share Class B 61.53 57.57 58.84Share Class F 28.99 26.91 -Share Class I 84.71 78.59 78.95Share Class Z 61.51 57.05 57.29
Net Assets 415,780,014 402,450,583 559,551,220
Absolute Return Fixed Income Fund (EUR) - Net asset value per:
Share Class A 24.53 25.01 25.06Share Class AH (USD) 24.32 24.67 -Share Class AR 23.39 24.23 24.96Share Class B 24.04 24.63 24.93Share Class BR 23.01 23.95 24.93Share Class C 24.26 24.79 24.95Share Class CR 23.22 24.10 24.95Share Class IH (USD) 24.50 24.78 -Share Class Z 24.81 25.22 25.10
Net Assets 30,136,667 32,380,182 7,809,904
Asian Fixed Income Opportunities Fund (USD) - Net asset value per:
Share Class A 26.33 24.81 -Share Class AX 25.26 24.27 -Share Class I 26.57 24.95 -Share Class IX 25.30 24.31 -Share Class Z 26.58 24.96 -Share Class ZX 25.31 24.31 -
Net Assets 10,616,488 9,974,416 -
Emerging Markets Corporate Debt Fund (USD) - Net asset value per:
Share Class A 32.74 30.27 30.53Share Class AH (EUR) 32.21 29.95 30.34Share Class AHX (EUR) 27.21 25.82 27.14Share Class AX 27.68 26.13 27.33Share Class B 31.04 28.85 29.38Share Class BH (EUR) 30.52 28.52 29.19Share Class BHX (EUR) 27.15 25.77 27.07Share Class BX 27.60 26.06 27.25Share Class C 31.49 29.22 29.67Share Class CH (EUR) 26.90 25.09 25.60Share Class I 27.24 25.11 25.18Share Class IH (EUR)* 27.19 - -Share Class Z 33.86 31.21 31.29Share Class ZH (EUR) 28.15 26.10 26.28
Net Assets 725,113,886 ***** 544,124,234 626,667,509
* Share Class was launched during the period.***** Official Net Asset Value per Share including a Swing Pricing Adjustment.

Morgan Stanley Investment Funds 30 June 2016 316
Statement of share and net assets statistics (continued)
As at 30 June 2016 31 December 2015 31 December 2014
Emerging Markets Debt Fund (USD) - Net asset value per:
Share Class A 81.68 74.34 76.41Share Class AH (EUR) 59.29 54.22 55.98Share Class AHX (EUR) 23.79 22.29 24.15Share Class ARM 21.34 20.11 22.05Share Class AX 51.79 48.32 52.07Share Class B 67.61 61.84 64.20Share Class BH (EUR) 28.14 25.86 26.97Share Class BHX (EUR) 23.74 22.25 24.10Share Class BX 24.17 22.55 24.30Share Class C 34.97 31.94 33.06Share Class I 91.53 83.07 84.90Share Class Z 39.07 35.45 36.22Share Class ZH (EUR) 34.86 31.78 32.61Share Class ZHX (GBP) - - 26.52
Net Assets 245,872,750 228,494,006 370,082,060
Emerging Markets Domestic Debt Fund (USD) - Net asset value per:
Share Class A 29.00 25.93 31.30Share Class AH (EUR) 21.59 19.45 23.65Share Class AHX (EUR) 16.25 14.92 19.10Share Class ARM 15.19 13.96 17.97Share Class AX 16.62 15.14 19.21Share Class B 26.43 23.74 28.95Share Class BH (EUR) 18.61 16.85 20.70Share Class BHX (EUR) 16.23 14.90 19.06Share Class BX 16.76 15.27 19.36Share Class C 23.00 20.63 25.08Share Class I 30.58 27.26 32.72Share Class Z 28.45 25.35 30.42Share Class ZH (EUR) 20.70 18.60 22.49Share Class ZX 16.95 15.44 19.59
Net Assets 170,779,359 163,763,838 236,869,037
Emerging Markets Fixed Income Opportunities Fund (USD) - Net asset value per:
Share Class A 26.84 24.11 -Share Class AH (EUR) 26.60 24.06 -Share Class AHR (EUR) 25.50 23.84 -Share Class B 26.59 24.01 -Share Class BH (EUR) 26.36 23.96 -Share Class BHR (EUR) 25.27 23.74 -Share Class C 26.71 24.06 -Share Class CH (EUR) 26.48 24.01 -Share Class CHR (EUR) 25.39 23.79 -Share Class Z 27.03 24.19 -
Net Assets 18,715,841 9,719,461 -
Euro Bond Fund (EUR) - Net asset value per:
Share Class A 16.38 15.67 15.71Share Class B 13.63 13.10 13.26Share Class C 36.86 35.36 35.68Share Class I 17.76 16.94 16.92Share Class Z 39.90 38.07 37.99
Net Assets 239,057,653 251,370,400 222,215,614

317 Morgan Stanley Investment Funds 30 June 2016
Statement of share and net assets statistics (continued)
As at 30 June 2016 31 December 2015 31 December 2014
Euro Corporate Bond Fund (EUR) - Net asset value per:
Share Class A 48.16 46.74 47.20Share Class AD 27.45 27.46 27.97Share Class ADX 23.59 23.77 24.58Share Class AH (USD) 26.03 25.14 25.29Share Class AX 30.35 29.68 30.42Share Class B 41.55 40.53 41.34Share Class BD 25.93 26.06 26.82Share Class BDX 23.54 23.72 24.53Share Class BH (USD) 27.25 26.44 26.87Share Class BX 28.44 27.81 28.51Share Class C 37.35 36.37 36.96Share Class CD 26.23 26.32 26.98Share Class F 26.17 25.36 -Share Class FX 25.93 25.36 -Share Class I 51.33 49.72 49.99Share Class IH (USD) 26.23 25.28 25.32Share Class ID 26.18 26.13 26.51Share Class IX 26.65 26.06 26.71Share Class S 34.99 33.86 34.01Share Class Z 41.04 39.74 39.94Share Class ZD 28.22 28.16 28.56Share Class ZOX 24.31 24.50 25.34
Net Assets 3,590,603,102 3,943,367,285 2,921,934,807
Euro Corporate Bond (ex Financials) Fund (EUR) (4) - Net asset value per:
Share Class A - 28.60 28.94Share Class N - 31.35 31.41Share Class Z - 28.90 29.11
Net Assets - 73,230,339 71,029,665
Euro Strategic Bond Fund (EUR) - Net asset value per:
Share Class A 44.95 43.22 43.54Share Class AD 26.24 26.36 26.62Share Class ADX 23.12 23.40 24.00Share Class AX 28.81 27.90 28.54Share Class B 37.24 35.98 36.61Share Class BD 24.80 25.03 25.54Share Class BDX 23.06 23.34 23.94Share Class BX 28.71 27.81 28.45Share Class C 31.40 30.29 30.71Share Class I 48.78 46.79 46.94Share Class Z 40.30 38.65 38.76Share Class ZD 26.99 27.04 27.20
Net Assets 830,267,444 836,695,699 690,706,965
European Currencies High Yield Bond Fund (EUR) - Net asset value per:
Share Class A 22.23 21.42 21.22Share Class ADX 21.61 21.94 22.96Share Class AH (USD) 26.95 25.84 25.51Share Class AX 29.07 28.68 29.84Share Class B 18.53 17.95 17.97Share Class BD 27.03 26.94 27.12Share Class BDX 21.56 21.90 22.91Share Class BX 29.00 28.61 29.76Share Class C 46.20 44.66 44.55Share Class I 24.09 23.17 22.87Share Class IH (USD) 27.22 26.05 25.61Share Class IHX (USD) - - 24.52Share Class Z 50.51 48.56 47.90Share Class ZD - - 25.16Share Class ZH (USD) 25.50 24.39 -Share Class ZX 24.95 24.62 25.61
Net Assets 1,265,694,906 ***** 1,307,964,586 905,740,224
(4) Fund was closed on 2 May 2016.***** Official Net Asset Value per Share including a Swing Pricing Adjustment.

Morgan Stanley Investment Funds 30 June 2016 318
Statement of share and net assets statistics (continued)
As at 30 June 2016 31 December 2015 31 December 2014
Global Bond Fund (USD) - Net asset value per:
Share Class A 40.88 38.15 40.13Share Class AH (EUR) 25.93 24.37 25.91Share Class AHX (EUR) 23.42 22.22 24.13Share Class AX 31.97 30.12 32.36Share Class B 33.71 31.61 33.58Share Class BH (EUR) 24.59 23.23 24.94Share Class BHX (EUR) 23.37 22.18 24.08Share Class BX 24.08 22.69 24.38Share Class C 30.86 28.89 30.58Share Class I 44.42 41.36 43.32Share Class Z 33.62 31.30 32.77Share Class ZH (EUR)* 26.41 - -
Net Assets 472,473,961 465,018,268 534,714,192
Global Convertible Bond Fund (USD) - Net asset value per:
Share Class A 40.57 42.23 42.24Share Class AH (AUD) - - 25.39Share Class AH (CHF) 28.02 29.40 29.70Share Class AH (EUR) 34.38 35.97 36.06Share Class ARM - - 24.51Share Class B 35.30 36.93 37.31Share Class BH (EUR) 29.89 31.43 31.83Share Class CH (EUR) 26.83 28.16 28.40Share Class I 43.29 44.96 44.75Share Class IH (EUR) 36.67 38.28 38.20Share Class NH (CHF) 23.77 24.79 24.75Share Class Z 31.63 32.84 32.68Share Class ZH (CHF) - 23.64 -Share Class ZH (EUR) 38.92 40.61 40.51Share Class ZHX (EUR) 34.87 36.53 36.73Share Class ZX 26.17 27.28 27.37
Net Assets 743,909,105 1,461,478,329 1,519,065,240
Global Credit Fund (USD) - Net asset value per:
Share Class A 27.15 25.81 26.92Share Class B 26.19 25.02 26.35Share Class C 26.53 25.30 26.55Share Class I 27.57 26.15 27.16Share Class Z 27.62 26.19 27.18Share Class ZH1 (CHF) 26.49 25.40 26.15
Net Assets 165,139,761 144,116,772 145,701,004
Global Fixed Income Opportunities Fund (USD) - Net asset value per:
Share Class A 30.77 30.31 30.73Share Class AH (CHF) 24.08 23.92 -Share Class AH (EUR) 28.72 28.45 28.99Share Class AHR (EUR) 22.96 23.24 24.73Share Class AHX (EUR) 26.16 26.29 27.60Share Class ARM 22.66 22.80 24.11Share Class AX 26.67 26.66 27.84Share Class B 29.39 29.10 29.80Share Class BH (EUR) 27.54 27.42 28.22Share Class BHR (EUR) 22.43 22.81 24.53Share Class BHX (EUR) 26.10 26.23 27.53Share Class BX 26.61 26.60 27.78Share Class C 26.82 26.48 26.96Share Class CH (EUR) 26.35 26.16 26.77Share Class CHR (EUR) 22.72 23.04 24.64Share Class CHX (EUR) 23.82 23.94 25.13Share Class I 24.73 24.29 24.47Share Class IH (CHF) 24.25 24.02 -Share Class IX 23.36 23.35 24.39Share Class Z 31.75 31.18 31.40Share Class ZH (CHF) 24.26 24.02 -Share Class ZH (EUR) 26.68 26.35 26.67Share Class ZH (GBP) 25.20 24.78 -Share Class ZHX (EUR)* 25.39 - -Share Class ZHX (GBP) 24.13 24.17 -Share Class ZX 23.92 23.92 24.88
Net Assets 1,297,518,585 1,271,566,128 802,018,483
* Share Class was launched during the period.

319 Morgan Stanley Investment Funds 30 June 2016
Statement of share and net assets statistics (continued)
As at 30 June 2016 31 December 2015 31 December 2014
Global High Yield Bond Fund (USD) - Net asset value per:
Share Class A 34.20 32.76 33.84Share Class AH (EUR) 30.44 29.34 30.54Share Class AHX (EUR) 25.50 25.37 28.27Share Class AO (SEK) 23.75 23.62 25.01Share Class ARM - - 22.29Share Class AX 26.11 25.83 28.54Share Class B 32.66 31.44 32.81Share Class BH (EUR) 29.18 28.27 29.72Share Class BHX (EUR) 25.45 25.32 28.20Share Class BX 26.07 25.78 28.48Share Class C 28.16 27.05 28.12Share Class CH (EUR) 27.56 26.65 27.91Share Class I 23.77 22.72 23.36Share Class IX 20.74 20.52 22.66Share Class Z 35.01 33.46 34.39Share Class ZH (EUR) 23.82 22.91 23.72
Net Assets 281,248,628 282,438,757 249,642,158
Global Mortgage Securities Fund (USD) - Net asset value per:
Share Class A 28.39 27.74 27.42Share Class AH (EUR) 27.91 27.43 27.26Share Class AX - - 26.33Share Class B 27.36 26.87 26.82Share Class BH (EUR) 26.93 26.60 26.70Share Class BHR (EUR) 23.90 24.04 25.09Share Class BHX (EUR) 25.97 25.82 26.27Share Class C 27.77 27.22 27.07Share Class CH (EUR) 27.32 26.93 26.92Share Class CHX (EUR) 26.00 25.85 26.31Share Class CX 26.24 25.95 26.27Share Class I 28.97 28.23 27.75Share Class IH (EUR) 27.69 27.14 26.81Share Class IHX (EUR) 25.38 25.24 25.69Share Class Z 29.00 28.25 27.76
Net Assets 392,320,746 355,525,600 261,754,698
Global Premier Credit Fund (USD) - Net asset value per:
Share Class A 25.59 24.31 25.30Share Class B 24.70 23.59 24.79Share Class BH (EUR) 24.10 23.17 24.59Share Class Z 26.01 24.66 25.54Share Class ZX 24.07 23.10 24.44
Net Assets 14,370,242 12,333,159 12,956,927
Short Maturity Euro Bond Fund (EUR) - Net asset value per:
Share Class A 20.36 20.38 20.41Share Class AH (SEK) 24.87 24.91 -Share Class AH (USD) 25.29 25.17 25.10Share Class B 17.09 17.18 17.38Share Class C 26.13 26.23 26.44Share Class I 22.15 22.12 22.06Share Class IH (USD) 25.53 25.37 25.18Share Class Z 30.54 30.49 30.40
Net Assets 1,370,693,410 1,142,854,802 559,590,277
US Dollar Corporate Bond Fund (USD) (5) - Net asset value per:
Share Class A 25.57 - -Share Class I 25.59 - -Share Class Z 25.59 - -
Net Assets 10,236,108 - -
(5) Fund commenced operations on 20 May 2016.

Morgan Stanley Investment Funds 30 June 2016 320
Statement of share and net assets statistics (continued)
As at 30 June 2016 31 December 2015 31 December 2014
US Dollar High Yield Bond Fund (USD) - Net asset value per:
Share Class A 25.96 24.55 24.89Share Class AX 23.98 23.42 24.89Share Class B 25.55 24.29 24.87Share Class BX 23.92 23.36 24.87Share Class C 25.78 24.44 24.88Share Class CX 23.95 23.39 24.88Share Class I 26.30 24.77 24.91Share Class Z 26.31 24.78 24.91
Net Assets 11,052,342 10,228,618 9,963,103
US Dollar Short Duration Bond Fund (USD) (6) - Net asset value per:
Share Class A 25.03 - -Share Class I 25.04 - -Share Class Z 25.05 - -
Net Assets 11,468,105 - -
US Dollar Short Duration High Yield Bond Fund (USD) - Net asset value per:
Share Class A 25.63 24.68 25.03Share Class AX 23.65 23.51 25.03Share Class B 25.23 24.42 25.01Share Class BX 23.59 23.45 25.01Share Class C 25.51 24.60 25.02Share Class CX 23.63 23.49 25.02Share Class I 25.91 24.86 25.04Share Class Z 25.92 24.87 25.04
Net Assets 10,356,677 9,933,413 10,015,387
US Dollar Liquidity Fund (USD) - Net asset value per:
Share Class A 13.03 13.03 13.03Share Class AX 1.00 1.00 1.00Share Class I 13.56 13.55 13.55Share Class Z 25.06 25.03 25.03
Net Assets 4,207,499,439 3,939,945,659 4,494,078,971
Diversified Alpha Plus Fund (EUR) - Net asset value per:
Share Class A 27.37 29.46 33.52Share Class AH (CHF) 20.09 21.68 24.87Share Class AH (SEK) 19.96 21.53 24.56Share Class AH (SGD) 21.07 22.54 25.42Share Class AH (USD) 29.01 31.06 35.21Share Class AX 20.12 21.66 24.64Share Class B 25.26 27.33 31.40Share Class BH (USD) 25.16 27.07 31.00Share Class C 25.50 27.55 31.56Share Class F 20.66 22.12 -Share Class FH (CHF) 22.69 24.37 -Share Class FH (GBP) 21.32 22.79 25.56Share Class FH (SGD) 22.99 24.48 -Share Class FH (USD) 21.02 22.39 25.14Share Class I 29.73 31.83 35.85Share Class IH (GBP) 21.12 22.55 -Share Class IH (USD) 21.30 22.68 25.45Share Class N 15.09 16.09 17.95Share Class Z 29.72 31.83 35.83Share Class ZH (CHF) 20.68 22.21 25.20Share Class ZH (GBP) 27.63 29.50 33.06Share Class ZH (USD) 25.58 27.24 30.56Share Class ZHX (GBP) 21.23 22.66 25.40
Net Assets 3,780,695,444 5,702,440,712 7,252,637,110
(6) Fund commenced operations on 22 April 2016.

321 Morgan Stanley Investment Funds 30 June 2016
Statement of share and net assets statistics (continued)
As at 30 June 2016 31 December 2015 31 December 2014
Diversified Alpha Plus Low Volatility Fund (EUR) - Net asset value per:
Share Class A 21.94 22.85 24.63Share Class AH (USD) 22.29 23.10 24.81Share Class B 21.46 22.47 24.46Share Class C 21.58 22.56 24.50Share Class I 22.43 23.25 24.80Share Class IH (USD) 22.76 23.47 24.94Share Class Z 22.45 23.27 24.81
Net Assets 19,470,557 20,991,441 22,222,476
Global Balanced Income Fund (EUR) - Net asset value per:
Share Class A 26.48 26.82 25.85Share Class AR 24.05 25.11 25.85Share Class AHR (USD) 23.92 24.87 25.26Share Class BR 23.45 24.60 25.24Share Class CR 23.56 24.68 25.25Share Class CHR (USD) 24.23 25.27 -Share Class I* 25.42 - -Share Class IR 24.63 25.56 25.99Share Class IHR (USD) 24.64 25.45 -Share Class Z 27.15 27.32 26.00Share Class ZHR (GBP) 23.61 24.46 -Share Class ZHR (USD) 23.66 24.43 -
Net Assets 378,648,890 298,345,300 7,797,544
Global Balanced Risk Control Fund of Funds (EUR) - Net asset value per:
Share Class A 34.50 34.45 33.13Share Class AH (USD) 27.09 26.94 25.92Share Class B 32.96 33.08 32.13Share Class C 30.71 30.78 29.81Share Class CH (USD) 25.24 25.19 -Share Class IH (USD) 24.26 23.97 -Share Class Z 35.05 34.78 33.03Share Class ZH3 (COP) 22.78 **** 20.61 **** -
Net Assets 2,225,064,133 2,173,982,891 1,061,045,063
Global Multi-Asset Income Fund (EUR) - Net asset value per:
Share Class A 26.11 24.92 -Share Class AR 25.56 24.92 -Share Class AHR (USD) 25.76 24.96 -Share Class IR 25.76 24.98 -Share Class Z 26.33 24.98 -
Net Assets 13,987,547 13,283,162 -
Liquid Alpha Capture Fund (USD) - Net asset value per:
Share Class A 22.21 23.30 25.35Share Class AH (EUR) 22.43 23.67 25.79Share Class BH (EUR) 21.94 23.26 25.61Share Class C 21.92 23.05 25.25Share Class CH (EUR) 22.12 23.39 25.66Share Class I - 23.72 25.53Share Class IH (GBP) 22.62 23.76 25.55Share Class N 23.09 24.04 25.67Share Class Z 22.71 23.71 25.51Share Class ZH (EUR) 22.52 23.66 25.50
Net Assets 25,186,806 72,707,293 91,812,284
Liquid Alternatives Fund (USD) - Net asset value per:
Share Class A 22.63 23.02 24.61Share Class AH (EUR) 22.43 22.95 24.68Share Class BH (EUR) 21.95 22.57 24.52Share Class C 22.25 22.73 24.50Share Class CH (EUR) 22.05 22.64 24.55Share Class I 23.09 23.38 24.75Share Class IH (GBP) 23.21 23.57 24.90Share Class Z 23.21 23.50 24.87Share Class ZH (EUR) 22.93 23.34 24.85
Net Assets 9,939,602 9,822,515 10,039,675
* Share Class was launched during the period.**** Official Net Asset Value per Share is in USD.
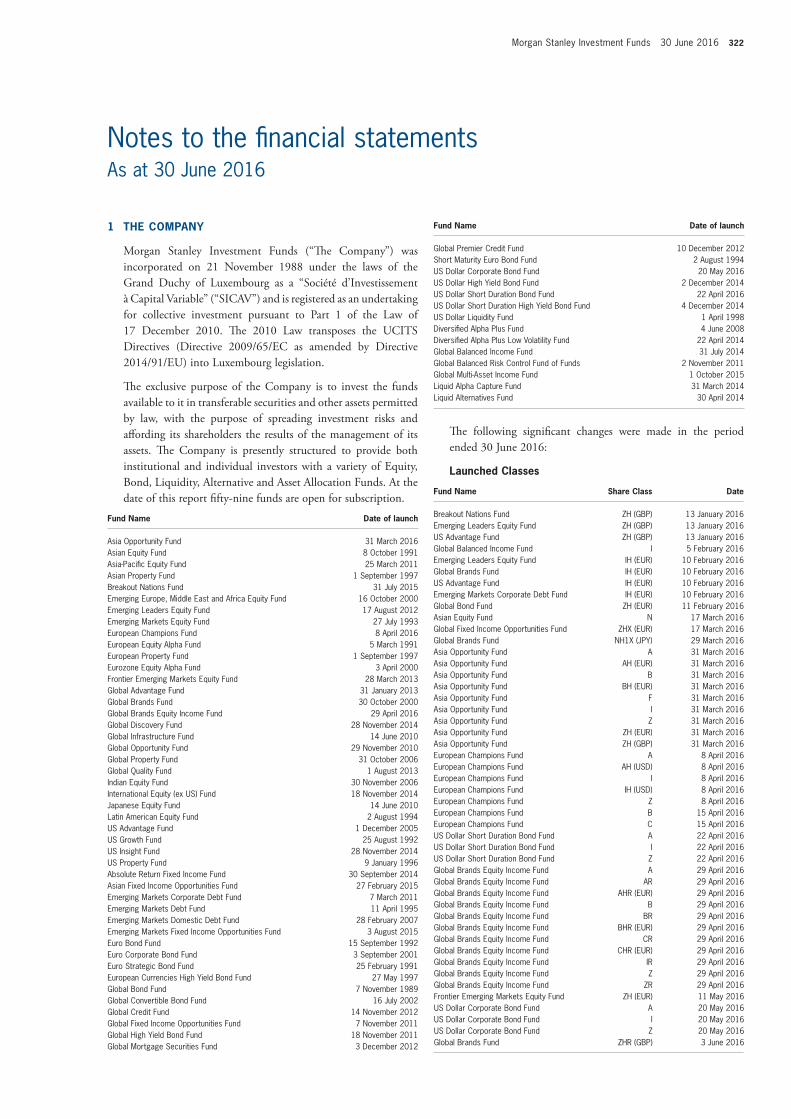
Morgan Stanley Investment Funds 30 June 2016 322
1 THE COMPANY
Morgan Stanley Investment Funds (“The Company”) was incorporated on 21 November 1988 under the laws of the Grand Duchy of Luxembourg as a “Société d’Investissement à Capital Variable” (“SICAV”) and is registered as an undertaking for collective investment pursuant to Part 1 of the Law of 17 December 2010. The 2010 Law transposes the UCITS Directives (Directive 2009/65/EC as amended by Directive 2014/91/EU) into Luxembourg legislation.
The exclusive purpose of the Company is to invest the funds available to it in transferable securities and other assets permitted by law, with the purpose of spreading investment risks and affording its shareholders the results of the management of its assets. The Company is presently structured to provide both institutional and individual investors with a variety of Equity, Bond, Liquidity, Alternative and Asset Allocation Funds. At the date of this report fifty-nine funds are open for subscription.
Fund Name Date of launch
Asia Opportunity Fund 31 March 2016Asian Equity Fund 8 October 1991Asia-Pacific Equity Fund 25 March 2011Asian Property Fund 1 September 1997Breakout Nations Fund 31 July 2015Emerging Europe, Middle East and Africa Equity Fund 16 October 2000Emerging Leaders Equity Fund 17 August 2012Emerging Markets Equity Fund 27 July 1993European Champions Fund 8 April 2016European Equity Alpha Fund 5 March 1991European Property Fund 1 September 1997Eurozone Equity Alpha Fund 3 April 2000Frontier Emerging Markets Equity Fund 28 March 2013Global Advantage Fund 31 January 2013Global Brands Fund 30 October 2000Global Brands Equity Income Fund 29 April 2016Global Discovery Fund 28 November 2014Global Infrastructure Fund 14 June 2010Global Opportunity Fund 29 November 2010Global Property Fund 31 October 2006Global Quality Fund 1 August 2013Indian Equity Fund 30 November 2006International Equity (ex US) Fund 18 November 2014Japanese Equity Fund 14 June 2010Latin American Equity Fund 2 August 1994US Advantage Fund 1 December 2005US Growth Fund 25 August 1992US Insight Fund 28 November 2014US Property Fund 9 January 1996Absolute Return Fixed Income Fund 30 September 2014Asian Fixed Income Opportunities Fund 27 February 2015Emerging Markets Corporate Debt Fund 7 March 2011Emerging Markets Debt Fund 11 April 1995Emerging Markets Domestic Debt Fund 28 February 2007Emerging Markets Fixed Income Opportunities Fund 3 August 2015Euro Bond Fund 15 September 1992Euro Corporate Bond Fund 3 September 2001Euro Strategic Bond Fund 25 February 1991European Currencies High Yield Bond Fund 27 May 1997Global Bond Fund 7 November 1989Global Convertible Bond Fund 16 July 2002Global Credit Fund 14 November 2012Global Fixed Income Opportunities Fund 7 November 2011Global High Yield Bond Fund 18 November 2011Global Mortgage Securities Fund 3 December 2012
Fund Name Date of launch
Global Premier Credit Fund 10 December 2012Short Maturity Euro Bond Fund 2 August 1994US Dollar Corporate Bond Fund 20 May 2016US Dollar High Yield Bond Fund 2 December 2014US Dollar Short Duration Bond Fund 22 April 2016US Dollar Short Duration High Yield Bond Fund 4 December 2014US Dollar Liquidity Fund 1 April 1998Diversified Alpha Plus Fund 4 June 2008Diversified Alpha Plus Low Volatility Fund 22 April 2014Global Balanced Income Fund 31 July 2014Global Balanced Risk Control Fund of Funds 2 November 2011Global Multi-Asset Income Fund 1 October 2015Liquid Alpha Capture Fund 31 March 2014Liquid Alternatives Fund 30 April 2014
The following significant changes were made in the period ended 30 June 2016:
Launched Classes
Fund Name Share Class Date
Breakout Nations Fund ZH (GBP) 13 January 2016Emerging Leaders Equity Fund ZH (GBP) 13 January 2016US Advantage Fund ZH (GBP) 13 January 2016Global Balanced Income Fund I 5 February 2016Emerging Leaders Equity Fund IH (EUR) 10 February 2016Global Brands Fund IH (EUR) 10 February 2016US Advantage Fund IH (EUR) 10 February 2016Emerging Markets Corporate Debt Fund IH (EUR) 10 February 2016Global Bond Fund ZH (EUR) 11 February 2016Asian Equity Fund N 17 March 2016Global Fixed Income Opportunities Fund ZHX (EUR) 17 March 2016Global Brands Fund NH1X (JPY) 29 March 2016Asia Opportunity Fund A 31 March 2016Asia Opportunity Fund AH (EUR) 31 March 2016Asia Opportunity Fund B 31 March 2016Asia Opportunity Fund BH (EUR) 31 March 2016Asia Opportunity Fund F 31 March 2016Asia Opportunity Fund I 31 March 2016Asia Opportunity Fund Z 31 March 2016Asia Opportunity Fund ZH (EUR) 31 March 2016Asia Opportunity Fund ZH (GBP) 31 March 2016European Champions Fund A 8 April 2016European Champions Fund AH (USD) 8 April 2016European Champions Fund I 8 April 2016European Champions Fund IH (USD) 8 April 2016European Champions Fund Z 8 April 2016European Champions Fund B 15 April 2016European Champions Fund C 15 April 2016US Dollar Short Duration Bond Fund A 22 April 2016US Dollar Short Duration Bond Fund I 22 April 2016US Dollar Short Duration Bond Fund Z 22 April 2016Global Brands Equity Income Fund A 29 April 2016Global Brands Equity Income Fund AR 29 April 2016Global Brands Equity Income Fund AHR (EUR) 29 April 2016Global Brands Equity Income Fund B 29 April 2016Global Brands Equity Income Fund BR 29 April 2016Global Brands Equity Income Fund BHR (EUR) 29 April 2016Global Brands Equity Income Fund CR 29 April 2016Global Brands Equity Income Fund CHR (EUR) 29 April 2016Global Brands Equity Income Fund IR 29 April 2016Global Brands Equity Income Fund Z 29 April 2016Global Brands Equity Income Fund ZR 29 April 2016Frontier Emerging Markets Equity Fund ZH (EUR) 11 May 2016US Dollar Corporate Bond Fund A 20 May 2016US Dollar Corporate Bond Fund I 20 May 2016US Dollar Corporate Bond Fund Z 20 May 2016Global Brands Fund ZHR (GBP) 3 June 2016
Notes to the financial statementsAs at 30 June 2016

323 Morgan Stanley Investment Funds 30 June 2016
Notes to the financial statements (continued)As at 30 June 2016
Closed Classes
Fund Name Share Class Date
Global Convertible Bond Fund ZH (CHF) 19 January 2016Liquid Alpha Capture Fund I 21 January 2016Euro Corporate Bond (ex Financials) Fund N 31 March 2016Euro Corporate Bond (ex Financials) Fund A 2 May 2016Euro Corporate Bond (ex Financials) Fund Z 2 May 2016
Launched Funds
• On 31 March 2016, Morgan Stanley Investment Funds – Asia Opportunity Fund commenced operations.
• On 8 April 2016, Morgan Stanley Investment Funds – European Champions Fund commenced operations.
• On 22 April 2016, Morgan Stanley Investment Funds – US Dollar Short Duration Bond Fund commenced operations.
• On 29 April 2016, Morgan Stanley Investment Funds – Global Brands Equity Income Fund commenced operations.
• On 20 May 2016, Morgan Stanley Investment Funds – US Dollar Corporate Bond Fund commenced operations.
Closed Fund
• On 2 May 2016, Morgan Stanley Investment Funds – Euro Corporate Bond (ex Financials) Fund closed.
Code of Conduct
The Board of Directors of the Company adopted the principles of the ALFI Code of Conduct, designed to provide the Board with a framework of principles and best practice recommendations for the governance of the Company.
2 SIGNIFICANT ACCOUNTING POLICIES
The financial statements are presented in accordance with generally accepted accounting principles applicable to UCITS investment funds in Luxembourg and require management to make estimates and assumptions that affect the amounts reported in the financial statements and accompanying notes. Actual results could differ from those estimates.
a) Valuation of securities
Securities listed on a recognised stock exchange or dealt in on any other regulated market are valued at their last available prices at the valuation point, or, in the event that there should be several such markets, on the basis of their last available prices on the main market for the relevant security.
In normal market conditions, fixed income securities (including mortgage backed securities) are valued at mid market price at the valuation point, based on data provided by pricing vendors.
In the event that the last available price or mid market price (fixed income) does not truly reflect the fair market value of the relevant securities, the value of such securities will be based on the reasonably foreseeable sales price determined prudently and in good faith pursuant to procedures established by the Board of Directors of the Company.
Securities not listed or traded on a stock exchange or not dealt on another regulated market are valued on the basis of the reasonably foreseeable sales price determined prudently and in good faith pursuant to procedures established by the Board of Directors of the Company.
Securities with a known short-term maturity date, are valued using an amortised cost method. This involves valuing an investment at its cost and thereafter assuming a constant amortisation to maturity of any discount or premium, regardless of the impact of fluctuating interest rates on the market value of the investments.
Investments in other Undertakings for Collective Investments (“UCIs”) are valued at the last available net asset value for the UCI in question, excluding redemption fees if any.
Events may occur between the determination of an investment’s last available price and the determination of the Fund’s Net Asset Value per Share at the valuation point that may, in the opinion of the Board of Directors of the Company, mean that the last available price does not reflect the fair market value of the investment. In such circumstances the price of such investment shall be adjusted in accordance with the procedures adopted from time to time by the Board of Directors of the Company in their discretion. As at the date of this annual report, certain securities may be fair valued in accordance with these procedures.
If since the time of determination of the net asset value there has been a material change in the quotations in the markets on which a substantial portion of the investments attributable to an available Fund are dealt in or quoted, the Company may, in order to safeguard the interests of the shareholders and the Company, cancel the first valuation and carry out further valuations as appropriate.
b) Valuation of Interest rate swaps
An Interest Rate Swap (“IRS”) is a bilateral agreement in which each of the parties agree to exchange a series of interest payments (usually fixed/floating) based on a notional amount that serves as a computation basis and that is usually not exchanged.
IRS contracts are valued by reference to service data providers, market data and algorithms.

Morgan Stanley Investment Funds 30 June 2016 324
Notes to the financial statements (continued)As at 30 June 2016
The unrealised gain/loss as at period end is recorded under “Unrealised gain/loss on interest rate swap contracts” in the Statement of assets and liabilities. The changes in such amounts are recorded under “Net change in unrealised appreciation/(depreciation) on interest rate swap contracts” and the realised gain/loss under “Net realised gain/(loss) on interest rate swap contracts” in the Statement of operations and changes in net assets.
c) Valuation of Credit default swaps
A Credit Default Swap (“CDS”) is a transaction in which two parties enter into an agreement, whereby the buyer pays the seller a periodic payment for the specified life of the agreement. The seller makes no payments unless a credit event, relating to a predetermined reference asset, occurs. If such an event does occur, the seller will then make a payment to the buyer, and the swap contract will terminate.
CDS contracts are valued by reference to service data providers, market data and algorithms.
The unrealised gain/loss as at period end is recorded under “Unrealised gain/loss on credit default swap contracts” in the Statement of assets and liabilities. The changes in such amounts are recorded under “Net change in unrealised appreciation/(depreciation) on credit default swap contracts” and the realised gain/loss under “Net realised gain/(loss) on credit default swap contracts” in the Statement of operations and changes in net assets.
The notional amount represents the highest potential liability of a contract and is not shown in the Statement of assets and liabilities.
d) Valuation of Total return swaps
A Total Return Swap (“TRS”) is a transaction in which the buyer receives the performance of an underlying asset and in return the buyer pays funding costs and generally, an arrangement fee. The underlying asset may be, but not limited to, a specific security, basket of securities, other instruments and index.
TRS contracts are valued by reference to the mark to market value based on the market value of the underlying asset.
The unrealised gain/loss as at period end is recorded under “Unrealised gain/loss on total return swap contracts” in the Statement of assets and liabilities. The changes in such amounts are recorded under “Net change in unrealised appreciation/(depreciation) on total return swap contracts” and the realised gain/loss under “Net realised gain/(loss) on total return swap contracts” in the Statement of operations and changes in net assets.
e) Valuation of Options
Options are contractual agreements that convey the right, but not the obligation, for the purchaser either to buy or sell a specific amount of a financial instrument at a fixed price, either at a fixed future date or at any time within a specified period.
Options are valued by reference to the expected future cash flow based on the market implied performance, spot level and the volatility of the underlying asset(s).
In determining the accounting treatment for options, consideration is given to the nature of the instrument itself and the Fund’s Investment objective. When the underlying is acquired or delivered upon exercise of an option, the acquisition cost or sale proceeds are adjusted by the amount of the premium paid. When an option is closed, the difference between the premium and the cost to close the position is recorded under “Net realised gain/(loss) on options” in the Statement of operations and changes in net assets. When an option expires, the premium is accounted for as a realised gain for options written or as a realised loss for options purchased.
For the Global Balanced Income Fund and Global Multi-Asset Income Fund, the net option premium received on written options will be recorded as income. When an option is closed, the cost to close the position is recorded under “Net realised gain/(loss) on options” in the Statement of operations and changes in net assets.
The market value of options as at period end is recorded under “Options at market value” in the Statement of assets and liabilities. The changes in unrealised gain/(loss) on options are recorded under “Net change in unrealised appreciation/(depreciation) on options” in the Statement of operations and changes in net assets.
f) Valuation of Forward currency exchange contracts
A forward currency exchange contract is an agreement between two parties to exchange one currency for another at a specific price and date in the future.
Open forward contracts are valued by reference to the last available currency rates prevailing at the relevant valuation point.
The unrealised gain/loss as at period end is recorded under “Unrealised gain/loss on forward currency exchange contracts” in the Statement of assets and liabilities. The changes in such amounts are recorded under “Net change in unrealised appreciation/(depreciation) on foreign exchange transactions” and the realised gain/loss under “Net realised gain/(loss) on foreign exchange transactions” in the Statement of operations and changes in net assets.

325 Morgan Stanley Investment Funds 30 June 2016
Notes to the financial statements (continued)As at 30 June 2016
g) Valuation of Financial futures contracts
A financial futures contract is a contractual agreement, to buy or sell a particular commodity or financial instrument at a pre-determined price in the future. Financial futures contracts detail the quality and quantity of the underlying asset and they are standardised to facilitate trading on a futures exchange.
Futures contracts are valued at the last available prices, on the exchanges for which the contracts are traded on, as at the valuation point.
The unrealised gain/loss as at period end is recorded under “Unrealised gain/loss on financial futures contracts” in the Statement of assets and liabilities. The changes in such amounts are recorded under “Net change in unrealised appreciation/(depreciation) on financial futures contracts” and the realised gain/loss under “Net realised gain/(loss) on financial futures contracts” in the Statement of operations and changes in net assets.
At the time the Fund enters into a financial futures contract the Fund deposits and maintains with the broker as collateral an initial margin as required by the exchange on which the transaction is affected. Cash held by/owed to the broker as of 30 June 2016 is recorded as part of “Cash at banks” and “Bank overdrafts” in the Statement of assets and liabilities. Pursuant to the contract, the Fund agrees to receive from or pay to the broker an amount of cash equal to the daily fluctuation in the value of the contract. Such receipts or payments are known as the variation margin and are recorded by the Fund as unrealised appreciation/(depreciation) on financial futures contracts. When the contract is closed, the Fund records a “Net realised gain/(loss) on financial futures contracts” equal to the difference between the value of the contract at the time it was opened and the time it is closed.
h) Income and securities transactions
Dividend income is recorded on the ex-dividend date. Interest income is accrued daily. Discounts and premiums are accreted and amortised as adjustments to interest income for short-term money market instrument only. Income from securities lending is recorded on a cash receipts basis.
Securities transactions are accounted for on a trade date basis, on the date the securities are purchased or sold. Realised gains or losses on the sale of securities are determined on the basis of the average cost method and are recorded under “Net realised gain/(loss) on sales of investments” in the Statement of operations and changes in net assets.
For the Global Mortgage Securities Fund, realised gains and losses on the sale of interest only mortgaged-backed securities are determined on a First In First Out (FIFO) basis of cost method and are recorded under “Net realised gain/(loss) on
sales of investments” in the Statement of operations and changes in net assets.
i) Valuation of Repurchase agreements
Under a repurchase agreement, the Company purchases securities and agrees to re-sell them at a mutually agreed upon date and price. A repurchase agreement is collateralised by securities. Repurchase agreements are valued at cost with interest accrued from the date of purchase.
Repurchase agreements outstanding as at period end, if any, are included in the Statement of assets and liabilities. Net repurchase agreements income is included under “Bank interest” in the Statement of operations and changes in net assets.
j) Translation of foreign currencies
Transactions in foreign currencies are translated into the currency of each Fund at the last available rate of exchange prevailing in a recognised market at the date of the transactions. Assets and liabilities denominated in foreign currencies are translated into the currency of each Fund at the last available rate of exchange prevailing in a recognised market at the date of the Statement of assets and liabilities.
The Combined statement of assets and liabilities is presented in US Dollars at the last available rate of exchange prevailing in a recognised market at the date of the Statement of assets and liabilities, while the combined Statement of operations and changes in net assets is presented in US Dollars at the average exchange rates ruling during the period.
The difference between opening net assets stated at exchange rates at the beginning of the period and their value at the end of the period is shown as “Translation difference” in the Statement of operations and changes in net assets.
k) Mauritian subsidiary
The Indian Equity Fund currently invests through Morgan Stanley Investment Holding Company (Mauritius) Limited (“the Subsidiary”). All assets and liabilities, income and expenses of the Subsidiary are recorded in the Statement of assets and liabilities and the Statement of operations and changes in net assets of the Indian Equity Fund. All investments held by the Subsidiary are individually disclosed in the statement of investments of the Indian Equity Fund.
The Subsidiary incurs and pays certain fees and expenses relating to its investment activity in India. These fees and expenses may include brokerage costs and commissions, transaction costs associated with converting currency to and from Indian Rupee to US Dollars, fees incurred by its standing proxy, corporate and registration fees and taxes associated with the establishment and operation of the Subsidiary.

Morgan Stanley Investment Funds 30 June 2016 326
Notes to the financial statements (continued)As at 30 June 2016
The audited financial statements of the subsidiary is made available to the shareholders free of charge upon request at the registered office of the Morgan Stanley Investment Holding Company (Mauritius) Limited: CIM Fund Services Ltd, 33 Edith Cavell Street, Port Louis, Republic of Mauritius.
3 SECURITIES LENDING
Certain Funds may lend securities to qualified financial institutions, such as broker-dealers, to earn additional income. Any increase or decrease in the fair value of the securities loaned that might occur and any interest earned or dividends declared on those securities during the term of the loan would remain in the Fund. Funds that lend securities, receive securities as collateral in an amount equal to or exceeding 100% of the current fair value of the loaned securities. The collateral is marked to market daily, by the securities lending agent, to ensure that a minimum of 100% collateral coverage is maintained throughout the term of the loan. Securities lending income is generated as a result of securities on loan less compensation to the administrative agent. Net securities lending income is included in the Statement of operations and changes in net assets. See note 4(b) for related party disclosure on securities lending transactions.
The value of loaned securities, related collateral outstanding, identity of the counterparties, security lending income and associated operational costs and fees as at 30 June 2016 are as follows:
Fund NameValue of loaned
securities in USD
Securities Collateral MV
in USD*Fund
Currency
Lending Income (Gross)
in Fund Currency
Lending Agent fees
in Fund Currency
Lending Income (Net)
in Fund Currency
Asian Equity Fund 23,986,690 25,277,948 USD 67,500 6,750 60,750Asia-Pacific Equity Fund 9,347,929 9,849,923 USD 18,750 1,875 16,875Emerging Leaders Equity Fund 47,278,730 49,817,653 USD 73,586 7,359 66,227Emerging Markets Equity Fund 166,642,156 175,603,499 USD 150,000 15,000 135,000European Equity Alpha Fund 126,910,742 133,756,878 EUR 301,299 30,130 271,169European Property Fund 7,638,464 8,088,432 EUR 11,060 2,212 8,848Eurozone Equity Alpha Fund 139,079,813 146,548,559 EUR 275,656 27,566 248,090Frontier Emerging Markets Equity Fund 1,006,473 1,070,191 USD 686 137 549Global Infrastructure Fund 28,733,300 30,276,312 USD 375,771 37,654 338,117Global Opportunity Fund 8,754,307 9,257,911 USD 32,381 6,476 25,905Latin American Equity Fund 5,955,508 6,275,326 USD 18,750 1,875 16,875US Advantage Fund 61,979,500 65,324,012 USD 148,345 29,669 118,676US Growth Fund 60,564,357 64,042,473 USD 970,178 194,036 776,142Emerging Markets Corporate Debt Fund 20,421,420 26,571,905 USD 17,019 1,702 15,317Emerging Markets Debt Fund 11,358,613 14,779,579 USD 5,752 575 5,177Euro Bond Fund 14,416,594 14,770,572 EUR 17,500 1,750 15,750Euro Corporate Bond Fund 352,677,565 361,432,521 EUR 17,500 1,750 15,750Euro Corporate Bond (ex Financials) Fund1 - - EUR 1,467 147 1,320Euro Strategic Bond Fund 62,825,717 64,539,942 EUR 98,000 9,800 88,200European Currencies High Yield Bond Fund 293,931,759 301,935,696 EUR 154,997 15,500 139,497Global Bond Fund 15,006,507 15,498,261 USD 50,888 5,089 45,799Global Convertible Bond Fund 7,987,011 8,451,142 USD 643 129 514Global Fixed Income Opportunities Fund 18,931,367 24,069,569 USD 111,549 11,155 100,394Global High Yield Bond Fund 1,542,343 1,949,525 USD 1,272 127 1,145Short Maturity Euro Bond Fund 30,303,524 31,047,581 EUR 17,500 1,750 15,750
Total 1,517,280,389 1,590,235,410
1 Fund was closed on 2 May 2016.* Collateral is comprised of government bonds issued by the following countries: Austria, Belgium,
Germany, Finland, France, UK, Netherlands and USA.
Fund NameValue of loaned
securities in USD Collateral MV in USD Counterparty
Asian Equity Fund 20,505,014 21,606,157 Morgan Stanley & Co. InternationalAsian Equity Fund 3,481,676 3,671,791 UBSAsia-Pacific Equity Fund 9,347,929 9,849,923 Morgan Stanley & Co. InternationalEmerging Leaders Equity Fund 47,278,730 49,817,653 Morgan Stanley & Co. InternationalEmerging Markets Equity Fund 152,837,738 161,045,302 Morgan Stanley & Co. InternationalEmerging Markets Equity Fund 13,804,418 14,558,197 UBSEuropean Equity Alpha Fund 123,333,592 129,956,747 Morgan Stanley & Co. InternationalEuropean Equity Alpha Fund 3,577,150 3,800,131 Bank of AmericaEuropean Property Fund 2,115,770 2,241,536 Credit Suisse Securities (Europe)European Property Fund 4,370,406 4,624,301 Morgan Stanley & Co. InternationalEuropean Property Fund 196,629 207,366 UBSEuropean Property Fund 955,659 1,015,229 Bank of AmericaEurozone Equity Alpha Fund 139,079,813 146,548,559 Morgan Stanley & Co. InternationalFrontier Emerging Markets Equity Fund 428,433 459,332 Citigroup Global MarketsFrontier Emerging Markets Equity Fund 185,844 195,992 UBSFrontier Emerging Markets Equity Fund 392,196 414,867 J.P. MorganGlobal Infrastructure Fund 28,733,300 30,276,312 Morgan Stanley & Co. InternationalGlobal Opportunity Fund 3,040,515 3,221,250 Credit Suisse Securities (Europe)Global Opportunity Fund 2,317,878 2,444,444 UBSGlobal Opportunity Fund 3,395,914 3,592,217 J.P. MorganLatin American Equity Fund 5,955,508 6,275,326 Morgan Stanley & Co. InternationalUS Advantage Fund 61,979,500 65,324,012 Bank of AmericaUS Growth Fund 756,684 801,663 Credit Suisse Securities (Europe)US Growth Fund 50,706,446 53,642,617 Deutsche BankUS Growth Fund 9,101,227 9,598,193 UBSEmerging Markets Corporate Debt Fund 20,421,420 26,571,905 Morgan Stanley & Co. InternationalEmerging Markets Debt Fund 11,358,613 14,779,579 Morgan Stanley & Co. InternationalEuro Bond Fund 14,416,594 14,770,572 BarclaysEuro Corporate Bond Fund 352,677,565 361,432,521 BarclaysEuro Strategic Bond Fund 62,825,717 64,539,942 BarclaysEuropean Currencies High Yield Bond Fund 293,931,759 301,935,696 BarclaysGlobal Bond Fund 15,006,507 15,498,261 BarclaysGlobal Convertible Bond Fund 7,299,825 7,724,907 Credit Suisse Securities (Europe)Global Convertible Bond Fund 687,186 726,235 J.P. MorganGlobal Fixed Income Opportunities Fund 18,931,367 24,069,569 Morgan Stanley & Co. InternationalGlobal High Yield Bond Fund 1,542,343 1,949,525 Morgan Stanley & Co. InternationalShort Maturity Euro Bond Fund 30,303,524 31,047,581 Barclays
Total 1,517,280,389 1,590,235,410
4 RELATED PARTY TRANSACTIONS AND AFFILIATIONS
The Company has delegated to the Management Company Morgan Stanley Investment Management (ACD) Limited (“MSIM (ACD) Limited”) under the overall supervision and control of the Board of Directors of the Company, its investment management services, central administration, registrar and transfer agency services as well as marketing, principal distribution and sales services, as more specifically detailed in the management company services agreement as well as in the prospectus of the Company.
MSIM (ACD) Limited is authorised by the Financial Conduct Authority in the United Kingdom to provide these services. The Management Company may delegate some of its tasks to other parties, as detailed below, subject to approval by the Company. The Management Company’s liability to the Company for the performance of collective portfolio management services has not been affected by such delegation.
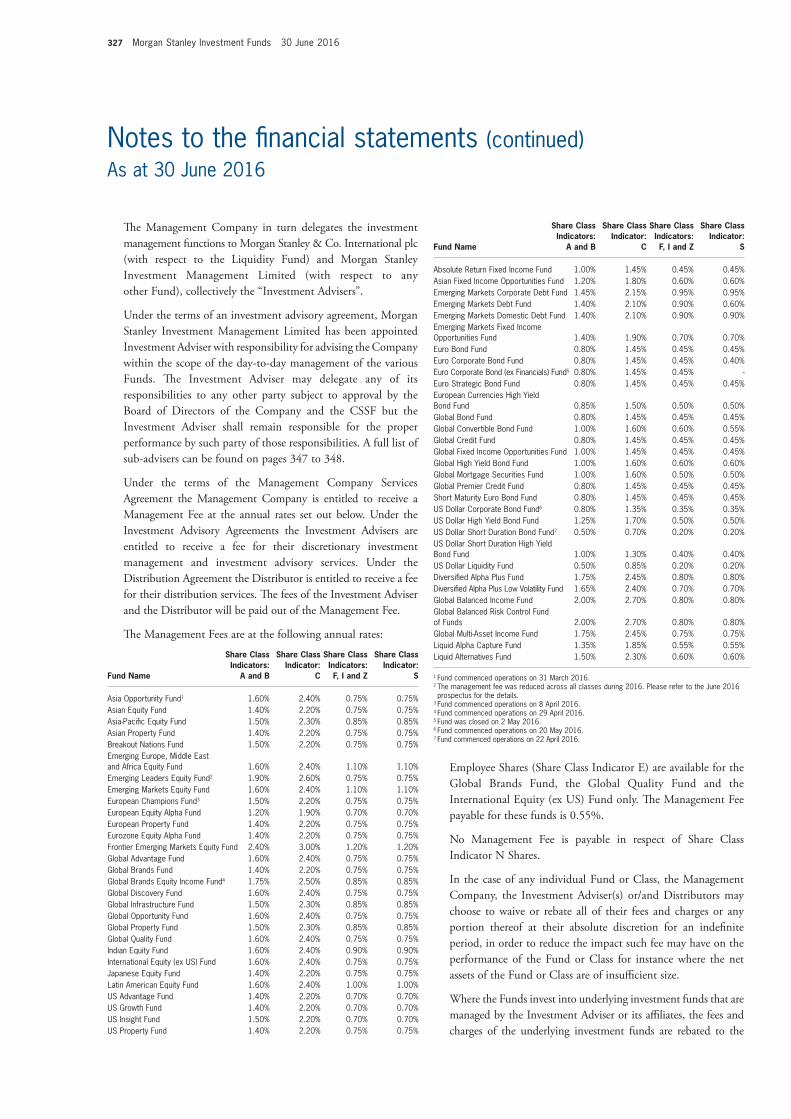
327 Morgan Stanley Investment Funds 30 June 2016
Notes to the financial statements (continued)As at 30 June 2016
The Management Company in turn delegates the investment management functions to Morgan Stanley & Co. International plc (with respect to the Liquidity Fund) and Morgan Stanley Investment Management Limited (with respect to any other Fund), collectively the “Investment Advisers”.
Under the terms of an investment advisory agreement, Morgan Stanley Investment Management Limited has been appointed Investment Adviser with responsibility for advising the Company within the scope of the day-to-day management of the various Funds. The Investment Adviser may delegate any of its responsibilities to any other party subject to approval by the Board of Directors of the Company and the CSSF but the Investment Adviser shall remain responsible for the proper performance by such party of those responsibilities. A full list of sub-advisers can be found on pages 347 to 348.
Under the terms of the Management Company Services Agreement the Management Company is entitled to receive a Management Fee at the annual rates set out below. Under the Investment Advisory Agreements the Investment Advisers are entitled to receive a fee for their discretionary investment management and investment advisory services. Under the Distribution Agreement the Distributor is entitled to receive a fee for their distribution services. The fees of the Investment Adviser and the Distributor will be paid out of the Management Fee.
The Management Fees are at the following annual rates:
Fund Name
Share Class Indicators:
A and B
Share Class Indicator:
C
Share Class Indicators: F, I and Z
Share Class Indicator:
S
Asia Opportunity Fund1 1.60% 2.40% 0.75% 0.75%Asian Equity Fund 1.40% 2.20% 0.75% 0.75%Asia-Pacific Equity Fund 1.50% 2.30% 0.85% 0.85%Asian Property Fund 1.40% 2.20% 0.75% 0.75%Breakout Nations Fund 1.50% 2.20% 0.75% 0.75%Emerging Europe, Middle East and Africa Equity Fund 1.60% 2.40% 1.10% 1.10%Emerging Leaders Equity Fund2 1.90% 2.60% 0.75% 0.75%Emerging Markets Equity Fund 1.60% 2.40% 1.10% 1.10%European Champions Fund3 1.50% 2.20% 0.75% 0.75%European Equity Alpha Fund 1.20% 1.90% 0.70% 0.70%European Property Fund 1.40% 2.20% 0.75% 0.75%Eurozone Equity Alpha Fund 1.40% 2.20% 0.75% 0.75%Frontier Emerging Markets Equity Fund 2.40% 3.00% 1.20% 1.20%Global Advantage Fund 1.60% 2.40% 0.75% 0.75%Global Brands Fund 1.40% 2.20% 0.75% 0.75%Global Brands Equity Income Fund4 1.75% 2.50% 0.85% 0.85%Global Discovery Fund 1.60% 2.40% 0.75% 0.75%Global Infrastructure Fund 1.50% 2.30% 0.85% 0.85%Global Opportunity Fund 1.60% 2.40% 0.75% 0.75%Global Property Fund 1.50% 2.30% 0.85% 0.85%Global Quality Fund 1.60% 2.40% 0.75% 0.75%Indian Equity Fund 1.60% 2.40% 0.90% 0.90%International Equity (ex US) Fund 1.60% 2.40% 0.75% 0.75%Japanese Equity Fund 1.40% 2.20% 0.75% 0.75%Latin American Equity Fund 1.60% 2.40% 1.00% 1.00%US Advantage Fund 1.40% 2.20% 0.70% 0.70%US Growth Fund 1.40% 2.20% 0.70% 0.70%US Insight Fund 1.50% 2.20% 0.70% 0.70%US Property Fund 1.40% 2.20% 0.75% 0.75%
Fund Name
Share Class Indicators:
A and B
Share Class Indicator:
C
Share Class Indicators: F, I and Z
Share Class Indicator:
S
Absolute Return Fixed Income Fund 1.00% 1.45% 0.45% 0.45%Asian Fixed Income Opportunities Fund 1.20% 1.80% 0.60% 0.60%Emerging Markets Corporate Debt Fund 1.45% 2.15% 0.95% 0.95%Emerging Markets Debt Fund 1.40% 2.10% 0.90% 0.60%Emerging Markets Domestic Debt Fund 1.40% 2.10% 0.90% 0.90%Emerging Markets Fixed Income Opportunities Fund 1.40% 1.90% 0.70% 0.70%Euro Bond Fund 0.80% 1.45% 0.45% 0.45%Euro Corporate Bond Fund 0.80% 1.45% 0.45% 0.40%Euro Corporate Bond (ex Financials) Fund5 0.80% 1.45% 0.45% -Euro Strategic Bond Fund 0.80% 1.45% 0.45% 0.45%European Currencies High Yield Bond Fund 0.85% 1.50% 0.50% 0.50%Global Bond Fund 0.80% 1.45% 0.45% 0.45%Global Convertible Bond Fund 1.00% 1.60% 0.60% 0.55%Global Credit Fund 0.80% 1.45% 0.45% 0.45%Global Fixed Income Opportunities Fund 1.00% 1.45% 0.45% 0.45%Global High Yield Bond Fund 1.00% 1.60% 0.60% 0.60%Global Mortgage Securities Fund 1.00% 1.60% 0.50% 0.50%Global Premier Credit Fund 0.80% 1.45% 0.45% 0.45%Short Maturity Euro Bond Fund 0.80% 1.45% 0.45% 0.45%US Dollar Corporate Bond Fund6 0.80% 1.35% 0.35% 0.35%US Dollar High Yield Bond Fund 1.25% 1.70% 0.50% 0.50%US Dollar Short Duration Bond Fund7 0.50% 0.70% 0.20% 0.20%US Dollar Short Duration High Yield Bond Fund 1.00% 1.30% 0.40% 0.40%US Dollar Liquidity Fund 0.50% 0.85% 0.20% 0.20%Diversified Alpha Plus Fund 1.75% 2.45% 0.80% 0.80%Diversified Alpha Plus Low Volatility Fund 1.65% 2.40% 0.70% 0.70%Global Balanced Income Fund 2.00% 2.70% 0.80% 0.80%Global Balanced Risk Control Fund of Funds 2.00% 2.70% 0.80% 0.80%Global Multi-Asset Income Fund 1.75% 2.45% 0.75% 0.75%Liquid Alpha Capture Fund 1.35% 1.85% 0.55% 0.55%Liquid Alternatives Fund 1.50% 2.30% 0.60% 0.60%
1 Fund commenced operations on 31 March 2016.2 The management fee was reduced across all classes during 2016. Please refer to the June 2016 prospectus for the details.
3 Fund commenced operations on 8 April 2016.4 Fund commenced operations on 29 April 2016.5 Fund was closed on 2 May 2016.6 Fund commenced operations on 20 May 2016.7 Fund commenced operations on 22 April 2016.
Employee Shares (Share Class Indicator E) are available for the Global Brands Fund, the Global Quality Fund and the International Equity (ex US) Fund only. The Management Fee payable for these funds is 0.55%.
No Management Fee is payable in respect of Share Class Indicator N Shares.
In the case of any individual Fund or Class, the Management Company, the Investment Adviser(s) or/and Distributors may choose to waive or rebate all of their fees and charges or any portion thereof at their absolute discretion for an indefinite period, in order to reduce the impact such fee may have on the performance of the Fund or Class for instance where the net assets of the Fund or Class are of insufficient size.
Where the Funds invest into underlying investment funds that are managed by the Investment Adviser or its affiliates, the fees and charges of the underlying investment funds are rebated to the

Morgan Stanley Investment Funds 30 June 2016 328
Notes to the financial statements (continued)As at 30 June 2016
written notice. These Specific Additional Costs are applicable as follows:
Share Class Indicator Taxe
d’abonnement
A, B, C, E, F and I 0.05%*N, S and Z 0.01%*
* Except for the US Dollar Liquidity Fund where the rate is currently 0.00%.
Share Class Sub-IndicatorHedging
Expenses
H, H1, H2, H3 and O 0.04%
Specific Additional Costs are made on the following Funds in addition to the share class costs above:
Emerging Market
Custody Subsidiary
Indian Equity Fund 0.05% 0.05%Asian Equity Fund, Asia Opportunity Fund, Asia-Pacific Equity Fund, Emerging Europe Middle East and Africa Equity Fund, Emerging Leaders Equity Fund, Emerging Markets Equity Fund, Frontier Emerging Markets Equity Fund, Latin American Equity Fund 0.05% 0.00%
iiii) A Distribution Fee (payable to the the Management Company in relation to Share Class Indicator B shares only).
The Distributor is paid a distribution fee for the Equity Funds, Bond Funds, Asset Allocation Funds and Alternative Investment Funds, accrued daily and paid monthly, at the annual rate of 1.00% of the average daily Net Asset Value to Share Class Indicator B as compensation for providing distribution-related services to the Funds with respect to such Shares.
The US Dollar Liquidity Fund will pay the Management Company a distribution fee, accrued daily and paid monthly, at the annual rate of 0.75% of the average daily Net Asset Value for Share Class Indicator B.
Where the Distributor and its affiliates invest on behalf of clients, or their clients invest directly into Share Class Indicator N Shares, such clients may pay, outside of the Fund, to the Distributor or its affiliates a base management fee, a performance fee or a mixture of both a base management fee and a performance fee.
a) Morgan Stanley Investment Management Limited and the sub-advisers for the Company have entered into the following types of transactions in which a connected person had a material interest:
i) Transactions in relation to an investment in respect of which an affiliated firm benefited from a commission, fee, mark up or mark down; or
ii) Transactions in relation to a placing and/or a new issue in which the affiliated company was a member of the underwriting syndicate.
Funds to avoid duplicated Management Fee otherwise known as “double dipping”. Other income in the Statement of operations and changes in net assets of the Global Balanced Risk Control Fund of Funds, of the Global Balanced Income Fund, Global Multi-Asset Income Fund and of the Liquid Alternatives Fund consists of such rebate.
The Funds are subject to the following:
i) Management Fee at the levels described above. The Management Fee covers the fees of the principal distributor and the Investment Adviser.
ii) A monthly Administration Charge at a maximum annual rate of 0.25% of the Funds’ aggregate average daily Net Asset Value attributable to all Classes of Shares of the Funds. The current fees are as follows:
Share Class Indicator Administration Charge
A, B, C and F 0.25%*I and Z 0.18%*S 0.10%E and N 0.10%
* Except for the US Dollar Liquidity Fund which charge 0.15%.
The Administration Charge will remain in force for an unlimited period and may be changed, subject to the maximum noted above, by the Company upon no less than one month’s prior written notice.
The Administration Charge will be utilised by the Company to pay the fees of the Administrator, the Transfer Agent, the Domiciliary Agent and the Management Company. The Funds will also pay other expenses incurred in the operation of the Company out of the Administration Charge including, without limitation, formation expenses of new Funds, the fees of the Custodian, expenses for legal and auditing services, cost of any proposed listings, maintaining such listings, reporting and publishing expenses (including preparing, printing, advertising and distributing Shareholders’ reports and prospectuses), the remuneration of the Directors including all reasonable out-of-pocket expenses, registration fees and other expenses due to supervisory authorities in various jurisdictions, insurance, interest, and the costs of publication of the Net Asset Value per Share, whether such publication is required for regulatory purposes or otherwise.
The Administration Charge for the period is disclosed in the Statement of operations and changes in net assets.
iii) Specific Additional Costs in addition to the Administration Charge, including, without limitation, taxe d’abonnement, additional custody fees applicable to investment in emerging markets, hedging expenses and the costs relating to the subsidiaries. These Specific Additional Costs will remain in force for an unlimited period and may be changed by the Management Company upon no less than one month’s prior
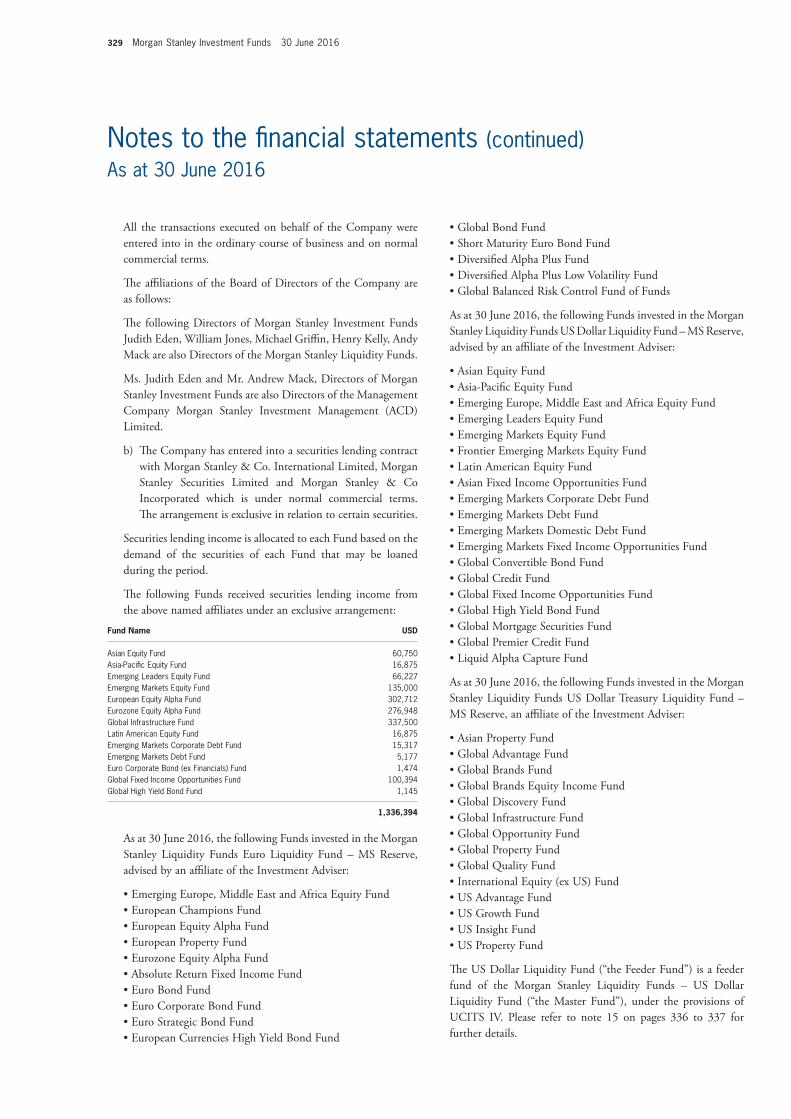
329 Morgan Stanley Investment Funds 30 June 2016
Notes to the financial statements (continued)As at 30 June 2016
• Global Bond Fund • Short Maturity Euro Bond Fund • Diversified Alpha Plus Fund • Diversified Alpha Plus Low Volatility Fund • Global Balanced Risk Control Fund of Funds
As at 30 June 2016, the following Funds invested in the Morgan Stanley Liquidity Funds US Dollar Liquidity Fund – MS Reserve, advised by an affiliate of the Investment Adviser:
• Asian Equity Fund • Asia-Pacific Equity Fund • Emerging Europe, Middle East and Africa Equity Fund • Emerging Leaders Equity Fund • Emerging Markets Equity Fund • Frontier Emerging Markets Equity Fund • Latin American Equity Fund • Asian Fixed Income Opportunities Fund • Emerging Markets Corporate Debt Fund • Emerging Markets Debt Fund • Emerging Markets Domestic Debt Fund • Emerging Markets Fixed Income Opportunities Fund • Global Convertible Bond Fund • Global Credit Fund • Global Fixed Income Opportunities Fund • Global High Yield Bond Fund • Global Mortgage Securities Fund • Global Premier Credit Fund • Liquid Alpha Capture Fund
As at 30 June 2016, the following Funds invested in the Morgan Stanley Liquidity Funds US Dollar Treasury Liquidity Fund – MS Reserve, an affiliate of the Investment Adviser:
• Asian Property Fund • Global Advantage Fund • Global Brands Fund • Global Brands Equity Income Fund • Global Discovery Fund • Global Infrastructure Fund • Global Opportunity Fund • Global Property Fund • Global Quality Fund • International Equity (ex US) Fund • US Advantage Fund • US Growth Fund • US Insight Fund • US Property Fund
The US Dollar Liquidity Fund (“the Feeder Fund”) is a feeder fund of the Morgan Stanley Liquidity Funds – US Dollar Liquidity Fund (“the Master Fund”), under the provisions of UCITS IV. Please refer to note 15 on pages 336 to 337 for further details.
All the transactions executed on behalf of the Company were entered into in the ordinary course of business and on normal commercial terms.
The affiliations of the Board of Directors of the Company are as follows:
The following Directors of Morgan Stanley Investment Funds Judith Eden, William Jones, Michael Griffin, Henry Kelly, Andy Mack are also Directors of the Morgan Stanley Liquidity Funds.
Ms. Judith Eden and Mr. Andrew Mack, Directors of Morgan Stanley Investment Funds are also Directors of the Management Company Morgan Stanley Investment Management (ACD) Limited.
b) The Company has entered into a securities lending contract with Morgan Stanley & Co. International Limited, Morgan Stanley Securities Limited and Morgan Stanley & Co Incorporated which is under normal commercial terms. The arrangement is exclusive in relation to certain securities.
Securities lending income is allocated to each Fund based on the demand of the securities of each Fund that may be loaned during the period.
The following Funds received securities lending income from the above named affiliates under an exclusive arrangement:
Fund Name USD
Asian Equity Fund 60,750Asia-Pacific Equity Fund 16,875Emerging Leaders Equity Fund 66,227Emerging Markets Equity Fund 135,000European Equity Alpha Fund 302,712Eurozone Equity Alpha Fund 276,948Global Infrastructure Fund 337,500Latin American Equity Fund 16,875Emerging Markets Corporate Debt Fund 15,317Emerging Markets Debt Fund 5,177Euro Corporate Bond (ex Financials) Fund 1,474Global Fixed Income Opportunities Fund 100,394Global High Yield Bond Fund 1,145
1,336,394
As at 30 June 2016, the following Funds invested in the Morgan Stanley Liquidity Funds Euro Liquidity Fund – MS Reserve, advised by an affiliate of the Investment Adviser:
• Emerging Europe, Middle East and Africa Equity Fund • European Champions Fund • European Equity Alpha Fund • European Property Fund • Eurozone Equity Alpha Fund • Absolute Return Fixed Income Fund • Euro Bond Fund • Euro Corporate Bond Fund • Euro Strategic Bond Fund • European Currencies High Yield Bond Fund

Morgan Stanley Investment Funds 30 June 2016 330
Notes to the financial statements (continued)As at 30 June 2016
Funds other than US Dollar Liquidity Fund – Discretionary Distributing Share Classes (Share Class Sub-Indicators “R” and “RM”)
For the Discretionary Distributing Share Classes of the Bond Funds, Equity Funds, Asset Allocation Funds and Alternative Investment Funds, the Company intends to declare dividends which will be set at the discretion of the Board of Directors of the Company. The Discretionary Distributing Share Class may pay distributions from capital or may charge all or part of the Fund’s fees and expenses to the capital of the Fund. Dividends paid out of capital amount to a return or withdrawal of part of a Shareholder’s original investment or from any capital gains attributable to that original investment. Such dividends may result in an immediate decrease of the Net Asset Value per Share. Where part or all of the fees and expenses of a Share Class are charged to the capital of that Share Class the result will be a reduction of the capital that the Share Class has available for investment in the future and capital may be eroded.
Frequency of Dividends
Equity Funds and Alternative Investment Funds – semi-annual dividend (Share Class Sub-Indicators “X” and “R”)
Both the Distributing Share Classes (Share Class Sub-Indicator “X”) and Discretionary Distributing Share Classes (Share Class Sub-Indicator “R”) aim to declare semi-annual dividends for Equity Funds (other than the Global Brands Equity Income Fund) and Alternative Investment Funds. Such dividends, if any, will be accrued on the last Dealing Day of June and December and declared on the next Dealing Day. The dividend declaration will be made public at the registered office of the Company and made available at the offices of the Transfer Agent on the first Dealing Day of July and January.
Bond Funds, Asset Allocation Funds and the Global Brands Equity Income Fund – quarterly dividend (Share Class Sub-Indicators “X” and “R”)
Both the Distributing Share Classes (Share Class Sub-Indicator “X”) and Discretionary Distributing Share Classes (Share Class Sub-Indicator “R”) aim to declare quarterly dividends for Bond Funds, Asset Allocation Funds and the Global Brands Equity Income Fund.
Such dividends, if any, will be accrued on the last Dealing Day of March, June, September and December and declared on the next Dealing Day. The dividend declaration, where issued, will be made public at the registered office of the Company and made available at the offices of the Transfer Agent on the first Dealing Day of January, April, July and October as applicable.
As at 30 June 2016, Morgan Stanley Investment Funds Global Balanced Income Fund, Morgan Stanley Investment Funds – Global Balanced Risk Control Fund of Funds, Morgan Stanley Investment Funds – Global Multi-Asset Income Fund and Morgan Stanley Investment Funds – Liquid Alternatives Fund invested in the Funds, advised by the Investment Adviser or an affiliate, detailed in note 14 on pages 335 to 336.
As at 30 June 2016, Morgan Stanley Investment Funds – Liquid Alternatives Fund invested in Fundlogic Alternatives plc – MS Ascend UCITS Fund Class P USD and Morgan Stanley Long Term Trends Fund Class B USD, affiliates of the Investment Adviser.
The Company has entered into OTC swaps transactions to which Morgan Stanley acts as counterparty.
5 DIVIDEND POLICY
The Company offers Accumulating Share Classes, Distributing Share Classes and Discretionary Distributing Share Classes.
Approach to declaring dividends
Funds other than US Dollar Liquidity Fund – Distributing Share Classes (Share Class Sub-Indicators “X” and “M”)
For the Distributing Share Classes of the Bond Funds, Equity Funds, Asset Allocation Funds and Alternative Investment Funds, the Company intends to declare dividends which will be equal to the net investment income attributable to such Classes (i.e. 100% of the net investment income).
For the Global Mortgage Securities Fund, net investment income is considered to include net realised gains and losses from prepaid principal on mortgaged-backed and asset-backed securities for the purpose of the dividend policy.
For the Global Balanced Income Fund and Global Multi-Asset Income Fund, net investment income is considered to include the net option premium received as a result of writing options for the purpose of the dividend policy.
For Global Brands Equity Income Fund, net investment income is considered to include income earned through receipt of premiums by taking exposure via one or more swaps to written options on equity securities and /or to indices for the purpose of the dividend policy.
US Dollar Liquidity Fund – Distributing Share Classes (Share Class Sub-Indicator “X”)
For the Distributing Share Classes of the US Dollar Liquidity Fund, the Company intends to declare dividends which will be equal to the net investment income attributable to such Classes and realised capital gains, reduced by realised losses, if any. In the case of the US Dollar Liquidity Fund, such dividends, if any, will be declared on each Dealing Day.
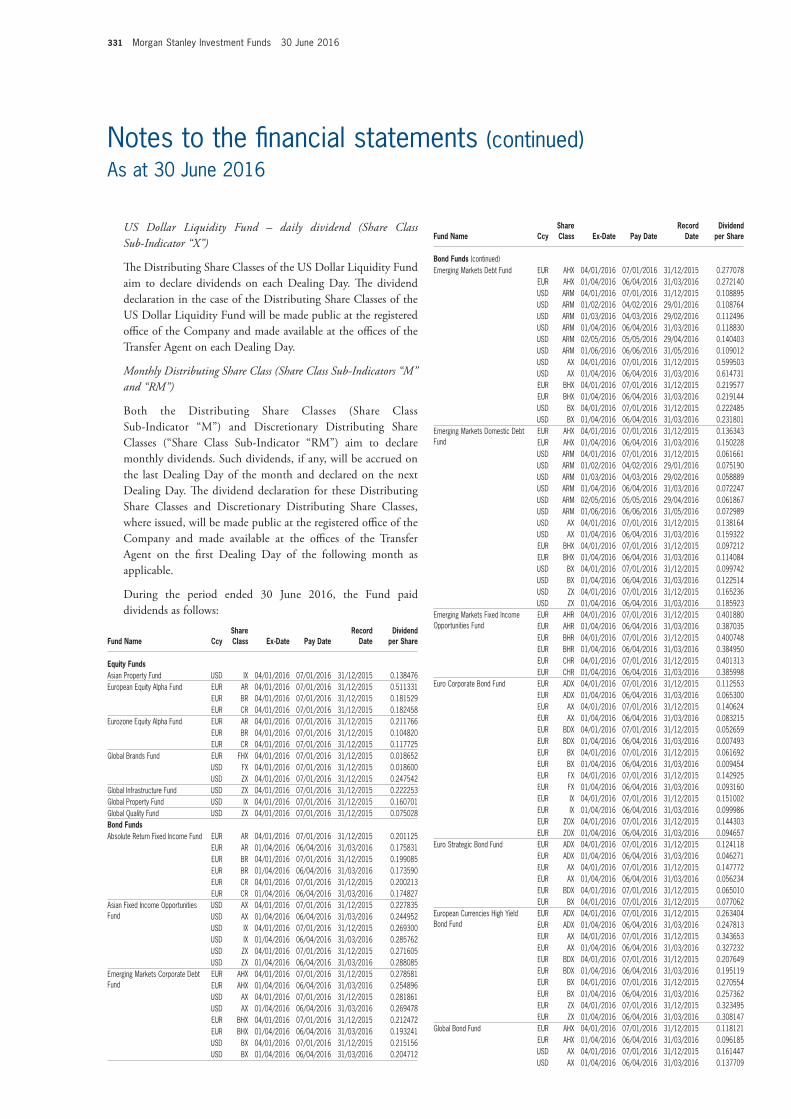
331 Morgan Stanley Investment Funds 30 June 2016
Notes to the financial statements (continued)As at 30 June 2016
Fund Name CcyShare Class Ex-Date Pay Date
Record Date
Dividend per Share
Bond Funds (continued)Emerging Markets Debt Fund EUR AHX 04/01/2016 07/01/2016 31/12/2015 0.277078
EUR AHX 01/04/2016 06/04/2016 31/03/2016 0.272140USD ARM 04/01/2016 07/01/2016 31/12/2015 0.108895USD ARM 01/02/2016 04/02/2016 29/01/2016 0.108764USD ARM 01/03/2016 04/03/2016 29/02/2016 0.112496USD ARM 01/04/2016 06/04/2016 31/03/2016 0.118830USD ARM 02/05/2016 05/05/2016 29/04/2016 0.140403USD ARM 01/06/2016 06/06/2016 31/05/2016 0.109012USD AX 04/01/2016 07/01/2016 31/12/2015 0.599503USD AX 01/04/2016 06/04/2016 31/03/2016 0.614731EUR BHX 04/01/2016 07/01/2016 31/12/2015 0.219577EUR BHX 01/04/2016 06/04/2016 31/03/2016 0.219144USD BX 04/01/2016 07/01/2016 31/12/2015 0.222485USD BX 01/04/2016 06/04/2016 31/03/2016 0.231801
Emerging Markets Domestic Debt Fund
EUR AHX 04/01/2016 07/01/2016 31/12/2015 0.136343EUR AHX 01/04/2016 06/04/2016 31/03/2016 0.150228USD ARM 04/01/2016 07/01/2016 31/12/2015 0.061661USD ARM 01/02/2016 04/02/2016 29/01/2016 0.075190USD ARM 01/03/2016 04/03/2016 29/02/2016 0.058889USD ARM 01/04/2016 06/04/2016 31/03/2016 0.072247USD ARM 02/05/2016 05/05/2016 29/04/2016 0.061867USD ARM 01/06/2016 06/06/2016 31/05/2016 0.072989USD AX 04/01/2016 07/01/2016 31/12/2015 0.138164USD AX 01/04/2016 06/04/2016 31/03/2016 0.159322EUR BHX 04/01/2016 07/01/2016 31/12/2015 0.097212EUR BHX 01/04/2016 06/04/2016 31/03/2016 0.114084USD BX 04/01/2016 07/01/2016 31/12/2015 0.099742USD BX 01/04/2016 06/04/2016 31/03/2016 0.122514USD ZX 04/01/2016 07/01/2016 31/12/2015 0.165236USD ZX 01/04/2016 06/04/2016 31/03/2016 0.185923
Emerging Markets Fixed Income Opportunities Fund
EUR AHR 04/01/2016 07/01/2016 31/12/2015 0.401880EUR AHR 01/04/2016 06/04/2016 31/03/2016 0.387035EUR BHR 04/01/2016 07/01/2016 31/12/2015 0.400748EUR BHR 01/04/2016 06/04/2016 31/03/2016 0.384950EUR CHR 04/01/2016 07/01/2016 31/12/2015 0.401313EUR CHR 01/04/2016 06/04/2016 31/03/2016 0.385998
Euro Corporate Bond Fund EUR ADX 04/01/2016 07/01/2016 31/12/2015 0.112553EUR ADX 01/04/2016 06/04/2016 31/03/2016 0.065300EUR AX 04/01/2016 07/01/2016 31/12/2015 0.140624EUR AX 01/04/2016 06/04/2016 31/03/2016 0.083215EUR BDX 04/01/2016 07/01/2016 31/12/2015 0.052659EUR BDX 01/04/2016 06/04/2016 31/03/2016 0.007493EUR BX 04/01/2016 07/01/2016 31/12/2015 0.061692EUR BX 01/04/2016 06/04/2016 31/03/2016 0.009454EUR FX 04/01/2016 07/01/2016 31/12/2015 0.142925EUR FX 01/04/2016 06/04/2016 31/03/2016 0.093160EUR IX 04/01/2016 07/01/2016 31/12/2015 0.151002EUR IX 01/04/2016 06/04/2016 31/03/2016 0.099986EUR ZOX 04/01/2016 07/01/2016 31/12/2015 0.144303EUR ZOX 01/04/2016 06/04/2016 31/03/2016 0.094657
Euro Strategic Bond Fund EUR ADX 04/01/2016 07/01/2016 31/12/2015 0.124118EUR ADX 01/04/2016 06/04/2016 31/03/2016 0.046271EUR AX 04/01/2016 07/01/2016 31/12/2015 0.147772EUR AX 01/04/2016 06/04/2016 31/03/2016 0.056234EUR BDX 04/01/2016 07/01/2016 31/12/2015 0.065010EUR BX 04/01/2016 07/01/2016 31/12/2015 0.077062
European Currencies High Yield Bond Fund
EUR ADX 04/01/2016 07/01/2016 31/12/2015 0.263404EUR ADX 01/04/2016 06/04/2016 31/03/2016 0.247813EUR AX 04/01/2016 07/01/2016 31/12/2015 0.343653EUR AX 01/04/2016 06/04/2016 31/03/2016 0.327232EUR BDX 04/01/2016 07/01/2016 31/12/2015 0.207649EUR BDX 01/04/2016 06/04/2016 31/03/2016 0.195119EUR BX 04/01/2016 07/01/2016 31/12/2015 0.270554EUR BX 01/04/2016 06/04/2016 31/03/2016 0.257362EUR ZX 04/01/2016 07/01/2016 31/12/2015 0.323495EUR ZX 01/04/2016 06/04/2016 31/03/2016 0.308147
Global Bond Fund EUR AHX 04/01/2016 07/01/2016 31/12/2015 0.118121EUR AHX 01/04/2016 06/04/2016 31/03/2016 0.096185USD AX 04/01/2016 07/01/2016 31/12/2015 0.161447USD AX 01/04/2016 06/04/2016 31/03/2016 0.137709
US Dollar Liquidity Fund – daily dividend (Share Class Sub-Indicator “X”)
The Distributing Share Classes of the US Dollar Liquidity Fund aim to declare dividends on each Dealing Day. The dividend declaration in the case of the Distributing Share Classes of the US Dollar Liquidity Fund will be made public at the registered office of the Company and made available at the offices of the Transfer Agent on each Dealing Day.
Monthly Distributing Share Class (Share Class Sub-Indicators “M” and “RM”)
Both the Distributing Share Classes (Share Class Sub-Indicator “M”) and Discretionary Distributing Share Classes (“Share Class Sub-Indicator “RM”) aim to declare monthly dividends. Such dividends, if any, will be accrued on the last Dealing Day of the month and declared on the next Dealing Day. The dividend declaration for these Distributing Share Classes and Discretionary Distributing Share Classes, where issued, will be made public at the registered office of the Company and made available at the offices of the Transfer Agent on the first Dealing Day of the following month as applicable.
During the period ended 30 June 2016, the Fund paid dividends as follows:
Fund Name CcyShare Class Ex-Date Pay Date
Record Date
Dividend per Share
Equity Funds Asian Property Fund USD IX 04/01/2016 07/01/2016 31/12/2015 0.138476European Equity Alpha Fund EUR AR 04/01/2016 07/01/2016 31/12/2015 0.511331
EUR BR 04/01/2016 07/01/2016 31/12/2015 0.181529EUR CR 04/01/2016 07/01/2016 31/12/2015 0.182458
Eurozone Equity Alpha Fund EUR AR 04/01/2016 07/01/2016 31/12/2015 0.211766EUR BR 04/01/2016 07/01/2016 31/12/2015 0.104820EUR CR 04/01/2016 07/01/2016 31/12/2015 0.117725
Global Brands Fund EUR FHX 04/01/2016 07/01/2016 31/12/2015 0.018652USD FX 04/01/2016 07/01/2016 31/12/2015 0.018600USD ZX 04/01/2016 07/01/2016 31/12/2015 0.247542
Global Infrastructure Fund USD ZX 04/01/2016 07/01/2016 31/12/2015 0.222253Global Property Fund USD IX 04/01/2016 07/01/2016 31/12/2015 0.160701Global Quality Fund USD ZX 04/01/2016 07/01/2016 31/12/2015 0.075028Bond FundsAbsolute Return Fixed Income Fund EUR AR 04/01/2016 07/01/2016 31/12/2015 0.201125
EUR AR 01/04/2016 06/04/2016 31/03/2016 0.175831EUR BR 04/01/2016 07/01/2016 31/12/2015 0.199085EUR BR 01/04/2016 06/04/2016 31/03/2016 0.173590EUR CR 04/01/2016 07/01/2016 31/12/2015 0.200213EUR CR 01/04/2016 06/04/2016 31/03/2016 0.174827
Asian Fixed Income Opportunities Fund
USD AX 04/01/2016 07/01/2016 31/12/2015 0.227835USD AX 01/04/2016 06/04/2016 31/03/2016 0.244952USD IX 04/01/2016 07/01/2016 31/12/2015 0.269300USD IX 01/04/2016 06/04/2016 31/03/2016 0.285762USD ZX 04/01/2016 07/01/2016 31/12/2015 0.271605USD ZX 01/04/2016 06/04/2016 31/03/2016 0.288085
Emerging Markets Corporate Debt Fund
EUR AHX 04/01/2016 07/01/2016 31/12/2015 0.278581EUR AHX 01/04/2016 06/04/2016 31/03/2016 0.254896USD AX 04/01/2016 07/01/2016 31/12/2015 0.281861USD AX 01/04/2016 06/04/2016 31/03/2016 0.269478EUR BHX 04/01/2016 07/01/2016 31/12/2015 0.212472EUR BHX 01/04/2016 06/04/2016 31/03/2016 0.193241USD BX 04/01/2016 07/01/2016 31/12/2015 0.215156USD BX 01/04/2016 06/04/2016 31/03/2016 0.204712

Morgan Stanley Investment Funds 30 June 2016 332
Notes to the financial statements (continued)As at 30 June 2016
Fund Name CcyShare Class Ex-Date Pay Date
Record Date
Dividend per Share
Asset Allocation FundsGlobal Balanced Income Fund EUR AR 04/01/2016 07/01/2016 31/12/2015 0.379692
EUR AR 01/04/2016 06/04/2016 31/03/2016 0.364636USD AHR 04/01/2016 07/01/2016 31/12/2015 0.376097USD AHR 01/04/2016 06/04/2016 31/03/2016 0.361698EUR BR 04/01/2016 07/01/2016 31/12/2015 0.372091EUR BR 01/04/2016 06/04/2016 31/03/2016 0.356446EUR CR 04/01/2016 07/01/2016 31/12/2015 0.373260EUR CR 01/04/2016 06/04/2016 31/03/2016 0.357834USD CHR 04/01/2016 07/01/2016 31/12/2015 0.382090USD CHR 01/04/2016 06/04/2016 31/03/2016 0.366845EUR IR 04/01/2016 07/01/2016 31/12/2015 0.386548EUR IR 01/04/2016 06/04/2016 31/03/2016 0.372393USD IHR 04/01/2016 07/01/2016 31/12/2015 0.384834USD IHR 01/04/2016 06/04/2016 31/03/2016 0.371251GBP ZHR 04/01/2016 07/01/2016 31/12/2015 0.369882GBP ZHR 01/04/2016 06/04/2016 31/03/2016 0.356606USD ZHR 04/01/2016 07/01/2016 31/12/2015 0.369447USD ZHR 01/04/2016 06/04/2016 31/03/2016 0.356468
Global Multi-Asset Income Fund USD AHR 04/01/2016 07/01/2016 31/12/2015 0.271075USD AHR 01/04/2016 06/04/2016 31/03/2016 0.271238EUR AR 04/01/2016 07/01/2016 31/12/2015 0.273035EUR AR 01/04/2016 06/04/2016 31/03/2016 0.260990EUR IR 04/01/2016 07/01/2016 31/12/2015 0.273410EUR IR 01/04/2016 06/04/2016 31/03/2016 0.262005
6 TAXATION
Under current law and practice, the Company is not liable to any Luxembourg income tax, or any Luxembourg capital gains tax on the realised capital appreciation of the assets of the Company nor are dividends paid by the Company liable to any Luxembourg withholding tax. The Company is, however, liable to annual subscription tax in Luxembourg (“taxe d’abonnement”) calculated at the rate of 0.05% of the Net Asset Value of the funds. Furthermore, the Company has sought the benefit of a reduced annual tax rate of 0.01% for Share Classes where the whole of the Share Class is held by institutional investors as provided by Article 174 of the 2010 Law, likely those Shares with Share Class Indicators N, S or Z. This tax is payable quarterly on the basis of the net assets of the relevant Funds, calculated at the end of the quarter to which the tax relates. No stamp or other tax will be payable in Luxembourg in connection with the issue of Shares of the Company, except a once and for all tax of EUR 1,239.47 which was paid upon incorporation.
Pursuant to Article 175 of the 2010 Law, subscription tax is not payable on the value of the assets of the Funds represented by investments in other Luxembourg undertakings for collective investment which are themselves subject to the subscription tax.
The Company is exempt from subscription tax in respect of the portion of the US Dollar Liquidity Fund (“the Feeder Fund”) invested in the Morgan Stanley Liquidity Funds - US Dollar Liquidity Fund (“the Master Fund”), which is itself subject to a subscription tax of 0.01%. For those Shares with Share Class Indicator Z of the Feeder Fund, any proportion of the assets of the Share Class which is not invested in the Master Fund shall be subject to the subscription tax at a rate of 0.01%. For all
Fund Name CcyShare Class Ex-Date Pay Date
Record Date
Dividend per Share
Bond Funds (continued)Global Bond Fund (continued) EUR BHX 04/01/2016 07/01/2016 31/12/2015 0.061222
EUR BHX 01/04/2016 06/04/2016 31/03/2016 0.042576USD BX 04/01/2016 07/01/2016 31/12/2015 0.064135USD BX 01/04/2016 06/04/2016 31/03/2016 0.047127
Global Convertible Bond Fund EUR ZXH 04/01/2016 07/01/2016 31/12/2015 0.067990EUR ZXH 01/04/2016 06/04/2016 31/03/2016 0.069342USD ZX 04/01/2016 07/01/2016 31/12/2015 0.053177USD ZX 01/04/2016 06/04/2016 31/03/2016 0.056006
Global Fixed Income Opportunities Fund
EUR AHR 04/01/2016 07/01/2016 31/12/2015 0.250074EUR AHR 01/04/2016 06/04/2016 31/03/2016 0.235074EUR AHX 04/01/2016 07/01/2016 31/12/2015 0.191672EUR AHX 01/04/2016 06/04/2016 31/03/2016 0.184032USD ARM 04/01/2016 07/01/2016 31/12/2015 0.079885USD ARM 01/02/2016 04/02/2016 29/01/2016 0.075704USD ARM 01/03/2016 04/03/2016 29/02/2016 0.082419USD ARM 01/04/2016 06/04/2016 31/03/2016 0.081323USD ARM 02/05/2016 05/05/2016 29/04/2016 0.075901USD ARM 01/06/2016 06/06/2016 31/05/2016 0.082209USD AX 04/01/2016 07/01/2016 31/12/2015 0.195281USD AX 01/04/2016 06/04/2016 31/03/2016 0.195610EUR BHR 04/01/2016 07/01/2016 31/12/2015 0.245778EUR BHR 01/04/2016 06/04/2016 31/03/2016 0.230438EUR BHX 04/01/2016 07/01/2016 31/12/2015 0.124276EUR BHX 01/04/2016 06/04/2016 31/03/2016 0.122104USD BX 04/01/2016 07/01/2016 31/12/2015 0.127463USD BX 01/04/2016 06/04/2016 31/03/2016 0.130567EUR CHR 04/01/2016 07/01/2016 31/12/2015 0.248120EUR CHR 01/04/2016 06/04/2016 31/03/2016 0.232972EUR CHX 04/01/2016 07/01/2016 31/12/2015 0.147075EUR CHX 01/04/2016 06/04/2016 31/03/2016 0.142354USD IX 04/01/2016 07/01/2016 31/12/2015 0.208263USD IX 01/04/2016 06/04/2016 31/03/2016 0.206414GBP ZHX 04/01/2016 07/01/2016 31/12/2015 0.221562EUR ZHX 01/04/2016 06/04/2016 31/03/2016 0.033762GBP ZHX 01/04/2016 06/04/2016 31/03/2016 0.213064USD ZX 04/01/2016 07/01/2016 31/12/2015 0.215085USD ZX 01/04/2016 06/04/2016 31/03/2016 0.213739
Global High Yield Bond Fund EUR AHX 04/01/2016 07/01/2016 31/12/2015 0.398182EUR AHX 01/04/2016 06/04/2016 31/03/2016 0.393038USD AX 04/01/2016 07/01/2016 31/12/2015 0.405022USD AX 01/04/2016 06/04/2016 31/03/2016 0.416367EUR BHX 04/01/2016 07/01/2016 31/12/2015 0.331485EUR BHX 01/04/2016 06/04/2016 31/03/2016 0.333775USD BX 04/01/2016 07/01/2016 31/12/2015 0.337747USD BX 01/04/2016 06/04/2016 31/03/2016 0.353924USD IX 04/01/2016 07/01/2016 31/12/2015 0.346685USD IX 01/04/2016 06/04/2016 31/03/2016 0.353766
Global Mortgage Securities Fund EUR BHR 04/01/2016 07/01/2016 31/12/2015 0.227515EUR BHR 01/04/2016 06/04/2016 31/03/2016 0.210474EUR BHX 04/01/2016 07/01/2016 31/12/2015 0.080266EUR BHX 01/04/2016 06/04/2016 31/03/2016 0.093918EUR CHX 04/01/2016 07/01/2016 31/12/2015 0.106658EUR CHX 01/04/2016 06/04/2016 31/03/2016 0.118818USD CX 04/01/2016 07/01/2016 31/12/2015 0.109360USD CX 01/04/2016 06/04/2016 31/03/2016 0.125562EUR IHX 04/01/2016 07/01/2016 31/12/2015 0.178991EUR IHX 01/04/2016 06/04/2016 31/03/2016 0.186560
Global Premier Credit Fund USD ZX 04/01/2016 07/01/2016 31/12/2015 0.158529USD ZX 01/04/2016 06/04/2016 31/03/2016 0.116936
US Dollar High Yield Bond Fund USD AX 04/01/2016 07/01/2016 31/12/2015 0.371826USD AX 01/04/2016 06/04/2016 31/03/2016 0.369589USD BX 04/01/2016 07/01/2016 31/12/2015 0.310540USD BX 01/04/2016 06/04/2016 31/03/2016 0.312885USD CX 04/01/2016 07/01/2016 31/12/2015 0.344212USD CX 01/04/2016 06/04/2016 31/03/2016 0.344077
US Dollar Short Duration High Yield Bond Fund
USD AX 04/01/2016 07/01/2016 31/12/2015 0.371127USD AX 01/04/2016 06/04/2016 31/03/2016 0.371567USD BX 04/01/2016 07/01/2016 31/12/2015 0.309977USD BX 01/04/2016 06/04/2016 31/03/2016 0.314690USD CX 04/01/2016 07/01/2016 31/12/2015 0.352747USD CX 01/04/2016 06/04/2016 31/03/2016 0.354500

333 Morgan Stanley Investment Funds 30 June 2016
Notes to the financial statements (continued)As at 30 June 2016
Currency
RUB 64.269 = $1.00SEK 8.485 = $1.00SGD 1.348 = $1.00THB 35.127 = $1.00TRY 2.885 = $1.00TWD 32.264 = $1.00TZS 2,190.000 = $1.00VND 22,304.000 = $1.00ZAR 14.717 = $1.00
* Rates of exchange used to translate the Statement of operations and changes in net assets into US dollars.
8 SOFT COMMISSION ARRANGEMENTS
During the period ended 30 June 2016, the Investment Adviser entered into soft commission arrangements with brokers relating to the sub-funds which invest in equity securities. As a result of these arrangements, investment research services were received and used as part of the investment decision making process in the management of the sub-funds concerned. These research services must be substantive in nature (i.e. they must assist in helping the portfolio manager in reaching an investment decision) and include both detailed research produced for all of the broker’s clients as well as tailored research developed at the Investment Adviser’s own request.
There is an adequate control process at the Investment Adviser to ensure that ineligible services remain outside the scope of any soft commission arrangements with brokers.
The sub-funds that entered into soft commission arrangements for the period ended 30 June 2016 were as follows:
• Asia Opportunity Fund • Asian Equity Fund • Asia-Pacific Equity Fund • Asian Property Fund • Breakout Nations Fund • Emerging Europe, Middle East and Africa Equity Fund • Emerging Leaders Equity Fund • Emerging Markets Equity Fund • European Champions Fund • European Equity Alpha Fund • European Property Fund • Eurozone Equity Alpha Fund • Frontier Emerging Markets Equity Fund • Global Advantage Fund • Global Brands Fund • Global Brands Equity Income Fund • Global Discovery Fund • Global Infrastructure Fund • Global Opportunity fund • Global Property Fund • Global Quality Fund • Indian Equity Fund • International (ex US) Equity Fund • Latin American Equity Fund
other Share Classes of the Feeder Fund any portion of the assets of the Share Class not invested in the Master Fund will be subject to the subscription tax of 0.05%. Please refer to note 15 for further details about the Feeder Fund and the Master Fund.
Subscription tax is calculated by reference to the net assets of the relevant fund or share class at the end of each quarter. Subscription tax will be paid from the tax d’abonnement Specific Additional Cost described in the prospectus. Any difference between the Specific Additional Costs collected and the tax payable will be paid by or credited to the Management Company.
Dividends, interest and capital gains on securities held by the Company may be subject to non-recoverable withholding tax or capital gains tax in the country of origin.
7 RATES OF EXCHANGE
The rates of exchange used for translation into US Dollars of Statement of assets and liabilities and Statement of operations and changes in net assets, including securities and foreign currency holdings, as of 30 June 2016 were:
Currency
AED 3.673 = $1.00ARS 14.917 = $1.00AUD 1.345 = $1.00BDT 78.400 = $1.00BRL 3.211 = $1.00CAD 1.299 = $1.00CHF 0.975 = $1.00CLP 662.460 = $1.00CNH 6.670 = $1.00CNY 6.642 = $1.00COP 2,928.500 = $1.00CZK 24.386 = $1.00DKK 6.693 = $1.00EGP 8.880 = $1.00EUR 0.900 = $1.00EUR* 0.896 = $1.00GBP 0.744 = $1.00HKD 7.759 = $1.00HUF 284.940 = $1.00IDR 13,213.000 = $1.00ILS 3.851 = $1.00INR 67.525 = $1.00ITL 1,741.565 = $1.00JPY 102.780 = $1.00JPY* 111.421 = $1.00KES 101.100 = $1.00KRW 1,151.310 = $1.00KWD 0.302 = $1.00LKR 145.615 = $1.00MAD 9.777 = $1.00MXN 18.529 = $1.00MYR 4.028 = $1.00NGN 282.750 = $1.00NOK 8.375 = $1.00NZD 1.407 = $1.00OMR 0.385 = $1.00PEN 3.293 = $1.00PHP 47.093 = $1.00PKR 104.750 = $1.00PLN 3.974 = $1.00QAR 3.642 = $1.00RON 4.067 = $1.00
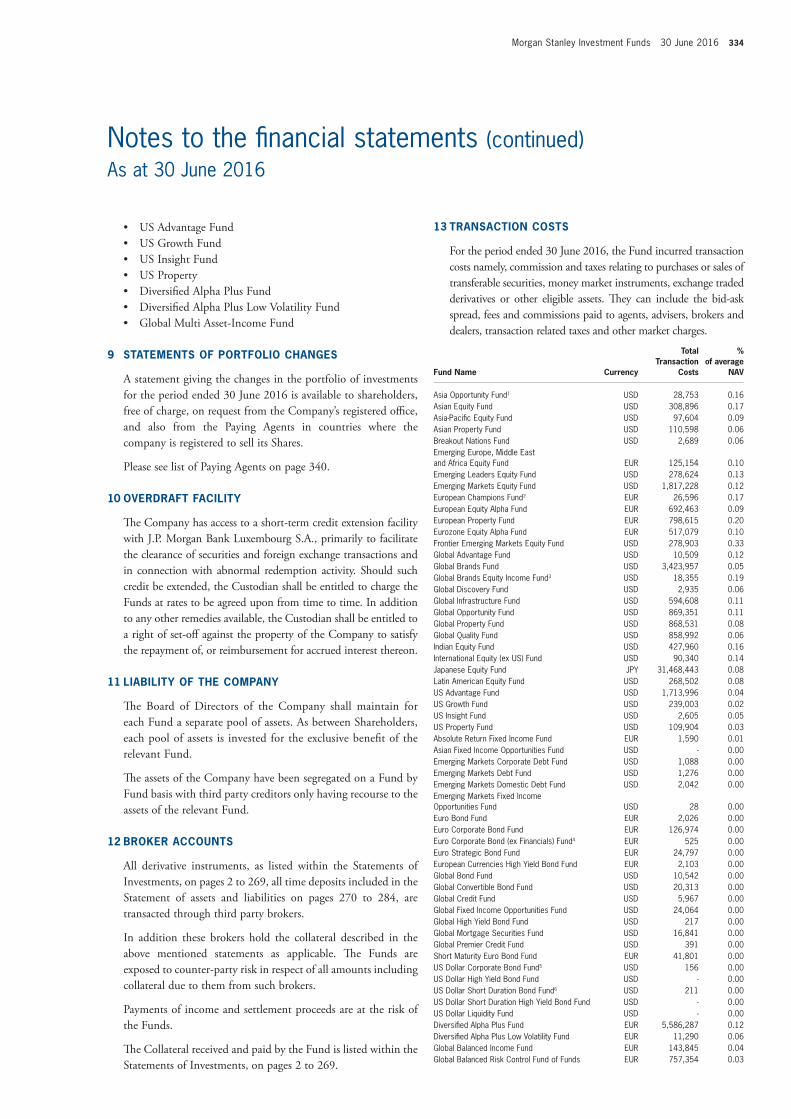
Morgan Stanley Investment Funds 30 June 2016 334
Notes to the financial statements (continued)As at 30 June 2016
13 TRANSACTION COSTS
For the period ended 30 June 2016, the Fund incurred transaction costs namely, commission and taxes relating to purchases or sales of transferable securities, money market instruments, exchange traded derivatives or other eligible assets. They can include the bid-ask spread, fees and commissions paid to agents, advisers, brokers and dealers, transaction related taxes and other market charges.
Fund Name Currency
Total Transaction
Costs
% of average
NAV
Asia Opportunity Fund1 USD 28,753 0.16Asian Equity Fund USD 308,896 0.17Asia-Pacific Equity Fund USD 97,604 0.09Asian Property Fund USD 110,598 0.06Breakout Nations Fund USD 2,689 0.06Emerging Europe, Middle East and Africa Equity Fund EUR 125,154 0.10Emerging Leaders Equity Fund USD 278,624 0.13Emerging Markets Equity Fund USD 1,817,228 0.12European Champions Fund2 EUR 26,596 0.17European Equity Alpha Fund EUR 692,463 0.09European Property Fund EUR 798,615 0.20Eurozone Equity Alpha Fund EUR 517,079 0.10Frontier Emerging Markets Equity Fund USD 278,903 0.33Global Advantage Fund USD 10,509 0.12Global Brands Fund USD 3,423,957 0.05Global Brands Equity Income Fund3 USD 18,355 0.19Global Discovery Fund USD 2,935 0.06Global Infrastructure Fund USD 594,608 0.11Global Opportunity Fund USD 869,351 0.11Global Property Fund USD 868,531 0.08Global Quality Fund USD 858,992 0.06Indian Equity Fund USD 427,960 0.16International Equity (ex US) Fund USD 90,340 0.14Japanese Equity Fund JPY 31,468,443 0.08Latin American Equity Fund USD 268,502 0.08US Advantage Fund USD 1,713,996 0.04US Growth Fund USD 239,003 0.02US Insight Fund USD 2,605 0.05US Property Fund USD 109,904 0.03Absolute Return Fixed Income Fund EUR 1,590 0.01Asian Fixed Income Opportunities Fund USD - 0.00Emerging Markets Corporate Debt Fund USD 1,088 0.00Emerging Markets Debt Fund USD 1,276 0.00Emerging Markets Domestic Debt Fund USD 2,042 0.00Emerging Markets Fixed Income Opportunities Fund USD 28 0.00Euro Bond Fund EUR 2,026 0.00Euro Corporate Bond Fund EUR 126,974 0.00Euro Corporate Bond (ex Financials) Fund4 EUR 525 0.00Euro Strategic Bond Fund EUR 24,797 0.00European Currencies High Yield Bond Fund EUR 2,103 0.00Global Bond Fund USD 10,542 0.00Global Convertible Bond Fund USD 20,313 0.00Global Credit Fund USD 5,967 0.00Global Fixed Income Opportunities Fund USD 24,064 0.00Global High Yield Bond Fund USD 217 0.00Global Mortgage Securities Fund USD 16,841 0.00Global Premier Credit Fund USD 391 0.00Short Maturity Euro Bond Fund EUR 41,801 0.00US Dollar Corporate Bond Fund5 USD 156 0.00US Dollar High Yield Bond Fund USD - 0.00US Dollar Short Duration Bond Fund6 USD 211 0.00US Dollar Short Duration High Yield Bond Fund USD - 0.00US Dollar Liquidity Fund USD - 0.00Diversified Alpha Plus Fund EUR 5,586,287 0.12Diversified Alpha Plus Low Volatility Fund EUR 11,290 0.06Global Balanced Income Fund EUR 143,845 0.04Global Balanced Risk Control Fund of Funds EUR 757,354 0.03
• US Advantage Fund • US Growth Fund • US Insight Fund • US Property • Diversified Alpha Plus Fund • Diversified Alpha Plus Low Volatility Fund • Global Multi Asset-Income Fund
9 STATEMENTS OF PORTFOLIO CHANGES
A statement giving the changes in the portfolio of investments for the period ended 30 June 2016 is available to shareholders, free of charge, on request from the Company’s registered office, and also from the Paying Agents in countries where the company is registered to sell its Shares.
Please see list of Paying Agents on page 340.
10 OVERDRAFT FACILITY
The Company has access to a short-term credit extension facility with J.P. Morgan Bank Luxembourg S.A., primarily to facilitate the clearance of securities and foreign exchange transactions and in connection with abnormal redemption activity. Should such credit be extended, the Custodian shall be entitled to charge the Funds at rates to be agreed upon from time to time. In addition to any other remedies available, the Custodian shall be entitled to a right of set-off against the property of the Company to satisfy the repayment of, or reimbursement for accrued interest thereon.
11 LIABILITY OF THE COMPANY
The Board of Directors of the Company shall maintain for each Fund a separate pool of assets. As between Shareholders, each pool of assets is invested for the exclusive benefit of the relevant Fund.
The assets of the Company have been segregated on a Fund by Fund basis with third party creditors only having recourse to the assets of the relevant Fund.
12 BROKER ACCOUNTS
All derivative instruments, as listed within the Statements of Investments, on pages 2 to 269, all time deposits included in the Statement of assets and liabilities on pages 270 to 284, are transacted through third party brokers.
In addition these brokers hold the collateral described in the above mentioned statements as applicable. The Funds are exposed to counter-party risk in respect of all amounts including collateral due to them from such brokers.
Payments of income and settlement proceeds are at the risk of the Funds.
The Collateral received and paid by the Fund is listed within the Statements of Investments, on pages 2 to 269.
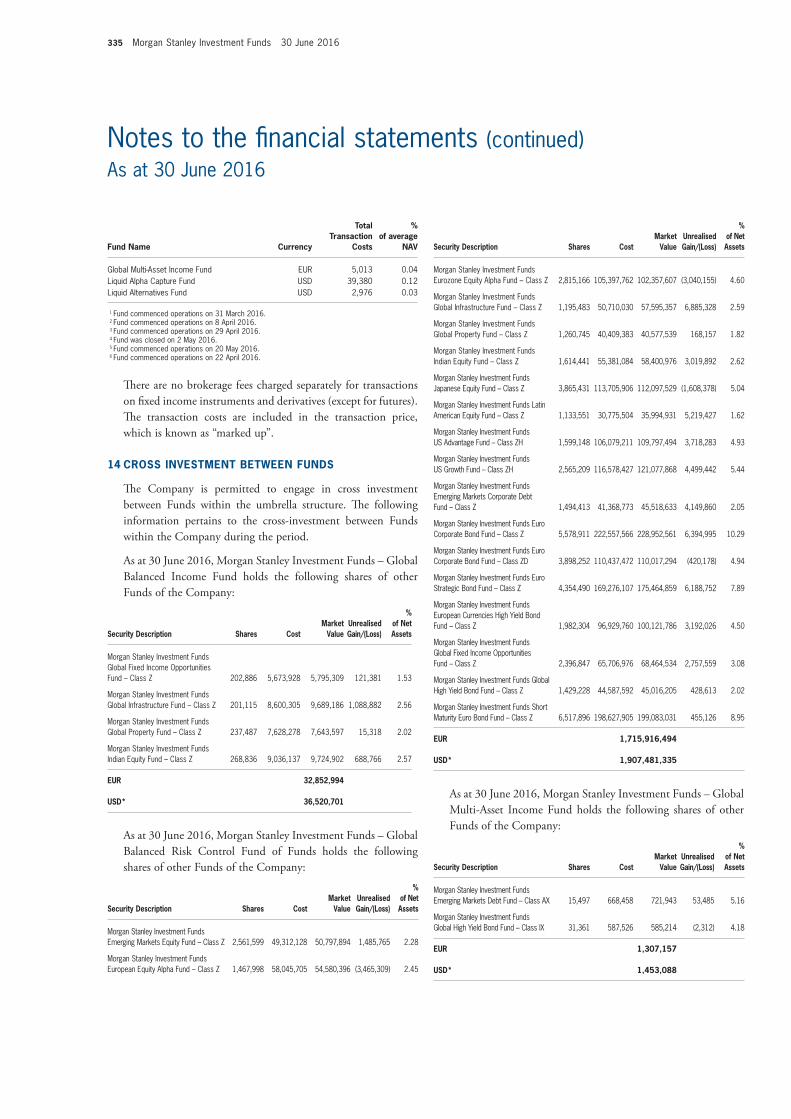
335 Morgan Stanley Investment Funds 30 June 2016
Notes to the financial statements (continued)As at 30 June 2016
Security Description Shares CostMarket
ValueUnrealised Gain/(Loss)
% of Net Assets
Morgan Stanley Investment Funds Eurozone Equity Alpha Fund – Class Z 2,815,166 105,397,762 102,357,607 (3,040,155) 4.60
Morgan Stanley Investment Funds Global Infrastructure Fund – Class Z 1,195,483 50,710,030 57,595,357 6,885,328 2.59
Morgan Stanley Investment Funds Global Property Fund – Class Z 1,260,745 40,409,383 40,577,539 168,157 1.82
Morgan Stanley Investment Funds Indian Equity Fund – Class Z 1,614,441 55,381,084 58,400,976 3,019,892 2.62
Morgan Stanley Investment Funds Japanese Equity Fund – Class Z 3,865,431 113,705,906 112,097,529 (1,608,378) 5.04
Morgan Stanley Investment Funds Latin American Equity Fund – Class Z 1,133,551 30,775,504 35,994,931 5,219,427 1.62
Morgan Stanley Investment Funds US Advantage Fund – Class ZH 1,599,148 106,079,211 109,797,494 3,718,283 4.93
Morgan Stanley Investment Funds US Growth Fund – Class ZH 2,565,209 116,578,427 121,077,868 4,499,442 5.44
Morgan Stanley Investment Funds Emerging Markets Corporate Debt Fund – Class Z 1,494,413 41,368,773 45,518,633 4,149,860 2.05
Morgan Stanley Investment Funds Euro Corporate Bond Fund – Class Z 5,578,911 222,557,566 228,952,561 6,394,995 10.29
Morgan Stanley Investment Funds Euro Corporate Bond Fund – Class ZD 3,898,252 110,437,472 110,017,294 (420,178) 4.94
Morgan Stanley Investment Funds Euro Strategic Bond Fund – Class Z 4,354,490 169,276,107 175,464,859 6,188,752 7.89
Morgan Stanley Investment Funds European Currencies High Yield Bond Fund – Class Z 1,982,304 96,929,760 100,121,786 3,192,026 4.50
Morgan Stanley Investment Funds Global Fixed Income Opportunities Fund – Class Z 2,396,847 65,706,976 68,464,534 2,757,559 3.08
Morgan Stanley Investment Funds Global High Yield Bond Fund – Class Z 1,429,228 44,587,592 45,016,205 428,613 2.02
Morgan Stanley Investment Funds Short Maturity Euro Bond Fund – Class Z 6,517,896 198,627,905 199,083,031 455,126 8.95
EUR 1,715,916,494
USD* 1,907,481,335
As at 30 June 2016, Morgan Stanley Investment Funds – Global Multi-Asset Income Fund holds the following shares of other Funds of the Company:
Security Description Shares CostMarket
ValueUnrealised Gain/(Loss)
% of Net Assets
Morgan Stanley Investment Funds Emerging Markets Debt Fund – Class AX 15,497 668,458 721,943 53,485 5.16
Morgan Stanley Investment Funds Global High Yield Bond Fund – Class IX 31,361 587,526 585,214 (2,312) 4.18
EUR 1,307,157
USD* 1,453,088
Fund Name Currency
Total Transaction
Costs
% of average
NAV
Global Multi-Asset Income Fund EUR 5,013 0.04Liquid Alpha Capture Fund USD 39,380 0.12Liquid Alternatives Fund USD 2,976 0.03
1 Fund commenced operations on 31 March 2016. 2 Fund commenced operations on 8 April 2016. 3 Fund commenced operations on 29 April 2016. 4 Fund was closed on 2 May 2016. 5 Fund commenced operations on 20 May 2016. 6 Fund commenced operations on 22 April 2016.
There are no brokerage fees charged separately for transactions on fixed income instruments and derivatives (except for futures). The transaction costs are included in the transaction price, which is known as “marked up”.
14 CROSS INVESTMENT BETWEEN FUNDS
The Company is permitted to engage in cross investment between Funds within the umbrella structure. The following information pertains to the cross-investment between Funds within the Company during the period.
As at 30 June 2016, Morgan Stanley Investment Funds – Global Balanced Income Fund holds the following shares of other Funds of the Company:
Security Description Shares CostMarket
ValueUnrealised Gain/(Loss)
% of Net Assets
Morgan Stanley Investment Funds Global Fixed Income Opportunities Fund – Class Z 202,886 5,673,928 5,795,309 121,381 1.53
Morgan Stanley Investment Funds Global Infrastructure Fund – Class Z 201,115 8,600,305 9,689,186 1,088,882 2.56
Morgan Stanley Investment Funds Global Property Fund – Class Z 237,487 7,628,278 7,643,597 15,318 2.02
Morgan Stanley Investment Funds Indian Equity Fund – Class Z 268,836 9,036,137 9,724,902 688,766 2.57
EUR 32,852,994
USD* 36,520,701
As at 30 June 2016, Morgan Stanley Investment Funds – Global Balanced Risk Control Fund of Funds holds the following shares of other Funds of the Company:
Security Description Shares CostMarket
ValueUnrealised Gain/(Loss)
% of Net Assets
Morgan Stanley Investment Funds Emerging Markets Equity Fund – Class Z 2,561,599 49,312,128 50,797,894 1,485,765 2.28
Morgan Stanley Investment Funds European Equity Alpha Fund – Class Z 1,467,998 58,045,705 54,580,396 (3,465,309) 2.45
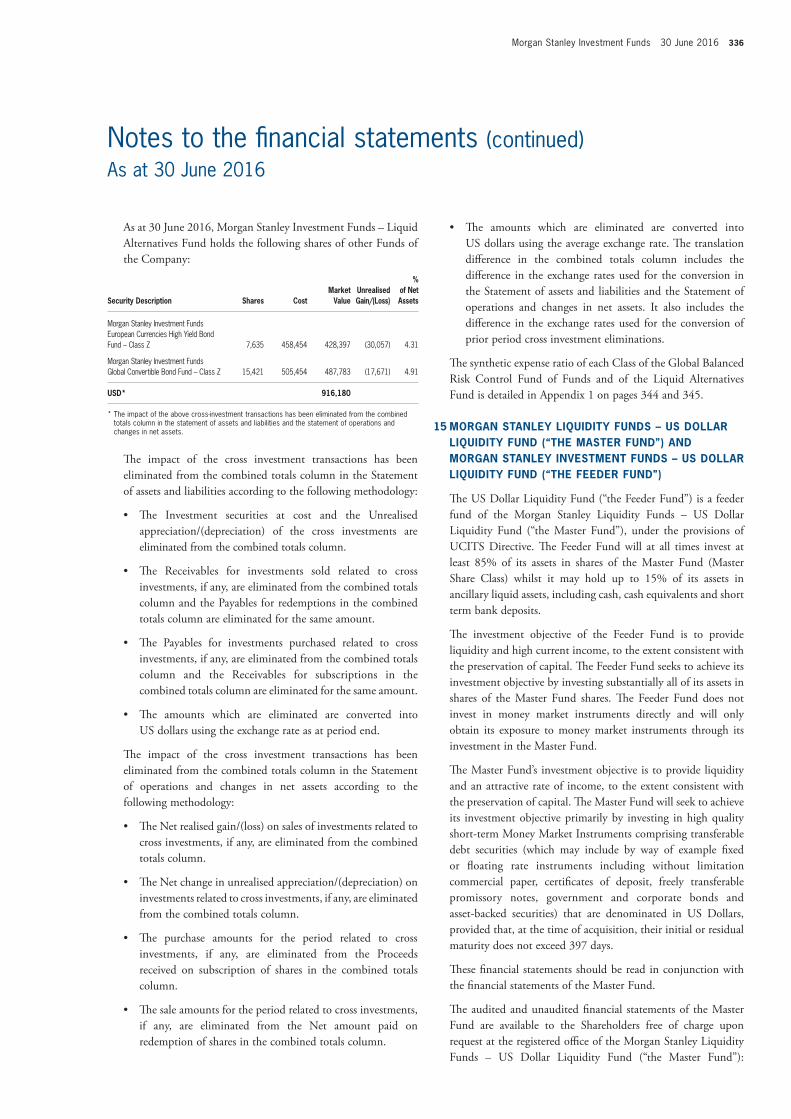
Morgan Stanley Investment Funds 30 June 2016 336
Notes to the financial statements (continued)As at 30 June 2016
• The amounts which are eliminated are converted into US dollars using the average exchange rate. The translation difference in the combined totals column includes the difference in the exchange rates used for the conversion in the Statement of assets and liabilities and the Statement of operations and changes in net assets. It also includes the difference in the exchange rates used for the conversion of prior period cross investment eliminations.
The synthetic expense ratio of each Class of the Global Balanced Risk Control Fund of Funds and of the Liquid Alternatives Fund is detailed in Appendix 1 on pages 344 and 345.
15 MORGAN STANLEY LIQUIDITY FUNDS – US DOLLAR LIQUIDITY FUND (“THE MASTER FUND”) AND MORGAN STANLEY INVESTMENT FUNDS – US DOLLAR LIQUIDITY FUND (“THE FEEDER FUND”)
The US Dollar Liquidity Fund (“the Feeder Fund”) is a feeder fund of the Morgan Stanley Liquidity Funds – US Dollar Liquidity Fund (“the Master Fund”), under the provisions of UCITS Directive. The Feeder Fund will at all times invest at least 85% of its assets in shares of the Master Fund (Master Share Class) whilst it may hold up to 15% of its assets in ancillary liquid assets, including cash, cash equivalents and short term bank deposits.
The investment objective of the Feeder Fund is to provide liquidity and high current income, to the extent consistent with the preservation of capital. The Feeder Fund seeks to achieve its investment objective by investing substantially all of its assets in shares of the Master Fund shares. The Feeder Fund does not invest in money market instruments directly and will only obtain its exposure to money market instruments through its investment in the Master Fund.
The Master Fund’s investment objective is to provide liquidity and an attractive rate of income, to the extent consistent with the preservation of capital. The Master Fund will seek to achieve its investment objective primarily by investing in high quality short-term Money Market Instruments comprising transferable debt securities (which may include by way of example fixed or floating rate instruments including without limitation commercial paper, certificates of deposit, freely transferable promissory notes, government and corporate bonds and asset-backed securities) that are denominated in US Dollars, provided that, at the time of acquisition, their initial or residual maturity does not exceed 397 days.
These financial statements should be read in conjunction with the financial statements of the Master Fund.
The audited and unaudited financial statements of the Master Fund are available to the Shareholders free of charge upon request at the registered office of the Morgan Stanley Liquidity Funds – US Dollar Liquidity Fund (“the Master Fund”):
As at 30 June 2016, Morgan Stanley Investment Funds – Liquid Alternatives Fund holds the following shares of other Funds of the Company:
Security Description Shares CostMarket
ValueUnrealised Gain/(Loss)
% of Net Assets
Morgan Stanley Investment Funds European Currencies High Yield Bond Fund – Class Z 7,635 458,454 428,397 (30,057) 4.31
Morgan Stanley Investment Funds Global Convertible Bond Fund – Class Z 15,421 505,454 487,783 (17,671) 4.91
USD* 916,180
* The impact of the above cross-investment transactions has been eliminated from the combined totals column in the statement of assets and liabilities and the statement of operations and changes in net assets.
The impact of the cross investment transactions has been eliminated from the combined totals column in the Statement of assets and liabilities according to the following methodology:
• The Investment securities at cost and the Unrealised appreciation/(depreciation) of the cross investments are eliminated from the combined totals column.
• The Receivables for investments sold related to cross investments, if any, are eliminated from the combined totals column and the Payables for redemptions in the combined totals column are eliminated for the same amount.
• The Payables for investments purchased related to cross investments, if any, are eliminated from the combined totals column and the Receivables for subscriptions in the combined totals column are eliminated for the same amount.
• The amounts which are eliminated are converted into US dollars using the exchange rate as at period end.
The impact of the cross investment transactions has been eliminated from the combined totals column in the Statement of operations and changes in net assets according to the following methodology:
• The Net realised gain/(loss) on sales of investments related to cross investments, if any, are eliminated from the combined totals column.
• The Net change in unrealised appreciation/(depreciation) on investments related to cross investments, if any, are eliminated from the combined totals column.
• The purchase amounts for the period related to cross investments, if any, are eliminated from the Proceeds received on subscription of shares in the combined totals column.
• The sale amounts for the period related to cross investments, if any, are eliminated from the Net amount paid on redemption of shares in the combined totals column.

337 Morgan Stanley Investment Funds 30 June 2016
Notes to the financial statements (continued)As at 30 June 2016
6B, route de Trèves, L-2633 Senningerberg, Grand Duchy of Luxembourg. The Master Fund’s accounting year begins on 1 April and ends on 31 March of each year.
As of 30 June 2016, the Feeder Fund holds 33.24% of the net asset value of the Master Fund, and 100% of the Master Share Class.
For the period ended 30 June 2016, the aggregated total expenses of the Feeder Fund and the Master Fund are USD 11,812,296.
The synthetic expense ratio of each Class of the Feeder Fund is detailed in Appendix 1 on page 344. The total expense ratio of the Master Fund (Master Share Class) is 0.01%.
16 SWING PRICING
To the extent that the Board of Directors of the Company consider that it is in the best interests of Shareholders, taking into account factors including the prevailing market conditions, the level of subscriptions and redemptions in a particular Fund and the size of the Fund, the Board of Directors of the Company may decide to adjust the Net Asset Value of a Fund to reflect the estimated dealing spreads, costs and charges (“Swing Factor”) to be incurred by the Fund in liquidating or purchasing investments to satisfy the net transactions received in respect of a particular day.
Under normal market circumstances, the Swing Factor shall not exceed 1% of the Net Asset Value of the relevant Fund on the relevant day. When net subscriptions in a Fund exceed a certain threshold on a given day, the Net Asset Value is adjusted upwards by the Swing Factor. Similarly, when net redemptions in a Fund exceed a certain threshold on a given day, the Net Asset Value of the Fund is adjusted downwards by the Swing Factor.
As at 30 June 2016, the net asset value of the Frontier Emerging Markets Equity Fund, Emerging Markets Corporate Debt Fund and of the European Currencies High Yield Bond Fund was swung because of a large subscription and redemption exceeding the threshold.
The official Net Asset Value per Share as at period-end, disclosed in the Statement of share and net assets statistics therefore includes a Swing Pricing adjustment, which is not recognised in the Statement of assets and liabilities and the Statement of operations and changes in net assets.
17 INDEMNIFICATIONS
The Company has arrangements in place for the indemnification of the members of its Board of Directors, and of its service providers (the “Indemnified Parties”) in certain circumstances, which exclude the Indemnified Parties’ own negligence, wilful default, or fraud. The Company’s service providers include the Management Company, the Investment Advisers,
the Sub-Investment Advisers, the Custodian, the Administrator and Paying Agent, the Distributor and the Registrar and Transfer Agent.
18 DIRECTORS’ REMUNERATION
The Directors of the Company were entitled to a remuneration at an annual rate of EUR 50,000 per director. The Administration charge will be utilised to pay the renumeration of the Directors including reasonable out-of-pocket expenses. Directors fees remain ultimately subject to approval by the Company’s shareholders.
19 SUBSEQUENT EVENTS
The following significant changes were made after period end:
Anti-Dilution Measures:
As outlined in prospectus dated June 2016, a decision was made by the Board of the Directors of the Company to increase the Swing Factor from a maximum of 1% of the Net Asset Value to a maximum of 2% of the Net Asset Value of the relevant Fund on the relevant Dealing Day. Further, the Management Company’s ability to use a separate anti-dilution charge has been removed. These changes will be effective as of 12th August 2016.
Launched Funds
Effective 5 July 2016, Morgan Stanley Investment Funds – US Active Factor Equity Fund commenced operations.
Effective 12 July 2016, Morgan Stanley Investment Funds – Global Active Factor Equity Fund commenced operations.
Effective 16 August 2016, Morgan Stanley Investment Funds – Global Balanced Fund commenced operations.
Morgan Stanley Investment Funds – Global Balanced Defensive Fund to commence operations on or around 23 August 2016.
Launched Classes
Fund Name Share Class Date
US Active Factor Equity Fund A 5 July 2016US Active Factor Equity Fund B 5 July 2016US Active Factor Equity Fund C 5 July 2016US Active Factor Equity Fund I 5 July 2016US Active Factor Equity Fund Z 5 July 2016US Active Factor Equity Fund AH (EUR) 5 July 2016US Active Factor Equity Fund BH (EUR) 5 July 2016US Active Factor Equity Fund CH (EUR) 5 July 2016Global Active Factor Equity Fund A 12 July 2016Global Active Factor Equity Fund B 12 July 2016Global Active Factor Equity Fund C 12 July 2016Global Active Factor Equity Fund I 12 July 2016Global Active Factor Equity Fund Z 12 July 2016Global Active Factor Equity Fund AH (EUR) 12 July 2016Global Active Factor Equity Fund BH (EUR) 12 July 2016Global Active Factor Equity Fund CH (EUR) 12 July 2016Global Balanced Fund A 16 August 2016Global Balanced Fund B 16 August 2016Global Balanced Fund C 16 August 2016Global Balanced Fund Z 16 August 2016

Morgan Stanley Investment Funds 30 June 2016 338
DIRECTORS
Judith EdenNon-executive DirectorLondonUnited Kingdom
Carine FeipelNon-executive DirectorLuxembourg
Michael GriffinNon-executive DirectorDublinIreland
William JonesNon-executive DirectorLuxembourg
Henry KellyNon-executive DirectorLuxembourg
Andrew MackNon-executive DirectorLondonUnited Kingdom
MANAGEMENT COMPANY
Morgan Stanley Investment Management (ACD) Limited25 Cabot Square Canary Wharf London E14 4QA United Kingdom
DIRECTORS OF THE MANAGEMENT COMPANY
Judith Eden(From 6 January 2016)Non-executive DirectorLondon United Kingdom
Andrew MackNon-executive Director LondonUnited Kingdom
Andrew Onslow Managing Director Morgan Stanley InvestmentManagement LimitedLondon United Kingdom
Ruairi O’HealaiManaging DirectorMorgan Stanley InvestmentManagement LimitedLondon United Kingdom
Diane Hosie(From 8 February 2016)Managing DirectorMorgan Stanley InvestmentManagement LimitedLondonUnited Kingdom
DIRECTORS OF MORGAN STANLEY INVESTMENT HOLDING COMPANY (MAURITIUS) LIMITED
Sonia LutchmiahDirectorCIM Global Business CompaniesRepublic of Mauritius
Judith EdenNon-Executive DirectorLondonUnited Kingdom
William JonesNon-executive DirectorLuxembourg
Andrew Mack Non-executive DirectorLondonUnited Kingdom
Ashraf Ramtoola Director Fund AdministrationCIM Global Business CompaniesRepublic of Mauritius
Directors and service providers
Other information

339 Morgan Stanley Investment Funds 30 June 2016
Directors and service providers (continued)As at 30 June 2016
INVESTMENT ADVISERS*
Morgan Stanley InvestmentManagement Limited25 Cabot SquareCanary WharfLondon E14 4QAUnited Kingdom
Morgan Stanley & Co. International plc25 Cabot SquareCanary WharfLondon E14 4QAUnited Kingdom
INVESTMENT SUB-ADVISERS
Morgan StanleyInvestment Management Inc.522 Fifth AvenueNew York, NY 10036USA
Morgan Stanley InvestmentManagement Company23 Church Street16-01 Capital SquareSingapore, 049481
Mitsubishi UFJ Asset Management (UK) Ltd24 Lombard StreetLondon EC3V 9AJUnited Kingdom
DELEGATED SUB-ADVISER
Mitsubishi UFJ Kokusai Asset Management Co., Ltd1-12-1 Yurakucho, Chiyoda-ku Tokyo 100-0006Japan
REGISTERED OFFICE
6B, route de Trèves2633 SenningerbergLuxembourg
DISTRIBUTOR*
Morgan Stanley InvestmentManagement Limited25 Cabot SquareCanary WharfLondon E14 4QAUnited Kingdom
DEPOSITORY AND CUSTODIAN BANK
J.P. Morgan BankLuxembourg S.A.European Bankand Business Centre6C, route de Trèves2633 SenningerbergLuxembourg
ADMINISTRATOR AND PAYING AGENT*
J.P. Morgan BankLuxembourg S.A.European Bankand Business Centre6C, route de Trèves2633 SenningerbergLuxembourg
DOMICILIARY AGENT
Morgan Stanley Investment Management Limited, Luxembourg BranchEuropean Bank and Business Centre6B, route de Trèves2633 SenningerbergLuxembourg
ADMINISTRATOR OF THE SUBSIDIARY
CIM Fund Services Ltd.33 Edith Cavell StreetPort LouisRepublic of Mauritius
REGISTRAR AND TRANSFER AGENT*
RBC Investor ServicesBank S.A.14 rue Porte de France4360 Esch-sur-AlzetteLuxembourg
INDEPENDENT AUDITOR
Ernst & Young S.A.35E avenueJohn F. KennedyL-1855Luxembourg
AUDITOR OF THE SUBSIDIARY
Ernst & Young9th Floor NexTeracom Tower ICybercityEbeneRepublic of Mauritius
LEGAL ADVISER
Arendt & Medernach41A avenue John F. KennedyL-2082 Luxembourg Luxembourg
* Delegated from the Management Company.

Morgan Stanley Investment Funds 30 June 2016 340
AUSTRIA
Meinl Bank AktiengesellschaftBauernmarkt 2Postfach 991014 ViennaAustria
BELGIUM
RBC Investor Services Belgium S.A.11, Place Rogier1210 BrusselsBelgium
DENMARK
Nordea Bank Denmark A/SStrandgade 30900 Copenhagen CDenmark
FRANCE
Caceis1/3 Place Valhubert75013 ParisFrance
GERMANY
Morgan Stanley Bank AGJunghofstrasse 13-1560311 Frankfurt am MainGermany
GREECE
Alpha Bank40, Stadiou Street102 52 AthensGreece
HONG KONG
Morgan Stanley Asia Limited30th FloorThree Exchange SquareCentralHong Kong
IRELAND
J.P. Morgan Administration Services (Ireland) LimitedJP Morgan HouseInternational Financial Services CentreDublin 1Ireland
ITALY
RBC Investor Services Italia S.p.A.Via Vittor Pisani, 2620124 MilanItaly
Banca Sella Holding S.p.A.Piazza Gaudenzio Sella, 113900 BiellaItaly
Iccrea Banca S.p.A.Via Lucrezia Romana, 41-4700178 RomeItaly
State Street Bank S.p.A.Via Ferrante Aporti, 1020125 MilanItaly
Société Générale Securities Services S.p.A.MAC 2Via Benigno Crespi, 19/A20159 MilanItaly
Allianz BankFinancial Advisors S.p.A.Piazzale Lodi, 320137 MilanItaly
Monte dei Paschi di Siena S.p.A.(functions performed out of the office located in Mantova, Via L. Grossi, 3) Piazza Salimbeni, 3 53100 Siena Italy
BNP Paribas Securities Services Succursale di MilanoVia Ansperto, 520123 MilanItaly
All Funds Bank S.A. Italian Branch Via Santa Margherita, 720121 MilanItaly
SPAIN
Every distributor registered in Spain acts as paying agent for the Company and a list of them are available at www.cnmv.com
SWEDEN
MFEX MUTUAL FUNDS EXCHANGE ABBox 5378Grev Turegatan 19SE-102 49StockholmSweden
SWITZERLAND
Banque Cantonale de GenèvePaying agent17, quai de l’Ile1204 GenevaSwitzerland
Carnegie Fund Services S.ASwiss representative agent11, rue du Général-Dufour1204 GenevaSwitzerland
UNITED KINGDOM
Morgan Stanley Investment Management Limited25 Cabot SquareLondon E14 4QAUnited Kingdom
Paying and information agentsCopies of the Financial Reports of the Company can be obtained from the following Paying and Information Agents.
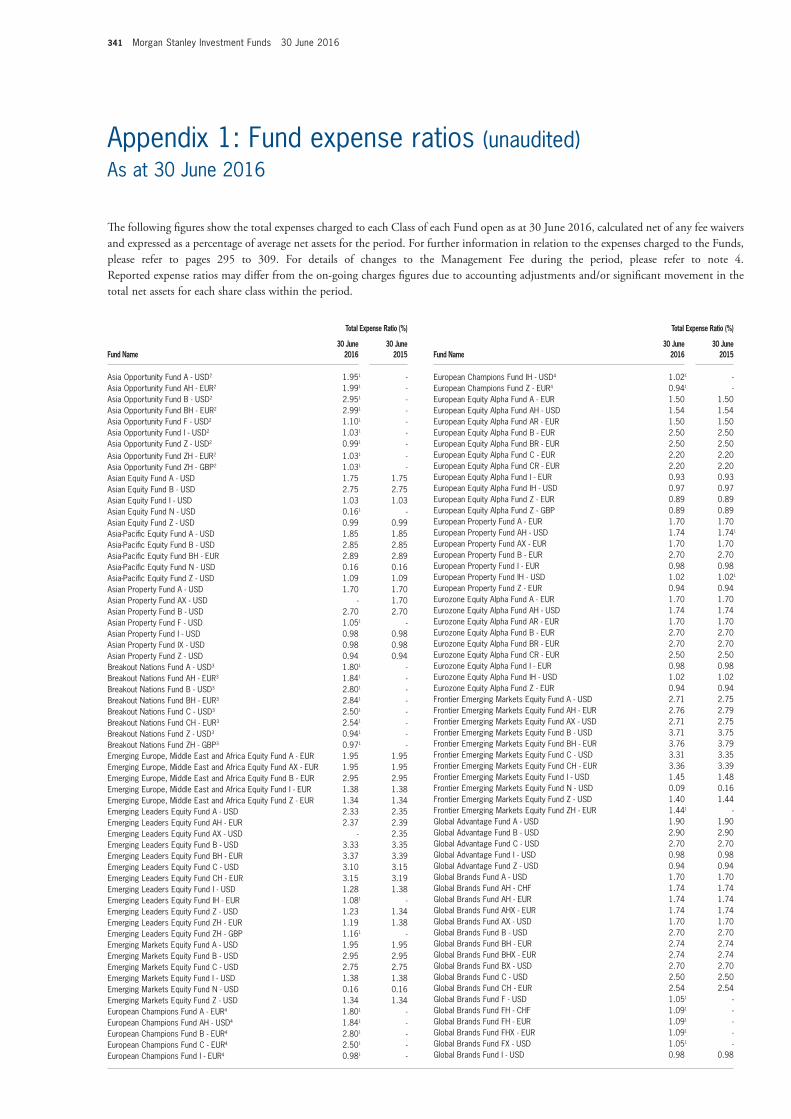
341 Morgan Stanley Investment Funds 30 June 2016
Total Expense Ratio (%)
Fund Name
30 June 2016
30 June 2015
European Champions Fund IH - USD4 1.021 -European Champions Fund Z - EUR4 0.941 -European Equity Alpha Fund A - EUR 1.50 1.50European Equity Alpha Fund AH - USD 1.54 1.54European Equity Alpha Fund AR - EUR 1.50 1.50European Equity Alpha Fund B - EUR 2.50 2.50European Equity Alpha Fund BR - EUR 2.50 2.50European Equity Alpha Fund C - EUR 2.20 2.20European Equity Alpha Fund CR - EUR 2.20 2.20European Equity Alpha Fund I - EUR 0.93 0.93European Equity Alpha Fund IH - USD 0.97 0.97European Equity Alpha Fund Z - EUR 0.89 0.89European Equity Alpha Fund Z - GBP 0.89 0.89European Property Fund A - EUR 1.70 1.70European Property Fund AH - USD 1.74 1.741
European Property Fund AX - EUR 1.70 1.70European Property Fund B - EUR 2.70 2.70European Property Fund I - EUR 0.98 0.98European Property Fund IH - USD 1.02 1.021
European Property Fund Z - EUR 0.94 0.94Eurozone Equity Alpha Fund A - EUR 1.70 1.70Eurozone Equity Alpha Fund AH - USD 1.74 1.74Eurozone Equity Alpha Fund AR - EUR 1.70 1.70Eurozone Equity Alpha Fund B - EUR 2.70 2.70Eurozone Equity Alpha Fund BR - EUR 2.70 2.70Eurozone Equity Alpha Fund CR - EUR 2.50 2.50Eurozone Equity Alpha Fund I - EUR 0.98 0.98Eurozone Equity Alpha Fund IH - USD 1.02 1.02Eurozone Equity Alpha Fund Z - EUR 0.94 0.94Frontier Emerging Markets Equity Fund A - USD 2.71 2.75Frontier Emerging Markets Equity Fund AH - EUR 2.76 2.79Frontier Emerging Markets Equity Fund AX - USD 2.71 2.75Frontier Emerging Markets Equity Fund B - USD 3.71 3.75Frontier Emerging Markets Equity Fund BH - EUR 3.76 3.79Frontier Emerging Markets Equity Fund C - USD 3.31 3.35Frontier Emerging Markets Equity Fund CH - EUR 3.36 3.39Frontier Emerging Markets Equity Fund I - USD 1.45 1.48Frontier Emerging Markets Equity Fund N - USD 0.09 0.16Frontier Emerging Markets Equity Fund Z - USD 1.40 1.44Frontier Emerging Markets Equity Fund ZH - EUR 1.441 -Global Advantage Fund A - USD 1.90 1.90Global Advantage Fund B - USD 2.90 2.90Global Advantage Fund C - USD 2.70 2.70Global Advantage Fund I - USD 0.98 0.98Global Advantage Fund Z - USD 0.94 0.94Global Brands Fund A - USD 1.70 1.70Global Brands Fund AH - CHF 1.74 1.74Global Brands Fund AH - EUR 1.74 1.74Global Brands Fund AHX - EUR 1.74 1.74Global Brands Fund AX - USD 1.70 1.70Global Brands Fund B - USD 2.70 2.70Global Brands Fund BH - EUR 2.74 2.74Global Brands Fund BHX - EUR 2.74 2.74Global Brands Fund BX - USD 2.70 2.70Global Brands Fund C - USD 2.50 2.50Global Brands Fund CH - EUR 2.54 2.54Global Brands Fund F - USD 1.051 -Global Brands Fund FH - CHF 1.091 -Global Brands Fund FH - EUR 1.091 -Global Brands Fund FHX - EUR 1.091 -Global Brands Fund FX - USD 1.051 -Global Brands Fund I - USD 0.98 0.98
Total Expense Ratio (%)
Fund Name
30 June 2016
30 June 2015
Asia Opportunity Fund A - USD2 1.951 -Asia Opportunity Fund AH - EUR2 1.991 -Asia Opportunity Fund B - USD2 2.951 -Asia Opportunity Fund BH - EUR2 2.991 -Asia Opportunity Fund F - USD2 1.101 -Asia Opportunity Fund I - USD2 1.031 -Asia Opportunity Fund Z - USD2 0.991 -Asia Opportunity Fund ZH - EUR2 1.031 -Asia Opportunity Fund ZH - GBP2 1.031 -Asian Equity Fund A - USD 1.75 1.75Asian Equity Fund B - USD 2.75 2.75Asian Equity Fund I - USD 1.03 1.03Asian Equity Fund N - USD 0.161 -Asian Equity Fund Z - USD 0.99 0.99Asia-Pacific Equity Fund A - USD 1.85 1.85Asia-Pacific Equity Fund B - USD 2.85 2.85Asia-Pacific Equity Fund BH - EUR 2.89 2.89Asia-Pacific Equity Fund N - USD 0.16 0.16Asia-Pacific Equity Fund Z - USD 1.09 1.09Asian Property Fund A - USD 1.70 1.70Asian Property Fund AX - USD - 1.70Asian Property Fund B - USD 2.70 2.70Asian Property Fund F - USD 1.051 -Asian Property Fund I - USD 0.98 0.98Asian Property Fund IX - USD 0.98 0.98Asian Property Fund Z - USD 0.94 0.94Breakout Nations Fund A - USD3 1.801 -Breakout Nations Fund AH - EUR3 1.841 -Breakout Nations Fund B - USD3 2.801 -Breakout Nations Fund BH - EUR3 2.841 -Breakout Nations Fund C - USD3 2.501 -Breakout Nations Fund CH - EUR3 2.541 -Breakout Nations Fund Z - USD3 0.941 -Breakout Nations Fund ZH - GBP3 0.971 -Emerging Europe, Middle East and Africa Equity Fund A - EUR 1.95 1.95Emerging Europe, Middle East and Africa Equity Fund AX - EUR 1.95 1.95Emerging Europe, Middle East and Africa Equity Fund B - EUR 2.95 2.95Emerging Europe, Middle East and Africa Equity Fund I - EUR 1.38 1.38Emerging Europe, Middle East and Africa Equity Fund Z - EUR 1.34 1.34Emerging Leaders Equity Fund A - USD 2.33 2.35Emerging Leaders Equity Fund AH - EUR 2.37 2.39Emerging Leaders Equity Fund AX - USD - 2.35Emerging Leaders Equity Fund B - USD 3.33 3.35Emerging Leaders Equity Fund BH - EUR 3.37 3.39Emerging Leaders Equity Fund C - USD 3.10 3.15Emerging Leaders Equity Fund CH - EUR 3.15 3.19Emerging Leaders Equity Fund I - USD 1.28 1.38Emerging Leaders Equity Fund IH - EUR 1.081 -Emerging Leaders Equity Fund Z - USD 1.23 1.34Emerging Leaders Equity Fund ZH - EUR 1.19 1.38Emerging Leaders Equity Fund ZH - GBP 1.161 -Emerging Markets Equity Fund A - USD 1.95 1.95Emerging Markets Equity Fund B - USD 2.95 2.95Emerging Markets Equity Fund C - USD 2.75 2.75Emerging Markets Equity Fund I - USD 1.38 1.38Emerging Markets Equity Fund N - USD 0.16 0.16Emerging Markets Equity Fund Z - USD 1.34 1.34European Champions Fund A - EUR4 1.801 -European Champions Fund AH - USD4 1.841 -European Champions Fund B - EUR4 2.801 -European Champions Fund C - EUR4 2.501 -European Champions Fund I - EUR4 0.981 -
The following figures show the total expenses charged to each Class of each Fund open as at 30 June 2016, calculated net of any fee waivers and expressed as a percentage of average net assets for the period. For further information in relation to the expenses charged to the Funds, please refer to pages 295 to 309. For details of changes to the Management Fee during the period, please refer to note 4. Reported expense ratios may differ from the on-going charges figures due to accounting adjustments and/or significant movement in the total net assets for each share class within the period.
Teksty do App MAMY TAGOWAĆ :) /// AJ 2016.04.01
Appendix 1: Fund expense ratios (unaudited)As at 30 June 2016

Morgan Stanley Investment Funds 30 June 2016 342
Appendix 1: Fund expense ratios (unaudited) (continued)As at 30 June 2016
Total Expense Ratio (%)
Fund Name
30 June 2016
30 June 2015
International Equity (ex US) Fund I - USD 0.98 0.98International Equity (ex US) Fund Z - USD 0.94 0.94Japanese Equity Fund A - JPY 1.70 1.70Japanese Equity Fund AH - USD 1.74 1.74Japanese Equity Fund B - JPY 2.70 2.70Japanese Equity Fund C - JPY 2.50 2.50Japanese Equity Fund I - JPY 0.98 0.98Japanese Equity Fund Z - JPY 0.94 0.94Japanese Equity Fund ZH - EUR 0.98 0.98Latin American Equity Fund A - USD 1.95 1.95Latin American Equity Fund B - USD 2.95 2.95Latin American Equity Fund C - USD 2.75 2.75Latin American Equity Fund I - USD 1.28 1.28Latin American Equity Fund Z - USD 1.24 1.24US Advantage Fund A - USD 1.70 1.70US Advantage Fund AH - EUR 1.74 1.74US Advantage Fund B - USD 2.70 2.70US Advantage Fund BH - EUR 2.74 2.74US Advantage Fund C - USD 2.50 2.50US Advantage Fund I - USD 0.93 0.93US Advantage Fund IH - EUR 0.971 -US Advantage Fund Z - USD 0.89 0.89US Advantage Fund ZH - EUR 0.93 0.93US Advantage Fund ZH - GBP 0.931 -US Advantage Fund ZX - USD 0.89 0.89US Growth Fund A - USD 1.70 1.70US Growth Fund AH - EUR 1.74 1.74US Growth Fund AX - USD 1.70 1.70US Growth Fund B - USD 2.70 2.70US Growth Fund BH - EUR 2.74 2.74US Growth Fund C - USD 2.50 2.50US Growth Fund CH - EUR 2.54 2.54US Growth Fund F - USD 1.00 1.00US Growth Fund FH - EUR 1.03 1.041
US Growth Fund I - USD 0.93 0.93US Growth Fund IX - USD 0.93 0.93US Growth Fund Z - USD 0.89 0.89US Growth Fund ZH - EUR 0.93 0.93US Growth Fund ZX - USD 0.891 -US Insight Fund A - USD 1.80 1.80US Insight Fund Z - USD 0.89 0.89US Property Fund A - USD 1.70 1.70US Property Fund B - USD 2.70 2.70US Property Fund F - USD 1.051 -US Property Fund I - USD 0.98 0.98US Property Fund Z - USD 0.94 0.94Absolute Return Fixed Income Fund A - EUR 1.30 1.30Absolute Return Fixed Income Fund AH - USD 1.33 1.341
Absolute Return Fixed Income Fund AR - EUR 1.30 1.30Absolute Return Fixed Income Fund B - EUR 2.30 2.30Absolute Return Fixed Income Fund BR - EUR 2.30 2.30Absolute Return Fixed Income Fund C - EUR 1.75 1.75Absolute Return Fixed Income Fund CR - EUR 1.75 1.75Absolute Return Fixed Income Fund IH - USD 0.73 0.721
Absolute Return Fixed Income Fund Z - EUR 0.64 0.64Asian Fixed Income Opportunities Fund A - USD 1.50 1.501
Asian Fixed Income Opportunities Fund AX - USD 1.50 1.501
Asian Fixed Income Opportunities Fund I - USD 0.83 0.831
Asian Fixed Income Opportunities Fund IX - USD 0.83 0.831
Asian Fixed Income Opportunities Fund Z - USD 0.79 0.791
Asian Fixed Income Opportunities Fund ZX - USD 0.79 0.791
Emerging Markets Corporate Debt Fund A - USD 1.75 1.75Emerging Markets Corporate Debt Fund AH - EUR 1.79 1.79Emerging Markets Corporate Debt Fund AHX - EUR 1.79 1.79Emerging Markets Corporate Debt Fund AX - USD 1.75 1.75Emerging Markets Corporate Debt Fund B - USD 2.75 2.75Emerging Markets Corporate Debt Fund BH - EUR 2.79 2.79Emerging Markets Corporate Debt Fund BHX - EUR 2.79 2.79Emerging Markets Corporate Debt Fund BX - USD 2.75 2.75Emerging Markets Corporate Debt Fund C - USD 2.45 2.45Emerging Markets Corporate Debt Fund CH - EUR 2.49 2.49
Total Expense Ratio (%)
Fund Name
30 June 2016
30 June 2015
Global Brands Fund IH - EUR 1.021 -Global Brands Fund NH1X - JPY 0.151 -Global Brands Fund S - USD 0.91 0.91Global Brands Fund Z - USD 0.94 0.94Global Brands Fund ZH - EUR 0.98 0.98Global Brands Fund ZH - GBP 0.98 0.98Global Brands Fund ZHR - GBP 0.981
Global Brands Fund ZX - USD 0.94 0.94Global Brands Equity Income Fund A - USD5 2.051 -Global Brands Equity Income Fund AR - USD5 2.051 -Global Brands Equity Income Fund AHR - EUR5 2.091 -Global Brands Equity Income Fund B - USD5 3.051 -Global Brands Equity Income Fund BR - USD5 3.051 -Global Brands Equity Income Fund BHR - EUR5 3.091 -Global Brands Equity Income Fund CR - USD5 2.801 -Global Brands Equity Income Fund CHR - EUR5 2.841 -Global Brands Equity Income Fund IR - USD5 1.081 -Global Brands Equity Income Fund Z - USD5 1.041 -Global Brands Equity Income Fund ZR - USD5 1.041 -Global Discovery Fund A - USD 1.90 1.90Global Discovery Fund Z - USD 0.94 0.94Global Infrastructure Fund A - USD 1.80 1.80Global Infrastructure Fund AH - EUR 1.84 1.84Global Infrastructure Fund B - USD 2.80 2.80Global Infrastructure Fund BH - EUR 2.84 2.84Global Infrastructure Fund C - USD 2.60 2.60Global Infrastructure Fund CH - EUR 2.64 2.64Global Infrastructure Fund I - USD 1.08 1.08Global Infrastructure Fund Z - USD 1.04 1.04Global Infrastructure Fund ZH - EUR 1.08 1.08Global Infrastructure Fund ZX - USD 1.04 1.041
Global Opportunity Fund A - USD 1.90 1.90Global Opportunity Fund AH - EUR 1.94 1.94Global Opportunity Fund B - USD 2.90 2.90Global Opportunity Fund BH - EUR 2.94 2.94Global Opportunity Fund C - USD 2.70 2.70Global Opportunity Fund I - USD 0.98 0.98Global Opportunity Fund N - USD 0.11 0.11Global Opportunity Fund Z - USD 0.94 0.94Global Property Fund A - USD 1.80 1.80Global Property Fund AH - EUR 1.84 1.84Global Property Fund B - USD 2.80 2.80Global Property Fund BH - EUR 2.84 2.84Global Property Fund C - USD 2.60 2.60Global Property Fund CH - EUR 2.64 2.64Global Property Fund I - USD 1.08 1.08Global Property Fund IX - USD 1.08 1.08Global Property Fund Z - USD 1.04 1.04Global Quality Fund A - USD 1.90 1.90Global Quality Fund AH - CHF 1.94 1.94Global Quality Fund AH - EUR 1.94 1.94Global Quality Fund AH - SGD 1.94 1.94Global Quality Fund AX - USD 1.90 1.90Global Quality Fund B - USD 2.90 2.90Global Quality Fund BH - EUR 2.94 2.94Global Quality Fund C - USD 2.70 2.70Global Quality Fund CH - EUR 2.74 2.74Global Quality Fund E - USD 0.70 0.70Global Quality Fund I - USD 0.98 0.98Global Quality Fund Z - USD 0.94 0.94Global Quality Fund ZH - CHF 0.98 0.98Global Quality Fund ZH - EUR 0.98 0.98Global Quality Fund ZX - USD 0.94 0.94Indian Equity Fund A - USD 2.25^ 2.12^
Indian Equity Fund B - USD 3.33^ 3.15^
Indian Equity Fund I - USD 1.49^ 1.31^
Indian Equity Fund N - USD (0.32)^ (0.09)^
Indian Equity Fund Z - USD 1.20^ 1.18^
International Equity (ex US) Fund A - USD 1.90 1.90International Equity (ex US) Fund B - USD 2.90 2.90International Equity (ex US) Fund C - USD 2.70 2.70

343 Morgan Stanley Investment Funds 30 June 2016
Total Expense Ratio (%)
Fund Name
30 June 2016
30 June 2015
Euro Corporate Bond (ex Financials) Fund Z - EUR7 - 0.64Euro Strategic Bond Fund A - EUR 1.10 1.10Euro Strategic Bond Fund AD - EUR 1.10 1.10Euro Strategic Bond Fund ADX - EUR 1.10 1.10Euro Strategic Bond Fund AX - EUR 1.10 1.10Euro Strategic Bond Fund B - EUR 2.10 2.10Euro Strategic Bond Fund BD - EUR 2.10 2.10Euro Strategic Bond Fund BDX - EUR 2.10 2.10Euro Strategic Bond Fund BX - EUR 2.10 2.10Euro Strategic Bond Fund C - EUR 1.75 1.75Euro Strategic Bond Fund I - EUR 0.68 0.68Euro Strategic Bond Fund Z - EUR 0.64 0.64Euro Strategic Bond Fund ZD - EUR 0.64 0.64European Currencies High Yield Bond Fund A - EUR 1.15 1.15European Currencies High Yield Bond Fund ADX - EUR 1.15 1.15European Currencies High Yield Bond Fund AH - USD 1.19 1.19European Currencies High Yield Bond Fund AX - EUR 1.15 1.15European Currencies High Yield Bond Fund B - EUR 2.15 2.15European Currencies High Yield Bond Fund BD - EUR 2.15 2.15European Currencies High Yield Bond Fund BDX - EUR 2.15 2.15European Currencies High Yield Bond Fund BX - EUR 2.15 2.15European Currencies High Yield Bond Fund C - EUR 1.80 1.80European Currencies High Yield Bond Fund I - EUR 0.73 0.73European Currencies High Yield Bond Fund IH - USD 0.77 0.77European Currencies High Yield Bond Fund IHX - USD - 0.77European Currencies High Yield Bond Fund Z - EUR 0.69 0.69European Currencies High Yield Bond Fund ZH - USD 0.701 -European Currencies High Yield Bond Fund ZX - EUR 0.69 0.69Global Bond Fund A - USD 1.10 1.10Global Bond Fund AH - EUR 1.14 1.14Global Bond Fund AHX - EUR 1.14 1.14Global Bond Fund AX - USD 1.10 1.10Global Bond Fund B - USD 2.10 2.10Global Bond Fund BH - EUR 2.14 2.14Global Bond Fund BHX - EUR 2.14 2.14Global Bond Fund BX - USD 2.10 2.10Global Bond Fund C - USD 1.75 1.75Global Bond Fund I - USD 0.68 0.68Global Bond Fund Z - USD 0.64 0.64Global Bond Fund ZH - EUR 0.681 -Global Convertible Bond Fund A - USD 1.30 1.30Global Convertible Bond Fund AH - AUD - 1.34Global Convertible Bond Fund AH - CHF 1.34 1.34Global Convertible Bond Fund AH - EUR 1.34 1.34Global Convertible Bond Fund ARM - USD - 1.30Global Convertible Bond Fund B - USD 2.30 2.30Global Convertible Bond Fund BH - EUR 2.34 2.34Global Convertible Bond Fund CH - EUR 1.94 1.94Global Convertible Bond Fund I - USD 0.83 0.83Global Convertible Bond Fund IH - EUR 0.87 0.87Global Convertible Bond Fund NH - CHF 0.15 0.15Global Convertible Bond Fund Z - USD 0.79 0.79Global Convertible Bond Fund ZH - CHF - 0.831
Global Convertible Bond Fund ZH - EUR 0.83 0.83Global Convertible Bond Fund ZHX - EUR 0.83 0.83Global Convertible Bond Fund ZX - USD 0.79 0.79Global Credit Fund A - USD 1.10 1.10Global Credit Fund B - USD 2.10 2.10Global Credit Fund C - USD 1.75 1.75Global Credit Fund I - USD 0.68 0.68Global Credit Fund Z - USD 0.64 0.64Global Credit Fund ZH1 - CHF 0.68 0.68Global Fixed Income Opportunities Fund A - USD 1.30 1.30Global Fixed Income Opportunities Fund AH - CHF 1.34 1.341
Global Fixed Income Opportunities Fund AH - EUR 1.34 1.34Global Fixed Income Opportunities Fund AHR - EUR 1.34 1.34Global Fixed Income Opportunities Fund AHX - EUR 1.34 1.34Global Fixed Income Opportunities Fund ARM - USD 1.30 1.30Global Fixed Income Opportunities Fund AX - USD 1.30 1.30Global Fixed Income Opportunities Fund B - USD 2.30 2.30Global Fixed Income Opportunities Fund BH - EUR 2.34 2.34
Total Expense Ratio (%)
Fund Name
30 June 2016
30 June 2015
Emerging Markets Corporate Debt Fund I - USD 1.18 1.18Emerging Markets Corporate Debt Fund IH - EUR 1.221 -Emerging Markets Corporate Debt Fund Z - USD 1.14 1.14Emerging Markets Corporate Debt Fund ZH - EUR 1.18 1.18Emerging Markets Debt Fund A - USD 1.70 1.70Emerging Markets Debt Fund AH - EUR 1.74 1.74Emerging Markets Debt Fund AHX - EUR 1.74 1.74Emerging Markets Debt Fund ARM - USD 1.70 1.70Emerging Markets Debt Fund AX - USD 1.70 1.70Emerging Markets Debt Fund B - USD 2.70 2.70Emerging Markets Debt Fund BH - EUR 2.74 2.74Emerging Markets Debt Fund BHX - EUR 2.74 2.74Emerging Markets Debt Fund BX - USD 2.70 2.70Emerging Markets Debt Fund C - USD 2.40 2.40Emerging Markets Debt Fund I - USD 1.13 1.13Emerging Markets Debt Fund Z - USD 1.09 1.09Emerging Markets Debt Fund ZH - EUR 1.13 1.13Emerging Markets Debt Fund ZHX - GBP - 1.13Emerging Markets Domestic Debt Fund A - USD 1.69 1.70Emerging Markets Domestic Debt Fund AH - EUR 1.73 1.74Emerging Markets Domestic Debt Fund AHX - EUR 1.73 1.74Emerging Markets Domestic Debt Fund ARM - USD 1.69 1.70Emerging Markets Domestic Debt Fund AX - USD 1.69 1.70Emerging Markets Domestic Debt Fund B - USD 2.69 2.70Emerging Markets Domestic Debt Fund BH - EUR 2.73 2.74Emerging Markets Domestic Debt Fund BHX - EUR 2.73 2.74Emerging Markets Domestic Debt Fund BX - USD 2.69 2.70Emerging Markets Domestic Debt Fund C - USD 2.39 2.40Emerging Markets Domestic Debt Fund I - USD 1.12 1.13Emerging Markets Domestic Debt Fund Z - USD 1.08 1.09Emerging Markets Domestic Debt Fund ZH - EUR 1.12 1.13Emerging Markets Domestic Debt Fund ZX - USD 1.08 1.09Emerging Markets Fixed Income Opportunities Fund A - USD6 1.701 -Emerging Markets Fixed Income Opportunities Fund AH - EUR6 1.741 -Emerging Markets Fixed Income Opportunities Fund AHR - EUR6 1.741 -Emerging Markets Fixed Income Opportunities Fund B - USD6 2.701 -Emerging Markets Fixed Income Opportunities Fund BH - EUR6 2.741 -Emerging Markets Fixed Income Opportunities Fund BHR - EUR6 2.741 -Emerging Markets Fixed Income Opportunities Fund C - USD6 2.201 -Emerging Markets Fixed Income Opportunities Fund CH - EUR6 2.241 -Emerging Markets Fixed Income Opportunities Fund CHR - EUR6 2.241 -Emerging Markets Fixed Income Opportunities Fund Z - USD6 0.891 -Euro Bond Fund A - EUR 1.10 1.10Euro Bond Fund B - EUR 2.10 2.10Euro Bond Fund C - EUR 1.75 1.75Euro Bond Fund I - EUR 0.68 0.68Euro Bond Fund Z - EUR 0.64 0.64Euro Corporate Bond Fund A - EUR 1.10 1.10Euro Corporate Bond Fund AD - EUR 1.10 1.10Euro Corporate Bond Fund ADX - EUR 1.10 1.10Euro Corporate Bond Fund AH - USD 1.14 1.14Euro Corporate Bond Fund AX - EUR 1.10 1.10Euro Corporate Bond Fund B - EUR 2.10 2.10Euro Corporate Bond Fund BD - EUR 2.10 2.10Euro Corporate Bond Fund BDX - EUR 2.10 2.10Euro Corporate Bond Fund BH - USD 2.14 2.14Euro Corporate Bond Fund BX - EUR 2.10 2.10Euro Corporate Bond Fund C - EUR 1.75 1.75Euro Corporate Bond Fund CD - EUR 1.75 1.75Euro Corporate Bond Fund F - EUR 0.751 -Euro Corporate Bond Fund FX - EUR 0.751 -Euro Corporate Bond Fund I - EUR 0.68 0.68Euro Corporate Bond Fund IH - USD 0.72 0.72Euro Corporate Bond Fund ID - EUR 0.68 0.68Euro Corporate Bond Fund IX - EUR 0.68 0.68Euro Corporate Bond Fund S - EUR 0.56 0.56Euro Corporate Bond Fund Z - EUR 0.64 0.64Euro Corporate Bond Fund ZD - EUR 0.64 0.64Euro Corporate Bond Fund ZOX - EUR 0.64 0.64Euro Corporate Bond (ex Financials) Fund A - EUR7 - 1.10Euro Corporate Bond (ex Financials) Fund N - EUR7 - 0.11
Appendix 1: Fund expense ratios (unaudited) (continued)As at 30 June 2016

Morgan Stanley Investment Funds 30 June 2016 344
Total Expense Ratio (%)
Fund Name
30 June 2016
30 June 2015
US Dollar High Yield Bond Fund C - USD 2.00 2.00US Dollar High Yield Bond Fund CX - USD 2.00 2.00US Dollar High Yield Bond Fund I - USD 0.73 0.73US Dollar High Yield Bond Fund Z - USD 0.69 0.69US Dollar Short Duration Bond Fund A - USD9 0.801 -US Dollar Short Duration Bond Fund I - USD9 0.431 -US Dollar Short Duration Bond Fund Z - USD9 0.291 -US Dollar Short Duration High Yield Bond Fund A - USD 1.30 1.30US Dollar Short Duration High Yield Bond Fund AX - USD 1.30 1.30US Dollar Short Duration High Yield Bond Fund B - USD 2.30 2.30US Dollar Short Duration High Yield Bond Fund BX - USD 2.30 2.30US Dollar Short Duration High Yield Bond Fund C - USD 1.60 1.60US Dollar Short Duration High Yield Bond Fund CX - USD 1.60 1.60US Dollar Short Duration High Yield Bond Fund I - USD 0.63 0.63US Dollar Short Duration High Yield Bond Fund Z - USD 0.59 0.59US Dollar Liquidity Fund A - USD 0.44* 0.20*
US Dollar Liquidity Fund AX - USD 0.43* 0.20*
US Dollar Liquidity Fund I - USD 0.30* 0.20*
US Dollar Liquidity Fund Z - USD 0.34* 0.20*
Diversified Alpha Plus Fund A - EUR 2.05 2.05Diversified Alpha Plus Fund AH - CHF 2.09 2.09Diversified Alpha Plus Fund AH - SEK 2.09 2.09Diversified Alpha Plus Fund AH - SGD 2.10 2.09Diversified Alpha Plus Fund AH - USD 2.09 2.09Diversified Alpha Plus Fund AX - EUR 2.05 2.05Diversified Alpha Plus Fund B - EUR 3.05 3.05Diversified Alpha Plus Fund BH - USD 3.09 3.09Diversified Alpha Plus Fund C - EUR 2.75 2.75Diversified Alpha Plus Fund F - EUR 1.07 1.101
Diversified Alpha Plus Fund FH - CHF 1.131 -Diversified Alpha Plus Fund FH - GBP 1.18 1.14Diversified Alpha Plus Fund FH - SGD 1.141 -Diversified Alpha Plus Fund FH - USD 1.14 1.14Diversified Alpha Plus Fund I - EUR 1.03 1.03Diversified Alpha Plus Fund IH - GBP 1.07 1.071
Diversified Alpha Plus Fund IH - USD 1.07 1.07Diversified Alpha Plus Fund N - EUR 0.11 0.11Diversified Alpha Plus Fund Z - EUR 0.99 0.99Diversified Alpha Plus Fund ZH - CHF 1.03 1.03Diversified Alpha Plus Fund ZH - GBP 1.03 1.03Diversified Alpha Plus Fund ZH - USD 1.03 1.03Diversified Alpha Plus Fund ZHX - GBP 1.03 1.03Diversified Alpha Plus Low Volatility Fund A - EUR 1.95 1.95Diversified Alpha Plus Low Volatility Fund AH - USD 1.99 1.99Diversified Alpha Plus Low Volatility Fund B - EUR 2.95 2.95Diversified Alpha Plus Low Volatility Fund C - EUR 2.70 2.70Diversified Alpha Plus Low Volatility Fund I - EUR 0.93 0.93Diversified Alpha Plus Low Volatility Fund IH - USD 0.96 0.97Diversified Alpha Plus Low Volatility Fund Z - EUR 0.89 0.89Global Balanced Income Fund A - EUR 2.30 2.30Global Balanced Income Fund AR - EUR 2.30 2.30Global Balanced Income Fund AHR - USD 2.34 2.34Global Balanced Income Fund BR - EUR 3.30 3.30Global Balanced Income Fund CR - EUR 3.00 3.00Global Balanced Income Fund CHR - USD 3.041 -Global Balanced Income Fund I - EUR 1.041 -Global Balanced Income Fund IR - EUR 1.03 1.03Global Balanced Income Fund IHR - USD 1.071 -Global Balanced Income Fund Z - EUR 0.99 0.99Global Balanced Income Fund ZHR - GBP 1.021 -Global Balanced Income Fund ZHR - USD 1.021 -Global Balanced Risk Control Fund of Funds A - EUR 2.44* 2.34*
Global Balanced Risk Control Fund of Funds AH - USD 2.48* 2.461,*
Global Balanced Risk Control Fund of Funds B - EUR 3.44* 3.34*
Global Balanced Risk Control Fund of Funds C - EUR 3.14* 3.04*
Global Balanced Risk Control Fund of Funds CH - USD 3.181,* -Global Balanced Risk Control Fund of Funds IH - USD 1.20* 1.241,*
Global Balanced Risk Control Fund of Funds Z - EUR 1.16* 1.07*
Global Balanced Risk Control Fund of Funds ZH3 - COP 1.20* 1.151,*
Global Multi-Asset Income Fund A - EUR10 2.051 -Global Multi-Asset Income Fund AR - EUR10 2.051 -
Total Expense Ratio (%)
Fund Name
30 June 2016
30 June 2015
Global Fixed Income Opportunities Fund BHR - EUR 2.34 2.34Global Fixed Income Opportunities Fund BHX - EUR 2.34 2.34Global Fixed Income Opportunities Fund BX - USD 2.30 2.30Global Fixed Income Opportunities Fund C - USD 1.75 1.75Global Fixed Income Opportunities Fund CH - EUR 1.79 1.79Global Fixed Income Opportunities Fund CHR - EUR 1.79 1.79Global Fixed Income Opportunities Fund CHX - EUR 1.79 1.79Global Fixed Income Opportunities Fund I - USD 0.68 0.68Global Fixed Income Opportunities Fund IH - CHF 0.72 0.721
Global Fixed Income Opportunities Fund IX - USD 0.68 0.68Global Fixed Income Opportunities Fund Z - USD 0.64 0.64Global Fixed Income Opportunities Fund ZH - CHF 0.68 0.681
Global Fixed Income Opportunities Fund ZH - EUR 0.68 0.68Global Fixed Income Opportunities Fund ZH - GBP 0.66 0.681
Global Fixed Income Opportunities Fund ZHX - EUR 0.661 -Global Fixed Income Opportunities Fund ZHX - GBP 0.66 0.681
Global Fixed Income Opportunities Fund ZX - USD 0.64 0.64Global High Yield Bond Fund A - USD 1.30 1.30Global High Yield Bond Fund AH - EUR 1.34 1.34Global High Yield Bond Fund AHX - EUR 1.34 1.34Global High Yield Bond Fund AO - SEK 1.34 1.34Global High Yield Bond Fund AX - USD 1.30 1.30Global High Yield Bond Fund B - USD 2.30 2.30Global High Yield Bond Fund BH - EUR 2.34 2.34Global High Yield Bond Fund BHX - EUR 2.34 2.34Global High Yield Bond Fund BX - USD 2.30 2.30Global High Yield Bond Fund C - USD 1.90 1.90Global High Yield Bond Fund CH - EUR 1.94 1.94Global High Yield Bond Fund I - USD 0.83 0.83Global High Yield Bond Fund IX - USD 0.83 0.83Global High Yield Bond Fund Z - USD 0.79 0.79Global High Yield Bond Fund ZH - EUR 0.83 0.83Global Mortgage Securities Fund A - USD 1.30 1.30Global Mortgage Securities Fund AH - EUR 1.34 1.34Global Mortgage Securities Fund AX - USD - 1.30Global Mortgage Securities Fund B - USD 2.30 2.30Global Mortgage Securities Fund BH - EUR 2.34 2.34Global Mortgage Securities Fund BHR - EUR 2.34 2.34Global Mortgage Securities Fund BHX - EUR 2.34 2.34Global Mortgage Securities Fund C - USD 1.90 1.90Global Mortgage Securities Fund CH - EUR 1.94 1.94Global Mortgage Securities Fund CHX - EUR 1.94 1.94Global Mortgage Securities Fund CX - USD 1.90 1.90Global Mortgage Securities Fund I - USD 0.73 0.73Global Mortgage Securities Fund IH - EUR 0.77 0.77Global Mortgage Securities Fund IHX - EUR 0.77 0.77Global Mortgage Securities Fund Z - USD 0.69 0.69Global Premier Credit Fund A - USD 1.10 1.10Global Premier Credit Fund AH - EUR - 1.14Global Premier Credit Fund B - USD 2.10 2.10Global Premier Credit Fund BH - EUR 2.14 2.14Global Premier Credit Fund C - USD - 1.75Global Premier Credit Fund CH - EUR - 1.79Global Premier Credit Fund I - USD - 0.68Global Premier Credit Fund Z - USD 0.64 0.64Global Premier Credit Fund ZX - USD 0.64 0.64Short Maturity Euro Bond Fund A - EUR 1.10 1.10Short Maturity Euro Bond Fund AH - SEK 1.141 -Short Maturity Euro Bond Fund AH - USD 1.14 1.14Short Maturity Euro Bond Fund B - EUR 2.10 2.10Short Maturity Euro Bond Fund C - EUR 1.75 1.75Short Maturity Euro Bond Fund I - EUR 0.68 0.68Short Maturity Euro Bond Fund IH - USD 0.72 0.72Short Maturity Euro Bond Fund Z - EUR 0.64 0.64US Dollar Corporate Bond Fund A - USD8 1.101 -US Dollar Corporate Bond Fund I - USD8 0.581 -US Dollar Corporate Bond Fund Z - USD8 0.541 -US Dollar High Yield Bond Fund A - USD 1.55 1.55US Dollar High Yield Bond Fund AX - USD 1.55 1.55US Dollar High Yield Bond Fund B - USD 2.55 2.55US Dollar High Yield Bond Fund BX - USD 2.55 2.55
Appendix 1: Fund expense ratios (unaudited) (continued)As at 30 June 2016

345 Morgan Stanley Investment Funds 30 June 2016
1 Annualised Total Expense Ratio from date of launch to 30 June 2016 for launched Share Class or from the date of re-activation to 30 June 2016 for Share Class closed and re-opened during the period. See note 1 for further details regarding the launch date of the Share Class.
2 Fund commenced operations on 31 March 2016.3 Fund commenced operations on 31 July 2015.4 Fund commenced operations on 8 April 2016.5 Fund commenced operations on 29 April 2016.6 Fund commenced operations on 3 August 2015.7 Fund was closed on 2 May 2016.8 Fund commenced operations on 20 May 2016.9 Fund commenced operations on 22 April 2016.10 Fund commenced operations on 1 October 2015. * Synthetic TER. ̂ It was identified during 2015 that there was an error in the Indian Equity Fund due to an incorrect expense accrual methodology. The period of error was from 1 April 2014 to 10 August 2015,
and the reported total expense ratios for 2014, 2015 and 2016 financial statements were impacted as a result. Had the error not occurred, the total expense ratios for each respective year would have been as followed: 2015: A=2.00%, B=3.00%, I=1.23%, N=0.21%, Z=1.19% 2016: A=2.00%, B=3.00%, I=1.21%, N=0.21%, Z=1.19%
Total Expense Ratio (%)
Fund Name
30 June 2016
30 June 2015
Global Multi-Asset Income Fund AHR - USD10 2.091 -Global Multi-Asset Income Fund IR - EUR10 0.981 -Global Multi-Asset Income Fund Z - EUR10 0.941 -Liquid Alpha Capture Fund A - USD 1.78 2.15Liquid Alpha Capture Fund AH - EUR 1.87 2.19Liquid Alpha Capture Fund BH - EUR 2.84 3.19Liquid Alpha Capture Fund C - USD 2.33 2.85Liquid Alpha Capture Fund CH - EUR 2.45 2.89Liquid Alpha Capture Fund I - USD - 0.98Liquid Alpha Capture Fund IH - GBP 0.88 1.02Liquid Alpha Capture Fund N - USD 0.11 0.11
Total Expense Ratio (%)
Fund Name
30 June 2016
30 June 2015
Liquid Alpha Capture Fund Z - USD 0.80 0.94Liquid Alpha Capture Fund ZH - EUR 0.83 0.98Liquid Alternatives Fund A - USD 2.36* 2.45*
Liquid Alternatives Fund AH - EUR 2.41* 2.51*
Liquid Alternatives Fund BH - EUR 3.41* 3.51*
Liquid Alternatives Fund C - USD 3.18* 3.26*
Liquid Alternatives Fund CH - EUR 3.21* 3.31*
Liquid Alternatives Fund I - USD 1.40* 1.49*
Liquid Alternatives Fund IH - GBP 1.44* 1.54*
Liquid Alternatives Fund Z - USD 1.36* 1.46*
Liquid Alternatives Fund ZH - EUR 1.40* 1.50*
Appendix 1: Fund expense ratios (unaudited) (continued)As at 30 June 2016

Morgan Stanley Investment Funds 30 June 2016 346
(unaudited) (continued)As at 30 June 2016Appendix 2: Portfolio turnover rate (unaudited)As at 30 June 2016
Funds Name Portfolio turnover rate (%)*
Equity FundsAsia Opportunity Fund1 9.68Asian Equity Fund 141.95Asia-Pacific Equity Fund 119.09Asian Property Fund 66.16Breakout Nations Fund (15.17)Emerging Europe, Middle East and Africa Equity Fund 66.30Emerging Leaders Equity Fund 138.01Emerging Markets Equity Fund 123.20European Champions Fund2 9.84European Equity Alpha Fund 101.51European Property Fund 117.70Eurozone Equity Alpha Fund 79.61Frontier Emerging Markets Equity Fund 88.70Global Advantage Fund 194.12Global Brands Fund 76.32Global Brands Equity Income Fund3 24.84Global Discovery Fund 168.56Global Infrastructure Fund 110.41Global Opportunity Fund 157.25Global Property Fund 35.45Global Quality Fund 63.57Indian Equity Fund (53.54)International Equity (ex US) Fund 119.78Japanese Equity Fund 33.34Latin American Equity Fund 58.17US Advantage Fund 108.50US Growth Fund 27.30US Insight Fund 121.31US Property Fund 17.92
Bond FundsAbsolute Return Fixed Income Fund 189.40Asian Fixed Income Opportunities Fund 184.13Emerging Markets Corporate Debt Fund 218.68
Funds Name Portfolio turnover rate (%)*
Bond Funds (continued)Emerging Markets Debt Fund 134.50Emerging Markets Domestic Debt Fund 325.57Emerging Markets Fixed Income Opportunities Fund 286.68Euro Bond Fund 34.41Euro Corporate Bond Fund 3.22Euro Strategic Bond Fund 20.93European Currencies High Yield Bond Fund 55.61Global Bond Fund 367.10Global Convertible Bond Fund 139.26Global Credit Fund 62.45Global Fixed Income Opportunities Fund 120.52Global High Yield Bond Fund 32.60Global Mortgage Securities Fund 672.90Global Premier Credit Fund 50.36Short Maturity Euro Bond Fund 6.56US Dollar Corporate Bond Fund4 (3.50)US Dollar High Yield Bond Fund 116.93US Dollar Short Duration Bond Fund5 110.80US Dollar Short Duration High Yield Bond Fund 65.78
Liquidity FundsUS Dollar Liquidity Fund6 -
Asset Allocation FundsDiversified Alpha Plus Fund 323.11Diversified Alpha Plus Low Volatility Fund 187.78Global Balanced Income Fund 52.85Global Balanced Risk Control Fund of Funds 275.01Global Multi-Asset Income Fund 312.02
Alternative Investment FundsLiquid Alpha Capture Fund 660.24Liquid Alternatives Fund 207.53
1 Fund commenced operations on 31 March 2016.2 Fund commenced operations on 8 April 2016.3 Fund commenced operations on 29 April 2016.4 Fund commenced operations on 20 May 2016.5 Fund commenced operations on 22 April 2016.6 Due to the fact underlying investments have short term maturity and that they are replaced at maturity, no portfolio turnover statistics are calculated for the fund.
The portfolio turnover data has been computed as follows:
Total of Securities transactions (purchases and sales)* – Total transactions of funds units (subscriptions and redemptions) x 100Average net assets
* Purchases and sales exclude securities having maturity dates at acquisition of one year or less.

347 Morgan Stanley Investment Funds 30 June 2016
Appendix 3: Sub-Advisers (continued)As at 30 June 2016Appendix 3: Sub-AdvisersAs at 30 June 2016
Fund Name Sub-Adviser
Equity FundsMorgan Stanley Investment Funds Asia Opportunity Fund1 Morgan Stanley Investment Management Inc.Morgan Stanley Investment Funds Asian Equity Fund Morgan Stanley Investment Management Company Inc.Morgan Stanley Investment Funds Asia-Pacific Equity Fund Morgan Stanley Investment Management Company Inc.Morgan Stanley Investment Funds Asian Property Fund Morgan Stanley Investment Management Company Inc.Morgan Stanley Investment Funds Breakout Nations Fund Morgan Stanley Investment Management Inc.Morgan Stanley Investment Funds Emerging Europe, Middle East and Africa Equity Fund Morgan Stanley Investment Management Inc.Morgan Stanley Investment Funds Emerging Leaders Equity Fund Morgan Stanley Investment Management Company Inc.Morgan Stanley Investment Funds Emerging Markets Equity Fund Morgan Stanley Investment Management Company & Morgan Stanley Investment Management Inc.Morgan Stanley Investment Funds European Champions Fund2 NoneMorgan Stanley Investment Funds European Equity Alpha Fund NoneMorgan Stanley Investment Funds European Property Fund NoneMorgan Stanley Investment Funds Eurozone Equity Alpha Fund NoneMorgan Stanley Investment Funds Frontier Emerging Markets Equity Fund Morgan Stanley Investment Management Inc.Morgan Stanley Investment Funds Global Advantage Fund Morgan Stanley Investment Management Inc.Morgan Stanley Investment Funds Global Brands Fund None Morgan Stanley Investment Funds Global Brands Equity Income Fund3 NoneMorgan Stanley Investment Funds Global Discovery Fund Morgan Stanley Investment Management Inc.Morgan Stanley Investment Funds Global Infrastructure Fund Morgan Stanley Investment Management Company & Morgan Stanley Investment Management Inc.Morgan Stanley Investment Funds Global Opportunity Fund Morgan Stanley Investment Management Inc.Morgan Stanley Investment Funds Global Property Fund Morgan Stanley Investment Management Company & Morgan Stanley Investment Management Inc.Morgan Stanley Investment Funds Global Quality Fund None Morgan Stanley Investment Funds Indian Equity Fund Morgan Stanley Investment Management Inc. & Morgan Stanley Investment Management CompanyMorgan Stanley Investment Funds International Equity (ex US) Fund None Morgan Stanley Investment Funds Japanese Equity Fund Mitsubishi UFJ Asset Management (UK) Ltd, delegated to Mitsubishi UFJ Kokusai Asset Management Co., Ltd Morgan Stanley Investment Funds Latin American Equity Fund Morgan Stanley Investment Management Inc.Morgan Stanley Investment Funds US Advantage Fund Morgan Stanley Investment Management Inc.Morgan Stanley Investment Funds US Growth Fund Morgan Stanley Investment Management Inc.Morgan Stanley Investment Funds US Insight Fund Morgan Stanley Investment Management Inc.Morgan Stanley Investment Funds US Property Fund Morgan Stanley Investment Management Inc.
Bond FundsMorgan Stanley Investment Funds Absolute Return Fixed Income Fund Morgan Stanley Investment Management Inc.Morgan Stanley Investment Funds Asian Fixed Income Opportunities Fund Morgan Stanley Investment Management Inc.Morgan Stanley Investment Funds Emerging Markets Corporate Debt Fund Morgan Stanley Investment Management Inc.Morgan Stanley Investment Funds Emerging Markets Debt Fund Morgan Stanley Investment Management Inc.Morgan Stanley Investment Funds Emerging Markets Domestic Debt Fund Morgan Stanley Investment Management Inc.Morgan Stanley Investment Funds Emerging Markets Fixed Income Opportunities Fund Morgan Stanley Investment Management Inc.Morgan Stanley Investment Funds Euro Bond Fund NoneMorgan Stanley Investment Funds Euro Corporate Bond Fund NoneMorgan Stanley Investment Funds Euro Strategic Bond Fund NoneMorgan Stanley Investment Funds European Currencies High Yield Bond Fund NoneMorgan Stanley Investment Funds Global Bond Fund Morgan Stanley Investment Management Inc. Morgan Stanley Investment Funds Global Convertible Bond Fund Morgan Stanley Investment Management Inc. Morgan Stanley Investment Funds Global Credit Fund Morgan Stanley Investment Management Inc. Morgan Stanley Investment Funds Global Fixed Income Opportunities Fund Morgan Stanley Investment Management Inc. Morgan Stanley Investment Funds Global High Yield Bond Fund Morgan Stanley Investment Management Inc. Morgan Stanley Investment Funds Global Mortgage Securities Fund Morgan Stanley Investment Management Inc. Morgan Stanley Investment Funds Global Premier Credit Fund Morgan Stanley Investment Management Inc. Morgan Stanley Investment Funds Short Maturity Euro Bond Fund NoneMorgan Stanley Investment Funds US Dollar Corporate Bond Fund4 Morgan Stanley Investment Management Inc.Morgan Stanley Investment Funds US Dollar High Yield Bond Fund Morgan Stanley Investment Management Inc.Morgan Stanley Investment Funds US Dollar Short Duration Bond Fund5 Morgan Stanley Investment Management Inc.Morgan Stanley Investment Funds US Dollar Short Duration High Yield Bond Fund Morgan Stanley Investment Management Inc.
List of Sub-Advisers (to be read in conjunction with the prospectus dated June 2016). Morgan Stanley Investment Management Limited acts as Investment Adviser to the Funds, with the exception of the Liquidity Fund, where the Investment Adviser is Morgan Stanley International & Co. plc. Where the Investment Adviser has delegated any of its responsibilities, the Funds are advised by the following Sub-Advisers.
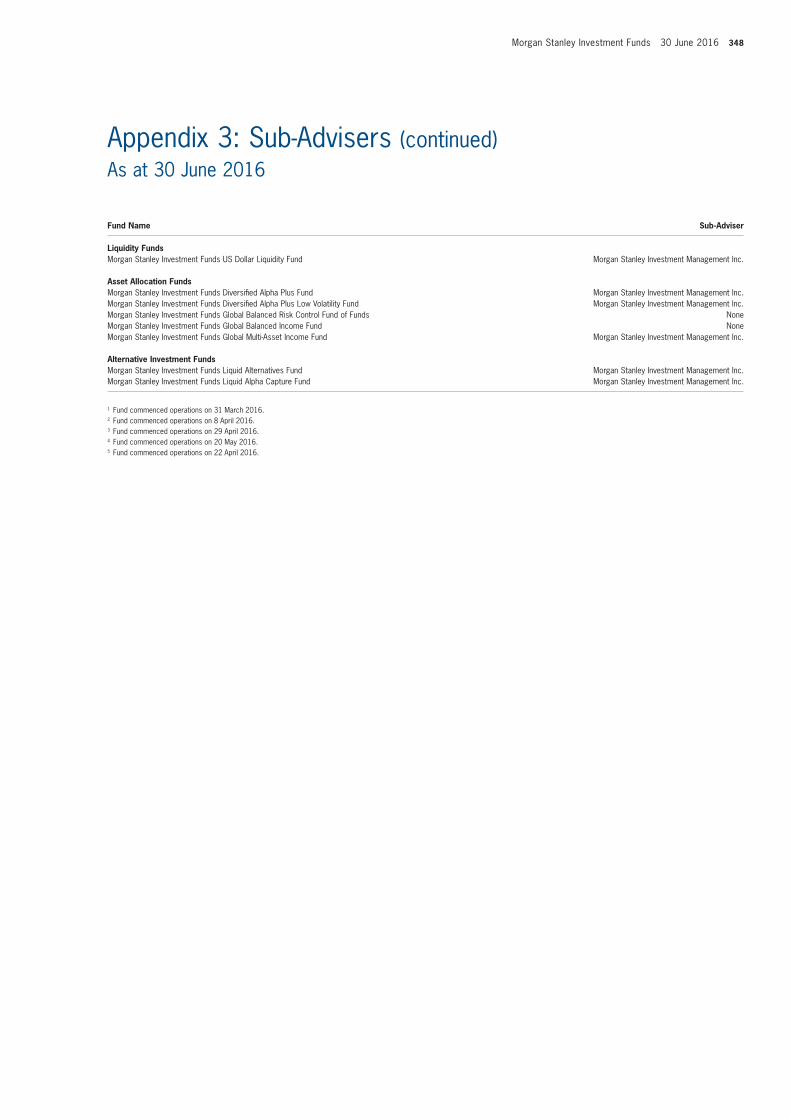
Morgan Stanley Investment Funds 30 June 2016 348
Appendix 3: Sub-Advisers (continued)As at 30 June 2016
Fund Name Sub-Adviser
Liquidity FundsMorgan Stanley Investment Funds US Dollar Liquidity Fund Morgan Stanley Investment Management Inc.
Asset Allocation FundsMorgan Stanley Investment Funds Diversified Alpha Plus Fund Morgan Stanley Investment Management Inc.Morgan Stanley Investment Funds Diversified Alpha Plus Low Volatility Fund Morgan Stanley Investment Management Inc.Morgan Stanley Investment Funds Global Balanced Risk Control Fund of Funds NoneMorgan Stanley Investment Funds Global Balanced Income Fund NoneMorgan Stanley Investment Funds Global Multi-Asset Income Fund Morgan Stanley Investment Management Inc.
Alternative Investment FundsMorgan Stanley Investment Funds Liquid Alternatives Fund Morgan Stanley Investment Management Inc.Morgan Stanley Investment Funds Liquid Alpha Capture Fund Morgan Stanley Investment Management Inc.
1 Fund commenced operations on 31 March 2016.2 Fund commenced operations on 8 April 2016.3 Fund commenced operations on 29 April 2016.4 Fund commenced operations on 20 May 2016.5 Fund commenced operations on 22 April 2016.
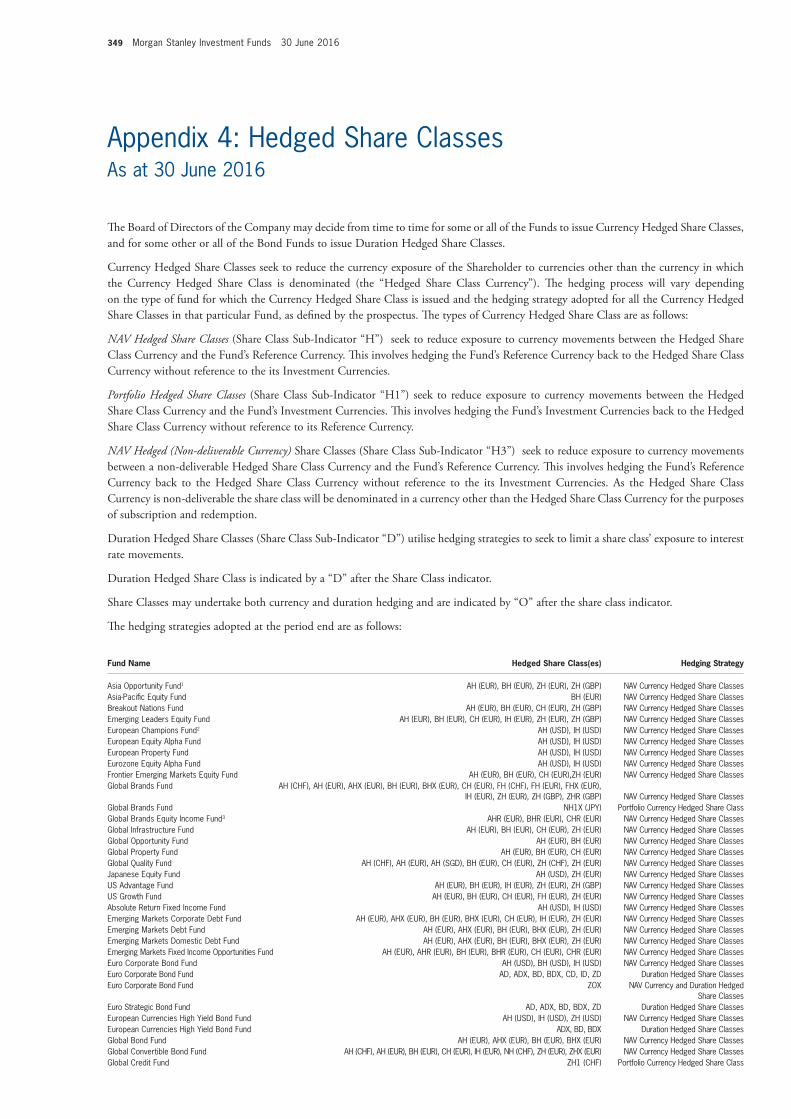
349 Morgan Stanley Investment Funds 30 June 2016
Appendix 4: Hedged Share Classes (continued)As at 30 June 2016
Fund Name Hedged Share Class(es) Hedging Strategy
Asia Opportunity Fund1 AH (EUR), BH (EUR), ZH (EUR), ZH (GBP) NAV Currency Hedged Share ClassesAsia-Pacific Equity Fund BH (EUR) NAV Currency Hedged Share ClassesBreakout Nations Fund AH (EUR), BH (EUR), CH (EUR), ZH (GBP) NAV Currency Hedged Share ClassesEmerging Leaders Equity Fund AH (EUR), BH (EUR), CH (EUR), IH (EUR), ZH (EUR), ZH (GBP) NAV Currency Hedged Share ClassesEuropean Champions Fund2 AH (USD), IH (USD) NAV Currency Hedged Share ClassesEuropean Equity Alpha Fund AH (USD), IH (USD) NAV Currency Hedged Share ClassesEuropean Property Fund AH (USD), IH (USD) NAV Currency Hedged Share ClassesEurozone Equity Alpha Fund AH (USD), IH (USD) NAV Currency Hedged Share ClassesFrontier Emerging Markets Equity Fund AH (EUR), BH (EUR), CH (EUR),ZH (EUR) NAV Currency Hedged Share ClassesGlobal Brands Fund AH (CHF), AH (EUR), AHX (EUR), BH (EUR), BHX (EUR), CH (EUR), FH (CHF), FH (EUR), FHX (EUR),
IH (EUR), ZH (EUR), ZH (GBP), ZHR (GBP) NAV Currency Hedged Share ClassesGlobal Brands Fund NH1X (JPY) Portfolio Currency Hedged Share ClassGlobal Brands Equity Income Fund3 AHR (EUR), BHR (EUR), CHR (EUR) NAV Currency Hedged Share ClassesGlobal Infrastructure Fund AH (EUR), BH (EUR), CH (EUR), ZH (EUR) NAV Currency Hedged Share ClassesGlobal Opportunity Fund AH (EUR), BH (EUR) NAV Currency Hedged Share ClassesGlobal Property Fund AH (EUR), BH (EUR), CH (EUR) NAV Currency Hedged Share ClassesGlobal Quality Fund AH (CHF), AH (EUR), AH (SGD), BH (EUR), CH (EUR), ZH (CHF), ZH (EUR) NAV Currency Hedged Share ClassesJapanese Equity Fund AH (USD), ZH (EUR) NAV Currency Hedged Share ClassesUS Advantage Fund AH (EUR), BH (EUR), IH (EUR), ZH (EUR), ZH (GBP) NAV Currency Hedged Share ClassesUS Growth Fund AH (EUR), BH (EUR), CH (EUR), FH (EUR), ZH (EUR) NAV Currency Hedged Share ClassesAbsolute Return Fixed Income Fund AH (USD), IH (USD) NAV Currency Hedged Share ClassesEmerging Markets Corporate Debt Fund AH (EUR), AHX (EUR), BH (EUR), BHX (EUR), CH (EUR), IH (EUR), ZH (EUR) NAV Currency Hedged Share ClassesEmerging Markets Debt Fund AH (EUR), AHX (EUR), BH (EUR), BHX (EUR), ZH (EUR) NAV Currency Hedged Share ClassesEmerging Markets Domestic Debt Fund AH (EUR), AHX (EUR), BH (EUR), BHX (EUR), ZH (EUR) NAV Currency Hedged Share ClassesEmerging Markets Fixed Income Opportunities Fund AH (EUR), AHR (EUR), BH (EUR), BHR (EUR), CH (EUR), CHR (EUR) NAV Currency Hedged Share ClassesEuro Corporate Bond Fund AH (USD), BH (USD), IH (USD) NAV Currency Hedged Share ClassesEuro Corporate Bond Fund AD, ADX, BD, BDX, CD, ID, ZD Duration Hedged Share ClassesEuro Corporate Bond Fund ZOX NAV Currency and Duration Hedged
Share ClassesEuro Strategic Bond Fund AD, ADX, BD, BDX, ZD Duration Hedged Share ClassesEuropean Currencies High Yield Bond Fund AH (USD), IH (USD), ZH (USD) NAV Currency Hedged Share ClassesEuropean Currencies High Yield Bond Fund ADX, BD, BDX Duration Hedged Share ClassesGlobal Bond Fund AH (EUR), AHX (EUR), BH (EUR), BHX (EUR) NAV Currency Hedged Share ClassesGlobal Convertible Bond Fund AH (CHF), AH (EUR), BH (EUR), CH (EUR), IH (EUR), NH (CHF), ZH (EUR), ZHX (EUR) NAV Currency Hedged Share ClassesGlobal Credit Fund ZH1 (CHF) Portfolio Currency Hedged Share Class
The Board of Directors of the Company may decide from time to time for some or all of the Funds to issue Currency Hedged Share Classes, and for some other or all of the Bond Funds to issue Duration Hedged Share Classes.
Currency Hedged Share Classes seek to reduce the currency exposure of the Shareholder to currencies other than the currency in which the Currency Hedged Share Class is denominated (the “Hedged Share Class Currency”). The hedging process will vary depending on the type of fund for which the Currency Hedged Share Class is issued and the hedging strategy adopted for all the Currency Hedged Share Classes in that particular Fund, as defined by the prospectus. The types of Currency Hedged Share Class are as follows:
NAV Hedged Share Classes (Share Class Sub-Indicator “H”) seek to reduce exposure to currency movements between the Hedged Share Class Currency and the Fund’s Reference Currency. This involves hedging the Fund’s Reference Currency back to the Hedged Share Class Currency without reference to the its Investment Currencies.
Portfolio Hedged Share Classes (Share Class Sub-Indicator “H1”) seek to reduce exposure to currency movements between the Hedged Share Class Currency and the Fund’s Investment Currencies. This involves hedging the Fund’s Investment Currencies back to the Hedged Share Class Currency without reference to its Reference Currency.
NAV Hedged (Non-deliverable Currency) Share Classes (Share Class Sub-Indicator “H3”) seek to reduce exposure to currency movements between a non-deliverable Hedged Share Class Currency and the Fund’s Reference Currency. This involves hedging the Fund’s Reference Currency back to the Hedged Share Class Currency without reference to the its Investment Currencies. As the Hedged Share Class Currency is non-deliverable the share class will be denominated in a currency other than the Hedged Share Class Currency for the purposes of subscription and redemption.
Duration Hedged Share Classes (Share Class Sub-Indicator “D”) utilise hedging strategies to seek to limit a share class’ exposure to interest rate movements.
Duration Hedged Share Class is indicated by a “D” after the Share Class indicator.
Share Classes may undertake both currency and duration hedging and are indicated by “O” after the share class indicator.
The hedging strategies adopted at the period end are as follows:
Appendix 4: Hedged Share ClassesAs at 30 June 2016

Morgan Stanley Investment Funds 30 June 2016 350
Appendix 4: Hedged Share Classes (continued)As at 30 June 2016
Fund Name Hedged Share Class(es) Hedging Strategy
Global Fixed Income Opportunities Fund AH (CHF), AH (EUR), AHR (EUR), AHX (EUR), BH (EUR), BHR (EUR), BHX (EUR), CH (EUR), CHR (EUR), CHX (EUR), IH (CHF), ZH (CHF), ZH (EUR), ZH (GBP), ZHX (EUR), ZHX (GBP) NAV Currency Hedged Share Classes
Global High Yield Bond Fund AH (EUR), AHX (EUR), BH (EUR), BHX (EUR), CH (EUR), ZH (EUR) NAV Currency Hedged Share ClassesGlobal High Yield Bond Fund
AO (SEK)NAV Currency and Duration Hedged
Share ClassesGlobal Mortgage Securities Fund AH (EUR), BH (EUR), BHR (EUR), BHX (EUR), CH (EUR), CHX (EUR), IH (EUR), IHX (EUR) NAV Currency Hedged Share ClassesGlobal Premier Credit Fund BH (EUR) NAV Currency Hedged Share ClassesShort Maturity Euro Bond Fund AH (SEK), AH (USD), IH (USD) NAV Currency Hedged Share ClassesDiversified Alpha Plus Fund AH (CHF), AH (SEK), AH (SGD), AH (USD), BH (USD), FH (CHF), FH (GBP), FH (SGD), FH (USD),
IH (GBP), IH (USD), ZH (CHF), ZH (GBP), ZH (USD), ZHX (GBP) NAV Currency Hedged Share ClassesDiversified Alpha Plus Low Volatility Fund AH (USD), IH (USD) NAV Currency Hedged Share ClassesGlobal Balanced Income Fund AHR (USD), CHR (USD), IHR (USD), ZHR (GBP), ZHR (USD) NAV Currency Hedged Share ClassesGlobal Balanced Risk Control Fund of Funds
AH (USD), CH (USD), IH (USD), ZH3 (COP)NAV Currency Hedged and Non-deliverable
Currency Hedged Share ClassesGlobal Multi-Asset Income Fund AHR (USD) NAV Currency Hedged Share ClassesLiquid Alpha Capture Fund AH (EUR), BH (EUR), CH (EUR), IH (GBP), ZH (EUR) NAV Currency Hedged Share ClassesLiquid Alternatives Fund AH (EUR), BH (EUR), CH (EUR), IH (GBP), ZH (EUR) NAV Currency Hedged Share Classes
1 Fund commenced operations on 31 March 2016.2 Fund commenced operations on 8 April 2016.3 Fund commenced operations on 29 April 2016.


www.morganstanleyinvestmentfunds.com CN G
R SA
R SI
CAV
16UCITS DO NOT HAVE A GUARANTEED RETURN AND PAST PERFORMANCE DOES NOT GUARANTEE FUTURE RETURNS