socioeconomic restructuring and regional change: rethinking growth in the european community
TRANSCRIPT

Clark University
Socioeconomic Restructuring and Regional Change: Rethinking Growth in the EuropeanCommunityAuthor(s): Andrés Rodríguez-PoseSource: Economic Geography, Vol. 70, No. 4 (Oct., 1994), pp. 325-343Published by: Clark UniversityStable URL: http://www.jstor.org/stable/143727 .
Accessed: 09/05/2014 19:15
Your use of the JSTOR archive indicates your acceptance of the Terms & Conditions of Use, available at .http://www.jstor.org/page/info/about/policies/terms.jsp
.JSTOR is a not-for-profit service that helps scholars, researchers, and students discover, use, and build upon a wide range ofcontent in a trusted digital archive. We use information technology and tools to increase productivity and facilitate new formsof scholarship. For more information about JSTOR, please contact [email protected].
.
Clark University is collaborating with JSTOR to digitize, preserve and extend access to Economic Geography.
http://www.jstor.org
This content downloaded from 169.229.32.138 on Fri, 9 May 2014 19:15:28 PMAll use subject to JSTOR Terms and Conditions

Socioeconomic Restructuring and Regional Change: Rethinking Growth in the European Community*
Andres Rodriguez-Pose Department of Social and Political Sciences, European University Institute
Badia Fiesolana, 50016 S. Domenico di Fiesole (Fl), Italy
Abstract: Scientific literature on the spatial effects of socioeconomic restructuring has tended to highlight three key components in what has been considered to be the emergence of a new territorial model: the significance of subnational units (regions and cities) as the genuine "post-Fordist" unit of analysis; the growing prominence of service activities in the configuration of new development areas; and, finally, either the "randomizing" of the location of growth poles or the appearance of the social dimension as a new determinant of growth. Most studies of spatial restructuring have been confined, however, to the theoretical dimension or to case study analyses. There is a lack of large empirical cross-sectional studies on the topic. In this article, I try to discern, using a cross-sectional method, the extent to which a new growth pattern is developing in the European Community (EC) and the influence of previously existing conditions in current territorial changes in wealth levels. I conclude that a flexible production spatial model is not yet the dominant pattern. Many characteristics of the mass production system are still evident in growth trends. Furthermore, this territorial restructuring is by no means a global and homogeneous process, since it implies different transformations in core, intermediate, and lagging areas.
Key words: socioeconomic restructuring, growth, growth patterns, regions, European Community.
Production Change and Socioeconomic Transformations
The decline of traditional mass produc- tion during the 1970s and 1980s has led to a profound restructuring of the economic sphere of society. Highly capitalized units and centralized production structures have entered a long-lasting crisis every- where in the world, and the advanced capitalist countries have endured serious problems of deindustrialization. Large plants, which formerly served to maxi-
* The author is grateful to Humberto Lopez, Lavan Mahadeva, and Matteo Manera for their help and useful comments in the econometric analysis. I would also like to thank three anonymous referees, Susan Hanson, Jonathan Hopkin, and Claire Kilpatrick for their con- structive comments on earlier drafts of the paper. Needless to say, the usual disclaimer applies.
mize economies of scale and reduce production costs, have become too rigid to respond to new consumer demands. The immediate response to these problems has been changes aimed at optimizing production and decentralizing and "flexi- bilizing" production decisions (Gottdiener 1989; Cooke and Morgan 1992). Thanks to these restructuring efforts, firms have become capable of manufacturing high- quality products, while keeping costs low and enabling, at the same time, the reinforcement of links between manufac- turers and consumers (Boyer 1989).
The shift from mass production meth- ods to flexible ones and the increasing integration and globalization of the world economy have not only altered econo- mies, but have also transformed prevail- ing social, political, and territorial pat- terns. As a result, a more flexible model of spatial organization that challenges long- established disparities (such as the old
325
This content downloaded from 169.229.32.138 on Fri, 9 May 2014 19:15:28 PMAll use subject to JSTOR Terms and Conditions

326 ECONoMIc GEOGRAPHY
rural-urban, agrarian-industrial, or center- periphery dichotomies) seems to be emerging (Massey 1984; Gregory and Urry 1985; Agnew and Duncan 1989; Entrikin 1989; Scott and Storper 1992; Leborgne and Lipietz 1992; Benko 1992). In this new spatial configuration, service activities are likely to play a much greater role in economic growth (Riddle 1986; Ochel and Wegner 1987; Nusbaumer 1987a, 1987b; Grubel and Walker 1989; Marshall and Wood 1992) and the signifi- cance of subnational entities is likely to increase, to the detriment of nation-states (Porter 1990; Krugman 1991; Leborgne and Lipietz 1992; O'Brien 1992).
Many studies have sought to confirm the appearance of new post-Fordist land- scapes and new patterns in the spatial distribution of wealth. Most empirical research on the topic, however, has been restricted to case studies focusing on growth poles and industrial districts in formerly lagging areas.' My intention here is to enlarge the territorial scope of the debate beyond the theoretical and case study framework that has dominated discussion about the influence of socioeco- nomic restructuring on spatial disparities. I do this through sectoral2 cross-sectional analyses of regional units in the European Community (EC). Do the conclusions of
case studies hold for larger spatial scales? Are we actually witnessing the birth of a new spatial distribution of wealth? Has flexible production revolutionized growth patterns? Does growth in a post-Fordist society follow a regional logic and not a national one? Sectoral cross-sectional analysis enables us to determine whether the main postulates of existing theories on socioeconomic restructuring (the genesis of a new spatial pattern, the rise of the service sector as the motor of economic growth, or the shrinking importance of the nation-state) can be generalized be- yond the spatial frame in which such theories were conceived, or whether socioeconomic restructuring has been limited to certain key areas. At present, the scarcity of large cross-sectional analy- ses hampers our ability to universalize conclusions reached in previous case- oriented studies. Is socioeconomic re- structuring really a general phenomenon or is it restricted to scattered areas?
Regions in the EC provide the ideal setting for this type of research. They allow us to analyze how restructuring has influenced growth patterns in the favorite territorial unit of post-Fordist literature: the region. In addition, the EC provides us with a space that has been clearly affected by the decay of mass production and the rise of flexible methods; it is also the part of the world where the greatest advances toward economic, social, and political integration have been achieved.
Spatial Consequences of the Breakdown of Fordism
Fordism engendered a territorial sys- tem based on the accumulation of capital and labor in urban agglomerations-the "development poles" (Perroux 1957)- with satellite industrial spaces strategi- cally placed in natural resource or energy sites and along the great communication axes. Labor and capital tended to concen- trate in large industrial plants and produc- tion units in core regions, in order to take advantage of internal and external econo-
1 Studies on the spatial consequences of socioeconomic restructuring have focused mainly on what have been called the "new growth spaces" (Komninos 1992, 217). These include the "technopoles" of Sophia-Antipolis and the Cite Scientifique de l'lle de France, as well as the cities of Grenoble and Toulouse in France; the so-called Italian industrial districts around Prato, Bologna, and Arezzo and the "wonder regions" of Emilia-Romagna, Veneto, and Tuscany; the southern German Ldnder of Baden-Wurttemberg and Bavaria; the cities in the axis Cambridge-Reading-Bristol in En- gland; and the high-technology centers of the Silicon Valley, Orange County, Phoenix, and Dallas-Fort Worth in the United States.
2 The term "sector" here refers to the three main divisions of the economy: agriculture, forestry, and fishery; industry; and services.
This content downloaded from 169.229.32.138 on Fri, 9 May 2014 19:15:28 PMAll use subject to JSTOR Terms and Conditions

SOCIOECONOMIC RESTRUCTURING AND REGIONAL CHANGE 327
mies and economies of scale and scope (Scott and Storper 1992, 10-14). The German Ruhr, Wallonia, and the South Yorkshire and Manchester areas in Great Britain represent paradigmatic examples of this type of spatial organization.
The decline in manufacturing increas- ingly threatened the great industrial regions created around large industrial complexes. Challenges were both external and internal. As Storper and Scott (1989, 25-26) point out, "Internally, market saturation and thorough-going spatial de- centralization in response to worker mili- tancy were creating high levels of unem- ployment and productivity slowdowns in the core. Externally the competition from Japan and the newly industrializing countries was cutting dramatically into domestic markets in North America and Western Europe. The net result was intensified industrial restructuring and rationalization in the core, leading to more plant closure, more decentraliza- tion, and greater unemployment." These processes led to "new industrial foci" in areas where "the social conditions built up in Fordist industrial regions could be avoided or were not present" (Storper and Scott 1989, 27).
A major tenet of the literature on the spatial consequences of post-Fordism is that socioeconomic restructuring has pro- duced new spatial cleavages. According to Castells, decision, information, and finan- cial "growth-promoting" service centers tend to become concentrated in core areas, whereas production units and re- search and development complexes tend to be dispersed to intermediate and peripheral regions, mainly in previously nonindustrialized areas. Routine activities and "Taylorist" unskilled manual tasks are uprooted from central locations to "off- shore" placements in the search for low production costs and weak labor organiza- tion (Castells 1989).
This viewpoint holds that the new ter- ritorial pattern is dichotomous. On the one hand, capital and information are becom- ing increasingly concentrated in core ser- vice-oriented regions (Harvey 1985). In ad-
dition, global networks link international banks and trade services into a worldwide network of international financial nuclei (Thrift 1987; O'Brien 1992). As a conse- quence, "ownership is more and more in- ternational and global, divorced from na- tional definitions" (O'Brien 1992, 100). On the other hand, the prevailing view holds that the flexibilization of production sys- tems allows the genesis of new develop- ment poles in previously isolated or lag- ging areas. In recent years, we have seen a shift from a predominantly sectoral and ur- ban model to a more supple one, appar- ently less constrained by former hierarchi- cal bonds with neighboring cities, but still heavily reliant on and integrated with eco- nomic circuits and world networks. As a result, core countries have experienced in the last two decades a steady decay in ur- banization rates and a corresponding in- crease in industrial and service workplaces in rural areas (Keeble, Offord, and Walker 1988; Porter 1990). Some rural areas, fur- thermore, have experienced a growth in employment and income (Stohr 1990), whereas the pace of deindustrialization has been accelerated in former centers of mass production (Komninos 1989, 1992; Storper and Scott 1989) like the Ruhr, the North and North-West of England, the Scottish Strathclyde, Wallonia, or the Nord-Pas-de- Calais region.
In sum, the restructuring literature has outlined major spatial trends related to deindustrialization and the establishment of flexible production methods: the ap- pearance of new development poles in formerly lagging areas and the distortion of the traditional clear-cut division be- tween centers and peripheries. These trends reduce the influence of national borders in spatial patterning of develop- ment. The room for maneuver left to national entities is shrinking rapidly as the integration of the world economy contin- ues to erode national "sovereignty." Sub- national entities, such as regions or local communities, are acquiring more rele- vance in articulating space, to the detri- ment of nation-states (Vandermotten et al. 1990; Murphy 1991; Benko 1992). In spite
This content downloaded from 169.229.32.138 on Fri, 9 May 2014 19:15:28 PMAll use subject to JSTOR Terms and Conditions

328 ECONOMIc GEOGRAPHY
of efforts to maintain national control, the integration of the world economy leads to a blurring of state borders and a revision of the role of the nation-state (Porter 1990; Dunford 1992; O'Brien 1992; Cooke 1992). National economic actors and stock exchanges "can no longer expect to monopolize trading in the shares of companies in their country or region, nor can trading be confined to specific cities or exchanges" (O'Brien 1992, 1).
The power of the nation-state is being challenged on two fronts: On the one hand, economic and political integration in areas such as the EC is inducing important transfers of power to suprana- tional bodies like the European Council or the European Commission; on the other hand, the increased concentration of economic activity in regional clusters, together with the revival (in some cases) and the creation (in others) of regional political movements and parties, is help- ing to propel the relevance of the regional dimension in the EC.3 Therefore, accord- ing to Krugman, "as Europe becomes a unified market, with free movement of capital and labor, it will make less and less sense to think of the relations between its component nations in terms of the stan- dard paradigm of international trade. Instead the issues will be those of regional economics" (1991, 8).
In this context, even the conception of the nation-state as the framework for growth and development studies has been openly challenged by several authors. Porter, for example, states that "the importance of geographic concentration raises interesting questions about whether the nation is a relevant unit of analysis" (1990, 157). As a result, interest has
shifted toward the role that subnational areas play in the emergence of the new spatial organization. Much of the litera- ture on the spatial effects of changes in production structures, deindustrialization, and the breakdown of the Fordist system has concentrated on regions and cities, not larger units. Regions arise as the spatial post-Fordist unit par excellence. They are regarded as a unique environ- ment for economic competition and the return to more liberal market structures, closely identified with flexible production methods (Komninos 1989; Hausermann and Kramer-Badoni 1989; Porter 1990).
Origins and Explanations of the Prevailing Spatial Pattern
Explanations of changes in territorial structure are twofold. One thread of literature highlights the significance of external "globalizing" factors. Several au- thors have stressed the internationaliza- tion of capital and the fact that the growing integration of economic circuits has led to greater economic interdepen- dency (Sassen 1990; O'Brien 1992). This interdependence has contributed to the appearance of new developing areas and to a reduction in the gap between advanced and lagging regions. Areas hitherto isolated from what was consid- ered the advanced economy have been fully incorporated in world capitalist circuits. This catch-up effect has been observed on an international scale; the Pacific Rim, once peripheral to the development of the world economy, is becoming a key area in the evolution of the new modes of production (Markusen 1985; Berry 1989). But it is on a subnational level, within the developed world, where phenomena such as the ascension of the "sunbelts" or the devel- opment of the "Third Italy" are attracting most attention.
A second set of explanations focuses on deindustrialization, the rise of service and high-technology industries, and the devel- opment of new technologies and systems
3 Since 1970 "regionalizing" processes have been initiated in Belgium, France, Portugal, and Spain. Regions in already "regionalized" states such as Germany or Italy have expanded their share of power. And even in the United Kingdom, one of the most centralized coun- tries in the EC, "regionalization" has been included in the agenda of the Labour Party.
This content downloaded from 169.229.32.138 on Fri, 9 May 2014 19:15:28 PMAll use subject to JSTOR Terms and Conditions

SOCIOECONOMIC RESTRUCTURING AND REGIONAL CHANGE 329
of management as potential causes of the changes in the spatial pattern (Storper and Scott 1989; Scott and Storper 1992; Leborgne and Lipietz 1992). Improved technological systems have allowed a rapid response to the major challenges affecting the old industrial order. In fact, technology is often considered the ulti- mate means of surmounting the problems related to decreasing productivity growth rates, to the lags and high costs in passing from innovation to manufacturing, and, above all, as the most effective way to elude the rigidity of mass production (Boyer 1989). As O'Brien notes, "the impact of technology on the method and speed of communications and calculation, gives the . . . markets a wholly new dimension" (1992, 10-11). Technology has enabled the routinization of a large number of service activities and has eased the process of decentralization of tradi- tional manufacturing activities to subur- ban locations or distant regions (Morris 1987). Information technology has been studied as key to spatial change. As Stdhr (1990) underlines, transfers of informa- tion, innovation, and entrepreneurial ini- tiative from outside of as well as within the local community are key to the development of a particular space.
In sum, explanations of territorial pattern have tended to emphasize the dynamics of transformation. Advances in technology, im- provements in communication, and the de- velopment of market structures are fre- quently cited in interpretations of the new spatial dynamic. This fact might have in- duced the overemphasis on innovation and dynamic elements in the restructuring pro- cess and produced the widespread impres- sion that a new and distinctive post-Fordist spatial configuration was emerging. From that perspective, the increasing mobility of traditional locational factors and the re- moval of resource bottlenecks are fostering growth in areas where development was al- most precluded during the Fordist era of mass production. Innovation and technol- ogy are frequently seen as allowing growth to occur almost anywhere, since the factors that activate development have become ex-
tremely mobile in recent years and know no national or legal borders. Taken to its limit, this argument implies that "location no longer matters" (O'Brien 1992, 73).
In my opinion, the argument that economic restructuring is reducing the sway of local conditions in growth and is increasingly randomizing growth patterns is highly disputable. Traditional locational constraints are gradually losing relevance, but this does not imply that "location no longer matters" to growth. Restructuring means precisely that locational factors and constraints that used to be relatively unnoticed or ignored have come to the fore. Social circumstances, in particular, have attracted little attention in empirical cross-sectional research, which has fo- cused largely on economic indicators and on dynamism, while neglecting persistent forces and start-off conditions. Existing social conditions may play an essential role in an area's receptivity to and assimilation of foreign trends and pro- cesses. The successful adoption of novel technologies, techniques, and information relies heavily not only on the capacity of a few individuals or companies to invent new procedures and to compile massive amounts of information, but also on the capacity of any space to supersede old production structures and to respond rapidly to challenges. The current level of development of a nation, a region, or a locality is the outcome of how different production systems, social and political regimes, and cultures have been succes- sively combined in space.
Several authors have stressed the impor- tance of start-off conditions for the assimi- lation of imported innovations and thus in the growth and development capacities of certain territories (Massey 1984; Soja 1985, 1989; Sayer 1985; Giddens 1985; Urry 1985; Browett 1987; Gottdiener 1987; Agnew 1987; Agnew and Duncan 1989). Despite the rich debate that developed in the sec- ond half of the 1980s on the question of the dialogue between innovation and preexist- ing social and economic conditions, most empirical research has been restricted to single case analysis.
This content downloaded from 169.229.32.138 on Fri, 9 May 2014 19:15:28 PMAll use subject to JSTOR Terms and Conditions

330 ECONOMIC GEOGRAPHY
The empirical portion of this paper ad- dresses the question of a new spatial divi- sion of wealth in the EC, using a cross- sectional analysis of social and economic conditions. I address the following ques- tions: Is a new spatial model emerging? Does this new model imply a greater role for subnational regions? What is the influ- ence of initial social conditions on regional growth? I first tackle, through the study of regional growth, the question of the sig- nificance of the region as a unit of analysis; I then look at the influence of static and dynamic social and economic variables on the spatial patterns of wealth from 1980 to 1989.4 By inspecting shifts in value added and employment in different economic sec- tors, I seek to determine whether or not we are witnessing the emergence of a new spatial model. I shall also try to discern the extent to which the current allotment of Gross Domestic Product (GDP) per per- son in the regions of the European Com- munity is a product of changes in the eco- nomic structure or of the social conditions of a region and how important the start-off effects were in the genesis of the "flexible economy" spatial pattern.
Data and the Unit of Analysis The study covers 113 regions5 of the
4 Although it would be advisable to enlarge the time scope at least back to 1970 in order to include the whole process of transformation from a well-established Fordist mode of production to the "neo-Fordist" or "post- Fordist" economic systems emerging from the crisis, the lack of reliable regional data precludes this.
5 Regions in the EC refer to diverse territorial units in terms of autonomy. Only in the two federal states of the EC (Germany and Belgium), as well as in the "regionalized" states (Spain, Italy, and France), do regions enjoy a certain degree of self-government, although the level of autonomy of subnational units among these countries differs consider- ably. In centralized states (Denmark, Greece, Ireland, Luxembourg, the Netherlands, and the United Kingdom), regions constitute only
EC,6 for each of which a considerable amount of GDP and sectoral data have been gathered. The sectoral data refer to: (1) gross value added (GVA) at market prices7 (economic data); (2) total employ- ment (social data)8 for each of the main
administrative divisions or, as in the case of Denmark and Greece, have been set up only to collect funds from the Community's Euro- pean Regional Development Fund (ERDF). Portugal is between these poles, some regions enjoying a certain degree of self-rule while others are just administrative entities.
6 Regions have not been chosen according to any of the three N.U.T.S. (acronym for Nomenclature d'Unite's Territoriales Statis- tiques (Naming of Statistical Territorial Units)) levels used by the European Community. The significant differences in terms of size, popula- tion, and political power among the regions included in each' of the three categories made it advisable to apply another regional division to our study. The classification used in the analysis responds to the existence of compara- ble levels of self-government in countries with a certain level of administrative decentraliza- tion (Germany, Belgium, Spain, Italy, France, and Portugal) and to similar dimensions in territory or population for the remaining nations (Denmark, Greece, Ireland, Luxem- bourg, the Netherlands, and the United Kingdom). The final regional level selected corresponds to the following national adminis- trative levels: Regions (B), Lhnder (D), Comu- nidades aut6nomas (E), Regions (F), Regioni (I), Landsleden (NL), Regioes autonomas (P), Standard regions (UK), the whole nation in the cases of Ireland and Luxembourg, and, finally, two subnational divisions currently used by the European Community which do not correspond to any real administrative entity (and, thus, are established only for EC purposes): Grupper af Amter (Dk) and Groups of development regions (Gr).
7 Gross value added at market prices is the indicator for measuring national income used by the Statistical Office of the European Communities (EUROSTAT). It aggregates the value of the output of industries and other productive enterprises minus the value of the inputs at each stage of production. The sum of these values added gives gross domestic product (GDP).
8 Employment is considered in this article as
This content downloaded from 169.229.32.138 on Fri, 9 May 2014 19:15:28 PMAll use subject to JSTOR Terms and Conditions

SOCIOECONOMIC RESTRUCTURING AND REGIONAL CHANGE 331
socioeconomic sectors (agriculture, indus- try, and services); and (3) gross domestic product indicators, measured in ECUs,9 for the period 1980 to 1989. The source of the data is the REGIO database of the Commission of the European Communi- ties.
This study is not free, however, from one of the main problems affecting regional research: lack of data. Complete sets of regional data are provided for only six members of the EC (Belgium, Ger- many, France, Ireland, Italy, Luxem- bourg, and the Netherlands). Sets are incomplete for Greece and to a lesser extent Denmark since, in both cases, national and EC administrative divisions do not coincide. Regional data for gross value added at market prices are com- pletely absent for Denmark and Greece. The absence of recent data for several countries must also be mentioned. Data for the United Kingdom stop in 1987, and in 1988 for Spain and the Netherlands. In 1988 and 1989 the national average,
a noneconomic indicator, since (because of the existence of intensive and strict employment protection, both on individual and collective bases) the labor market in most EC countries is, in the short term, almost invulnerable to the level of overall activity in the economy. In contrast with the United States, employees in Europe are protected by a rigid and complete set of laws in areas such as employment contracts, guaranteed payments, suspension from work on medical grounds, trade union membership, maternity, unfair dismissals, time off from work, redundancy payments, or insolvency of the employer. Moreover, trade unions play an active role in employment regulation via collective bargaining with other social and economic agents. Therefore, em- ployment in Europe reacts slowly to economic transformations and thus may be regarded more as a noneconomic variable than an economic one.
9 The ECU, an international currency com- posed of weighted averages of currencies of EC members, was introduced as part of the European Monetary System (EMS). All coun- tries in the EC except Greece, Italy, and the United Kingdom are members of the EMS.
instead of regional data, had to be used as gross-value-added data for Portugal. Fur- thermore, no information is available for five Lander of the former German Demo- cratic Republic and East Berlin. The region of Noord-Nederland has been excluded from all regression analyses because abnormally low growth rates there in comparison to other regions resulted from changes in national account- ing concerning the allocation of benefits from North Sea oil and gas pits, which were concentrated in that region in 1980, before it was decided to divide them on a national basis (Vandermotten et al. 1990). In some cases (mainly Denmark and Portugal) the deficiencies of the European data base have been, to a certain extent, solved by resorting to national account statistics. In other cases, however, since the REGIO data base compiles data from national statistical offices, these defects simply reflect the deficiencies of national statistical systems at a regional level.
Regions, Nations, and Growth This part of the analysis seeks to
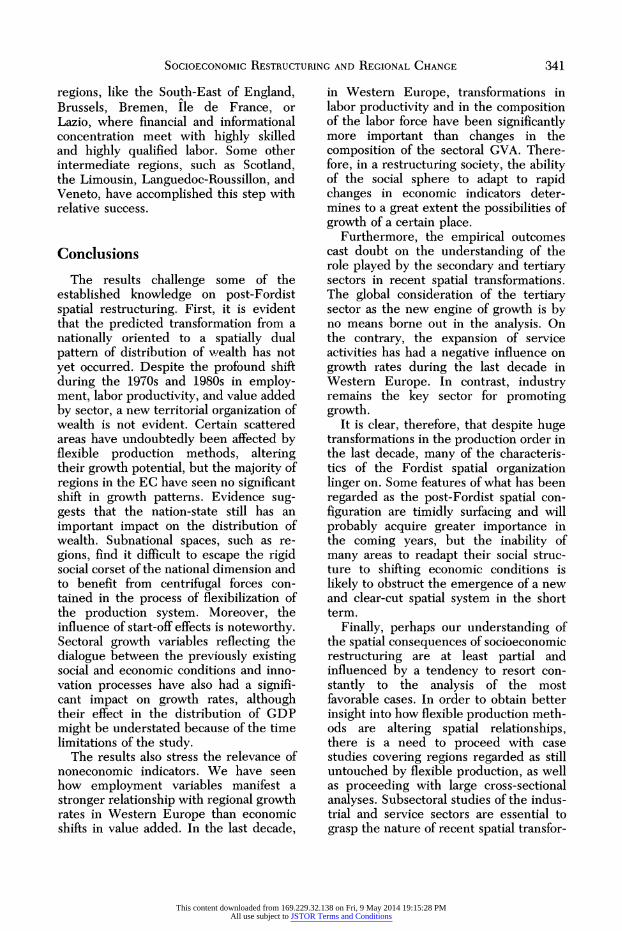
determine the significance of the region as a valid unit of analysis. An important question concerns how to measure the dependent variable. What type of growth should be examined: monetary or real growth, growth measured in ECUs, or growth measured in purchasing power parity? In the first step of the analysis I measured annual rates of growth using GDP at a national level. Preliminary analysis of the data showed, however, a strong national influence on regional growth trends. Regions in peripheral countries (except Greece), regardless of their initial level of development in the EC, experienced much higher growth rates than regions in core countries such as Belgium, the Netherlands, Germany, or France. Furthermore, whereas periph- eral countries shared a distinct growth pattern, regions in core countries had fairly similar growth rates throughout the period (Fig. 1).
The results of preliminary regressions
This content downloaded from 169.229.32.138 on Fri, 9 May 2014 19:15:28 PMAll use subject to JSTOR Terms and Conditions

332 ECONOMic GEOGRAPHY
conducted with this dependent variable confirmed the strong dominance of the state effect, in contrast to what the literature on post-Fordism tends to con- sider a fundamentally regional phenome- non. Regional data in these regressions were purposely introduced in national order, so that scores in the Durbin- Watson test could be considered signifi- cant. Durbin-Watson results were ex- tremely low in all models.10 These types of autocorrelated errors constitute a typi- cal example of spatial autocorrelation, through which "in regional cross-section data, a random shock affecting economic activity in one region may cause economic activity in an adjacent region to change because of close economic ties between the regions" (Kennedy 1985, 98-99). The pattern of residuals shows that values for regions tend to follow clear national patterns.
An obvious explanation is that progres- sive specialization, incentives to invest, and government intervention through an ac- tive regional policy pay off. Notable catch-up effects are found. The evidence supports the postulates of equilibrium the- ories, which argue for the long-term con- vergence of development levels among na- tions. The catch-up hypothesis cannot be defended, however, when development levels within nations are scrutinized. The catch-up hypothesis would predict that within peripheral countries lagging re- gions would grow at a greater pace than advanced ones. Yet data for Italy and Spain reveal that this is not the case. Both in Italy and Spain it was mainly the richest regions that grew the most quickly. In the case of Italy, the only three regions that
10 In most cases, Durbin-Watson scores were around 1.1. These results indicate the existence of autocorrelated disturbances gen- erated by the introduction of data in a national order, which provokes a high correlation of successive residuals. The introduction of re- gional data on an alphabetical order (thus avoiding the national effect) made Durbin- Watson scores rise to more than 1.6.
had higher GDP per capita than the aver- age of the EC in 1980 (Vale d'Aosta, Lom- bardy, and Emilia-Romagna) grew more than the average of the nation. In Spain, growth was mainly concentrated in the rich- est regions, such as Madrid, Catalonia, or the Balearic Islands.
The results suggest that the nation is still a solid unit of analysis when studying spatial restructuring. Growth rates through- out the 1980s and the distribution of GDP per inhabitant still strongly follow national patterns, while the spatial "flexibilization" described by most of the adherents of post- Fordism is, in most areas, still at its initial stages. This leads to the conclusion that the decline of the importance of the nation in the spatial organization of production systems has been overstated and that the national sphere is still responsible for a great deal of the spatial distribution of wealth. Although the importance of na- tional borders for growth patterns might be diminishing, the pace of change is sig- nificantly slower than that suggested by the literature on economic restructuring. Social factors and the defense of sover- eignty act as strong obstacles to change in spatial structures.
The most salient point is that ignoring either the national or the regional dimen- sion may strongly distort any conclusions emerging from the analysis of growth trends. Therefore, the growth rate used as the dependent variable in the following analyses will account for distortions cre- ated by the national dimension: annual regional growth rates are divided by a national coefficient, which represents the relationship between national growth rates and the EC's average growth. This method allows us to avoid misinterpreta- tions provoked by very high growth rates in Italy, Spain, and Portugal, which otherwise would have led to the consider- ation of social and economic conditions in those three countries as the stimulus for regional growth.
This content downloaded from 169.229.32.138 on Fri, 9 May 2014 19:15:28 PMAll use subject to JSTOR Terms and Conditions

SOCIOECONOMIC RESTRUCTURING AND REGIONAL CHANGE 333
160
Spain
1 4 0 0 0.... ............................................... 00 0 00 0 Italy
D 0 0 0 d 4@) 0 0 0 0
0 0 .0 .No0. en- **- *
GDP per inhab immunity Center
t la ow 0 G0 0 0 1 0sb 80 ~~~~ ~~~~~~~~~~~~~~~~~~~~~0.0 0 Bruo Hamburgsse
Greece ~~~~~0 000
20~~~~~~~~~~~~~~~~~~~~ 0 200 400 600 00 1000 1200r400e100
~~~~~~~D e4ihbtn n18
Fiur 1 AerGDperana growbthaonGD in te1980s
The Social and Economic Dimensions of Regional Growth
The aim of this section is to analyze the extent to which the interplay between the previously existing economic and social structure and dynamic socioeconomic trends (the independent variables) is altering regional growth (the dependent variable) in a post-Fordist society and whether these transformations are creat- ing a new territorial pattern. The annual rate of growth between 1980 and 1989 represents the dynamic dimension of changes in GDP per capita-that is, how GDP has reacted to the crisis of the previous system of production. In other words, it is intended to depict the actual result of the dynamic between exogenous transformation processes and the inher- ited forces acting in society.
In order to discover the causes of the changing pattern in the distribution of GDP, social and economic independent variables, representing the dialogue be- tween innovation and tradition, as well as the start-off conditions have been intro-
duced into the equation. The general model (Model 1) takes the following form:
y = oc + BEG + 12A5G + 81E + 82ASE + E (1)
where
y is the mean annual rate of growth of GDP between 1980 and 1989, G is the start-off share of each of the main socioeconomic sectors (agricul- ture, industry, and services) in GDP, ASG is the mean annual rate of growth of the share of each sector in GDP between 1980 and 1989, E represents the start-off employment levels in each sector, and ASE is the mean annual rate of growth of the share of employment in each sector between 1980 and 1989.
The model represents how static social and economic variables (G and E) com- bine with change over time (ASG and AsE) in space in order to generate growth. I use data on value added and level of employ- ment in each sector to depict two of the
This content downloaded from 169.229.32.138 on Fri, 9 May 2014 19:15:28 PMAll use subject to JSTOR Terms and Conditions

334 ECONOMIC GEOGRAPHY
main social spheres. The proportion of gross value added at market prices por- trays the original situation and the evolu- tion of economic sectors, whereas data on employment reflects the social distribu- tion of labor. In any period of time, and especially in transition periods from one productive system to another, changes in the economic sphere are likely to occur more quickly than are social changes. The initial situation or start-off conditions are identified by a collection of static vari- ables, the percentage of gross value added (GVA) and employment in each of the main socioeconomic sectors in 1980. On the other hand, the actual outcome of the dialogue between innovation and tradition in the economic and social spheres of society is represented by a group of dynamic variables: the annual variation rates in value added and employment between 1980 and 1989. The variables and their correlation coefficient with growth rates are described in Table 1.
Two important questions to be ad- dressed prior to analyzing the factors that stimulate growth is (1) whether start-off conditions play a greater role than dynamic trends in generating growth and (2) whether persistent social condi- tions dampen transformation from a Fordist spatial model to one of flexible production. These questions can be answered with the use of econometric encompassing tests, which provide an adequate means for discriminating be- tween competing non-nested" social and economic, static and dynamic models.12 This econometric testing allows us to
differentiate among competing models. Rival hypotheses are dealt with symmet- rically in order to select the model expected to perform best (the encompass- ing model) with regard to a particular loss function. The rationale behind each test is "to derive from one model an explanation or prediction of certain as- pects of a contending model and contrast that with the result actually obtained by that rival model" (Hendry and Richard 1989, 436). There are four possible outcomes in encompassing tests: (1) both models are accepted; (2) Model 1 is accepted and Model 2 is rejected; (3) Model 2 is accepted and Model 1 is rejected; (4) both models are rejected.
At this point, I divide the general model (Model 1) into four different submodels (Models 2 to 5) and apply encompassing testing to the competing models in order to determine if any of the sets of variables included in Model 1 is able to explain by itself growth trends in Europe in the 1980s. My intention is twofold. I first test whether employment factors, both as start-off conditions or dynamic variables, have a greater explan- atory power than sectoral gross-value- added data in the genesis of regional growth of GDP, or if economic factors (as it has often been assumed) prevail.13 I then determine if the initial situation or dynamic processes separately suffice to explain growth rates.
Start-off Conditions and Growth
Using encompassing tests, I compare two non-nested models. In both models regional growth is regressed against sets of variables. The first one (Model 2) includes the share of GVA in each sector as a percentage of GDP in 1980 and the
" Two models (or hypotheses) are said to be "non-nested" if neither can be obtained from the other by the imposition of appropriate restrictions or as a limit of a suitable approxi- mation (Eatwell, Milgate, and Newman 1987, 670).
12 As Mizon indicates, "the encompassing principle is concerned with the ability of a model to account for the behavior of others, or, less ambitiously, to explain the behavior of relevant characteristics of other models" (1984, 136).
13 A priori it might be expected that sectoral gross value added might have a greater influence, both from a start-off as well as a dynamic basis, than employment in explaining growth, since sectoral gross value added is included in the composition of GDP.
This content downloaded from 169.229.32.138 on Fri, 9 May 2014 19:15:28 PMAll use subject to JSTOR Terms and Conditions

Table 1
Independent Variables Used in the Analysis
Independent Correlation Coefficient Variables Definition with Growth
El % of active population employed in agricultural,
forestry, and fishery products sector in 1980 -0.11
E2 % of active population employed in secondary
sector in 1980 -0.15
E3 % of active population employed in tertiary
sector in 1980 0.26
AE1 Annual rate of growth of employment in agricultural,
forestry, and fishery products sector, 1980-89 -0.27
AE2 Annual rate of growth of employment in secondary
sector, 1980-89 0.10
AE3 Annual rate of growth of employment in tertiary
sector, 1980-89 -0.17
Gl % of gross value added at factor cost provided by
agricultural, forestry and fishery products sector in 1980 -0.03
G2 % of gross value added at factor cost provided by
secondary sector in 1980 0.09
G3 % of Cross value added at factor cost provided by
tertiary sector in 1980 0.15
AGI Annual rate of growth of gross value added in
agricultural, forestry, and fishery products sector, 1980-89 -0.32
AG2 Annual rate of growth of gross value added in
secondary sector, 1980-89 0.20
AG3 Annual rate of growth of gross value added in
tertiary sector, 1980-89 -0.38
P1 Labor productivity, measured in ECUs, in agricultural,
forestry, and fishery products sector in 1980 0.08
P2 Labor productivity, measured in ECUs, in secondary
sector in 1980 0.01
P3 Labor productivity, measured in ECUs, in tertiary
sector in 1980 0.06
API Annual rate of growth of labor productivity in
agricultural, forestry, and fishery products sector, 1980-89 0.14
AP2 Annual rate of growth of labor productivity in
secondary sector, 1980-89 0.16
AP3 Annual rate of growth of labor productivity in
tertiary sector, 1980-89 0.10
This content downloaded from 169.229.32.138 on Fri, 9 May 2014 19:15:28 PMAll use subject to JSTOR Terms and Conditions

336 ECONOMIc GEOGRAPHY
Table 2
Regional Growth Regressed on Start-off Sectoral Share of Gross Value Added (Model 2)
Variable Coefficient Standard Error t-statistic
GI .0589782 .01163 5.07235 G2 .0451404 .00505 8.93232 G3 .0942477 .00358 26.33668 R2 = .9936940 a = .5947371 F(3, 92) = 4832.46 p = .0000
Table 3
Regional Growth Regressed on Start-off Employment Conditions (Model 3)
Variable Coefficient Standard Error t-statistic
El .0695784 .00576 12.07421 E2 .0586900 .00653 8.98416 E3 .0838148 .00415 20.19773
2 R = .9918813 or = .6748270 F(3, 92) = 3746.63 p = .0000
second (Model 3) the share of employ- ment in each of the three main sectors in the same year.14 The results are presented in Tables 2, 3, and 4.
The encompassing tests show that, from a statistical point of view, none of the mod- els provides a valid explanation for growth rates in the EC in the 1980s; that is to say, none of the models analyzed "encom- passes" the other. At a level of significance of 5 percent, the values of the tests clearly demonstrate that both models are rejected, since the numerical results obtained ex- ceed the critical values of the different en- compassing tests.15 This indicates that nei- ther initial conditions in employment nor
14 Each set comprises three different vari- ables. In the first model (Model 2), variables are GI, G2, and G3; in the second (Model 3), El, E2, E3. The average regional growth rate is the dependent variable (y) (see Table 1 for specifications on concrete variables). Since the sum of all the variables in each set is 100, and in order to avoid problems of multicollinearity, regressions are performed without a constant.
5The critical values are 2.63 for F(3,89), 1.96 for N(0,1) and 7.81 for Chi2(3).
the share of GVA in 1980 decipher by them- selves the enigmas behind regional growth in Western Europe during the 1980s.
Dynamic Trends and Growth
In the second encompassing test annual rates of regional growth are regressed on two sets of dynamic variables. The first one (Model 4) consists of the mean annual rate of growth of the share of sectoral participation in GDP during the 1980s, while the second one (Model 5) includes the mean annual rate of growth of the share of employment in each of the three main sectors for the same period of time.16
16 Each of the sets consists of three different variables. The first set (Model 4) includes AGI, AG2, and AG3. In the second set (Model 5), the variables include AE1, AE2, and AE3. Again, the average regional growth rate, as the dependent variable (y), is regressed on both sets (see Table 1 for specifications on concrete variables). Since change in one of the variables of the set affects the behavior of the other set, regressions are performed, once again, without a constant, in order to avoid multicollinearity.
This content downloaded from 169.229.32.138 on Fri, 9 May 2014 19:15:28 PMAll use subject to JSTOR Terms and Conditions

SOCIOECONOMIC RESTRUCTURING AND REGIONAL CHANGE 337
Table 4
Encompassing Tests for Models 2 and 3
Model 2 vs. Model 3 vs. Model 3 Form Test Form Model 2
3.090 N(0,1) Cox N(0,1) -11.295 -3.292 N(0,1) Ericsson IV N(0,1) 9.731 22.595 x2(3) Sargan X2(3) 38.092 9.658 F(3, 89) Joint Model F(3, 89) 20.963
Note: Model 2: y is regressed on G1, G2, and G3. Model 3: y is regressed on El, E2, and E3.
The results of this test are very similar to that of the previous one (Tables 5, 6, and 7).
Once more, the numerical results of the encompassing analysis exceed the critical values for each test and lead us to reject the hypothesis that one model "encom- passes" the other. Therefore, the results confirm that the annual rates of growth in neither the share of employment nor in the share of sectoral GVA participation to GDP act as exclusive explanatory vari- ables of growth.
The encompassing test results clearly contest the idea of the supremacy of economic structural models over social structural explanations of development and growth. All four economic and social, static and dynamic models were rejected, and none was judged better than the others. Such evidence supports the con- tention that regional economic growth is not just the result of the interaction of a limited number of economic factors, but the consequence of a complicated and
multifaceted process in which social, political, and cultural elements-along with economic factors-play significant roles. When capital and labor tend to move freely, traditional economic loca- tional factors are no longer able to explain on their own how and why economic activity flourishes in certain areas and not in others. On the other hand, sociostruc- tural variables alone also do not suffice to interpret a burst of regional growth in a particular territory.
What elements are responsible for triggering growth? What circumstances concentrate growth in certain areas and not in others? The results of the encom- passing tests encourage us to think about explaining regional growth in terms of both economic and social structural as- pects such as productivity per employee in each sector. We also need to take account of static and dynamic dimensions of growth. The capacity of one region to grow faster than others may depend more on the initial conditions that predispose it
Table 5
Regional Growth Regressed on Annual Rates of Growth of Sectoral Share of Gross Value Added (Model 4)
Variable Coefficient Standard Error t-statistic
AGi -.7227118 .10482 -6.89499 AG2 .0801835 .35457 .22614 AG3 2.9434804 .59100 4.98055 R2 _ .8109806
r= 3.2561378 F(3, 92) = 131.57 p = .0000
This content downloaded from 169.229.32.138 on Fri, 9 May 2014 19:15:28 PMAll use subject to JSTOR Terms and Conditions

338 ECONOMic GEOGRAPHY
Table 6
Regional Growth Regressed on Annual Rates of Growth of the Share of Employment in Each Sector (Model 5)
Variable Coefficient Standard Error t-statistic
SE1 - .6462896 .13082 -4.94018 AE2 - .8419271 .24590 - 3.42391 AE3 1.8017496 .39361 4.57751 R= .7478188 a= 3.7610220 F(3, 92) = 90.94 p = .0000
to develop at a faster pace than neighbor- ing areas than on the actual economic and social processes occurring in a determined territory over a certain period of time.
The final portion of the analysis is a cross-sectional study of socioeconomic structure, the social (employment) and economic (GVA) dimensions, as well as the combination of both variables (labor productivity), in their static and dynamic forms. My goal is to identify the sectoral variables that have affected the develop- ment of growth rates most strongly during the last decade and to see if a new territorial pattern is emerging.
Socioeconomic Restructuring and Regional Growth
If traditional economic locational factors do not explain economic activity and growth in the EC sufficiently, what structural factors have promoted regional growth in the EC in the last decade? All twelve variables used in the encompass- ing tests are included in the final analysis. They capture start-off conditions and rates of growth in the share of employment and start-off conditions and rates of growth in the share of GVA. As mentioned before, the encompassing tests have also led me to include in the analysis a final set of variables representing the combination of employment and GVA variables. Data in this set describe the productivity of labor (P) across different sectors in 1980, in its static dimension, and the rates of growth of sectorial productivity during the 1980s,
from a dynamic point of view.17 The final model (Model 6) is
y = Oc + 13G + 32AG + 81E + 8A2SE + y1P + y2\AP + E (2)
where P is the initial labor productivity in each of the three main socioeconomic sectors, and ASP is the mean annual rate of growth of labor productivity in GDP of each sector between 1980 and 1989.
Table 1 indicates that none of the variables included in the analysis demon- strates a strong or even moderate correla- tion with regional growth rate during the 1980s; coefficients are insignificant (p = .05). Therefore, few conclusions can be drawn from an analysis of isolated factors. The correlation coefficients between growth and the 18 independent variables thus strengthen the idea of the multifac- eted nature of regional growth in a restructuring society.
Regression Analysis
Several preliminary regressions were executed with all variables. In order to obtain the final empirical model, t-tests and a joint F test were performed on the coefficients of the redundant variables. At a 95 percent level of significance, an empirical model was accepted as a valid
17 Variables included in the last set are P1, P2, P3, AP1, AP2, and AP3 (see Table 1 for specifications on concrete variables).
This content downloaded from 169.229.32.138 on Fri, 9 May 2014 19:15:28 PMAll use subject to JSTOR Terms and Conditions

SOCIOECONOMIC RESTRUCTURING AND REGIONAL CHANGE 339
Table 7
Encompassing Tests for Models 4 and 5
Model 4 vs. Model 5 vs. Model 5 Form Test Form Model 4
-4.946 N(O, 1) Cox N(O, 1) -9.334 3.995 N(O,1) Ericsson IV N(O,1) 6.274
14.524 x2(3) Sargan x2(3) 33.929 5.561 F(3, 89) Joint Model F(3, 89) 17.333
Note: Model 4: y is regressed on AGI, AG2, and AG3. Model 5: y is regressed on SEI, AE2, and AE3.
simplification of the general theoretical model. The empirical model is
y = a + AERx + AE3x + Pix + P2x + AP2x + AP3x + e (3)
Significant variables selected in the em- pirical model represent fairly well the distribution of variables in the theoretical model. Both variables indicating the start-off conditions as well as those representing processes are included. Em- ployment and productivity variables also appear in the model. There is only one significant absence: none of the six variables containing sectoral GVA as a share of GDP emerged as significant. Such an outcome could not be expected a priori, since it is normally regarded as logical that GVA, as an endogenous component of GDP and thus of its rate of growth, may have a more solid effect on regional development than com- pletely exogenous factors, as in the case of employment. Nevertheless, this fact serves to reinforce the idea of the influence of social or socially related
factors in economic growth in a post- Fordist society.
Table 8 reports the outcomes of the regression of annual regional growth rates during the 1980s on the six variables included in the empirical model. This model reveals a close relationship be- tween labor productivity trends and re- gional growth rates. Nonetheless, dy- namic labor productivity variables are more strongly related to growth than static ones. As the regression shows, the initial conditions of labor productivity in agriculture and industry, in spite of high levels of significance, do not have a decisive positive or negative influence on growth rates. Increases in labor produc- tivity in industry and services during the 1980s do have positive or negative im- pacts on growth. Any increase in the productivity of the tertiary sector is negatively related to growth, while labor productivity increases in industry result in increasing development rates. This is fundamentally due to the fact that the regions that have experienced a moderate
Table 8
Annual Rates of Regional Growth Regressed on the Independent Variables of the Empirical Model
AE1 AE3 P1 P2 AP2 AP3
-0.0965 -0.4298 0.0013 -0.0058 0.1162 -0.0858 (-4.82) (-3.89) (1.99) (-2.06) (3.04) (-2.59) Intercept = 7.3257 (45.44) R2 = 0.3145 F(6,89) = 6.117 a t-statistics are in parentheses.
This content downloaded from 169.229.32.138 on Fri, 9 May 2014 19:15:28 PMAll use subject to JSTOR Terms and Conditions

340 ECONOMIC GEOGRAPHY
rise in productivity in the tertiary sector are the peripheral regions of Spain, Portugal, and the Italian Mezzogiorno, where this increase is mainly concen- trated in small wholesale and retail and administrative services. Productivity in other types of services more closely associated with post-Fordist restructur- ing, such as financial services and services to industries, changes little throughout the period. On the other hand, the regions with the highest increase in industrial productivity tend to be for- merly intermediate regions (Catalonia, Midi-Pyrenees, Languedoc-Roussillon, Veneto) that had the initial socioeconomic conditions necessary to attract flexible production plants.
The model clearly suggests that large increases in employment in agriculture and in the service sector during the 1980s curb the possibilities of regional economic growth. Results in the service sector are extremely significant. There is a strong negative correlation between employ- ment in the tertiary sector and regional development.
The whole model raises interesting questions about the real role played by the emerging service economy in a restructuring society and about the prom- inence of service activities as the new motor of growth (Riddle 1986; Ochel and Wegner 1987; Nusbaumer 1987a, 1987b; Grubel and Walker 1989). The service sector has experienced the largest expan- sion in Western Europe during the 1980s. Nevertheless, this expansion in employ- ment has not been matched by a similar development of growth rates during the 1980s. It is true that some types of services (e.g., services to industries) trig- ger an increase in productivity and thus encourage growth (Petit 1986; Riddle 1986; McKenzie 1987; Ochel and Wegner 1987). And it is also true that some of the regions with the highest growth rates have developed a strong, dynamic, high- quality service sector. This is the case of Baden-Wiirttemberg, Bavaria, Hessen, Lombardy, and Tuscany, all regions that
at the beginning of the decade already possessed strong service sectors.
Nevertheless, these regions constitute the exception, not the rule. The service sector has boomed in areas that had small tertiary economies at the beginning of the 1980s. Regions undergoing strong indus- trial decline (such as Wallonia, Saarland, the Basque Country, or Asturias) and, in particular, old agricultural regions like Galicia, Cantabria or both Castiles in Spain; Burgundy in France; Abruzzi, Basilicata, Molise, Calabria, and Sicily in Italy; and Centro, Alentejo, and Algarve in Portugal constitute the new expanding tertiary spaces. In those areas, economic restructuring has meant the emergence of a new, poorly paid, and precarious service economy where labor productivity in- creases are negligible. In those relatively lagging regions, the service sector has absorbed workers escaping from industrial decline and the crisis in agriculture. It is a very different "tertiarization" from the one occurring in core areas, where, to a certain extent, highly educated and dy- namic individuals enter a productive tertiary sector. In lagging areas, a precar- ious service economy has become a substitute for unemployment: a sort of social policy, financed through budgetary solidarity, whose goal is to avoid social and political unrest.
In addition, the results demonstrate that industry still plays a significant role in regional economic growth, although de- velopment is by no means fostered in traditional mass production regions, as it was in the 1970s (start-off conditions in industrial productivity have a slight nega- tive association with growth). Old Fordist areas, such as Wallonia, Nord-Pas-de- Calais, Lorraine, Liguria, Yorkshire, and the North and North-West of England are among the regions with the lowest growth rates during the 1980s. Growth has occurred in those regions that have managed to transform their old industrial fabric into a flexible production structure in a shorter period of time than the traditional Fordist areas. This has been achieved mainly in core and capital
This content downloaded from 169.229.32.138 on Fri, 9 May 2014 19:15:28 PMAll use subject to JSTOR Terms and Conditions
SOCIOECONOMIC RESTRUCTURING AND REGIONAL CHANGE 341
regions, like the South-East of England, Brussels, Bremen, Ile de France, or Lazio, where financial and informational concentration meet with highly skilled and highly qualified labor. Some other intermediate regions, such as Scotland, the Limousin, Languedoc-Roussillon, and Veneto, have accomplished this step with relative success.
Conclusions
The results challenge some of the established knowledge on post-Fordist spatial restructuring. First, it is evident that the predicted transformation from a nationally oriented to a spatially dual pattern of distribution of wealth has not yet occurred. Despite the profound shift during the 1970s and 1980s in employ- ment, labor productivity, and value added by sector, a new territorial organization of wealth is not evident. Certain scattered areas have undoubtedly been affected by flexible production methods, altering their growth potential, but the majority of regions in the EC have seen no significant shift in growth patterns. Evidence sug- gests that the nation-state still has an important impact on the distribution of wealth. Subnational spaces, such as re- gions, find it difficult to escape the rigid social corset of the national dimension and to benefit from centrifugal forces con- tained in the process of flexibilization of the production system. Moreover, the influence of start-off effects is noteworthy. Sectoral growth variables reflecting the dialogue between the previously existing social and economic conditions and inno- vation processes have also had a signifi- cant impact on growth rates, although their effect in the distribution of GDP might be understated because of the time limitations of the study.
The results also stress the relevance of noneconomic indicators. We have seen how employment variables manifest a stronger relationship with regional growth rates in Western Europe than economic shifts in value added. In the last decade,
in Western Europe, transformations in labor productivity and in the composition of the labor force have been significantly more important than changes in the composition of the sectoral GVA. There- fore, in a restructuring society, the ability of the social sphere to adapt to rapid changes in economic indicators deter- mines to a great extent the possibilities of growth of a certain place.
Furthermore, the empirical outcomes cast doubt on the understanding of the role played by the secondary and tertiary sectors in recent spatial transformations. The global consideration of the tertiary sector as the new engine of growth is by no means borne out in the analysis. On the contrary, the expansion of service activities has had a negative influence on growth rates during the last decade in Western Europe. In contrast, industry remains the key sector for promoting growth.
It is clear, therefore, that despite huge transformations in the production order in the last decade, many of the characteris- tics of the Fordist spatial organization linger on. Some features of what has been regarded as the post-Fordist spatial con- figuration are timidly surfacing and will probably acquire greater importance in the coming years, but the inability of many areas to readapt their social struc- ture to shifting economic conditions is likely to obstruct the emergence of a new and clear-cut spatial system in the short term.
Finally, perhaps our understanding of the spatial consequences of socioeconomic restructuring are at least partial and influenced by a tendency to resort con- stantly to the analysis of the most favorable cases. In order to obtain better insight into how flexible production meth- ods are altering spatial relationships, there is a need to proceed with case studies covering regions regarded as still untouched by flexible production, as well as proceeding with large cross-sectional analyses. Subsectoral studies of the indus- trial and service sectors are essential to grasp the nature of recent spatial transfor-
This content downloaded from 169.229.32.138 on Fri, 9 May 2014 19:15:28 PMAll use subject to JSTOR Terms and Conditions

342 ECONOMic GEOGRAPHY
mations. Other critical social and political aspects might also be taken into consider- ation in cross-sectional studies (e.g., pop- ulation structure and the ageing of popu- lation, educational levels, gender issues, xenophobia, the composition of the labor force, the degree of regional autonomy). Only in this way will we be able to assert whether the shift from mass production to flexible production constitutes, in spatial terms, more than a simple cyclical capital- ist crisis.
References Agnew, J. A. 1987. Place and politics: The
geographical mediation of state and society. Boston: Allen and Unwin.
Agnew, J. A., and Duncan, J. S., eds. 1989. The power of place: Bringing together geograph- ical and sociological imaginations. Boston: Unwin Hyman.
Benko, G. 1992. Industrial space, locational logic and regional development (in French). Espaces et Societe's 66-67:129-46.
Berry, M. 1989. Industrialisation, de-industri- alisation and uneven development: The case of the Pacific Rim. In Capitalist development and crisis theory: Accumulation, regulation and spatial restructuring, ed. M. Gottdiener and N. Komninos, 174-216. London: Mac- millan.
Boyer, R. 1989. New directions in management practices and work organisation: General principles and national trajectories. Paris: OECD.
Browett, J. 1987. On the significance of geographical space: Reply to Smith. Interna- tional Journal of Urban and Regional Research 11:262-69.
Castells, M. 1989. The informational city. Oxford: Basil Blackwell.
Cooke, P. 1992. Regional innovation systems: Competitive regulation in the new Europe. Geoforum 23:365-82.
Cooke, P., and Morgan, K. 1992. The network paradigm. New departures in corporate regional development. Discussion memo.
Dunford, M. 1992. Endogenous development, "developmentalist" state and world markets (in French). Espaces et Societe's 66-67:99- 127.
Eatwell, J.; Milgate, M.; and Newman, P., eds. 1987. The new Palgrave: A dictionary of economics. London: Macmillan.
Entrikin, J. N. 1989. Place, region and modernity. In The power of place: Bringing together geographical and sociological imag- inations, ed. J. A. Agnew and J. S. Duncan, 30-43. Boston: Unwin Hyman.
Giddens, A. 1985. Time, space and regionalisa- tion. In Social relations and spatial struc- tures, ed. D. Gregory and J. Urry, 265-69. London: Macmillan.
Gottdiener, M. 1987. Space as a force of production: Contribution to the debate on realism, capitalism and space. International Journal of Urban and Regional Research 11:405-16.
. 1989. Crisis theory and socio-spatial restructuring: The US case. In Capitalist development and crisis theory: Accumula- tion, regulation and spatial restructuring, ed. M. Gottdiener and N. Komninos, 365-90. London: Macmillan.
Gregory, D., and Urry, J., eds. 1985. Social relations and spatial structures. London: Macmillan.
Grubel, H. G., and Walker, M. A. 1989. Modern service sector growth: Causes and effects. In Services in world economic growth, ed. H. Giersch, 1-34. Institut fur Weltwirtschaft an der Universitdt Kiel, Tfibingen: J.C.B. Mohr.
Harvey, D. 1985. The urbanization of capital. Oxford: Basil Blackwell.
Hausermann, H., and Kramer-Badoni, T. 1989. The change of regional inequality in the Federal Republic of Germany. In Capitalist development and crisis theory: Accumulation, regulation and spatial re- structuring, ed. M. Gottdiener and N. Komninos, 331-47. London: Macmillan.
Hendry, D. F., and Richard, J. F. 1989. Recent developments in the theory of encompass- ing. In Contributions to operations research and economics: The twentieth anniversary of CORE, ed. B. Cornet and H. Tulkens, 393-440. Cambridge: MIT Press.
Keeble, D.; Offord, J.; and Walker, S. 1988. Peripheral regions in a community of twelve member states. Brussels-Luxembourg: Com- mission of the European Communities, O.P.O.C.E..
Kennedy, P. 1985. A guide to econometrics. Oxford: Basil Blackwell.
Komninos, N. 1989. From national to local: The Janus face of crisis. In Capitalist development and crisis theory: Accumula- tion, regulation and spatial restructuring, ed. M. Gottdiener and N. Komninos, 348-44. London: Macmillan.
This content downloaded from 169.229.32.138 on Fri, 9 May 2014 19:15:28 PMAll use subject to JSTOR Terms and Conditions

SOCIOECONOMIC RESTRUCTURING AND REGIONAL CHANGE 343
. 1992. The new spaces of growth: The birth of postfordist development centers (in French). Espaces et Societes 66-67:217-33.
Krugman, P. 1991. Geography and trade. Leuven: Leuven University Press; and Cambridge: MIT Press.
Leborgne, D., and Lipietz, A. 1992. False ideas and open questions of the postfordist period (in French). Espaces et Societe's 66-67:39-68.
McKenzie, R. B. 1987. The emergence of the "service economy": Fact or artifact? In Conceptual issues in service sector research: A symposium, ed. H. G. Grubel, 73-97. Vancouver: Fraser Institute.
Markusen, A. 1985. Profit cycles, oligopoly and regional development. Cambridge: MIT Press.
Marshall, J. N., and Wood, P. A. 1992. The role of services in urban and regional development: Recent debates and new directions. Environment and Planning A 24:1255-70.
Massey, D. 1984. Spatial divisions of labor: Social structures and the geography of production. London: Macmillan.
Mizon, G. E. 1984. The encompassing ap- proach in econometrics. In Econometrics and quantitative economics, ed. D. F. Hendry and K. F. Wallis, 135-72. Oxford: Basil Blackwell.
Morris, J. 1987. The internationalisation of banking, technological change and spatial patterns: A case study in South Wales. Geoforum 18:257-67.
Murphy, A. B. 1991. Regions as social con- structs: The gap between theory and prac- tice. Progress in Human Geography 15:22- 35.
Nusbaumer, J. 1987a. Services in the global market. Boston: Kluwer Academic.
. 1987b. The services economy: Lever to growth. Boston: Kluwer Academic.
O'Brien, R. 1992. Globalfinancial integration: The end of geography. London: Royal Institute of International Affairs.
Ochel, W., and Wegner, M. 1987. Service economies in Europe: Opportunities for growth. London: Pinter.
Perroux, F. 1957. General theory of economic progress (in French). Paris: ISEA.
Petit, P. 1986. Slow growth and the service economy. London: Pinter.
Porter, M. E. 1990. The competitive advantage of nations. London: Macmillan.
Riddle, D. I. 1986. Service-led growth: The role of the service sector in world develop- ment. New York: Praeger.
Sassen, S. 1990. The mobility of labor and capital: A study in international investment and labor flow. Cambridge: Cambridge University Press.
Sayer, A. 1985. The difference that space makes. In Social relations and spatial structures, ed. D. Gregory and J. Urry, 49-66. London: Macmillan.
Scott, A., and Storper, M., eds. 1986. Produc- tion, work, territory: The geographical anatomy of industrial capitalism. London: Allen and Unwin.
. 1992. Regional development revisited (in French). Espaces et Societe's 66-67:7-38.
Soja, E. W. 1985. The spatiality of social life: Towards a transformative retheorisation. In Social relations and spatial structures, ed. D. Gregrory and J. Urry, 90-120. London: Macmillan.
. 1989. Postmodern geographies: The reassertion of space in critical social theory. London: Verso.
Stdhr, W. B., ed. 1990. Global challenge and local response: Initiatives for economic regeneration in contemporary Europe. Lon- don: Mansell for the United Nations Univer- sity.
Storper, M., and Scott, A. J. 1989. The geographical foundations and social regula- tion of flexible production complexes. In The power of geography: How territory shapes social life, ed. J. Wolch and M. Dear, 21-40. Boston: Unwin Hyman.
Thrift, N. 1987. The fixers: The urban geogra- phy of international commercial capital. In Global restructuring and territorial devel- opment, ed. J. Henderson and M. Castells, 203-33. Beverly Hills: Sage.
Urry, J. 1985. Social relations, space and time. In Social relations and spatial structures, ed. D. Gregory and J. Urry, 20-48. London: Macmillan.
Vandermotten, C.; Capron, H.; Decrolly, M.; and Romus, P. 1990. Regions and Europe (in French). Neuvieme Congres des Econo- mistes Belges de Langue Franqaise, Chale- roi: CIFoP.
This content downloaded from 169.229.32.138 on Fri, 9 May 2014 19:15:28 PMAll use subject to JSTOR Terms and Conditions