socio-economic inequalities in the pathway of care for pancreatic cancer james brown, jean adams,...
TRANSCRIPT

Socio-economic inequalities in Socio-economic inequalities in the pathway of care for the pathway of care for
pancreatic cancerpancreatic cancer
James Brown, Jean Adams, Martin White & Mark Pearce
Institute of Health & SocietyNewcastle University
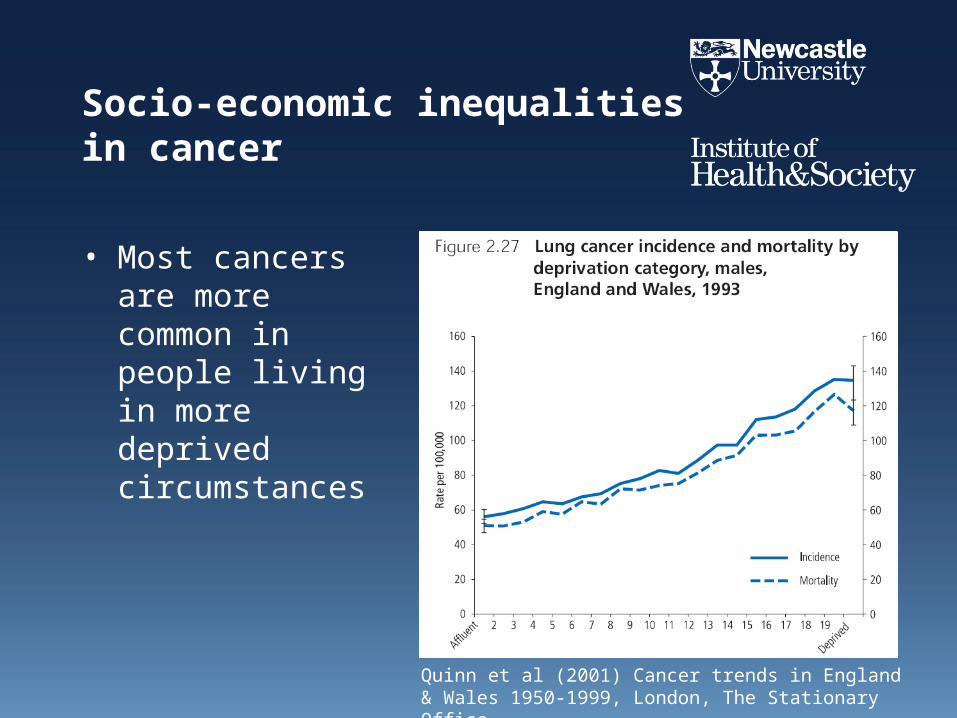
Socio-economic inequalities in cancer
• Most cancers are more common in people living in more deprived circumstances
Quinn et al (2001) Cancer trends in England & Wales 1950-1999, London, The Stationary Office

• People living in more deprived circumstances experience worse survival from cancer
Socio-economic inequalities in cancer
Quinn et al (2001) Cancer trends in England & Wales 1950-1999, London, The Stationary Office

Pancreatic cancer
• 10th most common cancer; 6th most common cause of cancer death in UK– 7600 diagnoses/year; 7300 deaths/year
• Rapidly fatal– 13% live 1 year or more– 2-3% live 5 years or more
• Risk factors– smoking, diabetes, obesity– chronic pancreatitis
• Socio-economic patternnot clear

Pancreatic cancer care pathway
Symptoms
GP
Hospital
Diagnosis
No treatmentTreatment
Research questions
• After controlling for age and gender, are there socio-economic inequalities in incidence?
• After controlling for age, gender and co-morbidity are there socio-economic inequalities in:– who is receives treatment?– delay from:
• GP referral to first hospital appointment?• first hospital appointment to diagnosis?• diagnosis to receipt of treatment?
Methods
• NYCRIS data on all pancreatic adenocarcinomas, 1998-2004, linked to Hospital Episode Statistics
• Statistical analysis– sex-specific, directly age standardized incidence– logistic regression for receipt of treatment– Cox regression for delays
Results
• 5 387 cases• 52% female• 58% diagnosed at age 70+• 87% with Charleson index of 0• 25% received treatment• Median delay from:
– GP referral to first hospital appointment = 8 days– first hospital appointment to diagnosis = 6 days– diagnosis to receipt of treatment = 40 days
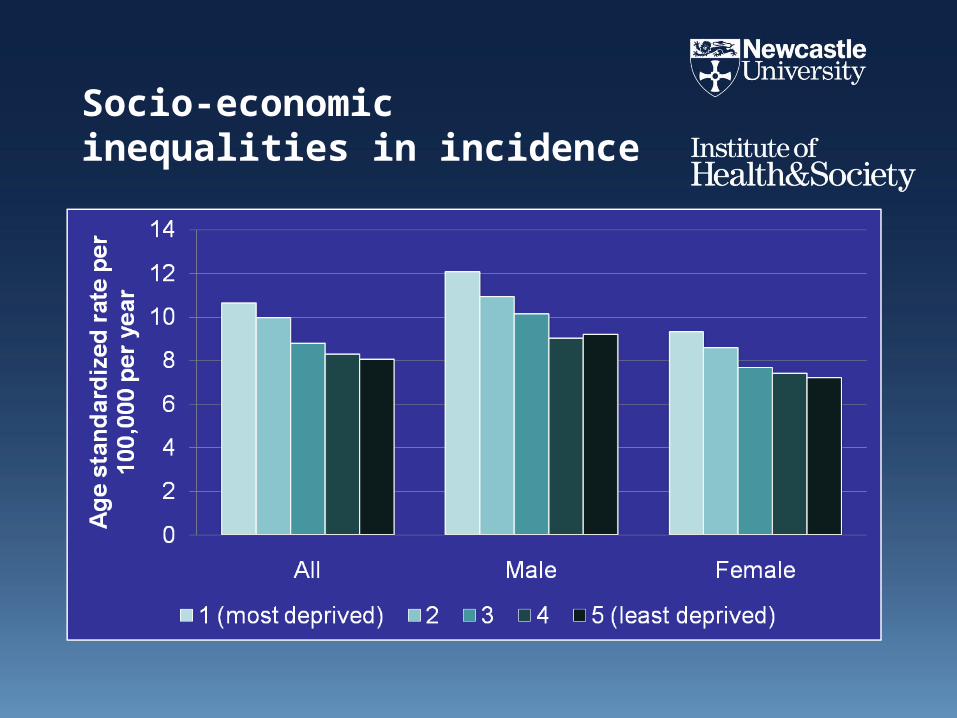
Socio-economic inequalities in incidence
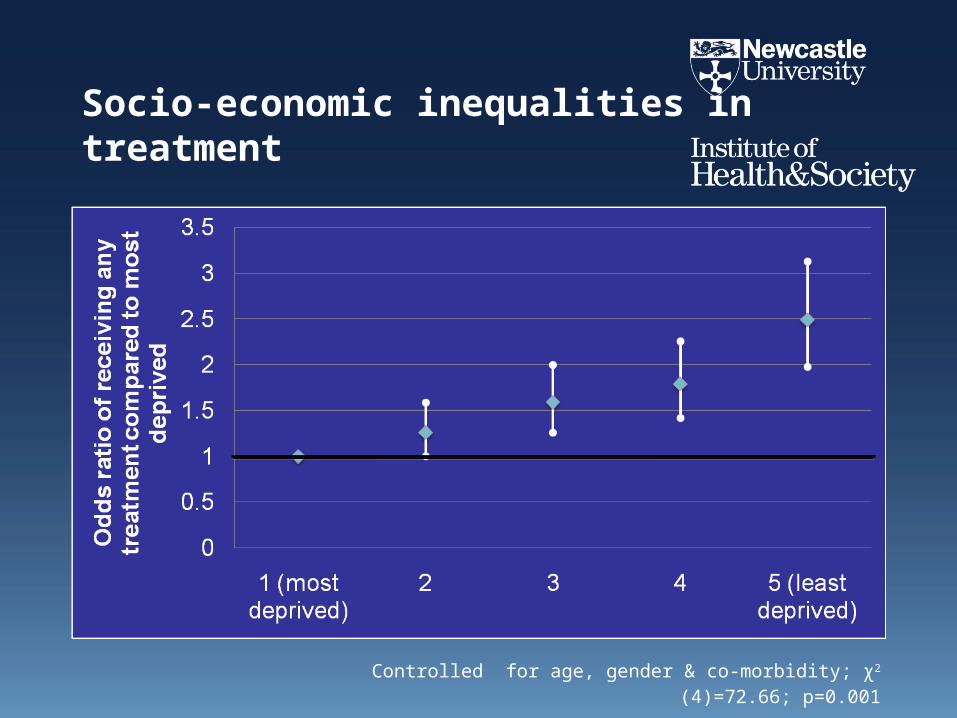
Socio-economic inequalities in treatment
Controlled for age, gender & co-morbidity; χ2 (4)=72.66; p=0.001
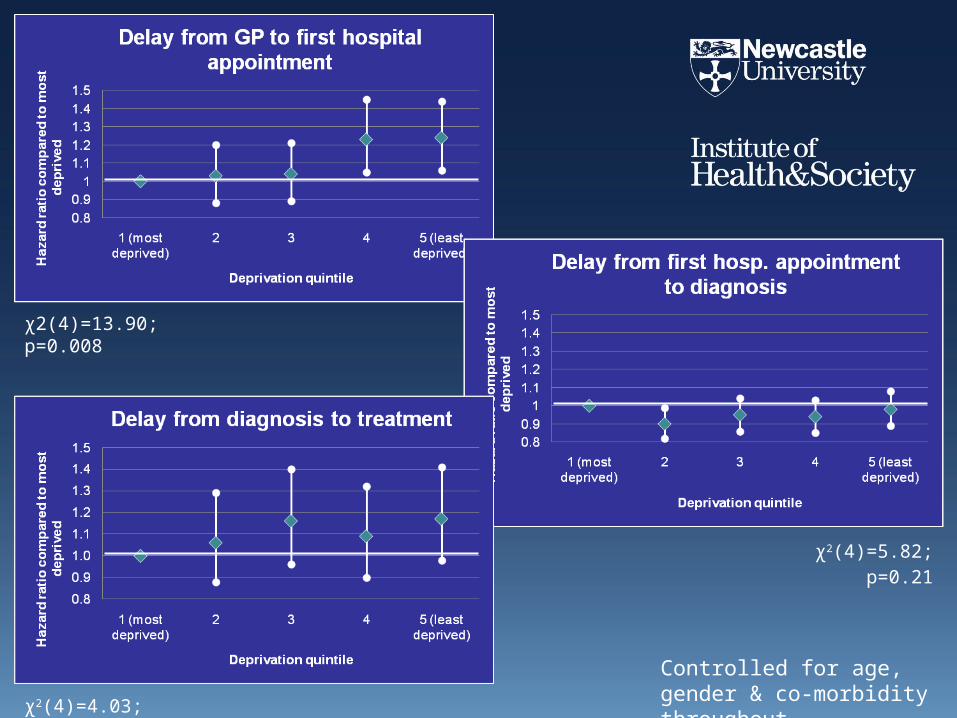
χ2(4)=4.03; p=0.40
χ2(4)=13.90; p=0.008
χ2(4)=5.82; p=0.21
Controlled for age, gender & co-morbidity throughout

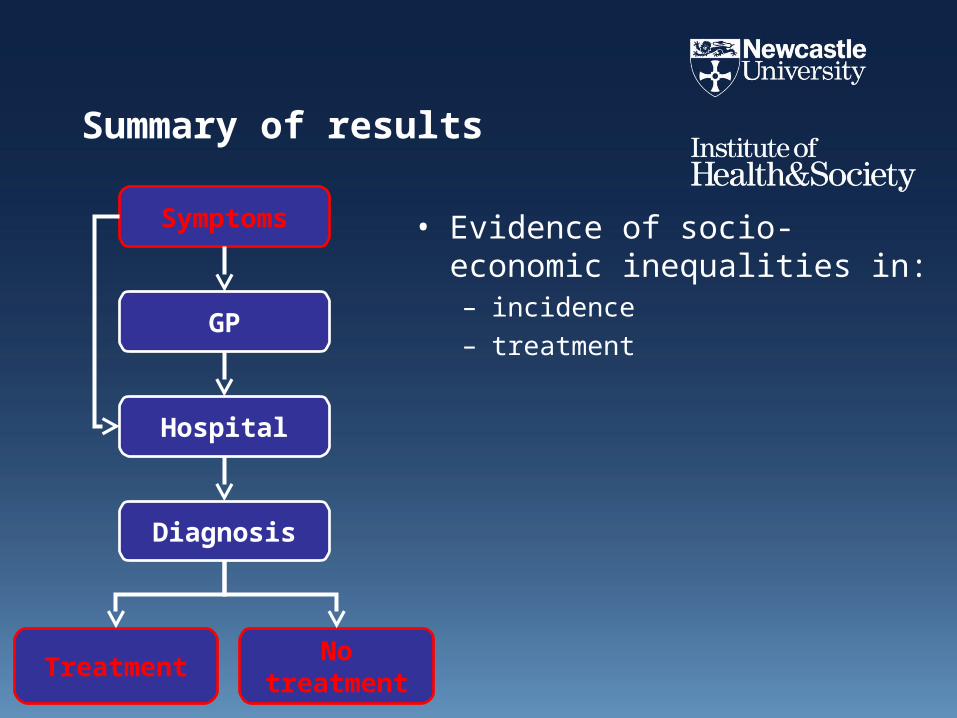
Summary of results
• Evidence of socio-economic inequalities in:
Symptoms
GP
Hospital
Diagnosis
No treatmentTreatment

Summary of results
• Evidence of socio-economic inequalities in:– incidence
Symptoms
GP
Hospital
Diagnosis
No treatmentTreatment
Summary of results
• Evidence of socio-economic inequalities in:– incidence– treatment
Symptoms
GP
Hospital
Diagnosis
No treatmentTreatment
Summary of results
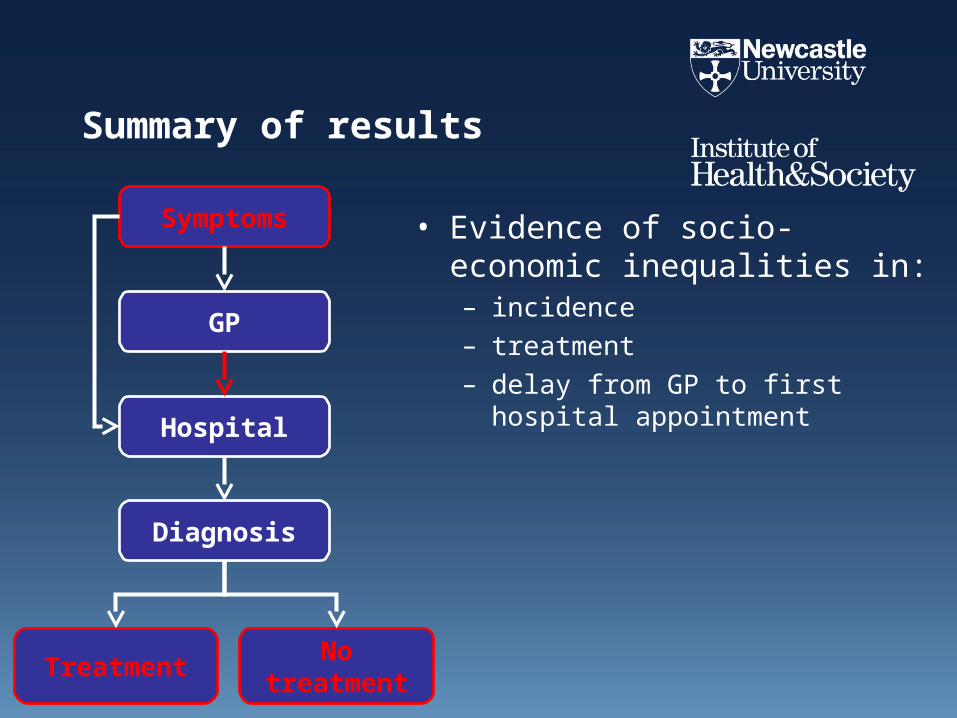
• Evidence of socio-economic inequalities in:– incidence– treatment– delay from GP to first hospital
appointment
Symptoms
GP
Hospital
Diagnosis
No treatmentTreatment

Summary of results
• Evidence of socio-economic inequalities in:– incidence– treatment– delay from GP to first hospital
appointment
• No evidence of socio-economic inequalities in:– delay from first hospital
appointment to diagnosis– delay from diagnosis to treatment
Symptoms
GP
Hospital
Diagnosis
No treatmentTreatment

Major limitations & next steps
• No control for stage/grade at diagnosis• No modelling of effect of various inequalities on
survival• Any treatment rather than ‘best’ treatment
• Repeat with – common cancers – better data availability– clear NICE guidelines
• How and why are there socio-economic gradients in who gets treatment?– observations of consultations & MDT meetings?