socio economic impact of mobile broadband in kenya · socio economic impact of mobile broadband in...
TRANSCRIPT

Shola Sanni, Senior Policy Manager, Africa
Socio Economic Impact of
Mobile Broadband in Kenya

2
About the GSMA

3
Economic impact of mobile in Sub-Saharan Africa
Operator value
added
(wages, taxes
and business
surplus)
Knock-on effect in sectors
providing inputs in the supply
chain of mobile goods and services
Improved efficiency
throughout the
economy via the use of
mobile technology
(agriculture, education,
finance, health)
The mobile industry accounts for around
7.7% of GDP in Sub-Saharan Africa, taking
into account direct, indirect and productivity
effects.
Going forward, we expect the economic
contribution of the mobile industry in the
region will increase in both absolute and
relative terms - from $110bn to $140bn USD
in 2020 (8.6% of GDP).
This forecast relies on a favourable
macroeconomic environment and on a
moderate expansion in demand and supply
in the mobile market. The impact could
therefore be even higher if network coverage
and mobile adoption is accelerated,
especially of new 4G services.
3711
62110
2.6%
0.7%
4.3%
7.7%
0%
1%
2%
3%
4%
5%
6%
7%
8%
9%
0
20
40
60
80
100
120
140
Direct Impact Indirect Productivity Total
US
D B
illio
ns
Total contribution to GDP in 2016(percentages are proportions of GDP)
Source: GSMA Intelligence. GDP estimates are rounded to due to uncertainties in the data

Mobile market in Kenya: key metrics
4
Mobile subscribers
market penetration
Mobile internet
subscribers penetration
Proportion of 3G
Connections
Proportion of 4G
Connections
Kenya 54% 52% 22% 2%
Burundi 35% 11% 7% 0%
Rwanda 52% 24% 31% 11%
South Sudan 17% 9% 21% 0%
Tanzania 42% 29% 37% 2%
Uganda 40% 25% 19% 4%
Sub-Saharan Africa 43% 26% 31% 2%
The adoption of mobile technology in Kenya has advanced more quickly than other countries in East Africa as well
as most other countries in the Sub-Saharan African region
Mobile internet adoption in Kenya is higher than all other Sub-Saharan African countries
However, the majority of mobile users in Kenya are on 2G technologies and so are currently not benefitting from
the services enabled by 3G and 4G technologies
Source: GSMA Intelligence. Data as of Q4 2016
5
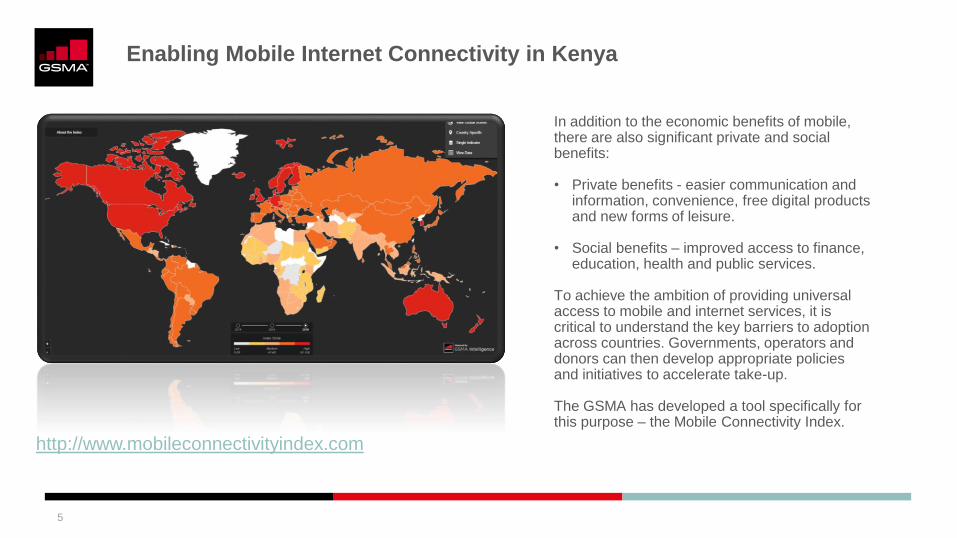
Enabling Mobile Internet Connectivity in Kenya
In addition to the economic benefits of mobile, there are also significant private and social benefits:
• Private benefits - easier communication and information, convenience, free digital products and new forms of leisure.
• Social benefits – improved access to finance, education, health and public services.
To achieve the ambition of providing universal access to mobile and internet services, it is critical to understand the key barriers to adoption across countries. Governments, operators and donors can then develop appropriate policies and initiatives to accelerate take-up.
The GSMA has developed a tool specifically for this purpose – the Mobile Connectivity Index.
http://www.mobileconnectivityindex.com

6
Mobile Connectivity Index
• What: The GSMA Mobile Connectivity Index
measures the performance of 150 countries
against four key enablers of mobile internet
connectivity
• Why: Support the efforts of the mobile industry and
the wider international community to deliver on the
ambition of universal internet access.
• How: The index is built up through 39 specific
indicators feeding into 13 dimensions which are
aggregated to give a score for each of the four
enablers. Scores fall within a range of 0-100.
• The results and the data are available on our web
tool – www.mobileconnectivityindex.com – and all
scores at the country and regional level can be
viewed from 2014 to 2016

7
Key Findings from the Index
There is a strong positive correlation between
index score and mobile internet penetration. The
index is therefore an effective tool to identify priorities
to drive mobile internet adoption.
There are no short cuts to creating a strong
enabling environment for mobile internet
adoption. Countries generally need high
performance across all four enablers.
Evaluate countries in the context of their clusters
and assess performance over time. The exact
scores and positions can be subject to a small
margin of error and many countries score very
closely. Kenya is currently in the emerging cluster.
• Leaders: High index scores and mobile internet
penetration.
• Fast Transitioners: Mobile Internet penetration
scores similar to the Leaders but achieved with
lower index scores.
• Transitioners: Typically score well on 2-3 enablers
• Emerging: Typically score well on 1-2 enablers
• Discoverers: Need to work on all four enablers
AUSAUT
BEL
CAN
CYPCZE
DNK
EST
FIN
FRA
DEU
HKG
HUN
ISLIRL
ISR
ITA
JPN
KOR
LVA LTU
LUX
NLD
NZL
NOR
POL
PRT
QAT
SGP
SVN
ESP
SWE
CHEGBR
USAARG
BHR
BRN
CHL
CHN
CRI
GRC
KWT
MYS
MLT
ROU
SAU
THA
ARE
URY
ALB
DZA
AZE
BLR
BLZ
BOL
BIH
BWA
BRA
BGR
KHM
COL
HRV
DOM
ECU
EGY
SLVFJI
GEO
GTM
HND
IDN
IRNJAM
JOR
KAZ
KGZ
LBN
MKD
MUS
MEX
MDA
MNGMNE
MAR
NAM
NIC
OMN
PAN
PRY
PER
PHL
RUS
LCA
SRB SVK
ZAF
LKA
TTOTUN
TUR
UKR
VEN
VNM
AGO
BGD
BTN
CMR
COG
CIV
ETH
GAB
GHA
IND
IRQ
KEN
LAO
LSO
MMR
NPL
NGA
PAK
PNG
RWA
SEN
SLB
SDNSWZTZA
UZB
YEM
ZWE
AFG
BENBFATCD
COD
GMB
GIN
LBR
MDGMWI
MLI
MRT
MOZ
NER
SLE
TGO
UGAZMB
010
20
30
40
50
60
70
80
90
Mobile
In
tern
et P
en
etr
ation (
%)
10 20 30 40 50 60 70 80 90
Index Score
Leaders Fast Transitioners
Transitioners Emerging
Discoverers Fitted Line
Mobile Internet Penetration and Index Scores (2016)

8
Results for Kenya and East Africa
0
10
20
30
40
50
60
70
Index S
core
Country Index Scores
2014 2015 2016
Source: GSMA Intelligence. Scores are normalized out of 100
• Kenya’s Index score is the highest in East Africa
and above the Sub-Saharan Africa average. It
has shown good improvement over time,
especially in 2016
• Kenya’s current score is in line with the
Emerging cluster, while the previous slide
showed that it had achieved greater mobile
internet connectivity than similar countries
• In order to enable greater connectivity -
particularly for 3G and 4G technology - and
move to the next Transitioner cluster, it needs to
address a number of enablers, particularly
around: network quality; affordability for those on
low incomes; digital skills, and; creation of
content in more local languages.
• We explore each of these further in the following
slides

9
Enabler Analysis
Source: GSMA Intelligence (2016 analysis). Scores are normalized out of 100.
• In both absolute and relative terms (relative to both the Emerging cluster and the next Transitioner cluster), Kenya’s score for
Consumer Readiness is higher than the other enablers, followed by Affordability, Infrastructure and then Content
• However, as shown in the following slides, within these enablers there are significant differences across the dimensions, for
example:
• The Consumer score is primarily driven by Kenya’s high score for gender equality, whereas its score for skills is much
lower
• On infrastructure, while Kenya scores lower than the Emerging average, there are dimensions where it actually performs
better (for example network coverage)
Kenya EAC Average Sub-Sahara
Africa Average
Emerging
Average
Transitioner
Average
Index 41.66 36.54 36.73 42.11 61.39
Infrastructure 34.33 33.01 32.13 36.28 52.03
Affordability 49.52 41.21 43.19 50.09 62.11
Consumer 61.48 55.53 49.25 51.20 71.81
Content 28.81 24.06 28.84 36.31 62.74

10
Infrastructure Analysis
Source: GSMA Intelligence (2016 analysis). Scores are normalized out of 100.
• Compared to most other countries in Africa, network coverage is fairly widespread in Kenya, with more than 90% 2G coverage and
more than 80% 3G coverage. 4G is also starting to be rolled out, reaching more than 20% by the end of 2016.
• However, network quality in Kenya (measured using download and upload speeds and latencies) is poorer than the EAC and SSA average
(where it is also relatively low)
• Kenya’s score for enabling infrastructure – for example access to electricity and IXP and server development - is in line with other African
countries but lower than the Emerging cluster average.
• The availability of spectrum is above the EAC, SSA and Emerging cluster average, partly due to the availability of digital dividend
spectrum (e.g. in the 800MHz band) which many other countries are yet to release for mobile services
Kenya EAC Average Sub-Sahara Africa
Average
Emerging Average
INFRASTRUCTURE 34.33 33.01 32.13 36.28
Network Coverage 56.14 52.37 45.97 52.81
Network Quality 21.93 27.80 25.00 27.97
Enabling Infrastructure 32.18 27.89 32.61 38.44
Spectrum 22.39 16.88 21.57 21.77

11
Affordability Analysis
Source: GSMA Intelligence (2016 analysis). Scores are normalized out of 100.
• Mobile internet services and internet-enabled devices are generally much more affordable in Kenya than most other African countries.• Entry-usage (users that require 100MB of data per month): plans are available in Lena for around $1, which is less than averages in EAC ($1.50)
and Sub-Saharan Africa more widely ( $3).
• Medium-usage (500MB of data per month): plans are available for around $2 - less than EAC ($35) and SSA ($5.50) averages
• High-usage (1GB per month plus voice & SMS): plans are available for around $10 - less than EAC ($13) and SSA ($30) averages
• Basic internet-enabled devices: these are available for around $30 – less than EAC ($35) and SSA ($45) averages
• Affordability in Kenya is also enabled by relatively lower taxation on mobile services compared to many other African countries.
• However, income inequality in Kenya is greater than the EAC, SSA and the Emerging cluster averages, meaning that affordability for those in
the bottom 20-40% of the population will be much higher and therefore a key barrier to mobile internet adoption
Kenya EAC Average Sub-Sahara Africa
Average
Emerging Average
AFFORDABILITY 49.52 41.21 43.19 50.09
Mobile Tariffs 41.21 32.37 27.67 35.65
Handset price 70.66 56.57 51.68 65.21
Taxation 69.65 49.54 62.52 60.67
Income 28.51 22.86 27.01 33.82
Inequality 37.56 44.72 47.10 55.13

12
Consumer Analysis
Source: GSMA Intelligence (2016 analysis). Scores are normalized out of 100.
Kenya EAC Average Sub-Sahara Africa
Average
Emerging Average
CONSUMER READINESS 61.48 55.53 49.25 51.20
Basic Skills 41.76 35.34 32.60 35.84
Gender Equality 81.19 75.71 65.90 66.56
• Kenya’s score for skills, which measures education outcomes such as literacy, years of schooling and tertiary enrolment, is
higher than the averages in EAC, SSA and the Emerging cluster. However, compared to countries higher in the Index Kenya’s
score for basic skills is much lower (e.g. 41.76 compared to the average in the next Transitioner cluster of 61.63). Therefore,
improving the ability of users to engage with mobile technologies is important both to increase mobile internet adoption
and also ensure users can realize the full economic and social benefits of the internet
• The country’s score for Gender Equality is higher than most other African countries, primarily driven by higher gender
equality in education and financial inclusion. This is reflected in mobile phone access, where women are only 2% less
likely to use a phone than men (by contrast, in many other low and middle income countries, women can be between 20-70%
less likely. However, the gender gap in internet access is higher, with women in Kenya 18% less likely to access the
internet than men. It is therefore important to develop policies targeting the gender gap in terms of mobile internet usage.

13
Content Analysis
Source: GSMA Intelligence (2016 analysis). Scores are normalized out of 100.
• Compared to most countries in EAC and SSA, Kenya creates more content for its users, including:
• Mobile applications and web content
• E-Government services
• Social media (which provides a platform to generate content that people are interested in)
• However, Kenya’s population is linguistically diverse with more than 60 languages spoken. Many people therefore do not have a
lot of content accessible available in their first or preferred languages (although those that speak English have access to a wide
range of content). It is therefore important to develop more relevant content in a wider range of local languages.
• This is consistent with GSMAi survey data, which found that for those not accessing the mobile internet in Kenya, around
20% said that one of the main reasons was that they did not find the internet relevant (i.e. either useful or interesting)
Kenya EAC Average Sub-Sahara Africa
Average
Emerging Average
CONTENT 28.81 24.06 28.84 36.31
Local Relevance 38.48 30.82 27.75 31.02
Availability 19.14 17.30 29.93 41.60

14
Changes in Index score since 2014
Source: GSMA Intelligence. Scores are normalized out of 100.
-5
0
5
10
15
20
25
Netw
ork
Covera
ge
Netw
ork
Qualit
y
En
ablin
g I
nfr
astr
uctu
re
Sp
ectr
um
Mo
bile
ta
riffs
Handset price
Ta
xatio
n
Incom
e
Inequalit
y
Ba
sic
Skill
s
Gender
Eq
ualit
y
Local R
ele
van
ce
Availa
bili
ty
Change in S
core
betw
een 2
014 a
nd 2
016
Changes in Dimension Scores (2014-2016)
Kenya EAC Average Sub-Saharan Africa
• Operators in Kenya have made
significant improvements to network
coverage relative to other EAC and
SSA countries
• Furthermore, while Kenya is lagging
some of its peers on network quality
and inequality, it has made significant
improvements during the last two years.
• It is therefore important that the country
continues its progress on these
dimensions, along with developing the
population’s digital skills and increasing
the availability of content in more local
languages.
Infrastructure Affordability Consumer Content

15
Enabling Mobile Internet Adoption - Summary
The adoption of mobile technology, especially mobile internet services, is much more advanced in Kenya than many other African
countries. However, both new users and the majority of existing users would realise more of the economic and social benefits
afforded by the internet if they utilized 3G or, ideally, 4G technologies. Government and operators therefore have a crucial role in
driving a more enabling environment that can accelerate take-up:
• Continue to improve network quality
• Developing enabling infrastructure necessary to support mobile access and network quality – especially backhaul and core
networks that are resilient and have sufficient capacity to meet demand
• Continue to make mobile more affordable to those on the lowest incomes
• Policies and initiatives that help improve education and awareness of mobile technology and also close the gender gap in
mobile internet access
• Supporting firms in the mobile ecosystem – particularly software developers and content creators – to develop content that is
both relevant and accessible to people in urban and rural areas

Thank you!