socio-economic factors affecting fertility in kenya
TRANSCRIPT
46 S.-Afr.Tydskr.sosiol.l992,23(2)
Socio-economic factors affecting fertility in Kenya
I. Kalule-SabitiCurrently at the Intsituteof Development Research, University of Bophuthatswana, PrivateBag X2046,Mmabatho,
Republic of Bophuthtswana.
Received February 1991,' accepted November 1991
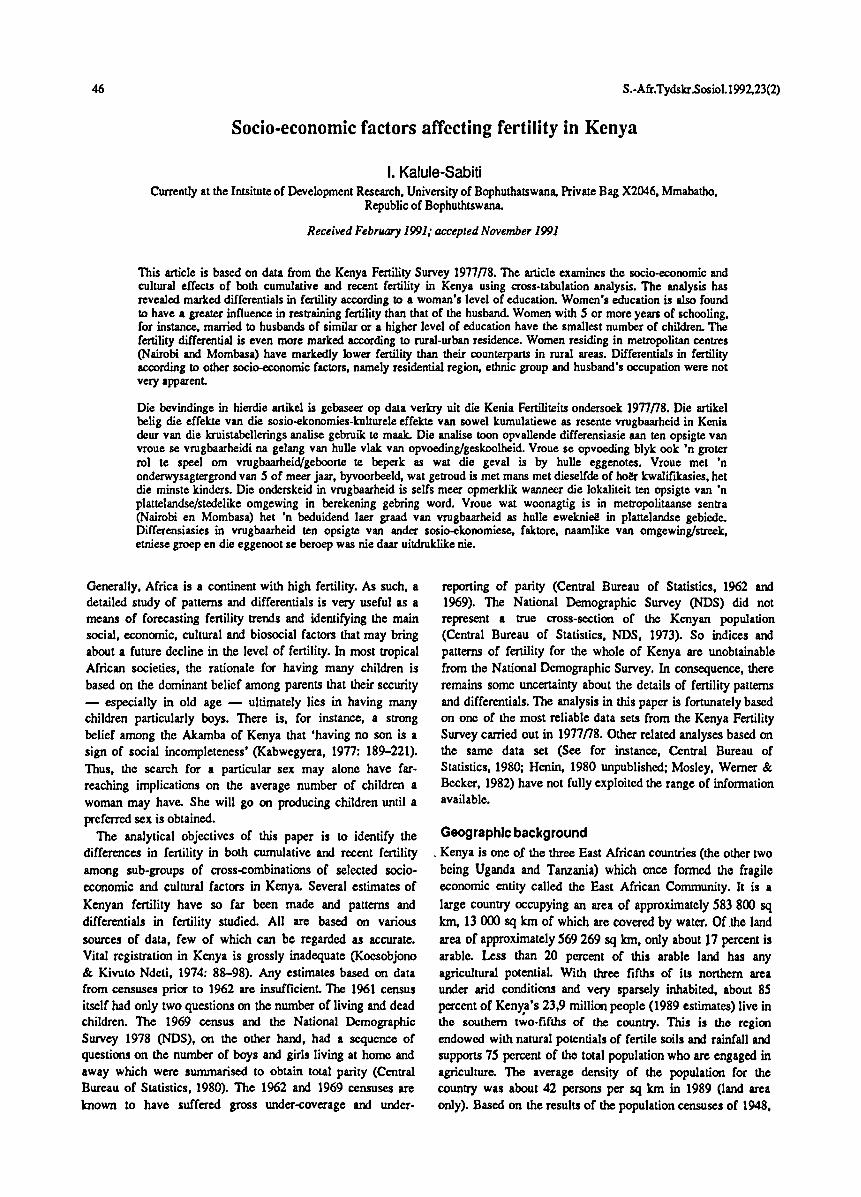
This article is based on data from the Kenya Fertility Survey 1977f78. The article examines the socio-economic andcultural effects of both cumulative and recent fertility in Kenya using cross-tabulation analysis. The analysis hasrevealedmarkeddifferentials in fertility according to a woman's level of education. Women's education is also foundto have a greater influence in restraining fertility than that of the husband. Women with S or moreyears of schooling,for instance, married to husbands of similaror a higher level of education have the smallestnumberof children. Thefertility differential is even more marked according to rural-urban residence. Women residing in metropolitan centres(Nairobi and Mombasa) have markedly lower fertility than their counterparts in rural areas. Differentials in fertilityaccording to other socio-economic factors, namelyresidential region, ethnic group and husband's occupation were notvery apparent
Die bevindinge in hierdie artikel is gebaseer op data verkry uit die Kenia Fertiliteits ondersoek 19nf78. Die artikelbelig die effekte van die sosio-ekonomies-kulturele effekte van sowel kumulatiewe as resente vrugbaarheid in Keniadeur van die kruistabellerings analise gebruik te maak. Die analise toon opvalIende differensiasie aan ten opsigtevanvroue se vrugbaarheidi na gelang van hulle vlak van opvoeding/geskoolheid. Vroue se opvoeding blyk ook 'n groterrol te speel om vrugbaarheid/geboorte te beperk as wat die geval is by hulle eggenotes, Vroue met 'nonderwysagtergrond van S of meer jaar, byvoorbeeld, wat getroudis met mans met dieselfde of boer kwalifikasies, hetdie minstekinders, Die onderskeid in vrugbaarheid is selfs meer opmerklik wannecr die lokaliteit ten opsigte van 'nplattelandse/stedelike omgewing in berekening gebring word. Vroue wat woonagtig is in metropolitaanse sentra(Nairobi en Mombasa) het 'n beduidend Iaer graad van vrugbaarheid as hulle ewekniee in plattelandse gebiede.Differensiasies in vrugbaarheid ten opsigte van ander sosio-ekonomiese, faktore, naamlike van omgewing/streek,etniesegroepen die eggenootse beroepwas nie daar uitdruklike nie.
Generally, Africa is a continent with high fertility. As such, adetailed study of patterns and differentials is very useful as ameans of forecasting fertility trends and identifying the mainsocial, economic, cultural and biosocial factors that may bringabout a future decline in the level of fertility. In most tropicalAfrican societies, the rationale for having many children isbased on the dominant belief among parents that their security- especially in old age - ultimately lies in having manychildren particularly boys. There is, for instance, a strongbelief among the Akamba of Kenya that 'having no son is asign of social incompleteness' (Kabwegyera, 1977: 189-221).Thus, the search for a particular sex may alone have farreaching implications on the average number of children awoman may have. She will go on producing children until apreferred sex is obtained.
The analytical objectives of this paper is to identify thedifferences in fertility in both cumulative and recent fertilityamong sub-groups of cross-combinations of selected socioeconomic and cultural factors in Kenya. Several estimates of
Kenyan fertility have so far been made and patterns anddifferentials in fertility studied. All are based on varioussources of data, few of which can be regarded as accurate.Vital registration in Kenya is grossly inadequate (Koesobjono& Kiwto Ndeti, 1974: 88-98). Any estimates based on datafrom censuses prior to 1962 are insufficient The 1961 censusitself had only two questions on the number of living and deadchildren. The 1969 census and the National DemographicSurvey 1978 (NOS), on the other hand, had a sequence ofquestions on the number of boys and girls living at home andaway which were summarised to obtain total parity (CentralBureau of Statistics, 1980). The 1962 and 1969 censuses areknown to have suffered gross under-coverage and under-
reporting of parity (Central Bureau of Statistics, 1962 and1969). The National Demographic Survey (NOS) did notrepresent a true cross-section of the Kenyan population(Central Bureau of Statistics, NOS, 1973). So indices andpatterns of fertility for the whole of Kenya are unobtainablefrom the National Demographic Survey. In consequence, thereremains some uncertainty about the details of fertility patternsand differentials. The analysis in this paper is fortunately basedon one of the most reliable data sets from the Kenya FertilitySurvey carried out in 1977n8. Other related analyses based onthe same data set (See for instance, Central Bureau ofStatistics, 1980; Henin, 1980 unpublished; Mosley, Werner &Becker, 1982) have not fully exploited the range of informationavailable.
Geographic background. Kenya is one oJ the three East African countries (the other twobeing Uganda and Tanzania) which once formed the fragileeconomic entity called the East African Community. It is a
large country occupying an area of approximately 583 800 sqkm, 13 000 sq km of which are covered by water. Of .the landarea of approximately 569 269 sq km, only about 17 percent isarable. Less than 20 percent of this arable land has anyagricultural potential. With three fifths of its northern areaunder arid conditions and very sparsely inhabited, about 8Spercent of Kenya's 23,9 million people (1989 estimates) live inthe southern t~o-fifths of the country. This is the regionendowed with natural potentials of fertile soils and rainfall andsupports 75 percent of the total population who are engaged inagriculture. The average density of the population for thecountry was about 42 persons per sq km in 1989 (land areaonly). Based on the results of the population censuses of 1948,
S.AfrJ. SocioI.1992,23(2)
1962 and 1969, there has been an estimated increase in totalpopulation between 1948 and 1962 of about 60 percent (with
an annual growth rate of about 3,3 percent per annum). InAugust 1979, the total population was estimated at 15322000
(World Bank, 1979) making Kenya the sixth most populouscountry in sub-Saharan Africa, tenth in the whole of Africa and
forty-seventh in the world. The 1969-79 intercensal growthrate (estimated at 3,4 per cent per year) made Kenya's one of
the highest growth rates of population in the world. The
Population Reference Bureau, Inc. (1984) estimate was even
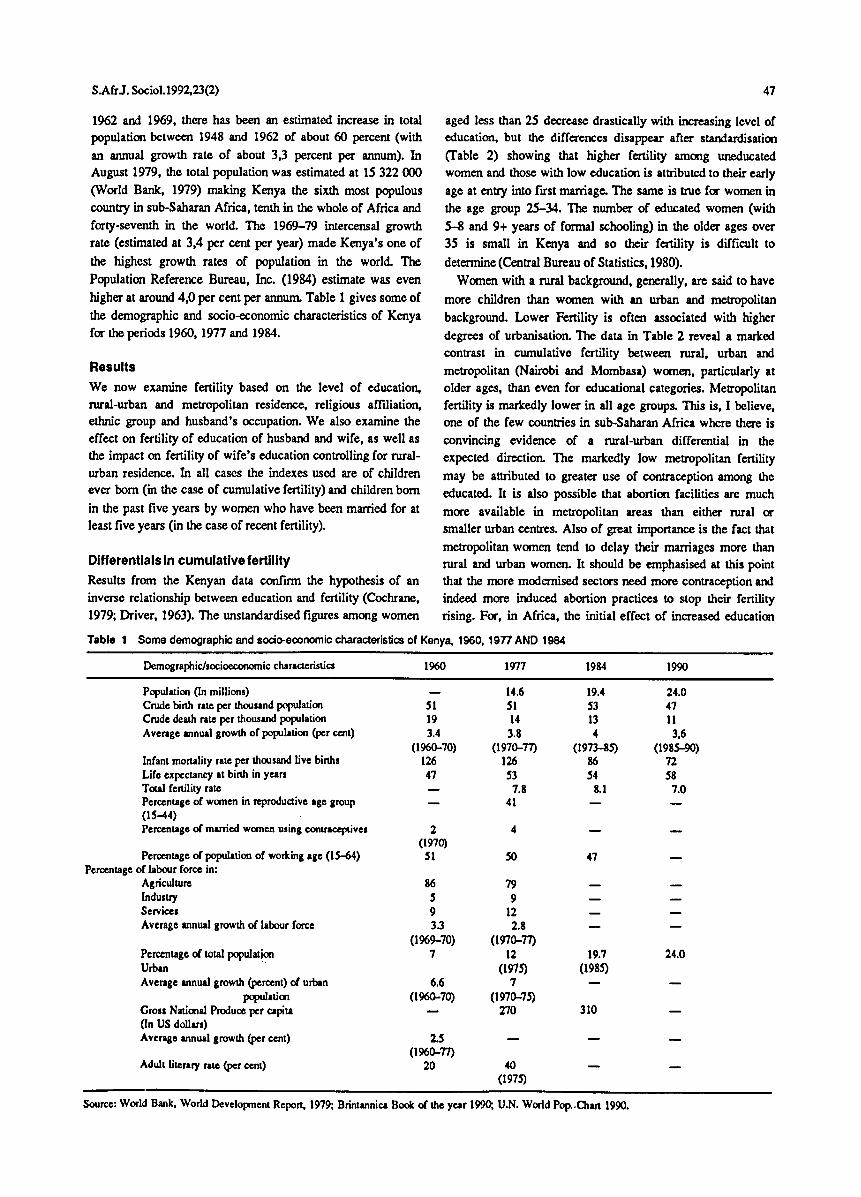
higher at around 4,0 per cent per annum, Table 1 gives some of
the demographic and socio-economic characteristics of Kenyafor the periods 1960, 1977 and 1984.
Results
We now examine fertility based on the level of education,rural-urban and metropolitan residence, religious affiliation,ethnic group and husband's occupation. We also examine theeffect on fertility of education of husband and wife, as well asthe impact on fertility of wife's education controlling for ruralurban residence. In all cases the indexes used are of childrenever born (in the case of cumulative fertility) and children born
in the past five years by women who have been married for atleast five years (in the case of recent fertility).
Differentials In cumulative fertility
Results from the Kenyan data confirm the hypothesis of aninverse relationship between education and fertility (Cochrane,1979; Driver, 1963). The unstandardised figures among women
47
aged less than 25 decrease drastically with increasing level ofeducation, but the differences disappear after standardisation
(Table 2) showing that higher fertility among uneducatedwomen and those with low education is attributed to their early
age at entry into first marriage. The same is true for women inthe age group 25-34. The number of educated women (with
5-8 and 9+ years of formal schooling) in the older ages over35 is small in Kenya and so their fertility is difficult to
determine (Central Bureau of Statistics,1980).
Women with a rural background, generally, are said to have
more children than women with an urban and metropolitan
background. Lower Fertility is often associated with higher
degrees of urbanisation. The data in Table 2 reveal a markedcontrast in cumulative fertility between rural, urban andmetropolitan (Nairobi and Mombasa) women, particularly atolder ages, than even for educational categories. Metropolitanfertility is markedly lower in all age groups. This is, I believe,one of the few countries in sub-Saharan Africa where there is
convincing evidence of a rural-urban differential in theexpected direction. The markedly low metropolitan fertility
may be attributed to greater use of contraception among theeducated. It is also possible that abortion facilities are much
more available in metropolitan areas than either rural orsmaller urban centres. Also of great importance is the fact that
metropolitan women tend to delay their marriages more thanrural and urban women. It should be emphasised at this pointthat the more modernised sectors need more contraception and
indeed more induced abortion practices to stop their fertilityrising. For, in Africa, the initial effect of increased education
Tabl. 1 Some demographic and socio-economic characteristics of Kenya. 1960, 19n AND 1984
1984 1990
19.4 24.053 4713 II4 3.6
(1973-85) (1985-90)86 7254 58
8.1 7.0
Demographic/socioeconomic characteristics
Population (In millions)Crude binh rate per thousand populationCrodedeath nle per thousand populationAvenge annualgrowthof population (per cent)
InCant mortality rale per thousand live binhsLife expectancy at binh in yeanTotal fertility ralePercentage of women in reproductive age group(15-H)Percentage of married women usingcontraceptives
Percentage of population of working age (15~4)Percentage of labour force in:
AgricultureIndustryServicesAverage annualgrowthof labour force
Percentage of total populationUrban .Avenge annualgrowth(percent) of urban
populatiooGroll National Produce per capita(In US dollars)Avrrage annualgrowth(per cent)
Adult lilenry rale (per cent)
1960
51193.4
(1960-70)12647
2(1970)
51
86593.3
(1969-70)7
6.6(1960-70)
2.5(1960-77)
20
1977
14.651143.8
(1970-77)126537.8
41
4
so
799
122.8
(1970-77)12
(1975)7
(1970-75)270
40(1975)
47
19.7(1985)
310
24.0
Source:World Bank,World Development Report, 1979; Brintannica Bookof the year 1990; U.N. WorldPop..Otart 1990.

(in combination with increased urbanisation) is to reducebreastfeeding periods, encourage more stable unions and
discourage polygamous practices, all of which tend to favourhigh fertility. This effect has to be balanced by increased useof contraception and induced abortion. Fertility differentials onthe basis of religion, husband's occupation and ethnic groupare not very marked. Fertility is, however, very low among
Nairobi, the Coast and Mijikenda categories.
DIfferentials In recent fertility
Estimated rates for fertility in the recent past are presented inTable 3. The rates are the averages for the five years prior tothe survey and represent the number of children ever born to toa hypothetical woman by age of SO if she experiences thecurrent age-specific rates throughout her reproductive life.Cautious of the possible errors in the dating of births in thebirth history, the differentials shown in the Table among sub-
Table 2 Mean number of children everborn by current ageandselected socio-economic variables unstandardised and standardised by ageat marriage.
15-24Current age
25-34 35-44 45+
SelectedVariable.
EducationNone1-4 years5-8 years9+years
Place of residenceRuralUrbanMetropolitan
Region of residenceNairobiCentralCoastNyanzaRiftWesternEastern
Ethnic groupKikuyuLuoLuhyaKambaKiisiMeruJEmbuMijikendaKalenjinOther
Husband's occupation(Evermarried womenonly)NeverworkedProfessionalOericalSale.PrivateMold workersOther.ervice workersSelf-employed agricAgricultural worker.SkilledmanualUnskilled manual
All evermarried Neverwomen married
1.8 0.31.9 0.21.8 0.21.5 0.2
1.8 0.21.7 0.41.6 0.3
1.5 0.21.8 0.21.6 0.31.7 0.11.9 0.31.9 0.22.0 0.3
1.8 0.21.7 0.11.8 0.21.9 0.31.7 0.12.0 0.41.5 0.22.1 0.32.0 0.3
1.71.81.71.81.91.71.81.71.72.0
Unst
1.51.10.90.6
0.11.11.0
0.90.71.21.11.11.10.8
0.81.11.10.90.90.81.21.21.3
St·
1.01.01.00.9
1.01.11.1
0.91.00.90.91.11.01.2
1.10.81.01.11.31.20.81.11.0
1.82.01.81.8
.2.01.71.81.71.72.0
Unst
4.64.84.43.3
4.64.03.8
3.94.64.14.64.64.74.4
4.64.44.74.24.94.54.24.63.8
4.44.34.34.74.84.64.64.64.74.9
St·
4.44.74.64.5
4.64.24.0
4.44.73.84.34.64.54.6
4.94.04.64.45.04.63.84.63.7
4.34.74.44.74.47.34.54.64.74.6
Unst
7.07.67.1
7.26.86.1
7.17.25.97.57.27.76.7
7.37.37.96.77.46.75.87.06.6
7.47.57.27.26.97.36.97.27.17.7
St·
6.97.67.2
7.26.96.0
6.87.55.87.57.17.56.8
7.56.97.76.87.76.75.56.96.3
7.47.67.27.26.97.47.07.37.17.5
Unst
7.78.78.3
8.0o5.6
8.16.08.37.68.27.9
8.18.08.27.78.97.87.08.35.5
7.48.4o7.88.57.47.98.08.66.3
St·
7.78.58.9
8.0o5.7
8.25.08.
7.67.97.9
8.28.08.07.78.77.75.88.15.9
7.48.7o7.98.37.57.98.18.6
'6.2
Source: Table 5.11 in Ihe First Report,Volume I, KES 1977n8, a. our .tarting point of Ihe analYlil.- Very few number of case. to compute the fertility rate••• Standardilation for age at marriage wu done bued on the diltribution01each entire age groupaccording to age at marriage.The initialdataconliltaof
the unltandardiled means or marginalmeanl of childrenever born for each combination 01age at marriageand socio-econcenic variable. The first .tepinvolved multiplying the proportion. of womcn in Ihe entire age group for each category of age at marriage by IDlStandardiled mean. in eachcombination of age at marriageand background variable.The numbers generated are then addedaeroll aU categoriel of age at marriage. The resultillheltandardised means of childrenever born for each categoryof education in Ihat age group.Standardisation for proportion nevermarried were only donefor age group 15-24, II the sample size for never married women in Ihe older age. WII too small to justify standardisation.
S.AfrJ. Sociol.1992,23(2) 49
Table 3 Estimated five-year average total fertility ratesby selectedvariables
Source Table 5,12 Central Bureau of Statistics, Kenya Fenility Survey1977n8,First Report, Volume I, February 1980.
groups of population are, as one would expect, markedbetween education groups and even more marked betweenrural, urban and metropolitan residence than in the others.
Fertility and the education of wife and husband
Education, particularly women's education, has been shown to
have a major impact on fertility (Cochrane, 1979). It affectsfertility indirectly through transformation of old traditionalvalues into new aspirations and outlook to modern values, and
directly through reducing the reproductive period as a result ofpostponement of marriage. In the short run, however,
education is thought to raise the level of fertility throughbreaking down traditional practices such as polygamy which
influences breast-feeding and sexual abstinence and which are
know to have a suppressing effect on fertility (Mosley, Werner
& Becker, 1982).Although Kenya has made tremendous progress in
educational development (in terms of increased infrastructure,increased expenditure on education and increased in-take at all
levels), the proportion of women with some secondary andhigher education is still small. And since this development hasbeen largely during the past 20-30 years, its impact has onlybeen felt among the relatively young people whose marriages
have been postponed because they are still at school.
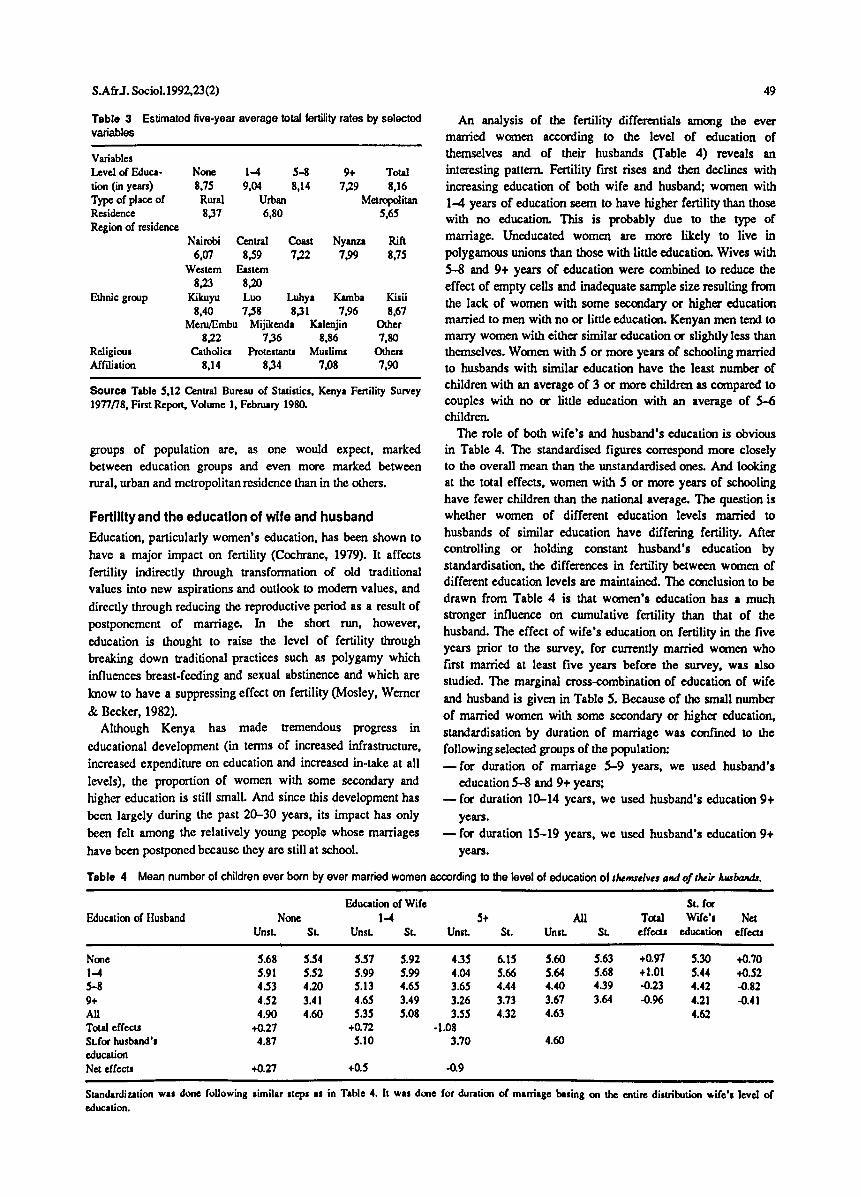
An analysis of the fertility differentials among the evermarried women according to the level of education ofthemselves and of their husbands (Table 4) reveals aninteresting pattern. Fertility first rises and then declines withincreasing education of both wife and husband; women with1-4 years of education seem to have higher fertility than thosewith no education. This is probably due to the type ofmarriage. Uneducated women are more likely to live inpolygamous unions than those with little education. Wives withS-8 and 9+ years of education were combined to reduce theeffect of empty cells and inadequate sample size resulting fromthe lack of women with some secondary or higher educationmarried to men with no or little education. Kenyan men tend tomarry women with either similar education or slightly less thanthemselves. Women with S or more years of schooling marriedto husbands with similar education have the least number ofchildren with an average of 3 or more children as compared tocouples with no or little education with an average of S-6children.
The role of both wife's and husband's education is obviousin Table 4. The standardised figures correspond more closelyto the overall mean than the unstandardised ones. And lookingat the total effects, women with S or more years of schoolinghave fewer children than the national average. The question iswhether women of different education levels married tohusbands of similar education have differing fertility. Aftercontrolling or holding constant husband's education bystandardisation, the differences in fertility between women ofdifferent education levels are maintained. The conclusion to bedrawn from Table 4 is that women's education has a muchstronger influence on cumulative fertility than that of thehusband. The effect of wife's education on fertility in the fiveyears prior to the survey, for currently married women whofirst married at least five years before the survey, was alsostudied. The marginal cross-combination of education of wife
and husband is given in Table S. Because of the small numberof married women with some secondary or higher education,standardisation by duration of marriage was confined to thefollowing selected groups of the population:- for duration of marriage 5-9 years, we used husband's
education 5-8 and 9+ years;- for duration 10-14 years, we used husband's education 9+
years.- for duration 15-19 years, we used husband's education 9+
years.
9+ Total7).9 8,16
Metrqx>litan5,65
1-1 5-89,04 8,14
Urban6,80
None8,75Rural8,37
Nairobi Central Coast Nyanza Rift6,(11 8,59 7).2 7,99 8,75
Western Eastern8,23 8,20
Kikuyu Loo Luhya Kamba Kisii8,40 7,58 8,31 7,96 8,67
MeJU/Ernbu Mijikenda Kalenjin OIher8).2 7,36 8,86 7,80
Catholics Protestants Muslims OIhers8,14 8,34 7,08 7,90
VariablesLevelof Education (in years)Typeof place ofResidenceRegionof residence
Ethnicgroup
ReligiousAffiliation
Table 4 Mean number of children everborn by ever married women according to the levelof education of IMmseilleJ and of IMir IaMSbattd.r.
Education of Wife St. forEducatioo of Husband None 1-4 S+ All ToW Wife'. Net
UnsL SL UnsL SL UnsL St. UnsL SL effeds education dfew
None 5.68 5.54 5.57 5.92 4.35 6.1S 5.60 5.63 +0.97 5.30 +{).701-1 5.91 5.52 5.99 5.99 4.04 5.66 5.64 5.68 +1.01 5.44 +{).525-8 4.53 4.20 5.13 4.65 3.65 4.44 4.40 4.39 -0.23 4.42 -0.829+ 4.52 3.41 4.65 3.49 3.26 3.73 3.67 3.64 -0.96 4.21 -0.41AU 4.90 4.60 5.3S 5.08 3.S5 4.32 4.63 4.62Total effects +0.27 +0.72 -1.08SLforhusband's 4.87 5.10 3.70 4.60educationNet effects +0.27 +0.5 .Q.9
Standardization was done following similar steps as in Table 4. It was done for duration of marriage basing on the entire distribution ",ife's level ofeducation.

52
more stable unions, all tend to favour high fertility. In the longrun, however, this effect is balanced by increased use of
contraceptionand induced abortion.The extent of concern among both urban and rural
populations over the rapidly growing population in Kenya isnot known; nor is it clear what percentage of the total
population know that Kenya has a population policy and howmany believe that the country should regulate its population
growth. Whatever the level of concern and the extent ofawareness, education is a very crucial factor in facilitating the
awareness of the problems of rapid growth. Kabwegyere andMbula (1979) found that it is only those who are educated
whose perspectives extend beyond the frontiers of their owncultural milieu. The more educated not only are the ones who
find jobs in the monetary sector, they also feel greater relativedeprivation to the extent that they will consider family size(Kabwegyere and Mbula, 1979). Until such a time as parentsbecome more concerned about the quality of children ratherthan quantity, change their traditional values into newaspirations and outlook to modern values, reduce thereproductive period through delaying first marriages and,
above all, replace the traditional practices (breastfeeding andsexual abstinence) which are disappearing as a result ofincreasing modernisation, with increased use of effectivecontraception, a decline in the Kenyan fertility level may notbe expected. That may not be before the tum of this century.
References
Britannica, Book 0/the year J990.
Central Bureau of Statistics, 1962. Population CeflSlU J962. AnalyticalReport. Vol IV. Nairobi: Ministry of Finance and Planning,
S.-Afr.Tydskr.Sosiol.l992,23(2)
Central Bureau of Statistics, 1969. PopuJatiofl CeflSlU J969. AnalyticalReport, Vol IV. Nairobi: Ministry of Financeand Planning.
Central Bureau of Statistics, 1978. TheNatioflal Demographic Survey.Nairobi: Ministry of Economic Planning and DevelopmcnL
Central Bureau of Statistics, 1980. Kenya Fertility Survey 19nn8. FirstReport, Vol 1. Nairobi: Ministry of Economic Planning andDevelopmenL
Cochrane, H.S. 1979, FertililyaNI Education. The World Bank.Baltimore and Loodon: The John Hopkins University Press.
Driver, E. 1963. Differeflli4l Fertilily ill Cefllral INIi4. Princeton. NewJersey: Princeton University Press.
Henin, R. A. 1980. Unpublished datL Population Studie. and ResearchInstitute. University of Nairobi.
Kabwegyere, T. 19n. Detenninations of Fertility: A Discussion ofClange in the Family among theAkamba of Kenya. InCaldwell, J.e.(cd). The PersisteN:e 0/High Fertilily FatrUly tvtd Fertility Change.Clanging African Family series, Part 1.Canberra: The AustralianNational University. pp 189-221.
Kwabwegyere, T. and Mbula, T. 1979. A Case o/the AkiJmba of EasternKenya. Clanging African Project Serle•. Monograph No.5.Canberra:Australian National University.
Kocsobjono, S. and Kivuto Ndeti. 1974. Proble"",0/Implementation 0/PopuJatiOfl Policy ill Kenya. Kroniew van AfriCL pp. 88-98.
Mosley, W.H., Wencr, L.H. and Becker, S.L. 1982. The DynamiC.f 0/BirthSpacillg aNI MaritalFertilily ill Kenya.WFS Scientific Reports.No. 30. London: World Fertility Survey. International StatisticalInstitute.
Pullum, T.W. 1978. Standardisation. Technical Bulletin. No. 3rrecb. S97.Loodon: World Fertility Survey. International Statistical Institute.
Republic of KenYL KenyaFive·YearDevelopmefll PIQfl J966-70.Nairobi: Ministry of Finance and Planning.
Republic of KenYL KenyaFive-Year Developmen: PIQfl J974-78.Nairobi: Ministry of Finance and Planning,
United Nation•. The DeterminanuaNI COflSeqlUncu 0/PopulationTrends. STISOAlsleJrIAlSO. Vol J. New York:United Nations.
World Bank. Country Economic Report 1975. Kenya:Ifllo the SecoNlDecade. Baltimore and London: The John Hopkins University Pres•.
World Bank. 1979. WorldDevelopmefll Report, Washington D.e, U.S.A.
'n Profie) van die werksetiek van voorgraadse studente'
Albert C. van WykenAnna F. SteynDcpartement Sosiologie, Randse Afrikaanse Universiteit, Posbus 524, loharmesburg 2000, Republiek van Suid-Afrika
OmvangSeptember 1990;aanvaar Januarle 1992
A profile or the work ethic or undergraduate students. Western civilizations are worried about a possibledecreasein the 'Protestant work ethic'. In this article an overview is given of the history of the work ethic in Westerncivilizations. Three scales were developed to measure the work ethic of 1000 undergraduate students, viz a Workorientation scale, an Ascetism scale and a Fun morality scale. Lastly, a profile of the work ethic of these students wasconstructed.
Daar bestaan toenemende kommer in Westerse samelewings oor die moontlike afname van die sogenaamde'Protestantse werksetiek'. In hierdie artikel word 'n oorsigtelike perspektief gegee van die historiese verloop van diewerksetiek in Westerse samelewings. Drie skale is ontwerp om die werksetiek van 1000 voorgraadse studenteaan 'nuniversiteit te meet, naamlik: 'n Werkorit!ntasieskaal, 'n Asketismealc:aal en 'n PretetiekskaaI. 'n Profiel van diewerksetiek van studentewordlaastens verskaf.
Inleldlng
Daar bestaan geruirne tyd reeds kommer oor aspekte rondomdie werksetiek van die arbeidsmag in Westerse samelewings.Pascarella (1984:3) skryf oor die Amerikaanse ekonomie: 'By
the early 1980's, the country was on an unhealthy 'high' high prices, high interest rates, high unemployment, a high rateof business failures, and a high level of imported goods •••
Spirits were low. Some industries seemed doomed to
extinction soon ... The number of hours of work required to
produce a given amount of goods and services has been
steadily reduced through most of the nation's history. But in
the late 1970's and early 1980's this measure of productivity
slipped downward.'