socio-economic determinants of sweet …gjar.org/publishpaper/vol3issue9/u142.pdf · government...
TRANSCRIPT

Vol-3, Issue-9 PP. 972-883 ISSN: 2394-5788
872 | P a g e 3 0 S e p t e m b e r 2 0 1 6 w w w . g j a r . o r g
SOCIO-ECONOMIC DETERMINANTS OF SWEET
POTATO PRODUCTION AMONG SMALL HOLDER
WOMEN FARMERS IN EZZA SOUTH LOCAL
GOVERNMENT AREA OF EBONYI STATE, NIGERIA.
Ume S.I., Onunka B.N., Nwaneri T.C. & Okoro G.O
Department of Agricultural, Extension and Management,
Federal College of Agriculture,
Ishiagu, Ivo Local Government Area of Ebonyi State,
Nigeria.
[email protected], [email protected],
[email protected], [email protected]
ABSTRACT
This study is an investigation on how sweet potato female farmers’ socio economic characteristics affect their production in Ezza
South, Local Government Area of Ebonyi state, Nigeria. The study sought to describe the socioeconomics characteristics of the female
farmers, determine the effect of the female farmers’ socioeconomic determinant factors on sweet potato production in the study area..
estimate the cost and return in sweet potato production and identify the problems faced by sweet potato farmers. One hundred and
twenty farmers selected using multi – staged random sampling technique for the study. Structured questionnaire was used to elicit
information from the respondents as related to the objectives of the work for analysis. Percentage, multiple regression analysis and
Gross Margin analysis were used to analyze the objectives of the study. The results showed that most of the respondents were aged,
had access to credit and well experienced in the vocation. The socio-economic factors that affect sweet potato production in the study
area were household size, Level of education, farming experience and farm size. The major constraints to sweet potato production in
the study area were poor access to creditl, high cost of transportation and vine shortage. The study recommended that credit should be
made available to farmers at affordable collateral. More so, there is need to ensure access road to rural area and urban markets toavoid
high cost of transportation which makes farmers to sell their product at the farm gate at a very cheap rate. Finally, there is also need to
ensure the availability of improved varieties of sweet potato vine to farmer in order to put to end the extent of recycling of old and
local varieties stocks in farmers possession in order to boost their production.
Key word: Socio Economic, Determinant, Sweet Potato, Production, Small holder Woman Farmers.
1. INTRODUCTION
In sub Saharan Africa, most women household depend on agriculture as their main source of income with the sector employing over
three-quarters of the labor force but only accounting for 21% of Gross Domestic Product ( GDP) (Edmond; 2007). These farmers

Vol-3, Issue-9 PP. 972-883 ISSN: 2394-5788
873 | P a g e 3 0 S e p t e m b e r 2 0 1 6 w w w . g j a r . o r g
cultivate different types of food and cash crops and among them is sweet potato. Sweet potato is believed to have originated from
South /Central America and was brought into Africa by the Portuguese in 16th century (Agbo and Ene, 2012). Globally, sweet potato
is the sixth most important food crop after rice, wheat, potatoes, maize and cassava, while in the developing nations it is the fifth most
important food crop (Chukwu, 2013). China produces over 50% of the world’s sweet potatoes, while Nigeria is the largest producers in
Africa with total output of between 18-24 tons per hectare (Ukpabi, 2012).
As in Nigeria and other countries in sub-Saharan Africa, sweet potato is often referred to as female crop as women are
responsible for producing 80% of the food, as opposed to men who tend to engage in cash crops production as income-generating
activities for their households’ upkeep (Mathew and Fatimah, 2006). It is consumed without much processing either eaten boiled,
roasted or fried. The leaves and tender shoots of sweet potato (contain 8% starch, 4% sugar, 27% protein, vitamin and 56 mg carotene
per 100 gram dry matter) are usually eaten boiled or incorporated in soup or stew (Kasaam and Stockinger, 2006). Industrially, its
flour can be used to substitute wheat in bread making, blends 15-30% for pastries bakery, brewing of alcoholic drinks and sweeteners
in non-alcoholic drinks (Nwokocha, 2009).
Nevertheless, the production of sweet potato in most sweet potato growing regions of the country are constrained by high
cost of fertilizer, poor soil fertility, use of local varieties, pests and diseases problems, storage problem of sweet potato tubers,
processing problem and land fragmentation that do not encourage mechanization (Agbo and Ene, 2012). Other problems include
competition for land between agriculture and other infrastructural development and high cost of labour (Enyinnaya and Chilaka, 2012).
The aforesaid scenario notwithstanding, sweet potato sector has lots of potentials for increased productivity in the country as the nation
are blessed with rich and abundant sweet potato growing environments and numerous programmes and policies and improved
varieties (Chukwu, 2013 ). Furthermore, cocoyam is capable of establishing ground cover very fast which enables it to suppress weeds
such as stringa, control of soil erosion and maintenance of soil fertility which could attest to its high yield, (Purseglovm, 2004;
Therberye, 2009 ).
Therefore, there is the need to assess the socioeconomic characteristics of the sweet potato farmers as it affect their
performance in farming and their productivity in terms of profit accruing from sweet potato production in the study area. This could
lead to formulation and implementation of polices that would enable them to improve on their performances.
The study could be justified in many ways; include through identification of problems limiting potato production, policy options could
be instituted by government and researchers on how best to overcome the constraint to boost food security. Finally, this study is hoped
to stimulate a wider interest in potato cultivation and possibly assist in attracting funds for expansion of its production to meet with the
rising Nigerian population. Specifically, the objectives are to;
Describe the socioeconomics characteristics of the female farmers?
Determine the effect of the female farmers’ socioeconomic determinant factors on sweet potato production in the study
area..
Estimate the cost and return in sweet potato production
Identify the problems faced by sweet potato farmers.
Research Question
In view of the foregoing, the study is designed to answer the following research questions
What were the socioeconomics characteristics of the female farmers?.
What were the socioeconomic determinant factors to sweet potato production in the study area?
What were the costs and return to sweet potato production
What are the problems faced by sweet potato women farmer
2. THEORETICAL FRAMEWORK OF MULTIPLE REGRESSIONS
The multiple regression studies involve the nature of the relationship between a dependent variable and two or more explanatory
variables. The techniques produce estimators of the standard error of multiple regressions and coefficient of multiple determinations.
In implicit form, the statement that a particular variable of interest (yi) is associated with a set of the other variables (xi) is given as:

Vol-3, Issue-9 PP. 972-883 ISSN: 2394-5788
874 | P a g e 3 0 S e p t e m b e r 2 0 1 6 w w w . g j a r . o r g
yi=f (x1,x2,....,xk)…………………………………………(1)
where y is the dependent variable, and xi.. xkis a set of k explanatory variables.
The coefficient of multiple determination measures the relative amount of variation in the dependent variable (yi) explained by the
regression relationship between y and the explanatory variables (xi). the F-statistics tests the significance of the coefficients of the
explanatory variables as a group. It tests the null hypothesis of no evidence of significant statistical regression relationship between yi
and the xis against the alternative hypothesis of evidence of significant statistical relationship. The critical F-value has n and n-k-1
degrees of freedom, where n is the number of respondents and k is the number of explanatory variables. The standard error of
regression coefficients is the measure error about the regression coefficients. The z-statistics is used in testing the null hypothesis that
the parameter estimates are statistically equal to zero against the alternative hypothesis the parameter estimates the statistically
different from zero. If the computed z-value exceeds the critical value, we reject the null hypothesis and conclude that the parameter
estimates differ significantly from zero.
The nature of the relationship between an outcome variable (yi) and a set of explanatory variables (xi) can be modeled using different
function forms. The four commonly used algebraic (functional) forms are: linear, log-linear or semi-log, linear-log, and power or
double-log. The first functional form is the linear function expressed as:
yi=bo+ bix1 +b2 + …+Bkxk+e1 …………………………………………………………………..(2)
where the bis are the parameters to be estimated and ei is the stochastic error term. The elasticity estimates of the linear function are
given as bixi/yo where xiand yi are mean values of xi and yi .the second functional form is the log-linear or semi-log function expressed
as:
yi= exp(bo+ bix1 + …+bkxk+e1)…………………………………………………………………... (3)
by taking the logarithm of both sides the function of expression (3) can be linearised as followings:
Inyi= bo+ b1x1 + b2x2 +…+bkxk+e1) …………………………………………………………….(4)
Where e is the error term. The coefficient of elasticity given by bkxk
The third form is the linear-log function expressed as:
exp (yi)= exp (bo+e1)[x1 b1 x2
b2……xk
bk]…………………………………….(5)
3. MATERIALS AND METHODS.
The study was conducted in Ezza North Local Government Area (LGA) of Ebonyi State, Nigeria. The LGA is located
between longitude 7°31 and 7°31E, of Greenwich Meridian and latitude 5°41 and 6°45N of Equator. It covers an area of about 305km2
with population of about 145, 619 people (NPC, 2006). It is bounded in the North by Ebonyi Local Government Area and Ohaukwu
Local Government Areas, in the East by Ezza South L G A and Abakiliki LGAs, in the South by Ohaozara LGA. and West by Ishielu
L GAs. The area is endowed with minerals, and has tropical climate with annual rainfall of about 1800mm - 2000mm, mean
temperature of about 28°C - 42°C and relative humidity of 65%. The main crops cultivated in the area are rice, yam and cassava. They
also engaged in livestock production such as sheep, goat, pig and poultry. The people also engage in other economic activities such as
hunting, tailoring, barbing, petty trading mechanics, saloon and civil services.
Multi-stage random sampling technique was used to select towns, villages and farmers. In the first stage, 4 towns were
selected out of 6 towns. In the second stage, 6 villages out of 8 were randomly selected, totaling 24 villages. In the third stage, five
sweet potato female farmers were selected from each village by the list provided by the extension agent of Agricultural Development
Programme(ADP). This brought to a total of 120 sweet potato famers for detailed study. Structured questionnaire and oral interview
were used to collect information as related to the study.
The objectives I and IV were analyzed using percentage response and frequency distribution.
Vol-3, Issue-9 PP. 972-883 ISSN: 2394-5788
875 | P a g e 3 0 S e p t e m b e r 2 0 1 6 w w w . g j a r . o r g
The objective iii was captured using Gross Margin analysis. The Gross Margin = total revenue – total variable cost. The Net farm
income = total gross margin + total fixed cost.
The multiple regression model used to address objective iii and was specified implicitly as:
Y = (X1, X2, X3, X4 X5 X6 X7 , X6 X7+…e)……………………………………………………………………………………(1)
Y = Output of Sweet potato (kg)
X1 = Age of the Farmers (years)
X2 = Level of Education (years).
X3 = cost of planting material (bundle)
X 4 = years of experience (years)
X 5 = labor employed in man days
X 6 =House hold size (no)
X 7 = quantity of fertilizer used in kilogram
X 8 = Farm size (ha)
E = error term
Four functional forms of the multiple regressions were employed in order to select the one that has provided the best fit. The functional
forms tried were:
Linear function
Y = b0 + b1 x1 b2 x2 + b3 x 3 + b4 x4 + b5 x5 + ei …………………………. (9)
Double log function:-
ln(y) = lnb0 + b1lnx1 + b2lnx2 + b3lnx3 + b4lnx4 + b5lnx5 + ei …………… (10)
Semi log
Y =lnb0 + b1lnx1 + b2lnx2 + b3lnx3 + b4lnx4 + b5lnx5 + ei ………………… (11)
Exponential function
lnY = b0 + b1x1 + b2x2 + b3x3 + b4x4 + b5x5 + ei………………..………… (12)
The choice of the best functional form was based on the magnitude of the R2 value, the high number of significance, size and
signs of the regression coefficients as they conform to apriori expectation.
Net farm income was used to address the profitability of sweet potato production in the study area.

Vol-3, Issue-9 PP. 972-883 ISSN: 2394-5788
876 | P a g e 3 0 S e p t e m b e r 2 0 1 6 w w w . g j a r . o r g
Gross Margin analysis = G.M. = TR – TVC …….……1
i.e. G.M =
m
ij
ii
n
xrQP11
11 ……...…. 2
The Net farm income can be calculated by Gross Margin less fixed input. The Net Farm Income can be expressed as thus:
NFI =
kxrQPm
ij
ii
n
11
11 …….…..3
Where: GM = Gross margin (N), NFI = Net Farm Income (N), P1 = Market (unit) price of output (N), Q = Quantity of output (kg), ri =
Unit price of the variable input (kg), xi = quantity of the variable input (kg) , K = Annual fixed cost (depreciation) (N), i = 1 2 3 ……..
n, j = 1 2 3
4. RESULTS AND DISCUSSION
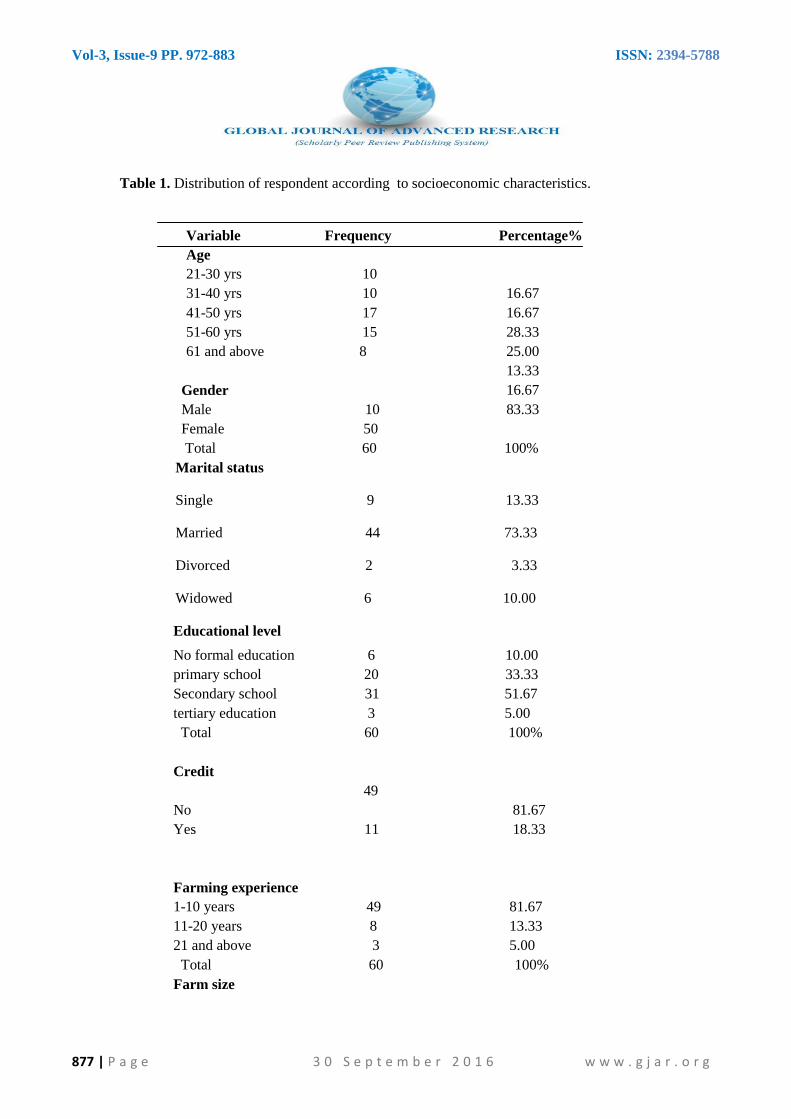
In Table 1, most (66. 7%) of farmers interviewed were between the age range of 41-50 years, indicating that old people are
more into sweet potato production. This age class is often conservative to technology adoption as well as cannot withstand the rigor
and strains in farming. These inadequacies are capable of affecting their production and productivity. This contradicts the findings of
Onyenweaku, et al (2010), whose finding was dominated by young energetic and enterprising individuals. In Table 1, majority
(83.33%) of the farmers interviewed was female and the male farmers were 16.67%. This finding gives credence to the popular axiom
that crop like sweet potato is gender stereotyped in many developing countries of the world. Nevertheless, because of economic
hardship and other circumstances, this scenario is gradually fading out (Kassam and Stockinger, 2006). In Table 1 ,revealed that
73.33% of the respondents were married, while 13.33 were single. Married people are often associated with children who could be
used in accomplishing certain agricultural activities in the farm; especially where they are of labor age. This assertion agrees with
Edumond (2006). Most (90%) of the respondents were educated and only 10% had no formal education. Educated people are often
prudent in scarce resources use for high yield to be attained in their farming activities.
In addition, 81.67% of the farmers studied had no access to credit and 18.33% do not . The high interest rate often associated
with commercial bank loans, lots of beaurocractic process involve in loan procuring loan and short term repayment of loan could be
cited to explain the poor access to credit by most farmers interviewed ( Enyinnia and Chinaka 2012). The Table moreover indicated
that 81.7% of the respondents had farming experience of 1-10 years. This infers that the sweet potato producting farmers in the study
area were well experienced in potato cultivation. FAO (2006) opined that long years of farming experience help farmers to set
realistic targets. Furthermore, 81.7% of respondents had farm size less than 2 hectares, while 2% cultivated above 4 hectares. This
result conform to the prior knowledge that most farmers in developing countries are largely small scaled in their operations with the
farms not only small but scattered, hence making mechanization very difficult (Therberye, 2009). Also, most (66.67%) of the
respondents used family labor in their farms, followed by hired labour (16.67%), while the least (3.33%), communal labour. The
higher proportion of farmers that were associated with family labor use could be linked to high cost of labor which is occasioned by
ferminalization of agriculture and youth migration to urban areas in pursuit of white collar job. This finding concurred with Ume, et
al,( 2010).
Vol-3, Issue-9 PP. 972-883 ISSN: 2394-5788
877 | P a g e 3 0 S e p t e m b e r 2 0 1 6 w w w . g j a r . o r g
Table 1. Distribution of respondent according to socioeconomic characteristics.
Variable Frequency Percentage%
Age
21-30 yrs 10
31-40 yrs 10
41-50 yrs 17
51-60 yrs 15
61 and above 8
16.67
16.67
28.33
25.00
13.33
Gender
Male 10
Female 50
16.67
83.33
Total 60 100%
Marital status
Single 9 13.33
Married 44 73.33
Divorced 2 3.33
Widowed 6 10.00
Educational level
No formal education 6
primary school 20
Secondary school 31
tertiary education 3
10.00
33.33
51.67
5.00
Total 60
100%
Credit
49
No
Yes 11
81.67
18.33
Farming experience
1-10 years 49
11-20 years 8
21 and above 3
81.67
13.33
5.00
Total 60 100%
Farm size

Vol-3, Issue-9 PP. 972-883 ISSN: 2394-5788
878 | P a g e 3 0 S e p t e m b e r 2 0 1 6 w w w . g j a r . o r g
0.01-1.00 49
1.01-2.00 6
2.01-3.00 3
3.01-4.00 2
81.67
10.00
5.00
3.33
Total 60 100%
Labour use
Family 40
hire 10
communal labor 2
family labor hire 8
66.67
16.67
3.33
13.33
Total 60 100%
Source: Field survey; 2015
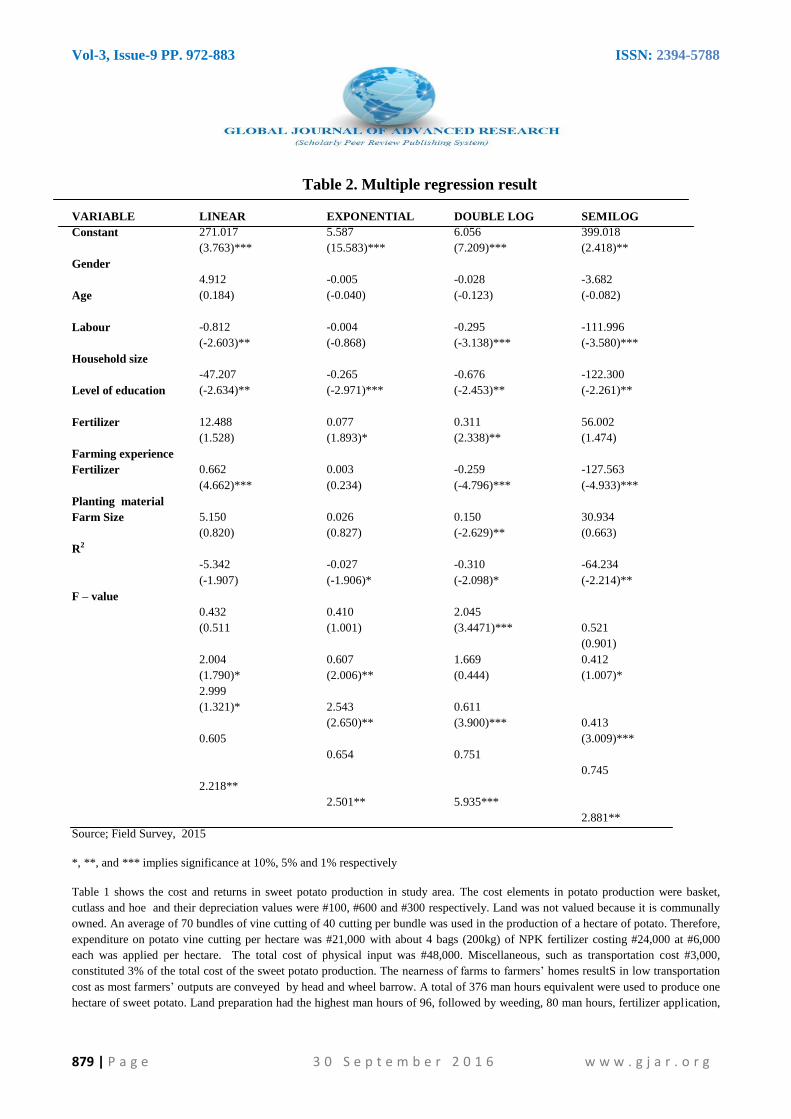
Based on statistical and econometric criteria, Double log production function was chosen as lead equation as shown in Table
2. The coefficient of determination (R2) was 0.751, implying that 75.1% of the variation in the output of the farmers were accounted
by various input included in the model, while the remaining 24.9% were due to error term. The statistical test of the coefficient of
education was negative and significant at 1% probability level. This is contrary to a priori expectation that the more educated one is,
the more likelihood of the increase in his farm outputs. This finding is in line with Malthew and Fatiomoh (2006), who reported that
high level of school attendant could reduce the desire for farming in preference to salaried employment instead. Onwuka et al, (2009),
opined that educational status informed the type of job and standard of living one had and this could impact directly on the farmer’s
production through among others, unlocking the natural talent and inherent enterprising qualities of the farmers.
As expected, the coefficient of household size was positive in agreement with a priori expectation that the larger the
household size, the more probability of increase in farmers’ output. This is desirable and of great importance in most developing
countries, since most rural households relied more on members of the households than hired labour to work in their farms in order to
save money that would had been paid to hired labour. More so, many poorer households according to Chukwu (2013) engage their
members into hired labour in order to generate income for improvement of family welfare. However, Nwokocha (2009) emphasized
that the impact of household size to agricultural production depends on the magnitude, age structure and available farm labour among
members. In line with a priori knowledge, the co-efficient of farming experience had direct relationship with farmers’ output and
significant at 10% alpha level. The aftermath of the farming experience as noted by Agbo and Ene, (2011) is to optimize the farmers`
capacity to maximize their output and profit at minimum cost. This can be achieved through efficient use of resources at their disposal.
The co-efficient of number of dependent was positive variable and has no significant. Surprisingly, the coefficient of credit was
negative and significant at 5% significant. The negative sign of the variable could be explained by poor access of the farmers to credit
facility and diversion of agricultural credit to nonfarm uses . Ume et al (2012) made similar finding. Fertilizer coefficient was
negatively related to the output of sweet potato women farmers at 5% significant level of alpha. This implied that as the price of
fertilizer increases, the fewer quantity of it being used by the farmers, consequently low outputs result. .The coefficient of farm size
was positive and significant at 1% alpha level. This implies that with all things being equal, the higher the farmers’ farm sizes the more
output of sweet potato being produced. Iheke (2006) reported that farm size played an important role in farm success because it
reflects the availability of capital, access to credit and even good management ability for higher production .
Vol-3, Issue-9 PP. 972-883 ISSN: 2394-5788
879 | P a g e 3 0 S e p t e m b e r 2 0 1 6 w w w . g j a r . o r g
Table 2. Multiple regression result
VARIABLE
Constant
Gender
Age
Labour
Household size
Level of education
Fertilizer
Farming experience
Fertilizer
Planting material
Farm Size
R2
F – value
LINEAR
271.017
(3.763)***
4.912
(0.184)
-0.812
(-2.603)**
-47.207
(-2.634)**
12.488
(1.528)
0.662
(4.662)***
5.150
(0.820)
-5.342
(-1.907)
0.432
(0.511
2.004
(1.790)*
2.999
(1.321)*
0.605
2.218**
EXPONENTIAL
5.587
(15.583)***
-0.005
(-0.040)
-0.004
(-0.868)
-0.265
(-2.971)***
0.077
(1.893)*
0.003
(0.234)
0.026
(0.827)
-0.027
(-1.906)*
0.410
(1.001)
0.607
(2.006)**
2.543
(2.650)**
0.654
2.501**
DOUBLE LOG
6.056
(7.209)***
-0.028
(-0.123)
-0.295
(-3.138)***
-0.676
(-2.453)**
0.311
(2.338)**
-0.259
(-4.796)***
0.150
(-2.629)**
-0.310
(-2.098)*
2.045
(3.4471)***
1.669
(0.444)
0.611
(3.900)***
0.751
5.935***
SEMILOG
399.018
(2.418)**
-3.682
(-0.082)
-111.996
(-3.580)***
-122.300
(-2.261)**
56.002
(1.474)
-127.563
(-4.933)***
30.934
(0.663)
-64.234
(-2.214)**
0.521
(0.901)
0.412
(1.007)*
0.413
(3.009)***
0.745
2.881**
Source; Field Survey, 2015
*, **, and *** implies significance at 10%, 5% and 1% respectively
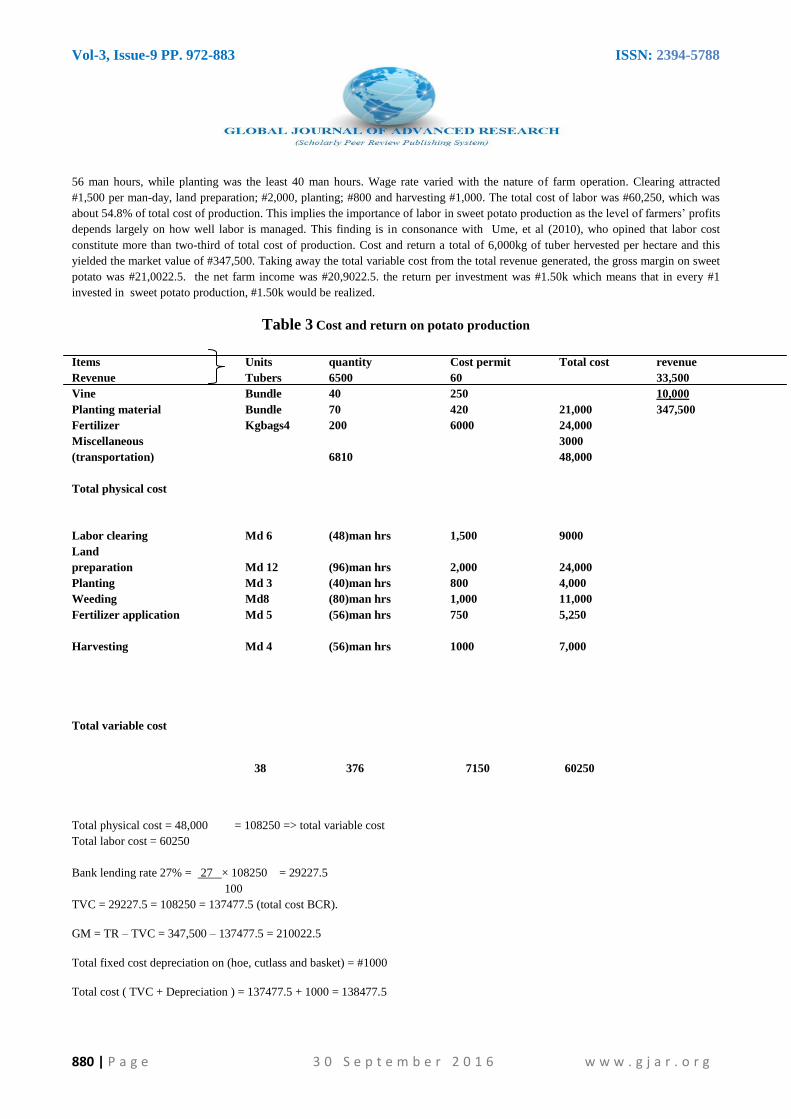
Table 1 shows the cost and returns in sweet potato production in study area. The cost elements in potato production were basket,
cutlass and hoe and their depreciation values were #100, #600 and #300 respectively. Land was not valued because it is communally
owned. An average of 70 bundles of vine cutting of 40 cutting per bundle was used in the production of a hectare of potato. Therefore,
expenditure on potato vine cutting per hectare was #21,000 with about 4 bags (200kg) of NPK fertilizer costing #24,000 at #6,000
each was applied per hectare. The total cost of physical input was #48,000. Miscellaneous, such as transportation cost #3,000,
constituted 3% of the total cost of the sweet potato production. The nearness of farms to farmers’ homes resultS in low transportation
cost as most farmers’ outputs are conveyed by head and wheel barrow. A total of 376 man hours equivalent were used to produce one
hectare of sweet potato. Land preparation had the highest man hours of 96, followed by weeding, 80 man hours, fertilizer application,
Vol-3, Issue-9 PP. 972-883 ISSN: 2394-5788
880 | P a g e 3 0 S e p t e m b e r 2 0 1 6 w w w . g j a r . o r g
56 man hours, while planting was the least 40 man hours. Wage rate varied with the nature of farm operation. Clearing attracted
#1,500 per man-day, land preparation; #2,000, planting; #800 and harvesting #1,000. The total cost of labor was #60,250, which was
about 54.8% of total cost of production. This implies the importance of labor in sweet potato production as the level of farmers’ profits
depends largely on how well labor is managed. This finding is in consonance with Ume, et al (2010), who opined that labor cost
constitute more than two-third of total cost of production. Cost and return a total of 6,000kg of tuber hervested per hectare and this
yielded the market value of #347,500. Taking away the total variable cost from the total revenue generated, the gross margin on sweet
potato was #21,0022.5. the net farm income was #20,9022.5. the return per investment was #1.50k which means that in every #1
invested in sweet potato production, #1.50k would be realized.
Table 3 Cost and return on potato production
Total physical cost = 48,000 = 108250 => total variable cost
Total labor cost = 60250
Bank lending rate 27% = 27 × 108250 = 29227.5
100
TVC = 29227.5 = 108250 = 137477.5 (total cost BCR).
GM = TR – TVC = 347,500 – 137477.5 = 210022.5
Total fixed cost depreciation on (hoe, cutlass and basket) = #1000
Total cost ( TVC + Depreciation ) = 137477.5 + 1000 = 138477.5
Items
Revenue
Vine
Planting material
Fertilizer
Miscellaneous
(transportation)
Total physical cost
Units
Tubers
Bundle
Bundle
Kgbags4
quantity
6500
40
70
200
6810
Cost permit
60
250
420
6000
Total cost
21,000
24,000
3000
48,000
revenue
33,500
10,000
347,500
Labor clearing
Land
preparation
Planting
Weeding
Fertilizer application
Harvesting
Total variable cost
Md 6
Md 12
Md 3
Md8
Md 5
Md 4
(48)man hrs
(96)man hrs
(40)man hrs
(80)man hrs
(56)man hrs
(56)man hrs
1,500
2,000
800
1,000
750
1000
9000
24,000
4,000
11,000
5,250
7,000
38 376 7150 60250

Vol-3, Issue-9 PP. 972-883 ISSN: 2394-5788
881 | P a g e 3 0 S e p t e m b e r 2 0 1 6 w w w . g j a r . o r g
Total farm income = TR – TC = 347,500 – 138477.5 = 209022.5
Return on investment (BCR) = NFI = 209022.5 = 1.50.
TC 138477.5
Source: Field survey 2015.
N.B kg =kilogram, MD =man-day.
Table 4 revealed that credit problem was reported by 66.67% of the respondent. Credit is used to purchase input and
payment labour(FAO, 2006).Moreover, land scarcity was reported by 43.33% of the respondents. The scarcity of land in the study
area could be related to method of land tenure holding which results in the smallness and scartteredness of cultivated land, which
impair mechanization and commercialization of agriculture (Ume et al, 2010). More so High cost of labor was reported by 53.33% of
the sampled farmers. High cost of labour is as a result of youth migration to urban area in search of white-collar job and the few
youths that are left behind charges high to meet up with urban counterpart (Nwokocha, 2009). Also, shortage of vine was reported by
46.67% of the respondents. As well, high cost of fertilizer (55%) was incurred by the respondents as reported in table 4. Fertilizer is
important in boasting farmers’ production but the diversion of the resources to the neighboring state and black market of the resource
, made fertilizer very scarce at farm level (Onyeweaku et at, 2010). Lack of storage was reported by 55% of the respondents. The
problem of storage makes the industrial uses of sweet potato very difficult and the product seasonal.
Furthermore, high cost of transportation was complained by 48.33% of the sampled farmers as shown in table 4. This is as
result of poor road network in many rural areas where farming takes place and this effect transportation of the farmers’ products
(sweet potato) to the markets and farmers’ home very difficult and costly. Transportation problem makes some farmers to sell their
products at cheaper rate at the farm gate(Ukpabi, 2012). Finally, market problem was encountered by 48.33% of sampled farmers.
Market problems involve availability of the market, nearness to the market and availability of customers to purchase the product of the
particular market(Tewe et a l 2012).
Table 4; Constraints to Sweet Potatoes production
Variable Frequency Percentage
Credit 42 76.7
Land Scarcity 42 70
High cost of Labour 38 63.3
Shortage of vine 36 60
High cost of fertilizer 34 56.7
Lack of storage 32 53.3
High cost of transportation 28 45.7
Marketing Problem 14 23.3
*Multiple response
Source; Field, Survey; 2015
5. CONCLUSION AND RECOMMENDATIONS
Based on the results, the following conclusions were deduced
a) Most of the respondents studied were above 40 years of age and above, predominantly females and small scaled in their
farming operations and are fairly educated.

Vol-3, Issue-9 PP. 972-883 ISSN: 2394-5788
882 | P a g e 3 0 S e p t e m b e r 2 0 1 6 w w w . g j a r . o r g
b) The socio-economic characteristics that were positive and significant at varied level of significant to the farmers’ output
were household size, level of education and farming experience, farm size and fertilizer.
c) Sweet potato was profitable in the study area.
d) The major constraints of sweet potato production were capital, lack of storage facilities,
e) high cost of fertilizer and high cost of transportation.
Based on the results obtained from the study the following policy considerations and recommendations are deduced;
a) There is need to ensure the availability of improved varieties of sweet potato to the farmers to curtail the extent of recycling
of old and local varieties stocks in farmers possession, which has genetically broken down and sources of pest and disease
transfer, thereby affecting their yields.
b) Labor saving device such as hand driving plough should be developed and be disseminated to farmers in order to reduce
high labor cost.
c) Adult education, seminars and conferences should be organized by appropriate bodies to equip farmers in good managerial
skills and rational decision making ideas to enhance their production and productivity.
d) Policy options aimed at improving the rural infrastructure to discourage urban-rural migration of energetic youths that
would serve as source of labor should be implemented.
e) Credit should be made available to farmers through micro-finance bank, agricultural credit scheme and any other
government agencies and cooperate bodies at reduced interest rate and affordable collaterals.
f) More extension agents should be employed and policy aimed at providing motivations to extension agents for effective
dissemination of innovation to the farmers.
g) Finally, access road; the road to the farm should be motorable to reduce difficulty and high cost of transporting agricultural
products to the market or home for various uses.
6. ACKNOWLEDGEMENT Our specially thanks go to Miss Peace, who analyzed the data and University Library staff of University of Nigeria Nsukka, Nigeria for
allowing us to use their facilities.
7. REFERENCE
[1] Agbo, I. and Ene, C.S.O. 2011 “status of sweet potato production and research in Nigeria” sweet potato. Jero Publishers,
Enugu, Nigeria.
[2] Onwuka S., Ekwe K.C. and Nwosu A.C. 2009 comparative analysis of foreign and local rice consumption Ikwuano and
Umuahia North Local Government Area of Abia State. Nigeria, Journal of Rural Development 31(5) 134 – 139.
[3] Mathew O.A and Fatimoh A.A 2006 Profitability and Technical Efficiency of Sweet Potato Production Nigeria, Journal of
Rural Development 31(5) 105-120.
[4] Kasaam A.H. and Stockinger, K.R. 2006. Growth and nitrogen uptake of sorghum and millet in mixed cropping. Samatu. Pp
140-148.
[5] Nwokocha, H.N. 2009. Agronomy of sweet potato “in’’ O.B. Arene (ed). Root Crops Research and Technology Transfer
training Manual. National Root Crop Research Institute (NRCRI). Pp 34 -40
[6] Purseglovw, J.W. 2004. Tropical crops. Dicots. I. john Wiley and Sons Inc. New York. P. 78-88.
[7] Therberye, R.L. 2009, common African pest and disease of cassava , yam, sweet potato and cocoyam. IITA Ibadan Building
+ Mamset Ltd England Pp. 64-66.
[8] Ukpabi, U.J. 2012. Processing and utilization of sweet potato `in’ Root Crop Research Technology Transfer Training
Manual, O.B. Arene (ed). NRCRI Umucike, Nigeria.

Vol-3, Issue-9 PP. 972-883 ISSN: 2394-5788
883 | P a g e 3 0 S e p t e m b e r 2 0 1 6 w w w . g j a r . o r g
[9] Chukwu G.O 2013, seasonality and climate period effect on crop transpiration of sweet potato. In root crop in the 21st
century. Proc. 7th Triennial Symposium of the ISTRC-AB, Akoroda, M.O and Ngeve J.M (eds) Cotonou Benin, 11th 17th
Oct. 1998,pp 280 284.
[10] Food and Agricultural Organization, (FAO) 2006: Production year book of the United Nations.
[11] National population commission (N.P.C) 2006, Abuja, Nigeria.
[12] Tewe, O.O; Ojeniyi E.F and Abu, O A 2012 sweet potato production, utilization and marketing in Nigeria. Social science
department, international potato center (CIP), Lima, Peru.
[13] Edmond, J.B. 2007, Sweet potato production, processing and marketing
[14] The AV publishing company inc. west port, com.
[15] Enyinnia, T and Chinaka, C.C. 2012, chemical weed control in sweet potato in the rainforest zone of South Eastern Nigeria.
Nigeria journal of weed science Vol. 5: 37-40
[16] Onyeweakwu, C, E., Okoye, B.C and Okorie, K.C 2010; Determinants of fertilizer adoption by rice farmers in bendel local
government area of Abia state, Nigeria. In the Nigeria Agriculture Journal.4; 234 – 240
[17] Sarr, A. 2009; Poverty and famines. An essay on entitlement and derivation; clarion press, oxford, UK.
[18] Ume, S.I, Arene, C.I. and Okpukpara, B. 2010: Adoption of improved crop production technology in Anambra State,
Nigeria: T & V system approach. Farm Management Association of Nigeria, 20th Annual National Conference held at Jos.
Pp56-61