socio economic and spatial restructuring impact of social
TRANSCRIPT

SOCIO-ECONOMIC AND SPATIAL RESTRUCTURING
IMPACT OF SOCIAL HOUSING
JULY
FY 2018/19
Prepared by:
(SHRA and Genesis Analytics (Pty) Ltd)

Page | i
Table of Contents
Table of Contents ..................................................................................................................................... i
Table of Figures ......................................................................................................................................iii
List of Tables ...........................................................................................................................................iii
List of Abbreviations ................................................................................................................................iii
Policy Summary ...................................................................................................................................... 1
Executive summary ................................................................................................................................. 2
1. Introduction ...................................................................................................................................... 2
2. Key findings from the literature/document review ........................................................................... 2
3. The programme ............................................................................................................................... 2
4. Key findings ..................................................................................................................................... 3
4.1. Policy and strategy: ................................................................................................................. 3
4.2. Delivery of social housing ....................................................................................................... 3
4.3. Tenant Outcomes .................................................................................................................... 4
4.4. Neighbourhood outcomes ....................................................................................................... 4
4.5. Sector Outcomes .................................................................................................................... 5
5. Recommendations .......................................................................................................................... 5
6. Introduction ...................................................................................................................................... 7
7. Intervention description ................................................................................................................... 7
7.1. Defining Social Housing .......................................................................................................... 7
7.2. Policy Objectives ..................................................................................................................... 8
7.3. Stakeholders in the Social Housing Sector ............................................................................. 9
7.4. Restructuring Zones .............................................................................................................. 10
7.5. Social Housing Target Market ............................................................................................... 13
7.6. Social Housing Institutions .................................................................................................... 13
7.7. Financing for Social Housing Institutions .............................................................................. 14
7.8. Viable Social Housing Institutions ......................................................................................... 15
8. Purpose of the study ..................................................................................................................... 15
9. Approach and methods ................................................................................................................. 15
9.1. Research Framework ............................................................................................................ 16
9.2. Contribution Analysis ............................................................................................................ 16
9.3. Data collection ....................................................................................................................... 17
9.3.1. Secondary Data............................................................................................................. 17
9.3.2. Primary Data ................................................................................................................. 17
9.3.3. Qualitative Data Collection ............................................................................................ 21
10. Literature review ........................................................................................................................ 22
10.1. Introduction ............................................................................................................................ 22

Page | ii
10.1.1. Defining Social Housing ................................................................................................ 23
Overarching definitions ...................................................................................................... 23
10.1.2. Variations interpretations .............................................................................................. 24
10.2. What is the rationale for social housing? .............................................................................. 25
10.2.1. Why is housing important? ............................................................................................ 25
10.2.2. What are the problems that social housing aims to address? ...................................... 26
10.3. How has social housing been operationalised? .................................................................... 29
10.3.1. How is social housing delivered? .................................................................................. 29
10.3.2. Who does social housing benefit? ................................................................................ 30
10.4. How effective has social housing been? ............................................................................... 31
11. Findings and analysis ................................................................................................................ 33
11.1. Policy and strategy ................................................................................................................ 36
11.1.1. Spatial disadvantaged provided housing ...................................................................... 36
11.1.2. Social Restructuring ...................................................................................................... 37
11.1.3. Economic Restructuring ................................................................................................ 39
11.1.4. Social Housing Target Market ....................................................................................... 39
11.2. Delivery of social housing ..................................................................................................... 40
11.2.1. Employment opportunities created by SHIs .................................................................. 40
11.2.2. Financial Sustainability .................................................................................................. 41
11.3. Tenant Outcomes .................................................................................................................. 43
11.3.1. Security ......................................................................................................................... 43
11.3.2. Transportation ............................................................................................................... 46
11.3.3. Economic opportunities ................................................................................................. 48
11.3.4. Health ............................................................................................................................ 51
11.3.5. Education ...................................................................................................................... 53
11.4. Neighbourhood outcomes ..................................................................................................... 55
11.4.1. Urban regeneration ....................................................................................................... 55
11.4.2. Spatial Restructuring ..................................................................................................... 56
11.4.3. Community Integration .................................................................................................. 59
11.5. Sector outcomes ................................................................................................................... 59
12. Conclusion ................................................................................................................................. 60
13. Recommendations .................................................................................................................... 61
13.1. Policy ..................................................................................................................................... 61
13.2. Delivery Model....................................................................................................................... 61
13.3. Tenanting .............................................................................................................................. 61
13.4. Community Development Programmes ................................................................................ 62
13.5. Longitudinal Study ................................................................................................................. 62

Page | iii
Table of Figures
Figure 1: Typology of restructuring zones ............................................................................................. 12 Figure 2: Approach ................................................................................................................................ 16 Figure 3: Number of households surveyed per housing project ........................................................... 18 Figure 4: Provincial Breakdown of Survey Respondents ...................................................................... 19 Figure 5: Gender of leaseholders (according to survey responses) ..................................................... 19 Figure 6: Distribution and average age of the leaseholders (according to survey responses) ............. 20 Figure 7: Race of the leaseholders ....................................................................................................... 21 Figure 8: Household size ...................................................................................................................... 21 Figure 9: Expanded theory of change with focus on tenant, community and city outcomes ................ 34 Figure 10: Policy and Strategy Impact Pathway ................................................................................... 36 Figure 11: Racial profile of the tenants vs the racial profile of the surrounding ward ........................... 37 Figure 12: Ward-Level Income .............................................................................................................. 38 Figure 13: SHI Delivery Impact Pathway .............................................................................................. 40 Figure 14: Overall feelings of safety ..................................................................................................... 45 Figure 15: Transport used by surveyed tenants to get to work............................................................. 47 Figure 16: Comparison of employment statistics .................................................................................. 50
List of Tables
Table 1: Summary of roles and responsibilities of sector stakeholders .................................................. 9 Table 2: Restructuring Zones ................................................................................................................ 11 Table 3: Gender of leaseholders as per data provided by SHIs ........................................................... 19 Table 4: Overview of employment opportunities provided by SHIs ...................................................... 40 Table 5: SHI RCG-capitalised social housing portfolio ......................................................................... 41 Table 6: Crime statistics disaggregated by precinct around project ..................................................... 45 Table 7: Documents and literature reviewed ...................................................................................... 101 Table 8: FGD details ........................................................................................................................... 101 Table 9: KII stakeholder list ................................................................................................................. 102
List of Abbreviations
BNG Breaking New Ground
CID City Improvement District
DPME Department of Planning, Monitoring and Evaluation
EAP East Asia and the Pacific
FGD Focus Group Discussions
FLISP Finance Linked Individual Subsidy Programme
IHS International Housing Solutions
IRR Income-Related Rent
IS Institutional Subsidy
JDA Johannesburg Development Agency
JOSHCO Johannesburg Social Housing Company
KFC Kentucky Fried Chicken
KII Key Informant Interviews

Page | iv
LTR Long-Term Rules
MES Metro Evangelical Services
MPI Multidimensional Poverty Index
NASHO National Association of Social Housing Organisations
NPO Non-profit organisation
PAR Participatory Action Research
RCG Restructuring capital grant
RDP Reconstruction and Development Programme
SAMPI SA multi-dimensional poverty index
SHI Social Housing Institution
SHP Social Housing Programme
SHRA Social Housing Regulatory Authority
StatsSA Statistics South Africa
ToC Theories of change
TVET Technical vocational education and training
UIF Unemployment Insurance Fund
UNISA University of South Africa

Page 1 of 108
Policy Summary
The aim of the Social Housing Programme (SHP) is to redress spatial inequities entrenched by apartheid, by
providing low- and middle- income households with good quality and affordable rental housing opportunities in
well-located areas of cities. Secondly, the programme aims to improve the functioning of the housing sector by
contributing to the range of housing options available to the poor. Genesis was appointed to undertake a study
on the socio-economic and spatial restructuring impact of social housing using a case studies approach to
establish how the SHP has delivered on its two primary objectives, as well as identify the impact it has on the
household.
The study finds that the contribution of the SHP to the national priorities of restructuring was contextual and
dependent on the specific location of the projects. While some projects have contributed to localised
restructuring by providing previously disadvantaged individuals with access to a wide range of amenities and
employment opportunities, social housing should not be seen as a panacea and should be considered as one
component of coordinated public and private investment. In terms of social housing’s contribution to
neighbourhood development, the evidence shows that tenants are spending in the areas around the social
housing projects, which will lead to improvements in the local economy; however, beyond these direct increases
in local aggregate expenditure the impacts of social housing on the neighbourhoods of the case studies is
limited. Social housing projects have encouraged some investment by public and private sector actors in
transport infrastructure, housing and the development of amenities. However, given the limited scale of social
housing, it is difficult to attribute investment in an area directly to social housing. Additionally, the housing
projects have, in some instances, contributed to an increase in social integration; however, in other instances
the demographics, particularly racial makeup of the housing projects mirror that of the areas they are placed.
Finally, the findings of this study find that the SHP has not yet reached a scale that can significantly contribute
to the housing sector change.
• Recommendation: the development of social housing should be closely linked to urban
regeneration. Current policy only examines whether or not a site is in a restructuring zone. Going
forward there should be a closer link to municipal development plans. Greater integration is needed
between the municipalities and the SHRA to ensure that social housing compliments urban
regeneration. To achieve this, a coordinated effort is needed between public and private investments.
In terms of providing a viable housing option for low- to middle- income households, social housing institutions
(SHIs) receiving a restructuring capital grant (RCG) subsidy have shown success in the short term; however,
the high operating costs have made it increasingly difficult for SHIs to continue charging affordable rentals in
the primary target market. As a result, low-income households may eventually be priced out of social housing
as SHIs try reach commercial sustainability. The commercial sustainability of SHIs is also under threat due to
marginal project viability and net operating deficits on subsidised units.
• Recommendation: social housing institutions should be charged concessionary commercial
rates and taxes. Some SHIs are charged commercial rates and taxes while others charged NPO rates
and taxes. Going forward the SHRA should negotiate with municipalities to ensure that all SHIs are
charged consistent concessionary rates.
• Recommendation: to ensure commercial sustainability of the SHIs, a mix of low-, middle- and
high-income tenants should be considered. Diversity among the income groups will allow for cross-
subsidisation to occur within social housing.
Social housing can play a vital role in improving peoples’ lives and uplift communities; however, the study finds
that it is not the remedy to all issues facing the country and some of its impact may be intergenerational.
Furthermore, without a scalable approach to delivering social housing, the impact it can have on national spatial,
economic and social impact will be limited.
• Recommendation: the impact of social housing should be studied longitudinally

Page 2 of 108
Executive summary
1. Introduction
Genesis Analytics (“Genesis”) was appointed by the Social Housing Regulating Authority (“SHRA”) to undertake
a study on the socio-economic and spatial restructuring impact of social housing using a case study approach.
The aim of the South African social housing programme (SHP) is to redress spatial, economic and social
inequities entrenched by apartheid, by providing low- and moderate-income households with good quality and
affordable rental housing opportunities in well-located areas of South African cities. The primary purpose of this
study is to establish how the SHP has led to social, economic and spatial restructuring. The study used ten
case studies to assess whether the programme’s theory of change held and what contribution social housing
was making to tenants’ lives, the neighbourhoods they live in and the housing sector.
2. Key findings from the literature/document review
The literature review finds that there is no agreed-upon meaning for the term social housing however, in
examining multiple definitions common threads were found. Globally, social housing is noted to be a response
to a reinforcing housing market failure where well-located housing becomes unattainable and the excluded
become spatially marginalised. Thus, social housing is often targeted at low- to -middle income households and
provides an affordable housing option.
Globally there is evidence that social housing has contributed positively to reduced absenteeism of tenants at
both school and work, improved health and education outcomes, improved feelings of safety and provided
opportunities to build strong networks. However, in some countries such as the US and Chile, it has had
negative outcomes on reinforcing segregation along racial and income lines respectively. The literature review
also highlights the importance of placing the results within a defined context, as not all outcomes are produced
by a direct causal relationship, instead they are the results of a complex system where outcomes come about
from being reinforced by one another.
3. The programme
The Social Housing Act 16 of 2008 defines social housing as follows: ‘A rental or cooperative housing option
for low-income persons at a level of scale and built form which requires institutionalised management and which
is provided by social housing institutions in accredited social housing projects in designated restructuring zones.
The aim of the South African SHP is to redress spatial inequities entrenched by apartheid, by providing low-
and moderate-income households with good quality and affordable rental housing opportunities in well-located
areas of South African cities. Secondly, the programme aims to improve the functioning of the housing sector
by contributing to the range of housing options available to the poor.
To achieve these policy objectives social housing is largely dependent on its location, which has to be in a
restructuring zone. Furthermore, the for social housing to be effective it has to reach its intended target audience
which is made up of primary audience who earns between R1 500 and R7 500 and a secondary audience who
earns between R5 500 and R15 000. Lastly, social housing is administered through an accredited social housing
institution, who undertake the property and tenanting management.
Historically, the delivery of social housing was subsidised directly through two instruments, an institutional
subsidy (IS) or a restructuring capital grant (RCG). The RCG is intended to fund a proportion of the capital costs
of the social housing project, while the remaining portion be funded by debt or other sources of funding. To
qualify for the RCG, a social housing project must have at least 30% of the units allocated to individuals in the

Page 3 of 108
primary target market, who would pay subsidised rentals of between R500 and R1 166.1 Additionally, the RCG
increases proportionately to the number of tenants in the primary target market to a maximum of 70%. Overall,
the RCG is intended to deliver a return that covers financing costs, operating costs, provision for long-term
maintenance as well as additional margin for future reinvestment. Following the DPME evaluation of social
housing, the Restructuring Capital Grant quantum and income bands were adjusted and a single social housing
funding stream was introduced. As of October 2017, the SHP is largely funded through the consolidated capital
grant (CCG), which is transferred to the SHRA.
4. Key findings
The following findings are based on a representative sample of 1636 households from ten housing projects in
three different provinces, key informant interviews with relevant stakeholders in the social housing sector, and
the literature review.
4.1. Policy and strategy:
The contribution of social housing to spatial restructuring depends on the locations of the social housing
projects. Projects that are located in the inner city have contributed to spatial restructuring by providing
previously disadvantaged individuals with access to a wide range of amenities and employment opportunities.
The other projects have had made a minor contribution to spatial restructuring through the densification of urban
areas and infill development. Additionally, the study finds that social housing is a contributor to social
restructuring, particularly at a neighbourhood level by ensuring a racial tenant mix, with the exception of a few
cases. The social housing projects have integrated individuals of different races, and in some cases, brought
previously disadvantaged individuals into historically ‘White neighbourhoods.
It is further concluded that social housing projects have had a varied impact on economic restructuring and
urban regeneration. This study noted that there has been investment, such as transport hubs, schools or
shopping centres, around the social housing projects, but we cannot attribute this to the social housing. There
is also evidence of social housing catalysing small business development in the immediate surrounding areas.
However, given the limited scale of social housing, it is difficult to attribute investment in an area directly to
social housing.
Lastly, in general, SHIs have been successful in targeting low- to middle- income households; however, the
high operating costs have made it increasingly difficult for SHIs to charge affordable rentals to households in
the primary target market. Additionally, it has become increasingly difficult for these households to afford the
rent and the additional service charges that accompany it. As a result, low-income households are likely to
eventually be priced out of social housing.
4.2. Delivery of social housing
SHIs have directly created a number of temporary, contract and permanent jobs. However, the job creation
potential of the social housing programme is limited. The jobs created are related directly to social housing
activities, primarily tenant management and maintenance activities.
The commercial sustainability of SHIs is under threat due to marginal project viability and net operating deficits
on subsidised units. Additionally, SHIs are struggling to grow their portfolio to optimal numbers which further
1 Ibid
Page 4 of 108
exposes them to the risk of becoming commercially unsustainable. A consequence of this is that projects are
not well-maintained, which puts them at risk of degradation in the long-term.
4.3. Tenant Outcomes
The study examines a variety of outcomes that tenants should experience from after moving into social housing.
The following presents the findings and commentary on these outcomes:
• Security: All social housing projects included in this study have some combination of security measures
(such as security guards, controlled access, turnstiles or electric fencing). The social housing projects that
have these measures have increased, on average, how safe tenants feel within the social housing project.
However, it was noted that social housing has no control of security measures outside of the SHP, this
study found that of those surveyed, 9% had been victims of violent crimes and 17% had been victims of
property theft since moving into social housing. These numbers are not necessarily reflective of social
housing, but of living in a country like South Africa. SAPS data on reported crimes in 2018 shows that 12%
of people in South Africa were victims of violent crimes and 25% were victims of property crimes, which is
greater than the reported levels in social housing.2
• Transportation: A consequence of the SHPs location was tenants’ access to public transports routes.
Lakehaven, Valley View, Scottsdene were all located in suburban areas and therefore had limited access
to regular public transport. Areas such as Belhar or City deep were located in industrial areas where
transport mainly brought people to the area to work as opposed to taking people outside of the area. Lastly
projects such as BG Alexander, Roodepoort, Tau Village and Thembelihle were all situated within walking
distance of a transport hub and therefore had easy access to public transport. Apart from access to public
transport residents can walk to certain amenities if they are close enough, carpool with other residents or
use their own private vehicles.
• Economic opportunities: Without access to regular transport tenants are limited in their employment
opportunities to what is close to the social housing project. Social housing that is located in suburban areas
limits employment opportunities. However, we find that social housing presents tenants with some
opportunities for self-employment, apart from the opportunities (such as becoming a cleaner and or
handyman) present in social housing.
• Health: On average social housing is located near various healthcare facilities, proximity to these
healthcare facilities and the health focused community development programmes have provided tenants
with better access to healthcare.
• Education: On average social housing is located near various educational facilities, proximity to these
educational facilities has provided tenants with better access to education. However, despite this it is found
the students were still travelling significant distances to educational facilities. On average, tenants claim
that their children have experienced improved educational outcomes since moving to a new school after
moving into social housing. This is noted to be a result of children attending schools with better facilities.
4.4. Neighbourhood outcomes
Tenants are spending, on average R2 407, in the areas around the social housing projects, which will lead to
improvements in the local economy; however, beyond these direct increases in local aggregate expenditure,
the evidence of impact on the neighbourhoods of the case studies is limited. Social housing projects have
encouraged some investment by public and private sector actors in transport infrastructure, housing and the
2 Crime stats SA. Available : http://www.crimestatssa.com/national.php
Page 5 of 108
development of amenities. However, given the limited scale of social housing, it is difficult to attribute investment
in an area directly to social housing.
4.5. Sector Outcomes
A well-functioning housing sector has a mixture of tenure options and provides subsidised sectional title or
freehold accommodation to relieve pressure on subsidised rental accommodation, including social housing.
Additionally, the subsidy support framework across different housing instruments is coherent but uncoordinated
and greater linkages between programmes should be encouraged. Lastly, the involvement of the private sector
is critical to a well-functioning housing sector. In recent years, it was noted that 50% of new projects came from
the private sector. This indicates that the objective of the social housing policy which aims to facilitate private
sector investment in social housing through the establishment of private public partnerships is being achieved
Conclusions
While limited in scale, social housing is having positive effects on the tenants and communities that it is located
in. The delivery of social housing has also led to improvements in tenants’ feeling of safety, education outcomes
and access to health care. However, these impacts are contextual and largely dependent on the specific social
housing project’s location relative to amenities and economic opportunities. Moreover, it must be noted that
social housing cannot provide a panacea for all social and economic issues and in some instances the
contribution of social housing to certain outcomes, such as health, employment and income may only be realised
intergenerationally. While social housing is successfully targeting low-income households, the financial cost
incurred by SHIs may result in these low-income households being priced out of social housing in the future.
In terms of social housing’s contribution to neighbourhood development, the evidence shows that tenants are
spending in the areas around the social housing projects, which leads to improvements in the local economy.
However, beyond these direct increases in local aggregate expenditure the evidence of the impacts of social
housing on the neighbourhoods around the case studies is limited. Social housing projects have encouraged
some investment by public and private sector actors in transport infrastructure, housing and the development
of amenities. However, given the limited scale of social housing, it is difficult to attribute investment in an area
directly to social housing.
Social housing projects have, in some instances, contributed to an increase in social integration; however, in
other instances the demographics, particularly racial makeup of the housing projects mirror that of the areas
they are placed. Finally, the findings of this study find that the SHP has not yet reached a scale that can
significantly contribute to the housing sector change.
5. Recommendations
Policy
R1 The development of social housing should be closely linked to urban regeneration and there should be
a coordinated effort between private and public investment.
R2 Social housing organisations should be charged concessionary commercial rates and taxes by
municipalities to ensure consistency.
Delivery Model
R3 Rental amounts should be indexed to tenants’ income bands to account for fluctuations in tenants’
income.

Page 6 of 108
R4 Greater links to other affordable housing options, such as BNG or FLISP should be generated to ensure
that correct target market is being matched to the right housing option.
R5 There should be a set of service provider guidelines that inform the security measures added to social
housing projects.
Tenanting
R6 To ensure financial sustainability of the SHIs, there should be a mix of low-, middle- and high-income
tenants.
R7 Alternative tenure options should be available to tenants, to help them move out of social housing.
Community Development Programmes
R8 Community development programmes should partner with existing community organisations to ensure
further integration with the community.
Longitudinal study
R9 The impact of social housing should be studied longitudinally.

Page 7 of 108
6. Introduction
Genesis Analytics (“Genesis”) has been appointed by the Social Housing Regulating Authority (“SHRA”) to
undertake a study on the socio-economic and spatial restructuring impact of social housing using a case study
approach. This report contains the background section, a literature review on social housing, a description of
methods used in this study, the findings of the study, conclusions based on the analysis and recommendations.
An annex contains the individual case studies.
7. Intervention description
The objective of this section is to provide an overview of the social housing programme and describe the
mechanism through which it is implemented. This section is structured as follows:
Definition of Social Housing
Policy Objectives
Target Market for Social Housing
Restructuring Zones
Social housing institutions (SHIs)
7.1. Defining Social Housing
The Social Housing Policy defines social housing as follows:
‘A rental or co-operative housing option for low income persons at a level of scale and built form which requires
institutionalised management and which is provided by accredited social housing institutions or in accredited
social housing projects in designated restructuring zones.’3
Related to this definition, additional key concepts are described in the box below:
Box 1: Key Social Housing Concepts
Social Housing Institutions (SHI) is defined as a legal entity established with the primary objective of developing and/or
managing housing stock that has been funded through the grant programmes specified in this policy, which institution
has been accredited by the designated regulatory body (defined in this policy). The housing stock can be owned by
the housing institution, or it can be owned collectively by groups of residents. Housing institutions should not be seen
as short- term vehicles for providing housing to a specified market segment, but are seen as robust, sustainable
institutions, established to assist in providing the social housing option. Housing institutions will therefore have to
demonstrate financial and operational sustainability over time while adhering to the guiding principles for social
housing.
Other Delivery Agent (ODA): means any entity other than a SHI which may undertake an approved project,
but excludes a provincial government or a municipality
Approved Project: A project in which government provides a subsidy, through the Social Housing Regulatory Authority
(SHRA), in order to make rental units which are provided by a SHI or private sector actor affordable to those eligible
for social housing. Restructuring Zones: Geographic areas identified by local authorities (municipalities) and supported by provincial
government for targeted, focused investment. Within these areas, SHIs can apply for the Restructuring Capital Grant
(explained in the sections that follow). Social housing in restructuring zones must take the form of medium density,
3 The Government of the Republic of South Africa, 2009. Social Housing Policy. Available at
http://www.dhs.gov.za/sites/default/files/documents/national_housing_2009/6_Social_Rental_Interventions/3
%20Vol%206%20Social%20Housing%20Policy.pdf

Page 8 of 108
multi-unit complexes requiring institutionalised management. This includes townhouses, row housing, multi-story
units and walk-ups and excludes detached units.
Social housing can take the form of greenfield development, which involves development on unused land or
brownfield development, which includes the refurbishment or remodelling of existing buildings. As such,
greenfield developments often take the form of two-three storey walk ups whereas brownfield developments
can take the form of high-rise, multi-storey units.
Social housing provides a rental tenure option and as such, excludes individual ownership by tenants.
Therefore, delivery agents may not transfer to individual ownership any of the units developed with social
housing grants or subsidies.4 Transfer to individual ownership will only be possible with the permission from the
regulator given that a portion of the subsidy will be repaid.5 Social housing does, however, allow for collective
forms of ownership through housing co-operatives who have to be accredited as SHIs.6
Lastly, in addition to residential accommodation, social housing projects should also provide a range of
community development programmes and other facilities in services to promote social cohesion. This includes
social services such as health, education and recreation programmes, economic services such as financial
counselling, training and empowerment programmes.7
7.2. Policy Objectives
The aim of the South African SHP is to redress spatial inequities entrenched by apartheid, by providing low-
and moderate-income households with good quality and affordable rental housing opportunities in well-located
areas of South African cities.8 Additionally, the programme aims to promote the integration of households across
income and population divides and further provide poor households with convenient access to employment
opportunities and the full range of urban amenities.9
The policy intention of the social housing programme is set out in the Social Housing Policy, the National
Housing Code and the Social Housing Act. Based on these documents, the SHP has two primary objectives:
Firstly, the programme aims to deliver affordable rental housing to low-medium income households.10 Secondly,
the programme aims to contribute to the national priority of restructuring South African society to redress
structural economic, social and spatial dysfunctionalities thereby contributing to Government’s vision of an
economically empowered, non-racial and integrated society living in sustainable human settlements.11 The
restructuring contribution of social housing relates to three components:
4 The Government of the Republic of South Africa, 2008. Social Housing Act 16 of 2008. Available at
https://www.gov.za/sites/default/files/gcis_document/201409/315771199.pdf 5 Ibid 6 Ibid 7 Department of Planning, Monitoring and Evaluation (DPME), 2016. Impact and Implementation Evaluation of
the Social Housing Programme 8 National Association of Social Housing Organisations (NASHO), 2013. Reviving our inner cities: Social
Housing and Urban Regeneration in South Africa. Research Report 9 National Department of Human Settlements (NDHS), 2009. The National Housing Code: Part 3: Social
Housing Policy, 10 Social Housing Regulatory Authority (SHRA), 2018. Annual Report 2017/2018. Available at
http://www.shra.org.za/images/2018/reports/SHRA%20IAR%202017_18.pdf 11 Ibid

Page 9 of 108
Spatial: Social housing will be located in specific, defined localities called restructuring zones. Restructuring
zones have been identified as areas of economic opportunity where the poor have limited access to
accommodation and where the provision of social housing can contribute to redressing the situation.12
Economic: Social housing will contribute to job creation through construction activities as well as management
and maintenance of rental stock. The programme will further contribute to economic revitalisation and urban
regeneration in important areas that are lagging or underperforming and this too will contribute to job
creation.13
Social: Social housing will aim for a mix of race and income levels in the tenant profile, as well as promote
diversity at the neighbourhood level.14 The programme further aims to provide a safe environment for
tenants and contribute to stabilising crime-ridden environments.
Secondly, the programme aims to improve the functioning of the housing sector by contributing to the range of
housing options available to the poor.15 This policy objective recognises that the formal rental sector in South
Africa is underdeveloped and that well-functioning housing sectors have a good balance between ownership
and rental housing models.
7.3. Stakeholders in the Social Housing Sector
The key stakeholders in the social housing sector include policy makers, sector regulators, delivery agents,
financiers and support organisations. The table below lists the stakeholders in the social housing sector as well
as their roles and responsibilities.
Table 1: Summary of roles and responsibilities of sector stakeholders16
Stakeholder Roles and Responsibilities
National Government
Create and uphold an enabling environment for social housing by providing the
legislative, regulatory, financial and policy framework for the delivery of social
housing.
Address issues that affect the growth, development or sustainability of the sector.
Institute and fund the social housing programme.
Allocate funds from the Department’s budget for the operational costs and
commitments of the Social Housing Regulatory Authority (SHRA).
Determine norms and standards to be adhered to by provinces and municipalities.
Monitor the SHRA.
Provincial Government
Ensure fairness, equity and compliance with national and provincial social
housing norms and standards.
Ensure protection of consumers by creating awareness of consumers’ rights and
obligations.
Facilitate sustainability and growth of the social housing sector
Identify and submit restructuring zones to the Minister.
Mediate in cases of conflict between and SHI and municipality, if required.
Monitor social housing projects to ascertain compliance with prescribed norms
and standards.
Endorse social housing projects
12Social Housing Regulatory Authority (SHRA), 2018. Annual Report 2017/2018. Available at
http://www.shra.org.za/images/2018/reports/SHRA%20IAR%202017_18.pdf 13 Ibid 14 Ibid 15 National Department of Human Settlements (NDHS), 2009. The National Housing Code: Part 3: Social
Housing Policy 16 Ibid

Page 10 of 108
Stakeholder Roles and Responsibilities
Provincial Steering Committees
(PSC’s)17
Develop a strategy and implementation plan for enhancing the delivery of the
social housing sector.
Align the efforts within the province by ensuring co-operative planning and
budgeting, prioritisation and monitoring of initiatives.
Facilitate the sourcing and acquisition of funding to support delivery within the
sector.
Identify and support capacity building programmes and efforts within the sector.
Facilitate the removal of blockages to social housing implementation.
Municipalities
Encourage the development of new social housing stock and the upgrading of
existing stock or the conversion of existing non-residential stock.
Provide access to municipal rental stock, land and buildings for social housing
development in designated restructuring zones and to municipal
infrastructure and services for approved projects.
Initiate and motivate the identification of restructuring zones.
For municipalities with assigned powers, approve, allocate and administer capital
grants to approved projects.
Social Housing Regulatory Authority
(SHRA)
Register and accredit SHIs.
Recommends restricting zones.
Set rules and regulation for, compliance and accreditation and to act on non-
compliance.
Regulate the investment of public funds in social housing projects.
Report on compliance, both in respect of delivery agents and the sector.
National Association of Social
Housing Organisations (NASHO)
Representation and coordination on behalf of its’ members (SHIs & ODAs).
Campaign and lobby on behalf of its members.
Promote the social housing sector.
Support individual SHIs & ODAs
Promote capacity-building within the sector from the demand side partnership
with other sector players.
Promote joint procurement by SHIs where this is efficient.
Promote exchange of good practice among its members.
National Rental Housing Task Team
(NRHTT)
Facilitate, co-ordinate, guide and manage the interface amongst all rental housing
programmes to achieve greater alignment and coherency in policy,
programmes, projects and research with the wider human settlement
policies, development and performance objectives of government.
Financiers (Gauteng Partnership
Fund, NHFC, Development Bank of
South Africa, Commercial lenders)
Finance the development of social housing projects.
7.4. Restructuring Zones
Restructuring zones are defined geographic zones that are identified by local authorities and supported for
provincial government for targeted, focused investment. They are intended to fulfil the restructuring objectives
of the social housing policy by providing opportunities for low to middle income people to access amenities
and income-generating opportunities.
17 Social Housing Regulatory Authority (SHRA), 2018. State of the sector report. Available at
http://www.shra.org.za/images/2018/reports/SHRA_State%20Sector%20Report_Final_OL.pdf

Page 11 of 108
The identification of restructuring zones was a phased process that was preceded by the identification of
Provincial Restructuring Zone Municipalities. At present, this includes 149 municipalities (see list below) that
are located in all the metros, major cities and secondary cities in provinces that do not have big cities.
Table 2: Restructuring Zones
Province Municipality Number of restructuring zones
Gauteng
City of Tshwane 35
City of Johannesburg 16
Ekurhuleni Metropolitan Municipality 18
Randfontein Local Municipality 7
Mogale City Municipality 7
Merafong Local Municipality 4
Westonaria Local Municipality 5
KwaZulu-Natal
eThekwini Metropolitan Municipality 12
Msunduzi Local Municipality 10
Emnambithi Local Municipality 3
Newcastle Local Municipality 3
Kwa-Dukuza Local Municipality 3
Mhlathuze Local Municipality 2
Hibiscus Coast Local Municipality 3
Eastern Cape
Nelson Mandela Bay Metropolitan
Municipality
19
Buffalo City Metropolitan Municipality 5
Camdeboo Local Municipality 1
King Sabata Dalindyebo Local
Municipality
1
Kouga Local Municipality 1
Western Cape
City of Cape Town 10
Oudtshoorn Local Municipality 2
Mossel Bay Local Municipality 2
George Municipality 1
Knysna Local Municipality 3
Bitou Local Municipality 4
Drakenstein Local Municipality 3
Overstrand Local Municipality 3
Stellenbosch Local Municipality 2
Saldanha Bay Local Municipality 3
Breede Valley Local Municipality 2
Swartland Local Municipality 4
Free State Mangaung Metropolitan Municipality 2
North West
Rustenburg Local Municipality 3
Tlkowe Local Municipality 2
Matlosana Local Municipality 1
Limpopo Polokwane Local Municipality 4
Mpumalanga Govan Mbeki Local Municipality 4

Page 12 of 108
eMalahleni Local Municipality 7
Steve Tshwete Local Municipality 3
Mbombela Local Municipality 6
Umjindi Local Municipality 1
Nkomazi Local Municipality 1
Thaba Chweu Local Municipality 2
Msukaligwa Local Municipality 1
Lekwa Local Municipality 2
Victor Khanye Local Municipality 1
Northern Cape Sol Plaatje Municipality 3
Source: NASHO, 2016; SHRA, 2017
According to restructuring zone guidelines, “nodes and corridors are likely to be suitable as restructuring zones
because of proximity to both job opportunities and consumption opportunities.”18 Given that the criteria for
identifying restructuring zones is very broad, restructuring zones are often large and dispersed, comprising of a
number of significantly different types of areas. The figure that follows is a typology that provides a description
of the four areas that are included in restructuring zones.
Figure 1: Typology of restructuring zones
Source: NASHO, 2016
In addition, restructuring zones include townships, which are defined as former black areas located on the
outskirts of the former white cities.19 Whilst the majority of townships are poorly located and under-resourced,
there are a few townships that have gradually become similar to urban areas. Soweto is such an example.
18 Godehart, S, 2007. Scan of Restructuring Zones, Draft Report 19 Godehart, S, 2007. Scan of Restructuring Zones, Draft Report
Inner city locations including‘decentralised urban centres, where the intent is to drive urban regeneration using
social housing. This primarilyinvolves renovating existing buildings.
CBD: Urban Regeneration
Inner suburban residential areas with access to transport and other socio-economic resources where the intent is to strengthen
the economic residential mix and the tenure choice. This primarily involves greenfield development.
Suburban Inner: Integration
Outer suburban residential areas with less developed internal public transport but significant linkage to key public transport routes. The intention is to strengthen the economic
residential mix and tenure choice and involves primarily greenfield development.
Suburban Outer: Integration
Old apartheid areas left vacant or with marginal industrial development. The effective use of these areas is reliant on the
public transport infrastructure and investment in
infrastructure development. This primarily involves greenfield development.
Grey Areas: Linkage

Page 13 of 108
However, the social housing policy framework would exclude these areas as the provision of social housing
would not change the racial or economic mix of these areas.20
7.5. Social Housing Target Market
The primary target market for social housing is “persons across the range of income bands that can be
construed as low income”.21 Low-income persons are broadly defined as those whose household income is
between R1 500 and R7 500 per month. Within this income band, there is a primary target market of households
earning between R1 500 and R3 500 a month, and a secondary target market of households earning between
R3 501 and R7 500. Accredited social housing projects should not allocate more than 70% to either market.
Additionally, within this broad affordability band, SHIs can target a diverse tenant population including
households from different income categories, racial groups and family structures.
In 2017, the Department of Human Settlements revised the income bands for social housing. This constitutes
an increase in the upper limit of the primary market from R3 500 to R5 500 and upper end of the secondary
target market from R7 500 to R15 000. Accordingly, the Social Housing Programme caters for households
earning between R1 500 – R15 000 per month. However, these income bands are often misunderstood by the
market.
In addition to low- to medium- income households, the National Housing Code states that the target market for
social housing includes the following groups:
People opting for flexibility and mobility that rental housing allows, such as people investing in housing in rural
areas and contract workers;
Single individuals who have been excluded from housing subsidy assistance to date;
People using social housing as a first phase in a process towards individual ownership or better rental
accommodation;
People who require short-term accommodation such as vendors who work in urban areas and cannot afford to
return nightly to their permanent residence in townships on the outskirts of the city;
Single individuals with dependents;
Individuals with special needs who are able to live independently; and,
Individuals currently living in informal settlements because it is the only affordable rental option available to
them.
This target market, whilst not completely exhaustive, indicates that social housing requires a wide range of unit
types.
7.6. Social Housing Institutions
The Social Housing Act requires approved social housing projects to be delivered through accredited SHIs that
are regulated by the SHRA. There are seven types of SHIs22:
A company financed by share capital (including state-owned companies);
A company limited by guarantee or a not for profit company;
A housing cooperative;
A share block company;
A communal property association;
20 Ibid 21 Ibid 22 Ibid

Page 14 of 108
A voluntary association which in terms of its constitution is a juristic person distinct from its members; and,
A trust.
The most common form of legal entities that have applied for accreditation are companies, state-owned
companies and cooperatives.
SHIs undertake property management (maintenance, rent management and vacancy management) and tenant
management (tenanting, tenant liaison and tenant empowerment) duties, which is intended to result in well-
managed social housing. The long-term sustainability and functioning of the social housing sector rests on the
financial sustainability of SHIs and the ability of SHIs to grow their portfolio.
The SHIs of relevance to this study are: SOHCO Property Investments, Johannesburg Social Housing Company
(JOSHCO), Yeast City Housing, First Metro Housing and Madulammoho Housing Association
7.7. Financing for Social Housing Institutions
Historically, the delivery of social housing was subsidised directly through two instruments:
The institutional subsidy (IS) is a conditional grant, financed by the National Department of Human Settlements
that is allocated on a project-by-project basis by provincial governments for approved social housing
projects. The institutional subsidy caters for the development of affordable rental projects that do not fall
within the identified restructuring zones.
The restructuring capital grant (RCG) flows from the National Department of Human Settlements to the SHRA
to allow for social housing to be developed in restructuring zones and promote mixed-income rental housing
developments. Additionally, the RCG aims to ensure the delivery of viable projects and subsequently
promote the development of viable SHIs.
Given that the ten case studies selected for this study are located in restructuring zones, the discussion that
follows is based primarily on the RCG.
The RCG is intended to fund a proportion of the capital costs of the social housing project, while the remaining
portion be funded by debt or other sources of funding. The amount of the grant is intended to equal the amount
required to allow rental income to cover the ongoing operating costs of the project, pay for debt service and
build some reserves in the SHI.23 The minimum RCG was R 125 615 per unit and contributed to approximately
40% of the financing of the project.24
To qualify for the RCG, a social housing project must have at least 30% of the units allocated to individuals in
the primary target market, who would pay subsidised rentals of between R500 and R1 166.25 Additionally, the
RCG increases proportionately to the number of tenants in the primary target market to a maximum of 70%.
Overall, the RCG is intended to deliver a return that covers financing costs, operating costs, provision for long-
term maintenance as well as additional margin for future reinvestment.
Following the DPME evaluation of social housing, the Restructuring Capital Grant quantum and income bands
were adjusted and a single social housing funding stream was introduced. As of October 2017, the social
housing programme is funded through a consolidated capital grant (CCG), which is transferred to the Social
Housing Regulatory Authority (SHRA). The CCG includes the institutional subsidy component to streamline the
23 Godehart, S, 2007. Scan of Restructuring Zones, Draft Report 24 Ibid 25 Ibid

Page 15 of 108
funding of social housing developments. R2,3 billion is allocated for social housing over the MTEF period, which
is expected to fund the delivery of 62 489 social housing units.26
7.8. Viable Social Housing Institutions
One of the aims of the social housing programme and the subsequent financing mechanisms is to promote the
development of viable and financially sustainable SHIs. A viable SHI receives a return that covers financing and
operating costs, provides for long-term maintenance as well as an additional margin for future reinvestment in
other social housing projects. This requires SHIs to effect sustainable annual rental increases, consistently
collect rentals and/or grow their portfolio of social housing projects.
8. Purpose of the study
Social housing represents a complex system of interrelated and reinforcing economic, social, political,
technological, and environmental sub-systems. Through this complexity there is potential for a variety of
challenges to arise, which need to be overcome to ensure an efficient, well-functioning social housing sector.
The Social Housing Programme (SHP) is one approach SHRA has undertaken to intervene in this system and
facilitate a better functioning housing sector. Not only does this approach tackle the functioning of the system,
but it also looks to drive spatial, economic and social integration through the delivery of affordable rental housing
for low- to middle- income groups. SHRA is interested in understanding the change they have catalysed through
the SHP.
The primary purpose of this study is to establish how the SHP has led to social, economic and spatial
restructuring. Unpacking how the SHP has contributed to these broad national objectives, the study investigates
how social housing is:
i) Changing the lives of the tenants that reside in the housing units;
ii) Impacting on the communities around the social housing projects, including the extent to which
social housing has improved community integration; and,
iii) How these changes lead to broader sector impact.
In achieving this purpose, the study examines the contribution of the SHP to observed changes to tenants,
communities and the sector, as well as any other unintended consequences.
A secondary purpose of this assignment is to use this study as an input into other measurement activities the
SHRA is undertaking, including its work with Equal Spaces. Specifically, the data collection activities of this
study and the data collected provide a starting point for the longitudinal measurement of impact.
9. Approach and methods
The approach for this assignment was confirmed during the inception meeting and subsequent follow-up theory
of change workshop. This section describes the agreed approach and methods.
Genesis uses a theory-based approach to conduct the study. As there were already two existing theories of
change (ToC) for SHP prior to this assignment, the study expands on these, specifically examining the outcome
26 Godehart, S, 2007. Scan of Restructuring Zones, Draft Report

Page 16 of 108
and impact portions and testing their achievement. The following diagram illustrates this approach, which is
described in more detail in the sections that follow.
Figure 2: Approach
The approach uses Contribution Analysis to determine how the social housing programme has contributed to
outcomes on tenants and neighbourhoods. The approach involves selecting the case studies for analysis,
collecting data related to these case studies and using this data to understand and document the contribution
story.
9.1. Research Framework
The study is based on a research framework that guided the development of data collection instruments and
subsequent stakeholder consultations. Key research questions unpack and interrogate the aspects of tenant
and community impact. Based on the research questions, Genesis developed research instrument guides to
support the qualitative and quantitative data collection activities.
9.2. Contribution Analysis
Given the lack of a control group and the complexity around social housing we use Contribution Analysis in this
study. A key question in the assessment of this programme is that of attribution. While experimental or quasi-
experimental evaluation designs can answer these attribution questions, they are often not feasible or practical.
We use Contribution Analysis to examine the contribution being made by the SHP to the observed
results. Other influencing factors are assessed and either shown not to have made a significant contribution,
or their relative role in contributing to the desired result has been recognised.27
We use the six iterative steps28 in Contribution Analysis, each step adding to the credible narrative:
1. Setting out the attribution problem to be addressed
27 Mayne, J. (2008) Contribution analysis: An approach to exploring cause and effect, ILAC Brief 16 28 www.betterevaluation.org/plan/approach/contribution_analysis
Primary sources of data
Secondary sources of data
Review/Develop theory of change
Establish research
framework
Select projects for
case studies
KIIs with project
stakeholders
and SHRA
FGDs with tenants and communities
Tenant survey
National and provincial statistics
Existing data from SHRA
Develop case
studies
Use all data to interrogate ToCand assemble contribution story and
answer key questions of
the study

Page 17 of 108
2. Developing a theory of change and identifying risks to it
3. Gathering the existing evidence on the theory of change
4. Assembling and assessing the contribution story, and challenges to it
5. Seeking out additional evidence
6. Revising and strengthening the contribution story
These six steps are used in this study to establish the contribution social housing has made to the observed
changes for the tenants and surrounding communities.
9.3. Data collection
This study uses a range of data from both primary and secondary sources. This section describes the data that
was used to inform this study and the team’s experiences in collecting this data.
9.3.1. Secondary Data
Literature and Document Review
In undertaking this component of the assignment, Genesis received and reviewed a number of documents from
the SHRA. Additionally, we consulted supplementary resources to ground our understanding of social housing
and inform the development of the outcomes list and subsequent data collection tools. The review of documents
and additional literature forms the basis of the background and literature review sections in this report. The
documents are listed in Appendix 3.
National and Provincial Statistics
Where possible we use and analyse national and provincial statistics on crime, property prices, investment, and
employment, which bolster the analysis of the cases and assist with the Contribution Analysis. This also allows
us to establish the various contexts in which SHP has been implemented. We have consulted data from the
National Income Dynamics Survey (2017), the 2011 Census, the Victims of Crime Survey 2017, property reports
for each case sight sourced from Lightstone™, and the General Household Survey 2018. However, with the
exception of the Census 2011, there is a significant limitation with the secondary survey data sources in that
the geographic level of disaggregation is only to the metro level, meaning that the data over aggregate results
across varied neighbourhoods. The 2011 Census data can be disaggregated to ward level, and this data forms
our key secondary source of information of the areas surrounding the social housing projects.
9.3.2. Primary Data
Given the wide diversity and large number of social housing projects across the country, the study uses a
diverse grouping of 10 case study projects to achieve its purpose. The primary data collection was focused on
these 10 projects.
Quantitative Data Collection
The tenant survey forms one of the primary data collection components of this research assignment. The
questionnaire was developed based on the outcomes identified in the expanded ToC, while the questions and
their wording were informed by our experience in conducting surveys as well as a review of other research
pieces that have used surveys to establish the outcomes of social housing. The draft version of this
questionnaire was shared with the steering committee to provide input and comment before approval. The
survey was then pre-tested to establish if tenants correctly understood the questions by holding qualitative
interviews with a small sample of tenants at a social housing site not included in this study.

Page 18 of 108
Figure 3: Number of households surveyed per housing project
n=1636
The response rate to the survey allows for generalisable statements to be made as the sampling was random
and the sample size was representative at the project level; however, it must be noted that the full sample
cannot be generalised to all social housing projects. The tenant survey was answered by 1 636 leaseholders,
across the ten SHPs in three provinces – Gauteng, KwaZulu-Natal and the Western Cape. The figure below
depicts the provincial breakdown of survey respondents.
520
629
400
709
312
709
500
109
733
157
207 214 188 231 157 189 194 70 80 106
Avoca Hills Belhar BGAlexander
City Deep LakehavenPhase I
Roodepoort Scottsdene Tau Village ThembelihleVillage
Valley View
No. units No. units sampled

Page 19 of 108
Figure 4: Provincial Breakdown of Survey Respondents
There are more female leaseholders than male leaseholders. Of those who responded to the survey, 43%
identify as male and 57% identify as female. This indicates a high presence of female-headed households in
these social housing projects.
Figure 5: Gender of leaseholders (according to survey responses)
The following table illustrates the gender breakdown of leaseholders for the population according data provided
by the SHIs:
Table 3: Gender of leaseholders as per data provided by SHIs
Project Male Female Total Percentage female
Avoca Hills 164 248 412 60%
BG Alexander 154 230 384 60%
Belhar 243 370 613 60%
Lakehaven 114 195 309 63%
Scottsdene 221 268 489 55%
Thembelihle Village 205 531 736 72%
Male 43% Female 57%
Avoca Hills
Lake Haven Phase 1
Valley View
Belhar
Scottsdene
BG Alexander
City Deep
Roodepoort
Tau Village Thembelihle
408
470
758

Page 20 of 108
Project Male Female Total Percentage female
Valley View 52 104 156 67%
Total 1153 1946 3099 63%
The discrepancy between the sample and the survey being six percentage points results from no gender data
being provided by three of projects.
The age of the leaseholders ranged from 18 to 83 years old, with the average age of leaseholders being 39
years old. This age range indicates that there were no child-headed households in the sample. The presence
of lease holders above the age of 60 indicates that there are some pensioners living in social housing too.
Figure 6: Distribution and average age of the leaseholders (according to survey responses)
All races, with the exception of ‘Asian’29 are represented in these social housing projects, the largest population
group being African. Compared to the national racial demographic statistics, where 80,8% of the population are
African, 8,8% are Coloured, 2,5% are Indian or Asian, and 8% are White,30 the demographic spread of people
benefitting from these social housing projects is not nationally representative – there is a higher percentage of
both Coloured and Indian people benefiting from the selected case social housing projects, and very few White
people. This is to be expected given the social challenges and unequal income levels in South Africa.
Additionally, the proportion of Coloured and Indian leaseholders included in this study is likely an
overrepresentation of the country proportion of Coloured and Indian leaseholders in all social housing projects.
This is because the study purposively sampled projects and included projects in Cape Town and Durban, which
respectively have a higher Coloured and Indian population as compared to the national statistics.
29 We separated Indian and Asian. The standard South African classification merges Indian and Asian 30 StatsSA, Mid-year population estimates. 2017. Available:
https://www.statssa.gov.za/publications/P0302/P03022017.pdf
0.3%
4.9%
16.3%
23.3%
21.2%
13.0%
8.9%
4.2% 4.3%
2.0%0.6% 0.7% 0.2%
0%
5%
10%
15%
20%
25%
18 - 20 21 - 25 26 - 30 31 - 35 36 - 40 41 - 45 46 - 50 51 - 55 56 - 60 61 - 65 66 - 70 71 - 75 75+
Average age39

Page 21 of 108
Figure 7: Race of the leaseholders
The data in the tenant survey indicates that those who moved into social housing went from living with an
average of five people in a household to living with approximately three people on average. It was reported that
tenants who move into social housing often do so to gain a sense of independence – many tenants move out
of family homes or homes that are shared with other households, into their own space.
Figure 8: Household size
Survey challenges
After refinement and in collaboration with iKapadata, the tenant survey (included in Appendix 2) was
successfully implemented in the selected housing projects with the exception of Thembelihle, where data
collection was halted due to security risks. Figure 3 above depicts the number of households interviewed per
housing project. With the exception of Thembelihle, this is a representative sample of the total number of
occupants at each housing project.
9.3.3. Qualitative Data Collection
Focus Group Discussions
Allowed tenants to express their perspectives regarding their experiences of living in social housing. The
discussions with tenants also allowed for the assessment of the appropriateness of the housing, the extent of
the benefits and any unintended consequences. Additionally, the FGDs were tailored to each of the individual
housing projects based on the emerging findings of the preliminary quantitative data analysis. This enabled to
the team to get more detail on interesting project-specific findings from the quantitative data analysis.
Two FGDs were conducted at each housing project, split by gender to facilitate openness and honesty and
further determine if the experiences of men and women in social housing differ. Genesis used Participatory
Action Research (PAR) principles; where engagement is a “bottom up” process of building knowledge with
71%
24%
4%
0%
1%
African
Coloured
Indian
Asian
White
Previous residence Current residence
± 5 people ± 3 people
**This result is statistically significant

Page 22 of 108
participants and working from the perspective that tenants know best about their own context, strengths,
challenges and opportunities. Details of the FGDs conducted are outlined in Appendix 3
Lessons learnt from FGDs
The team conducted FGDs with tenants at all of the case studies with the exception of Thembelihle and Avoca
Hills. Thembelihle was excluded from the qualitative data collection due to safety concerns.
Attendance at the FGDs was poor across most of the housing projects, except for Belhar, Scottsdene and City
Deep. Although the team accounted for the tenants’ busy weekly schedules by scheduling the discussions on
Saturdays, and further offered tea and cake as an incentive to participate in the discussions, most tenants had
errands to run on the day and did not attend. The research team had asked the housing managers to put up
notices prior to our visits, but most of them had failed to follow our request, which added to the poor attendance
problem.
In Roodepoort, the research team experienced trouble accessing the venue in which the discussions were to
be held. The contact person was not aware of the scheduled visit, and thus could not provide the research team
with the relevant information, as the housing manager was on leave during the time of the visit and their phone
was off. As a result, the research team conducted short interviews with anyone that was able to be contacted
at the social housing project.
At Tau Village, only five people showed up to the focus group discussion. Similarly, at BG Alexander, the
research team conducted a KII with one tenant before four more tenants showed up, after which the group
discussion was facilitated.
Key informant Interviews
Key Informant Interviews (KIIs) were face-to-face or telephonic one-hour interviews with SHIs and SHRA
representatives, community leaders and community members from surrounding neighbourhoods. The guides
for these interviews were based on the research questions listed in the research framework and were presented
to the steering committee before being used in the field. The purpose of these interviews was to gain insight
into the programme’s implementation (from the SHI and SHRA perspective) and assess the impact social
housing has had on the community (from the community leaders and member’s perspective).
KII challenges
Whilst the majority of stakeholders were cooperative, all of the municipal stakeholders were unresponsive and
as a result, the research team was unable to get the view of municipalities.
10. Literature review
10.1. Introduction
The purpose of reviewing relevant literature is to provide an understanding of social housing and its rationale,
as well as to review existing evidence of impact in other contexts. This review assists in establishing the South
African social housing programme’s contribution to impact by providing a theoretical backing and evidence for
and against the links in the theory of change. This review is divided into four sections:
• Section 1 defines social housing first by looking at various definitions of social housing from different
countries and regions and then examines their similarities and differences.

Page 23 of 108
• Section 2 addresses the rationale behind providing social housing and aims to answer the question
about why social housing is provided and unpacks how social housing should lead to improved
outcomes in theory.
• Section 3 examines how social housing is operationalised in different countries and considers the
different social housing models and eligibility criteria.
• Section 4 reviews published evaluations and studies done to explore the empirical evidence of the
results flowing from social housing interventions in different countries.
The last section was used to inform this study’s analysis framework allowing the team to use expected outcomes
that are grounded in the literature.
10.1.1. Defining Social Housing
Social housing is present in many countries across the globe; however, the term ‘social housing' is reported to
be a term with no agreed-upon meaning.31 Caruso claims that the confusion around the term stems from the
“wide diversity of national housing systems, concepts and policies”.32 This creates a layer of complexity when
comparing social housing interventions across different countries. Given that social housing exists within a
variety of countries and is a widely researched topic, we decided to examine the various definitions put forward
in the literature and discuss their similarities and differences to provide context for the rest of the review.
Overarching definitions
Box 2: Broad, regional and country-specific definitions
OECD:
“The stock of residential rental accommodation provided at sub-market prices and allocated according to
specific rules rather than according to market mechanisms”.33
EU:
“Conceptually the central distinction is that market housing is allocated according to effective demand, while
social housing is allocated according to need, and usually has sub-market rents (Haffner et al 2009). Most
social housing statistics are, however, based on ownership of the dwelling rather than allocation
mechanisms.”34
Europe:
“The essential defining characteristic, as with market housing, is how the accommodation is allocated. Social
housing is not allocated by demand and by price but is rather allocated according to some politically or
administratively defined and interpreted form of need. It is explicitly not allocated by market forces. It exists
because governments have decided that some housing, at least, should not be allocated by market forces.
[…]”35
31 Hansson, A. G. and Lundgren, B. 2018. Defining Social Housing: A Discussion on the Suitable Criteria. Housing, Theory and Society, DOI: 10.1080/14036096.2018.1459826 32 Caruso, N. 2013. New Practices of Social housing from definition to recent development. Planum, The journal
of urbanism. 33 OECD. 2017. PH4.2 Social Housing Rental Stock. OCED Affordable housing database. 34 Scanlon, K, Fernández A, Whitehead, M, Christine, M. E. 2015. Social housing in Europe. European Policy Analysis .17. pp. 1-12. 35 Oxley, M., M. Haffner, M. Elsinga, and H.Van der Heijden. 2010. Competition and Social Rented Housing.
Housing, Theory and Society Vol. 27. No. 4

Page 24 of 108
East Asia and the Pacific
“Social housing, targeted at specific beneficiary groups, is a collective term for the most common rental
housing arrangements in EAP [East Asia and the Pacific]. Social housing may include rental housing
administered by public agencies or non-profits and offer units for low-income groups or public sector
workers.”36
Australia
“Social housing is short and long-term rental housing that is owned and run by the government or not-for-
profit agencies. Social housing is made up of two types of housing, public housing and community housing.
It is for people on low incomes who need housing, especially those who have recently experienced
homelessness, family violence or have other special needs.”37
Kenya
“…a distinction of two categories of interventions as far as housing is concerned, namely: “affordable housing”
and “social housing”. Both concepts are not defined. We note though that ‘social housing’, like all social
policy, is concerned not only with economic issues but also social issues around housing. It is benevolent,
redistributive and concerned with broader non-economic social welfare issues including livelihood. It mainly
applies to subsidised low-income rental housing for segments of society that cannot afford housing at market
rates.” 38
South Africa
“A rental or co-operative housing option for low income persons at a level of scale and built form which
requires institutionalised management and which is provided by accredited social housing institutions or in
accredited social housing projects in designated restructuring zones.” 39
10.1.2. Variations interpretations
While social housing is a complex topic, at its core the definitions highlight the concept as a response to housing
needs. Examining the definitions above three main common themes were found:
1. Social housing is not allocated through mechanisms of market forces;
2. All social Housing is subsidised through some mechanism;
3. It must address the needs of low-income individuals and households; and
These themes are further explored in the discussion of the similarities and differences below.
36 The World Bank. 2014. Access to Affordable and Low-Income Housing in East Asia and the Pacific.
Sustainable Development Department East Asia and Pacific Region. 37 Housing Vic. (n.d). Social Housing. Available: https://housing.vic.gov.au/social-housing 38 Economic and Social Rights Centre. 2018. State of housing in Kenya: Will Government Strategy Deliver on
Social Housing. Available: https://s-eu-west-1.amazonaws.com/s3.sourceafrica.net/documents/118447/State-
of-Housing-Book-2.pdf 39 Department of Human Settlements. Social & Rental Interventions: Social Housing Policy. The Nation Housing
Code. Volume 6 Available:
http://www.dhs.gov.za/sites/default/files/documents/national_housing_2009/6_Social_Rental_Interventions/3
%20Vol%206%20Social%20Housing%20Policy.pdf
Page 25 of 108
Similarities
The definitions in Box 2 illustrate that across countries and regions there is some commonality in the way in
which social housing is understood. The first defining feature is that social housing is not allocated by market
forces instead it is based on eligibility criteria that allows a person or household to qualify for social housing.
Social housing is generally for low-income households and individuals who cannot afford market determined
rental prices. Factoring in income, social housing charges a rent amount below what would ordinarily be
determined by the market. The shortfall, between what the market would charge and what low-income
households can afford is then often made up with the use of a government subsidy, thus allowing low-income
families access to a portion of a country's housing stock. Although not explicitly stated in the definition above,
all social housing is subsided through some mechanism. This is an important characteristic given that the
provision of social housing is to address a market failure, thereby bringing the rent charged in social housing in
line with tenants can afford.
The purpose of social housing is to provide more than just a house but a sense of community and well-being.
The Kenyan and South African definitions make explicit reference to this in stating that social housing caters to
non-economic social welfare issues and the promotion of a life-style conducive to community living. In these
definitions social housing becomes more than a shelter but a holistic housing intervention that focuses on
improving different facets of people's lives by integrating them into a larger eco-system.
Differences
While there are common threads throughout the above definitions there are two notable variations. The EU
definition quoted above includes the possibility of ownership- shifting the purpose of social housing from being
a temporary housing solution to be a permanent housing solution in some countries. This option allows for the
ownership of the property to transfer from the state to the occupying household, which has the potential to
provide financial stability through the acquisition of an asset.
In most of the definitions listed above social housing is specifically targeted at low-income households; however,
the Australian definition includes societies’ most vulnerable people such as the homeless, those who have
experienced family violence and those who have a disability and are therefore in need of government assistance
to fulfil their housing needs.
10.2. What is the rationale for social housing?
10.2.1. Why is housing important?
The right to adequate shelter is one of the most basic human rights. Adequate shelter refers to more than the
basic infrastructure and includes the availability of land and services, such as water and appropriate sewage
facilities. The availability of the above makes it possible for people to survive, eat, sleep, raise families and
enjoy relaxing in their homes.
A lack of adequate housing exposes people to a range of social ills which compromise their quality of life and
hinders their progress towards building sustainable livelihoods. 40 On a micro-economic level, adequate housing
has been shown to have a significant impact on health and educational outcomes, feelings of security, social
40 Impact of Habitat for Humanity Homeownership, Habitat for Humanity, 2015
Page 26 of 108
cohesion, family wellbeing, and productivity. 41.42 Housing also has the potential to be a tool for poverty
eradication and socio-economic mobility43 44
According to the United Nations (UN,) roughly half of the global population live in cities, with rapid urbanisation
expected to continue45; however, on the supply side cities cannot meet the rising housing needs of these
individuals. The high demand and limited supply leads to increases in the price of housing. This is particularly
an issue in desirable and well-connected areas, which results in low-income households being pushed to the
outskirts or non-desirable areas of a city. By living on the urban periphery low-income households move into
areas that do not have formal infrastructure in place, their access to basic services are limited, as is their
employment opportunities and they spend a large percentage of their income travelling to and from the
economic centre. These living conditions have a negative effect on households leading them to become
disenfranchised and trapping them within a cycle of poverty.
10.2.2. What are the problems that social housing aims to address?
The literature examined indicates that the main use of social housing has been to address a shortage of housing
and provide an alternative tenure option to ownership. Historically, the provision of social housing has done
more than address housing shortages instead it has been used to stimulate economies, promote investment
and address spatial and historical disadvantages.
Initially, social housing in Western Europe, had been important in terms of investment made into new buildings,
regeneration of urban areas and providing adequate affordable housing to a wide range of citizens. However,
throughout the 20th century, social housing was used as a response to events such as World War I and II. These
events had economic consequences that left individuals in desperate need of government's assistance to fulfil
their housing requirements. The wars had devasted the countries' housing stocks, there was a post-war baby
boom increasing the population that needed housing, and there was a mass migration from rural to urban
areas.46Those who came from the rural lands into the urban centres needed government assistance in securing
housing by either rental or ownership means that were subsidised by the government. In more recent times
social housing has been seen as a viable alternative to ownership especially for households that suffered the
most under the 2008 financial crises. In the post-financial crisis, market demand for social housing increased
as the risks associated with buying property were perceived to be too high. Many household incomes also have
not recovered to their pre-2008 state leaving many families in need of alternative housing options. In these
41 Thomson, H., Thoms, S., Sellstrom, E. and Petticrew, M. (2009) The Health Impacts of Housing
Improvements: A Systematic Review of Intervention Studies From 1887 to 2007. American Journal of Public
Health. 99(53). pp. S681 – S692 42 Wolitski, R., Kidder, D., Pals, S., Royal, S., Aidala, A., Stall, R., Holtgrave, D., Harre, D., and Courtenay-
Quirk, C. (2009) Randomized Trial of the Effects of Housing Assistance on the Health and Risk Behaviors of
Homeless and Unstably Housed People Living with HIV. AIDS Behav. 14. pp. 493 - 503 43 Leaver, C., Bargh, G., Dunn, J., and Hwang, Stephen. (2007). The Effects of Housing Status on Health-
Related Outcomesin People living with HIV: A Systematic Review of the Literature. AIDS Behav. 11. pp. S85
– S100 44 Measuring Success in Human Settlements Development: An Impact Evaluation Study of the Upgrading of
Informal Settlements Programme in selected projects in South Africa, The Department of Human Settlements
South Africa 45 United Nations: Sustainable Development Goals: Goal 11. Available:
ttps://www.un.org/sustainabledevelopment/cities/ 46 Peppercorn, I. & Tuffin, C. n.d. Social housing in the USA and France: Lessons from convergences and
divergences.

Page 27 of 108
cases, particularly in the US and the EU social housing or public housing is able to act as a transitionary housing
solution until a household can once again afford to buy a house.
In other contexts social housing is used to address spatial disadvantages, This, is often the case where there
has been rapid urbanisation and the demand for housing is not met by the supply.47 As a result, in countries like
those in South America, the East Pacific region and Africa, ‘shanty towns’, ‘informal settlements’ or ‘slums’ start
appearing on the urban periphery.48 49 These places become densely populated and often give rise to people
living in structures in other people’s backyards without access to basic services such as water and electricity.50
Social housing also presents a solution, for households who cannot afford market determined rental rates. It
brings low-income households closer to the economic centres and provides them with an affordable rental
housing option. By being closer to the economic centre they have better access to amenities such as schools,
and healthcare centres.
Low-income households often do not have sufficient savings required to make them eligible for a home loan
and therefore are in need of an alternative option that is not secured based on a savings rate. These households
form part of a of gap in the market, the gap is neither serviced by the government nor by the banking sector,
giving rise to a market failure. Social housing is used as an intervention to address this market failure. An added
benefit of social housing is beneficiaries having access to basic services and the government keeping track of
whom it is providing these services to. Government benefits as they are able to generate revenue for the
provision of these services.
In South Africa social housing is used to address both spatial segregation and historical disadvantages created
under the apartheid regime.51 Spatial segregation predates apartheid, the passing of the Land Act in 1913,
prevented Black Africans from owning or buying land, the only place they were free to do was on restricted
pieces of land known as reserves.52 This system was replicated under the apartheid regime in the form of
Bantustans. In 1950, the Groups Areas Act was passed, with the intention of racially segregating all aspects of
social and economic life.53 Neighbourhood segregation was institutionalised, the result of which was African,
Coloured, Indian and White communities. This type of urban planning entrenched inequality within the built
environment and marginalised the majority of the population.54
Social housing in South Africa is therefore used as a way to restructure the cities socially, economically, and
spatially.55 The purpose of social housing is to bring those who were disadvantaged and were forced to live in
communities on the outskirts of the cities into the cities giving them access to formal accommodation and basic
47 The World Bank. 2014. XI 48 Ruprah, I.J and Marcano, T.L. 2007. A meta-impact evaluation of social housing programs: The Chilean case.
Office of evaluation Oversight. August. 49 The World Bank. 2014. XI 50 Ruprah, I.J and Marcano, T.L. 2007. 51 Wicht, Astrid. 1999. Social Housing in South Africa. A feasible option for low-income households?, paper for
University of Lund. Available: http://www.hdm.lth.se/fileadmin/hdm/alumni/papers/ad1999/ad1999-14.pdf
(accessed 24.04.2007) 52 Modise, Leepo, & Mtshiselwa, Ndikho. (2013). The Natives Land Act of 1913 engineered the poverty of Black
South Africans: a historico-ecclesiastical perspective. Studia Historiae Ecclesiasticae, 39(2), 359-378. 53 Turok, I. 1994. Urban Planning in the Transition from Apartheid: Part 1: The Legacy of Social Control. The
Town Planning Review. Vol. 64. No. 3: 243-259
54 Ibid: 243 55 SHRA. Available: http://www.shra.org.za/investment/about

Page 28 of 108
services. Its objective was to provide security of tenure that did not rest on ownership.56. Its placement within a
city was of utmost importance – where BNG (Breaking New Ground) formerly known as RDP, housing has been
accused of reinforcing apartheid town planning, social housing specifically targets urban areas.57 The rationale
behind this programme is to provide an affordable housing alternative close to the economic centre of a city
where there is access to transport nodes, quality education, healthcare and job opportunities.58
56 Ibid. 57 OCED, 2017. 58 Ibid, 8

Page 29 of 108
10.3. How has social housing been operationalised?
10.3.1. How is social housing delivered?
While social housing is provided in a number of countries, the form and delivery of social housing differ.
Altogether 29 countries (out of the 36 OECD countries) were found to provide at least one form of social housing
albeit with different characteristics in terms of general housing issues, providers, target groups and financing
arrangements.59
The social housing stock is generally provided and owned by companies in municipal ownership or
municipalities and non-profit organisations usually known as housing associations. 60
Countries with a small percentage of social housing stock (less than 10% of the total housing stock) tend to
have their social housing administered by the state.61 In the United States for example, public housing is directly
provided by the state and local housing agencies, with subsidies from the federal government that are
designated for low-income households.62 Social housing in Canada is typically owned by the government, non-
profit groups or co-operatives. Both the United States and Canada have the same payment scheme for its social
housing tenants, where tenants are required to spend 30% of their income for rent and utilities, and any shortfall
on the rent is subsidised by the housing programme.63 In China, the state used to monopolise the financing,
production and allocation of housing until 1990 when the state withdrew from the direct provision of housing
and allowed for private developers to build residential projects. Similar to the US and Canada, rent charges for
tenants should not exceed a certain threshold of the total household income, except in China this is set at 5%
of the household income.64
By contrast, in countries with a large share of social housing stock, such as the Netherlands and Denmark, the
not-for-profit sector is found to be the more common provider for social housing. The Danish social housing
sector is governed by a relatively complex interaction between the state, the municipalities, the housing
associations and tenants. The state sets general frameworks for the sector, while the municipalities manage
the local housing policy and decide whether to approve new constructions or not. The housing associations run
the housing estates and can decide to build new estates if the municipalities approve. The tenants have a
democratic influence on the day-to-day running of the estates. Municipalities have the right to appoint tenants
for up to 25 percent of all the lettings, which they use to ensure a stronger income mix in the social housing
estates by moving low-income earners (with a job) to high-income neighbourhoods.65 This runs counter to the
original intent of the rule for being appointed which was to ensure room for deprived citizens in estates where
the vast majority of the population was expected to live.66 Now the rule is applied to ensure that only a limited
number of deprived citizens is housed in the same estate.
Furthermore, an important principle that shapes the Danish social housing sector is the balanced rent principle.
This is in effect a cost rent, in that it ties the rent of a specific dwelling to the original costs of building the specific
social housing estate and the cost of running the housing estate.67 Comparably, approximately 75% of the 3
59 OECD Affordable Housing Database. 2016. PH4.3 Key Characteristics of Social Rental Housing 60 Scalon, 2015. 61 OECD Affordable Housing Database 2017. PH4.2 Social Rental Housing Stock 62 OECD, 2016.
63 Home Guarantee Corporation. 2007. Public Housing Policies of Selected countries 64 Home Guarantee Corporation. 2007.
65 Nielsen, R.S. 2017. The Danish Social Housing Sector: Recent Changes and Future Challenges 66 Ibid 67 Home Guarantee Corporation. 2007

Page 30 of 108
million rental homes in the Netherlands belong to housing associations, which are obligated to rent out 80% of
their vacant social housing to people with an annual income of up to €38 798.68
In Chile, to be eligible for social housing, your household savings are taken into consideration. The programme
specifically targets vulnerable and emerging families with household heads who are between 18 and 30 years
old, with a total monthly income of between $360 and $1 125.69 Eligibility is not solely determined by income
but instead by a Social Vulnerability Score measured by a government-issued survey. The programme is open
to current tenants and other non-paying users and does not have any geographic restrictions but the programme
also requires establishing a savings account with at least $180.70 Quite similarly, most social housing in New
Zealand is in the form of government subsidised rent, where Income-Related Rent (or IRR) is provided by
Housing New Zealand, but since April 2014 it is also available from other registered social housing providers.71
To be eligible for social housing your finances as well as your cash assets are taken into account.
In South Africa, as in the Czech Republic, the government provides a partial subsidy for the development of
rental stock. The remainder of the capital costs and the cost of management of the stock is collected through
affordable rentals paid by the tenants. The stock is then owned and managed by Social Housing Institutions
that are regulated by the Social Housing Regulatory Authority.72
10.3.2. Who does social housing benefit?
All countries that provide social housing have criteria that determine who is eligible to live in social rental housing
and in most cases the time in which household has been registered on a waiting list is one of the driving factors
in determining who gets social housing.73 At the same time, in most countries, people who are considered to
have the greatest needs are served first. To achieve this goal in Austria and Denmark, where the allocation of
social housing is managed by municipalities, they retain a right to allocate part of the social housing stock to
households they select on the basis of a needs assessment.74 Finally, criteria can also vary according to the
local needs and gaps in local housing markets, and give priority for instance to certain type of key workers,
students and young people in areas with an ageing population.
In Germany, for example, poor or vulnerable families are allocated to social housing dwellings by non-profit
housing associations. These dwellings are predominantly located in the peripheral housing estates, thereby
increasing the spatial concentration of distressed households.75The Czech Republic takes into account the
social situation of the applicant (for example, Roma communities, people leaving institutional housing or prison),
and in addition to this, there are special arrangements in place for disabled and elderly people.76 In Denmark
the municipality can assign a homeless person or family a dwelling bypassing the waiting list; in some deprived
areas, people with jobs or students can bypass the waiting list with an aim to increase the social mix of the
community.77 In contrast, Japan has a limited number of social housing dwellings, which are assigned through
a lottery system and do not therefore give any specific groups priority over the others. Although, in the
68 Government of the Netherlands. 2018. Rented Housing: Social Housing 69 Ross, L.M & Pelletiere, D. 2014. Chile’s New Rental Housing Subsidy and its relevance to U.S. Housing
Choice Voucher Program 70 OCED, 2017.
71 Ministry of Social Development, New Zealand .2018. Housing and Support Services 72 The National Association of Social Housing Organisations (NASHO). 2017. 73 OECD, 2017
74 OECD, 2017
75 Galster & Musterd, 2003 76 OECD, 2017
77 Home Guarantee Corporation. 2007.

Page 31 of 108
Netherlands, while priority can be given due to medical reasons, there is a limited number of dwellings that are
assigned through a lottery system.78
Certain countries only provide social housing to a designated group. For instance, in Mexico public housing
used to only be afforded to those who served in the military through their Military Housing Fund of the Social
Security Institute for the Mexican Armed Forces (or ISSFAM) program.79 However, there has since been an
increase in the number of social housing interventions in Mexico to aid the increased demand for affordable
housing, such as INFONAVIT (Instituto del Fondo Nacional de la Vivienda para los Trabajadores, or Mexican
federal institute for worker’s housing).80 Hungary only provides social housing to those residents who are
already recipients of social benefits, while Ireland states homelessness as a priority-criteria for determining
whether an applicant gets social housing or not.81 Chile uses a Social Vulnerability Score to determine eligibility.
This score measures vulnerability based on three major indicators (1) access to economic resources (for
example income, labour skills, access to water and sanitation), (2) household needs (for example family
composition and household size) and (3) risks that households face (for example individual health conditions,
and job insecurity).82 Whereas in South Africa, social housing is targeted at the low- to middle- income market
(R1 500- R15 000 per month).83 These are the individuals that fall within a gap where they do not necessarily
qualify for BNG housing or a mortgage, and therefore, are in need of other tenure options to suit their housing
needs.
While the priority criteria of social housing for countries vary quite considerably, low-income households are a
common beneficiary criterion for the majority of the countries' social housing policies. Assets are usually not
included in means-testing (except in Finland, New Zealand and Korea)84 but in a majority of countries, eligibility
for social rental housing is conditional to not owning other housing properties. Finally, in some countries, income
ceilings can be set at relatively high levels to allow income mixing (such as France and Austria).85
10.4. How effective has social housing been?
To understand social housing’s potential, we examine literature that assessed the outcomes produced by
housing interventions. This was done to grasp an understanding of what outcomes to expect and by having this
knowledge we were then able to build an analysis framework where our assumptions were supported by the
literature. It is important to note that we are not restricting the literature to only social housing but looking at a
broad range of housing interventions that aimed to improve low-income household's well-being.
From a desktop review that looked at measuring the outcomes of social housing it was found that there were
seven outcomes that social housing could potentially contribute to, these are:
1. Social and Community
2. Health
3. Education
4. Housing
5. Safety
78 OECD, 2017.
79 Cabrera, L. 2014. Affordable Housing in the Urban Global South: Seeking Sustainable Solutions 80 OECD, 2017.
81 Home Guarantee Corporation. 2007.
82 OECD, 2017.
83 Social Housing Regulatory Authority (SHRA) 84 OECD, 2017.
85 OECD, 2017.

Page 32 of 108
6. Empowerment
These outcomes reinforce one another, for example, the Department of Family and Community in Australia
theorised that access to affordable housing, provides low-income households with housing stability, since
families and individuals are not moving as much there is reduced absenteeism among children from school,
and therefore, an increase in grades should be observed. This was confirmed in a paper that looked at US
students who experienced homelessness or hypermobility, these students were found to perform below their
low-income peers.86
Another element of reduced absenteeism is improved health, in a 2015 paper, Thomson and Thomas found
that there is a link between affordable housing and improved health.87 However, this rests on a variety of other
factors – for improved health to be observed the size of the house has to be appropriate for the residents and
it has to have proper thermal controls. Exposure to extreme temperatures are noted to have adverse effects on
residents’ health outcomes.88 Increased space in a household is noted to increase privacy and opportunities for
studying. These improvements along with improved healthcare due to better thermal controls are noted to
reduce absences from school and work, enhancing grades and productivity.
However, the impact of housing interventions is not restricted to those who reside in a single unit. Instead
neighbourhoods can play contributing factors to outcomes such as education and health. In a 2014 paper by
Marten et al, a different health outcome is noted, it is found that the neighbourhood in which a social housing
project is placed plays a contributing factor to health and education outcomes for children living in social
housing.89 Five indicators were assessed: immunisation levels of two-year old’s, school readiness, grade nine
and high school completion and adolescent pregnancy. Young children fare worse than all other children that
live in a similar socio-economic neighbourhood in terms of school readiness and immunisation levels, whereas
older children who live in wealthier areas have higher completion rates of grade nine and high school and lower
rates of teenage pregnancy.90 The former effect is noted to be caused by low-income households who do not
have enough money to cover their monthly expenditure shifting their income away from their children’s
education or healthcare resulting in negative outcomes.91 The latter effect is noted to be because older children
are influenced more by their peers than their home life which then results in this positive effect. Thus, the study
is able to demonstrate that for households to experience these positive outcomes there are factors beyond
receiving a house, such as location, that need to be taken into consideration when developing social housing. 92
It is noted that the spatial planning of social housing contributes to complex outcomes experienced by the
beneficiaries. In Chile, social housing is placed on the urban periphery and served to further enforce segregation
along income and class lines.93 It also places low-income households far from the economic centres resulting
in beneficiaries having to spend increased amounts of their household income on travelling expenses. A similar
result is found in the US, with affordable housing projects that are placed close to the city centre. It is found that
low-income households have to commute further to their jobs, because they cannot find jobs that required their
86 Enterprise Community Partners. 2014. Impact of affordable housing on families and communities: a review
of the evidence base 87 Thomson, and Thomas 2015: 213 88 Ibid 89 Martens, P.J Daniel G. Chateau, D. G., Burland E. M., Finlayson, G.S., Smith, M.J. ,Taylor, C.R. Brownell, M.D., Nickel, N.C., Katz, A., Bolton, J.M., MD, and the PATHS Equity Team. 2014. The Effect of Neighborhood Socioeconomic Status on Education and Health Outcomes for Children Living in Social Housing. American Journal of Public Health. Vol. 104, No, 11. 90 Martin et al, 2015. 91 Enterprise Community Partners. 2014. 92 Ibid. 93 Cavieres, F. J. 2004. Chilean Housing Policy: A case of social and spatial exclusion.

Page 33 of 108
skill set within the city centre. Therefore, even though they live close to the economic centre, transport still
places a strain on the household budget.94 It is not only the location of the social housing project that is important
but access to relevant job opportunities that match the skills set of those living in social housing.
Access to affordable housing is important for low-income households who spend a significant portion of their
household income on housing. Those who can access affordable housing are likely to live in safer housing
conditions and less likely to revert to informal housing options or shelters.95 Important to this feeling of safety is
the feeling of community, which was measured by the number of people who shared a common language.
Examining the context of social housing, language was found to be important for improving the welfare of the
individuals. Important to welfare improvement is the ability to communicate with those that surround you, such
as your neighbours. Communication allows residents to access to what Bertrand, Luttmer and Mullianathan
(2000) describe as the ‘network effect', in their paper they look at the use of home language as a factor that
facilitates relationship and network building.96 People tend to interact with one another when they are able to
speak the same language this provides people with a larger network of contacts on which to draw from, these
contacts can be leveraged for a range of positive outcomes such as navigating the social housing system or
finding out about near-by job opportunities.
Outcomes that are the results of housing interventions are widely documented throughout the literature and
provide us with some guidance as to what to expect from our results. However, the literature review also
highlights the importance of placing the results within a defined context. For not all outcomes are produced by
a direct causal relationship, instead they are the results of a complex system where outcomes come about from
being reinforced by one another.
11. Findings and analysis
This section presents a critical analysis of the causal chains in the ToC, ultimately commenting on whether the
social housing programme has contributed to the observed outcomes. The analysis is structured along four key
areas pulled from the ToC to build the narrative of contribution from activity to impact level. Starting at the base
of the ToC the study briefly reviews the implementation of the policy strategy and site selection for SHPs, then
moves up to assess the delivery of the social housing through the SHIs, after which it reviews the perceived
quality and relevance of the delivered housing, and finally examines the outcomes of this on beneficiaries,
neighbourhoods and the sector.
The study reviewed the DPME ToC and the ToC included in the SHRA’s M&E Plan. Building on these ToCs,
the team expounds on the tenant, community and city outcomes. To do this, the team reviewed literature on
ToCs for social housing and used previous ToCs Genesis Analytics has assisted in developing in the housing
space. This expansion on the ToCs is necessary for Contribution Analysis, which requires that the sequence of
outcomes is captured, and other contributing factors and risks to these outcomes are captured. On the following
page the revised ToC is presented which is critically analysed throughout this section. The original ToC from
the DPME report as well as the SHRA’s logic model97 are included in Appendix 4.
94 Enterprise Community Partners. 2014. 95 Ibid. 96 Bertrand, M., Luttmer, F.P, Mullainathan, S. 2000. Network and Welfare Cultures. The Quarterly Journal of Economics. Vol. 115, No. 3:1019 – 1055. 97 Only the outcomes and impact section are illustrated in this report as this is the part of the logic model that
this evaluation focuses on.

Page 34 of 108
Figure 9: Expanded theory of change with focus on tenant, community and city outcomes
Disposable incomes increases, life satisfaction improves, and tenants' lives improve Low to medium income
households integrate with the existing community
Property Management (includes maintenance, rent management
and facilities, vacancy management)
Tenant Management (Includes tenanting, tenant liaison, tenant exiting, tenant empowerment)
Spatially disadvantaged people apply for for social housing
Well managed social housing units
Tenant mix that meets policy objectives
Private sector invests in economic opportunities
(entrepreneurship programmes, business hubs, retail zones, new buildings)
Low- and medium-income households move into SHPs the local communities
Collection of rates and taxes
Social housing crowds in investors
Surrounding property is regenerated and becomes
economically viable
Social housing contributes towards spatial, economic and social restructuring through access to affordable well –located housing for low to medium income households
Social housing contributes the transformation of the housing sector
Social housing delivered at scale which leads to integrated communities and human settlements
Tenants’ children have better access to education
facilities
Tenants’ children attend educations facilities
Tenants have better access to healthcare
facilities
Tenants have better access to transport routes
Tenants cost of travelling is reduced
Tenants have a greater sense of security living in
social housing
Tenants have better healthcare outcomes
Reduction in time off school / work
Tenant’s children have improved educational
outcomes
Tenants have better access to economic
opportunities
Tenants become employed / start small
business
Household income improves
Tenants spend more money in surrounding
area
Tenants have increased disposable income
Tenants feel safe
Tenants take part in community initiatives and social activities
Property values of buildings increase around
social housing
Social housing units are situated near educational facilities (creches,
schools, universities)
Social housing units are situated near healthcare facilities (Public pharmacies, clinics, hospitals)
Social housing units are situated near public
transport routes
Tenants move into well located, secure, good quality social housing units
Local economy grows
Beneficiary outcomes Neighbourhood outcomesSector outcomes
Financially sustainable SHIs have the capacity to develop, hold and
manage social housing rental units
Sustainable social housing units for low to
medium income households as part of a
functioning housing sector
SHI’s are accredited with B-BBEE status
Tenants take part in neighbourhood
initiatives, social and recreational activities
Neighbourhoods are made up of a racially
and economically diverse population
SHIs are accredited and employees receive training
SHIs employ people for theconstruction and
management of buildings
Through SHIs previously
disadvantaged people own businesses in economic centres
There is diverse local business ownership
within the local economy
Social housing projects are well run by SHI’s
Social housing attracts private investors to local
communities
The results in this red dotted box are not in the control of the
SHI or SHRA, but are the intended outcomes of social housing on the beneficiaries

Page 35 of 108
1. David J. Zimmerman, (February, 2003), Peer Effects in Academic Outcomes: Evidence from a Natural Experiment, The Review of Economics and Statistics, Vol. 85, No. 1
2. Anne C. Case and Lawrence F. Katz, (May, 1991), The Company You Keep: The Effects of Family and Neighborhood on Disadvantaged Youth
3. OECD, (2017), PH4.2 SOCIAL RENTAL HOUSING STOCK, OECD: Social Policy Division: Directorate of Employment, Labour and Social Affairs
4. Adullam Homes, Theory of change for a residential housing project to reduce reoffending
5. Elizabeth Burton, (April, 2002) Housing for an Urban Renaissance: Implications for Social Equity, Housing Studies, Vol. 18, No. 4
6. Jürgen Friedrichs, George Galster and Sako Musterd, (November, 2003), Neighbourhood Effects on Social Opportunities: The European and American Research and Policy Context,
Housing Studies, Vol. 18, No. 6
7. Enterprise Community Partners, Inc., (2014), Impact of Affordable Housing on Families and Communities: a review of the evidence base, Enterprise Community Partners, Inc. Knowledge,
Impact and Strategy Department
8. Linda Datcher, (February, 1982), Effects of Community and Family Background on Achievement, The review of Economics and Statistics, Vol. 64, No. 1
9. Stephen Bennett, (June, 2015) Measuring the impact of community housing: a proposed theory of change for community housing, the Centre for Social Impact
10. Patricia J. Martens, et al., (November, 2014), The Effect of Neighborhood Socioeconomic Status on Education and Health Outcomes for Children Living in Social Housing, American Journal
of Public Health, Vol 104, No. 11
11. The Urban Institute, Candidate Outcome Indicators: Affordable Housing Program, The Center for What Works
12. Thomson, H., and Thomas, S. (2015) Developing empirically supported theories of change for housing investment and health, Social Science and Medicine, Vol. 124, ISSN 0277-9536
13. FACS Analysis and Research Department of Family & Community Services, (May 2016), Measuring social housing outcomes: desktop review of evidence, NSW Government’s Future
Directions for Social Housing in NSW
14. Genesis Analytics and TUHF, (2016), Theory of Change for the TUHF housing projects in inner cities

Page 36 of 108
11.1. Policy and strategy
There are two impact pathways for policy and strategy. They are depicted in the figure below
Figure 10: Policy and Strategy Impact Pathway
11.1.1. Spatial disadvantaged provided housing
While the policy objective of social housing is to address spatial and economic inequality, the selection of sites
for social housing does not perfectly fit this objective.
The study found that the size of the restructuring zones and the variety of areas
within the restructuring zones restricts the social housing programme’s objective
of spatially restructuring the South African society. A study conducted by NASHO
demonstrated that, overall, the largest number of social housing projects are
located in outer suburban areas and, increasingly, in ‘grey areas’, which are
areas that are not well located in terms of access to economic opportunities and
proximity to amenities, and their success has relied on additional investment in
infrastructure. An example of this is provided in Box 3 below. The location of the
projects is largely a consequence of the cost and availability of well-located land.
A provincial government stakeholder indicated that the programme is increasingly
reliant on land that is available through the private land market. Additionally, as well-located inner-city locations
gain pre-eminence with the private and public sectors, the demand for old buildings and inner-city land parcels
has driven up selling prices, making it increasingly difficult for SHIs to compete without a coordinated municipal-
driven land identification process. Another reason why social housing projects are located in outer suburban
and grey areas is that the high levels of demand for affordable housing in the country means that social housing
projects will have high occupancy rates, despite their location.
Box 3: Spatial Restructuring at Scottsdene Rental Estate
Scottsdene Rental Estate is located in the predominantly Coloured neighbourhood of Scottsdene, near
Kraaifontein, approximately 32,8km outside of the Cape Town City Centre. Some tenants reported that their
places of work are as far as Woodstock, in the city centre, and they spend a large proportion of their day
travelling by train to work. Additionally, the majority of tenants (51%) indicated that they moved into the project
from the surrounding areas of Kraaifontein, Northpine and Scottsdene. As a result, these tenants have not
experienced a change in access to transport and amenities or the schools their children attend and, as a
Tenant Management Tenant mix that meets policy
objectives
Tenants move into well located
secure good quality social housing
units
Spatially disadvantaged people
apply for social housing
Low- and medium-income
households move into SHPs in local
communities
“Social housing isn’t
fulfilling its objectives
because it is driven by
demand. Demand doesn’t
resolve location and the
complexity of location”-
Government stakeholder

Page 37 of 108
result, this project has not contributed to spatial restructuring. It has, however, provided tenants with
affordable housing, independence and a safe living environment.
11.1.2. Social Restructuring
There is evidence that some social housing projects have a tenant mix that meets the social restructuring
objective in some areas.
The study found that racial integration within the projects was varied and depended both on the location of the
project and the province in which it is located. The figure below depicts the racial profile of the tenants in the
various projects.
Figure 11: Racial profile of the tenants vs the racial profile of the surrounding ward
As shown above, there are a number of projects that have representation of over 95% of just one racial group,
indicating that integration within the projects is limited. Conversely, there were a number of projects where
99%
70%
18%
10%
97%
99%
99%
56%
46%
49%
93%
35%
12%
68%
99%
84%
98%
84%
81%
39%
81%
85%
2%
1%
1%
11%
28%
12%
5%
20%
84%
31%
1%
3%
1%
3%
1%
3%
11%
5%
25%
37%
1%
5%
2%
18%
40%
18%
1%
5%
26%
39%
1%
11%
11%
18%
Project
Ward
Project
Ward
Project
Ward
Project
Ward
Project
Ward
Project
Ward
Project
Ward
Project
Ward
Project
Ward
Project
Ward
Avo
ca H
ills
Be
lha
rB
GA
lexa
nde
rC
ity D
ee
pL
ake
Ha
ven
Roo
dep
oort
Sco
ttsd
ene
Ta
u V
illa
ge
Th
em
be
lihle
Va
lley
Vie
w
Black African Coloured Indian White

Page 38 of 108
integration within the project is evident. Lake Haven, Valley View, Belhar and Scottsdene are the most racially
integrated projects. These projects are located in inner and outer suburban areas whilst the projects that aren’t
racially integrated are mostly located in the inner city. However, this finding does not extend to integration at a
neighbourhood level. The figure depicts the racial profile of the residents who live in the ward in which the social
housing projects are located. As shown above, there are projects where the racial profile of the tenants in a
project mirrors the racial profile of the ward in which the project is located. BG Alexander and Belhar are
examples of this. City Deep’s associated ward is very large and not contiguous, and thus presents a skewed
view of the racial breakdown of the area around the social housing project. However, for the rest of the cases,
there is evidence of racial integration. Whilst the majority of the social housing projects are not racially
integrated, the wards in which a large number of the projects are located are racially integrated.
Additionally, the study found that social housing is achieving ward-level income mix at varied levels. The figure
below depicts the annual income levels of the wards in which the social housing projects are located.
Figure 12: Ward-Level Income
The annual income of tenants who live in social housing is between R18 000 and R180 000. For income mix to
be achieved, the annual income for the ward would need to be predominantly above R180 000 or predominantly
below R180 000.98 As shown in the figure above, BG Alexander, Tau Village, Thembelihle and Scottsdene are
contributing minimally to income mix as the majority of residents’ annual income is within the social housing
income bracket. Conversely, Roodepoort, Valley View, Avoca Hills and City Deep have the highest number of
residents who earn above R150 000, indicating an income mix.
98 The ward level data doesn’t disaggregate the data in such a way that we will be able to identify how many
residents earn below R180 000. As such, we used R150 000 as the upper income band for social market.
10%
13%
13%
22%
7%
18%
11%
13%
11%
14%
8%
10%
10%
21%
4%
14%
8%
12%
9%
9%
50%
64%
64%
47%
30%
48%
53%
54%
59%
42%
19%
6%
6%
4%
26%
11%
13%
3%
12%
17%
7%
26%
4%
6%
4%
12%
7%
5%
5%
5%
7%
5%
9%
17%
5%
6%
Valley View
Thembelihle
Tau Village
Scottsdene
Roodepoort
Lakehaven
City Deep
BG Alexander
Belhar
Avoca Hills
Below R10 000 R10 000 - R20 000 R20 000 - R150 000 R150 000 - R300 000 Above R300 000 Unspecified

Page 39 of 108
The combination of the racial integration and income mix findings indicate that the social housing programme
is contributing to a tenant mix at the neighbourhood level in the majority of the projects.
11.1.3. Economic Restructuring
For economic restructuring and urban regeneration to take place, social housing must be complemented by
coordinated public and private investment.
Whilst there is potential for social housing to act as a catalyst for urban regeneration, the extent to which this is
possible depends on a coordinated response from public and private sector actors. Social housing is intended
to align with Urban Development Zones as well as other spatial planning instruments, such as inner-city
revitalisation strategies, development nodes and transport/investment corridors. This must subsequently be
linked to the National Spatial Development Framework, Provincial Government Development Strategies,
Provincial and Municipal Spatial Development Plans and Integrated Development Plans.99 Additionally,
neighbourhoods in decline, where an increasing number of social housing projects are built, either improve or
deteriorate further based on the amount of private and public investment in infrastructure, transport and other
housing developments.
11.1.4. Social Housing Target Market
The combination of annual rental increases, the increase in the income eligibility
criteria and the increases in municipal rates and taxes are making social
housing increasingly unaffordable for low-middle income tenants.
At the inception of the SHP, social housing was successful at targeting low- to
medium income households, particularly those in the primary target market.
However, this study found that, as the programme has progresses, the
affordability of these units is eroding. Interviews with tenants across the case
studies indicated that the annual increases in rent, rates and services are high,
and are an added cost burden. Tenants further expressed that they are concerned that
the cost burden will force them to move out of the social housing projects, back into the townships or their
previous residences.
Assessment of results chain
The contribution of social housing to spatial restructuring depends on the locations of the social housing
projects. Projects that are located in the inner city have contributed to spatial restructuring by providing
previously disadvantaged individuals with access to a wide range of amenities and employment opportunities.
The other projects have had made a minor contribution to spatial restructuring through the densification of
urban areas and infill development.
Additionally, the study found that social housing is a contributor to social restructuring, particularly at a
neighbourhood level by ensuring a racial tenant mix, with the exception of a few cases. The social housing
projects have integrated individuals of different races, and in some cases, brought previously disadvantaged
individuals into historically White neighbourhoods.
It is further concluded that social housing projects have had a varied impact on economic restructuring and
urban regeneration. Social housing projects have encouraged investment by public and private sector actors
99 Ibid
“How long will I be able
to afford the rent and the
R150 I pay monthly for
parking? The rent
increases every year and
I won’t be able to afford
it” -Tenant

Page 40 of 108
in transport infrastructure, housing and the development of amenities. There is also evidence of social
housing catalysing small business development in the immediate surrounding areas. However, given the
limited scale of social housing, it is difficult to attribute investment in an area directly to social housing.
Lastly, in general, SHIs have been successful in targeting low- to medium- income households; however, the
high operating costs have made it increasingly difficult for SHIs to charge affordable rentals to households in
the primary target market. Additionally, it has become increasingly difficult for these households to afford the
rent and the additional service charges that accompany it. As a result, low income households are likely to
eventually be priced out of social housing.
11.2. Delivery of social housing
There are two impact pathways for the delivery of social housing. They are depicted in the figure below.
Figure 13: SHI Delivery Impact Pathway
11.2.1. Employment opportunities created by SHIs
SHIs have created jobs that are related directly to the activities of the social housing project.
The jobs created by SHIs are primarily in tenant management and maintenance activities. Additionally, other
jobs created include security, gardening and cleaning. The nature of the employment contract as well as the
extent to which tenants can be hired varies according to the SHI. This is depicted in the table below. An example
of self-employment opportunity provided in one SHI is documented in Box 4 below.
Table 4: Overview of employment opportunities provided by SHIs
SHI Nature of employment
contracts
Hires tenants
(Y/N)
SOHCO Contract No
JOSHCO Permanent Yes
YEAST City Housing Temporary Yes
Madulammoho Housing Association Temporary Yes
First Metro Housing Company Permanent No
SHIs are accredited and
employees receive
training
SHIs employ people for
the construction and
management of buildings
SHIs are accredited with
B-BBE Status
Through SHIs, previously
disadvantaged people
own businesses in
economic centers
SHIs are accredited and
employees receive
training
Social housing units are
well run by SHIs
Financially sustainable
SHIs have the capacity
to develop, hold and
manage social housing
units
Sustainable social
housing units for low to
medium income
households as part of a
functioning housing
sector

Page 41 of 108
Additionally, the extent to which benefit are available depends on the nature of the employment contract, with
contractors and temporary employees receiving limited or no access to benefits and permanent employees
receiving benefits, the type and number of benefits depending on the SHI.
Box 4: Employment creation at JOSHCO
JOSHCO fcailitated the establishment of tenant-owned cleaning cooperatives who are responsible for
cleaning the communal areas of the complex. JOSHCO did this by assisting members with the registration
process and trained them on the operating of a cooperative. This form of employment creation for tenants is
more sustainable in that cooperatives exist and operate for the benefit of its members and because they have
a vested interest in the company, they work productively to ensure it succeeds.
11.2.2. Financial Sustainability
The financial sustainability of SHIs is under threat by the financing mechanism and political opportunism that
influences rent boycotts.
The financial sustainability of SHIs is underpinned by a number of underlying assumptions that accompany the
financing model. These include high rental collection rates, allowance for rental escalations capped to CPI and
the billing of rates and taxes at NPO rates. The study found that in most cases, these assumptions are not met
and number of SHIs subsequently struggle to generate sufficient net operating income to cover debt repayments
and create medium-term sustainability. SHI CEOs indicated that the high operating costs and significant
shortfalls in rental collection, put their projects at risk of being financially unsustainable in the long-term. In
response to constraints on viability, SHIs are often forced to make financial and business decisions that are not
in the best interests of the tenants. The most common result is that SHIs price more units at the top of the
income bands.
The SHIs lack of profitability constrains their ability to reinvest in additional social housing projects, which in turn
affects their ability grow their portfolio to the optimal number of units (above 2000). The table below illustrates
the portfolio of RCG-capitalised social housing units owned by SHIs in this study.
Table 5: SHI RCG-capitalised social housing portfolio100
SHI No. of
Projects
Total Number
of units
RCG Funded
Units
IS Unsubsidised
SOHCO 8 1843 1839 4
JOSHCO 26 6823 1723 966 4134
YEAST City Housing 14 1267 911 343 13
Madulammoho Housing Association 10 2599 1715 867 17
First Metro Housing Company 16 2248 1466 550 232
Source: SHRA Compliance Reporting Q2 2018/19
As shown above, JOSHCO, Madulammoho Housing Association and First Metro are the only SHIs whose total
housing portfolio gives them economies of scale in their management arrangements (with Madulammoho and
First Metro only slightly exceeding 2000 units). JOSHCO’s large portfolio is driven predominantly by their status
as an entity of the City of Johannesburg and subsequently receive substantial financial assistance from the city.
However, as mentioned above, an SHIs total housing portfolio is not the only indicator of sustainability. Yeast
have a small housing portfolio, but they remain financially sustainable as the underlying assumptions that
100 http://www.nasho.org.za/members

Page 42 of 108
underpin the financing model are met. Conversely, First Metro have a large housing portfolio but they are not
financially sustainable.
Another threat to the financial sustainability of SHIs and the social housing sector in its entirety are rental
boycotts or building hijacks that arise from the demand from tenants to transfer ownership of social housing
units to individuals (refer to the box below for an example). A large proportion of tenants in all of the projects
indicated that they wanted to own the units. When this is complemented by political populism (often fuelled by
political parties), it can lead to rental boycotts and building hijacks. The longer the rental boycotts take place,
the more likely it is that the SHI will be financially unsustainable as it uses funds from income-generating projects
to supplement the hijacked projects. Additionally, the slow pace at which legal evictions take place, puts these
SHIs at risk of collapse and in these cases, the developments could be sold should they meet the LTR on
transfer and disposal of stock.
Box 5: Rental boycotts at Valley View101
In 2010, Valley View experienced rental boycotts by 75% of the residents as a strategy to get SOHCO to
reduce rentals. This was followed by violent protests and SOHCO staff could not access the building.
Thereafter, SOHCO followed a legal mass eviction process, which took four years to complete. SOCHO
experienced rental boycotts in two of their other projects, which resulted in a rental collection shortfall of
approximately R10 million over the period.
Financial sustainability is affected by the way in which municipalities charge rates and taxes.
An important assumption underlying the financing model for social housing is that municipalities bill SHIs NPO
rates for rates and taxes. However, the study found that this is not always the case. The extent to which SHI’s
are billed NPO rates depends on the size and liquidity of the municipality and well as the relationship between
the SHI and the municipality. In the Eastern Cape for example, a municipality is trying to charge SHIs
commercial rates. In other cases, the City of Cape Town in particular, SHIs who received RCGs can apply for
100% rebate in rates and taxes. Additionally, in one case in the eThekwini municipality, a SHI is charged no
rates and taxes for one social housing project and full residential rates for another social housing project. The
financial sustainability of SHIs who pay residential and commercial rates for rates and taxes is at risk as it
reduces their profitability and puts strain on their ability to meet their debt repayments and sustainably manage
their projects.
Financial sustainability affects the extent to which maintenance can take place at the social housing projects.
Whilst maintenance generally takes place at the majority of the social housing projects, the study found that
there are some projects that are not well maintained. This is largely a consequence of the fact that the SHIs are
under threat of being financially unsustainable and maintenance increases their operating costs. Additionally,
tenants reported that a number of SHIs take a significant amount of time to respond to maintenance requests
(up to one year). In some cases, tenants reported that they had to contribute to their own maintenance requests
and when they could not afford this, maintenance did not take place. The combination of these put social
housing projects at risk of degradation in the long-term. This is likely to reduce the benefits of social housing for
tenants and further affect the financial viability of the project.
Assessment of results chain
101 Interview with Housing Manager and https://www.iol.co.za/news/developers-fight-estate-hijacking-1266306

Page 43 of 108
SHIs have directly created a number of temporary, contract and permanent jobs. However, the job creation
potential of the social housing programme is limited. The jobs created are related directly to social housing
activities, primarily tenant management and maintenance activities.
The financial sustainability of SHIs is under threat due to marginal project viability and net operating deficits
on subsidised units . Additionally, SHIs are struggling to grow their portfolio to optimal numbers which further
exposes them to the risk of becoming financially unsustainable. A consequence of this is that projects are
not well maintained, which puts them at risk of degradation in the long-term.
11.3. Tenant Outcomes
The following subsections present the tenant outcomes of the study. The ToC is referred to throughout this
subsection to determine whether or not the results chains hold, assessing each result and determining whether
it has been achieved and whether or not it logically follows to the next result.
11.3.1. Security
In the ToC the ‘security’ impact pathway is represented along the following results chain:
Internal security
Overall tenants have positive experiences of security in their social housing projects; however, there was
incidences of crime reported across the case studies indicating that crime is present but limited.
From the site observations at all the social housing project, security-controlled access was observed along with
other security measures such as electric fencing and turnstiles that tenants, staff and visitors have to use to
gain access into the social housing project. The additional security measures and the number of security guards
present are dependent on the social housing project. Some only had one security guard who sat at the gate,
while others had more. Those with more than one security guard had some guards who oversaw access into
the social housing project, while others roamed around the property. social housing projects have control over
security within the social housing project and they can incorporate additional security measures to make tenants
feel safer. This indicates that the security needs of the complex differed across the social housing projects.
Box 6: Additional security measures in Belhar
Originally, Belhar did not have a fence around its perimeter, this left the units exposed and the social housing
project experienced house break-ins. However, after the installation of the fence, tenants reported that house
break-ins have gone down. This indicates that the social housing projects has been be responsive to tenants'
security needs and included additional security measures to ensure that tenants feel safer within the confines
of the social housing project.
Tenants move into well
located, secure and good
quality housing units
Tenants have a greater
sense of security living in
social housing
Tenants feel safe

Page 44 of 108
From the tenant survey data, 12% of the sample reported that they moved into social housing because it
reported to offer a more secure living environment for them and their families.102 During the FGDs, most tenants
reported that they did not have security guards at their previous residences, and therefore, feel that living in a
gated social housing project with security guards has its benefits. Children can play freely within the complex
and parents do not have to worry about them wandering out, tenants can leave their doors open while they are
inside their units, and they can walk around the property late at night without feeling threatened. The security
benefits also had positive spillover effects for the community in that houses opposite the social housing project
feel safer because they now have security in the area, and security guards watching over their houses.
Box 7: Tenants feelings of safety and example from Scottsdene
Tenants from Scottsdene reported that the social housing project was the safest place in Kraaifontein.
Kraaifontein is one of the country's worst precincts in terms of the number of crimes that are reported, yet
social housing has made this group of residents feel safe.103 There were 20 919 crimes reported in 2018
alone, the number of property crimes and violent crimes are present in Table 6 below. The prevalent crimes
are crimes against another person such as murder, sexual offences, common assault and robbery.
However, there are still security concerns. For some tenants, the presence of the security guards was viewed
as not being effective. These tenants reported that the guards often do not follow proper security protocol when
letting visitors in, and crimes in the social housing project have occurred with the security guards present. It was
reported that tenants or visitors could easily bribe the guards, which would then allow them to exceed the visitor
limit.104 A few tenants reported their homes being broken into, their clothes being taken from the communal
washing lines and their car tires being stolen, despite the guards sitting at the gates.105 Of those surveyed, 9%
had been victims of violent crimes and 17% had been victims of property theft since moving into social
housing.106 These numbers are not necessarily reflective of social housing, but of living in a country like South
Africa. SAPS data on reported crimes in 2018 shows that 12% of people in South Africa were victims of violent
crimes and 25% were victims of property crimes, which is greater than the reported levels in social housing.107
As can be seen in Figure 14, the data indicates that tenants feel safer in the social housing project and in their
units as compared to their previous communities and residences. Furthermore, tenants were asked how safe
they felt walking alone outside their building during the day and at night. The aim of this question was to test
how safe tenants felt in their area at different times of the day. There were no significant changes in how safe
tenants feel walking in their areas during the day and at night as compared to their previous residences.108 This
is likely to be because the social housing projects have no control over security measures in the broader area
like they do within the confines of the project.
Examining feelings of safety by sex, it was found that across all four categories, women feel marginally more
unsafe than men.109 This is in line with the StatsSA Crimes Against Women Report, which states that women
in South Africa fear crime more than men do, and in turn tend to feel less safe than men. Interestingly, however,
102 Genesis Analytics. 2019. Tenant Survey Data. 103 Crime stats SA. Worst ten precincts: largest number of reported crimes. Available:
http://www.crimestatssa.com/topten.php 104 Genesis Analytics. 2019. SHP FGD Data. 105 Ibid. 106 Genesis Analytics. 2019. Tenant Survey Data. 107 Crime stats SA. Available: http://www.crimestatssa.com/national.php 108 Genesis Analytics. 2019. Tenant Survey Data. 109 Ibid.

Page 45 of 108
when comparing how the male and female tenants feel about crime, it was found that the same trends both
genders feel safer in their units, complex and in their area during the day and both feel less in their area safe at
night.
Figure 14: Overall feelings of safety
Source: Tenant survey data (** result is statistically significant)
External security
Most social housing projects are located close to a police station the result of which is tenants seeing the police
regularly and knowing where the police station is, this is important because the majority if of the social housing
projects are in high crime areas.
Tenant safety is dependent on two factors, how safe they feel within the social housing project and how safe
they feel within the area. From Figure 14, it can be seen that tenants feel marginally safer in their broader
communities than they did in their previous communities. Proximity to a police station is not a factor in the
selection of the location for social housing projects, which is dependent on the availability of land in a
restructuring zone. Property data indicates that on average social housing projects are located approximately
2,3 km away from a police station. Further evidence for this was found in the tenant data, where 50% of tenants
report that they see the police in their area at least once a week, 88% of tenants report that they knew where
the police station was, and 91% of tenants report that it would less than 30 minutes to get there.110 The visibility
of the police signals to the tenants that they are available should something happen and this is likely to increase
the way tenants feel about safety in the area. This is an unintended positive outcome for social housing.
Table 6: Crime statistics disaggregated by precinct around project111
Project Precinct # of property crimes in 2018 # of violent crimes in 2018
Avoca Hills Greenwood Park 1 213 1 306
Belhar Belhar 537 1 104
B.G. Alexander Hillbrow 1 698 5 324
110 Genesis Analytics. 2019. Tenant Survey Data. 111 SAPS, 2018, available at [https://www.saps.gov.za/services/crimestats.php]
Safe Unsafe Safe Unsafe
Unit 92% 8% 90% 10%
Complex 88% 12% 87% 13%
Area during
the day 78% 22% 73% 27%
Area at night 41% 59% 39% 61%
Male Female
Feelings of safety1 = very safe 4 = very unsafe
2,05 1,7
Safety in unit **
2,14 1,85
Safety in complex**
2,22 2,13
Safety in the area during day**
2,73 2,7
Safety in the area at night
Pre
vio
us
Cu
rre
nt

Page 46 of 108
Project Precinct # of property crimes in 2018 # of violent crimes in 2018
City Deep Jeppe 1 202 3 746
Lakehaven Newlands East 634 1 167
Roodepoort Roodepoort 2 276 2 762
Scottsdene Kraaifontein 1976 3 866
Tau Village/ Thembelihle Pretoria Central 2 054 3 841
Valley View Bellair 496 454
Table 6 presents the number property and violent crimes committed in the precinct where the social housing
projects are located. From the table above we can see that the majority of the areas, with the exception of Valley
View, have high levels of crime.
In addition to improved feelings of safety due to police presence, residents in Valley View and Lakehaven
reported that they are actively taking part in community forums such as the Neighbourhood Watch and the
Community Police Forum. These engagements serve two important purposes, the first of which helps the
tenants integrate with the surrounding community and the second sees the tenants taking an active interest in
the security concerns of the area.
Assessment of the results chain
There is evidence supporting the results chain for safety; all social housing projects have some combination
of security measures (such as security guards, controlled access, turnstiles and electric fencing), therefore
the social housing projects that are secure have increased how safe tenants feel within the social housing
project. However, the social housing project does not have control over external security measures and the
areas that they are located in have relatively high levels of reported crime. Thus, tenants still feel unsafe safe
in their neighbourhoods.
11.3.2. Transportation
Illustrated in the ToC is the following results chain:
Not all social housing projects were located near transport routes, limiting tenants’ access to public transport
and resulting in high transport costs for households.
Inner city social housing projects have access to a variety of regular public transport options. For example,
tenants at BG Alexander could take the Rea Vaya bus or a taxi from directly outside of the social housing
project. However, social housing projects that are located outside of the city centre, such as Lakehaven, do not
have access to regular public transport. In this particular case, housing management had to approach the taxi
association and request them to send taxis past the social housing project in the mornings and in the evenings.
While public transport is available, it is not regular and tenants who work outside of the taxi and bus operating
hours have to find alternative transport means. This has knock-on effects as tenants have to walk great
distances to access public transport, and tenants reported that the route they walk is not safe, especially when
Social housing units are situated near public transport
routes
Tenants have better access to transport
routes
Tenants cost of travelling is reduced
Tenants have increased
disposable income

Page 47 of 108
they are alone. This is supported by the evidence in the above section where tenants reported to feel unsafe
walking alone during the day and at night in their communities. There is a similar situation in City Deep where
tenants reported having to wait up to 30 minutes to catch a taxi. This increases the travelling time for those
tenants to get to work or school each day.
Figure 15: Transport used by surveyed tenants to get to work112
** Participants could select more than one option (therefore the total do not sum to 100%)
Figure 15 illustrates the most-used forms of transport that tenants use to get to and from work each day. Out of
six modes of transport, three are public (taxi, bus and train), two are private (walking and own car) and one is a
shared solution (carpool). Comparing these results to national averages we find that a higher number of social
housing tenants use cars, a car pool system or taxis to get to work while a lower number of people walk to work.
Tenants likely have their own cars or carpool with someone from the same housing project or area, hence the
high percentage of employed tenants who use this from of transport. Taxis are the most common form of public
transport used among tenants this possibly due to the convenience and accessibility. Given that most SHPs
were noted to not be located near a defined public transport route the high usage of taxi’s make sense. The
Lakehaven example above illustrates the flexibility of the taxi association in comparison to other public transport
options such as trains and buses who would need permission from the city to add a new route. Tenants in social
housing also walk less to their place of work this could be because there not enough economic opportunities
that are in walking distance from the social housing projects.
All forms of transport, with the exception of walking, carry a cost, and tenants across the ten case studies
reported spending an average of R217.12 more on transport than they did in their previous residences.113 114This
indicates that this impact pathway in the theory of change does not hold as tenants do not necessarily live closer
to amenities and travel costs have instead increased.
Other reasons that might explain this increase in cost could be that children have switched from public transport
to private lift-clubs115. Of those tenants interviewed, 51% reported that they at least one child attended an
112The first bracket indicates lowest income quintile (up to R7 029) and the second bracket indicates the quintile
2 (R7 030 – R12 780) 113 This result is statistically significant 114 Genesis Analytics. 2019. Tenant Survey Data. 115 Lift clubs were most noticeable in SHPs where public transport was not easily available and therefore parents
needed other transport options to get their children to and from school.
Walking: 17%
Taxi: 44%
Bus 7% Train 6%
Car 31%Car pool
21%

Page 48 of 108
educational facility. The use of a private lift club was reported to cost R250 – R300 per child, per month,116
therefore increasing the transport costs of the household. The data also indicate that 45% of the sample reported
to have experienced an increase in their disposable income since moving into social housing. Tenants could be
using their increased disposable income to travel to different amenities that are not located close to the social
housing project, therefore the increased traveling could be reason why there has been increase in transport
expenditure. Lastly, changes in the cost of petrol has increased, thereby increasing the amount tenants would
pay to travel. There are a number of factors that may be contributing to the increase in transport expenditure;
however, we find more evidence to suggest that tenants are paying more to reach work, school and other
amenities and that this is likely the biggest driver of increased costs, this is in contradiction to the ToC.
Box 8: Lakehaven example of use lift sharing mobile applications
One tenant in Lakehaven reported that she used the lift-sharing mobile application, Taxify. The mobile
application allows people to request a ‘ride’, and a driver then collects and drops them off at their desired
location. The tenant reported that she uses Taxify because it is convenient and affordable for her. Given that
the tenant lives close to her doctor and the Shoprite (the amenities she mostly uses) she is only charged
Taxify’s minimum fare.117 Therefore, in this case, being close to the amenities is beneficial for tenants who
use lift sharing applications that base their fee structure on distance.
Some tenants do not use public transport and instead have their own private vehicles. For these tenants they
incur an additional cost to park their vehicle at the social housing project (this was reported to be approximately
R150 - R160 a month), and this cost adds to their total monthly transport costs.
Assessment of the results chain
The results chain for transport contains two components, the first part relates to tenants’ access to transport
and the second part relates to its cost implications. The first part of the results chain can only be partially
confirmed. This is because not all social housing projects were located near an existing public transport route
and therefore those tenants did not have better access to public transport. The second part was found to not
hold because tenants are spending more on transport than they did at their previous residence, therefore
their cost of travelling was not reduced. The last part of the results chain does hold, in that the majority of
tenants reported that their disposable income increased; however, this was not because of reduced transport
costs.
11.3.3. Economic opportunities
In the ToC the ‘economic opportunities’ impact pathway is represented along the following results chain:
Employment opportunities offered by the social housing project
116 Genesis Analytics. 2019. SHP FGD Data. 117 This equates to ±R20 a trip.
Social housing units
are situated near
public transport
routes
Tenants have better
access to economic
opportunities
Tenants become
employed/start small
businesses
Household income
improves

Page 49 of 108
Social housing contributes to employment in three ways, the first is that it acts as an employer of tenants, the
second, is that by living in social housing, tenants have opportunities for self-employment and lastly, social
housing contributes to the local economy by hiring local services providers.
To run a social housing project efficiently, housing management needs to ensure that they have staff to handle
tenant issues, who run community development programmes and who secure, clean and maintain the social
housing project. Most of the social housing projects examined for this study had a combination of these staff
roles present at the social housing project. Some of these roles such as the cleaning, gardening and
maintenance staff are open to tenants. Tenants, therefore, have access to employment opportunities in the
same place that they live, which allows some households to earn an extra income; reduces travel costs because
the tenants don't have to travel to work, and some of the tenants receive benefits such as the UIF
(Unemployment Insurance Fund) and paid leave.
However, the extent to which tenants could work for the social housing project varied from project to project.
For example, at Lakehaven tenants were not allowed to work for the social housing project at all, while at Avoca
Hills, tenants were employed to clean the social housing project. This illustrates how this varies by project, as
both Lakehaven and Avoca Hills were managed by First Metro yet have different employment policies.
Of those employed, 7% of tenants reported to be self-employed.118 Some of those who are self-employed have
taken advantage of opportunities that have been presented through social housing. In City Deep, JOSHCO has
helped tenants establish a cleaning cooperative which is responsible for cleaning communal areas of the social
housing project. Here, the tenants are not employed by the social housing project, but by the cooperative. In
Valley View and Lakehaven, tenants, despite not being allowed, were running tuck shops out of their units and
using the income to pay their rent.119 Interestingly some tenants with private vehicles use their vehicles to
operate lift clubs for children at the social housing project. Parents at the social housing project were the target
market as they needed to get their children to and from school safely. By living in social housing some tenants
have seen a business opportunity and provided a service that might not have otherwise been fulfilled. These
provide some examples of how tenants can gain employment through social housing or become self-employed.
Finally, housing management at Avoca Hills, Valley View and City Deep reported that beyond the hiring of
tenants, they only use service providers who are from the same ward. The housing supervisor at Avoca Hills
reported that they keep a database of SMEs in the area and regularly use them for large maintenance jobs such
as painting, tiling or plumbing. Similarly, JOSHCO the company responsible for City Deep and Roodepoort, are
reported to spend 30% of their R46 000 000 capex on SMME empowerment by creating labour intensive jobs
through the Expanded Public Works Programme and SMME packages.120 By using local suppliers social
housing is also supporting local businesses, their employees and the local economy.
External employment opportunities
To live in social housing, there must be at least one person in the household who is permanently employed,
resulting in a 77% employment rate among adults. Although 22% of adults have become employed since moving
to a social housing project, there is not sufficient evidence to conclude that this is due to social housing.
118 Genesis Analytics. 2019. Tenant Survey Data. 119 Genesis Analytics. 2019. SHP FGD Data and Site Observation. 120JOSHCO. 2018/19. Midyear report for the 2018/19 financial year. Available:
http://www.joshco.co.za/annual_reports/midyear.report.1819.pdf

Page 50 of 108
The unemployment rate in social housing was calculated to be at 23%, which is marginally less than of the
South African unemployment rate, which is 27.1%.121
Figure 16: Comparison of employment statistics
Source: Tenant survey data and StatsSA
Within the sample of households there are 2 134 adults that are employed. There are only two households
where it was reported that no one was employed, indicating that the leaseholder had recently lost their job. The
majority (54%) of those who are employed are found to be the only person employed in their household.122
Disaggregating this by employment type, 96% of tenants are permanently employed, 20% of temporarily
employed and 7% are self-employed. These number do not add up to 100% as tenants reported having multiple
jobs, for example a tenant might be temporarily employed at a company but also have their own business
resulting in them being self-employed.
Employment by gender
Disaggregating employment by gender we find that 61.25% of the economically
active females are employed and 79% of the economically active males are
employed123. Comparing these labour force participation rates to national averages
we find that employment rates in social housing exceed the national averages for
women (which was estimated to be 47.85% in 2017) and for men (which was
estimated to be 62.04% in 2017).124 A high employment numbers are to be
expected because you must be formally employed to qualify for social housing.
However, since moving into social housing there has been a 22% increase in the number of adults in a
household employed when compared when they lived in their previous residences.125 Tenants and housing
managers from Lakehaven, Tau Village, and BG Alexander confirmed this by reporting that there were work
opportunities close by the social housing project and that they knew of tenants who had been employed by local
businesses. However, this is not the case at all social housing projects, Valley View, Scottsdene, Belhar and
are not surrounded by many businesses and therefore the employment opportunities are limited. City Deep is
an industrial area, however, the skills that are needed by these companies might not match the skill set of the
tenants, therefore tenants would still need to look outside of city deep for employment opportunities.
121 StatsSA. Available: http://www.statssa.gov.za 122 StatsSA. Available: http://www.statssa.gov.za 123 Economically active refers to those between the ages of 15 and 65. 124 The World Bank. Available: http://datatopics.worldbank.org/gender/country/south-africa 125 Genesis Analytics. 2019. Tenant Survey Data.
Employed 77%
Unemployed 23%
Overall employment Statistics for the social housing sample
Employed 73%
Unemployed 27%
Employment statistics for South Africa

Page 51 of 108
Furthermore, it is not enough to simply be close to economic opportunities, but these opportunities must match
the skill set required by businesses. In previous sections we have also indicated that not all social housing
projects are not built near public transport routes making it difficult and costly for tenants to get to work and for
tenants to look for work. Therefore, the evidence that social housing contributes to increases in employment is
not infallible.
Assessment of the results chain
As established in previous sections, not all social housing projects are located near public transport routes
thus making it costly for tenants to (i) get to work and (ii) to find work. Without access to regular transport
tenants are limited in their employment opportunities to what is close to the social housing project, social
housing that is located in suburban areas limits employment opportunities further because there little to no
opportunities available, and therefore, there is little evidence that the ToC holds.
Anecdotally and we find that social housing presents tenants with some opportunities for self-employment,
apart from the opportunities present in social housing 7% of tenants reported to be self-employed. This small
percentage of the sample indicates that this result has partially been achieved.
11.3.4. Health
In the ToC the ‘health impact pathway is represented along the following results chain:
Tenants have greater access to healthcare facilities because (i) the social housing projects are located near
healthcare facilities and (ii) some social housing projects have health focused community development
programmes. The majority of tenants report to be in good health and miss minimal amounts of school and work.
On average tenants are located 2,71 km from a healthcare facility, providing tenants with close access.126 This
finding was supported by the survey data where 62% of tenants reported that there was a healthcare facility
less than 5km away from where they lived.127 Assessing the tenants’ healthcare usage is difficult as healthcare
is not an amenity that tenants would use frequently unless they have need to. However, in terms of health
outcomes, during the time of the survey, 92% of leaseholder reported that were in excellent, very good or good
health. It is important to note that 52% of tenants moved from already improved brick structures and 27% moved
from a flat, and therefore, it is unlikely that the data will demonstrate significant changes in tenants’ health
outcomes in the medium term.
If tenants have better health outcomes, then they are likely to spend more time at work and school and less
days off due to illness. The data show that learners in social housing missed an average 1.98 days of school a
year and employed tenants missed an average 2.48 days of work in the last six months. Less time off work
allows tenants to be more productive at both school and at work. It is not possible to determine whether this is
126 Lightstone Property data 127 Genesis Analytics. 2019. Tenant Survey Data.
Social housing units are situated near
healthcare facilities
Tenants have better access to healthcare
facilities
Tenants’ have better
healthcare outcomes
Reduction in time off
school and work

Page 52 of 108
a result of the social housing; however, since the health of tenants was already likely to be reasonably high, the
evidence for contribution of social housing is limited.
Community development programmes also play a role in providing tenants access to health care facilities, see
Box 9 below for an example.
Box 9: Example of healthcare community development programme
Mature tenants and children in Belhar and Lakehaven reported to benefit from the healthcare community
development programme where a nurse came to the social housing project once a week to test tenants blood
pressure, sugar levels and give children their vaccinations. At these social housing projects tenants have
access to healthcare services free of charge, and could weekly monitor their health, and get advice about
how any life-style changes that they would need to make to live a better life.
Social housing projects also have social worker visits, where familial issues such as domestic violence,
substance abuse, or sick family members can be addressed. A social worker is available at Belhar and
Scottsdene and is made available through Madulammho’s partner Metro Evangelical Services (MES). Housing
management reported that the social workers were not widely used because of the stigma attached to using
them.128 However, in Belhar, housing management reported that the social worker had helped a tenant get help
for his substance abuse. Demonstrating that even though they are not widely used they have the potential to
positively affect tenants’ lives.
Substance abuse was raised as a concern in more than one social housing project, it is reported that the main
problem has been due to the changes in the laws around marijuana. Housing management reported that many
tenants are now openly using the substance which they feel is then leading them to use other hard drugs.129
Management feels that because there is no legal clarity around its use, they cannot stop the tenants from using
it, but they are worried about the negative ramifications it might have for tenants. Management also reported
that they do not screen for smokers when tenants apply for social housing. They noted that tenants are free to
smoke in their units should they wish to. However, management were concerned where tenants were smoking
in communal areas, such as passages ways as it negatively affects the other tenants who live in the same in
social housing project.130
At both Belhar and Scottsdene MES and KFC provide households with food parcels for a maximum of six
months. To qualify for these parcels, you must be unemployed and have dependents. The purpose of these
parcels in to ensure that your family has access to food while you are unemployed and looking for work. Housing
management said that these are highly beneficial for the tenants who receive them, as they do not have to
spend money on food and can use that money for other purposes such as rent and getting transport to look for
work.131
Another point to note on health is that for tenants to qualify for social housing they must be employed and
therefore tenants have may have already had a medical aid or hospital plan as one of their employment benefits.
128 Genesis Analytics. 2019. KII. 129 Ibid. 130 Ibid. 131 Ibid.
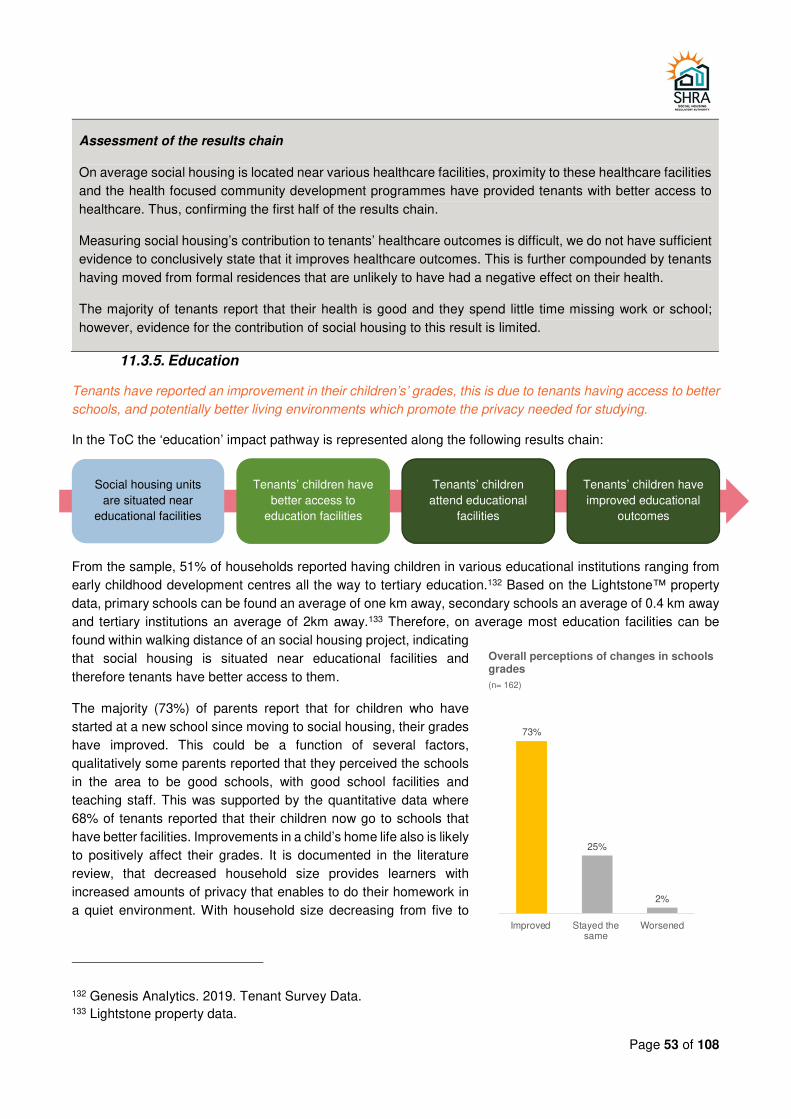
Page 53 of 108
Assessment of the results chain
On average social housing is located near various healthcare facilities, proximity to these healthcare facilities
and the health focused community development programmes have provided tenants with better access to
healthcare. Thus, confirming the first half of the results chain.
Measuring social housing’s contribution to tenants’ healthcare outcomes is difficult, we do not have sufficient
evidence to conclusively state that it improves healthcare outcomes. This is further compounded by tenants
having moved from formal residences that are unlikely to have had a negative effect on their health.
The majority of tenants report that their health is good and they spend little time missing work or school;
however, evidence for the contribution of social housing to this result is limited.
11.3.5. Education
Tenants have reported an improvement in their children’s’ grades, this is due to tenants having access to better
schools, and potentially better living environments which promote the privacy needed for studying.
In the ToC the ‘education’ impact pathway is represented along the following results chain:
From the sample, 51% of households reported having children in various educational institutions ranging from
early childhood development centres all the way to tertiary education.132 Based on the Lightstone™ property
data, primary schools can be found an average of one km away, secondary schools an average of 0.4 km away
and tertiary institutions an average of 2km away.133 Therefore, on average most education facilities can be
found within walking distance of an social housing project, indicating
that social housing is situated near educational facilities and
therefore tenants have better access to them.
The majority (73%) of parents report that for children who have
started at a new school since moving to social housing, their grades
have improved. This could be a function of several factors,
qualitatively some parents reported that they perceived the schools
in the area to be good schools, with good school facilities and
teaching staff. This was supported by the quantitative data where
68% of tenants reported that their children now go to schools that
have better facilities. Improvements in a child’s home life also is likely
to positively affect their grades. It is documented in the literature
review, that decreased household size provides learners with
increased amounts of privacy that enables to do their homework in
a quiet environment. With household size decreasing from five to
132 Genesis Analytics. 2019. Tenant Survey Data. 133 Lightstone property data.
Social housing units
are situated near
educational facilities
Tenants’ children have
better access to
education facilities
Tenants’ children
attend educational
facilities
Tenants’ children have
improved educational
outcomes
73%
25%
2%
Improved Stayed thesame
Worsened
Overall perceptions of changes in schools grades
(n= 162)

Page 54 of 108
three, children will have more privacy and improved study conditions that can lead to better grades being
achieved.
Some tenants reported that their children go to schools near the social housing project; however, from the tenant
survey data it was found that children travel an average of 9.7 km to get to school.134 This indicates that some
children are going to schools that are close to the social housing project, while others are not. Although there
are schools available close to the social housing projects, some parents are opting to send their children further
away. This indicates that they have a preference for the types of school they want their children to go and having
access to more than one school has allowed parents to choose which school they want for their children. This
may also explain the need for private transport to take children to and from school each day. The tenant survey
data indicates that 21% of children walk to school while the rest use some form of motorised transport. Indicating
that those 21% go to schools near the social housing project while the rest go schools further away.
On average, children in social housing have missed 2.39 days of school within the last year. Considering that
the average school year is 197 days135, children in social housing are only missing 1.2% of the school year. By
missing only a few days in the classroom children as exposed to most of the curriculum, have more time with
their teachers and spend more time learning. All factors that can lead to the improvement of children’s
educational outcomes.
Another driving force behind the improvement of grades is that at some social housing projects children have
access to after-school homework programmes. As part of the community development strategy, there are
programmes run in the social housing projects by volunteers who supervise homework sessions with the
children. Belhar reported that it had an aftercare programme in the hall where children can go to do their
homework, there is great demand from the parents for the programme to be run every day, but housing
management reported that it does not have sufficient volunteers to do so. Valley View reported having a similar
programme that was run by UNISA students; however, the programme had stopped due to funding constraints.
At other social housing projects, such as City Deep and Avoca Hills, it was reported that there was a need for
a creche on the premises. At Avoca Hills, the establishment of the creche is part of the social housing projects
future plans, whereas at City Deep housing management promised a creche but never delivered. Educational
community development programmes are in high demand by tenants as they view these types of programmes
as being beneficial for their children and themselves.
Assessment of results chain
On average social housing is located near various educational facilities, proximity to these educational
facilities have provided tenants with better access to education. Thus, confirming the first half of the results
chain.
However, the third result could not be confirmed because on average it was found that learners travel 9,7km
to their educational facilities indicating that they are not attending the facilities close to the SHP. This is not
negative, as it indicates that parents in social housing have a choice of the different educational facilities that
they can send their children to.
134 Genesis Analytics. 2019. Tenant Survey Data. 135 South African education. Available: https://south-africa-williams.weebly.com/length-of-a-school-
dayyear.html

Page 55 of 108
It was found that tenants claim that their children have experienced improved educational outcomes since
moving to a new school after moving into social housing. It is found that a driving factor for this is that learners
are attending schools with better facilities.
11.4. Neighbourhood outcomes
Neighbourhood outcomes are divided into two focus areas, the first examines that extent to which the presence
of social housing attracts private investment into the area spurring urban regeneration; and the second is that
through social housing the area becomes more diverse in terms of income levels and racial integration.
11.4.1. Urban regeneration
For economic restructuring and urban regeneration to take place, social housing must be complemented by
coordinated public and private investment
In some cases, social housing is built in an area where there are already plans to develop the infrastructure and
in other cases the social housing has spurred the creation of some small businesses and private sector
investment, examples of the following are provided below:
Inner-city projects: Inner city projects – BG Alexander, Tau Village and Thembelihle – contributed to some
form of urban regeneration as they are located in areas where government had existing plans for
infrastructure development and transport infrastructure development (Rea Vaya in the case of BG
Alexander). This was followed by private sector development as new shopping malls were built and the
proliferation of small businesses. However, these investments did not happen because of social housing
but happened to happen at the times at which social housing was introduced into the area.
Inner suburban and outer suburban projects: Valley View and Lakehaven have contributed minimally to
urban regeneration. However, these projects have contributed to the densification of urban areas and small
business development. The development of the other projects in this category, Belhar and Scottsdene, have
contributed to private sector housing development, led by Calgro, public sector housing development (BNG
and FLISP (Finance Linked Individual Subsidy Programme) housing) as well as small business
development. The contribution of these projects to urban regeneration would have been strengthened by
increased investment from the private sector and the development of transport infrastructure.
Social housing was also noted to spur some increased levels of economic activity in the area, the introduction
of new households has given rise to small business such as stand-alone tuck-shops and creches and provided
a larger consumer bases for local businesses to sell their goods and services to. The most common occurrence
was the establishment of small standalone shops that operate just outside of the social housing project. In
Scottsdene, the owner stated that he saw an opportunity to provide basic grocery items to a large number of
tenants who did not have a shop nearby. In Belhar, three small informal shops had been established on the
Tenants spend more
money in surrounding
area
Private investment is
crowded into
neighbourhoods
Surrounding property
is regenerated
Neighbourhoods are
made up of a racially
and economically
diverse population
Local economy grows &
low to medium income
households integrate
into communities

Page 56 of 108
road opposite the social housing project; the one owner was a tenant who had lost her job and needed a source
of income to help her husband pay the rent, and another takeaway business had moved their business to Belhar
because the social housing project provided a larger customer base to whom they could sell to.
The development of social housing brings numerous households into a given area and therefore increases the
market size for businesses in the area. we observed that there are existing businesses that have benefited from
the increased number of people, as well as new businesses that have been established to provide goods and
services to the new tenants. On average households in social housing spend an average of R2 407 every month
on good and services in the area (within a 5km radius), contributing towards the growth of the local economy.136
Disaggregating this by spending category it was found that households spend an average of R1 092.09 on food,
R282.74 on non-food items and R1 027.45 on transport.
11.4.2. Spatial Restructuring
Within the results chain it is assumed that social housing will have positive impact on the surrounding property
prices. This is because social housing acts as signal of investment into a given area. Examining the property
data dashboard below, we find that there is no discernible trend in property prices and therefore is no observable
impact of property prices.
In most cases the housing prices did not fluctuate rapidly after the construction and tenanting of the social
housing project, indicating that the construction of social housing project was neither seen as positive or
negative development in the area that would change investment behaviour. Therefore, there this not sufficient
evidence to suggest that social housing has strongly contributed the changes in property prices, or we do not
find sufficient evidence to show that the presence of social housing in a given area has been a sufficient catalyst
for attracting large-scale private investment to the area.
136 Genesis Analytics. 2019. Tenant survey data.

Page 57 of 108
PROPERTY DATA DASHBOARD137
R0,00
R100 000,00
R200 000,00
R300 000,00
R400 000,00
R500 000,00
R600 000,00
R700 000,00
R800 000,00
R900 000,00
08 09 10 11 12 13 14 15 16 17 18
Avoca Hills
Completionyear = 2013
R -
R 100 000,00
R 200 000,00
R 300 000,00
R 400 000,00
R 500 000,00
R 600 000,00
R 700 000,00
R 800 000,00
08 09 10 11 12 13 14 15 16 17 18
Belhar
2016
Sectional Title
Freehold(Averagesales)
R -
R 1000 000,00
R 2000 000,00
R 3000 000,00
R 4000 000,00
R 5000 000,00
R 6000 000,00
R 7000 000,00
08 09 10 11 12 13 14 15 16 17 18
B.G. Alexander
2008
R -
R 200 000,00
R 400 000,00
R 600 000,00
R 800 000,00
R 1000 000,00
R 1200 000,00
R 1400 000,00
08 09 10 11 12 13 14 15 16 17
Lakehaven
2011
R -
R 100 000,00
R 200 000,00
R 300 000,00
R 400 000,00
R 500 000,00
R 600 000,00
R 700 000,00
R 800 000,00
R 900 000,00
08 09 10 11 12 13 14 15 16 17 18
Roodepoort
2010
R -
R 100 000,00
R 200 000,00
R 300 000,00
R 400 000,00
R 500 000,00
R 600 000,00
R 700 000,00
08 09 10 11 12 13 14 15 16 17 18
Scottsdene
2015
R -
R 2000 000,00
R 4000 000,00
R 6000 000,00
R 8000 000,00
R 10000 000,00
R 12000 000,00
R 14000 000,00
08 09 10 11 12 13 14 15 16 17 18
Tau Village/ Thembelihle
Tau: 2010 Thembelihle: 2016
R -
R 200 000,00
R 400 000,00
R 600 000,00
R 800 000,00
R 1000 000,00
R 1200 000,00
08 09 10 11 12 13 14 15 16 17 18
Valley View
2009
Freehold average sales
Sectional Title average sales

137 City Deep has been excluded because it is an industrial area and no residential sales have been recorded.

Page 59 of 108
11.4.3. Community Integration
From the case studies it is found that the social housing projects contained a large number of tenants who had
moved from close by or from within the same suburbs as the social housing projects, and therefore were familiar
with the area and already integrated into the community. Tenants who had moved from further away areas into
social housing had mixed views on integrating into the community, one tenant reported that she only views her
unit as a place to stay while others reported that they integrated well into the community and found people very
friendly and welcoming.
Box 10: Community integration at Lakehaven
At Lakehaven the community development manager reported that tenants are involved in the community
police forum and a ‘war-room’ forum in which the local government convenes to listen to the needs of the
community. By participating in these forums, tenants become aware of issues beyond that of the social
housing project and integrate within the community.
At some social housing projects, such as Lakehaven and Valley View, the housing management had made a
conscious effort to integrate the tenants within the community through different forums. In doing so tenants are
immersed in issues that affect the community and help to come up with solutions.
Assessment of results chain
Tenants are spending in the areas around the social housing projects, which will lead to improvements in the
local economy; however, beyond these direct increases in local aggregate expenditure the impacts of social
housing on the neighbourhoods of the case studies is limited. Social housing projects have encouraged some
investment by public and private sector actors in transport infrastructure, housing and the development of
amenities. However, given the limited scale of social housing, it is difficult to attribute investment in an area
directly to social housing.
Additionally, we find that social housing is a contributor to social restructuring, particularly at a neighbourhood
level by ensuring a racial tenant mix. With the exception of a few cases the social housing projects have
integrated individuals of different races, and in some cases, brought previously disadvantaged individuals
into historically White neighbourhoods.
11.5. Sector outcomes
Housing policy in South Africa has not sufficiently addressed the high levels of demand for housing. The demand
for affordable housing is even more acute. The high levels of demand for social housing are reflected in the low
average vacancy rates and long waiting lists for occupation in social housing projects. The drivers of this high
demand include high levels of migration to urban areas, inability of individuals to access or qualify for subsidised
owned housing for low to middle income households and few opportunities for gap housing.138
A well-functioning housing sector has a mixture of ownership and rental housing models and provides
subsidised owned accommodation to relieve pressure on subsidised rental accommodation, including social
housing. Additionally, the subsidy support framework across different housing instruments is incoherent and
uncoordinated. Lastly, the involvement of the private sector is critical to a well-functioning housing sector. The
138City Deep has been excluded because it is an industrial area and no residential sales have been recorded.

Page 60 of 108
social housing policy aims to facilitate private sector investment in social housing through the establishment of
private public partnerships. The study found that this took place to a larger extent in 2018 and is expected to
take place increasingly in the coming years.
12. Conclusion
This study conducts a critical analysis of the causal chains in the ToC for social housing and comments on
whether the social housing programme contribution to tenant, spatial, economic and social outcomes. We use
a bottom up approach to establish contribution by reviewing the policy and implementation, delivery of social
housing, access for tenants, outcomes experienced by tenants and the surrounding communities, and the
contribution to the sector.
The contribution of social housing to spatial restructuring depends on the locations of the social housing
projects. Projects that are located in the inner city have contributed to spatial restructuring by providing
previously disadvantaged individuals with access to a wide range of amenities and employment opportunities.
SHIs have been successful in targeting low- to medium- income households; however, the high operating costs
have made it increasingly difficult for SHIs to charge affordable rentals to households in the primary target
market. As a result, low-income households may eventually be priced out of social housing. The financial
sustainability of SHIs is also under threat due to marginal project viability and net operating deficits on
subsidised units. SHIs are struggling to grow their portfolio to optimal numbers and the subsidy has stagnated
which further exposes them to the risk of becoming financially unsustainable. A consequence of this is that
projects are not well maintained, which puts them at risk of degradation in the long-term and can potentially
limited the benefits to tenants.
Nevertheless, there is substantial evidence supporting improvements in access to amenities and economic
opportunities for tenants. This has translated to improved feelings of security and perceptions of educational
opportunities for children. However, it must be noted that social housing cannot provide a panacea for all social
and economic difficulties and issues and in some instances the contribution of the social housing to certain
outcomes, such as health, employment and income will be limited in the short run. That being said, there is
potential for long-run changes to occur in these, and potentially even intergenerational impact resulting from
social housing. Thus, this study and its data should be viewed as the start of a longitudinal study and follow up
data collection activities should take place.
In terms of social housing’s contribution to neighbourhood development, the evidence shows that tenants are
spending in the areas around the social housing projects, which will lead to improvements in the local economy;
however, beyond these direct increases in local aggregate expenditure the impacts of social housing on the
neighbourhoods of the case studies is limited. Social housing projects have encouraged some investment by
public and private sector actors in transport infrastructure, housing and the development of amenities. However,
given the limited scale of social housing, it is difficult to attribute investment in an area directly to social housing.
Additionally, the housing projects have, in some instances, contributed to an increase in social integration;
however, in other instances the demographics, particularly racial makeup of the housing projects mirror that of
the areas they are placed. Finally, the findings of this study find that the SHP has not yet reached a scale that
can significantly contribute to the housing sector change.
Social housing can play a vital role in improving peoples’ lives and uplift communities; however, they are not
the remedy to all issues facing the country and their impact may take decades to materialise. Furthermore,
without a scalable approach to delivering social housing, the impact it can have on national spatial, economic
and social impact will be limited.

Page 61 of 108
13. Recommendations
13.1. Policy
• The development of social housing should be closely linked to urban regeneration. Current
policy only examines whether or not a site is in a restructuring zone. Going forward there should be
a closer link to municipal development plans. Greater integration is needed between the
municipalities and the SHRA to ensure that social housing compliments urban regeneration. To
achieve this, a coordinated effort is needed between public and private investments to ensure that
a selected area is well developed and caters to the needs of those who live and do business in it.
This will ensure that, in both the short and long term, social housing projects are well located, with
easy access to amenities such as education facilities, healthcare centres and transport hubs, while
also generating greater impact on the urban environment.
• Social housing organisations should be charged concessionary commercial rates and taxes.
When it comes to rates and taxes there is no consistency between municipalities, some SHIs are
charged commercial rates and taxes while others charged NPO rates and taxes. The burden of this
cost affects the financial viability of the SHIs. Going forward the SHRA should negotiate with
municipalities to ensure that all SHIs are charged concessionary rates.
13.2. Delivery Model
• Rental amounts should be indexed to tenants’ income bands. Low- to middle- income tenants
do not necessarily earn a consistent amount, instead their income fluctuates according to their
personal circumstances (for example if they lose their job, get a promotion or become pensioners).
A system should be in place to regularly check tenants’ incomes and adjust the rental amounts
accordingly. This will ensure that low-income individuals are not priced out of social housing.
• Greater links to other affordable housing options should be generated. This study found that
some social housing tenants did not match the intended target audience, for example, tenants
wanted to own their units, this resulted in tenants staying in social housing for extended periods of
time. Affordable housing in South Africa is catered for through various subsided housing models
(such as BNG as FLISP), more advocacy is needed around these options to ensure that the right
target audience is matched to right housing model or that individuals can graduate through the
system.
• There should be a set of service provider guidelines that inform the security measures added
to social housing projects. There are a variety of security measures that can be included in social
housing projects, a guideline should be developed to inform these additions. To be included within
this guideline are operating standards to deal with various security threats, this will to ensure
consistency across SHPs. The security guideline should complement the security strategy that is
being developed.
13.3. Tenanting
• To ensure financial sustainability of the SHIs, there should be a mix of low-, middle- and high-
income tenants. By adopting this approach, diversity among the income groups is generated which
allows for cross-subsidisation to occur within social housing and enables a higher income to be
generated for the SHP.
• Alternative tenure options should be available to tenants, for example tenants that go above the
income band should be allowed to stay in social housing for a defined period so that they can save
up the necessary capital needed to buy their own homes.

Page 62 of 108
13.4. Community Development Programmes
• Community development programmes should partner with existing community
organisations. CDP can benefit more than the tenants and can stand to benefit the broader
community. As such, SHPs should leverage off existing community initiatives as this will benefit
tenants as well integrate them into the community.
13.5. Longitudinal Study
• The impact of social housing should be studied longitudinally. The same tenants survey that was
used in this study should be used again with the same cohort of tenants. This will generate further data
on the tenants, measuring the changes that happen in their lives (in terms of changes in income,
household employment levels and household numbers) as well as whether how long they have stayed
in social housing or the reasons for them transitioning out of social housing.

Page 63 of 108
APPENDIX 1: REFERENCES
Bertrand, M., Luttmer, F.P, Mullainathan, S. Network and Welfare Cultures. The Quarterly Journal of Economics.
Vol. 115, No. 3:1019 – 1055.
Cabrera, L. 2014. Affordable Housing in the Urban Global South: Seeking Sustainable Solutions
Caruso, N. 2013. New Practices of Social housing from definition to recent development. Planum, The journal
of urbanism.
Cavieres, F. J. 2004. Chilean Housing Policy: A case of social and spatial exclusion.
Economic and Social Rights Centre. 2018. State of housing in Kenya: Will Government Strategy Deliver on
Social Housing. Available: https://s3-eu-west-1.amazonaws.com/s3.sourceafrica.net/documents/118447/State-
of-Housing-Book-2.pdf
Department of Human Settlements. Social & Rental Interventions: Social Housing Policy. The Nation Housing
Code. Volume 6 Available:
http://www.dhs.gov.za/sites/default/files/documents/national_housing_2009/6_Social_Rental_Interventions/3
%20Vol%206%20Social%20Housing%20Policy.pdf
Enterprise Community Partners. 2014. Impact of affordable housing on families and communities: a review of
the evidence base
Friedrichs, J.R., Galster, G. and Musterd, S., 2003. Neighbourhood effects on social opportunities: the European and American research and policy context. Housing studies, 18(6), pp.797-80
Hansson, A. G. and Lundgren, B. 2018. Defining Social Housing: A Discussion on the Suitable Criteria. Housing,
Theory and Society. DOI: 10.1080/14036096.2018.1459826
Home Guarantee Corporation. 2007. Public Housing Policies of Selected countries
Housing Vic. n.d. Social Housing. Available: https://housing.vic.gov.au/social-housing
Martens, P.J Daniel G. Chateau, D. G., Burland E. M., Finlayson, G.S., Smith, M.J.,Taylor, C.R. Brownell, M.D.,
Nickel, N.C., Katz, A., Bolton, J.M., MD, and the PATHS Equity Team. 2014. The Effect of Neighborhood
Socioeconomic Status on Education and Health Outcomes for Children Living in Social Housing. American
Journal of Public Health. Vol. 104, No, 11.
Ministry of Social Development.2018. Housing and Support Services.
Modise, Leepo, & Mtshiselwa, Ndikho. (2013). The Natives Land Act of 1913 engineered the poverty of Black
South Africans: a historico-ecclesiastical perspective. Studia Historiae Ecclesiasticae, 39(2), 359-378.
Nielsen, R.S. 2017. The Danish Social Housing Sector: Recent Changes and Future Challenges
OECD Affordable Housing Database. 2016. PH4.3 Key Characteristics of Social Rental Housing
OECD. 2017. PH4.2 Social Housing Rental Stock. OCED Affordable housing database.

Page 64 of 108
Oxley, M., M. Haffner, M. Elsinga, and H.Van der Heijden. 2010. Competition and Social Rented Housing. Housing. Theory and Society . Vol. 27. No. 4.
Peppercorn, I. & Tuffin, C. n.d. Social housing in the USA and France: Lessons from convergences and divergences.
Polak, I.M. 2006. Historical development of social housing. Nehnutel’nosti a Byvanie.64-77
Ross, L.M. & Pelletiere, D. 2014. Chile’s New Rental Housing Subsidy and its relevance to U.S. Housing Choice Voucher Program.
Ruprah, I, J. and Marcano. L. T. 2007 A meta-impact evaluation of social housing programs: The Chilean Case
Scanlon, K, Fernández A, Whitehead, M, Christine, M. E. 2015. Social housing in Europe. European Policy
Analysis .17. pp. 1-12.
The World Bank. 2014. Access to Affordable and Low-Income Housing in East Asia and the Pacific. Sustainable
Development Department East Asia and Pacific Region.
Thomson, H., and Thomas, S. 2015. Developing empirically supported theories of change for housing
investment and health. Social Science and Medicine. 124. pp. 205-214. ISSN 0277-9536
Turok, I. 1994. Urban Planning in the Transition from Apartheid: Part 1: The Legacy of Social Control. The Town
Planning Review. Vol. 64. No. 3: 243-259
United Nations: Sustainable Development Goals: Goal 11. Available: https://www.un.org/sustainabledevelopment/cities/
Wicht, Astrid. 1999. Social Housing in South Africa. A feasible option for low-income households?, paper for
University of Lund. Available: http://www.hdm.lth.se/fileadmin/hdm/alumni/papers/ad1999/ad1999-14.pdf

Page 65 of 108
APPENDIX 2: RESEARCH TOOLS
KII GUIDES
Tenant Associations
Introduction
Good day, my name is _______________, I am an evaluator from Genesis Analytics, an economics-based
advisory firm. The SHRA has commissioned us to conduct a study on the impact of social housing.
As part of this evaluation, we are seeking feedback from tenant associations on the impact social housing has
had on the tenants. You were identified as a key participant for this interview because of your role within the
tenant association.
Participation is entirely voluntary, and you are not obliged to answer any uncomfortable questions. You have
the right to withdraw at any time. All responses will be kept strictly confidential and will be anonymised in the
report.
Do you consent to be interviewed for the purposes of this study?
Social housing
1. Please can you introduce yourself. What is your role within Tenant association?
2. What is the purpose of tenant association?
Integration
3. How do the tenants interact with the community?
4. How has the presence of social housing impacted on the local area?
Investment (public and private)
5. What investment have you seen in the area since the social housing complex was established?
Probes
a. Public transport (buses and bus stops, taxi and taxi ranks)
b. Business hubs
c. Petrol stations, small stand-alone shops or shopping centres
d. Buildings being renovated/ land being developed
Improved Basic Services (triangulation)
6. How many power / water outages have there been in the last month?
• Where these planned or unplanned?
7. Does refuse removal always happen on time?

Page 66 of 108
• Have you been impacted by service delivery protests which have interrupted this service in the last month?
Property Management
8. How long does it take management to resolve your complaints about the building?
9. How much interaction do you have with the SHI/ Property Management
Close out
10. Is there anything else you would like to tell me about your SHI and its housing projects?

Page 67 of 108
Social Housing Institution (SHI)
Introduction
Good day, my name is _______________, I am an evaluator from Genesis Analytics, an economics-based
advisory firm. The SHRA has commissioned us to conduct a study on the impact of social housing.
As part of this evaluation, we are seeking feedback from Social Housing Institutions (SHIs) on the impact social
housing has had on the surrounding community. You were identified as a key participant for this interview
because of your role in the SHI.
Participation is entirely voluntary, and you are not obliged to answer any uncomfortable questions. You have
the right to withdraw at any time. All responses will be kept strictly confidential and will be anonymised in the
report.
Do you consent to be interviewed for the purposes of this study?
Social housing
1. Please can you introduce yourself by telling us about your role within the SHI?
2. What type of SHI do you work for?
• An umbrella-organisation which provides management services to smaller tenant organisations?
• A SHI which develops, owns and manages their own rental stock? • A SHI established by tenant groups or association that appoints an SHI to manage the
housing project while they remain collective owners?
3. What feasibility measure does the SHI undertake before establishing a social housing project?
• How many developments do you have? • Which are Greenfields vs refurbishments • What do you take into consideration when deciding on a new site for the establishment of an
SHP? • Have you received grant or subsidy funding to establish you SHIs?
4. Does your SHI offer community development programme?
• What is the rationale behind providing these programmes? • What type of programmes are these? • Are they well attended by tenants? • What are the outcomes of these?
5. Can you afford to maintain the SHP? Tenanting
6. How do you advertise to potential tenants?
7. Please walk us through how you select tenants?
• Do you consider factors such as their race, income bands, gender when selecting them? • Are there any other factors that are considered when selecting tenants? (such as smoker vs
non-smoker) • How long is the application process from start to finish?
8. Do tenants pay their rent and utilities on time? If not, what issues do you experience?

Page 68 of 108
9. On average how long do tenants stay in social housing for?
• How much notice does a tenant have to give before they move out of social housing
• Why do people leave social housing?
10. How long does it take you on average to resolve a tenant’s issue?
Access to utilities
11. How many water / electricity outages have there been in the past month?
• Where these planned or unplanned outages?
12. Does the refuse removal happen on time each week?
• Have you been impacted by service delivery protest which interrupt your service in the last month?
Investment (Private and Public)
13. What investment have you seen in the area since the social housing complex was established?
Probes
a. Public transport (buses and bus stops, taxi and taxi ranks)
b. Business hubs
c. Petrol stations, small stand-alone shops or shopping centres
d. Buildings being renovated/ land being developed
e. Increase in the availability of properties development in the area
f. What private investment have you seen vs public
Employment opportunities
14. What employment opportunities are created by the SHI?
• Are these in the local communities? • Are these available to tenants? • Do tenant acquire any benefits by working for the SHI?
Close out
15. Is there anything else you would like to tell me about your SHI and its housing projects?

Page 69 of 108
Municipal Management
Introduction
Good day, my name is _______________, I am an evaluator from Genesis Analytics, an economics-based
advisory firm. The SHRA has commissioned us to conduct a study on the impact of social housing
As part of this evaluation, the Genesis team is seeking feedback from municipal management on the impact
social housing has had on the community and city. You were identified as a key participant for this interview
because of your in the municipality.
Participation is entirely voluntary, and you are not obliged to answer any uncomfortable questions. You have
the right to withdraw at any time. All responses will be kept strictly confidential and will be anonymised in the
report.
Do you consent to be interviewed for the purposes of this study?
1. Please can you introduce yourself by telling us about your role within the municipal management?
Social housing
2. How many social housing establishments are there in your municipality?
• Is there a maximum number of social housing projects that are allowed in your area? If yes, why?
3. How has the municipality to contributed to the area that the SHI has been located in?
• Does the municipality have any future plans for the area?
Integration
4. Has the demographic profile of the community changed since the establishment of the social housing project?
• Please comment on what has changed: • Are there more people of a different race, income level, gender and people with disabilities
who now have access to the area? • Do you think that demographic profile area changed because of the presence of social
housing or was there another factor that contributed to this change?
Access to utilities
5. How many water / electricity outages have there been in the past month?
• Where these planned or unplanned outages and what were the causes of these?
6. Does the refuse removal happen on time each week?
Investment (Private and Public)
7. How have you had to respond to the establishment of social housing projects?
8. How has the local economy changed since the establishment of the social housing project?
Increase of local budgets

Page 70 of 108
9. How do social housing projects impact on the municipality’s finances?
10. Do the social housing projects pay rates and taxes on time?
Close out
11. Is there anything else you would like to tell me about social housing projects?

Page 71 of 108
Private Sector Investors
Introduction
Good day, my name is _______________, I am an evaluator from Genesis Analytics, an economics-based
advisory firm. The SHRA has commissioned us to conduct a study on the impact of social housing.
As part of the research for this study, we are seeking feedback from private sector organisations about their
role in urban regeneration and the economic development of cities.
Participation is entirely voluntary and you are not obliged to answer any uncomfortable questions. You have the
right to withdraw at any time. This interview will feed into the development of the case studies. Should you wish
to report anything anonymously, this will be anonymised in the general findings and excluded from the case
study.
Do you consent to be interviewed for the purposes of this study?
1. Please introduce yourself and tell us about your role in {name of institution}.
2. What is your company’s core business?
• Financier/Investment; • Property Management; • Property Developer
City Outcomes:
3. What is the nature of your investment in {name of area social housing project is located}?
• Financial only • Management of the property • Building or refurbishment of the property • Entrepreneurship programmes • Business hubs • Retail zone
4. When did your company first invest in the area?
• To establish timing in relation to SH completion date, to understand if the SH may have contributed to the decision to invest in the area.
5. What was the motivation for investing in this area?
If before completion of SH
• City Improvement District (CID); • Influx of new residents; • Business hub; • Retail hub; • Government incentive; • Identified area as an emerging local economy
If after completion of SH
• Improvement in infrastructure; • Increasing property prices; • New and growing rental market
General Perceptions of Social Housing

Page 72 of 108
6. Are you familiar with the {name of social housing project}.
If the investor entered after the SH
• Has this project had any influence over your company’s decision to invest in this area. Please advise why?
If the investor invested in the area before the SH
• Has there been any an increase in investment post the establishment of this project? Please describe / elaborate?
Tenant Outcomes
7. Has there been a change in the quality of service delivery in the area since {year social housing project was completed | if before investor entered then ask since they entered}?
• Can you elaborate on which services you’ve seen a change in? • What do you think these changes are a result of?
o The SH in the area o The area is a CID o Your company’s investment in the area o Municipal plans and improved effectiveness/efficiency thereof o Urban regeneration and related private sector investment
• Ascertain the types of improvements; • Reasons for the improvement – to determine if linked to SH or CID or general urban
regeneration (gentrification) of the area
8. Have you observed any changes in transport facilities in the area? If so, please elaborate.
• Introduction of new transport hub, routes, mechanisms(train/bus/taxi) that was not previously available in the area.
9. Have you observed any changes in crime in the area? If so, please elaborate
10. Is there anything else you would like to tell us about your view on social housing projects and how they impact on your business?

Page 73 of 108
Department of Human Settlements
Introduction
Good day, my name is _______________, I am an evaluator from Genesis Analytics, an economics-based
advisory firm. The SHRA has commissioned us to conduct a study on the impact of social housing.
As part of the research for this study, the Genesis team is seeking feedback from the Department of Human
Settlement about their role in urban regeneration and the economic development of cities.
Participation is entirely voluntary and you are not obliged to answer any uncomfortable questions. You have the
right to withdraw at any time. This interview will feed into the development of the case studies. Should you wish
to report anything anonymously, this will be anonymised in the general findings and excluded from the case
study.
Do you consent to be interviewed for the purposes of this study?
1. Please introduce yourself and tell us about your role in the Department
2. What is your involvement in/oversight function with the Social Housing Programme (SHP)?
• Determine the individual’s level of interaction with the SHP, i.e. Implementation of policy, oversight, developing policy, manging SHRA
3. To what extent have you been involved in the monitoring and/evaluation of the SHP?
• What is the individual’s role within the DHS in relation to oversight of the SHP? • Does the individual actively engage with SHP reports? • Does the individual engage directly with the management of the SHP i.e. SHRA?
City Outcomes
4. What do you understand the objectives of the SHP to be?
• Spatial, economic and social restructuring (and related indicators). • Establishing a sustainable pool of social housing for low-middle income earners. • Determine whether the individual’s understanding thereof is consistent with the policy and
objectives as articulated by SHRA.
5. Please can you describe the housing needs of the SH target market (upper end of low-income market earning between R1500 and R15000?
6. Do you think these objectives are relevant in the context of South Africa’s current housing needs?
• Are the SHP qualifying criteria relevant, i.e. income bands? This links to the DPME M&E report which stated that income bands for qualifying tenants needed to be indexed.
• Is the target market relevant – as it relates to race and gender. • Is the SHRA’s capital and institution investment strategy relevant?
7. What you understand to be the role of the SHRA?
• Ensuring common understanding of role, is important for assessing performance of SHRA and the SHP.
• How does the national policy support SHRA’s objectives? • How do national, provincial and municipal policy align?
8. What is your assessment of SHRA’s role in fulfilling its mandate?

Page 74 of 108
• Effectiveness of the implementing entity • Accreditation of SHIs • Tenant mix meet policy objectives • Well located social housing unit • Viable projects delivered • Investment plan/project pipeline
9. How does the Department of Human Settlements assess performance on the SHP?
• Links to oversight function that the DHS performs • Reports • Independent audits • Municipal reports
10. What does the department view as success within the context of the SHP?
• Spatial transformation of cities, • Local economic development • Sustainable housing for target population • Improved quality of life for Social Housing occupants (changed employment status, transport
time and cost, education and health access, personal safety at home)

Page 75 of 108
Social Housing Regulatory Authority (SHRA)
Introduction
Good day, my name is _______________, I am an evaluator from Genesis Analytics, an economics-based
advisory firm. The SHRA has commissioned us to conduct a study on the impact of social housing.
As part of the research for this study, we are seeking feedback from you about SHRA’s role in urban
regeneration and the economic development of cities.
Participation is entirely voluntary and you are not obliged to answer any uncomfortable questions. You have the
right to withdraw at any time. This interview will feed into the development of the case studies. Should you wish
to report anything anonymously, this will be anonymised in the general findings and excluded from the case
study.
Do you consent to be interviewed for the purposes of this study?
1. Please introduce yourself and tell us about your role within SHRA?
• What are your specific responsibilities as it relates to SHIs?
2. What do you understand the objectives of the Social Housing Programme (SHP) to be?
• Spatial, economic and social restructuring • Establishment of sustainable social housing for low-medium income households
Tenant Outcomes
3. How has the SHP contributed to achieving the tenant mix objectives of the policy?
• Determine if the individual understands what the tenant mix objectives are. Consistent understanding thereof is important.
• Changes in demographic profile – race, income, household structure, gender • Selection of appropriately located SH facilities
4. How has the SHP contributed to achieving social and economic objectives of the policy?
• Changes in health, education, transport costs, crime rates • Creation of job opportunities • Understand how SHRA assesses these objectives and where they source information and
what information.
5. How does SHRA ensure SHIs are meeting the needs of tenants?
• Reflect on the selection criteria that SHRA uses to select a SHI • Use of tenant survey or other data sources to determine tenant needs and how then does
SHRA evaluate the performance of SHI in relation to this?
6. How have SHIs contributed to tenant satisfaction?
• Well managed buildings that create a sense of security for tenants • Tenants have access to basic facilities, with little interruption to services • Facilities have a range of recreational facilities available to tenants
Community and City Outcomes

Page 76 of 108
7. How has SHRA contributed to sustainable social housing for low-medium income households as part of the broader housing sector
• SHRA’s role in establishing financially sustainable SHIs • How has SHRA engaged supporting institutions? (National, Provincial and Municipal human
settlements departments, NASHO, NHFC)
8. How has the SHP contributed to economic regeneration?
• Have private sector investment levels increased post the establishment of the SH? • How have public sector investment levels changed and has SHRA or the SHI play a role in
contributing to that change? • Have SHI’s created employment, either directly or indirectly? (Short term construction
employment; direct long-term employment with SHI in neighbourhood; indirect long-term employment).
• Are the SHIs earning non-residential income from commercial rentals in the area, which links to financial sustainability of the SHI.
• What changes have there been to rates and service charge payment levels to municipalities? • The above responses will have to be evidenced through other data
9. How would you assess SHRA’s objective of growing a sustainable portfolio of social housing?
• Financial: Reflect on SHRA’s funding structures (mix and quantum); Financial Viability (SHRA Indicators to be interrogated - Cash reserves, IRR, Cost to Income, Debt Service Cover, Liquidity, Solvency)
• Property Development/ Growth • Asset appreciation • Sustainable and growing portfolio mix (income, race, gender, unit size, sourcing of occupants) • Location & typology (types of buildings, unit typology, brownfields vs greenfields, non-
residential facilities and amenities provided)
10. How have other stakeholders contributed to the regeneration of cities?
• Municipalities • Private Sector • Other government departments (Transports, health, education etc)
11. How would you rate SHRA’s effectiveness in relation to?
• Accreditation of SHIs • Tenant mix meet policy objectives • Well located social housing unit • Viable projects delivered • Investment plan/project pipeline

Page 77 of 108
FGD GUIDES
Tenants FGD
Introduction
Good day, my name is _______________, and this is ________________. We are evaluators from Genesis
Analytics, an economics-based advisory firm. The SHRA has commissioned us to conduct a study on the impact
of social housing.
As part of the study, we want to understand more about your experiences living in {name of housing project}
and {name of area where project is situated}.
Participation is entirely voluntary, and you are not obliged to contribute to the conversation. You have a right to
withdraw at any time. The discussion here today will be kept confidential.
FGD RULES:
I. All phones be put on silence or switched off
II. Only one person is allowed to speak at a time
III. There are no right/wrong answers, all participants are encouraged to be as honest as they can
IV. No participant is superior – participants are encouraged to respect each other’s views. No one is allowed
to talk over anyone
Introduction of the participants
1. Please can you all introduce yourselves by telling us your name and where you lived before you moved
into {name of housing project}.
Satisfaction
2. What is it that you like about your units?
3. How have your lives changed since moving into {name of housing project} ?
4. What do you not like about the living in the {name of housing project}?
5. What would you like to change about {name of housing project}?
Community level
6. How does it feel being part of the {name of area where project is situated} community?
7. How are the services in this neighborhood?
Close out
8. Is the anything else you would like to tell us about {name of housing project}?

Page 78 of 108
Community FGD guide
Introduction of the evaluation
Good day, my name is _______________, and this is ________________. We are evaluators from Genesis
Analytics, an economics-based advisory firm. The SHRA has commissioned us to conduct a study on the impact
of social housing.
As part of the study, we want to know your views on {name of housing project} and how it affects your
community.
Participation is entirely voluntary, and you are not obliged to contribute to the conversation. You have a right to
withdraw at any time. The discussion here today will be kept confidential.
FGD RULES:
I. All phones be put on silence or switched off
II. Only one person is allowed to speak at a time
III. There are no right/wrong answers; all participants are encouraged to be as honest as they can
IV. No participant is superior – participants are encouraged to respect each other’s views. No one is allowed
to talk over anyone
Introduction of participants
1. Please can you all introduce yourselves by telling us your name and how long you have lived in {name
of area where project is situated}.
Impact on communities
2. How has the area changed since the you have lived here?
3. What is it like to live in this community?
4. How has the {name of housing project} contributed to the community?
5. How do people living in the {name of housing project} interact with the rest of the community?
6. What positive changes has the {name of housing project} caused?
7. What challenges has {name of housing project} caused?
Close out
8. Is the anything else you would like to tell us about {name of housing project} or your community?

Page 79 of 108

TENTANT SURVEY
Good day. My name is . I am interviewing residents of {name of social housing project}
as part of a research assignment that examines the impact of social housing.
As part of this study we want to find out about the changes you have experience (if any) since moving
into social housing. I am contracted by Ikapadata which is working with the Genesis Analytics and the
SHRA to collect data for the study.
We are speaking to a sample of residents who live in this social housing project and other social housing
projects across the country. The interview will take 45 minutes. Your answers will remain confidential,
so nobody will know how you personally replied.
Are you willing to be interviewed?
Name of interviewer_______________________________________
Please tick social housing project residence of the respondent
Belhar City Deep
Bothasig Gardens Tau Village
Jabulani Thembilhle Village
Roodeport Avoca Hills
Lake Haven Phase I Valley View
Housing
Outcomes Indicators Survey Questions Possible Responses
Integration
Number of adults
residing in the
residence
What is the total number
of occupants in this unit? Numeric (whole numbers only)
Asked for each resident
How old is resident #? Numeric (whole numbers only)
What is the address of
where you lived before
moving into this unit?
House number
Street Name
Suburb
City
How many people lived
in your previous
residence?
Numeric (whole numbers only)

What type of residence
did you previously live in?
House or brick structure on a
separate stand or yard
Traditional
dwelling/hut/structure made of
traditional material
Flat in a block of flats
Town/cluster/semi-detached
house (simplex, duplex, triplex)
House/flat or room in a
backyard
Informal dwelling/shack in a
backyard
Informal dwelling/shack not in
a backyard (In an informal
settlement)
Room/flat not in a backyard
but on a shared property
Caravan or tent
Workers’ hostel
Other (specify)
Race of tenants
What race does the lease holder of the household identify as?
Black
Coloured
Indian
Asian
White
Other (specify)
Prefer not to answer
Asked for each resident
What race does resident
# identify as?
Black
Coloured
Indian
Asian
White
Other (specify)

Prefer not to answer
Gender
Which of the following
best describes the gender
of the head of the
household?
Female
Male
Other (specify)
Prefer not to answer
Asked for each resident
Which of the following
best describes the gender
of resident #?
Female
Male
Other (specify)
Prefer not to answer
Is this a single parent
household?
Yes
No
Integration
Number of people
with disabilities
residing in the
residence
Asked for each resident
Does resident # have
any kind of disability?
Yes
No
Asked for each resident
who has a disability
What type/s of disability
does the person have?
Sight (blind/severe visual
limitation)
Hearing (deaf/ profoundly hard
of hearing)
Communication (speech
impairment)
Physical (needs
wheelchair/crutches etc)
Emotional
(behavioural/psychological)
Average
household
income
How many sources of
income does this
household have?
Numeric (whole numbers only)
What is the primary
source of income in this
household?
Formal employment (contract)
Informal employment (no
contract)
Own business
Social/government grant

Other
How has your disposable
income changed since
moving into social
housing ?
Increased
Stayed the same
Decreased
If the answer to above
the question is
‘increased’ or ‘stayed
the same’ then ask
What do you spend your
additional disposable
income on?
On my children
On myself
On recreational activities
Other
Home language
of tenants
Which language is
spoken most often in this
household?
Afrikaans
English
IsiNdebele
IsiXhosa
IsiZulu
Sepedi
Sesotho
Setswana
Sign language
SiSwati
Tshivenda
Xitsonga
Khoi, Nama and San
languages
Other
Predominant
language used in
the community to
communicate
with neighbours
Which language is
spoken most often in this
complex or social housing
project?
Afrikaans
English
IsiNdebele
IsiXhosa
IsiZulu
Sepedi

Sesotho
Setswana
Sign language
SiSwati
Tshivenda
Xitsonga
Khoi, Nama and San
languages
Other
Education Average distance
to schools
How many people in your
household currently
attend an educational
institution or school?
Please note that I will ask
you for some details on
each person who attends
an educational institution
or school.
Numeric
** This will inform the number of
times the following questions are
asked
Asked for each resident
attending an
educational institution
Which of the following
educational institutions
does resident # attend?
ECD centre
Creche
Pre-school
Primary school
High school
Technical vocational education
and training (TVET) colleges
Tertiary education institutions
(universities and universities of
technology)
Home-based education
Other
None of the above
Asked for each resident
attending an
educational institution
What is the name of the
educational institution?

Asked for each resident
attending an
educational institution
What is the distance from
your housing unit to this
educational institution?
Less than 5km
5km-15km
16km-30km
5km-15km
16km-30km
31km-50km
More than 51km
Average travel
time to schools /
educational
facilities
Asked for each resident
attending an
educational institution
Which of the following
modes of transport does
resident # in this
household usually use to
get to the educational
institution?
Walk
Bicycle
Motorcycle/scooter
Minibus taxi (Kombi)
Taxi (sedan)
Bus
Train
Own car/private vehicle
Vehicle hired by a group of
parents
Carpool with other tenants or
people in the community
Other (please specify)
Asked for each resident
attending an
educational institution
How long does it usually
take resident # in to get
to this educational
institution?
Less than 15 minutes
15 minutes-30 minutes
31 minutes-60 minutes
61 minutes-90 minutes
More than 90 minutes
Asked for each resident
attending an
educational institution
How much does it usually
cost resident # to get to
the educational institution
using their usual mode of
transportation per day?
Numeric Rands

Average
perception of
school quality in
relation to school
in previous
location
Asked for each resident
attending an
educational institution
Did any of the children of
this household attend a
different educational
institution when you lived
at your previous
residence?
Yes
No
(The next three
questions will be asked
when the answer to the
previous question is
‘yes’)
How does the average
quality of education in
this/these school/s
compare to the quality of
education in the previous
school/s?
Improved
No change
Worsened
Improvement in
educational
outcomes
How have the children’s
marks changed since
they started at the new
school?
Improved
No change
Worsened
Number and
nature of facilities
available at
schools in the
area
How do the facilities at
these schools compare to
the facilities at schools in
your previous area?
They have better facilities
Their facilities are the same
They have worse facilities
Number of days
absent from
school due to
poor health
Asked for each resident
attending an
educational institution
In the last year, how
many days has the
resident been absent
from school due to poor
health?
Numeric days

Access to utilities
Proportion of
residences with
access to water
at previous
residence
What was your main
source of water at your
previous residence?
Tap in the residence
Tap in the yard
Public tap
Water tank/carrier
Well
Other (please specify)
Our previous residence did not
have access to water
In an average year, how
many times was your
access to water
interrupted at your
previous residence?
Numeric (Whole numbers only)
Asked when the answer
to the previous
question is greater than
zero)
How long did these water
supply interruptions last
on average?
Less than 2 days
2-7 days
8-14 days
More than 14 days
What was your average
monthly water bill at your
previous residence?
Numeric Rands
Proportion of
households who
can afford water
What is your average
monthly water bill at this
unit?
Numeric Rands
Can you afford your
monthly water bill?
Yes
No
Proportion of
residences with
access to
Did you have electricity at
your previous residence?
Yes
No

electricity at
previous
residence
Asked when the answer
to the previous
question is ‘yes’
What was your main
source of electricity at
your previous residence?
Electricity from main switch
Electricity from generator
Solar energy
Other (please specify)
What was your average
monthly electricity bill? Numeric Rands
In an average year, how
many times was your
previous residence’s
electricity cut or
interrupted, even though
the electricity bill was
paid or sufficient pre-paid
electricity was bought?
Numeric (Whole numbers only)
Numeric Rands
Proportion of
households who
can afford
electricity
What is your average
electricity bill each
month?
Numeric (Whole numbers only)
Can you afford your
electricity bill?
Yes
No
Proportion of
residences with
access to refuse
removal at
previous
residence
Was your refuse or
rubbish removed at least
once a week at your
previous residence?
Yes
No
Number of
residences with
access to refuse
removal
What is your average
refuse removal bill each
month?
Numeric (Whole numbers only)
Can you afford your
refuse removal bill?
Yes
No

Access to
employment
opportunities
Number of
employed people
residing within
the residence
How many of the adults
who live in this unit are
employed or are self-
employed?
Numeric (whole number only)
Number of
employed people
residing within
the residence
Asked for each resident
who is employed or
self-employed
On what basis is resident
# employed?
Can select multiple
Permanently employed
Temporarily employed
Self-employed (business
owner)
Other (please specify)
Number of people
running a small
business in the
area
(Only ask this question
for self-employed
residents)
Does resident # run a
small business in the
area? (within a 5km
radius of this complex)
Yes
No
Number of
tenants that were
previously
employed (prior
to moving into the
current
residence)
Asked for each resident
who is employed or
self-employed
Was resident #
employed when you lived
at your previous
residence?
Yes
No
Number of days
absent from work
due to poor
health
Asked for each resident
who is employed or
self-employed
In the last year, how
many days has the
resident # been absent
from work due to poor
health?
Numeric days
Average distance
to tenant place of
employment
Asked for each resident
who is employed or
self-employed
Which of the following
modes of transport does
resident # usually use to
travel to work?
Walk
Bicycle
Motorcycle
Taxi
Bus

Train
Own car/private vehicle
Carpool
Other (please specify)
Asked for each resident
who is employed or
self-employed
What is the distance from
your complex to resident
# ‘s workplace?
Less than 5km
5km-15km
16km-30km
5km-15km
16km-30km
31km-50km
Above 51km
Average journey
time to tenant's
place of
employment
Asked for each resident
who is employed or
self-employed
How long does it usually
take resident # to get to
their workplace from your
unit?
Less than 15 minutes
15 minutes-30 minutes
31 minutes-60 minutes
61 minutes-90 minutes
More than 90 minutes
Asked for each resident
who is employed or
self-employed
How much does it usually
cost resident # to get to
their workplace using
their usual mode of
transportation per day?
Numeric Rands
Number of people
looking for a job
How many of the adults
who live in this unit are
unemployed and looking
for a job?
Numeric (whole number only)
Average distance
to nearest
transport facility
What is the distance from
your complex to the
nearest public transport
facility?
Less than 5km
5km-15km
16km-30km
5km-15km
16km-30km
31km-50km

Above 51km
Average journey
by foot to nearest
public transport
facility
How long does it usually
take to walk to the
nearest public transport
facility from your unit?
Numeric minutes
Security
Extent of visible
security
measures
(Security guards,
controlled
access)
Do you know where the
nearest police station is?
Yes
No
(This question will be
asked when the answer
to the previous
question is ‘yes’)
How long would it usually
take you to get to the
police station using your
usual mode of transport?
Less than 15 minutes
15 minutes-30 minutes
31 minutes-60 minutes
61 minutes-90 minutes
More than 90 minutes
How often do you see a
police officer in
uniform/on duty in your
area?
At least once a day
At least once a week
At least once a month
Never
Is there controlled access
or a security guard at
your complex?
Yes
No
Increased
emotional
security and
feeling at ease in
home
If you had to walk alone
in your area when it was
dark, how safe would you
feel?
Very safe
Safe
Unsafe
Very unsafe
If you had to walk alone
in the area you lived in
before you moved here
when it was dark, how
safe would you feel?
Very safe
Safe
Unsafe
Very unsafe
If you had to walk alone
in your area during the
Very safe
Safe

day, how safe would you
feel?
Unsafe
Very unsafe
If you had to walk alone
in the area you lived in
before you moved here
during the day, how safe
would you feel?
Very safe
Safe
Unsafe
Very unsafe
How safe do you feel in
your unit?
Very safe
Safe
Unsafe
Very unsafe
How safe did you feel in
your previous residence?
Very safe
Safe
Unsafe
Very unsafe
How safe do you feel in
your complex?
Very safe
Safe
Unsafe
Very unsafe
How safe did you feel in
your complex/Road?
Very safe
Safe
Unsafe
Very unsafe
Violent crimes
reported by the
tenant
Were you or any other
member of your
household ever a victim
of a violent crime
(involving a threat or
force) in the area you
used to live before
moving into this building?
Yes
No
Have you or any other
member of your Yes

household ever been a
victim of a violent crime
(involving a threat or
force) in the area you
currently live?
No
Property crimes
reported by the
tenant in last 12
months
Were you or any other
member of your
household ever a victim
of a property or non-
violent crime (involving
theft) in area you used to
live before moving into
this building?
Yes
No
Have you or any other
member of your
household ever been a
victim of a property or
non-violent crime
(involving theft) in the
area you currently live?
Yes
No
Satisfaction with
living conditions
Average
satisfaction level
with quality of life
Using a scale of 1-10,
where 1 means very
dissatisfied and 10
means very satisfied, how
do you feel about your life
as a whole right now
Scale 1 - 10
Satisfaction
levels with
resolution of
building
complaints to the
SHI
How satisfied are you
with the SHI’s resolution
of building complaints?
Scale 1 - 10
How satisfied are you
with the customer service
around housing
management?
Scale 1 - 10
Average
preference to
continue living in
the area
What is the most
important reason why you
moved to this area?
Affordability
It’s easy to get to work
My family lives nearby
Quality of property
Schooling/education
Security

Other
How strong is your
preference to continue
living in this area?
Strong preference to stay
Moderate preference to stay
Moderate preference to leave
Strong preference to leave
Imagine you lost a wallet
or purse in the area you
live in now, and that
contained R250 and your
contact details and it was
found by someone who
lives close by. Is it very
likely, somewhat likely or
not likely at all to be
returned with the money
in it?
Very likely
Somewhat likely
Not likely
Improved health
Average distance
to clinics and
healthcare
facilities
What is the distance from
your complex to the
nearest clinic or
healthcare facility?
Less than 5km
5km-15km
16km-30km
5km-15km
16km-30km
31km-50km
Above 51km
Average journey
time by foot for
tenants to
nearest health
facility
How long does it take you
to walk to the nearest
clinic or healthcare
facility?
Less than 15 minutes
15 minutes-30 minutes
31 minutes-60 minutes
61 minutes-90 minutes
More than 90 minutes
General Health
How would you describe
your health at present
Excellent
Very good
Good
Fair
Poor

Asked for each resident
In the last 30 days, has
the resident#
experienced any of the
following conditions?
Fever
Persistent cough
Cough with blood
Chest pain
Body ache
Headache
Back pain
Joint pain/arthritis
Diarrhoea
Painful urination
Swelling ankles
Severe weight loss
Number of people
who smoke
Asked for each resident
Does the resident#
smoke cigarettes?
Yes
No
Number of people
who have serious
health conditions
Asked for each resident
Does the resident# suffer
from any of the following
conditions?
Tuberculosis/TB
High blood pressure
Diabetes/high blood sugar
Stroke
Asthma
Heart problems
Cancer
This question will be
asked if the resident#
suffers from one or
more of the conditions
in the question above
Is the resident# taking
medication for the
condition?
Yes
No
I am going to read out a
list of ways you may
have felt or behaved in
the last week. Please
Rarely or none of the time
(less than 1 day)

state how often you
have felt this way in the
last week.
1. I was bothered by
things that don’t
usually bother me
2. I had trouble
keeping my mind
on what I was
doing
3. I felt depressed
4. I felt that everything
I did was an effort
5. I felt hopeful about
the future
6. I felt fearful
7. My sleep was
restless
8. I was happy
9. I felt lonely
10. I could not ‘get
going’
Some or little of the time (1-2
days)
Occasionally or a moderate
amount of time (3-4 days)
All or most of the time (5-7
days)
Expectations
Number of
tenants whose
expectations of
living in social
housing has been
met
Why did you move into
social housing? Open ended question
To what extent do you
agree or disagree with
the following statement:
“my expectations of this
social housing unit have
been met?”
Strongly agree
Agree
Disagree
Strongly disagree
Decreased
reliance on
social housing
Migration from
social housing to
none social
housing
What is the likelihood that
you will move from this
unit in the next two
years?
Definitely
Possibly
Unlikely
Definitely not
What would be your
reason’s for moving? Open ended question
Integration Free time
To what extent do you
agree or disagree with
the following statement: “I
have more free time since
moving to this unit?”
Strongly agree
Agree
Disagree
Strongly disagree

Social
development
programmes
Number of
tenants who take
part in social
development
programmes
Does this complex have a
social development
programme?
Yes
No
Asked if the complex
has a community
development
programme
What community
development programme
does your complex have?
Education (pre-school,
education support, adult
education, homework sessions,
parenting support, childcare)
Technology (access to
electronic technology, training in
electronic technology, radio
station)
Neighbourhood development
(food gardens, tackling crime,
adult and children’s activities)
Economic development
(Employment support, training,
financial services, small
enterprise development)
Environment (Tree planting,
recycling, energy saving)
Sport and recreation (Sports
activities, holiday clubs, common
sports facilities)
Youth work (Education,
recreation)
Health (Health awareness,
support groups)
Space provision (Community
centres, learning centres, sports
fields, meeting rooms, external
common spaces)
Asked if the complex
has a community
development
programme
Do you or anyone in this
unit take part in the social
development
programme?
Yes
No
Asked if the resident
participates in the Open ended question

social development
programme
How has your
participation in the social
development programme
impacted your life?
Recreational
facilities
Proportion of
residences with
access to
recreational
facilities within a
5km radius at
previous location
Were there any
recreational and
entertainment facilities
within a 5km radius
(walking distance) from
your previous residence?
Yes
No
Number and
nature of
recreational
facilities within a
5km radius
Are there any recreational
and entertainment
facilities within a 5km
radius (walking distance)
from your complex?
Yes
No
Tenant
satisfaction with
availability and
quality of
recreational
facilities
How satisfied are you
with the recreational and
entertainment facilities in
your area? (parks,
swimming pools, libraries,
malls etc)
Very satisfied
Satisfied
Dissatisfied
Very dissatisfied
Average journey
time by foot for
tenants to the
nearest
recreational and
entertainment
facilities
How long does it take you
to walk to the nearest
recreational and
entertainment facilities?
Less than 15 minutes
15 minutes-30 minutes
31 minutes-60 minutes
61 minutes-90 minutes
More than 90 minutes
Urban
regeneration
Improved
surrounding
building
infrastructure
What facilities are within
walking distance from
your complex?
Supermarket
Mall
Library
Public swimming pool
Gym
Public park
Sport facilities (tennis court,
basketball court)

Community centre
Clothing stores
Hair salon
Banks
Internet cafe
Filling station
Restaurant
Liquor store
None of the above
What facilities were within
walking distance from
your previous residence?
Supermarket
Mall
Library
Public swimming pool
Gym
Public park
Sport facilities (tennis court,
basketball court)
Community centre
Clothing stores
Hair salon
Banks
Internet cafe
Filling station
Restaurant
Liquor store
None of the above
Do you have street
lighting in this area?
Yes, currently in working
condition
Yes, not currently in working
condition
No
Have you seen an
improvement or Improvement

deterioration in this
community’s
infrastructure (transport
hubs, buildings, shops
etc) in the last 12
months?
No change
Deterioration
Household
expenditure
within a 5km
radius of SH
Average
household spend
on non-food
goods and
services within a
5km radius of the
SH
On average, how much
does your household
spend on non-food goods
at stores within a 5km
radius of this complex a
month? (cleaning
products, houseware,
glassware, toiletries etc)
Numeric Rands
Average
household spend
on groceries from
grocery stores
within a 5km
radius of the SH
On average, how much
does your household
spend on groceries (food
and beverages) at stores
that are within a 5km
radius of this complex a
month?
Numeric Rands
Travel
expenditure
On average, how much
does your household
spend on transport
(buses, trains, taxis,
petrol) a month?
Numeric Rands
Travel
expenditure
On average, how much
did your household spend
on transport (buses,
trains, taxis, petrol) a
month at your previous
residence?
Numeric Rands

APPENDIX 3: DATA COLLECTION
Table 7: Documents and literature reviewed
Documents from SHRA Additional literature
Viruly Consulting. (2014). A study on the Gauteng
partnership fund’s socio-economic impact on
Gauteng’s housing market.
Thomson, H and Thomas, S. (2015) Developing
empirically supported theories of change for housing
investment and health. Social Science and Medicine,
124. pp. 205-214.
Housing Development Agency. (2013). Reviving our
inner cities: social housing and urban regeneration in
South Africa
Wicht, A. (1999). Social Housing in South Africa: A
feasible option for low-income households.
Development Action Group, Cape Town, South Africa.
International Housing Solutions. (2012). A social audit
conducted on IHS residential units.
Martens, P. (2014). The effect of neighbourhood
socioeconomic status on education and health
outcomes for children living in social housing.
American Journal of Public Health, 11. pp. 2103-2109
DMPE and DHS. (2016). Impact and implementation
evaluation of the social housing programme.
Bennett, S and Muir, K. (2015). Measuring the impact
of community housing: A proposed theory of change
for community housing. Sydney. Australia. The Centre
for Social Impact.
The Presidency. (2008). Social Housing Act Enterprise Community Partners. (2014). Impact of
affordable housing on families and communities: A
review of the evidence base. Columbia, United States
of America
SHRA. (2017). State of the social housing sector
report.
Friedrichs, J. (2003). Neighbourhood effects on social
opportunities: The European and American research
and policy context. Housing Studies, 18. pp. 797-806
SHRA. (2015). State of the social housing sector
report.
FACS Analysis and Research. (2016). Measuring
Social Housing Outcomes: Desktop review of
evidence. Interim Report.
DHS. (2003). A social housing policy for South Africa:
Towards an enabling environment for social housing
development.
Datcher, L. (1982). Effects of community and family
background on achievement. The Review of
Economics and Statistics, 1. pp. 32-41
Rogers, N and Slowinski, K. (2004). Towards an
evaluation framework for urban regeneration in South
Australia, Discussion paper.
Burton, E. (2003). Housing for an urban renaissance:
Implications for social equity. Housing Studies, 18. pp.
537-562
The Social Housing Foundation. (2018). Cost-benefit
analysis: social rental housing and RDP housing.
The Urban Institute. (2000). Candidate outcome
indicators: Affordable housing program. Washington,
The United States of America
Johannesburg Development Agency. (2018). Analysis
of the impact of the JDA’s area-based regeneration
projects on private sector investments.
Zimmerman, D. (2011). Peer effects in academic
outcomes: Evidence from a natural environment. The
Review of Economics and Statistics, 1. pp. 9-23
Table 8: FGD details
Social Housing Project Date Time
Avoca Hills 2 February 2019 10:00-11:00
11:30-12:30
Belhar 8 February 2019 10:00-11:00
11:30-12:30
Scottsdene 8 February 2019 10:00-11:00
11:30-12:30
City Deep 13 February 2019 13:00-14:00
BG Alexander 16 February 2019 10:00-11:00
Lake Haven Phase 1 2 February 2019 10:00-11:00
11:30-12:30

Roodepoort 12 February 2019 16:00-17:00
Tau Village 15 February 13:00-14:00
Valley View 2 February 2019 10:00-11:00
11:30-12:30
Table 9: KII stakeholder list
Organisation Information gathered People interviewed
SHRA Tenant outcomes
Community and city outcomes
Effectiveness of SHRA
Financial sustainability of SHIs
Vincent Chauke
Arie Diephout
Rory Gallocher
SHIs Type of SHI
Financial sustainability
Relationship with SHRA
Property management
Prakshna Somai
Christopher Dyani
Meera Bhoora
Thulasizwe
Ntsoaki
Heather
Malcom
Housing managers Tenanting
Access to utilities
Investment in the area
Employment opportunities
Community development
programmes
Adam
Charity Sedise
Henry
Carl
Community organisations Impact of social housing on
communities
Internet café
Shops
Tuckshops
Fast food restaurant
Department of Human Settlements South African housing needs
Social housing objectives
Social housing M&E
Assessment of SHRA
Assessment of the success of social
housing
Bongani C Sibiya
Olana
Ahmed Vawda

Genesis Analytics (Pty) Ltd
Head office:
Physical 50 Sixth Road, Hyde Park, Johannesburg
Postal PO Box 413431, Craighall, 2024, South Africa
Telephone +2711 994 7000
Facsimile +2786 688 2247
Registration No 1998/001950/07
East Africa:
Physical 4th Floor, West Park Suites, Ojijo Road, Parklands, Nairobi
Postal 00508, Nairobi, Kenya
Telephone +254 701 945 800
Registration No P051570125T
www.genesis-analytics.com