social security · was developed by the bls to reflect the spending patterns of consumers over age...
TRANSCRIPT

SOCIAL SECURITY ADMINISTRATION BALTIMORE, MD 21235-0001
SOCIAL SECURITY
Office of the Chief Actuary
March 18, 2013
The Honorable Tom Harkin
United States Senate
Washington, D.C. 20510
Dear Senator Harkin:
I am writing in response to your request for estimates of the financial effects on Social Security
of the “Strengthening Social Security Act of 2013”, which was introduced on March 14, 2013.
This Bill includes three provisions with direct effects on Social Security benefits and tax
revenues. Enactment of these three provisions would increase benefits and extend solvency for
the Social Security program. We have enjoyed working closely with Zachary Schechter-
Steinberg of your staff in developing this proposal to meet your goals.
The enclosed tables provide estimates of the effects of the three provisions on the cost, income,
and trust fund reserves for the Old Age, Survivors, and Disability Insurance (OASDI) program,
as well as the estimated effects on retired worker benefit levels for selected hypothetical workers.
In addition, tables 1b and 1b.n reflect the Federal budget implications of the three provisions and
tables B1, B2, and B3 provide illustrations of the effects on benefit levels. We estimate that
enactment of these provisions would extend full solvency of the OASDI program for an
additional 16 years, with the projected depletion of combined OASI and DI Trust Fund reserves
moving from 2033 under current law to 2049 under the proposal. We base all estimates on the
intermediate assumptions of the 2012 Trustees Report.
The estimates and analysis provided here reflect the combined effort of many in the Office of the
Chief Actuary, but most particularly Alice Wade, Christopher Chaplain, Daniel Nickerson, Kyle
Burkhalter, Katie Sutton, and Jason Schultz.
The Bill includes the following three provisions with direct effects on the OASDI program:
1) Eliminate the taxable maximum, fully effective 2018. Phase in the elimination over 5
years by taxing all earnings above the current law taxable maximum at a rate of 2.48
percent in 2014, 4.96 percent in 2015, …, and 12.40 percent in 2018 and later. Credit the
additional earnings for benefit purposes by: (a) calculating a second average indexed
monthly earnings (“AIME+”) reflecting only earnings for each year that are above the
current law taxable maximum1, (b) applying a 5-percent factor on this newly computed
“AIME+” to compute a second primary insurance amount, (c) adding this second primary
insurance amount to the current-law primary insurance amount.
1 For years 2014 through 2017, only a portion of the earnings above the current law taxable maximum is included in
determining AIME+. The portion equals the ratio of the payroll tax rate applied during the year to the full payroll
tax rate of 12.4 percent.

2
2) Increase the first PIA bend point 15 percent above the current law level for newly eligible
beneficiaries, fully effective 2033. Phase in by increasing the first bend point 1 percent
above the current level for newly eligible beneficiaries in 2019, 2 percent for newly
eligible beneficiaries in 2020, …, and 15 percent for newly eligible beneficiaries in 2033
and later.
3) Compute the cost-of-living adjustment (COLA) using the Consumer Price Index for the
Elderly (CPI-E), effective December 2014. We estimate this new computation will
increase the annual COLA by about 0.2 percentage point, on average.
The balance of this letter provides a summary of the effects of the three provisions on the
actuarial status of the OASDI program, our understanding of the specifications and intent of each
provision, and descriptions of our detailed financial estimates for trust fund operations, benefit
levels, and implications for the federal budget.
Summary of Effects of the Proposal on OASDI Actuarial Status
Figure 1 below illustrates the expected change in the combined Old-Age and Survivors Insurance
(OASI) and Disability Insurance (DI) Trust Fund reserves, expressed as a percent of annual
program cost, assuming enactment of the three provisions of this Bill. Assuming enactment, the
OASDI program would be expected to be solvent for an additional 16 years, under the
intermediate assumptions of the 2012 Trustees Report.
Note: Trust Fund Ratio for a given year is the ratio of reserves in the combined OASI and DI Trust Funds at the
beginning of the year to the cost of the program during the year.
The level of reserves for the theoretical combined OASI and DI Trust Funds would decline from
340 percent of annual program cost at the beginning of 2012 until these reserves would become
depleted in 2049 (16 years later than projected depletion under current law). At the time of
reserve depletion in 2049, the program would be able to pay about 85 percent of then scheduled
benefits with continuing taxes (under current law, 75 percent of scheduled benefits are projected
3
to be payable in 2033 after depletion). By 2086, 81 percent of benefits scheduled under the
proposal would be payable compared to 73 percent of scheduled benefits payable under present
law.
Enactment of the three provisions of this Bill would eliminate about one-half of the long-range
OASDI actuarial deficit of 2.67 percent of taxable payroll under current law, lowering the
OASDI actuarial deficit to 1.30 percent of payroll for the long-range period.
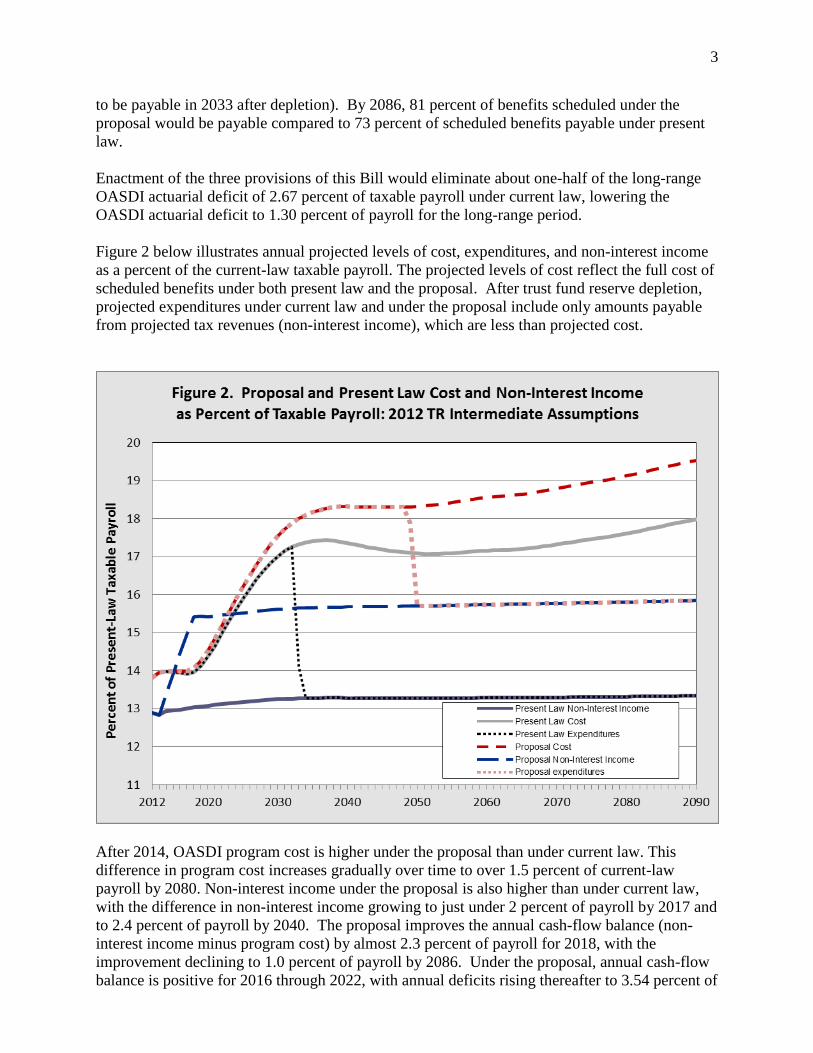
Figure 2 below illustrates annual projected levels of cost, expenditures, and non-interest income
as a percent of the current-law taxable payroll. The projected levels of cost reflect the full cost of
scheduled benefits under both present law and the proposal. After trust fund reserve depletion,
projected expenditures under current law and under the proposal include only amounts payable
from projected tax revenues (non-interest income), which are less than projected cost.
After 2014, OASDI program cost is higher under the proposal than under current law. This
difference in program cost increases gradually over time to over 1.5 percent of current-law
payroll by 2080. Non-interest income under the proposal is also higher than under current law,
with the difference in non-interest income growing to just under 2 percent of payroll by 2017 and
to 2.4 percent of payroll by 2040. The proposal improves the annual cash-flow balance (non-
interest income minus program cost) by almost 2.3 percent of payroll for 2018, with the
improvement declining to 1.0 percent of payroll by 2086. Under the proposal, annual cash-flow
balance is positive for 2016 through 2022, with annual deficits rising thereafter to 3.54 percent of

4
payroll by 2086. As a comparison, the projected annual deficit under current law is 4.50 percent
of payroll for 2086.
It is also useful to consider the projected cost, expenditures, and income for the OASDI program
expressed as a percentage of Gross Domestic Product (GDP). The graph below illustrates these
levels under both current law and the proposal.
Specification for Provisions of the Proposal
(1) Eliminate the Taxable Maximum by 2018
Under current law, payroll taxes totaling 12.4 percent apply to covered earnings in a year up to
the contribution and benefit base, or taxable maximum. This taxable maximum is $113,700 for
2013 and increases in the future in line with increases in the national average wage index (AWI).
All covered earnings subject to the payroll tax are also credited toward computation of potential
benefits as well as attainment of insured status.
Under this provision, all covered earnings in excess of the present-law taxable maximum would
be subject to some payroll tax starting in 2014. Covered earnings in excess of the maximum
would be taxed at a 2.48 percent rate in 2014, at a 4.96 percent rate in 2015, at a 7.44 percent rate
in 2016, … , and at a 12.4 percent rate in 2018 and later years. Therefore, all covered earnings
5
above and below the present-law taxable maximum would be taxed at the full 12.4 percent
payroll tax rate for 2018 and later.
Under this provision as modified, the primary insurance amount (PIA) would be determined in
two components. The first component would be computed exactly as under current law, based
on the average indexed monthly earnings (AIME), restricted to earnings at the level of the
current-law contribution and benefit base ($113,700 for 2013) for each year. The second
component of the PIA would be computed using the “AIME+.” The AIME+ would be computed
exactly like the AIME, except that annual earnings amounts used would be restricted to just the
excess amount taxable (if any) over the current-law contribution and benefit base for each year.2
The second component of PIA would be 5 percent of AIME+ for benefits in 2015 and later.
This provision alone is estimated to reduce the long-range OASDI actuarial deficit by 2.11
percent of taxable payroll and to reduce the annual deficit for the 75th
projection year (2086) by
2.21 percent of payroll.
(2) Modify the First PIA Bend Point
Under current law, any portion of the AIME that is below the first PIA bend point is multiplied
by a factor of 0.90 in computing the PIA. The first bend point is increased (indexed) by the
increase in the AWI. This provision would increase the level of the first PIA bend point, from
the level that would apply in the absence of this provision, by 1 percent for individuals newly
eligible for benefits in 2019, 2 percent for 2020, …, and 15 percent for individuals newly eligible
for benefits in 2033 and all subsequent years.
This provision alone is estimated to increase the long-range OASDI actuarial deficit by 0.37
percent of taxable payroll and to increase the annual deficit for the 75th
projection year (2086) by
0.71 percent of payroll.
(3) Base the COLA on CPI for the Elderly
The OASDI automatic cost of living adjustment (COLA) that applies for benefit increases after
the year of initial benefit eligibility is currently based on the increase in the Consumer Price
Index for Urban Wage Earners and Clerical Workers (CPI-W). The CPI-W was the only CPI
series produced by the Bureau of Labor Statistics (BLS) when the COLA was enacted into law in
1972. The CPI-W computes price increases for a broad market basket of goods and services from
month to month, with revisions to the weights in the market basket every two years reflecting the
distribution of expenditures by urban wage earners and clerical workers.
Under this provision, effective December 2014, the Social Security COLA would be based on
changes in the Consumer Price Index for the Elderly (CPI-E), rather than the CPI-W. The CPI-E
was developed by the BLS to reflect the spending patterns of consumers over age 62. Elderly
consumers spend relatively more on health and housing. We assume that using the CPI-E would
result in an average annual COLA of 3.0 percent per year, which is 0.2 percentage point higher
than the average annual increase assumed in the 2012 Trustees Report for the CPI-W. Our
assumption that the average annual increase in the CPI-E will be 0.2 percentage point greater
2 For years 2014 through 2017, only a portion of the earnings above the current law taxable maximum is included
for determining AIME+. The portion equals the ratio of the payroll tax rate applied during the year to the full
payroll tax rate of 12.4 percent.
6
than the CPI-W is based on analysis of the historical increases for the CPI-W and the CPI-E, the
difference in component weights for these two series, and our assumptions about the future
relative levels of average annual increase in these components.
This provision alone is estimated to increase the long-range OASDI actuarial deficit by 0.37
percent of taxable payroll and to increase the annual deficit for the 75th
projection year (2086) by
0.51 percent of payroll.
Detailed Financial Results for the Provisions of the Proposal
Summary Results by Provision
Table A provides estimates of the effects on the OASDI long-range actuarial balance for each of
the three provisions of the proposal separately and on a combined basis. Summary estimates are
also provided for the effect on the annual balance (the difference between income rate and the
cost rate, expressed as a percent of present-law taxable payroll) for the 75th
projection year,
2086.
Benefit Illustrations
Tables B1 and B2 provide illustrative examples of the projected change in benefit levels under
the three provisions for beneficiaries retiring at age 65 in future years at five selected earnings
levels, with selected numbers of years of work. The “Maximum-AIME Steady Earner” is
assumed to have earnings at ages 22 through 64 that equal the present-law taxable maximum
level (equivalent to $113,700 in 2013). As a result, the provision to increase the taxable
maximum does not affect benefit levels illustrated in these tables. Table B3 provides additional
important information on characteristics of the illustrative retiring workers.
Table B1 compares the initial benefit levels assuming retirement at age 65 under the basic
provisions of the proposal to both scheduled and payable present-law benefit levels. Future
retirees would have three COLAs based on the CPI-E at age 65 so their expected benefit levels
would be about 0.6 percentage point higher than under current law based on this provision alone.
The change in the first PIA bend point would increase the basic benefit level (PIA) for all
beneficiaries with career-average indexed monthly earnings (AIME) above the current-law first
bend point, and would increase benefits by the same dollar amount for all beneficiaries whose
AIME is 15 percent or more above the current-law first bend point. The large majority of retired
workers have AIMEs at least 15 percent above the current-law first bend point (nearly 90
percent), including all of the illustrative cases in these tables. Therefore, the percentage increase
in benefits for this provision is largest for the very-low-AIME illustrative worker and is lowest
for the maximum-AIME worker. The final two columns of this table show the level of
scheduled benefits under the proposal as a percentage of present law scheduled and present law
payable benefits, respectively. In the final column, no percentage is provided for years after
2048 because scheduled benefits under the proposal would not be fully payable.
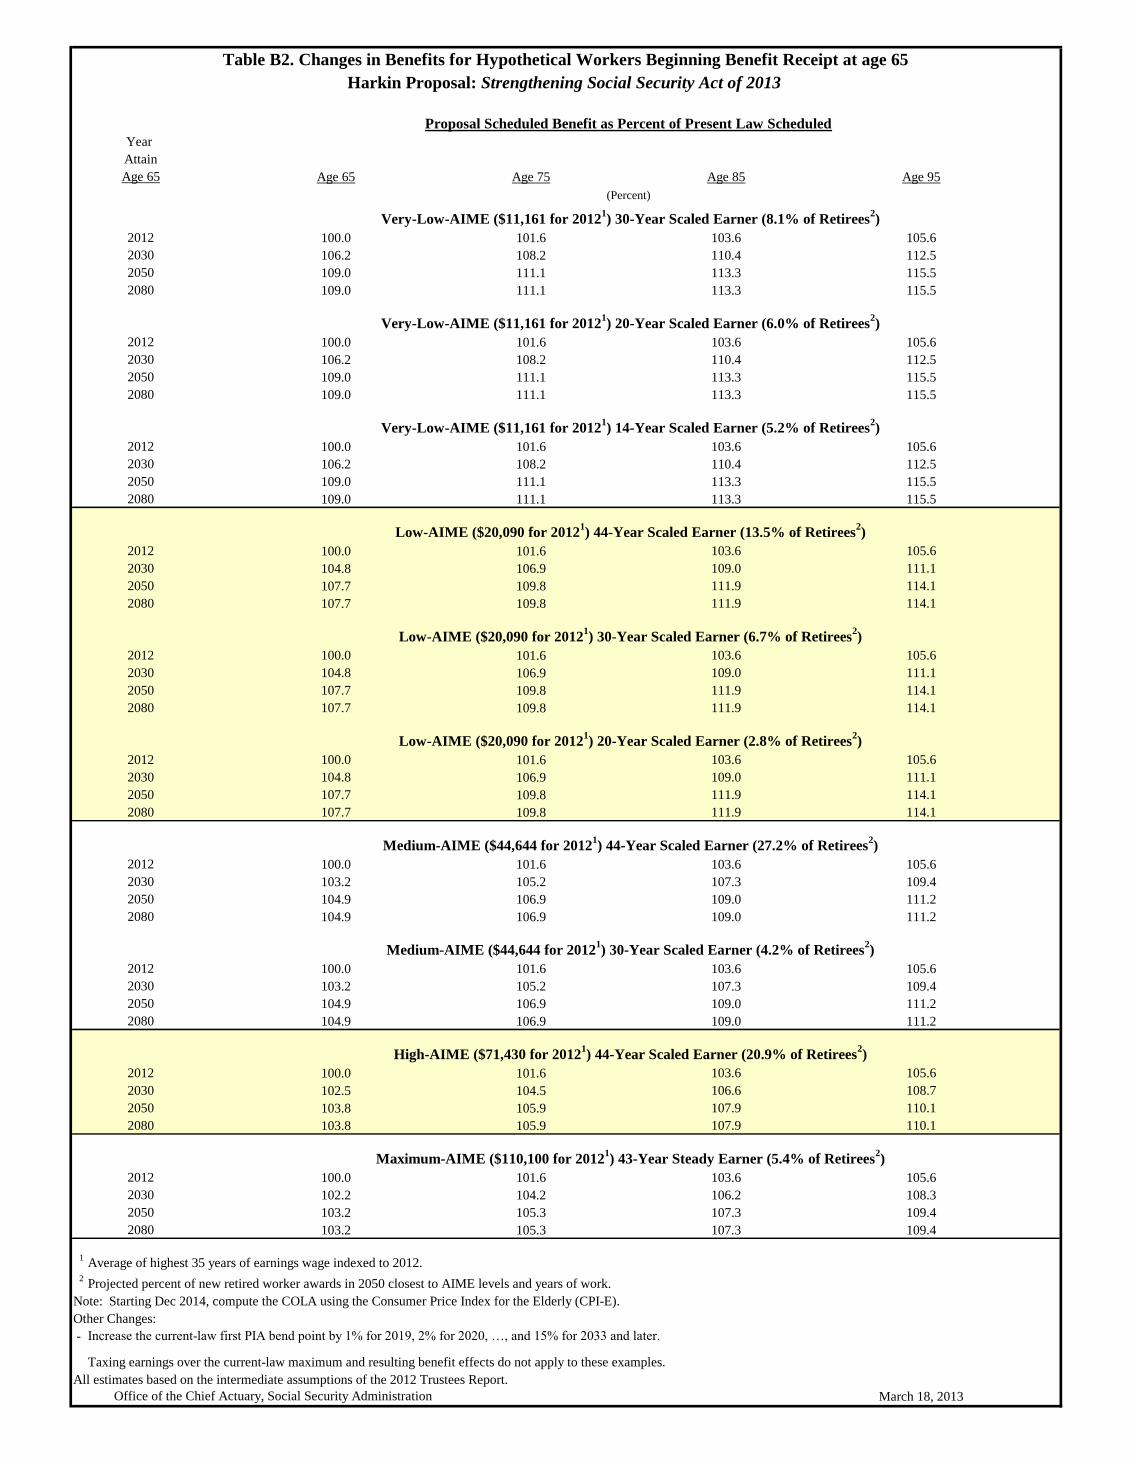
Table B2 compares the change in scheduled benefit levels at ages 65, 75, 85, and 95 under the
proposal to scheduled benefits under present law, assuming retirement at age 65. Table B2 shows
that projected scheduled benefits under the provisions of this proposal increase in relation to

7
present-law scheduled benefits between ages 65 and 95, because the provision to use the CPI-E
for calculating the COLA has a positive cumulative effect as beneficiaries age.
The hypothetical workers represented in these tables reflect average career-earnings patterns of
workers who started receiving retirement benefits under the Social Security program in recent
years. The tables subdivide workers with very low and low career-average earnings levels by
their numbers of years of non-zero earnings.
Table B3 provides information helpful in interpreting the benefit illustrations in tables B1 and
B2. Percentages in Table B3 are based on tabulations from a 10-percent sample of newly-
entitled retired workers in 2007. Table B3 displays the percentages of these newly-entitled
retired workers in 2007 that are closest to each of the illustrative examples and are:
1) “Dually Entitled”, meaning they received a higher spouse or widow(er) benefit based on
the career earnings of their husband or wife,
2) “WEP” (Windfall Elimination Provision), meaning that they received a reduced benefit
due to having a pension based on earnings that were not covered under the OASDI
program (primarily certain government workers), and they had less than 30 years of
substantial earnings that were taxable under the OASDI program,
3) “Foreign Born”, meaning that they entered the Social Security coverage area after birth
(and generally after entering working ages), and
4) “All Others”, meaning they had none of the three characteristics listed above.
The extent to which retired-worker beneficiaries represented by each of the illustrative examples
has any of the characteristics listed above (dually entitled, WEP, foreign born) is important
because such individuals are less dependent on the OASDI benefit that relates to their own
career-average earnings level.
Trust Fund Operations
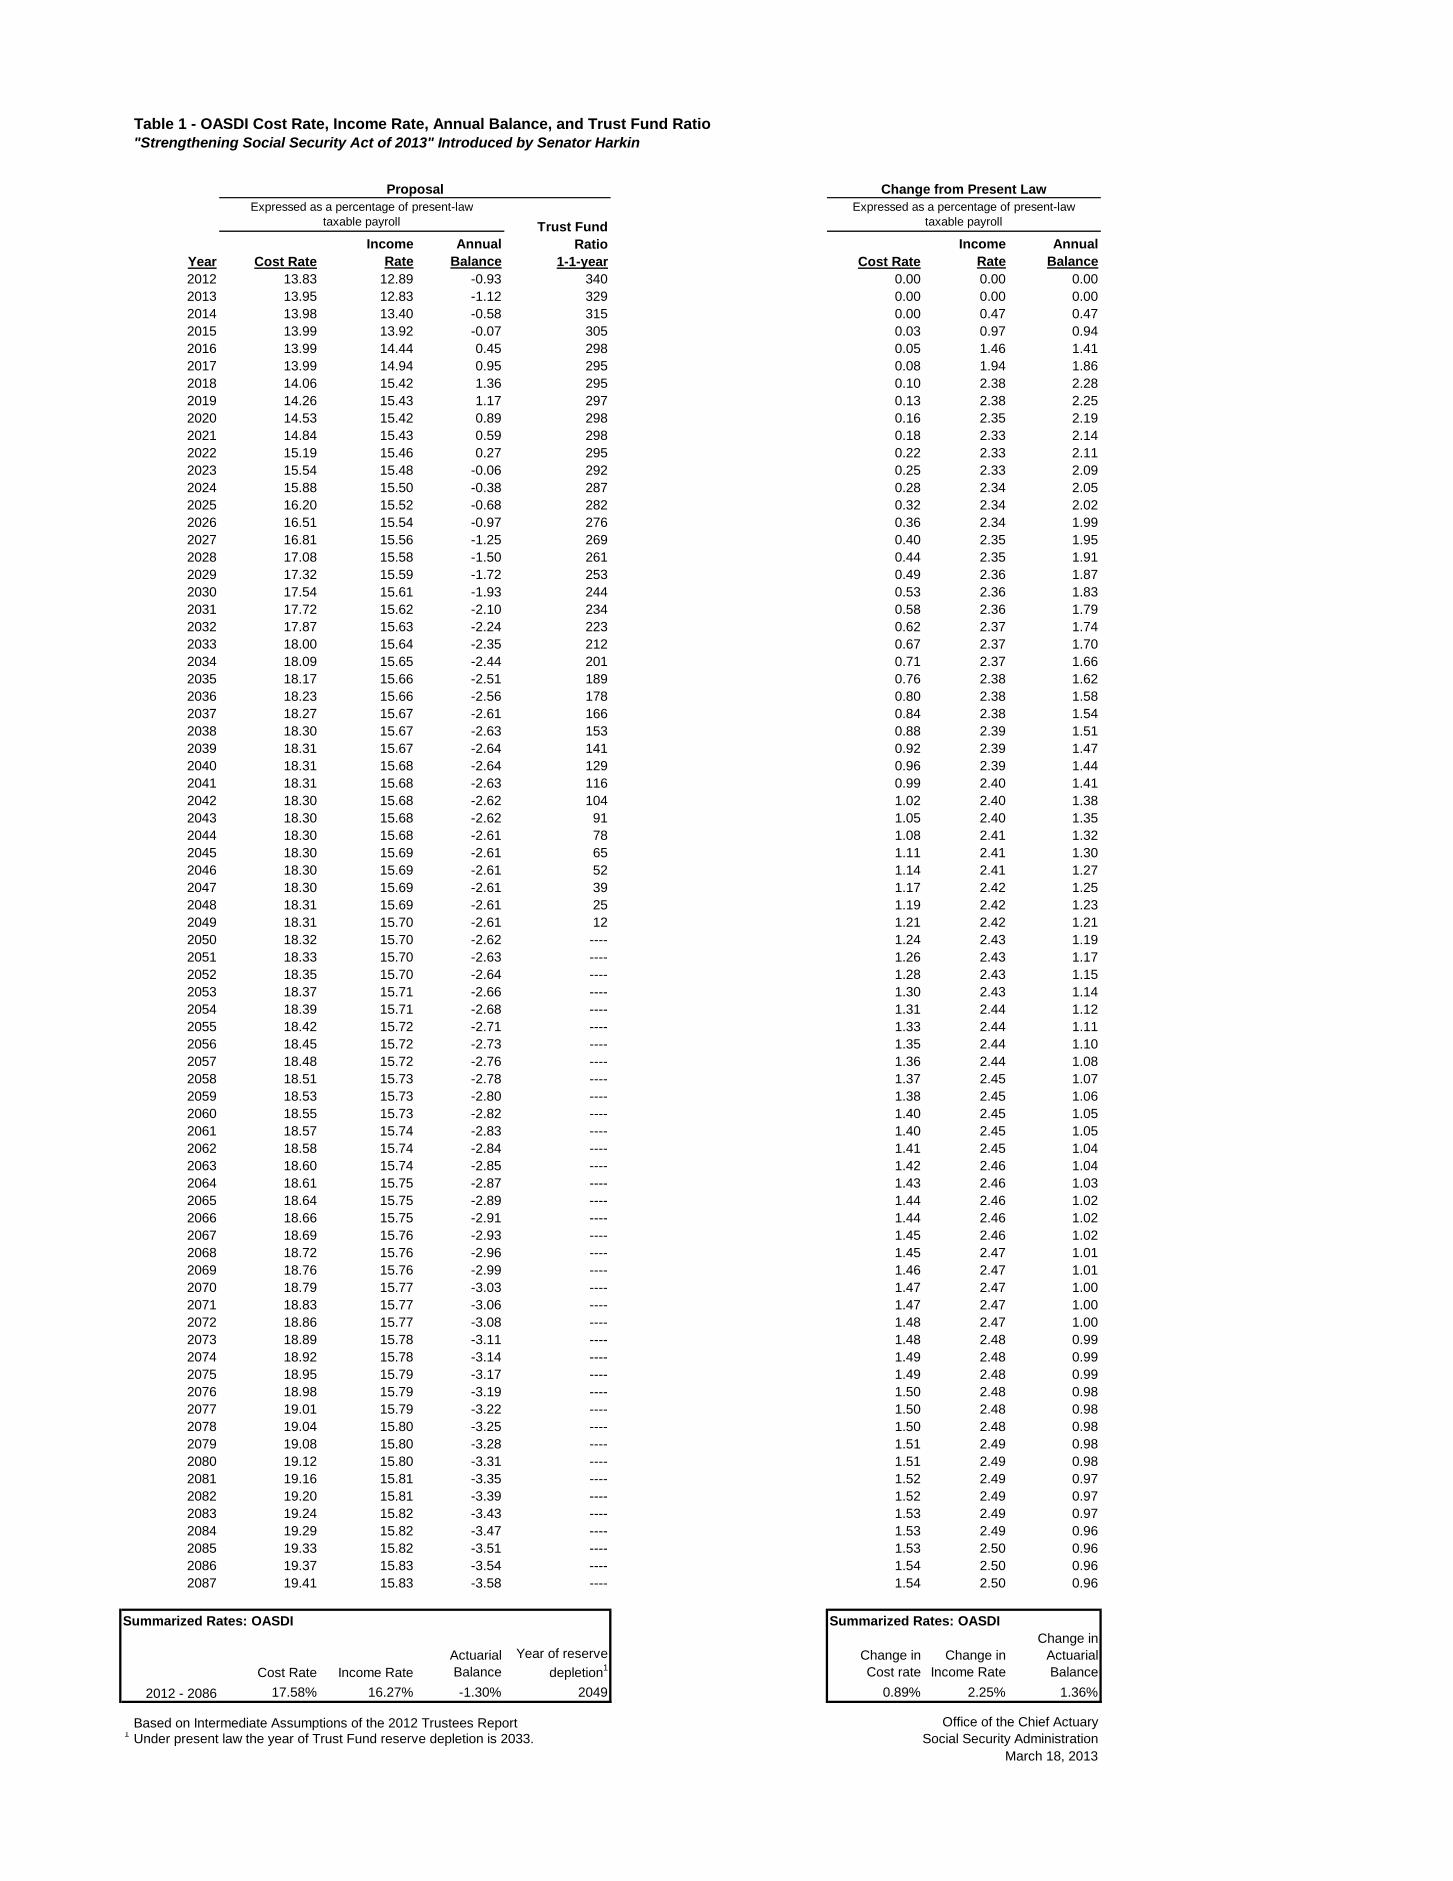
Table 1 shows the annual cost and income rates, annual balances, and trust fund ratios (reserves
as percent of annual program cost) for OASDI assuming enactment of the three basic Social
Security provisions of the proposal. This table also shows the change from present law in these
cost rates, income rates, and balances. Included at the bottom of this table are summarized rates
for the 75-year (long-range) period.
Table 1 indicates that the OASDI program is projected to be solvent for an additional 16 years
assuming enactment of the three provisions. The year in which the combined reserves of the
OASI and DI Trust Funds are projected to deplete would change from 2033 under current law to
2049 under the proposal. Even after depletion of the trust fund reserves, however, the actuarial
status of the program is improved as continuing income would be sufficient to pay a higher
percentage of scheduled benefits than under current law. Under current law, 75 percent of
benefits are projected to be payable at trust fund reserve depletion in 2033, declining to 73
percent payable by 2086. Under this proposal, 100 percent of the proposed (higher) scheduled
benefits would be fully payable through 2048, and 85 percent would be payable at trust fund
reserve depletion late in 2049, declining to 81 percent payable by 2086.
The actuarial deficit for the OASDI program over the 75-year projection period is reduced by
1.36 percent of taxable payroll, from an actuarial deficit of 2.67 percent of payroll under current
law to an actuarial deficit estimated at 1.30 percent of taxable payroll under the proposal.
8
We project annual balances (annual income rate minus annual cost rate) to become positive for
years 2016 through 2022 under the proposal and to be negative thereafter. Annual deficits
(negative annual balances) after 2022 are projected to be smaller than the deficits projected under
current law by 0.96 percentage points or more through 2086.
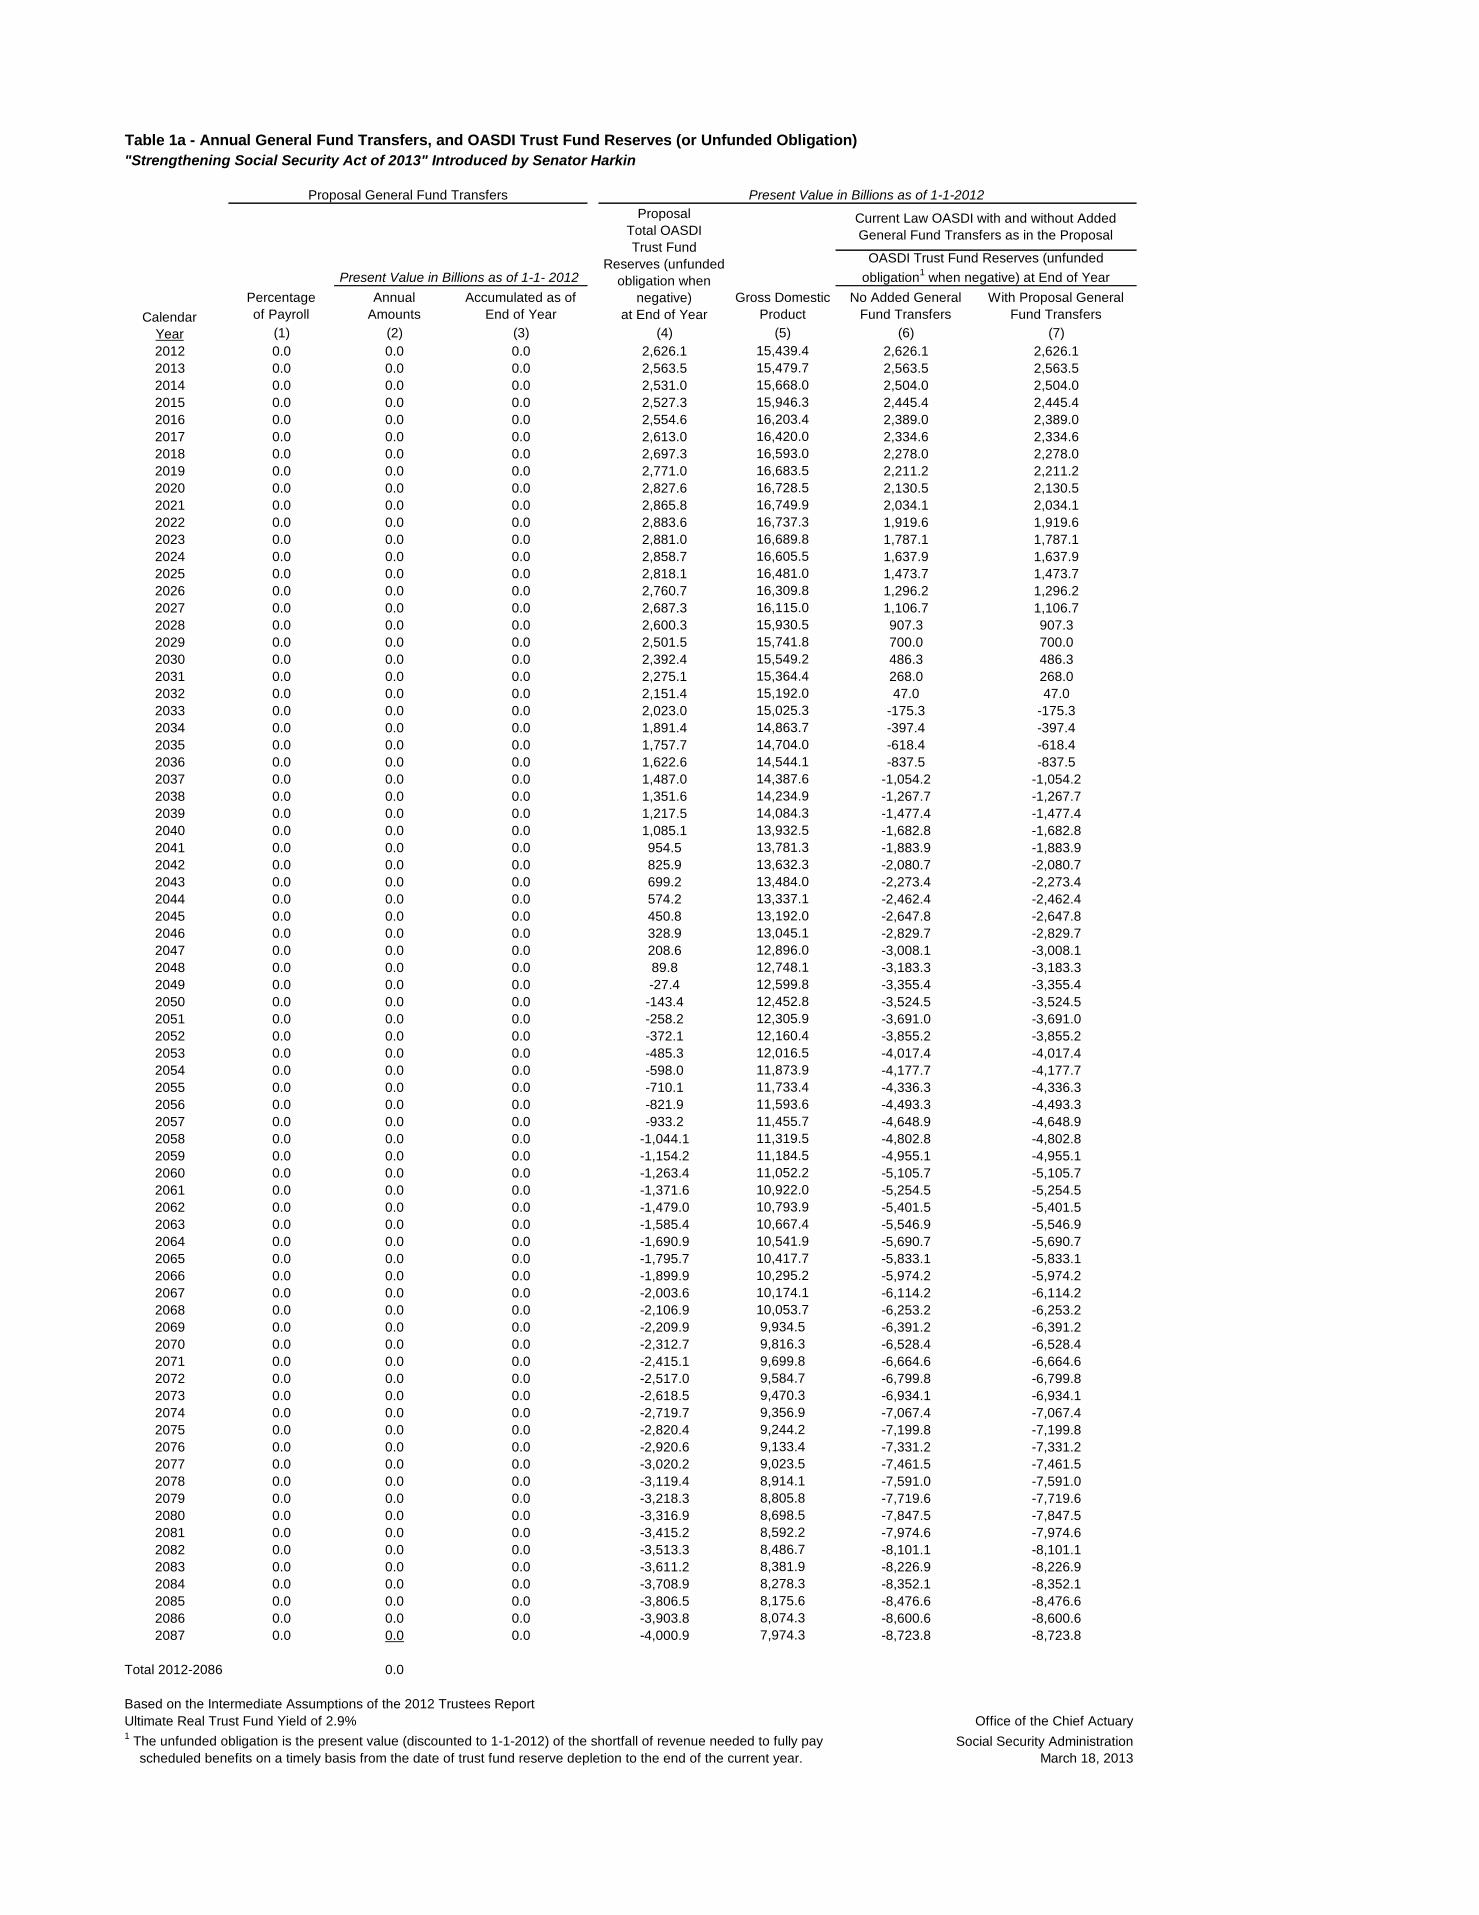
Program Transfers and Trust Fund Reserves
Column 4 of Table 1a provides a projection of the level of reserves for the theoretical combined
OASI and DI Trust Funds under the basic Social Security provisions of the proposal, expressed
in present value dollars discounted to January 1, 2012. The table indicates that the basic
provisions include no new specified transfers of general revenue to the trust funds. For purpose
of comparison, the OASDI Trust Fund reserves, expressed in present value dollars, are also
shown for the current-law Social Security program both without the added general fund transfers
(if any) provided under the proposal (column 6) and with the proposal added transfers (column
7). Note that negative values in columns 4, 6, and 7 represent the “unfunded obligation” for the
program through the year. The unfunded obligation is the present value of the shortfall of
revenue needed to pay full scheduled benefits on a timely basis from the date of trust fund
reserve depletion to the end of the indicated year. Gross Domestic Product (GDP), expressed in
present value dollars, is shown in column 5 for comparison with other values in the table.
Effect of the Basic Social Security Provisions on the Federal Budget
Table 1b shows the projected effect, in present value discounted dollars, on the Federal budget
(unified-budget and on-budget) cash flows and balances, assuming enactment of the three basic
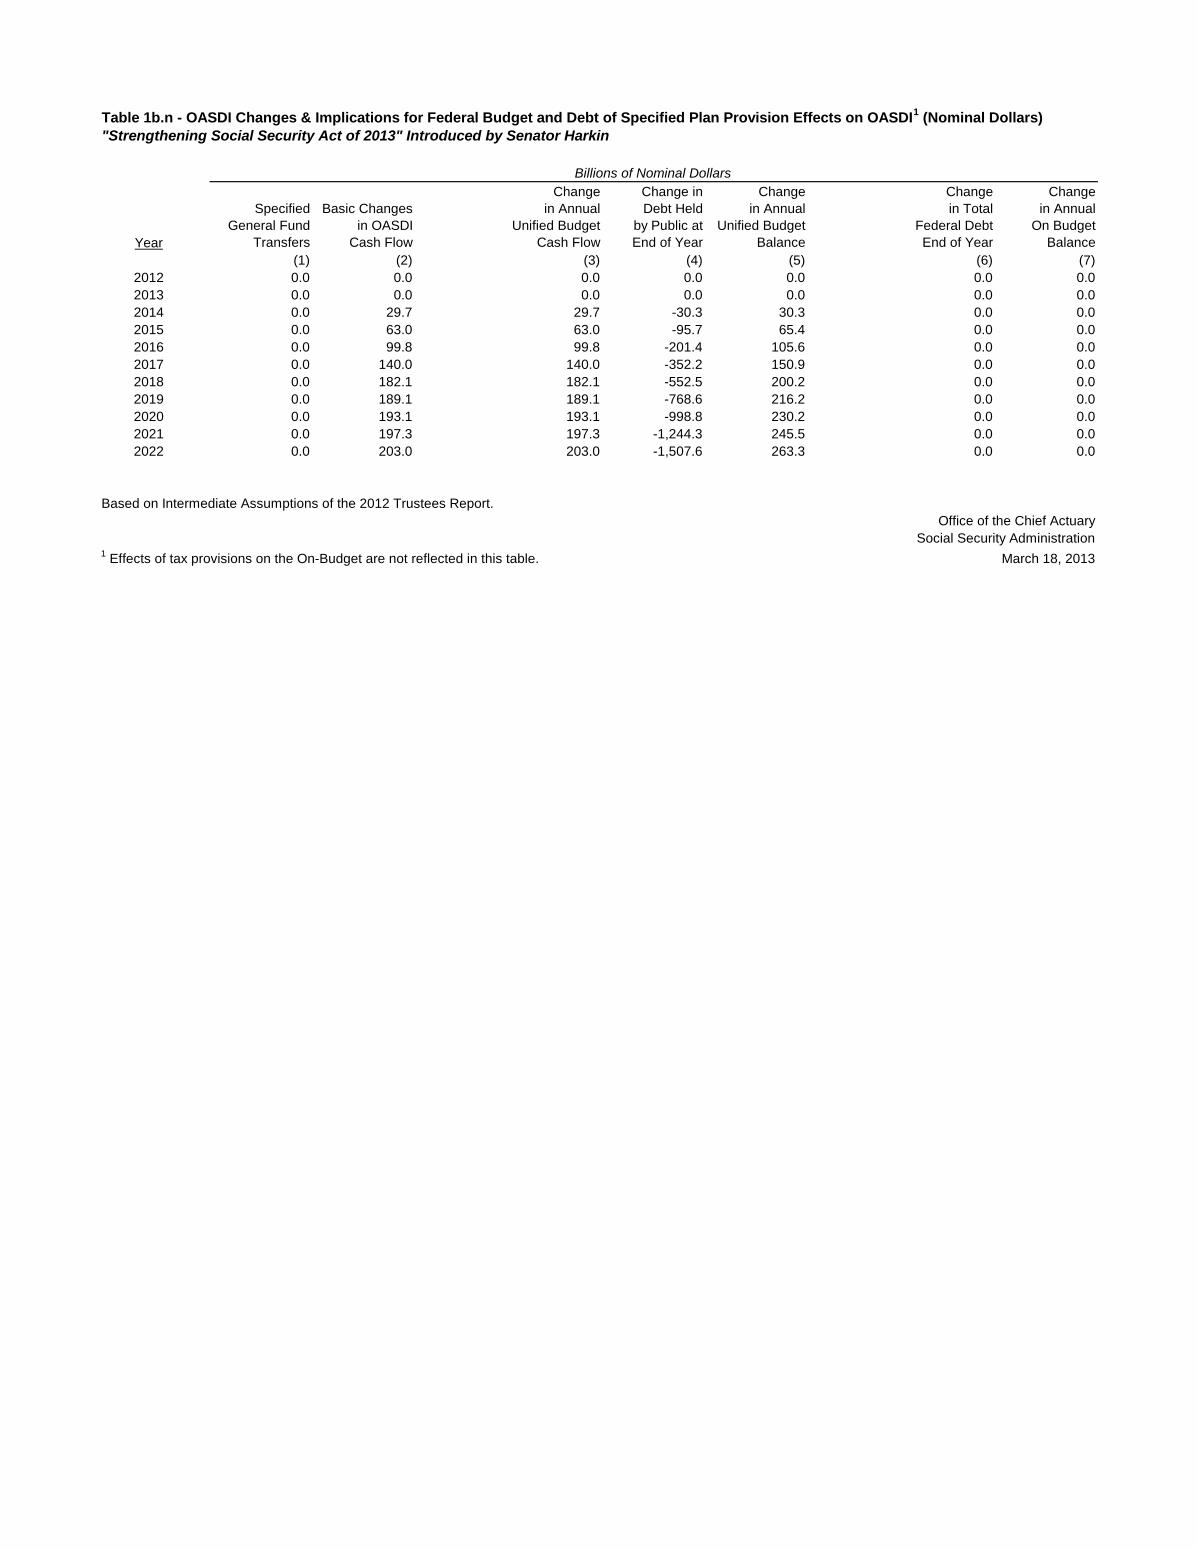
Social Security provisions of this proposal. Table 1b.n provides the estimated nominal dollar
effect of enactment of the three basic provisions of the proposal on the annual budget balances
for years 2012 through 2022. All values in these tables represent the amount of the change from
the level projected under current law.
The effect of the three basic Social Security provisions on unified budget cash flow (column 3) is
expected to be positive starting for 2014, reflecting the gradual application of the payroll tax to
earnings above the current-law taxable maximum amount.
Column 4 of Table 1b indicates that the projected effect of implementing the three basic Social
Security provisions is a reduction, starting in 2014, of the Federal debt held by the public,
reaching about $4.7 trillion in present value by 2086. Column 5 provides the projected effect of
the basic Social Security provisions on the annual unified budget balances, including both the
cash flow effect in column 3 and the additional interest on the accumulated debt indicated in
column 4. Columns 6 and 7 indicate that the basic Social Security provisions of this proposal
would have no expected direct effects on the on-budget cash flow, or on the total Federal debt, in
the future.
It is important to note that these estimates are based on the intermediate assumptions of the 2012
Trustees Report and thus are not consistent with estimates made by the Office of Budget and
Management or the Congressional Budget Office based on their assumptions.

9
Annual Trust Fund Operations as a Percent of GDP
Table 1c provides annual cost, annual expenditures (on a payable basis), and annual tax income
for the OASDI program expressed as a percentage of GDP. These values are shown for both
present law and assuming enactment of the three basic Social Security provisions of the Bill.
Showing the annual trust fund flows as a percent of GDP provides an additional perspective on
these trust fund operations in relation to the total value of goods and services produced in the
United States. The relationship between income and cost is similar when expressed as a percent
of GDP to that when expressed as a percent of taxable payroll (see Table 1).
Effects on Trust Fund Reserves and Unfunded Obligations
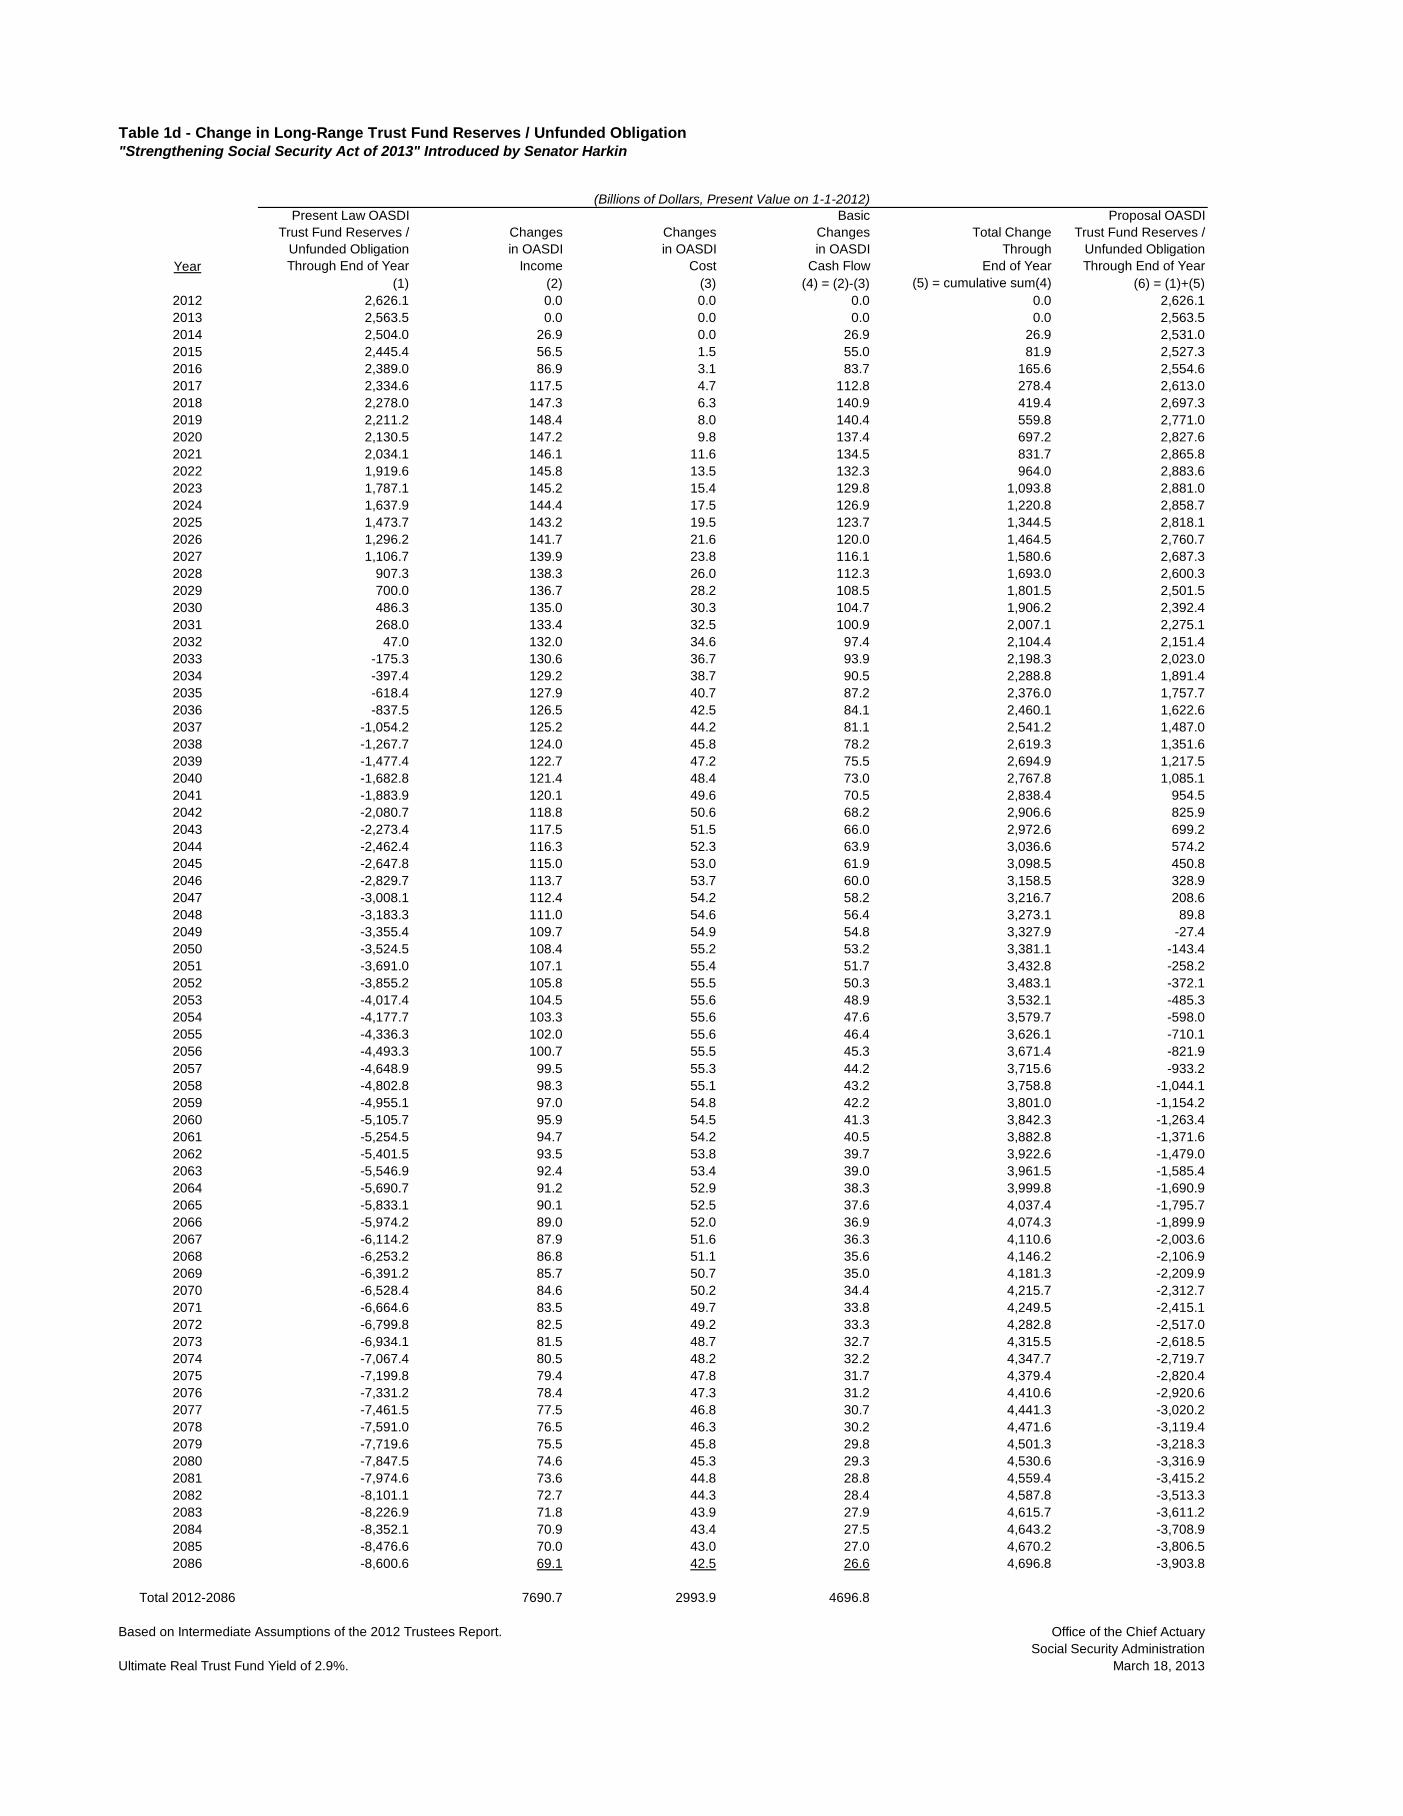
Table 1d provides estimates of the changes due to enactment of the three basic Social Security
provisions of this Bill in the level of projected trust fund reserves for years prior to trust fund
reserve depletion and the level of unfunded obligations for years after trust fund reserve
depletion. All values in the table are expressed in present-value discounted dollars. For the 75-
year (long-range) period as a whole, the present-law unfunded obligation of $8.6 trillion in
present value is reduced to an unfunded obligation of $3.9 trillion in present value. This $4.7
trillion change equals the following:
A $7.7 trillion increase in revenue (column 2), primarily from additional payroll tax
but also reflecting additional taxation of benefits revenues arising from increased
aggregate benefit levels, minus
A $3.0 trillion increase in cost (column 3), from basing the COLA on the CPI-E, from
increasing the first PIA bend point, and from additional benefits for those with
earnings above the present-law taxable maximum.
We hope these estimates will be helpful. Please let me know if we may provide further
assistance.
Sincerely,
Stephen C. Goss
Chief Actuary
Enclosures
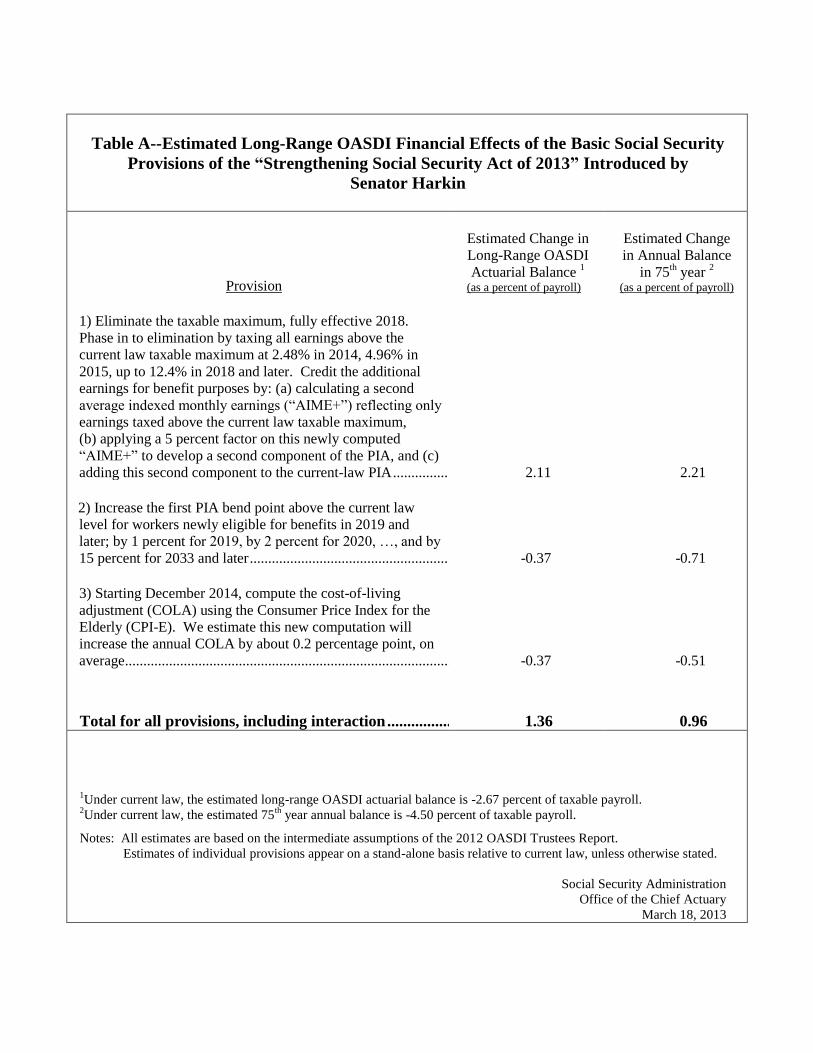
Table A--Estimated Long-Range OASDI Financial Effects of the Basic Social Security
Provisions of the “Strengthening Social Security Act of 2013” Introduced by
Senator Harkin
Provision
Estimated Change in Long-Range OASDI
Actuarial Balance 1
(as a percent of payroll)
Estimated Change in Annual Balance
in 75th year
2 (as a percent of payroll)
1) Eliminate the taxable maximum, fully effective 2018.
Phase in to elimination by taxing all earnings above the
current law taxable maximum at 2.48% in 2014, 4.96% in
2015, up to 12.4% in 2018 and later. Credit the additional
earnings for benefit purposes by: (a) calculating a second
average indexed monthly earnings (“AIME+”) reflecting only
earnings taxed above the current law taxable maximum,
(b) applying a 5 percent factor on this newly computed
“AIME+” to develop a second component of the PIA, and (c)
adding this second component to the current-law PIA ........................................................ 2.11 2.21 2) Increase the first PIA bend point above the current law
level for workers newly eligible for benefits in 2019 and
later; by 1 percent for 2019, by 2 percent for 2020, …, and by
15 percent for 2033 and later ............................................................................................................. -0.37 -0.71 3) Starting December 2014, compute the cost-of-living
adjustment (COLA) using the Consumer Price Index for the
Elderly (CPI-E). We estimate this new computation will
increase the annual COLA by about 0.2 percentage point, on
average ........................................................................................................................................................... -0.37 -0.51
Total for all provisions, including interaction .......................................................................... 1.36 0.96
1Under current law, the estimated long-range OASDI actuarial balance is -2.67 percent of taxable payroll.
2Under current law, the estimated 75
th year annual balance is -4.50 percent of taxable payroll.
Notes: All estimates are based on the intermediate assumptions of the 2012 OASDI Trustees Report.
Estimates of individual provisions appear on a stand-alone basis relative to current law, unless otherwise stated.
Social Security Administration
Office of the Chief Actuary
March 18, 2013

Year
Attain Benefit
Age 65 (Wage-Indexed (CPI-Indexed COLA4
Formula5 Total Scheduled Payable
2012 Dollars) 2012 Dollars)
2012 678 678 0.0 0.0 0.0 100 100
2030 602 790 0.6 5.5 6.2 106 106
2050 602 989 0.6 8.3 9.0 109 -
2080 602 1,361 0.6 8.3 9.0 109 -
2012 678 678 0.0 0.0 0.0 100 100
2030 602 790 0.6 5.5 6.2 106 106
2050 602 989 0.6 8.3 9.0 109 -
2080 602 1,361 0.6 8.3 9.0 109 -
2012 678 678 0.0 0.0 0.0 100 100
2030 602 790 0.6 5.5 6.2 106 106
2050 602 989 0.6 8.3 9.0 109 -
2080 602 1,361 0.6 8.3 9.0 109 -
2012 886 886 0.0 0.0 0.0 100 100
2030 787 1,034 0.6 4.2 4.8 105 105
2050 788 1,294 0.6 7.1 7.7 108 -
2080 788 1,781 0.6 7.0 7.7 108 -
2012 886 886 0.0 0.0 0.0 100 100
2030 787 1,034 0.6 4.2 4.8 105 105
2050 788 1,294 0.6 7.1 7.7 108 -
2080 788 1,781 0.6 7.0 7.7 108 -
2012 886 886 0.0 0.0 0.0 100 100
2030 787 1,034 0.6 4.2 4.8 105 105
2050 788 1,294 0.6 7.1 7.7 108 -
2080 788 1,781 0.6 7.0 7.7 108 -
2012 1,460 1,460 0.0 0.0 0.0 100 100
2030 1,297 1,704 0.6 2.6 3.2 103 103
2050 1,299 2,133 0.6 4.3 4.9 105 -
2080 1,299 2,934 0.6 4.3 4.9 105 -
2012 1,460 1,460 0.0 0.0 0.0 100 100
2030 1,297 1,704 0.6 2.6 3.2 103 103
2050 1,299 2,133 0.6 4.3 4.9 105 -
2080 1,299 2,934 0.6 4.3 4.9 105 -
2012 1,936 1,936 0.0 0.0 0.0 100 100
2030 1,719 2,258 0.6 1.9 2.5 103 103
2050 1,721 2,827 0.6 3.2 3.8 104 -
2080 1,721 3,888 0.6 3.2 3.8 104 -
2012 2,311 2,311 0.0 0.0 0.0 100 100
2030 2,102 2,761 0.6 1.6 2.2 102 102
2050 2,102 3,453 0.6 2.6 3.2 103 -
2080 2,098 4,740 0.6 2.6 3.2 103 -
1Average of highest 35 years of earnings wage indexed to 2012.
2Projected percent of new retired worker awards in 2050 closest to AIME levels and years of work.
3After the trust fund reserves deplete under present law, continuing taxes are expected to be enough to pay about three fourths of scheduled benefits.
4
5Increase the current-law first PIA bend point by 1% for 2019, 2% for 2020, …, and 15% for 2033 and later.
Taxing earnings over the current-law maximum and resulting benefit effects do not apply to these examples.
All estimates based on the intermediate assumptions of the 2012 Trustees Report.
Low-AIME ($20,090 for 20121) 20-Year Scaled Earner (2.8% of Retirees
2)
Medium-AIME ($44,644 for 20121) 44-Year Scaled Earner (27.2% of Retirees
2)
Medium-AIME ($44,644 for 20121) 30-Year Scaled Earner (4.2% of Retirees
2)
Maximum-AIME ($110,100 for 20121) 43-Year Steady Earner (5.4% of Retirees
2)
Starting in Dec 2014, compute the COLA using the Consumer Price Index for the Elderly (CPI-E).
Office of the Chief Actuary, Social Security Administration March 18, 2013
Monthly Benefits3 Percent of Present Law:
High-AIME ($71,430 for 20121) 44-Year Scaled Earner (20.9% of Retirees
2)
(Percent change) (Percents)
Very-Low-AIME ($11,161 for 20121) 30-Year Scaled Earner (8.1% of Retirees
2)
Very-Low-AIME ($11,161 for 20121) 20-Year Scaled Earner (6.0% of Retirees
2)
Very-Low-AIME ($11,161 for 20121) 14-Year Scaled Earner (5.2% of Retirees
2)
Low-AIME ($20,090 for 20121) 44-Year Scaled Earner (13.5% of Retirees
2)
Low-AIME ($20,090 for 20121) 30-Year Scaled Earner (6.7% of Retirees
2)
Table B1. Changes in Benefits for Hypothetical Workers Beginning Benefit Receipt at age 65
Harkin Proposal: Strengthening Social Security Act of 2013
Scheduled Benefit Level Percent Change at age 65
Present Law Scheduled Proposal Scheduled Benefit
Year
Attain
Age 65 Age 65 Age 75 Age 85 Age 95
2012 100.0 101.6 103.6 105.6
2030 106.2 108.2 110.4 112.5
2050 109.0 111.1 113.3 115.5
2080 109.0 111.1 113.3 115.5
2012 100.0 101.6 103.6 105.6
2030 106.2 108.2 110.4 112.5
2050 109.0 111.1 113.3 115.5
2080 109.0 111.1 113.3 115.5
2012 100.0 101.6 103.6 105.6
2030 106.2 108.2 110.4 112.5
2050 109.0 111.1 113.3 115.5
2080 109.0 111.1 113.3 115.5
2012 100.0 101.6 103.6 105.6
2030 104.8 106.9 109.0 111.1
2050 107.7 109.8 111.9 114.1
2080 107.7 109.8 111.9 114.1
2012 100.0 101.6 103.6 105.6
2030 104.8 106.9 109.0 111.1
2050 107.7 109.8 111.9 114.1
2080 107.7 109.8 111.9 114.1
2012 100.0 101.6 103.6 105.6
2030 104.8 106.9 109.0 111.1
2050 107.7 109.8 111.9 114.1
2080 107.7 109.8 111.9 114.1
2012 100.0 101.6 103.6 105.6
2030 103.2 105.2 107.3 109.4
2050 104.9 106.9 109.0 111.2
2080 104.9 106.9 109.0 111.2
2012 100.0 101.6 103.6 105.6
2030 103.2 105.2 107.3 109.4
2050 104.9 106.9 109.0 111.2
2080 104.9 106.9 109.0 111.2
2012 100.0 101.6 103.6 105.6
2030 102.5 104.5 106.6 108.7
2050 103.8 105.9 107.9 110.1
2080 103.8 105.9 107.9 110.1
2012 100.0 101.6 103.6 105.6
2030 102.2 104.2 106.2 108.3
2050 103.2 105.3 107.3 109.4
2080 103.2 105.3 107.3 109.4
1Average of highest 35 years of earnings wage indexed to 2012.
2Projected percent of new retired worker awards in 2050 closest to AIME levels and years of work.
Note: Starting Dec 2014, compute the COLA using the Consumer Price Index for the Elderly (CPI-E).
Other Changes:
- Increase the current-law first PIA bend point by 1% for 2019, 2% for 2020, …, and 15% for 2033 and later.
Taxing earnings over the current-law maximum and resulting benefit effects do not apply to these examples.
All estimates based on the intermediate assumptions of the 2012 Trustees Report.
Office of the Chief Actuary, Social Security Administration March 18, 2013
High-AIME ($71,430 for 20121) 44-Year Scaled Earner (20.9% of Retirees
2)
Maximum-AIME ($110,100 for 20121) 43-Year Steady Earner (5.4% of Retirees
2)
Medium-AIME ($44,644 for 20121) 44-Year Scaled Earner (27.2% of Retirees
2)
Medium-AIME ($44,644 for 20121) 30-Year Scaled Earner (4.2% of Retirees
2)
Very-Low-AIME ($11,161 for 20121) 30-Year Scaled Earner (8.1% of Retirees
2)
Very-Low-AIME ($11,161 for 20121) 20-Year Scaled Earner (6.0% of Retirees
2)
Very-Low-AIME ($11,161 for 20121) 14-Year Scaled Earner (5.2% of Retirees
2)
Low-AIME ($20,090 for 20121) 44-Year Scaled Earner (13.5% of Retirees
2)
Table B2. Changes in Benefits for Hypothetical Workers Beginning Benefit Receipt at age 65
Harkin Proposal: Strengthening Social Security Act of 2013
Proposal Scheduled Benefit as Percent of Present Law Scheduled
(Percent)
Low-AIME ($20,090 for 20121) 30-Year Scaled Earner (6.7% of Retirees
2)
Low-AIME ($20,090 for 20121) 20-Year Scaled Earner (2.8% of Retirees
2)

Category Dually Entitled2
WEP3
Foreign Born All Others4
Very-Low-AIME ($11,161 for 20121):
30-Year Scaled Earner (9.3% of Retirees) 47 6 11 40
20-Year Scaled Earner (5.8% of Retirees) 38 16 21 31
14-Year Scaled Earner (5.3% of Retirees) 22 21 45 20
Low-AIME ($20,090 for 20121):
44-Year Scaled Earner (13.1% of Retirees) 15 2 6 78
30-Year Scaled Earner (5.9% of Retirees) 16 9 18 59
20-Year Scaled Earner (3.1% of Retirees) 10 23 35 37
Medium-AIME ($44,644 for 20121):
44-Year Scaled Earner (23.0% of Retirees) 1 1 5 93
30-Year Scaled Earner (4.4% of Retirees) 1 8 26 67
High-AIME ($71,430 for 20121):
44-Year Scaled Earner (20.5% of Retirees) 0 0 6 93
Maximum-AIME ($110,100 for 20121):
Steady Earner (9.4% of Retirees) 0 0 7 93
1Average of highest 35 years of earnings wage indexed to 2012.
2
3Covered by pension from government employment and are subject to the windfall elimination provision (WEP).
4Neither foreign born, subject to WEP, or dually entitled.
April 23, 2012
Under current law, entitled to an additional benefit based on someone else's account. The dually entitled percent is a minimum value. Some beneficiaries that are not currently
dually entitled could become dually entitled in the future.
Office of the Chief Actuary, Social Security Administration
Table B3. Important Characteristics of Hypothetical Workers in 2007
Percent of Beneficiaries Within Each Category That Are:
Note 1: Percents based on tabulations of a 10-percent sample of newly entitled retired-worker beneficiaries in 2007 (169,725 records). We can be 95 percent confident that each of
the values shown above is within 1.4 percentage points of the value we would find using 100 percent of the retirees in 2007.
Note 2: The sum of the percentages for each category (sum across rows) could be greater than 100 percent because some beneficiaries can be classified in more than one of the
following groups: dually entitled, WEP, and foreign born.
"Strengthening Social Security Act of 2013" Introduced by Senator Harkin
Year Cost Rate
Income
Rate
Annual
Balance Cost Rate
Income
Rate
Annual
Balance
2012 13.83 12.89 -0.93 340 0.00 0.00 0.00
2013 13.95 12.83 -1.12 329 0.00 0.00 0.00
2014 13.98 13.40 -0.58 315 0.00 0.47 0.47
2015 13.99 13.92 -0.07 305 0.03 0.97 0.94
2016 13.99 14.44 0.45 298 0.05 1.46 1.41
2017 13.99 14.94 0.95 295 0.08 1.94 1.86
2018 14.06 15.42 1.36 295 0.10 2.38 2.28
2019 14.26 15.43 1.17 297 0.13 2.38 2.25
2020 14.53 15.42 0.89 298 0.16 2.35 2.19
2021 14.84 15.43 0.59 298 0.18 2.33 2.14
2022 15.19 15.46 0.27 295 0.22 2.33 2.11
2023 15.54 15.48 -0.06 292 0.25 2.33 2.09
2024 15.88 15.50 -0.38 287 0.28 2.34 2.05
2025 16.20 15.52 -0.68 282 0.32 2.34 2.02
2026 16.51 15.54 -0.97 276 0.36 2.34 1.99
2027 16.81 15.56 -1.25 269 0.40 2.35 1.95
2028 17.08 15.58 -1.50 261 0.44 2.35 1.91
2029 17.32 15.59 -1.72 253 0.49 2.36 1.87
2030 17.54 15.61 -1.93 244 0.53 2.36 1.83
2031 17.72 15.62 -2.10 234 0.58 2.36 1.79
2032 17.87 15.63 -2.24 223 0.62 2.37 1.74
2033 18.00 15.64 -2.35 212 0.67 2.37 1.70
2034 18.09 15.65 -2.44 201 0.71 2.37 1.66
2035 18.17 15.66 -2.51 189 0.76 2.38 1.62
2036 18.23 15.66 -2.56 178 0.80 2.38 1.58
2037 18.27 15.67 -2.61 166 0.84 2.38 1.54
2038 18.30 15.67 -2.63 153 0.88 2.39 1.51
2039 18.31 15.67 -2.64 141 0.92 2.39 1.47
2040 18.31 15.68 -2.64 129 0.96 2.39 1.44
2041 18.31 15.68 -2.63 116 0.99 2.40 1.41
2042 18.30 15.68 -2.62 104 1.02 2.40 1.38
2043 18.30 15.68 -2.62 91 1.05 2.40 1.35
2044 18.30 15.68 -2.61 78 1.08 2.41 1.32
2045 18.30 15.69 -2.61 65 1.11 2.41 1.30
2046 18.30 15.69 -2.61 52 1.14 2.41 1.27
2047 18.30 15.69 -2.61 39 1.17 2.42 1.25
2048 18.31 15.69 -2.61 25 1.19 2.42 1.23
2049 18.31 15.70 -2.61 12 1.21 2.42 1.21
2050 18.32 15.70 -2.62 ---- 1.24 2.43 1.19
2051 18.33 15.70 -2.63 ---- 1.26 2.43 1.17
2052 18.35 15.70 -2.64 ---- 1.28 2.43 1.15
2053 18.37 15.71 -2.66 ---- 1.30 2.43 1.14
2054 18.39 15.71 -2.68 ---- 1.31 2.44 1.12
2055 18.42 15.72 -2.71 ---- 1.33 2.44 1.11
2056 18.45 15.72 -2.73 ---- 1.35 2.44 1.10
2057 18.48 15.72 -2.76 ---- 1.36 2.44 1.08
2058 18.51 15.73 -2.78 ---- 1.37 2.45 1.07
2059 18.53 15.73 -2.80 ---- 1.38 2.45 1.06
2060 18.55 15.73 -2.82 ---- 1.40 2.45 1.05
2061 18.57 15.74 -2.83 ---- 1.40 2.45 1.05
2062 18.58 15.74 -2.84 ---- 1.41 2.45 1.04
2063 18.60 15.74 -2.85 ---- 1.42 2.46 1.04
2064 18.61 15.75 -2.87 ---- 1.43 2.46 1.03
2065 18.64 15.75 -2.89 ---- 1.44 2.46 1.02
2066 18.66 15.75 -2.91 ---- 1.44 2.46 1.02
2067 18.69 15.76 -2.93 ---- 1.45 2.46 1.02
2068 18.72 15.76 -2.96 ---- 1.45 2.47 1.01
2069 18.76 15.76 -2.99 ---- 1.46 2.47 1.01
2070 18.79 15.77 -3.03 ---- 1.47 2.47 1.00
2071 18.83 15.77 -3.06 ---- 1.47 2.47 1.00
2072 18.86 15.77 -3.08 ---- 1.48 2.47 1.00
2073 18.89 15.78 -3.11 ---- 1.48 2.48 0.99
2074 18.92 15.78 -3.14 ---- 1.49 2.48 0.99
2075 18.95 15.79 -3.17 ---- 1.49 2.48 0.99
2076 18.98 15.79 -3.19 ---- 1.50 2.48 0.98
2077 19.01 15.79 -3.22 ---- 1.50 2.48 0.98
2078 19.04 15.80 -3.25 ---- 1.50 2.48 0.98
2079 19.08 15.80 -3.28 ---- 1.51 2.49 0.98
2080 19.12 15.80 -3.31 ---- 1.51 2.49 0.98
2081 19.16 15.81 -3.35 ---- 1.52 2.49 0.97
2082 19.20 15.81 -3.39 ---- 1.52 2.49 0.97
2083 19.24 15.82 -3.43 ---- 1.53 2.49 0.97
2084 19.29 15.82 -3.47 ---- 1.53 2.49 0.96
2085 19.33 15.82 -3.51 ---- 1.53 2.50 0.96
2086 19.37 15.83 -3.54 ---- 1.54 2.50 0.96
2087 19.41 15.83 -3.58 ---- 1.54 2.50 0.96
Cost Rate Income Rate
Actuarial
Balance
Change in
Cost rate
Change in
Income Rate
Change in
Actuarial
Balance
17.58% 16.27% -1.30% 2049 0.89% 2.25% 1.36%
1Under present law the year of Trust Fund reserve depletion is 2033.
Table 1 - OASDI Cost Rate, Income Rate, Annual Balance, and Trust Fund Ratio
Proposal
Expressed as a percentage of present-law
taxable payroll Trust Fund
Ratio
1-1-year
Expressed as a percentage of present-law
taxable payroll
Change from Present Law
Year of reserve
depletion1
Summarized Rates: OASDI
Based on Intermediate Assumptions of the 2012 Trustees Report
March 18, 2013
Summarized Rates: OASDI
2012 - 2086
Office of the Chief Actuary
Social Security Administration
"Strengthening Social Security Act of 2013" Introduced by Senator Harkin
Percentage
of Payroll
Annual
Amounts
Accumulated as of
End of Year
Gross Domestic
Product
No Added General
Fund Transfers
With Proposal General
Fund Transfers
(1) (2) (3) (4) (5) (6) (7)
2012 0.0 0.0 0.0 2,626.1 15,439.4 2,626.1 2,626.1
2013 0.0 0.0 0.0 2,563.5 15,479.7 2,563.5 2,563.5
2014 0.0 0.0 0.0 2,531.0 15,668.0 2,504.0 2,504.0
2015 0.0 0.0 0.0 2,527.3 15,946.3 2,445.4 2,445.4
2016 0.0 0.0 0.0 2,554.6 16,203.4 2,389.0 2,389.0
2017 0.0 0.0 0.0 2,613.0 16,420.0 2,334.6 2,334.6
2018 0.0 0.0 0.0 2,697.3 16,593.0 2,278.0 2,278.0
2019 0.0 0.0 0.0 2,771.0 16,683.5 2,211.2 2,211.2
2020 0.0 0.0 0.0 2,827.6 16,728.5 2,130.5 2,130.5
2021 0.0 0.0 0.0 2,865.8 16,749.9 2,034.1 2,034.1
2022 0.0 0.0 0.0 2,883.6 16,737.3 1,919.6 1,919.6
2023 0.0 0.0 0.0 2,881.0 16,689.8 1,787.1 1,787.1
2024 0.0 0.0 0.0 2,858.7 16,605.5 1,637.9 1,637.9
2025 0.0 0.0 0.0 2,818.1 16,481.0 1,473.7 1,473.7
2026 0.0 0.0 0.0 2,760.7 16,309.8 1,296.2 1,296.2
2027 0.0 0.0 0.0 2,687.3 16,115.0 1,106.7 1,106.7
2028 0.0 0.0 0.0 2,600.3 15,930.5 907.3 907.3
2029 0.0 0.0 0.0 2,501.5 15,741.8 700.0 700.0
2030 0.0 0.0 0.0 2,392.4 15,549.2 486.3 486.3
2031 0.0 0.0 0.0 2,275.1 15,364.4 268.0 268.0
2032 0.0 0.0 0.0 2,151.4 15,192.0 47.0 47.0
2033 0.0 0.0 0.0 2,023.0 15,025.3 -175.3 -175.3
2034 0.0 0.0 0.0 1,891.4 14,863.7 -397.4 -397.4
2035 0.0 0.0 0.0 1,757.7 14,704.0 -618.4 -618.4
2036 0.0 0.0 0.0 1,622.6 14,544.1 -837.5 -837.5
2037 0.0 0.0 0.0 1,487.0 14,387.6 -1,054.2 -1,054.2
2038 0.0 0.0 0.0 1,351.6 14,234.9 -1,267.7 -1,267.7
2039 0.0 0.0 0.0 1,217.5 14,084.3 -1,477.4 -1,477.4
2040 0.0 0.0 0.0 1,085.1 13,932.5 -1,682.8 -1,682.8
2041 0.0 0.0 0.0 954.5 13,781.3 -1,883.9 -1,883.9
2042 0.0 0.0 0.0 825.9 13,632.3 -2,080.7 -2,080.7
2043 0.0 0.0 0.0 699.2 13,484.0 -2,273.4 -2,273.4
2044 0.0 0.0 0.0 574.2 13,337.1 -2,462.4 -2,462.4
2045 0.0 0.0 0.0 450.8 13,192.0 -2,647.8 -2,647.8
2046 0.0 0.0 0.0 328.9 13,045.1 -2,829.7 -2,829.7
2047 0.0 0.0 0.0 208.6 12,896.0 -3,008.1 -3,008.1
2048 0.0 0.0 0.0 89.8 12,748.1 -3,183.3 -3,183.3
2049 0.0 0.0 0.0 -27.4 12,599.8 -3,355.4 -3,355.4
2050 0.0 0.0 0.0 -143.4 12,452.8 -3,524.5 -3,524.5
2051 0.0 0.0 0.0 -258.2 12,305.9 -3,691.0 -3,691.0
2052 0.0 0.0 0.0 -372.1 12,160.4 -3,855.2 -3,855.2
2053 0.0 0.0 0.0 -485.3 12,016.5 -4,017.4 -4,017.4
2054 0.0 0.0 0.0 -598.0 11,873.9 -4,177.7 -4,177.7
2055 0.0 0.0 0.0 -710.1 11,733.4 -4,336.3 -4,336.3
2056 0.0 0.0 0.0 -821.9 11,593.6 -4,493.3 -4,493.3
2057 0.0 0.0 0.0 -933.2 11,455.7 -4,648.9 -4,648.9
2058 0.0 0.0 0.0 -1,044.1 11,319.5 -4,802.8 -4,802.8
2059 0.0 0.0 0.0 -1,154.2 11,184.5 -4,955.1 -4,955.1
2060 0.0 0.0 0.0 -1,263.4 11,052.2 -5,105.7 -5,105.7
2061 0.0 0.0 0.0 -1,371.6 10,922.0 -5,254.5 -5,254.5
2062 0.0 0.0 0.0 -1,479.0 10,793.9 -5,401.5 -5,401.5
2063 0.0 0.0 0.0 -1,585.4 10,667.4 -5,546.9 -5,546.9
2064 0.0 0.0 0.0 -1,690.9 10,541.9 -5,690.7 -5,690.7
2065 0.0 0.0 0.0 -1,795.7 10,417.7 -5,833.1 -5,833.1
2066 0.0 0.0 0.0 -1,899.9 10,295.2 -5,974.2 -5,974.2
2067 0.0 0.0 0.0 -2,003.6 10,174.1 -6,114.2 -6,114.2
2068 0.0 0.0 0.0 -2,106.9 10,053.7 -6,253.2 -6,253.2
2069 0.0 0.0 0.0 -2,209.9 9,934.5 -6,391.2 -6,391.2
2070 0.0 0.0 0.0 -2,312.7 9,816.3 -6,528.4 -6,528.4
2071 0.0 0.0 0.0 -2,415.1 9,699.8 -6,664.6 -6,664.6
2072 0.0 0.0 0.0 -2,517.0 9,584.7 -6,799.8 -6,799.8
2073 0.0 0.0 0.0 -2,618.5 9,470.3 -6,934.1 -6,934.1
2074 0.0 0.0 0.0 -2,719.7 9,356.9 -7,067.4 -7,067.4
2075 0.0 0.0 0.0 -2,820.4 9,244.2 -7,199.8 -7,199.8
2076 0.0 0.0 0.0 -2,920.6 9,133.4 -7,331.2 -7,331.2
2077 0.0 0.0 0.0 -3,020.2 9,023.5 -7,461.5 -7,461.5
2078 0.0 0.0 0.0 -3,119.4 8,914.1 -7,591.0 -7,591.0
2079 0.0 0.0 0.0 -3,218.3 8,805.8 -7,719.6 -7,719.6
2080 0.0 0.0 0.0 -3,316.9 8,698.5 -7,847.5 -7,847.5
2081 0.0 0.0 0.0 -3,415.2 8,592.2 -7,974.6 -7,974.6
2082 0.0 0.0 0.0 -3,513.3 8,486.7 -8,101.1 -8,101.1
2083 0.0 0.0 0.0 -3,611.2 8,381.9 -8,226.9 -8,226.9
2084 0.0 0.0 0.0 -3,708.9 8,278.3 -8,352.1 -8,352.1
2085 0.0 0.0 0.0 -3,806.5 8,175.6 -8,476.6 -8,476.6
2086 0.0 0.0 0.0 -3,903.8 8,074.3 -8,600.6 -8,600.6
2087 0.0 0.0 0.0 -4,000.9 7,974.3 -8,723.8 -8,723.8
Total 2012-2086 0.0
Based on the Intermediate Assumptions of the 2012 Trustees Report
Ultimate Real Trust Fund Yield of 2.9% Office of the Chief Actuary1 The unfunded obligation is the present value (discounted to 1-1-2012) of the shortfall of revenue needed to fully pay Social Security Administration
scheduled benefits on a timely basis from the date of trust fund reserve depletion to the end of the current year. March 18, 2013
Table 1a - Annual General Fund Transfers, and OASDI Trust Fund Reserves (or Unfunded Obligation)
Calendar
Year
Proposal General Fund Transfers Present Value in Billions as of 1-1-2012
Proposal
Total OASDI
Trust Fund
Reserves (unfunded
obligation when
negative)
at End of Year
Current Law OASDI with and without Added
General Fund Transfers as in the Proposal
Present Value in Billions as of 1-1- 2012
OASDI Trust Fund Reserves (unfunded
obligation1 when negative) at End of Year

"Strengthening Social Security Act of 2013" Introduced by Senator Harkin
Year
Specified
General Fund
Transfers
Basic Changes
in OASDI
Cash Flow
Change
in Annual
Unified Budget
Cash Flow
Change in
Debt Held
by Public at
End of Year
Change
in Annual
Unified Budget
Balance
Change
in Total
Federal Debt
End Of Year
Change
in Annual
On Budget
Balance
(1) (2) (3) (4) (5) (6) (7)
2012 0.0 0.0 0.0 0.0 0.0 0.0 0.0
2013 0.0 0.0 0.0 0.0 0.0 0.0 0.0
2014 0.0 26.9 26.9 -26.9 26.9 0.0 0.0
2015 0.0 55.0 55.0 -81.9 56.0 0.0 0.0
2016 0.0 83.7 83.7 -165.6 86.9 0.0 0.0
2017 0.0 112.8 112.8 -278.4 119.3 0.0 0.0
2018 0.0 140.9 140.9 -419.4 152.1 0.0 0.0
2019 0.0 140.4 140.4 -559.8 157.6 0.0 0.0
2020 0.0 137.4 137.4 -697.2 160.9 0.0 0.0
2021 0.0 134.5 134.5 -831.7 164.3 0.0 0.0
2022 0.0 132.3 132.3 -964.0 169.8 0.0 0.0
2023 0.0 129.8 129.8 -1,093.8 175.5 0.0 0.0
2024 0.0 126.9 126.9 -1,220.8 181.3 0.0 0.0
2025 0.0 123.7 123.7 -1,344.5 187.3 0.0 0.0
2026 0.0 120.0 120.0 -1,464.5 193.5 0.0 0.0
2027 0.0 116.1 116.1 -1,580.6 196.2 0.0 0.0
2028 0.0 112.3 112.3 -1,693.0 198.7 0.0 0.0
2029 0.0 108.5 108.5 -1,801.5 201.0 0.0 0.0
2030 0.0 104.7 104.7 -1,906.2 203.1 0.0 0.0
2031 0.0 100.9 100.9 -2,007.1 205.1 0.0 0.0
2032 0.0 97.4 97.4 -2,104.4 207.0 0.0 0.0
2033 0.0 93.9 93.9 -2,198.3 208.9 0.0 0.0
2034 0.0 90.5 90.5 -2,288.8 210.6 0.0 0.0
2035 0.0 87.2 87.2 -2,376.0 212.3 0.0 0.0
2036 0.0 84.1 84.1 -2,460.1 213.9 0.0 0.0
2037 0.0 81.1 81.1 -2,541.2 215.5 0.0 0.0
2038 0.0 78.2 78.2 -2,619.3 217.1 0.0 0.0
2039 0.0 75.5 75.5 -2,694.9 218.7 0.0 0.0
2040 0.0 73.0 73.0 -2,767.8 220.2 0.0 0.0
2041 0.0 70.5 70.5 -2,838.4 221.8 0.0 0.0
2042 0.0 68.2 68.2 -2,906.6 223.4 0.0 0.0
2043 0.0 66.0 66.0 -2,972.6 224.9 0.0 0.0
2044 0.0 63.9 63.9 -3,036.6 226.4 0.0 0.0
2045 0.0 61.9 61.9 -3,098.5 227.9 0.0 0.0
2046 0.0 60.0 60.0 -3,158.5 229.4 0.0 0.0
2047 0.0 58.2 58.2 -3,216.7 230.8 0.0 0.0
2048 0.0 56.4 56.4 -3,273.1 232.2 0.0 0.0
2049 0.0 54.8 54.8 -3,327.9 233.7 0.0 0.0
2050 0.0 53.2 53.2 -3,381.1 235.1 0.0 0.0
2051 0.0 51.7 51.7 -3,432.8 236.5 0.0 0.0
2052 0.0 50.3 50.3 -3,483.1 237.9 0.0 0.0
2053 0.0 48.9 48.9 -3,532.1 239.3 0.0 0.0
2054 0.0 47.6 47.6 -3,579.7 240.7 0.0 0.0
2055 0.0 46.4 46.4 -3,626.1 242.1 0.0 0.0
2056 0.0 45.3 45.3 -3,671.4 243.5 0.0 0.0
2057 0.0 44.2 44.2 -3,715.6 244.8 0.0 0.0
2058 0.0 43.2 43.2 -3,758.8 246.2 0.0 0.0
2059 0.0 42.2 42.2 -3,801.0 247.6 0.0 0.0
2060 0.0 41.3 41.3 -3,842.3 249.1 0.0 0.0
2061 0.0 40.5 40.5 -3,882.8 250.5 0.0 0.0
2062 0.0 39.7 39.7 -3,922.6 251.9 0.0 0.0
2063 0.0 39.0 39.0 -3,961.5 253.4 0.0 0.0
2064 0.0 38.3 38.3 -3,999.8 254.8 0.0 0.0
2065 0.0 37.6 37.6 -4,037.4 256.2 0.0 0.0
2066 0.0 36.9 36.9 -4,074.3 257.6 0.0 0.0
2067 0.0 36.3 36.3 -4,110.6 258.9 0.0 0.0
2068 0.0 35.6 35.6 -4,146.2 260.3 0.0 0.0
2069 0.0 35.0 35.0 -4,181.3 261.6 0.0 0.0
2070 0.0 34.4 34.4 -4,215.7 262.9 0.0 0.0
2071 0.0 33.8 33.8 -4,249.5 264.2 0.0 0.0
2072 0.0 33.3 33.3 -4,282.8 265.5 0.0 0.0
2073 0.0 32.7 32.7 -4,315.5 266.8 0.0 0.0
2074 0.0 32.2 32.2 -4,347.7 268.1 0.0 0.0
2075 0.0 31.7 31.7 -4,379.4 269.3 0.0 0.0
2076 0.0 31.2 31.2 -4,410.6 270.5 0.0 0.0
2077 0.0 30.7 30.7 -4,441.3 271.8 0.0 0.0
2078 0.0 30.2 30.2 -4,471.6 273.0 0.0 0.0
2079 0.0 29.8 29.8 -4,501.3 274.1 0.0 0.0
2080 0.0 29.3 29.3 -4,530.6 275.3 0.0 0.0
2081 0.0 28.8 28.8 -4,559.4 276.4 0.0 0.0
2082 0.0 28.4 28.4 -4,587.8 277.6 0.0 0.0
2083 0.0 27.9 27.9 -4,615.7 278.6 0.0 0.0
2084 0.0 27.5 27.5 -4,643.2 279.7 0.0 0.0
2085 0.0 27.0 27.0 -4,670.2 280.8 0.0 0.0
2086 0.0 26.6 26.6 -4,696.8 281.8 0.0 0.0
0.0 4,696.8 4,696.8
Based on Intermediate Assumptions of the 2012 Trustees Report.
Ultimate Real Trust Fund Yield of 2.9% Office of the Chief Actuary
Social Security Administration
March 18, 2013
Total 2012-86
1 Effects of tax provisions on the On-Budget are not reflected in this table.
Billions of Present Value Dollars as of 1-1-2012
Table 1b - OASDI Changes & Implications for Federal Budget and Debt of Specified Plan Provision Effects on OASDI1 (Present Value Dollars)
"Strengthening Social Security Act of 2013" Introduced by Senator Harkin
Year
Specified
General Fund
Transfers
Basic Changes
in OASDI
Cash Flow
Change
in Annual
Unified Budget
Cash Flow
Change in
Debt Held
by Public at
End of Year
Change
in Annual
Unified Budget
Balance
Change
in Total
Federal Debt
End of Year
Change
in Annual
On Budget
Balance
(1) (2) (3) (4) (5) (6) (7)
2012 0.0 0.0 0.0 0.0 0.0 0.0 0.0
2013 0.0 0.0 0.0 0.0 0.0 0.0 0.0
2014 0.0 29.7 29.7 -30.3 30.3 0.0 0.0
2015 0.0 63.0 63.0 -95.7 65.4 0.0 0.0
2016 0.0 99.8 99.8 -201.4 105.6 0.0 0.0
2017 0.0 140.0 140.0 -352.2 150.9 0.0 0.0
2018 0.0 182.1 182.1 -552.5 200.2 0.0 0.0
2019 0.0 189.1 189.1 -768.6 216.2 0.0 0.0
2020 0.0 193.1 193.1 -998.8 230.2 0.0 0.0
2021 0.0 197.3 197.3 -1,244.3 245.5 0.0 0.0
2022 0.0 203.0 203.0 -1,507.6 263.3 0.0 0.0
Based on Intermediate Assumptions of the 2012 Trustees Report.
Office of the Chief Actuary
Social Security Administration
March 18, 20131 Effects of tax provisions on the On-Budget are not reflected in this table.
Billions of Nominal Dollars
Table 1b.n - OASDI Changes & Implications for Federal Budget and Debt of Specified Plan Provision Effects on OASDI1 (Nominal Dollars)

"Strengthening Social Security Act of 2013" Introduced by Senator Harkin
Cost
Expenditures
(Payable)
Non-Interest
Income Cost
Expenditures
(Payable)
Non-Interest
Income
(1) (2) (3) (4) (5) (6)
2012 5.01 5.01 4.67 5.01 5.01 4.67
2013 5.06 5.06 4.66 5.06 5.06 4.66
2014 5.09 5.09 4.71 5.09 5.09 4.88
2015 5.10 5.10 4.73 5.11 5.11 5.08
2016 5.11 5.11 4.76 5.13 5.13 5.29
2017 5.14 5.14 4.81 5.17 5.17 5.52
2018 5.19 5.19 4.85 5.23 5.23 5.74
2019 5.28 5.28 4.87 5.32 5.32 5.76
2020 5.38 5.38 4.89 5.44 5.44 5.77
2021 5.49 5.49 4.91 5.56 5.56 5.78
2022 5.59 5.59 4.90 5.67 5.67 5.77
2023 5.70 5.70 4.90 5.79 5.79 5.77
2024 5.80 5.80 4.89 5.90 5.90 5.76
2025 5.89 5.89 4.89 6.01 6.01 5.75
2026 5.98 5.98 4.88 6.11 6.11 5.75
2027 6.06 6.06 4.88 6.21 6.21 5.75
2028 6.13 6.13 4.88 6.30 6.30 5.74
2029 6.20 6.20 4.87 6.37 6.37 5.74
2030 6.25 6.25 4.87 6.44 6.44 5.74
2031 6.29 6.29 4.87 6.50 6.50 5.73
2032 6.32 6.32 4.86 6.55 6.55 5.73
2033 6.34 5.16 4.86 6.59 6.59 5.73
2034 6.36 4.85 4.85 6.62 6.62 5.72
2035 6.36 4.85 4.85 6.64 6.64 5.72
2036 6.36 4.85 4.85 6.65 6.65 5.71
2037 6.35 4.84 4.84 6.66 6.66 5.71
2038 6.34 4.84 4.84 6.66 6.66 5.71
2039 6.33 4.83 4.83 6.66 6.66 5.70
2040 6.31 4.83 4.83 6.65 6.65 5.70
2041 6.28 4.82 4.82 6.64 6.64 5.69
2042 6.26 4.81 4.81 6.63 6.63 5.68
2043 6.24 4.81 4.81 6.62 6.62 5.68
2044 6.22 4.80 4.80 6.62 6.62 5.67
2045 6.21 4.79 4.79 6.61 6.61 5.66
2046 6.19 4.79 4.79 6.60 6.60 5.66
2047 6.17 4.78 4.78 6.59 6.59 5.65
2048 6.15 4.77 4.77 6.58 6.58 5.64
2049 6.14 4.76 4.76 6.57 5.63 5.63
2050 6.12 4.76 4.76 6.57 5.63 5.63
2051 6.11 4.75 4.75 6.56 5.62 5.62
2052 6.10 4.75 4.75 6.56 5.61 5.61
2053 6.09 4.74 4.74 6.56 5.61 5.61
2054 6.09 4.73 4.73 6.56 5.60 5.60
2055 6.08 4.73 4.73 6.56 5.59 5.59
2056 6.08 4.72 4.72 6.56 5.59 5.59
2057 6.08 4.71 4.71 6.56 5.58 5.58
2058 6.07 4.71 4.71 6.56 5.57 5.57
2059 6.07 4.70 4.70 6.56 5.57 5.57
2060 6.06 4.69 4.69 6.56 5.56 5.56
2061 6.06 4.69 4.69 6.55 5.55 5.55
2062 6.05 4.68 4.68 6.55 5.55 5.55
2063 6.05 4.68 4.68 6.55 5.54 5.54
2064 6.04 4.67 4.67 6.54 5.53 5.53
2065 6.04 4.66 4.66 6.54 5.53 5.53
2066 6.03 4.66 4.66 6.54 5.52 5.52
2067 6.03 4.65 4.65 6.54 5.51 5.51
2068 6.03 4.64 4.64 6.54 5.51 5.51
2069 6.03 4.64 4.64 6.54 5.50 5.50
2070 6.04 4.63 4.63 6.55 5.49 5.49
2071 6.04 4.63 4.63 6.55 5.49 5.49
2072 6.04 4.62 4.62 6.55 5.48 5.48
2073 6.04 4.62 4.62 6.55 5.47 5.47
2074 6.04 4.61 4.61 6.56 5.47 5.47
2075 6.04 4.61 4.61 6.56 5.46 5.46
2076 6.04 4.60 4.60 6.56 5.46 5.46
2077 6.05 4.59 4.59 6.56 5.45 5.45
2078 6.05 4.59 4.59 6.57 5.45 5.45
2079 6.05 4.59 4.59 6.57 5.44 5.44
2080 6.06 4.58 4.58 6.58 5.44 5.44
2081 6.06 4.58 4.58 6.58 5.43 5.43
2082 6.07 4.57 4.57 6.59 5.43 5.43
2083 6.08 4.57 4.57 6.60 5.42 5.42
2084 6.08 4.57 4.57 6.61 5.42 5.42
2085 6.09 4.56 4.56 6.62 5.42 5.42
2086 6.10 4.56 4.56 6.63 5.41 5.41
Table 1c - Present Law and Proposal Cost, Expenditures, and Income: As Percent of Gross Domestic Product
March 18, 2013
Social Security Administration
Present Law OASDI Proposal OASDI
Calendar
Year
Based on Intermediate Assumptions of the 2012 Trustees Report. Office of the Chief Actuary
"Strengthening Social Security Act of 2013" Introduced by Senator Harkin
Year
Present Law OASDI
Trust Fund Reserves /
Unfunded Obligation
Through End of Year
Changes
in OASDI
Income
Changes
in OASDI
Cost
Basic
Changes
in OASDI
Cash Flow
Total Change
Through
End of Year
Proposal OASDI
Trust Fund Reserves /
Unfunded Obligation
Through End of Year
(1) (2) (3) (4) = (2)-(3) (5) = cumulative sum(4) (6) = (1)+(5)
2012 2,626.1 0.0 0.0 0.0 0.0 2,626.1
2013 2,563.5 0.0 0.0 0.0 0.0 2,563.5
2014 2,504.0 26.9 0.0 26.9 26.9 2,531.0
2015 2,445.4 56.5 1.5 55.0 81.9 2,527.3
2016 2,389.0 86.9 3.1 83.7 165.6 2,554.6
2017 2,334.6 117.5 4.7 112.8 278.4 2,613.0
2018 2,278.0 147.3 6.3 140.9 419.4 2,697.3
2019 2,211.2 148.4 8.0 140.4 559.8 2,771.0
2020 2,130.5 147.2 9.8 137.4 697.2 2,827.6
2021 2,034.1 146.1 11.6 134.5 831.7 2,865.8
2022 1,919.6 145.8 13.5 132.3 964.0 2,883.6
2023 1,787.1 145.2 15.4 129.8 1,093.8 2,881.0
2024 1,637.9 144.4 17.5 126.9 1,220.8 2,858.7
2025 1,473.7 143.2 19.5 123.7 1,344.5 2,818.1
2026 1,296.2 141.7 21.6 120.0 1,464.5 2,760.7
2027 1,106.7 139.9 23.8 116.1 1,580.6 2,687.3
2028 907.3 138.3 26.0 112.3 1,693.0 2,600.3
2029 700.0 136.7 28.2 108.5 1,801.5 2,501.5
2030 486.3 135.0 30.3 104.7 1,906.2 2,392.4
2031 268.0 133.4 32.5 100.9 2,007.1 2,275.1
2032 47.0 132.0 34.6 97.4 2,104.4 2,151.4
2033 -175.3 130.6 36.7 93.9 2,198.3 2,023.0
2034 -397.4 129.2 38.7 90.5 2,288.8 1,891.4
2035 -618.4 127.9 40.7 87.2 2,376.0 1,757.7
2036 -837.5 126.5 42.5 84.1 2,460.1 1,622.6
2037 -1,054.2 125.2 44.2 81.1 2,541.2 1,487.0
2038 -1,267.7 124.0 45.8 78.2 2,619.3 1,351.6
2039 -1,477.4 122.7 47.2 75.5 2,694.9 1,217.5
2040 -1,682.8 121.4 48.4 73.0 2,767.8 1,085.1
2041 -1,883.9 120.1 49.6 70.5 2,838.4 954.5
2042 -2,080.7 118.8 50.6 68.2 2,906.6 825.9
2043 -2,273.4 117.5 51.5 66.0 2,972.6 699.2
2044 -2,462.4 116.3 52.3 63.9 3,036.6 574.2
2045 -2,647.8 115.0 53.0 61.9 3,098.5 450.8
2046 -2,829.7 113.7 53.7 60.0 3,158.5 328.9
2047 -3,008.1 112.4 54.2 58.2 3,216.7 208.6
2048 -3,183.3 111.0 54.6 56.4 3,273.1 89.8
2049 -3,355.4 109.7 54.9 54.8 3,327.9 -27.4
2050 -3,524.5 108.4 55.2 53.2 3,381.1 -143.4
2051 -3,691.0 107.1 55.4 51.7 3,432.8 -258.2
2052 -3,855.2 105.8 55.5 50.3 3,483.1 -372.1
2053 -4,017.4 104.5 55.6 48.9 3,532.1 -485.3
2054 -4,177.7 103.3 55.6 47.6 3,579.7 -598.0
2055 -4,336.3 102.0 55.6 46.4 3,626.1 -710.1
2056 -4,493.3 100.7 55.5 45.3 3,671.4 -821.9
2057 -4,648.9 99.5 55.3 44.2 3,715.6 -933.2
2058 -4,802.8 98.3 55.1 43.2 3,758.8 -1,044.1
2059 -4,955.1 97.0 54.8 42.2 3,801.0 -1,154.2
2060 -5,105.7 95.9 54.5 41.3 3,842.3 -1,263.4
2061 -5,254.5 94.7 54.2 40.5 3,882.8 -1,371.6
2062 -5,401.5 93.5 53.8 39.7 3,922.6 -1,479.0
2063 -5,546.9 92.4 53.4 39.0 3,961.5 -1,585.4
2064 -5,690.7 91.2 52.9 38.3 3,999.8 -1,690.9
2065 -5,833.1 90.1 52.5 37.6 4,037.4 -1,795.7
2066 -5,974.2 89.0 52.0 36.9 4,074.3 -1,899.9
2067 -6,114.2 87.9 51.6 36.3 4,110.6 -2,003.6
2068 -6,253.2 86.8 51.1 35.6 4,146.2 -2,106.9
2069 -6,391.2 85.7 50.7 35.0 4,181.3 -2,209.9
2070 -6,528.4 84.6 50.2 34.4 4,215.7 -2,312.7
2071 -6,664.6 83.5 49.7 33.8 4,249.5 -2,415.1
2072 -6,799.8 82.5 49.2 33.3 4,282.8 -2,517.0
2073 -6,934.1 81.5 48.7 32.7 4,315.5 -2,618.5
2074 -7,067.4 80.5 48.2 32.2 4,347.7 -2,719.7
2075 -7,199.8 79.4 47.8 31.7 4,379.4 -2,820.4
2076 -7,331.2 78.4 47.3 31.2 4,410.6 -2,920.6
2077 -7,461.5 77.5 46.8 30.7 4,441.3 -3,020.2
2078 -7,591.0 76.5 46.3 30.2 4,471.6 -3,119.4
2079 -7,719.6 75.5 45.8 29.8 4,501.3 -3,218.3
2080 -7,847.5 74.6 45.3 29.3 4,530.6 -3,316.9
2081 -7,974.6 73.6 44.8 28.8 4,559.4 -3,415.2
2082 -8,101.1 72.7 44.3 28.4 4,587.8 -3,513.3
2083 -8,226.9 71.8 43.9 27.9 4,615.7 -3,611.2
2084 -8,352.1 70.9 43.4 27.5 4,643.2 -3,708.9
2085 -8,476.6 70.0 43.0 27.0 4,670.2 -3,806.5
2086 -8,600.6 69.1 42.5 26.6 4,696.8 -3,903.8
Total 2012-2086 7690.7 2993.9 4696.8
Based on Intermediate Assumptions of the 2012 Trustees Report. Office of the Chief Actuary
Social Security Administration
Ultimate Real Trust Fund Yield of 2.9%. March 18, 2013
(Billions of Dollars, Present Value on 1-1-2012)
Table 1d - Change in Long-Range Trust Fund Reserves / Unfunded Obligation