social vulnerability to climate change in a time of renovation huy luongquang climatic research unit...
TRANSCRIPT
SOCIAL VULNERABILITY TO CLIMATE CHANGE IN A TIME OF RENOVATION
Huy LuongQuangClimatic Research UnitUniversity of East Anglia, Norwich, [email protected]

Outline
Assessment from 1995 – 2003 in Giao Thuy, a coastal district in the north of Vietnam,
Discussion on the limitations and dissatisfactions on the findings,
On-going development of a new approach.
Giao Thuy – social vulnerability ? Objectives
to assess social vulnerability and resilience under the effects of
economic renovation and the implications for local society
coping with the impacts of climate and weather extremes.

Figure 1. Research site - Giao Thuy district, 2000/01

Figure 2. Research site - Giao Thuy district, 2000/01
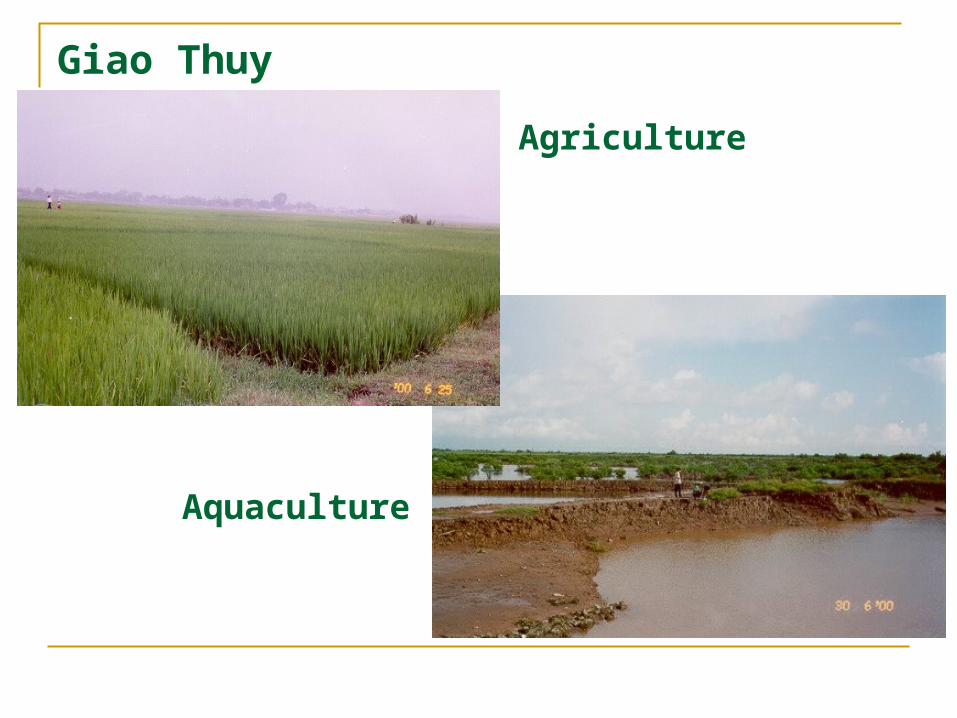
Giao Thuy district
Agriculture
Aquaculture

Why Giao Thuy? is selected on the basis of statistical
and social representativeness that provides a typical account of the social structure is a resource-dependent community
affected significantly by institutional changes.
annual climate and weather extremes are given special considerations in local policy making.
impacts of institutional changes under economic renovation and climatic related events have altered the social structure and local adaptive capacity.
allows a theoretical, analytical and descriptive basis to obtain a high level of insights and thoroughness.

Questions asked!
What are the changes of local society under the effects of economic renovation and consequences from these changes? And how is the local society responding to the consequences?
What are the impacts of climate and weather extremes on social livelihoods? And how are these livelihoods recovering from the impacts?
How is the level of social vulnerability and resilience revealed and varied since the economic renovation?
How effective are the chosen indicators in addressing understanding the processes that influence level of vulnerability?
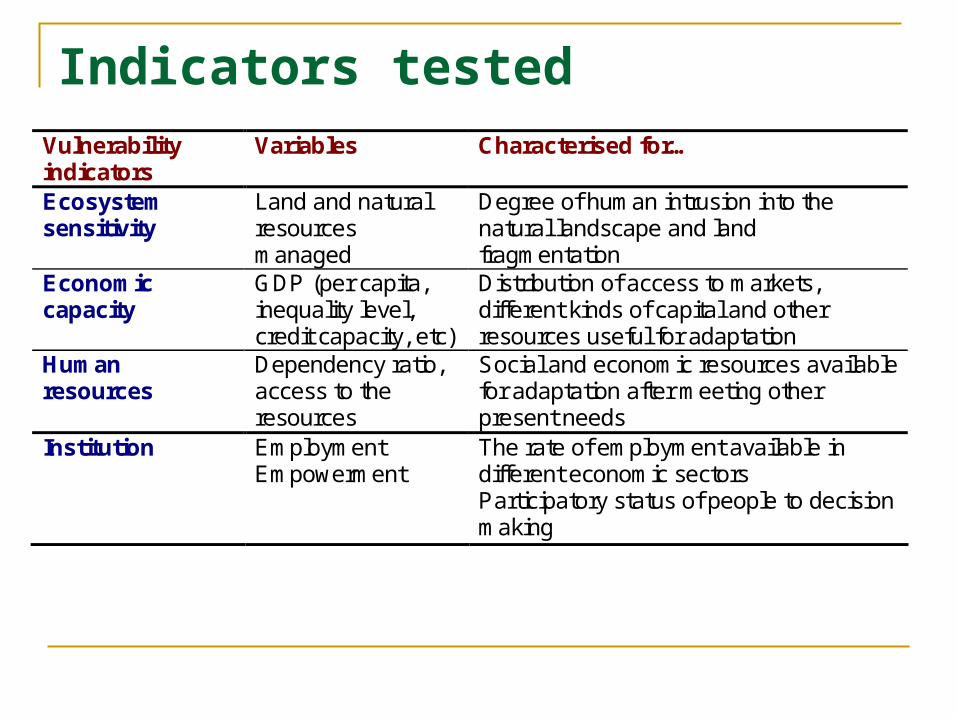
Indicators testedVulnerability indicators
Variables Characterised for…
Ecosystem sensitivity
Land and natural resources managed
Degree of human intrusion into the natural landscape and land fragmentation
Economic capacity
GDP (per capita, inequality level, credit capacity, etc)
Distribution of access to markets, different kinds of capital and other resources useful for adaptation
Human resources
Dependency ratio, access to the resources
Social and economic resources available for adaptation after meeting other present needs
Institution Employment Empowerment
The rate of employment available in different economic sectors Participatory status of people to decision making
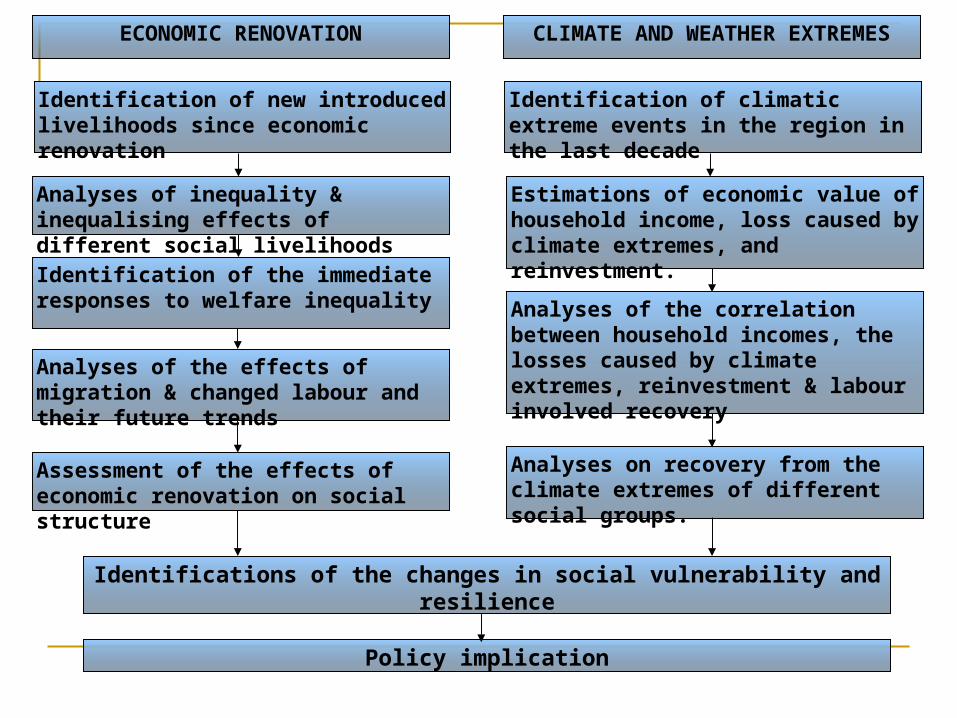
Identification of new introduced livelihoods since economic renovation
Analyses of inequality & inequalising effects of different social livelihoods
Identification of the immediate responses to welfare inequality
Assessment of the effects of economic renovation on social structure
Estimations of economic value of household income, loss caused by climate extremes, and reinvestment.
Analyses of the effects of migration & changed labour and their future trends
Identifications of the changes in social vulnerability and resilience
Policy implication
Identification of climatic extreme events in the region in the last decade
ECONOMIC RENOVATION CLIMATE AND WEATHER EXTREMES
Analyses of the correlation between household incomes, the losses caused by climate extremes, reinvestment & labour involved recovery
Analyses on recovery from the climate extremes of different social groups.

Institutional changesPolicy changes and its effects on social livelihoods Policies Context of formal policies Land reform Allocation and privatisation of agricultural land. Allocation
is based on population and agricultural land available at time of implementation Property rights to use, transfer, sell, buy, inherit, mortgage the land
Dismantling of the cooperative system
Lessening of restriction on markets and supplies of agricultural inputs Improve the crop management and agricultural services
Open market of employment
Removal of governmental guaranteed employment
Agriculture mechanisation
Changed agricultural practices

Economic growthHousehold average income per person per month (price 2003) Average income
(000 VND) Average growth
(%)
1996 1999 2001 1996-1999 1999-2001
Whole country 266 295 331 8.8 6
Red River Delta 223 280 337 7.6 9.6
Giao Thuy District 321 394 442 12.3 11.2
0
100
200
300
400
500
1 2 3
Whole country
Red River Delta
Giao Thuy District
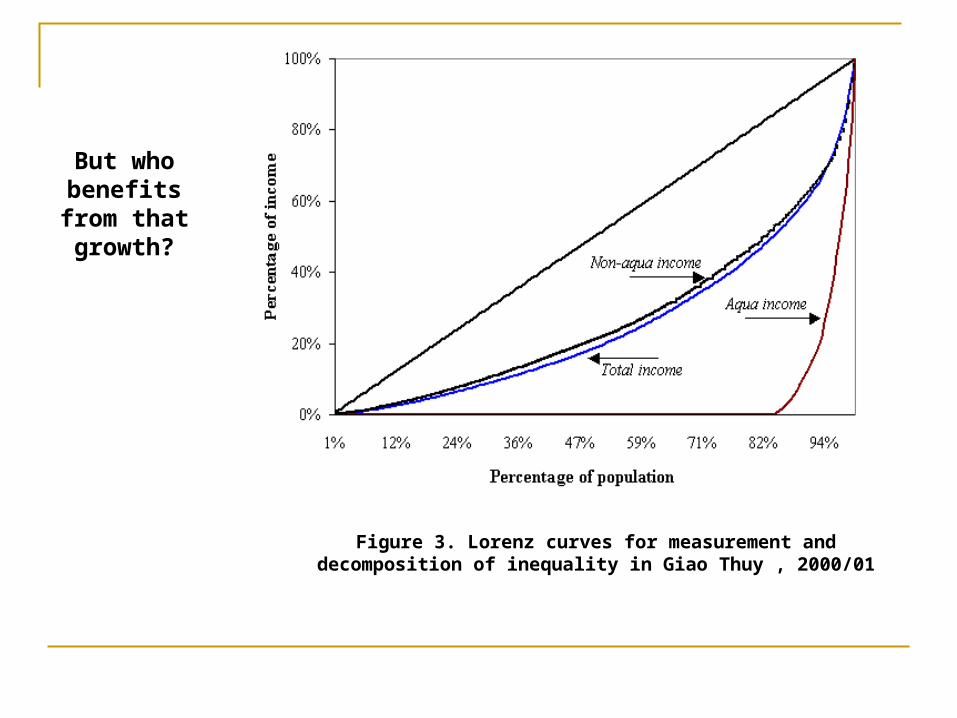
Figure 3. Lorenz curves for measurement and decomposition of inequality in Giao Thuy , 2000/01
But who benefits from that growth?

Migration as a newly introduced livelihoods
Formal – Governmental Organised Migration and Resettlement programmes
North-North resettlement programme – New Economic Zone, Post-war Migration and Resettlement (1975-1990s)
Population redistribution policies involving both deurbanisation and resettlement in NEZs - North-South migration,
Informal Spontaneous migration (both North-North and North-South), Population growth, land limitation, Employment opportunity, Social networks and structures.

Effects of migration on the social structure Changing gender roles - women more responsible to manage
agricultural land. Some loss of skills in agricultural workforce. Weakening family structure because older members of the family
are absent. Loss of social capital as members of community are absent. BUT increase remittance income.

Decomposition of per-capita income inequality by different components of income
Note:*** Inequality effect(+) Income source contributes more to inequality than share of income(-) Income source contributes less to inequality than share of income
Income sources Pseudo Gini coefficients
Share of income (%)
Contribution to inequality (%)
Inequalising effect***
1 Rice income 0.031 25.1% 4.0% - 2 Other plantations 0.416 1.8% 3.9% + 3 Breeding 0.114 23.1% 13.4% - 4 Aquaculture 0.343 17.8% 31.2% + 5 Fishing 0.371 18.9% 35.4% + 6 Manufacture and service 0.457 5.6% 13.3% + 7 Wages 0.148 3.5% 2.7% - 8 Remittance income -0.175 4.2% -3.9% -
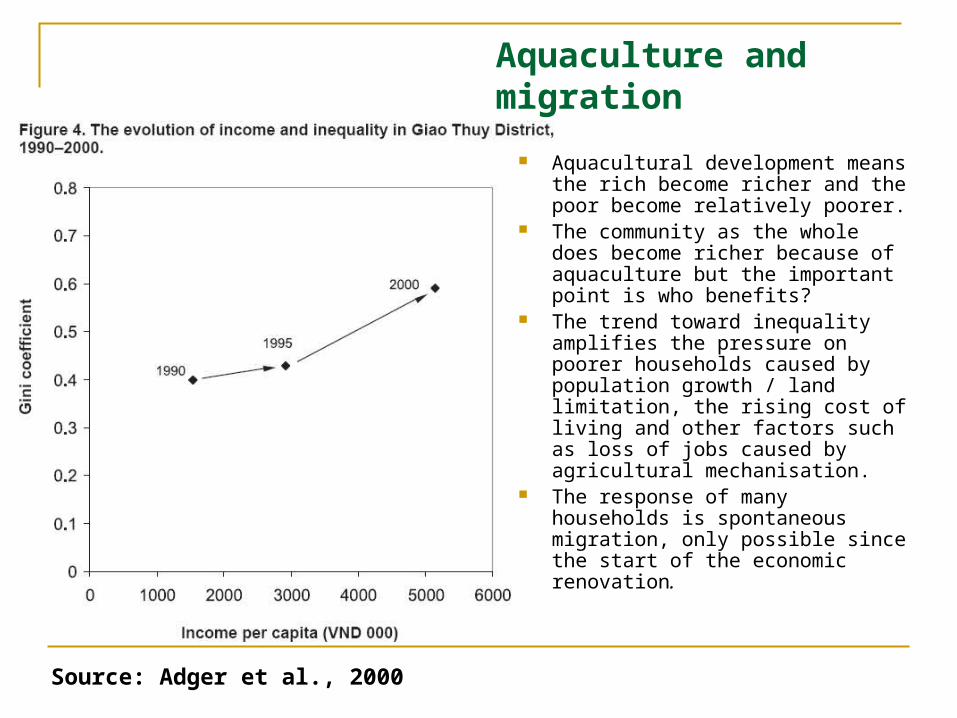
Aquaculture and migration
Aquacultural development means the rich become richer and the poor become relatively poorer.
The community as the whole does become richer because of aquaculture but the important point is who benefits?
The trend toward inequality amplifies the pressure on poorer households caused by population growth / land limitation, the rising cost of living and other factors such as loss of jobs caused by agricultural mechanisation.
The response of many households is spontaneous migration, only possible since the start of the economic renovation.
Source: Adger et al., 2000

Local access to natural resources before and after Doi Moi and Ramsar designation
Before After (2001-2003) Effects Ramsar management
N/A 6000 ha is under strict protection
Limited access decrease the number of locals who totally depend on mangrove
Increase inequality in whole community which shrimp pond owners gain
Policies on use and access to the natural resources
Free access to the mangrove in the area. No regulations to control the exploitation of the area.
Water resources and soil quality control
Maintain natural balance and the ecosystem,
Protection forest Production forest
Increase social resilience by higher productivity and stability of rice production.
Loss of resilience by limited employment, loss of skills and changes in social structure due to changes in labour allocation and new trends, such as spontaneous migrations.
Changes in formal policies towards habitat protectionRamsar designation (local level only)

Changes in access to natural resources
Beneficiaries before and after the designation of Ramsar site Before the designation
and economic renovation (late 1980s)
After the designation
Number of household benefiting from the mudflat
171 52
Individuals collecting marine products from the mudflat
208 76
Mean income gained from the mudflat per month
200 kg of rice* (171 households)
< 50 kg of rice or 150,000 VND (52
households) Percentage of income from mudflat out of total income of the household
12.48% (171 households) <5% (52 households)
Note: * The research used rice as a measure for the value of marine products collected by the households as marine products were not marketed before the designation of Ramsar site

Access to the natural resources in local area before and after the Ramsar designation and economic renovation. Before the designation
and economic renovation (late 1980s)
After the designation
AQUACUTLTURE
Area of aquacultural ponds 250 ha 2,158 ha
Number of aquacultural ponds 5 65
Number of labourers involved to aquaculture 25 452
Mean aquacultural income per capita 1,800,000 1,289,000
Total income by aquaculture VND 45m VND 582.6m FISHING AND FREE PRODUCT COLLECTION
Local area with free access to natural resources 12,000 ha 4,202 ha Number of beneficiaries who have been using the free access area
20,000 12,000
Mean working hours in free access area per month 110 50
Mean income per capita from fishing and free collection
approx. 200 kg of rice Approx. 50 kg of rice

78.50%
38.40%
54.80%
21.50%
71.60%
45.20%
0%
20%
40%
60%
80%
100%
Labours involved inseasonal migration
Main labours involvedin agriculture
Minor labours involvedin agriculture
Lab
oure
r in
volv
ed r
ate
(%)
Woman
Man
Labour force allocation in relationship with spontaneous migration.
Note: Data collected in 2001-2003 in Giao Thuy district

Effects of migration and changes in labour force on the level of social vulnerability
Remittance income has a complex and often opposing effects on the resilience of the poorer members of the community.
Limit the loss of resilience caused by aquaculture development and other trends but it is not enhancing resilience by diversifying livelihoods in the local community - it is being invested in existing agricultural activities.
Because of effects on gender roles, skills in the agricultural workforce, etc, it has negative effects on resilience.
However, migration livelihoods are less dependent on the environment, there is increased resilience to current environmental stress and long-term global environmental change compared to local livelihoods such as agriculture and fishing.
It is important to separate out these different effects rather than simply saying migration or aquaculture is good or bad.

Climate extremes and local response
examine the aquacultural, non-aquacultural, migrant and non-migrant communities coped with typhoon strikes,
cover the income from different sources at household level, loss caused by the extremes, reinvestment (recovering expenses) and the workforce available and involved to recover from the extreme events.
most recent and serious typhoon strikes occurred in the region in 1992, 1996 and 1998.

INCOME breakdown by different categories during 1992-1998
0
5,000,000
10,000,000
15,000,000
20,000,000
25,000,000
30,000,000
1992 1996 1998
Overall
Non-aquaculturalcommunityAquaculturalcommunityMigrantcommunityNon-migrantcommunity
Note: income data of the 1992 & 1996 have been converted to 1998 price using inflation rate by IMF (1999)

0
5,000,000
10,000,000
15,000,000
20,000,000
25,000,000
30,000,000
1992 1996 1998
Overall
Non-aquaculturalcommunityAquaculturalcommunityMigrantcommunityNon-migrantcommunity
Climate–related loss during 1992-1998
Note: income data of the 1992 & 1996 have been converted to 1998 price using inflation rate by IMF (1999)

Pearson correlation using loss as the dependent variables.
1992 Overall Non-aquacultural community
Aquacultural community
Migrant community
Non-migrant community
Loss and Income 0.57 -0.04* 0.75 0.62 -0.15* Loss and Investment 0.73 0.77 0.82 0.75 0.79 Loss and Labour used to recover
0.73 -0.03* 0.76 0.85 -0.18*
1996 Loss and Income 0.46 -0.03* 0.87 0.52 -0.07* Loss and Investment 0.89 0.84 0.82 0.82 0.84 Loss and Labour used to recover
0.64 -0.01* 0.87 0.87 -0.01*
1998 Loss and Income 0.59 -0.19* 0.78 0.49 -0.29* Loss and Investment 0.79 0.79 0.85 0.78 0.75 Loss and Labour used to recover
0.68 -0.06* 0.69 0.68 -0.05*
Note: * not significant at 5% level
How big / significant is the loss?

Implications from testing indicators
1. Changes in institutions have had good effects on both agriculture and aquaculture, the implications showed an increase in the level of social resilience in both the aquaculture and the non-aquaculture groups.
2. Testing financial and inequality indicators showed that the whole community got better off reduce social vulnerability but pressures on the rest of the population. Non-aquacultural groups still face a loss of social resilience caused by the development of aquaculture.
3. Two different trends, labour reallocation and spontaneous migration, both closely related to each other. Migration, with remittance income, has limited the loss of resilience but it is not improving coping capacity by diversifying livelihoods in the local community as remittance income is simply being invested in traditional activities or saved. Migration caused loss of skills in the rural society and changed the gender role on agricultural works, leading to further loss of social resilience.
4. Coping with the extreme events, typhoon strikes. Aquacultural community remains most sensitive and dependent economic sector but adaptability has enhanced considerably by the improved financial and human capacities. Non-aquaculture group, though less dependent on the environment than aquaculture, but is the most vulnerable to the climate and weather extremes.
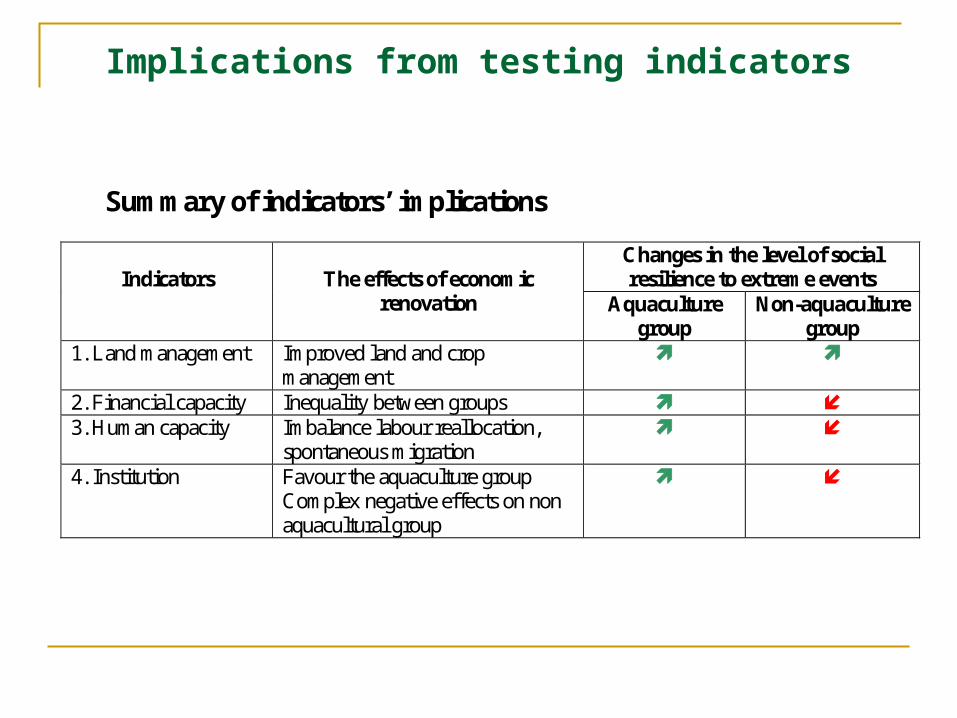
Summary of indicators’ implications
Changes in the level of social resilience to extreme events
Indicators
The effects of economic
renovation Aquaculture group
Non-aquaculture group
1. Land management Improved land and crop management
2. Financial capacity Inequality between groups 3. Human capacity Imbalance labour reallocation,
spontaneous migration
4. Institution Favour the aquaculture group Complex negative effects on non aquacultural group
Implications from testing indicators

Limitations and dissatisfactions Communication skills
the ability to ask relevant questions open to the knowledge and competence of the local community and
are prepared to admit their own ignorance of the local situation the researchers and the local community have to be prepared to
give up their preconceived ideas interpretation / translation
Power issues information provided by different members of the local community,
depending on their positions in the society can reflect their own view of the subject under discussion
Gender issues Gender differences define how, in a specific social and cultural
context, women and men interact and what is considered appropriate for each to do, thus determining their development options and constraints
Location and time Information is gathered from the perspective of the inhabitants
of one village while other groups of other locations and their perspectives are excluded, especially if different ethnic groups or even in different countries are concerned.

Superficial data stop at describing the activities and physical surroundings of a
community and often fail to investigate deeper to understand strategic decisions that underlie the observed patterns of activities or to see how these strategies have evolved over time
Uncertain quality of data Principles of crosschecking information by seeking different
sources and using different methods to obtain information about the same thing are not always undertaken.
Imposition of new concepts Tools and techniques used in the field maybe absolutely alien
to the local community, abuse of these techniques and tools will give wrong, even converse data and information
Extractive and empowering application of the approach Most approaches and techniques tend to extract information,
some empower the local community to obtain data and information. Interactive process is neglected.
Weaknesses in follow-up What can we do for the community afterwards?
Limitations and dissatisfactions (cont.)

Authority Decision making identity
Scientific community
Normally one way, no direct response from the local community. Research tends to explore the fact rather than the local
knowledge in order to use it effectively.
Local community
Very weak and sometimes mistakenly interpreted, local knowledge has not been considered as equally
important to scientific findings.
Decision made tom down to the society with support from scientific community, local
knowledge normally ignored
Weak response, sometimes too late as
decision has been made and implemented
Relatively effective support for decision making process,BUT
not involved local community
Information provision only, facts and figures sometimes
misinterpreted due to bureaucratic process
STRONGER LINK NEEDED
THIS LINK SHOULD INCLUDE LOCAL PARTICIPATION

More questions asked! How to establish an effective, interactive and continuous link
between the local community and the authority, which should include scientific community?
What can be used to give the local community a means to employ their knowledge to assist the authority and scientific community in developing an adaptation strategy which works?

Thank you for your attention!
Huy LuongQuangClimatic Research UnitUniversity of East Anglia, Norwich, [email protected]