social visualization social visualization for the masses
TRANSCRIPT

Social Visualization
Social Visualization for the Masses

2
Social Visualization
Many Eyes: A Site for Visualization at Internet ScaleHarry Potter and the Meat-Filled Freezer: A Case Study of Spontaneous Usage of Visualization ToolsVoyagers and Voyeurs: Supporting Asynchronous Collaborative Information Visualization

3
Previous Social Visualizations...
... have been a little different what are social visualizations?
visualization of social data using visualization to as medium for social
communication making use of web technologies?

4
Visualization of Social Data
Vizster (social network websites; seeing how people are related)
MatLink (social networks) NodeTrix People Garden

5
Visualization as Social Communication
Chat circles Keystrokes (somewhere in-between?)

6
as previously seen... web visualizations...
previously seen: wefeelfine gapminder
recall “web-centric” design decisions: short attention span fun and interactive

7
Many Eyes: A Site for Visualization at Internet Scale
Upload data Create Visualization Discuss (Not necessarily in this order!)

8
Many Eyes: Approach to visualization...
Let the people decide! give many possible visualization options
encourage discussion via visualization encourage visualization via discussions
both textual information and visualization aid each other

9
Many Eyes: Design Principles
asynchronous (email is asynchronous; instant messaging is synchronous)
enable easy creation of visualizations simple data format: spreadsheets (tables) web based: available to large audience

10
Many Eyes: Web Expectations
Designed for untrained, non-specialist users survey found certain groups interested...
Low barrier to entry Short attention span Bookmarks Undoable (back and forwards button) “Fun” and accessible

11
Many Eyes: Tree Map

12
Many Eyes: Node Link

13
Many Eyes: Stacked Chart

14
Many Eyes: Bubbles
15
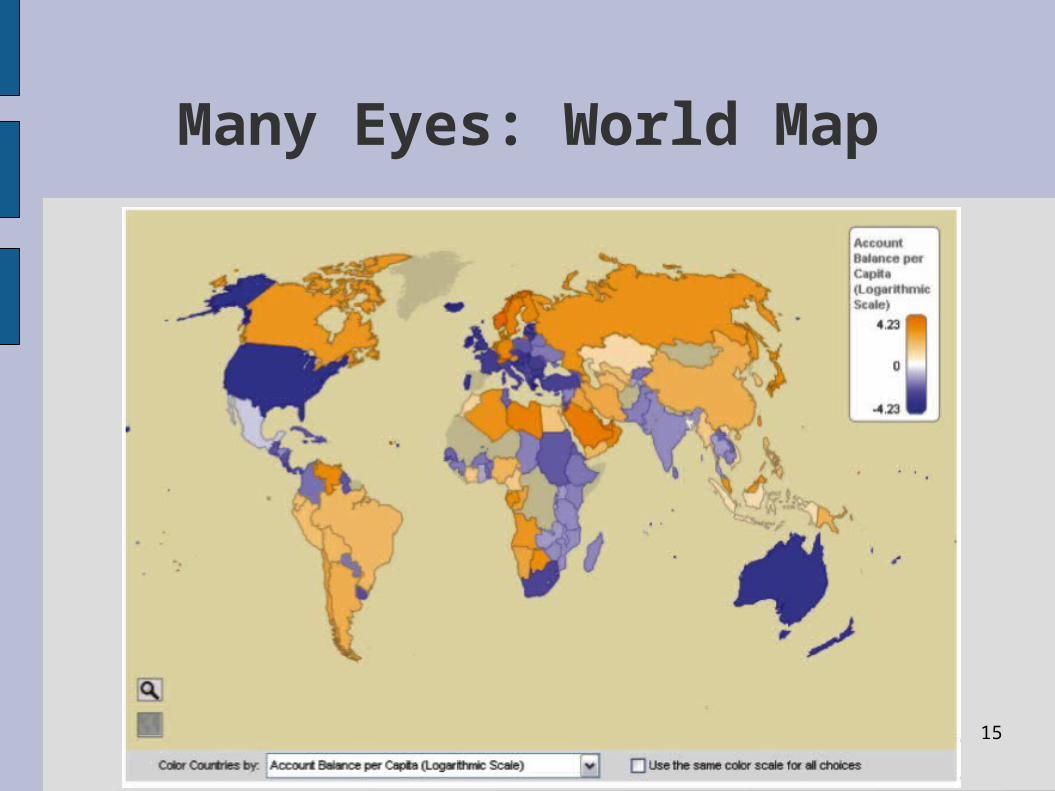
Many Eyes: World Map

16
Many Eyes: Scatter Plot

17
Many Eyes: Stacked Chart

18
Many Eyes: Tag Cloud

19
Many Eyes: Node Link
20
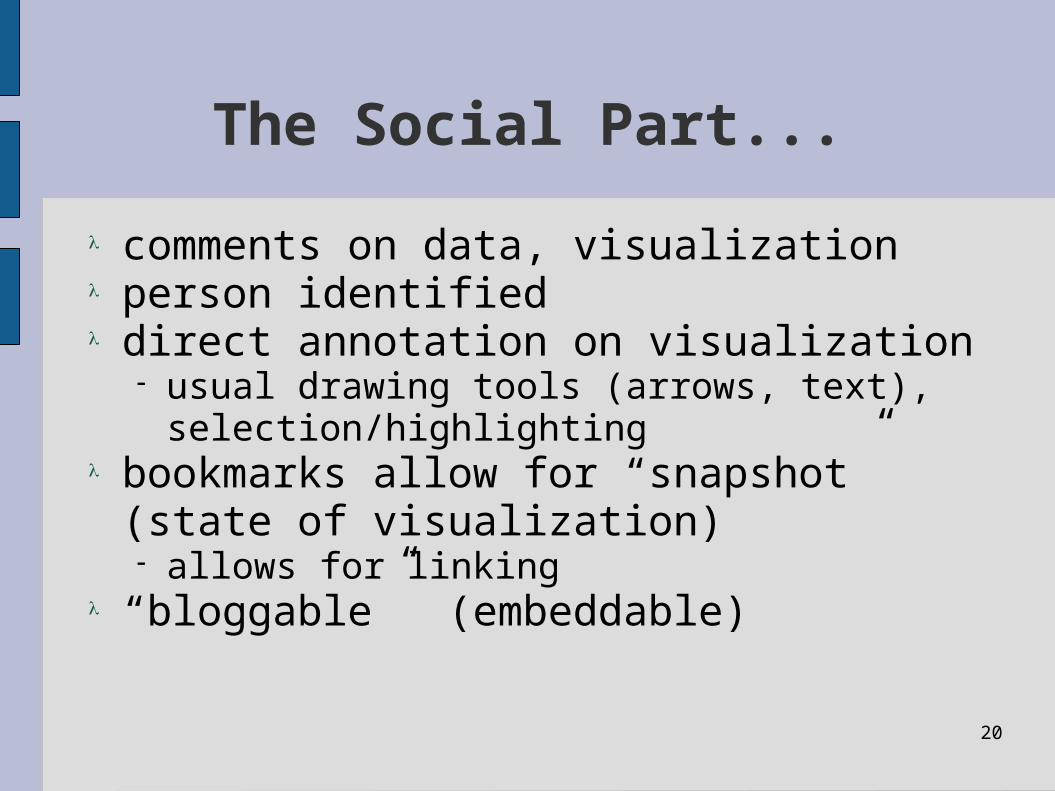
The Social Part...
comments on data, visualization person identified direct annotation on visualization
usual drawing tools (arrows, text), selection/highlighting
bookmarks allow for “snapshot” (state of visualization) allows for linking
“bloggable” (embeddable)

21
Many Eyes: Visualizations used

22
Many Eyes: A Quick Demo...
[this slide intentionally left blank]

23
Harry Potter and the Meat-Filled Freezer: A Case Study of Spontaneous
Usage of Visualization Tools
A review of Many Eyes' results (1 year later) some interesting results

24
visual analytics
global warming and linguistic data standard visual data analysis
25
data quality and error hunting
found errors in data from reliable sources National Center for Health Statistics
“visual representations can quickly expose data problems”
“many eyes make bugs shallow”

26
sociability – harry potter is freaking popular
playful annotations: books read, countries visited adding personal touch...
following from this...

27
generating mirrors – personal and collective
people are narcissistic sociable like to share personal information
tracking weight loss

28
sending a message
using visualization to express idea (not necessarily a new one) Multiple Sclerosis Jesus appears many times in Bible
Visualization confirms a persons beliefs

29
innovative use of visualizations
digg “Stacked graph” stacked graphs are meant to show multiple
graphs over a time period only two “time points”: diggs and comments with percentage scaling
can see the relation between these two litmash
use two pieces of literature as a data source

30
Many Eyes: Stacked Chart
31
Voyagers and Voyeurs: Supporting Asynchronous Collaborative
Information Visualization Heer, Viégas, Wattenberg collaborative visualization tools
enable visual conversations email with attachments is clumsy
visualization is part of conversation (uni-directional) want to be able to see how conversation evolves
over time

32
sense.us
bookmarks (represents current state of visualization)
bi-directional link between conversation and visualization
annotation: drawings and text fixed data

33
sense.us

34
sense.us: bookmark trail

35
sense.us: map

36
sense.us: stacked chart

37
sense.us: population pyramid

38
sense.us: scatter plot

39
summarizing all of that
interactivity is important! more options are better
people will find novel uses to a visualization when people are involved... visualization is
for both: finding information about data expressing their own (likely outside) view
annotations “games”

40
applications to my project...
more options are better... even if I don't find them immediately useful someone else may find a use

41
example

42
Discussion