social roles and the evolution of networks in extreme and ... · social roles and the evolution of...
TRANSCRIPT

Social Roles and the Evolution of Networks in Extreme and Isolated Environments* Jeffrey C. Johnson East Carolina University James S. Boster University of Connecticut Lawrence Palinkas University of California San Diego This article reports on the evolution of network structure as it relates to formal and informal social roles in well-bounded, isolated groups. Research was conducted at the Amundsen-Scott South Pole Station. Data was collected on crewmembers’ networks of social interaction over each of three winter-over periods, when the station is completely isolated. In addition, data was collected on the informal roles played by crewmembers (e.g., instrumental leadership, expressive leadership). The study found that globally coherent networks in winter-over groups were associated with group consensus on the presence of critically important informal social roles (e.g., expressive leadership) where global coherence is the extent to which a network forms a single group composed of a unitary core and periphery as opposed to being factionalized into two or more subgroups. Conversely, the evolution of multiple subgroups was associated with the absence of consensus on critical informal social roles, above all the critically important role of instrumental leader. Keywords: network evolution, global vs. local coherence, core/periphery structure, informal roles, norm consensus, role consensus

"This could have made for serious problems if there was not clear and open communications between the Station Manager and Construction Coordinator. Open communications and respect for each other were key factors in making our relationship an excellent one." (South Pole Station Manager from one year of the study; from Winter-over Turnover Reports)
Introduction
A number of researchers have begun to recognize the increasing importance of broader sociological,
anthropological, and social psychological issues in the study of humans in isolated and extreme environments,
particularly with respect to the social complexity of larger groups (Johnson and Finney, 1986; Harrison and Connors,
1984; Pierce 1985). Most notable among the potential concerns are the relationship of structural concepts such as
position, status, role, and norms to group evolution and function. Harrison and Conners (1984) have pointed out that
little actual research employing structural theory and concepts had been carried out prior to their review. This is still
basically true today.
The absence of the application of structural concepts in earlier work on social groups is somewhat
understandable, since much of it has involved less than seven participants (Johnson and Finney, 1986). Even in
research on larger groups in exotic environments such as polar research stations and among submariners, most of the
attention has focused on questions of health and psychological well-being (c.f. Gunderson, 1974; Gunderson and
Palinkas, 1991; Taylor, 1987) with little attention to the social, cultural, or social psychological issues. Structural
concepts begin to increase in their explanatory value as groups become larger than seven. This number is the upper
limit (5±2) for the size of a single clique (Killworth and Bernard, 1974). Beyond this limit, groups have the potential
to form multiple cliques or subgroups. One of the few early examples of the application of structural concepts to a
study of groups in exotic environments is Smith’s (1966) sociometric study of an Antarctic work group. In this study,
seven members of a single work expedition were observed and interviewed. Thus, one of the few applications of
structural concepts to research in exotic environments was somewhat limited in terms of structural complexity. The
point is that in larger, more complex groups, structural factors become difficult to ignore (Johnson and Finney, 1986).
Weak leadership has been associated with catastrophic failure in polar expeditions (Leonov and Lebedev,
1975) and with low morale in other isolated settings (Hammes and Osborne, 1965). Leadership has been one of the
most intensely studied aspects of small group phenomena, generating a vast array of definitions and a variety of
methods for identifying or evaluating leaders. For example, consider the difference between the “functions” approach
of Goudan (1970), which emphasizes the characteristics of leaders, and the “integrative” approach of Gibb (1969),
which emphasizes leader-follower relations.

Many distinguish between “instrumental” or “task-motivated” leaders who are focused on the accomplishment
of goals, and “expressive” or “relation-motivated” leaders who play more solidarity building roles in a group (Bales,
1953, 1958; Bales and Stodtbeck, 1955; Hare, 1976; Slater, 1955; Bales and Slater, 1955; Fiedler, 1971; Rees and
Segal, 1984). Termed “role differentiation theory,” it has been criticized because it fails to consider the integration of
the two leadership roles into one (Lewis, 1972; Meeker and Weitzel-O’Neil, 1977). House (1977) too questions the
mutual exclusivity of these roles in that the most successful groups tended to be those in which leadership roles were
integrated rather than differentiated. Such leaders were termed “charismatic.”
The literature on leadership also demonstrates the importance of the distinction between informal (emergent)
and formal group structure. As Smith (1966) noted in observations of an Antarctic work group, informal or emergent
roles will often replace or supplement more formal roles. During the course of selecting expedition members for his
attempt at the South Pole, for example, Amundsen was painstakingly aware of the potential problems associated with
the possible conflict between informal and formal roles. Amundsen deliberately kept the backgrounds of members
homogeneous, thereby avoiding the problems associated with background heterogeneity (e.g., scientists vs. non-
scientists). He also tested potential crewmembers’ stance toward authority by giving them intentionally obscure work
assignments (Huntford, 1984). The purpose of the test was simply to assess an individual’s potential competition for
Amundsen’s role as leader. If someone in the course of the test questioned his authority, the individual was eliminated
from consideration as a member of the crew.
Palinkas (1989c, 1990) observed that effective leadership appears to be based on prior experience, articulation
of goals, flexibility, and degree of interaction with other winter-over personnel. Data obtained on leaders of previous
Antarctic winter-over crews indicated that evaluations of effective leadership were based on the ability of individuals
assuming these roles to minimize group conflict, effectively address problems such as abusive or alcoholic station
members before they began to affect station morale, keep projects on schedule without overworking personnel, make
calm and rational decisions during an emergency, be fair and impartial particularly in conflicts between navy and
civilian personnel, and maintain a certain level of communication with other winter-over personnel through work-
related and social activities without becoming too “chummy.” Leaders lacking these abilities were harshly criticized
and blamed for low moral, group conflict, and inability to successfully complete projects with a minimum of mistakes.
“Leaders” and “followers” are labels for two major “statuses,” or “group positions,” but it is important to
realize that there may be informal or covert statuses that are not so easily identified. Formal status terms do not always
cover the range of statuses and roles found in groups (Goodenough, 1969; Merton, 1957).

The saying “Too many cooks spoil the stew” expresses the idea that group heterogeneity is important and that
competition for leadership should be kept at a minimum. In a particularly interesting instance of this principle, Klein
and Christiansen (1969) analyzed the relative effectiveness of basketball teams as a function of variation in role
expectations, status consensus, achievement motivation, and focused leadership. Teams that have both high average
achievement motivation and high variance in achievement motivation tend to have higher status consensus, display
higher degrees of group coherence, and therefore, win more often. They also found that variations on the task-
orientation of the players increased the chances that differing role expectations would be met. Roberts has obtained
similar results for groups in a variety of competitive situations, including the military (Roberts and Wicke, 1971;
Roberts et al., 1972; Roberts et al., 1980), drivers (Roberts and Kundrat, 1978), and athletes (Roberts and Nuttrass,
1980). He consistently found that teams that combined individuals with different problem solving styles (e.g., potents
and strategists) out-competed homogeneous teams.
Early on, Hall (1955) recognized the crucial importance of members’ agreement on group roles for producing
coherent groups. In the absence of role consensus, we find “role collision,” described by Hare (1976) as a “type of
conflict which may occur if two different individuals in a group perform roles which overlap in some respects.”
Heterogeneity can produce effective groups by simply reducing the potential for role collision. The value of status and
role heterogeneity is counterposed by the potential corrosive effect of heterogeneity in group members’ backgrounds
(e.g., nonscientists vs. scientists) and other characteristics (Palinkas, 1989a: Johnson and Finney, 1986; Bernard and
Killworth, 1973).
The Amundsen example also illustrates the importance of role heterogeneity; varying the role characteristics of
group members allows them to fit in and function well with each other. By screening the role characteristics of
possible expedition members, Amundsen minimized the potential for conflict due to role collision. This observation is
reinforced by the reexamination of Bavelas-type experiments by Freeman et al. (1979), which show a relationship
between group effectiveness and variation in centrality; groups with large variation in members' centrality were more
effective than groups with little or no variation in member centrality. (We expect that variation in role characteristics
corresponds to variation in centrality.) Similarly, MacKenzie (1976) demonstrated the relationships among group
hierarchy, task processes, and group efficiency; more hierarchical groups processed tasks more effectively and were
more efficient.
Note that status and role heterogeneity does not simply refer to heterogeneity of personality traits.
Communication, interaction, and mutual reinforcement among group members leads to good morale and individual
effectiveness; individuals must fit in with one another. In basketball, the networks formed by passing the ball

determine who “fits in.” As Klein and Christiansen (1969) demonstrated, role heterogeneity resulted in effective
communication and efficient ball passing. We would also expect to find relationships among network structure,
achievement motivation, and performance.
Outside of the psychotherapy literature, there have been few studies of deviants or low status individuals in
small groups. Earlier small-group research focused on the negative aspects of deviants, in particular, on their non-
conformity and rejection by the group (Newcomb, 1943; Chowdry and Newcomb, 1952; Festinger, 1954; Riecken,
1952). Similar findings for groups in exotic environments have been reported (Harrison and Connors, 1984).
Others, however, have recognized the positive aspects of such stigmatized statuses by noting the important
functions of deviants or low status individuals (Dentler and Erickson, 1959; Johnson and Miller, 1983). Deviant roles
emerge in many enduring groups, especially those in isolation (e.g., military and work groups [Dentler and Erickson,
1959]; Antarctic exploration groups [Johnson and Finney, 1986], and isolated commercial fish camps [Johnson and
Miller, 1983]). The deviants in these examples function positively: promoting group solidarity, reducing boredom, and
inhibiting group conflict. Dentler and Erickson (1959) point out that deviance is not only a natural part of social
groups; it is institutionalized, accepted, and rewarded.
The positive functional aspects of such low status positions can make a considerable contribution to producing
harmonious and effective small-groups. Just as “charismatic” leadership (House, 1977) is important, so too is the
presence of “charismatic” deviance (Johnson and Miller, 1983). Occupants of such a social position will function in
roles that provide a common reference point (e.g., mascot) for all other group members, thereby promoting group
cohesion. This role will typically manifest itself in humor and joking behavior. As Earls (1969) and Dunlap (1965)
point out, such behavior is essential for coping with boredom brought about by prolonged periods of isolation.
In the Antarctic, Palinkas (1989a, 1992a) identified two major categories of deviants in American winter-over
crews. In the first category is the individual who fails to conform to group norms and expectations. These include
individuals who break rules regarding personal or group safety, resulting in injury or death, which affect the morale of
the entire station; individuals who abuse alcohol and become hostile to other crewmembers or who fail to perform their
work assignments; individuals who fail to perform routine duties such as housekeeping; and individuals in positions of
authority who fail to exercise leadership or fulfill group expectations of the leadership role. Although these individuals
serve to unify the group as a whole by serving to define the boundaries of acceptable and unacceptable behavior and
thereby reinforce group norms, they may also serve to weaken morale and lead to wider social conflict if little or
nothing is done to control their behavior or minimize its effects on other group members.

The second category of deviant is the individual who acts as the station clown or jester. Frequently, this
person is the cook, a civilian contractor employee, or a junior enlisted Navy man who will perform pranks and
exaggerate his or her behavior sufficiently to be outside the mainstream of behavior on the station, yet not enough to
be considered disruptive or threatening. This behavior provides a certain measure of relief to the stress imposed by the
monotony of the physical and social environment. These individuals also provide an important communication
function in that they are frequently allowed to express frustrations or dissatisfaction with disruptive individuals or
undesirable conditions in a socially acceptable manner without causing additional stress or conflict.
There is abundant anecdotal evidence that lower social statuses have been important in past Polar expeditions.
For instance, on his Antarctic expedition, Amundsen brought with him a cook named Lindstrom. As “Chef, baker,
pastry-cook he provided surrogate domesticity. He was also instrument maker, taxidermist, housepainter…and clown
(334).” In his marginal social position as cook, Lindstrom provided not only food, but also humor and comic relief,
and greatly contributed to group harmony during the long winter. Because of his marginal position, Lindstrom was
able to play the role of clown or court-jester without fear of any sanctions. Thus, inter-personal and inter-subgroup
conflicts were reduced by the inclusion of this single member.
In a study of Italian commercial fishermen in an isolated camp in Alaska, Johnson and Miller (1983) and
Johnson and Finney (1986) described the example of a deviant member (i.e., the worst fisherman of the group) who
helped to mitigate conflict between the two major subgroups within the network of fishermen. During the fishing
season of 1980, a strike had idled most of the fishermen in the camp. This was a period of boredom, high stress, and
high potential for inter-personal and inter-subgroup conflict. However, the deviant, because of his status and personal
characteristics, emerged in the role of “court jester,” providing comic relief and a common reference point for all group
members irrespective of subgroup affiliation. The other fishermen made fun of him, played pranks on him, and he was
a fun topic of conversation. He was rewarded for his role and received valuable salmon as compensation. He
maintained moderate proximities among members of both subgroups. His role was important in minimizing conflicts
during this tense period. As other group members described him: “He is the bridge between the two groups,” and “He
belongs to everyone,” (Johnson and Miller, 1983:67).
A substantial body of research has focused on the evolution of network structure. Doreian (1983) and Doreian
and Stokman (1997) provide statistical models for assessing the amount and character of change in network structure.
Romney et al. (1989) discussed models of longitudinal network data in a reexamination of the Newcomb’s (1961)
study of 15 weeks of interactions among members of a fraternity. They found that the structure of the group
converged quickly to a stable final structure. Others, too, have been concerned with statistically modeling stability in

social networks over time, particularly in fixed node networks (Snijders 1990; Sanil, Banks, and Carley 1995) where
only edges vary from one time point to the next. Still others have looked for possible explanations underlying stability
or change including such things as reciprocity, tie strength, transitivity, and structural embeddedness (Feld 1997). The
related work of Sanil et al. (1995), Snijders (1990, 1996, forthcoming), Van de Bunt et al. (1999), and Snijders and
Van Duijn (1997) is important for establishing models for statistical tests of network change in this vein. The work of
Snijders (forthcoming) is particularly noteworthy in his more recent discussion of models of network change that are
the result of stochastic network effects (e.g., transitivity) and various covariates (e.g., gender). In many ways, this
work is similar to what we attempt here in that network change is related to one or more exogenous variables.
Whereas most of these models attempt to understand dynamics as a function of effects and covariates within a single
group over time, our work attempts to understand such dynamics both within and between three evolving networks.
This research also focuses to a greater degree than earlier work on the relationship of the evolution of network
structure to group function.
Propositions
Based on the literature discussed above we might expect the evolution of a globally coherent group structure
(defined below) to be related to the emergence of and agreement on various informal social roles. We specifically
explore the following propositions as they relate to the evolution of network structure over time:
P1: The greater the consensus on informal leadership roles, the more globally coherent the network. P2: The greater the overlap of informal and formal leadership roles the more globally coherent the network. P3: The greater the consensus on expressive leadership roles, the more globally coherent the network. P4: The greater the overlap of instrumental and expressive leadership roles, the more effective the leadership and the more globally coherent the network. P5: The greater the consensus on positive deviant roles (as opposed to negative deviance), the more globally coherent the network.
We examine these propositions in a setting that allows for clear network boundaries and little influence from
factors outside the network of interest. A “natural” laboratory for the study of humans in isolation, the South Pole
Station is the setting for an examination of the propositions.
The Setting
The Amundsen-Scott South Pole Station is located at 90o South Latitude. An American station, the site has
been occupied since the International Geophysical Year in 1956. The original polar station was abandoned in the early

seventies being replaced by a larger station whose most prominent feature is a large geodesic dome that provides
protection for a number of modular buildings.
The station is run by the National Science Foundation and its primary purpose is concerned with scientific
investigation in various fields, most notably astrophysics. Although initially the winter-over crews at South Pole
included both civilian and Naval personnel, it is now exclusively a civilian operation (with the exception of C-130
flights in and out of the pole piloted by the military). Winter-over crews consist of two primary groups of people.
First, there are the support personnel (referred to here as “trades”) who work for a private firm contracted to run the
day-to-day operations of the station. These include plumbers, carpenters, electricians, mechanics, cooks, material
handlers, science and computer technicians, and the station manager. Second, there are the NSF grantees and their
employees (graduate students, science technicians, post-doctoral fellows), often referred to by the “trades” personnel as
“beakers.”
Winter-over crewmembers begin training as a group in August preceding their deployment to Antarctica in
October and remain at the South Pole Station from October of one year through November of the next. They are in
each other's company for over 15 months. Crewmembers are not allowed to stay two successive winters, although this
rule has been broken. Winter temperatures are so cold (record temperature at South Pole –119o F) that flights to the
station are next to impossible, even in medical emergencies. Thus, for the 8.5 months of the Austral winter, the
winter-over crew is completely isolated at the station with no crewmembers entering or leaving. The nearest American
base (McMurdo Station) is over 800 miles away. Joking behavior and pranks are an important part of station culture;
crewmembers are assessed on their ability to both make and take such jokes. Sometimes the pranks stretch what might
be considered in “jest” and verge on being mean-spirited. Over the course of our study, alcohol problems were
generally limited to isolated individuals rather than to an entire subgroup. The increase in the proportion of female
crewmembers at the station over the past 15 years has had a restraining influence both on the incidence of “pranks”
and on the use of foul language. Members of the winter-over crews can be divided into a number of 'natural'
categories: male versus female; smokers versus non-smokers; science personnel versus contract personnel; and within
the contract personnel, support versus construction crew.
The Data
The network data for this study was collected over a three year period with three distinct winter-over crews in
the 1990's at the Amundsen-Scott South Pole Station. Year A had a total winter-over crew of 28 with 9 females and 19
males. Year B had a total winter-over crew of 27 with 20 males and 7 females. Finally Year C had a total winter-over

crew of 22 with 4 females and 18 males. Winter-over crews were the focus of the inquiry and most of the data
reported here is for the 8.5 month winter-over period. During this period, winter-over crews were in complete
isolation with no one coming in or leaving the station between approximately February 15 and October 25 of a given
year. On the 15th day of each of the 8.5 months of the isolation period (March-October), the station physician
distributed and collected questionnaires that asked a number of network and social-psychological questions. Here, we
focus on two primary types of data collected during this period.
The first of these are crewmembers’ self-reports of ratings of social interactions with each of the n-1 other
crewmembers over the prior two weeks. The ratings scale ranged from 0 to 10 with 0 representing no interaction and
10 representing a great deal of interaction. These were collected for a total of 8 months. This resulted in a series of 8
nxn asymmetrical matrices representing valued networks of reported interactions. Finally, additional network data was
collected at the end of the winter in October. This consisted of successive pile-sorts (Boster, 1994) of crewmembers’
perceptions of who “hung-out” with each other. This data provided the means for comparing informants’ perceptions
of group structure (i.e., cognitive networks) as well as providing a picture of the overall final group structure (i.e.,
social network).
The second primary type of data consisted of a sentence frame completion task (Metzger and Williams 1963;
D'Andrade et al. 1972; Johnson and Weller, forthcoming) asking crewmembers to associate crewmembers, including
themselves, with each of eleven possible informal social roles. Crewmembers were asked to circle all the names that
fit a sentence such as “__________ is a natural leader in getting things done around station.” This task was collected
at the beginning, middle, and end of the period of winter-over isolation. In addition, and in conjunction with the
successive pile-sorts, crewmembers were asked at the end of the winter to associate crewmembers with each of 22
informal social roles or role attributes. This differed from the eleven informal roles used in the questionnaire described
above in that an additional set of more negative roles were included. The positive informal roles/role attributes
included “social director” (expressive leader), “leader” (instrumental leader), “everybody's buddy,” “peacemaker,”
“jokes with,” “comedian/clown” (positive deviant), “storyteller,” “counselor,” “someone to count on,” “committed to
work,” and “volunteer”. The more negative informal roles/attributes included “self-exile,” “loner,” “rigid,” “cliquey,”
“disruptive,” “know-it-all,” “whiner,” “hypertense,” and “alcohol problem.” These informal role descriptions were
obtained from a set of open-ended interviews with informants who had wintered at the South Pole prior to the
beginning of our three year study. We focus primarily on three informal roles. The first of these we refer to as
instrumental leadership and was elicited by asking crewmembers to name “natural leaders in getting things done
around station.” The second is expressive leadership and was elicited by asking crewmembers to name “social

directors” and organizers of social events. The final roles concern positive deviance (i.e., clowns and comedians) and
negative deviance (i.e., the negative roles and related attributes listed above).
Global Coherence
We will first examine the extent to which a globally coherent structure evolves and changes over time in each
of the three networks. A globally coherent network is one that forms a single group composed of a unitary core and
periphery and lacks clearly defined cliques or subgroups, whereas a locally coherent network is one that is
factionalized into multiple subgroup or clique structures. This idea is similar to the notion of cohesion as discussed by
Pattison (1993) and more recently by Borgatti and Everett (2000a).
There are many ways of determining the degree to which a network is composed of multiple subgroups.
Borgatti and Everett (2000a) identify core/periphery structures using a block model approach. Their approach
maximizes the correlation between a structure matrix representing a theorized core/periphery structure and a
partitioning of the raw data itself. This sorts actors into core and periphery blocks in which the upper left block of the
model will contain actors with high frequencies of interaction and the lower right block will contain peripheral actors
with low frequencies of interactions.
We measure global coherence by looking at the similarity in patterns of interactions between all i's and j's or,
simply, the degree of structural equivalence among all the actors. The advantage of basing the search for coherence on
structural equivalence as opposed to, say, interaction intensity (i.e., cliques) is two-fold. First, the means for
determining the degree to which actors in the network form a single group of jointly occupied positions is
computationally straight forward, particularly for valued data of the kind here, in comparison to any of the alternative
clique approaches (e.g., n-cliques, k-plexes). More importantly, however, the use of structural equivalence as an index
of global coherence is theoretically appealing because of its conceptual relationship to such notions as social
homogeneity, social similarity, norm consensus, and social homophily (Burt 1982,1983; Johnson 1986). Structurally
equivalent actors will have a greater tendency to share attitudes, beliefs, and norms (Burt 1983, 1982; Johnson 1986)
even if i and j themselves are not directly connected. Thus, globally coherent groups will be characterized by a single
group norm whereas locally coherent groups will have more of a tendency to display multiple norms where such norms
may often be at odds with one another (Festinger et al. 1950). We would expect that globally coherent networks would
have greater group harmony and higher function compared to locally coherent networks.

We have avoided the use of density as an index of global coherence. Density as a summary index obscures
true differences in the structural characteristics of networks (Borgatti and Everett 2000b). Two networks can have
identical densities, but have profoundly different structures. For example, a network with moderate ratings among all
members could yield an identical density as another network with high ratings within subgroups but low ratings
between subgroups.
Visualizing Coherence
In the following sections, we assess the degree of global coherence in a group in several ways. Initially,
network graphs of the social interactions ratings for each of the months and the successive pile sort data collected at
winters' end will provide a visual check for the presence of global coherence. Figures 1-3 show the final group
structures (i.e., at winter’s end in October) for each of the three years in multidimensional scalings (Kruskal 1964) of
the successive pile sort data of crewmembers’ perceptions of who “hung-out” with each other. An inspection of the
three configurations reveals that Year A (Figure 1) has a classic core/periphery structure with the core members
interacting frequently amongst themselves and peripheral members having less interaction with either the core or other
periphery members. This is indicative of global coherence. Crewmembers did not distinguish subgroups during exit
interviews. Year B (Figure 2) has some of the same characteristics as Year A, but has three actors in the periphery and
a core that contains some degree of subgrouping. In this year, crewmembers in exit interviews distinguished three
major subgroups within the core: a subgroup of 10 individuals who hung-out in the galley and was referred to as the
"couch group" (a mix of both science and trades crewmembers); a subgroup of three individuals who worked the night
shift; and a subgroup of 4 couples, many of whom had had several previous winter-overs at the South Pole. Year C
(Figure 3) stands in stark contrast to the other two years in that there is a clear clique structure in which three well
bounded subgroups are evident, thus displaying more local coherence. In exit interviews, crewmembers reported that
members of these subgroups had a tendency to “hang-out” with one another in three separate locations in the station.
Crewmembers labeled these cliques according to the area in the station where members of the groups watched
videotapes such as the "biomed group,” the "library group,” and the "bar group". In addition, there are a number of
crewmembers that lie between the three subgroups (one of whom was the expressive leader) and one clear outlier.
[Insert Figures 1-3 here]

In a further visual examination of the evolution of group structure, we now turn to a comparison within and
between years of the 8 months of social interaction data. Figures 4-6 show the results of a series of correspondence
analyses (Greenacre 1984) of the stacked interaction ratings matrices over the 8.5 month period. Correspondence
analysis provides a means for graphically displaying structural comparisons or structural change (see Kumbasar et al.
1994 for a network example). For each of the figures only the initial position and final position for each crewmember
is shown. The vectors indicate the direction of the movement for each crewmember from March to October (i.e., each
member's position in March [with label] and October [no label]). Year A, with a few exceptions, has most
crewmembers moving inward toward the center of the space. In Year B, movement is somewhat complicated with
many crewmembers moving in the same relative direction while others move slightly in the opposite direction. The
core subgroups discussed above are also indicated on the graph. Finally, Year C stands in contrast to the other two in
that there is a clear movement of crewmembers outward from the center of the space to the periphery in a kind of
structural explosion. In addition, the movement of clusters of crewmembers in basically three different directions
reflects the formation of well-defined subgroups shown in the MDS of the successive pile sort data. Thus, two
distinctly different methods for determining network structure (successive pile sorts and interaction ratings) yield
strikingly similar results.
[Insert Figures 4-6 here]
Table 1 summarizes the movement of actors in each of the three years. Based on a visual inspection of the
plots, counts were made as to whether actors were moving toward each other in the center of the space or away for
each other. There are obvious differences in trends, as illustrated by the table. Year A has the most movement inward
followed by Year B. In Year C, most of the movement is outward as the structure changes from a coherent
core/periphery structure to one that is factionalized into distinct subgroups.
[Insert Table 1 here]
Coherence as Structural Equivalence In discussing goodness-of-fit tests for subgroups determined on the basis of structural equivalence, Burt (1983)
used factor analysis to test the truth of a given equivalence hypothesis and to determine the extent to which actors are

engaged in structurally equivalent relations. Here, we apply Burt’s approach to test whether the whole network forms
a single set of structurally equivalent actors using a much weaker criterion than that used by Burt (i.e., moderate
degrees of overlapping relations rather than identical relations). As he notes, "structurally equivalent actors have
similar distances to every other actor in a system so that distances to structurally equivalent actors are almost perfectly
correlated. In other words, a factor analysis of the covariance matrix among distances to structurally equivalent actors
should yield a single factor if the actors are equivalent under a strong criterion" (ibid: 277). We, too, are interested in a
single factor solution as an indication of the extent to which actors are structurally equivalent, but we are interested in
much weaker degrees of structural equivalence (see Johnson 1986 for a discussion).
The columns of the 24 interaction rating matrices (3 years x 8 months) were correlated to produce 24 inter-
rated correlation matrices. These matrices reflect structural equivalence: the similarity of the actors in their pattern of
social interactions with other group members. These inter-rated similarity matrices were then factored using minimum
residual factor analysis (Comrey, 1962). In this case, the first factor score is a measure of the degree of which each
individual in the group is similar to others in his or her pattern of interactions. To determine the degree of global
coherence in a network, we look at the means, standard deviations, and signs of the first factor scores. A globally
coherent network is one in which the scores are all positive with relatively small variance (with the possible exception
of a few outliers). Figures 7 and 8 show the means and standard deviations of these first factor scores by month for
each of the three years. Both show similar trends across the three years. Years B and C each start with high mean
scores which decline at various rates over time. However, Year C declines dramatically over the winter. In contrast,
Year A begins low and steadily moves upward. A look at variance shows a similar trend with the standard deviation
increasing the most for Year C and declining dramatically for Year A. Figure 9 shows the coefficient of variation or
the ratio of the standard deviation of the first factor score to one plus the mean of the first factor score (σ/(1+ x)) by
month for each of the three years. Figure 10 shows a dot box plot of the first factor scores over time for each of the
years. This graph confirms the trends illustrated in the graphs above but provides more details on the distribution of
the scores over time. The distribution of the scores for the final month (i.e., October) is especially important for our
argument. By winter's end, 41 percent of the actors in Year C have factor scores less than or equal to zero, reflecting
clear subgroup structure. Although Years A and B display much less variation by winter's end, Year A’s distribution
displays the most coherence. Figure 11 is a dot box plot comparing the distributions of scores for the final month of
the winter. It shows that Year A is much more coherent in its structure than Year B. Additionally, the distribution of
scores within years corresponds well with earlier analyses in terms of the presence of subgroups within the core for
Year B, multiple subgroups for Year C, and a well delineated core for Year A.

[Insert Figures 7-11 here]
For a statistical examination of the evolution of network structure over time, we turn to a two factor repeated
measures analysis of variance comparing scores in each of the years over time. The model that compares 3 levels of
factor A (year), having n subjects per level of A, and 8 levels of B (month) is
where αi, βk, and αβik are fixed effects corresponding to main effects for A (year), B (month) and their interaction and
εijk is the effect of random residual error. A random effect due to the jth subject in the ith level of A is denoted by πj(i)
with the assumption that πj(i) be independent and normally distributed (with mean µ and standard deviation σπ2). The
problem of independence in linear models in relation to network data has been discussed elsewhere (Sanil et al. 1995).
Table 2 shows the results of the analysis for both main and interaction effects. There is a significant difference
between years (F=3.494, p<0.035) in the first factor scores over the 8 months of the winter-over. More importantly,
however, there is an interaction effect between year and month indicating significantly different trends (F=6.465,
p<0.0005) in the first factor scores across time1. The dramatically different trends for Years A and C are clearly
evident from an inspection of Figures 7-9. Whereas Year B had the least amount of change over the 8 months of
winter moving from a strongly coherent structure to one that was slightly less coherent, Year A moved from a less to a
more coherent structure while Year C moved in the opposite direction. These trends are further supported by
polynomial tests for the interaction term of the extent to which the changes are linear, quadratic, or cubic. There is a
highly significant linear trend for the interaction effect (linear [F=10.45, p< 0.0005], quadratic [F=4.276, p<0.02],
cubic [F=3.844, p<0.03]).
[Insert Table 2 here]
Given the differences in years in terms of the evolution of network structure, we can now proceed with tests of
the various propositions. If the propositions are to be supported, then there should be markedly different role
,)( ijkikkijiijky εαββπαµ +++++=

distributions in Years B and A as compared with Year C. In the following sections, we examine the evolution of
various roles as they relate to global coherence.
Evolution of Instrumental and Formal Leadership In this section, we examine the propositions concerning the relationships between the evolution of group
structure and the corresponding evolution of social roles. In the first two propositions, we expect a globally coherent
group structure to be associated with both group consensus on instrumental leadership (i.e., informal work leader) (P1)
and the overlap of informal instrumental leadership with formal designated leadership (P2). Our exploration of these
propositions should be considered tentative, given we that our number of cases (three) is insufficient to conduct
statistical tests. Nevertheless, a visual examination of the data should reveal general trends if, in fact, they are present.
Table 3 shows changes in the degree of consensus on the instrumental leadership role between the beginning
and end of winter. We consider strong consensus to be when 67 percent or more of those responding assign a role to a
given individual. We consider moderate consensus to be when 33 to 66 percent of those responding assign a role to a
given individual. The table reveals two important trends that are both in the predicted direction. First, the two most
coherent years move from a lack of consensus on instrumental leadership to strong consensus: for Year A, all of the
respondents agreed that the formal leader (i.e., the station manager) was an informal instrumental leader. On the other
hand, Year C moves from consensus to strong disagreement on informal instrumental leadership. More importantly,
however, is the trend toward both high agreement on and the overlap of both formal and informal leadership roles for
Years A and B as compared to Year C. In Years A and B, agreement on instrumental leadership increases over time
and the formal leader, the station manager, exclusively occupies the informal leadership role. For Year C, the change
is in the opposite direction. At the beginning of the winter, there is strong consensus that the station manager is the
informal leader. However, by the end of the winter there is competition between the formal leader and two other
crewmembers for informal instrumental leadership, leading to role “collision.” This corresponds with the shift from
global coherence with the manager as the clear informal leader to greater factionalization with competition among
many informal leaders towards the end of the winter.
[Insert Table 3 here]
Figures 12-14 illustrate the consolidation of the role of informal leader in relationship to group structure. They
show a correspondence analysis of the October (winter's end) network structures with formal leaders (station

managers) indicated by white circles. In order to show relations of moderate strength and above, the social interactions
ratings data for each of the years were dichotomized using the following criterion.
1, if r > 4 Xij = 0, otherwise
In Year A (Figure 12), the manager is positioned in the center of the dense core of the network. In Year B (Figure 13),
the formal leader is in the center of a slightly less dense network core. Finally, in Year C (Figure 14), the formal
leader is central to one of the three main subgroups found in the network, but not in a position that is central to the
entire network structure.
[Insert Figures 12-14 here]
Evolution and Expressive Leadership
Although not as critical as instrumental leadership, expressive leadership is also important for positive group
interaction. Propositions three and four concern the relationship of coherent group structure to consensus on
expressive leadership and to the integration of expressive and instrumental leadership roles (House 1977). Table 4
provides data on the changes in consensus on expressive leadership over the course of the winter. Years A and B shift
from a lack of consensus on expressive leadership to a consensus on expressive leadership, especially in Year A. Year
A ends with high agreement that three individuals play the role of expressive leader with moderate consensus on two
others. This is as predicted by P3. However, in this year, the expressive role is not integrated with the informal
instrumental leadership role, violating P4. Year B goes from the total absence of expressive leadership to one of
moderate consensus on two crewmembers (one of whom is the station manager), in conformance with both P3 and P4.
There seems to be slightly more support for role differential theory over the role integration approaches advocated by,
for example, House (1977).
[Insert Table 4 here]

Year C, on the other hand, moves from high consensus on one individual and moderate consensus on another
(the station manager) to the complete disappearance of anyone occupying an expressive leadership role. The coupling
of the loss of the expressive leader with the loss of group global coherence conforms to both P3 and P4.
Evolution and Deviant Social Roles
Finally, P5 is tested through an examination of the presence or absence of both positive (e.g., “joker/clown” or
comedian) and negative deviant roles (e.g., “rigid,” “disruptive,” “whiner”) at the end of the Austral winter in the
three years. Table 5 shows the frequency counts for both positive and negative roles. Years A and B have a number of
individuals playing positive deviant roles with little or no negative deviance. In contrast, Year C has only one
moderately agreed upon positive deviant role while there are two crewmembers seen as playing more negative roles.
Thus, the two years with the more coherent structures have a higher degree of positive deviance while the least
coherent year has the highest amount of negative deviance, in support of P5.
[Insert Table 5 here]
Discussion and Summary
The evolution of network structures over the winter varies in the three years. Year A has the highest
coherence at winter’s end. The structure for this year evolves from a less coherent to a more coherent structure at the
end of the winter. Year B has the second highest coherence and follows a slightly different structural pattern over the
winter. In this case, the structure of the group displays a slow decline in coherence having moderate coherence by the
end of the winter. Finally, Year C moves from a highly coherent structure at the beginning of winter to a more
factionalized structure by winter’s end. Figures 12-14 illustrating the final network structures also confirm the
difference in global coherence in the three years. These differences in the evolution and stability of networks over
time suggest that instability is not necessarily either positive or negative; its evaluation depends on the kind and
direction of change that occurs. For Year A the instability is positive in that change led to the development of group
coherence over time. For Year C, the instability is negative in that the group shifted from a coherent to a factionalized
network structure over the course of the winter.
Agreement on instrumental leadership increases over time for years A and B but diminishes in Year C
reflecting competition among individual crewmembers for this role. More importantly, there is consolidation of
informal with formal instrumental leadership in Years A and B, while in Year C the trend is in the opposite direction.
Expressive leadership roles disappear completely in Year C, while Year A has high consensus on multiple individuals

in that role and Year B has moderate consensus for two individuals in that role, including the station manager (i.e., a
case of role integration).
At winter's end, positive deviant roles, such as clowns or comedians, are present in Years A and B, but mostly
disappear in Year C (moderate consensus on one crewmember). Instead, Year C has the highest amount of negative
deviant roles of the three years studied. Events transpired in Year C to undermine the ability of the formal leader to
maintain his/her informal leadership role. This was further exacerbated by the disappearance of the only expressive
leader sometime in the middle of winter (due in part to harassment by a marginalized crewmember). Lack of multiple
expressive leaders meant that the group was very dependent on a single individual to perform this important role over
the course of the entire winter. The efforts of some of the disruptive crewmembers (i.e., negative deviants) eventually
led to the withdrawal of the expressive leader. This made the formal leader’s ability to maintain group coherence
much more difficult.
The importance of expressive leadership lies in the ability of individuals in these roles to bring people together
in a variety of social contexts (e.g., dinner parties, sporting events, role playing games, movie nights). In these
settings, higher rates of social interaction aid in limiting gossip and slow the formation and maintenance of negative
stereotypes (e.g., particularly as it relates to the trades vs. beakers distinction), all potential contributors to conflict and
division. There appears to be a clear advantage in having several individuals in the role of expressive leader. Unlike
the role of instrumental leader where the effects of role competition or “collision” can be detrimental, multiple
individuals playing the role of expressive leader ensures that there will be adequate expressive leadership despite the
psychological stresses due to isolation and confinement.
Conclusion There is reasonable tentative support for four of the five hypothesized propositions, albeit with a small number
of cases. The exception is P4 concerning the integration of leadership roles. The evidence suggests that the presence
or absence of certain informal social roles in groups is important in allowing or preventing the evolution of a globally
coherent group structure.
It should be pointed out that the informal roles discussed here are not independent of one another. A globally
coherent group is one that has individuals playing a combination of informal roles that are essential to the proper
functioning of the group. In Year C, the formal group leader lost his/her recognition as the informal leader in part
because of the loss of an expressive leader and because of the emergence of negative deviants. Competent leadership
alone is not enough to grow and maintain a globally coherent network structure. Rather, it is necessary to have a

combination of positive social roles filled by different individuals so that members of the group mesh with one another
and contribute to group solidarity and norm consensus. It is the interplay of these various roles at various levels that
ultimately determines the evolution of network structure in isolated and extreme environments, and probably in other
settings as well.
*This research was supported by the National Science Foundation grants BNS-9011351 and OPP-9610231. In addition, a portion of this work was sponsored by a grant from the National Aeronautics and Space Administration grant NAG-5-4571. We would like to warmly thank the winter-over crews of South Pole Station for their kindness, friendship, and generous cooperation.
Footnotes
1. Other assumptions of the model, such as compound symmetry, are generally met as indicated by the ultraconservative adjusted probabilities of the Greenhouse and Geiser statistic (p< 0.0005) and the multivariate tests provided in SYSTAT which are all in agreement.

References
Bales, R.F., “Task roles and social roles in problem solving groups,” Readings in Psychology, E.E. Maccoby, et al.
(eds.), New York: Holt, Rinehart, and Winston, 1958. Bales, R.F. and F.L. Stodtbeck, “Role differentiation in small decision-making groups,” Family, Socialization, and
Interaction Process, T. Parsons, et al. (eds.), New York: Free Press, 1955. Bales, R.F., “The equilibrium problem in small groups,” Working Papers in the Theory of Action, T. Parsons, et al.
(eds.), New York: MacMillan, pp. 111-161, 1953. Bales, R.F. and P.E. Slater, “Role differentiation in small decision-making groups,” Family, Socialization, and
Interaction Process, T. Parsons, et al. (eds.), New York: Free Press, 1955. Bernard, H.R. and P.D. Killworth, “On the social structure of an ocean-going research vessels and other important
things,” Social Science Research 2:145-184, 1973. Borgatti, Steve, UCINET V. Natick, MA: Analytical Technologies, 1999.
Borgatti, Steve and M. Everett. Models of Core/Periphery Structures. Social Networks, 2000a. Borgatti, S. and M. Everett. Properties of Core/Periphery Structures. Paper presented at
Mathematical Sociology in Japan and in America: A Joint Conference. Honolulu, Hawaii June 23-25, 2000b.
Boster, James S. The Successive Pile Sort. Cultural Anthropology Methods 6(2):7-8, 1994. Burt, Ronald S. 1978. "Cohesion Versus Structural Equivalence as a Basis for Network Subgroups" Applied Network
Analysis: A Methodological Introduction, R. Burt , M. Minor and Associates (eds), London: Sage Publications, pp. 262-282, 1983.
Burt, R.S. 1982. Toward a Structural Theory of Action: Network Models of Social structure, Perception and Action.
NY: Academic Press
Chowdry, K. and T.M. Newcomb, “The relative abilities of leaders and non-leaders to estimate opinions of their own groups,” J. of Abnorm. Soc. Psych. 47:51-57, 1952.
Comrey, A.L. The minimum residual method of factor analysis. Psychological Reports 11:15-18, 1962. D'Andrade, R., N. Quinn, S. Nerlove, and A. Romney. "Categories of Disease in American-English and
Mexican-Spanish," Multidimensional Scaling: Theory and Applications in the Behavioral Sciences, A Romney, R. Shepard and S. Nerlove (eds), vol ii/Applications, New York: Seminar Press, pp. 5-54, 1972.
Dentler, R.A. and K.T. Erickson, “The function of deviance in small groups,” Social Problems 99-107, 1959. Doll, R.E. and E.K.E. Gunderson, “Group size, occupational status, and psychological symptomatology in an extreme
environment,” Journal of Clinical Psychology 27:196-198, 1971. Doreian, P. On the evolution of group and network structures. II. Structures within structure. Social Networks 8: 33-
64, 1983.. Doreian P., and F.N. Stokman (eds).. Evolution of Social Networks. Amsterdam etc.: Gordon and Breach,
1997. Dunlap, R.D., “The selection and training of crewmen for an isolation and confinement study in the Douglas Space
Cabin Simulator,” Douglas Aircraft Company, Inc., Santa Monica, CA, Douglas Paper No. 3446, 1965.

Earls, J.H., “Human adjustment to an exotic environment,” Archives of General Psychiatry 20:117-123, 1969. Feld, S.. Structural embeddednes and stability of interpersonal relations. Social Networks 19:91-95, 1997. Festinger, L., “Theory of social comparison processes,” Human Relations 7:117-140, 1954. Festinger, L., S, Schachter, and K.W. Back. 1950. Social Pressures in Informal Groups. Stanford: Stanford
University Press. Fiedler, F.E., “Validation and extension of the contingency model of leadership effectiveness,” Psychological Bulletin
76:128-148, 1971. Freeman, L.C., D. Roeder, and R. Mulholland, “Centrality in social networks II: Experimental results,” Social
Networks 2:119-141, 1979. Gibb, C.A., “Leadership,” The Handbook of Social Psychology, G. Lindzey and E. Aronson (eds.), vol. iv, Reading,
MA: Addison-Wesly, pp. 205-282, 1969. Goodenough, W.H., “Rethinking ‘status’ and ‘role,’” Cognitive Anthropology, S. Tyler (ed.), New York: Holt,
Rinehart, and Winston, 1969. Goudan, D.S., “conceptual and methodological approaches to the study of leadership,” Central States Speech J.
21:217-223, 1970. Greenacre, M.J. Theory and Application of Correspondence Analysis. London: Academic Press, 1984.. Gunderson, E.K.E. “Psychological studies in Antarctica,” In E.K.E. Gunderson (ed.), Human Adaptability to Antarctic
Conditions (pp. 115-131), Washington, DC: American Geophysical Union, 1974. Gunderson, E.K.E. Psychological studies in the U.S. Antarctic Program: a review. Scott Polar Res Inst Polar Symposia
1991; 1:5-8.
Hall, R.L., “Social influence on the aircraft commander’s role,” American Sociological Review 20:292-299, 1955. Hammes, J.A. and R.T. Osborne, “Survival research in group isolation studies,” Journal of Applied Psychology
49:418-421, 1965. Hare, A.P., Handbook of Small Group Research, New York: Free Press, 1976. Harrison, A.A. and M.M. Connors, “Groups in exotic environments,” Advances in Experimental Social Psychology
18:49-87, 1984. House, R.J., “A 1976 theory of charismatic leadership,” Leadership: The Cutting Edge, J. Hunt and L. Larson (eds.),
Carbondale: Southern Illinois Press, pp. 189-207, 1977. Huntford, R., Scott and Amundsen: The Race to the South Pole, New York: Athenaeum, 1984. Johnson, J.C. and M.L. Miller, “Deviant social positions in small groups: The relation between role and individual,”
Social Networks 5:51-69, 1983. Johnson, J.C., “Social networks and innovation adoption: A look at Burt’s use of structural equivalence,” Social
Networks 8:343-364, 1986. Johnson, J.C. and B.R. Finney, “Structural approaches to the study of groups in space: A look at two analogs,” Journal
of Social Behavior and Personality 1(3):325-347, 1986. Johnson, J.C., “Social structure and effectiveness in isolated groups,” presented at 27th Aerospace Sciences Meeting,
Reno, Nevada, January 1989, AIAA-89-0592, 1989.

Johnson, J.C. and S. Weller. Forthcoming. Elicitation Techniques in Interviewing. In The Handbook of Interviewing,
(eds.) J. Gubrium and J. Holstien. Sage: Newburry Park. Killworth, P.D. and H.R. Bernard, “Catij: A new sociometric and its application to a prison living unit,” Human
Organization 33:335-350, 1974. Klein, M. and G. Christiansen, “Group composition, group structure, and group effectiveness of basketball teams,”
Sport, Culture, and Society, J. Loy and G. Kenyon (eds.), New York: MacMillan, 1969. Kruskal, J.B. Nonmetric multidimensional scaling: A numerical method. Psychometrika 29:115-129, 1964. Kumbasar, E., A. K. Rommey, W. H. Batchelder, Systematic Biases in Social Perception. American Journal of
Sociology, Vol. 100, No. 2. (Sep.), pp. 477-505, 1994. Leanov, A.A. and V.I. Lebedev, Psychological Problems of Interplanetary Flight, NASA Tech. Translation NASA
TTF-16536, 1975. Lewis, G.H., “Role differentiation,” American Sociological Review 37:424-434, 1972. MacKenzie, K.D., “A Theory of group structures,” Vols. I and II), New York: Gordon and Breach, 1976. McGuire, F. and S. Tolchin, “Group adjustment at the South Pole,” British Journal of Psychiatry 107:954-960, 1961. Meeker, B.F. and P.A. Weitzel-O’Neil, “Sex roles and interpersonal behavior in task-oriented groups,” American
Sociological Review 42:91-105, 1977. Merton, R.K., Social Theory and Social Structure, Glencoe, Ill.: Free Press, 1957. Metzger, D. and G. Williams, "An ethnographic analysis of Tenejapa Ladino weddings," American
Anthropologist, 65:1076-1101. 1963. Natani, K. and J.T. Shurley, “Sociopsychological aspects of a winter vigil at South Pole station,” in E.K.E. Gunderson
(ed.), Human Adaptability to Antarctic Conditions (pp. 89-114). Washington, DC: American Geophysical Union, 1974.
Newcomb, T.M., Personality and Social Change, New York: Holt, Rinehart, and Winston, 1943. Newcomb, T.M. 1961. The Acquaintance Process. New York: Holt, Reinhard & Wilson. Nicholas, J.M., H. Clayton, and F.L. Ulschak, “Crew productivity issues in long-duration space flight,” Proceedings of
the AIAA 26th Aerospace Sciences Meeting, 1988. Palinkas, L.A., “The human element in space: Lessons from Antarctica,” Engineering, Construction, and Operations in
Space, S.W. Johnson and J.W. Wetzel (eds.), New York: American Society of Civil Engineers, pp. 1044-1055, 1988.
Palinkas, L.A., “Sociocultural influences on psychosocial adjustment in Antarctica,” Medical Anthropology 10:235-
246, 1989a. Palinkas, L.A., “Antarctica as a model for the human exploration of mars,” Case for Mars III, C. Stroker (ed.), San
Diego: Univelt, pp. 215-228, 1989b. Palinkas, L.A., “Small group and organizational influences on stress and performance,” Proceedings: The Combined
Effects of Multiple Stressors on Operational performance, E.K.E. Gunderson (ed.), Technical Report No. 89-58, San Diego: Naval health Research Center, 1989c.

Palinkas, L.A., “Psychosocial effects of adjustment in Antarctica: Lessons for long-duration space flight,” Journal of Spacecraft and Rockets 27:471-477, 1990.
Palinkas, L.A., “Going to extremes: The cultural context of stress, illness and coping in Antarctica,” Social Science
and Medicine 35:651-664, 1992a. Palinkas, L.A. and D. Browner, “Effects of prolonged isolation in extreme environments on stress, coping, and
depression,” Journal of Applied Social Psychology 25:557-576, 1995. Palinkas, L.A., M. Cravalho, and D. Browner, “Seasonal variation of depressive symptoms in Antarctica,” Acta
Psychiatrica Scandinavia 91:423-429, 1995. Palinkas, L.A. , J.C. Johnson, J.S. Boster, and M. Houseal. Longitudinal Studies of Behavior and Performance During
a Winter at the South Pole. Aviation, Space, and Environmental Medicine 69(1) 73-77, 1998. Palmai, G., “Psychological observations on an isolated group in Antarctica,” British Journal of Psychiatry 131:651-
654, 1963. Pattison, P. Algebraic Models for Social Networks. Cambridge: Cambridge University Press, 1993. Pierce, C.M., “Social science research in high latitudes,” Journal of Clinical Psychology 41:581, 1985. Rees, C.R. and M.W. Segal, “Role differentiation in groups: The relationship between instrumental and expressive
leadership,” Small Group Behavior 15:109-123, 1984. Riecken, H.W., “some problems on consensus development,” Rural Sociology 17:245-252, 1952. Roberts J.M. and J. Wicke, “Flying and expressive self-testing,” Naval War College Review 23:67-80, 1971. Roberts, J.M., Q. meeker, and J. Aller, “Action styles and management game performance,” Naval War College
Review 24:65-81, 1972. Roberts, J.M., T. Golder, and G. Chick, “Judgment, oversight and skill: A cultural analysis of P-3 pilot error,” Human
Organization 39:5-21, 1980. Roberts, J.M. and D. Kundrat, “Variation in expressive balances and competence for sports car rally teams,” Urban
Life 7:231-251, 275-280, 1978. Roberts, J.M. and S. Nuttrass, “Women and trapshooting,” Play and Culture H.B. Schwartzman (ed.), West Point, NY:
Leisure Press, 1980. Rohrer, J.H., “Interpersonal relationships in isolated small groups,” Psycho-Physiological Aspects of Space Flight,
B.E. Flaherty (ed.), New York: Columbia University Press, pp. 263-271, 1961. Romney, A.K., S.P. Borgatti, and K. Nakao, “Three-way Correspondence Analysis: The Newcomb and Nordlie Data,”
Paper presented at the Sunbelt IX Social Network Conference, Tampa, Florida, 1989. Sanil, A. , D. Banks, and K. Carley 1997. Models for evolving fixed node networks:Model fitting and model testing.
Social Networks 17:1995. Slater, P.E., “Role differentiation in small groups,” American Sociological Review 20:300-310, 1955. Smith, W.M., “Observations over the lifetime of a small isolated group: Structure, danger, boredom, and vision,”
Psychological Reports 19:475-514, 1966. Snijders, T. 1990. Testing for change in a digraph at two time points. Social Networks 12:539-373. Snijders, T. 2001. "The Statistical Evaluation of Social Network Dynamics," Sociological Methodology
(pending).
Snijders, T and M. Van Duijn. 1997. "Simulation for statistical inference in dynamic network models. Pp.
493-512 in Stimulating Social Phenomenon, edited by Conte, R., R. Hegselmann, and P. Terna. Berlin: Springer.
Strange, R.E. and S.A. Youngman, “Emotional aspects of wintering over,” Antarctic Journal of the United States
6:255-257, 1971. Taylor, A.J., “The adaptation of New Zealand research personnel in the Antarctic,” Polar Human Biology: Proceedings
of the SCAR/IUPS/IUBS Symposium on Human Biology and Medicine in the Antarctic, O.G. Edhom and E.K.E. Gunderson (eds.), Chicago: Heinemann, pp. 417-429.
Taylor, A.J., Antarctic Psychology, DSIR Bulletin No. 244. Wellington, NZ: Science Information Publishing Centre,
1987. Van de Bunt, G.G., M.A.J. Van Duijin, and T.A.B. Snijders. 1999. "Friendship networks through time: An
actor-oriented statistical network model. Computational and Mathematical Organization Theory 5:167-192.

Table 1. Comparison of direction of movement from t1 to t8.
Out In
Year A 7 21
Year B 12 15
Year C 18 3
FI(x) = 18.58 Exact p = 0.001

Table 2. Two factor repeated measures analysis of variance comparing first factor scores over time for the three years. Between Subjects SS df MS F P YEAR 3.567 2 1.784 3.494 0.035 Error 37.776 74 0.510 Within Subjects SS df MS F P Month 0.547 7 0.078 1.335 0.231 Month*YEAR 5.295 14 0.378 6.465 0.000 Error 30.305 518 0.059

Table 3. Comparison of consensus on instrumental leader role and isomorphism with formal leadership role between beginning and end of winter-over. Beginning End Year High Moderate High Moderate Consensus Consensus Consensus Consensus (c> .66) (.33<c<.67) (c> .66) (.33<c<.67) A 0 2* 1* 2 B 0 1* 1* 1 C 1* 1 0 3* *denotes formal leader in frequency count

Table 4. Comparison of consensus on expressive leader role between beginning and end of winter. Beginning End Year High Moderate High Moderate Consensus Consensus Consensus Consensus (c> .66) (.33<c<.67) (c> .66) (.33<c<.67) A 1 0 3 2 B 0 0 0 2* C 1 1* 0 0 *denotes formal leader in frequency count
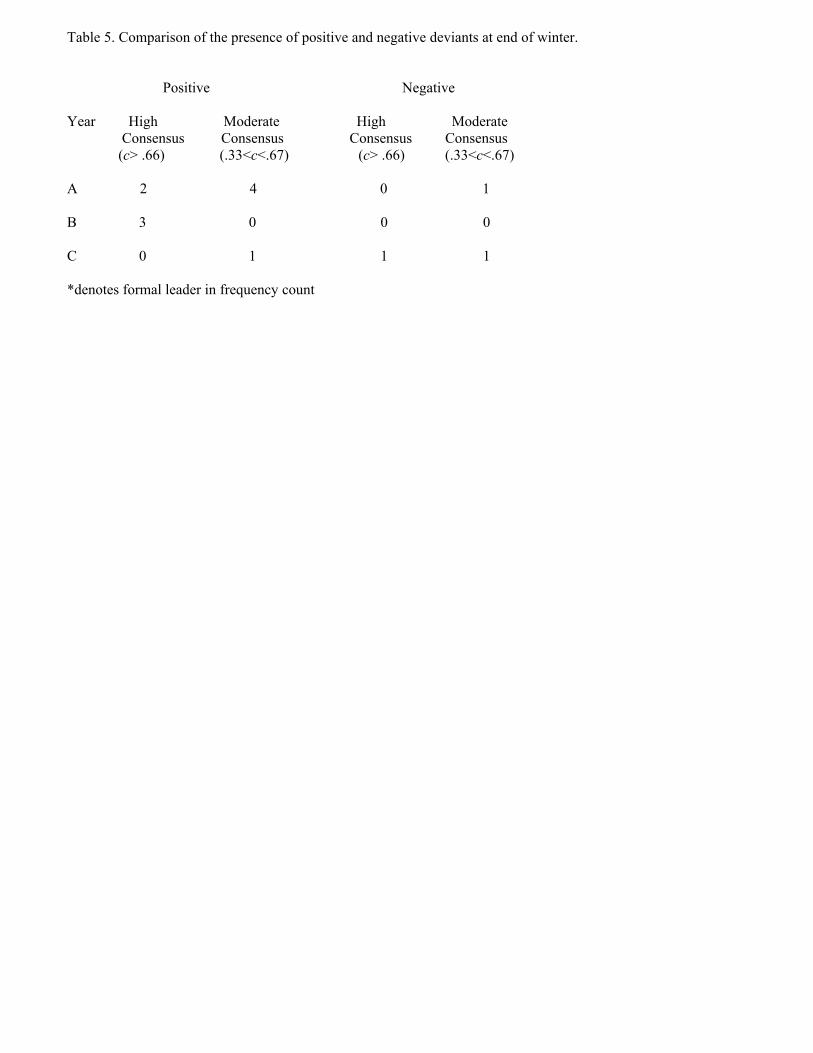
Table 5. Comparison of the presence of positive and negative deviants at end of winter. Positive Negative Year High Moderate High Moderate Consensus Consensus Consensus Consensus (c> .66) (.33<c<.67) (c> .66) (.33<c<.67) A 2 4 0 1 B 3 0 0 0 C 0 1 1 1 *denotes formal leader in frequency count

List of Figures
Figure 1. MDS of successive pile sort data on “who hung-out with whom” for Year A. Figure 2. MDS of successive pile sort data on “who hung-out with whom” for Year B. Figure 3. MDS of successive pile sort data on “who hung-out with whom” for Year C. Figure 4. Correspondence analysis of the stacked social interaction matrices for the 8 months of winter showing actor’s initial position on March (beginning of vector) and final position in October (end of vector) for Year A. Figure 5. Correspondence analysis of the stacked social interaction matrices for the 8 months of winter showing actor’s initial position on March (beginning of vector) and final position in October (end of vector) for Year B. Figure 6. Correspondence analysis of the stacked social interaction matrices for the 8 months of winter showing actor’s initial position on March (beginning of vector) and final position in October (end of vector) for Year C. Figure 7. Change in mean first factor scores over the 8 month winter. Figure 8. Change in the standard deviation of first factor scores over the 8 month winter. Figure 9. Change in the coefficient of relative variation (CRV) of first factor scores over the 8 month winter. Figure 10. Box plot of first factor scores by month for the three years showing the distribution of values.
Figure 11. Box plot of first factor scores of October for the three years, showing the distribution of values. Figure 12. Graph of October (final) structure from stacked correspondence analysis showing the position of the manager in Year A. Figure 13. Graph of October (final) structure from stacked correspondence analysis showing the position of the manager in Year B. Figure 14. Graph of October (final) structure from stacked correspondence analysis showing the position of the manager in Year C.

Figure 1
�� �� �� � ���
��
�
�
�
�
�
�
�
�
�
�
�
�
�
���
��
�
�
� �
�
��
�
!
����
�����������
�������

Figure 2
�� �� �� � ���
��
�
�
��
�
�
�
�
�
�
�
�
�
��
� �
��
��
�
�
�
�
���� ��
����������
���������

Figure 3
��"# ��"# ��"# �"# �"#��"�
��"#
�"�
�"#
�"�
�
�
���
�
��
�
��
�
�
�
��
�
�
�
������������
���������
������������

Figure 4
��"� ��"# �"� �"# �"���"�
��"#
�"�
�"#
�"�
!��
�
�
�
�
�
��
���
�
�
��
�
�
�
�
�
�
�

Figure 5
��"� ��"# �"� �"# �"���"�
��"#
�"�
�"#
�"�
�
��
�
�
��
�
�
��
�
�
�
�
���
�
�
�
�
��$%&'(�&$)'
�*+,-./
�*+0&

Figure 6
��"� ��"# �"� �"# �"���"�
��"#
�"�
�"#
�"�
��
��
�
�
�
�
�
�
�
�
�
�
�
���
�
�$*1.2(�3*+,
�$!3 34(�3*+,
� 3(�3*+,

Figure 7
� � � � 5 # 6 7 8 9����
�"�
�"�
�"�
�"�
�"5
�"#
�"6
���(�����(�����
�(����
���(����(����(�
���
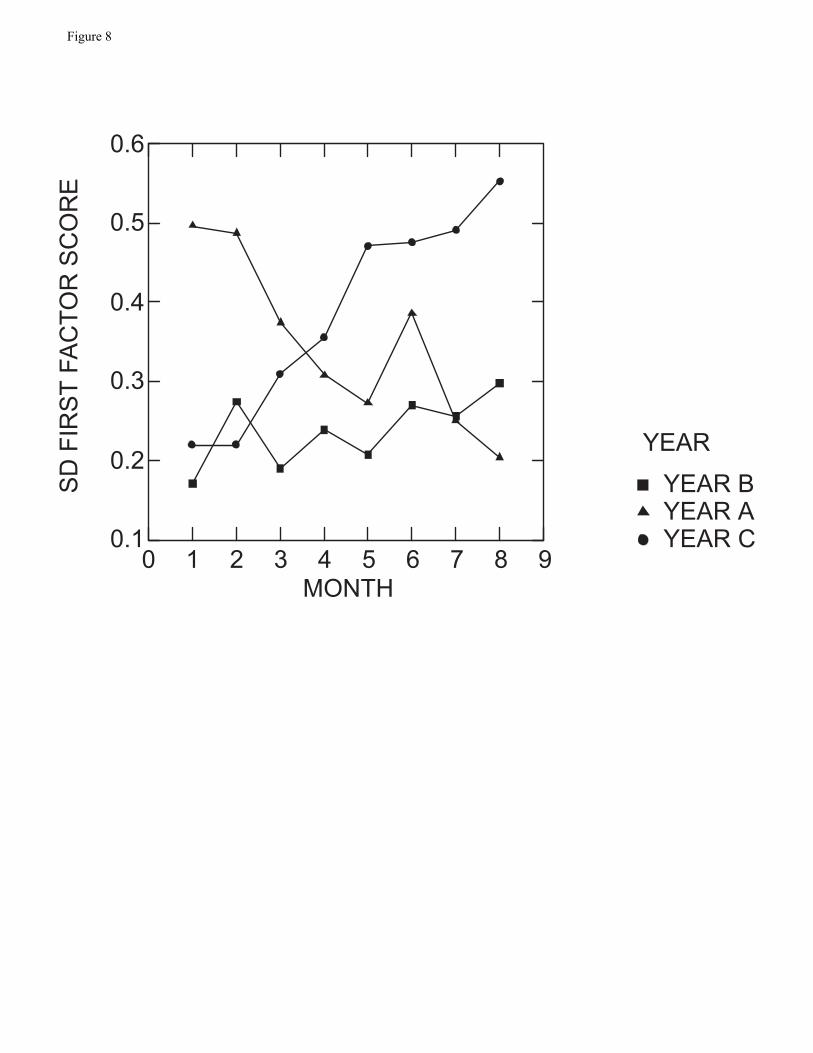
Figure 8
� � � � 5 # 6 7 8 9����
�"�
�"�
�"�
�"5
�"#
�"6
�(�����(�����
�(����
���(����(����(�
���

Figure 9
� � � � 5 # 6 7 8 9����
�"�
�"�
�"�
�"5
�"#
���(�����(�����
�(����
���(����(����(�
���

Figure 10
����
�"�
�"#
�"�
�"#
�"�
�����(�����
�(����(:�(;(����<
���
���
�
�
�
�
�
��
�
�
5
5
5
#
#
#
6
6
6
7
77
8
8
8
� ��

Figure 11
���
�"�
�"#
�"�
�"#
�"�
�����(�����
�(����(:�(;(����<
� � �

Figure 12
� = %.3

Figure 13
�$%&'(�&$)'
�*+,-./
�*+0&(�3*+,
� = %.3

Figure 14
�$*1.2(�3*+,
�$!3 34(�3*+,
� 3(�3*+,
� = %.3
*+'-$.3