social protection programmes, asset dynamics and distributional effects: evidence from ethiopia’s...
TRANSCRIPT

ETHIOPIAN DEVELOPMENT RESEARCH INSTITUTE
Social Protection Programmes, Asset Dynamics and Distributional Effects:
Evidence from Ethiopia’s Productive Safety Nets Programme
Guush Berhane - IFPRI -ESSPMehari Hiluf Abay - IFPRI -ESSP
Ethiopian Economics Association (EEA) 13th International Conference on the Ethiopian Economy
July 23 - 25, 2015
1
Outline
• Introduction• Research questions• Data and Method• Descriptive results• Estimation results (very preliminary)• Concluding remarks
2
Introduction
3
• Ethiopia’s PSNP is large social protection programme established in 2005.
• Primary objective of PSNP includes :• Improving food security of the poorest
households • Protecting assets of the poorest
households • Safeguarding these households from
further sliding down into extreme poverty aftershocks hit

Introduction
• Successive evaluative studies of the programme find consistent positive effects on household food security over the PSNP operation years.
• For example, according to Berhane et al 2014 , PSNP increased food security by 1.29 month, equivalent to reducing the length of the hungry season by one-third.
• However, the same studies did not establish similar consistent effects on asset holdings (livestock assets measured in tropical livestock units (TLU).
• The PSNP causally improved asset holdings in earlier years (2006-2010) but the effect was not detected in later years.
4
Introduction• Although it is understudied, there are some
expected reasons not to detect this impact. I. Distributional impact of PSNP• Estimation of average (mean) treatment
effect of the PSNP on asset holding may fail to show causal impacts because the impact may vary over quantile of the conditional distribution of asset wealth.
II. Dynamics in asset holding• It is possible that there is insurance motive
behind rural household asset holding, for example, livestock holding.
• PSNP as insurance may well play into the livestock holding dynamics as follow.
5
• Evidences show that the PSNP transfer levels has become more frequent and predictable over the years.
• Households may have responded to the increasingly higher and predictable transfer levels by saving less on assets.
III. Emerging income generation motive of livestock holding• Farmers may be moving away from
increasing quantity of animals as a stock of wealth in to using animals as a source of income, for example, shift to highbred and quality animals.
• The income generation motive of livestock holding become more important than the savings motive (in which case quantity of livestock is traded for quality)
Introduction
6
Introduction
• The objective of this study is therefore to examine the distributional impacts of the PSNP on livestock as well as other productive asset holdings, and understand the dynamics therein.
7
Research questionsWe investigate the following three questions:
1. Does the impact of PSNP on asset holding distribute differently across different groups of farmers in terms of wealth? 2. Do PSNP transfers play a role in farmers income generation from livestock product?
3. Are there differences in income generation from livestock product across wealth levels?
8
II. Data and Method• Our analysis is based on five round
longitudinal survey data collected on PSNP between 2006 and 2014.
• These data were collected from the four major regions covered by the PSNP (Tigray, Amhara, Oromiya, and SNNPR)
• The sample was constructed by randomly sampling woredas proportional to size from a list of chronically food-insecure woredas stratified by region where the PSNP was operating in 2006.
• Within each woreda, enumeration areas (EAs) were randomly selected from kebeles where the PSNP was operating.
9
• Within each EA, 15 beneficiary and 10 non-beneficiary households were sampled from separate lists for each group, yielding a sample of 25 households per EA.
• This study uses 2, 799 balanced sample households interviewed across all 5 rounds.
Data
10
Method
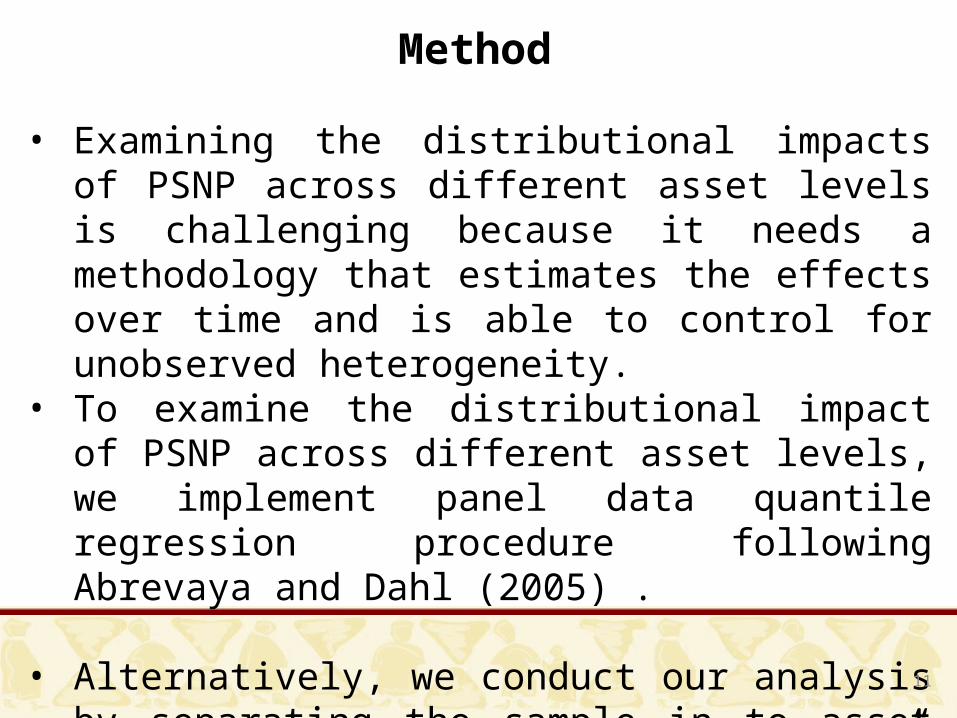
• Examining the distributional impacts of PSNP across different asset levels is challenging because it needs a methodology that estimates the effects over time and is able to control for unobserved heterogeneity.
• To examine the distributional impact of PSNP across different asset levels, we implement panel data quantile regression procedure following Abrevaya and Dahl (2005) .
• Alternatively, we conduct our analysis by separating the sample in to asset wealth terciles (Tercile 1 “poorest”, Tercile 2, and Tercile 3 “richest” households ).
11

12
• To asses that the relatively poor and rich group benefits differently from PSNP, we separately run a generalized instrumental variables (GIV) estimation model on the poorest and richest terciles.
• Similarly, to examine the effect of PSNP on income generation from livestock product we estimate probit model by interacting PSNP with wealth tercile group of the holuseholds.
Method
Descriptive results
13
0.0
1.0
2.0
3.0
4.0
5.0
6.0
Tro
pic
al Liv
esto
ck U
nits
year
BeneficiariesNon-Beneficiaries
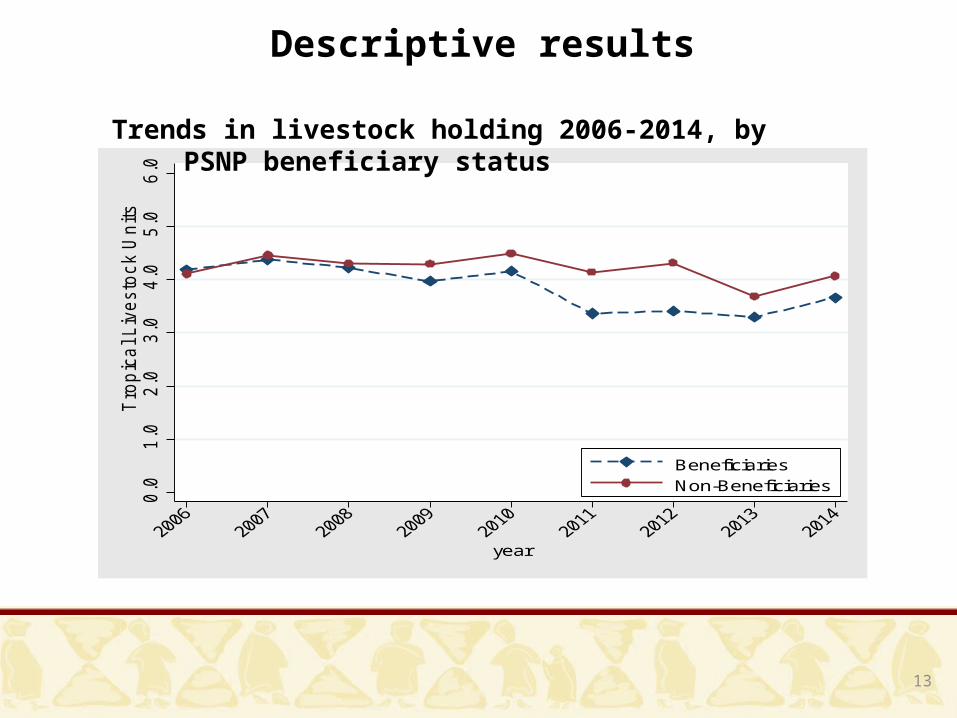
Trends in livestock holding 2006-2014, by PSNP beneficiary status

Descriptive results
14
0.0
0.5
1.0
1.5
2.0
2.5
Tro
pic
al Liv
esto
ck U
nits
year
Beneficiaries
Non-Beneficiaries
Poorest households
0.0
2.0
4.0
6.0
8.0
10.0
12.0
Tro
pic
al Liv
esto
ck U
nits
year
Beneficiaries
Non-Beneficiaries
Richest households
Trends in livestock holding for the poorest and richest terciles 2006-2014, by PSNP beneficiary status
Descriptive results
15
0.0
05.0
1.0
15.0
2.0
25.0
3.0
35.0
4
Cro
ssb
red
liv
esto
ck in
TLU
year
Beneficiaries Non-beneficiaries
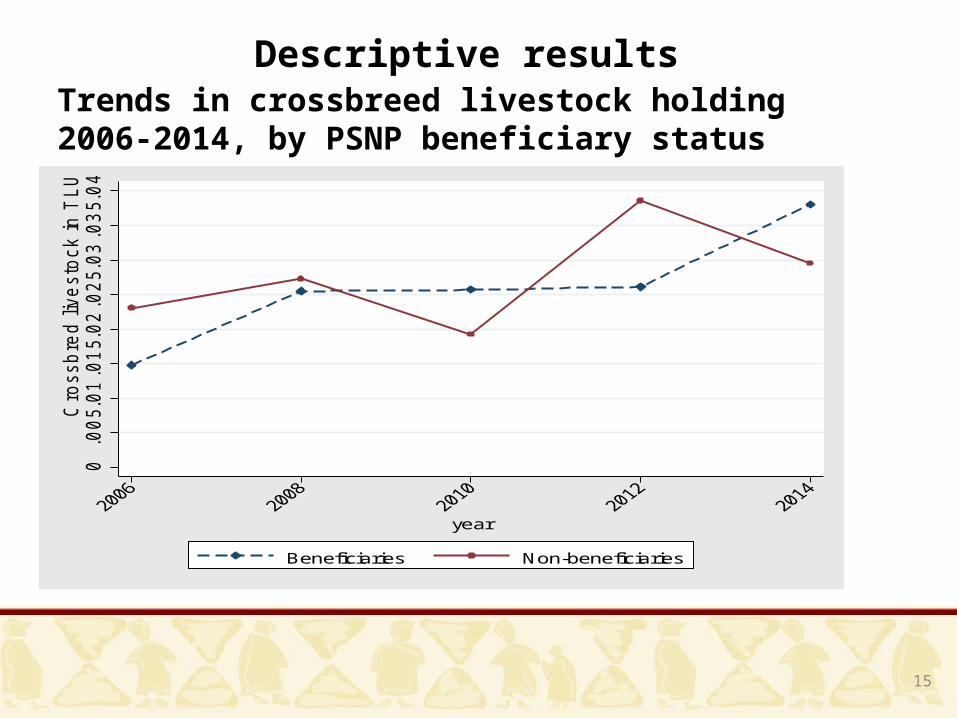
Trends in crossbreed livestock holding 2006-2014, by PSNP beneficiary status

Preliminary estimation results
16
Distributional impact of receipt of PW payments on livestock
holding
Panel quantile estimates: Dependent variable: Livestock
holdings, TLU
Quantiles
Size of
impact
Stand
ard
Error
t
statist
ic Interpretation
0.15 0.129** 0.057 2.26 The impact is
significant and positive
only at the 15 %
quantile. The impact is
focused primarily
among the very poor
beneficiaries with 0.13
TLU.
0.25 .101 .064
1.56
0.50 .028 .085
0.33
0.75 .103 .138
0.75
0.85 .007 .179
0.04
Notes: ** statistically significant at the 5 percent level.
17
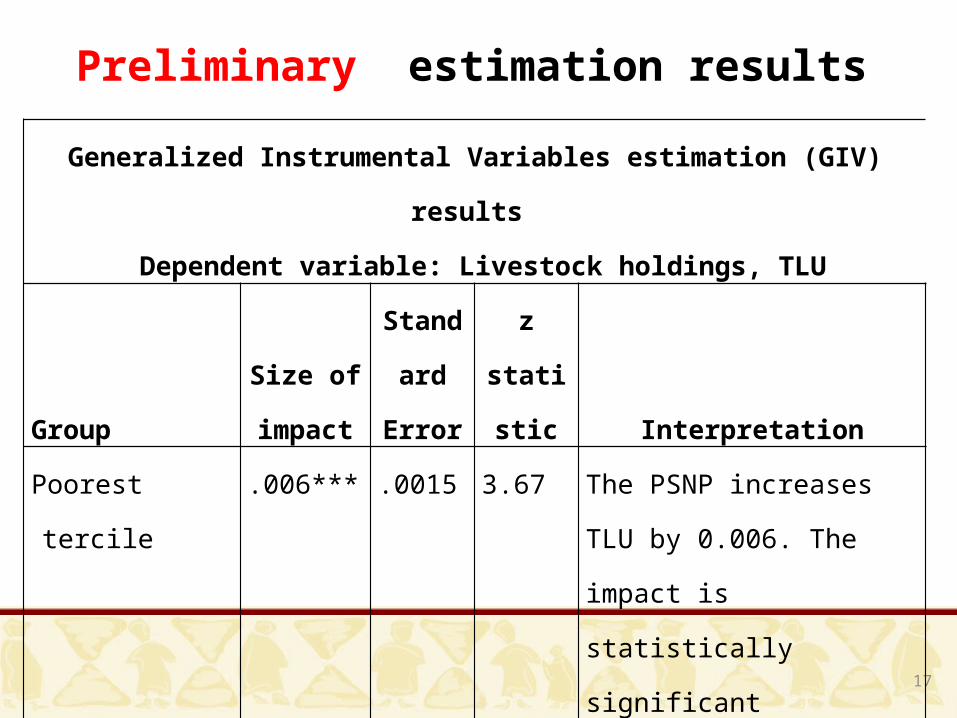
Generalized Instrumental Variables estimation (GIV)
results
Dependent variable: Livestock holdings, TLU
Group
Size of
impact
Stand
ard
Error
z
statis
tic Interpretation
Poorest tercile .006***
.0015
3.67 The PSNP increases TLU
by 0.006. The impact is
statistically significant
Richest tercile -.011 .0086
-1.27 The PSNP has no impact
on this group
Notes: *** statistically significant at the 1 percent level.
Preliminary estimation results

18
Preliminary estimation resultsImpact of PW payment on income generation from livestock
product. Probit model results: Dependent variable: dummy of
generating income from Livestock products
Size of
impact
Standa
rd
Error
z
statisti
c Interpretation
PSNP .547*** .044 12.35 The PSNP increases the
likelihood that beneficiaries
generate income from
livestock products for sale by
5 percentage points. This
impact is statistically
significant.
Richest tercile .525 *** .038 13.95 Households in the richest
tercile have 5 percentage
point higher likelihood to
generate income from
livestock product comparing
to the lower terciles. This
impact is statistically
significant.
Notes: *** statistically significant at the 1 percent level.

19
Concluding remarks
• PSNP has significant positive impacts on livestock asset holdings of the relatively poorest (and more so on the poorest 15th percentile of the sample) households.
• The results, although they are preliminary, indicate that PSNP primarily benefits the relatively poorest households suggesting that impacts of social protection programs may not be wealth neutral even within the eligible household groups

20
Concluding remarks • Households that received Public Works
payments more likely to generate income from livestock products as compared to households that did not receive any Public Works transfers.
• Further our results suggest that this income generation is also wealth dependent, the relatively wealthier households are more likely to shift from the traditional asset holding motive (using livestock as insurance as well as wealth accumulation) to livestock holding as means of income generation.

21
Thank you!