social mobility patterns in romania cristian pop humanist… · · 2015-09-30social mobility...
TRANSCRIPT
SOCIAL MOBILITY PATTERNS IN ROMANIA
Cristian Pop
Institutul de Istorie „George BariŃiu” din Cluj-Napoca Departamentul de Cercetări Socio-Umane
Abstract. My work is a contribution to the social mobility literature by
discussing the case of Romania in a wider context. The article will present and explain
the mobility patterns of five historical cohorts, with accents of men and women
(dis)similarities, born in different socio-historical contexts. They are related to various
social classes which influence their life trajectories and chances for social mobility
(e.g. men tend to move upwards, the high status classes maintain their positions, the
members of the younger cohorts are more mobile etc.). My intention is to describe the
current intergenerational social mobility in Romania, and the differences related to the
mobility rates between cohorts of individuals born in distinct periods. I will search after
explanations for these differences, implied by complex methodologies (such as logistic
regressions, dissimilarity index or origin-destination cross-tabulations). The analyses
of the intergenerational mobility rates, both absolute and relative (odds ratios), will be
done with a critical eye on the limitations impose by these rates.
Keywords: intergenerational social mobility, social classes, absolute mobility
rates, relative mobility rates.
INTRODUCTION
The aim of this study is to analyze the social mobility rates in the Romanian context, for men and women born in five historical periods1 and who compose different social classes. I understand social mobility in the light of Bendix and
1 The first cohort is made of the generation born until 1939, the oldest individual being born in
1917. Here we have the cohort born at the time of the First World War and immediately after. The next cohort is composed from the persons born between 1940 and 1954, in the time of the Second World War. The period 1955–1966 refers to the generation born at the time of the post-Stalinist urbanization politics. The fourth cohort, 1967–1976, is born at the time of the coercive pro-birth policies introduced by the communist regime. The last generation consists of the individuals born in the socialism’s economic crisis period, 1977–1985, a time when socialism began to decline and, afterwards, was replaced (Jecan and Pop, 2012).
An. Inst. de Ist. „G. BariŃiu” din Cluj-Napoca, Series Humanistica, tom. XIII, 2015, p. 29–58

Cristian Pop 2 30
Lipset’s (1962) work as referring to the process through which individuals move from one position to another inside the society where these positions contain a socially embedded hierarchy. The same authors highlight the most important analytic elements composing the study of social mobility: 1. The relation between the point of departure in individuals’ career and the one in which they are at the time of the inquiry; 2. The relation between individual’s social origin and the means of social mobility; 3. Sometimes, it is useful to analyze individuals’ entire occupational trajectory in order to understand the status changes and the quantity of time one spent on different social positions and 4. The consequences social mobility has on mobile/ immobile individuals and also upon the social structure (Bendix and Lipset, 1962).
I decided to concentrate on several questions related to the previous mentioned aspects: How can one describe the current intergenerational social mobility in Romania? Are there any differences related to the mobility rates between cohorts of individuals born in distinct periods? If yes, what are the explanations for these differences? These are the most important questions that articulate my research interest. In analyzing the Romanian social mobility system one could use two different perspectives. According to Richard Breen (2004), the first approach concentrates on studies of intergenerational mobility that examine the relationship between people’s current circumstances and those in which they originated. The focus might be on the relationship between parents and children earnings or on the class position an individual occupies and the class in which she/he grew up. The second perspective concerns studies of intragenerational mobility that look at the change in circumstances during an individual’s own (working) life.
A very common strategy here is the analysis of the relationship between the social class that one has when s/he got his/her first job and that of the current job, but many studies of intragenerational class mobility are much more sophisticated than this, seeking after detailed career trajectories and trying to model them (Breen, 2004). The same author warns us that the data demand for the study of class career mobility are far greater than for the study of intergenerational class mobility. Due to these circumstances, my analyses will concentrate only on intergenerational social mobility seen from two large perspectives: a time related one and a class related one.
In addition, I am interested in explaining both the absolute and relative mobility rates, concentrating myself on theories that explain the basic findings for both. The best known work that speaks about absolute mobility rates is the Lipset-Zetterberg (LZ) theory, which states that various Western industrial societies follow the same overall pattern of social mobility (Lipset and Zetterberg, 1959).
Breen (2004) explains that even though these authors have argued that the pattern of social mobility seems to show little variation between countries and in time, the marginal distributions of mobility tables do appear to vary sufficiently as to invalidate the LZ thesis. In the case of social fluidity, a well-known thesis is that of Featherman, Jones and Hauser’s (the FJH hypothesis), which states that:

3 Social Mobility Patterns in Romania 31
The genotypic pattern of social mobility (circulation mobility) in industrial societies with market economy and a nuclear family system is basically the same. The phenotype pattern of social mobility (observed mobility) differs according to the rate of change in the occupational structure, exogenously determined (as far as individual family is concerned) (Feathermam et al., 1975, p. 340).
In describing the Romanian context, I use a national dataset2 containing individuals born between 1917 and 1985. In my analyses, I use a class schema based on groups defined in terms of their relations to ownership and control over the means of production, and their control over the labour power of others (Pop, 2013), grounded in Kohn and Slomczynski’s work (2006), consistent to the approach of the Nuffield School (John Goldthorpe, Abigail McKnight, Tak Wing Chan etc.), which I tested empirically on the status attainment process (Pop, 2014). The article takes into account the work of other researchers in the field of Romanian social mobility studies, and includes a discussion on differences in five cohorts made out of individuals born in distinct historical periods. The study ends with a section of discussions and conclusions.
RESEARCHES ON THE ROMANIAN SOCIAL MOBILITY PROCESS
In a report drafted for the European Council, Alex Nunn (2011) writes about the complexity and contradictions related to the levels of social mobility in Romania:
“Assessing the level of social mobility in Romania is complex because of the recent history of transition and the rapidly changing nature of the structure of social stratification of the country. In some ways a qualitative assessment of mobility in Romania would suggest that the previous culture and structure of social homogeneity and its replacement with high levels of inequality would have to indicate high levels of inter-generational mobility. However, most would suggest that much of this mobility is negative in the sense of being mobility toward poverty or at least vulnerability to it for many social groups. This is starker in the Romanian context because it is not matched by striking economic success. (…) The Romanian case throws considerable light therefore
2 I used the data from the STRATSOC 2010 project, a dataset collected from the research:
“Class Structure and Social Stratification in Contemporary Romania”. The research was conducted by the University of Bucharest in partnership with the Babeş-Bolyai University Cluj-Napoca, the University of Oradea and the Centre for Urban and Regional Sociology (CURS), with the financial support of the Romanian Ministry of Education and Research, Grant PN-II No. 92131/Oct. 2008. The sample design was a multistage stratified-random sampling, and the final dataset included 4,508 respondents above 25 years old. The field research took place in November-December 2010, and it used face-to-face interviewing at the respondents’ residence.

Cristian Pop 4 32
on the relationship between social mobility and transition but it does not present a simple or clearly understandable causal relationship.” (p. 44)
Conclusions as such were already drawn by various scholars such as Tomescu-Dubrow (2006) in her article on intergenerational social mobility in Romania, where she examines the social mobility fluxes (understood as movements between origins and destinations), and the relationship between class origins and destinations using two conceptualizations of individuals’ place in the social structure: the social class (SC) and the socio-economic index (SEI). Using data from the communist and post-communist period (1970, 1988 and 2000), Tomescu-Dubrow (2006) proves that: 1. The Romanian social mobility increased between 1970 and 2000 (and the structural mobility decreased); 2. The relationship between the social class of origin and the destination one is more intense in 1970 comparing to 2000; 3. There is a very small change between respondents and (their point of departure) fathers socio-economic index between 1988 and 2000 and 4. For the 1988–2000 period, the relationship between father’s and respondent’s SEI strengthened significantly even if the respondent’s educational level is controlled.
The analysis apparently produces antagonistic results as the data for 1970–2000 show an increasing opening of the Romanian society, but those from 1988–2000 indicate a reduced opening of this post-communist society. Tomescu-Dubrow (2006) explains this contradiction through the fact that the social class and the socio-economic status are different dimensions of social inequality. She argues that there is a need for a new and complex approach, one which accounts for both dimensions (SC & SEI). Although the determination link between social origin and destination decreased, she does not argue for assigning a reduced importance of the social class in the post-communist period.
A year after Tomescu-Dubrow’s study, Cucu (2007) tried to find out how it is structured the Romanian middle class. Her analyses concentrate on three dimensions that are central in the crystallization phenomenon of the Romanian middle class: 1. the processes of consolidation of class boundaries through the homogamy of marriages; 2. the processes of recruitment and intergenerational reproduction of class position, and 3. the distance of the middle class from other social classes (Cucu, 2007). Her analysis show a high degree of structuring of class relationships in post-socialist Romania based on marriage. This homogamy is based on the similarity between the representations of actors’ positions related to the cultural and economic capital that they own, and these positions shape the Romanian middle class. She shows that, in the current context of stratification, the middle class is the one that reproduces itself to the highest extent. Regarding the third aspect, that of the distance of the middle class from other social classes, the findings indicate that between the social classes from Romania we have large social distances, expressed in unequal relative odds of mobility (Cucu, 2007), a finding to be further tested with my data.

5 Social Mobility Patterns in Romania 33
In a recent study, Culic and Cucu (2012) used five cohorts of individuals in order to achieve a generational specific understanding of each historical context that creates, reproduces and de-structures social classes using a central event in the respondents’ lives – that is marriage. Also, they investigate social closure through marital homogamy. Another specific intention of this study is to open a critique discussion of a methodological and epistemological nature on the ways one can empirical investigate and conceptualize the crystallization and de-structuring of social classes and class relations. Their intention is to find a way in which the social class could be the subject of empirical investigation, not only of conceptualization. Moreover, Culic and Cucu (2012) present this issue of class empirical investigation based on survey as being that of occupational aggregates that cannot represent the social classes but the ways in which some relations among these categories are structured in time. In order to interpret these relations, which are taking place in the social space in terms of classes, we need a complex historical analysis of the space/ time configurations where the theoretical relations (i.e. exploitation, domination, control, production, property, or exchange), and an understanding of their structuring consequences.
In a previous work (Jecan and Pop, 2012), we present the changes in the correspondence between the respondents’ education and their occupations in Romania, for five generations born between 1917 and 1985. Education is regarded as an important vehicle of social mobility and status attainment, yet it has different effects on individuals’ occupational trajectories, as observed also by Traian Rotariu (1980, 2004). The historical variations of these effects follow the social, economic and political changes taking place in the society. Our analysis shows that the number of individuals with higher education has risen much faster, during the last decades, than that of the number of individuals with higher-status occupations. Due to this structural situation, where the number of graduates with a certain educational level becomes rapidly higher than the number of job offers/occupations that match their educational level, some of the individuals who have graduated from higher education institutions are forced to accept jobs which are below their professional training. The surplus of graduates with a higher level of educational qualification than the available workplaces that require these qualifications, known as the phenomenon of “over-education” (or “over-qualification”), leads to an increase, and tightening of education related hiring criteria, even for occupations that do not necessarily need higher educational credentials. This excludes from some occupations individuals with lower educational levels, for which they were considered to be qualified, but as we move from one generation to another, and the number of individuals with higher educational degrees is increasing, they are considered unfit. Thus, even if the individuals’ chances of accessing the occupations corresponding to their educational level decrease for all categories, this decrease is stronger for the ones with lower education levels (the bumping-down effect; Jecan and Pop, 2012). Assessing the role of education on relative rates of social mobility, these findings can help understand the results of my further analysis.

Cristian Pop 6 34
AN OVERALL LOOK AT THE INTERGENERATIONAL SOCIAL
MOBILITY PATTERNS FROM ROMANIA
Post-socialist Romania’s lack of accurate data on social stratification made the case of our country almost invisible in comparative studies, although its route should resemble those of Poland and Hungary, both being post-communist countries with an important agricultural sector. As Breen (2004) explains, the basic datum for the study of intergenerational social mobility is a mobility table. Such a table is constructed using information drawn from a sample of people of the working age population of a particular country, at a particular point in time. It is a cross-tabulation of class origins by current class position (or class destination) that easily reveals patterns and rates of mobility, where mobility is understood simply as a movement between origins and destinations. By these means we can catch the absolute mobility rates. This research is concerned also with the study of social fluidity (relative mobility) that concerns the relationship between class origins and current class positions. Breen (2004) shows that social fluidity is based on the comparison between people of different class origins, of their chances of being found in one destination class rather than in another one. Also, the same scholar emphasizes that the degree of social fluidity is generally taken as an indicator of societal openness or the extent to which the chances of access to class positions are equally or unequally distributed.
In the class origin-destination distribution the most important change appears in the case of farmers (households owners, traditionally peasants), a class that shrinks from more than 35% to 14% in the case of women and 7% in the case of men, as presented in Table 1 (the distribution is based on respondent’s gender). As destinations, the employers, the managers and the professionals increase as a share from the total, no matter if we are talking about men or women. This is the case also for technicians and office workers. However, there are significant differences between men and women at destination. More men than women become employers and managers and more women are professionals and office workers, an anticipated result as we know that in Romania more women than men have tertiary education (cf. Statistical Office of the European Communities, 2014), in 2008: 56.3% are women; in 2009: 56.3% are women, in 2010: 56.4% are women; in 2011: 56% are women and in 2012: 54.3% are women), which is a condition in order to be a part of the professionals’ class, and for administrative office workers. For men, another increasing destination is the supervisors’ class, this not being the case for women. The most important class destination for men is skilled workers, a class that takes a more than double percent of men comparing to that of the women, even though, in what respects their origin, there is no important gender differentiation. As an overview, in Romania, there is still an important contrast between men and women as destination classes, where the first category is in advantage, being better represented in classes with more decision power.

7 Social Mobility Patterns in Romania 35
Table 1
Class origins and class destinations for men and women (%)
Class origins
(father’s class)
Class destination
(respondent’s class)
Men Women Men Women
Employers 0.5 0.6 2.2 1.3 Managers 4.1 2.9 7.7 4.2 Professionals 0.8 1.3 6.1 9.5 Supervisors 10.2 9.5 14.4 7.9 Self-employed 2.2 2.1 2.2 1.6 Technicians and office workers 5.2 6.6 6.9 21.0 Skilled workers 32.7 31.1 38.9 15.0 Service and trade workers 4.1 5.4 9.4 15.7 Unskilled workers 4.9 2.9 4.9 9.6 Farmers 35.4 35.6 7.3 14.1
Source: STRATSOC 2010 dataset, own calculations.
For a better understanding of the movement patterns between classes, Tables 2
and 3 provide details about the individuals’ outflows. The class with the highest percent of reproduction is that of the professionals, as more than 50% of the sons and daughters of professionals end up in the same class. On the one hand, this pattern is also present in the case of skilled workers and managers, but only for men, while, on the other hand, for farmers, technicians and office workers, service and trade workers in the case of women. Only a quarter of employers’ sons maintain their class position, the rest seem to be downward mobile, but we have to interpret this carefully, because of the small total number of employers. This is also the case for employers’ daughters. For the sons of managers, the only possible direction seems to be down the scale (excluding those who manage to maintain their class position). However, a small percent of women with origins in the managers’ class become employers as a destination. In the case of mobile professionals, half of them are upward mobile and the other half downward mobile. For women, this category presents the highest immobility, but among the mobile ones, the vast majority descents. A quarter of the supervisor’s sons manage to climb the social scale, while almost half of them end up in inferior – as income and education – positions. In the case of supervisors’ daughters, more than half of them are downward mobile.
The most important destination for self-employed men is the skilled workers’ class, while for women is the classes of technicians and office workers along with the service and trade workers ones. For the sons of technicians and office workers, a common trajectory seems to be an ascending one to managers and professional and a descending one to skilled workers. Women outflow from this class mostly to professionals and supervisors, but also to service and trade workers.

Cristian Pop 8 36
Table 2
Intergenerational social mobility of men: outflow percentages
Respondent’s class – men (Class destination)
Father’s class (Class origin)
Employers
Managers
Professionals
Supervisors
Self-em
ployed
Technicians and
office workers
Skilled workers
Service and
trade workers
Unskilled
workers
Farm
ers
N
Employers 25.0 0 12.5 25.0 0 0 0 25.0 0 12.5 8
Managers 0 31.1 24.6 8.2 4.9 1.6 19.7 9.8 0 0 61 Professionals 7.7 15.4 53.8 15.4 0 0 0 0 7.7 0 13 Supervisors 4.9 13.6 6.8 28.4 3.7 6.2 25.9 6.2 1.2 3.1 162
Self-employed 3.2 6.5 3.2 19.4 6.5 9.7 41.9 0 0 9.7 31 Technicians and office workers 0 19.8 18.5 8.6 2.5 11.1 21.0 13.6 4.9 0 81
Skilled workers 2.7 6.0 5.8 13.8 2.5 8.2 40.7 13.6 3.7 3.1 486 Service and trade workers 4.9 9.8 1.6 19.7 1.6 9.8 31.1 13.1 6.6 1.6 61 Unskilled workers 0 1.4 2.8 12.5 4.2 5.6 31.9 8.3 23.6 9.7 72
Farmers .8 4.6 1.7 13.4 1.7 6.3 43.3 6.5 4.8 16.8 476 Total 2.2 8.2 6.1 15.2 2.5 7.1 36.5 9.6 4.8 7.7 1451
Chi-square = 480.556; Phi = .575; Cramer’s V = .192; Contingency Coefficient = .499; p (sig) = .000 Source: STRATSOC 2010 dataset, own calculations.
Table 3
Intergenerational social mobility of women: outflow percentages
Respondent’s class – women (Class destination)
Father’s class (Class origin)
Employers
Managers
Professionals
Supervisors
Self-em
ployed
Technicians
and office
workers
Skilled workers
Service and
trade workers
Unskilled
workers
Farm
ers
N
Employers 0 0 30.0 40.0 10.0 10.0 10.0 0 0 0 10 Managers 3.8 13.5 38.5 9.6 3.8 25.0 1.9 1.9 1.9 0 52
Professionals 0 4.3 56.5 4.3 4.3 8.7 0 17.4 4.3 0 23 Supervisors .6 7.8 21.4 14.3 1.3 24.7 11.7 12.3 3.2 2.6 154 Self-employed 3.8 3.8 0 3.8 0 30.8 7.7 30.8 3.8 15.4 26
Technicians and office workers .9 9.3 16.7 12.0 1.9 38.9 2.8 10.2 .9 6.5 108
Skilled workers 2.4 5.2 10.0 6.8 1.8 28.1 16.9 19.1 7.0 2.8 502
Service and trade workers 0 1.2 1.2 8.3 1.2 19.0 14.3 34.5 13.1 7.1 84
Unskilled workers 0 2.9 5.7 5.7 1.4 10.0 18.6 20.0 21.4 14.3 70
Farmers .4 1.8 1.8 6.0 1.2 12.5 15.2 13.4 11.9 36.0 514 Total 1.2 4.5 9.8 7.9 1.6 21.5 13.8 16.3 8.5 14.9 1543
Chi-square = 650.004; Phi = .649; Cramer’s V = .216; Contingency Coefficient = .544; p (sig) = .000 Source: STRATSOC 2010 dataset, own calculations.
Skilled workers men tend to reproduce themselves, as their place of destination
matches their place of origin. However, some of them become supervisors, or service

9 Social Mobility Patterns in Romania 37
and trade workers. More than half of the skilled workers’ daughters manage to secure more influential and better paid class positions. Men’s outflow from the service and trade class is heading for skilled workers and supervisor while women’s outflow (from the same class) is for technicians and office workers and also skilled workers. Unskilled workers, as an origin, become, to an important extent, skilled workers and supervisors as a destination. In women’s case, the unskilled workers’ destination is service and trade workers and skilled workers. Like in the case of the previous two occupations, men farmers end up being skilled workers or supervisors. Women’s (from the farmers’ class) most important outflows are to service and trade workers, skilled workers and technicians, and office workers. All in all, individuals from some classes are characterized by a large immobility or downward mobility as they structurally cannot climb anymore, while others follow some upward patterns because the structure of the society permits this.
Although my result reports higher rates of upward mobility, actually it is possible that most of the mobility to be horizontal and the movement to happen between similar positions, as some social classes are similar in terms of income, education and complexity of work. Also, I can aggregate the similar classes into a new class schema that could solve the question related to the accuracy of the absolute mobility rates. My option here is to aggregate the data into three new classes. That is: 1. the privileged class, containing the employers, managers and professionals; 2. the middle class, made out of supervisors, self-employed, technicians and office workers, skilled workers, and service and trade workers; 3. The deprived class, composed of unskilled workers and farmers. As expected, this classification is based on some well-known socio-demographic stratification criteria: occupation, education and income. Taking into consideration the income, the mean income of the respondents from the less privileged class represents only 33% from the mean income of those from the privileged class, and 54% of the mean income of the average class. The mean income of the average class is 62% of the mean income of the privileged class. In the same manner, the mean education years of respondents from the average class (12.1) is 77% of the average education years of the privileged ones (15.8), while for deprived ones (7.8) this percent is only 49. Even more, the mean education years of the deprived class represents 65% of the mean education years of the average category.
After the aggregation, the majority of individuals are immobile, they end up in the same class as their fathers’ one (Table 4). Also, men are more mobile than women. In addition, we can see that the upward mobility is more pronounced than the downward one and that the men have higher percents of upward mobility compared to women. The net mobility rate is an indicator of the intensity of the social mobility processes, processes that are more than the minimal mobility induced by the changes in the social structure. It can offer a perspective on a mobility that is not caused by structural changes from the society. Also, the net mobility is a mirror image of the intensity of the structural mobility, calculated here as a dissimilarity index3.
3 D = 0.5 * ∑ |ki. – k.j|; where D is the index of dissimilarity, ki. is the total on the line, for
origin (line marginal frequency) and k.j is the total on the column, for destination (column marginal frequency), i = 1... n; j = 1 ... m.

Cristian Pop 10 38
Table 4
Mobility rates for men and women – three classes
Men
(N = 1451)
Women
(N = 1543)
Immobile (Immobility rate)
787 54.2%
937 60.7%
Total mobility (Total mobility rate)
664 45.8%
606 39.3%
Upward mobility (Upward mobility rate)
578 87%
482 79.5%
Downward mobility (Downward mobility rate)
86 13%
124 20.5%
Structural mobility (Structural mobility rate)
369 55.6%
228 37.6%
Net mobility (Net mobility rate)
295 44.4%
378 62.4%
Source: STRATSOC 2010 dataset, own calculations. Even more, the structural mobility is the result of the disparity between the
distribution based on social origin and the distribution based on attained status (RaŃ, 2014 personal communication). If the structural mobility is more important, the net one will be less important and vice versa, because the total mobility is a sum of the net and structural mobility. Here, men are more influenced by structural changes from the society (i.e. disappearance and creation of occupations) than women.
Tables 5 and 6 present different realities that describe men and women’s class positions. An important first observation is that if 12.3% of the men are in a current deprived position, this percent is more important among women (23.1), suggesting a gender related problem. Although in both cases more than half of those from the privileged classes succeed to remain there and almost three quarters maintain their position in the middle class, in the women’s case almost half remain in the deprived class as a destination while this proportion is approximately a quarter for men. Almost half of the deprived women manage to reach, as a destination, the middle class.
Table 5
Intergenerational social mobility of men – three classes: outflow percentages
Respondent’s class – men (Class destination) Father’s class
(Class origin) Privileged class Middle class Deprived class N
Privileged class 57.3 40.2 2.4 82 Middle class 19.0 74.8 6.2 821 Deprived class 6.8 70.3 23.0 548 Total 16.5 71.1 12.3 1451
Chi-square = 211.701; Phi = .382; Cramer’s V = .270; Contingency Coefficient = .357; p (sig) = .000.

11 Social Mobility Patterns in Romania 39
Table 6
Intergenerational social mobility of women – three classes: outflow percentages
Respondent’s class – women (Class destination) Father’s class
(Class origin) Privileged class Middle class Deprived class N
Privileged class 54.1 43.5 2.4 85 Middle class 19.1 71.2 9.7 874 Deprived class 4.5 49.5 46.1 584 Total 15.5 61.4 23.1 1543
Chi-square = 383.757; Phi = .499; Cramer’s V = .353; Contingency Coefficient = .446; p (sig) = .000. Source: STRATSOC 2010 dataset, own calculations.
This percent is more than 70% in men’s case, suggesting, again, unequal
upward mobility chances at women’s expanse. The privileged class and the deprived one are the opposed ends of a scale, as for the first the upward mobility is not possible while for the last the downward one is impossible. Although it is impossible to be measured with these tools, individuals from lower or upper strata could experience such mobility, even if that remains invisible in statistics. Also, we can observe that for both men and women the degree of reproduction (immobility) is higher in the case of the privileged classes compared to the less privileged ones, as the first try to maintain their power position, while the last to climb to better and more influential position.
INTERGENERATIONAL MOBILITY IN FIVE HISTORICAL COHORTS
In Table 7, I display the class origins (CO) represented by father’s class when the respondent was 14 years old and the class destinations (CD), namely respondent’s class, for each of the five cohorts of individuals born in different historical contexts. As percents of the occupied population, we can observe a steady increase of people who end up as employers. The exception is the last cohort, where there is a small decrease, but we have to acknowledge that this cohort is still mobile, as it contains the youngest respondents.
The professionals’ class is the one that presents a constant increase both as origins and as destinations, as we move from one generation to another. This is due to the fact that it is a class based also on tertiary education, which is increasing in time in the total population, as we observed earlier (Jecan and Pop, 2012). For the first three cohorts of managers and supervisors, the patterns are similar, with increase from origin to destination in each cohort and a decrease as class destination from the second cohort (1940–1954) to the third one (1955–1966). In the last two generations, while the number of managers increases, both as origins and destinations, for supervisors we see an inverse tendency.

Cristian Pop 12 40
Table 7
Class origins and class destinations for different cohorts (%)
Till 1939 1940–1954 1955–1966 1967–1976 1977–1985
CO CD CO CD CO CD CO CD CO CD
Employers 0.7 0.0 0.1 1.1 0.3 2.4 0.0 2.4 1.9 2.2 Managers 2.0 5.6 2.1 6.2 3.0 4.5 4.2 5.9 6.0 7.3 Professionals 0.2 3.4 0.6 5.2 0.7 5.1 1.2 9.0 2.6 17.5 Supervisors 6.5 14.9 7.9 13.8 10.1 11.4 13.3 8.4 11.2 7.0 Self-employed 3.3 0.8 3.2 0.9 0.8 1.8 1.8 3.4 1.6 2.6 Technicians and office workers
4.3 14.5 5.1 12.8 4.9 15.0 7.2 14.8 7.9 14.2
Skilled workers 8.5 16.5 17.5 32.0 34.8 32.7 44.5 26.6 52.1 18.3 Service and trade workers
2.2 7.6 5.6 6.8 6.3 13.3 4.9 15.9 4.2 20.1
Unskilled workers
4.7 9.1 5.0 6.9 5.8 7.4 5.2 7.6 3.6 5.6
Farmers 67.6 27.6 53.0 14.4 33.4 5.9 17.6 6.1 8.9 5.1 Total (N) 553 497 878 901 736 839 732 800 695 627
Source: STRATSOC 2010 dataset, own calculations. In the first two pre-socialist industrialization cohorts (until 1939 and 1940–
1954), only about a quarter of those originating in the self-employed class maintain their position. In the last three cohorts, more and more individuals tend to be self-employed, as we move from origins to destination. The class of technicians and office workers seems to be less influenced by historical changes and we cannot identify a clear pattern between generations as destination, although we can see in each cohort an increase from origin to destination in this class. In the case of skilled workers, an increase in their percent and movement from origin to destination, for the first two cohorts, and a decrease for the last three cohorts there are observable, even though, for the last three cohorts, more and more fathers reside in this class. The percent of those arriving in the service and trade workers’ class is growing rapidly, especially in the period of socialism industrialization (1955–1985). In each generation, the number of unskilled workers is increasing from origin to destination, although they represent a smaller percent in the 1977–1985 generation. From the first to the last cohort, the percent of farmers is shrinking because less and less respondents follow their father’s path in the farmers’ class, a class still of great importance for Romania. Resuming, the employers, managers and professionals tend to be more and more important as time passes, while in a similar manner the number of farmers tend to decline. This is also the case for the supervisors. The other social classes follow more sinuous patterns.
The results from Table 8 present a remarkable stability in time in terms of the total mobility and immobility rates, with the exception of the individuals born at the time of the First World War and immediately after, as it is possible that this generation has the greatest tendency to reproduce its structure. This result is

13 Social Mobility Patterns in Romania 41
somehow in contradiction with Tomescu-Dubrow’s (2006) first finding. The percent of those moving upward on the mobility scale is high in each cohort, although a clear decreasing tendency can be observed in the last two generations. The 1967–1976 cohort is the most affected one by the obstructive, pro-birth socialist policies4 that changed the demographics of Romania. In order to asses these changes, we can compare this generation with the others. The youngest cohort is the most mobile one, its members still moving along different life paths. An increased structural mobility characterizes the first and the last generation. The respondents born until 1939 faced great structural changes brought by the war. The individuals born between 1977 and 1985 faced important changes in the occupational structure as a result of the new democratic regime that created a new urban middle class (mostly employed in services), having a new and different lifestyle, influenced by migration and education. Also, a new set of occupations is available for them in a larger share than for the older generations.
Table 8
Mobility rates for respondents born in different cohorts
Till 1939
(N = 403)
1940–1954
(N = 722)
1955–1966
(N = 661)
1967–1976
(N = 658)
1977–1985
(N = 550)
Immobile (Immobility rate)
138 34.2%
178 24.7%
164 24.8%
172 26.1%
134 24.4%
Total mobility (Total mobility rate)
265 65.8%
544 75.3%
497 75.2%
486 73.9%
416 75.6%
Upward mobility (Upward mobility rate)
207 78.1%
433 79.6%
374 75.3%
305 62.8%
236 56.7%
Downward mobility (Downward mobility rate)
58 21.9%
111 20.4%
123 24.7%
181 37.2%
180 43.3%
Structural mobility (Structural mobility rate)
162 61.1%
262 48.2%
203 40.8%
230 47.3%
215 51.7%
Net mobility (Net mobility rate)
103 38.9%
282 51.8%
294 59.2%
256 52.7%
201 48.3%
Source: STRATSOC 2010 dataset, own calculations
The outflow percentages for each cohort have an obvious limitation, resulting from the small number of cases that characterize some social classes (Tables 9–13).
Keeping this in mind, we can observe, on one side, that for the oldest generation an important downward movement takes place between supervisors and technicians and office workers, between self-employed and skilled workers and between unskilled workers and farmers.
On the other side, the upward movement is observable from technicians to managers, from skilled workers to supervisors, from service and trade workers to
4 At the end of 1966, Nicolae Ceausescu issued an act (770/1966) that made the abortion illicit; as a result, the number of births increased largely.

Cristian Pop 14 42
supervisors and from farmers to supervisors and skilled workers. The children of technicians and office workers tend to end up in the same category. For the generation born in the time of the Second World War, the privileged classes (in this case managers and professionals) tend to maintain their status by immobility or by horizontal mobility. Almost 20 percent of the supervisors’ sons end up employers or managers or professionals and almost a quarter of them become skilled manual workers. Half of the self-employed offspring are technicians or skilled workers. The technicians and office workers become skilled workers, while the skilled workers’ sons tend to remain in the same category, a pattern displayed also by the unskilled workers. Most of the farmer’s offspring move to the skilled worker’s class, but the most important upward movement for them is to the supervisors.
Table 9
Intergenerational social mobility for the born till 1939 cohort: outflow percentages
Respondent’s class (Class destination)
Father’s class
(Class origin)
Managers
Professionals
Supervisors
Self-em
ployed
Technicians and
office workers
Skilled m
anual
workers
Service and trade
workers
Unskilled m
anual
workers
Farm
ers
N
Employers .0 .0 75.0 .0 25.0 .0 .0 .0 .0 4 Managers 20.0 10.0 20.0 .0 20.0 10.0 10.0 10.0% .0 10 Professionals .0 .0 100.0 .0 .0 .0 .0 .0 .0 1 Supervisors 13.3 10.0 26.7 .0 26.7 16.7 3.3 .0 3.3 30 Self-employed .0 .0 14.3 .0 21.4 35.7 7.1 .0 21.4 14 Technicians and office workers 29.4 17.6 5.9 .0 41.2 .0 5.9 .0 .0 17 Skilled manual workers 5.3 5.3 26.3 .0 13.2 18.4 15.8 10.5 5.3 38 Service and trade workers .0 .0 42.9 .0 28.6 14.3 .0 14.3 .0 7 Unskilled manual workers 5.9 .0 11.8 .0 11.8 11.8 5.9 29.4 23.5 17 Farmers 4.2 .8 12.1 .8 10.6 14.3 7.2 9.1 41.1 265
In the third generation (1955–1966), more and more the class destinations
correspond to the class origins. However, we can observe some mobility patterns: managers’ children become mostly professionals, the self-employed end up skilled workers, as do the unskilled workers and the farmers. The respondents born between 1967 and 1976 tend to remain in the same class as their fathers’ one, excepting the managers’ offspring, who become professionals, or the supervisor’s one, who are mostly skilled workers or managers. The unskilled workers and the farmers move to the skilled worker’s class, but this is hardly an upward mobility pattern, being rather a horizontal one. The last cohort seems to have the highest outflow rates. We can see that most of the individuals originating in the employers’

15 Social Mobility Patterns in Romania 43
class move to the professionals and supervisors, but also to service and trade workers. Mangers’ children move to the professionals’ class, while the latter tend to remain in their origin class. Most of the supervisors end up as managers (or supervisors) and the technicians and office workers children become mostly professionals. The unskilled workers are upward mobile to service and trade workers or skilled workers, at a moment when the farmers retain their class position. Thus, the mobility for each cohort (upward or downward) seems to be in a large proportion a horizontal one, individuals moving mostly into similar classes (as income and education). This presumption can be tested with aggregate level data.
Table 10
Intergenerational social mobility of the 1940–1954 cohort: outflow percentages
Respondent’s class (Class destination)
Father’s class
(Class origin)
Employers
Managers
Professionals
Supervisors
Self-em
ployed
Technicians and
office workers
Skilled m
anual
workers
Service and trade
workers
Unskilled m
anual
workers
Farm
ers
N
Employers .0 .0 .0 .0 .0 .0 100.0 .0 .0 .0 1 Managers .0 41.2 29.4 11.8 .0 .0 17.6 .0 .0 .0 17 Professionals .0 .0 80.0 .0 .0 .0 .0 20.0 .0 .0 5 Supervisors 3.2 6.5 9.7 24.2 1.6 19.4 24.2 4.8 1.6 4.8 62 Self-employed 6.3 6.3 .0 12.5 .0 25.0 25.0 6.3 .0 18.8 16 Technicians and office workers
.0 21.1 7.9 10.5 2.6 15.8 23.7 2.6 2.6 13.2 38
Skilled manual workers 1.4 6.5 6.5 16.5 .0 16.5 36.0 7.2 5.8 3.6 139 Service and trade workers 2.5 7.5 2.5 17.5 .0 22.5 20.0 7.5 10.0 10.0 40 Unskilled manual workers .0 5.4 8.1 13.5 2.7 5.4 21.6 16.2 13.5 13.5 37 Farmers .5 4.1 1.6 12.5 1.4 9.8 30.8 6.8 8.4 24.0 367
A three-point scale confirms my expectations and presents lower rates of
mobility for the different historical cohorts than a ten-pointoccupational scale. The main advantage of this scale is that it hides, in a great proportion, the horizontal mobility, the movement between similar classes, making more visible the vertical one. On the one hand, among the mobile individuals, most of them are moving upward, to a more privileged social class, even though, in the youngest generations (the last two), the percent is smaller than in the other ones. On the other hand, the structural mobility characterizes less these last two categories than the first ones, as the younger generations tend to adapt easier to the changing social context and are mobile beyond the structural constraints.

Cristian Pop 16 44
Table 11
Intergenerational social mobility of the 1955–1966 cohort: outflow percentages
Respondent’s class (Class destination)
Father’s class
(Class origin)
Employers
Managers
Professionals
Supervisors
Self-em
ployed
Technicians and
office workers
Skilled m
anual
workers
Service and
trade workers
Unskilled
manual workers
Farm
ers
N
Employers 50.0 .0 .0 .0 .0 .0 .0 .0 .0 50.0 2 Managers 4.8 19.0 23.8 14.3 4.8 9.5 19.0 4.8 .0 .0 21 Professionals .0 20.0 60.0 .0 .0 .0 .0 .0 20.0 .0 5 Supervisors 3.0 7.5 9.0 25.4 3.0 16.4 20.9 11.9 3.0 .0 67 Self-employed .0 16.7 .0 16.7 .0 16.7 33.3 16.7 .0 .0 6 Technicians and office workers
.0 6.1 18.2 18.2 6.1 30.3 9.1 9.1 3.0 .0 33
Skilled manual workers
3.4 6.3 2.9 14.7 2.1 19.7 30.7 14.7 4.2 1.3 238
Service and trade workers
4.9 4.9 .0 9.8 .0 14.6 22.0 36.6 7.3 .0 41
Unskilled manual workers
.0 .0 .0 2.8 .0 13.9 38.9 5.6 27.8 11.1 36
Farmers .9 2.4 .9 6.6 1.4 9.4 42.0 12.3 9.4 14.6 212
Table 12
Intergenerational social mobility of the 1967–1976 cohort: outflow percentages
Respondent’s class (Class destination)
Father’s class
(Class origin)
Employers
Managers
Professionals
Supervisors
Self-em
ployed
Technicians and
office workers
Skilled m
anual
workers
Service and
trade workers
Unskilled
manual workers
Farm
ers
N
Managers .0 10.3 44.8 6.9 3.4 20.7 6.9 6.9 .0 .0 29 Professionals .0 11.1 55.6 11.1 .0 22.2 .0 .0 .0 .0 9 Supervisors 2.2 19.1 16.9 15.7 5.6 11.2 20.2 6.7 1.1 1.1 89 Self-employed .0 9.1 .0 18.2 18.2 18.2 9.1 9.1 9.1 9.1 11 Technicians and office workers
2.0 7.8 9.8 9.8 2.0 31.4 7.8 21.6 5.9 2.0 51
Skilled manual workers
3.4 4.4 7.4 7.7 3.4 18.1 29.2 17.4 5.7 3.4 298
Service and trade workers
.0 3.2 3.2 9.7 3.2 12.9 16.1 35.5 6.5 9.7 31
Unskilled manual workers
.0 .0 .0 11.8 5.9 5.9 23.5 17.6 29.4 5.9 34
Farmers 1.9 .0 2.8 1.9 2.8 6.6 37.7 17.0 6.6 22.6 106

17 Social Mobility Patterns in Romania 45
Table 13
Intergenerational social mobility of the 1977–1985 cohort: outflow percentages
Respondent’s class (Class destination)
Father’s class
(Class origin)
Employers
Managers
Professionals
Supervisors
Self-em
ployed
Technicians and office workers
Skilled m
anual workers
Service and trade workers
Unskilled m
anual workers
Farm
ers
Total
Employers 9.1 .0 36.4 27.3 9.1 .0 .0 18.2 .0 .0 11 Managers 2.8 27.8 30.6 2.8 8.3 11.1 8.3 8.3 .0 .0 36 Professionals 6.3 6.3 50.0 6.3 6.3 .0 .0 18.8 6.3 .0 16 Supervisors 4.4 5.9 20.6 20.6 .0 10.3 11.8 16.2 4.4 5.9 68 Self-employed 10.0 .0 10.0 .0 .0 10.0 30.0 40.0 .0 .0 10 Technicians and office workers
.0 14.0 32.0 8.0 .0 24.0 8.0 12.0 .0 2.0 50
Skilled manual workers 1.8 5.8 13.8 4.4 2.2 18.9 24.0 21.5 4.4 3.3 275 Service and trade workers .0 3.8 .0 7.7 3.8 3.8 30.8 30.8 19.2 .0 26 Unskilled manual workers
.0 .0 16.7 5.6 5.6 .0 22.2 27.8 11.1 11.1 18
Farmers .0 .0 10.0 2.5 2.5 7.5 10.0 30.0 5.0 32.5 40
the outflows. As we move from the oldest to the youngest generation, the number of individuals arriving at the privileged class destination is increasing. In the first two cohorts, most of the respondents reside in the deprived class, but their number is shrinking, as we move towards the last generations. For the individuals born after 1955, the middle class is the largest.
Table 14
Measures of intergenerational mobility
Chi-square Phi Cramer’s V Contingency
Coefficient p (sig.)
Till 1939 160.702 .631 .223 .534 .000 1940–1954 237.904 .574 .191 .498 .000 1955–1966 289.341 .662 .221 .552 .000 1967–1976 287.709 .661 .234 .552 .000 1977–1985 247.766 .671 .224 .557 .000
Source: STRATSOC 2010 dataset, own calculations.
Cristian Pop 18 46
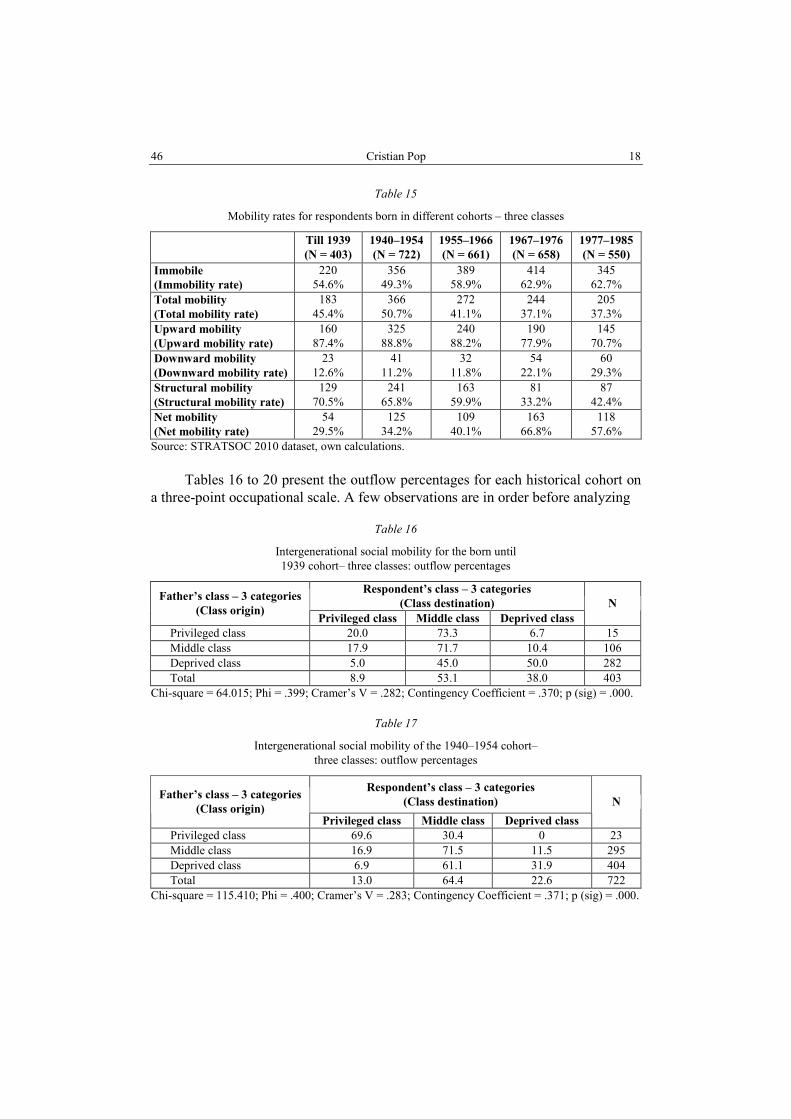
Table 15
Mobility rates for respondents born in different cohorts – three classes
Till 1939
(N = 403)
1940–1954
(N = 722)
1955–1966
(N = 661)
1967–1976
(N = 658)
1977–1985
(N = 550)
Immobile
(Immobility rate)
220 54.6%
356 49.3%
389 58.9%
414 62.9%
345 62.7%
Total mobility
(Total mobility rate)
183 45.4%
366 50.7%
272 41.1%
244 37.1%
205 37.3%
Upward mobility
(Upward mobility rate)
160 87.4%
325 88.8%
240 88.2%
190 77.9%
145 70.7%
Downward mobility
(Downward mobility rate)
23 12.6%
41 11.2%
32 11.8%
54 22.1%
60 29.3%
Structural mobility
(Structural mobility rate)
129 70.5%
241 65.8%
163 59.9%
81 33.2%
87 42.4%
Net mobility
(Net mobility rate)
54 29.5%
125 34.2%
109 40.1%
163 66.8%
118 57.6%
Source: STRATSOC 2010 dataset, own calculations.
Tables 16 to 20 present the outflow percentages for each historical cohort on
a three-point occupational scale. A few observations are in order before analyzing
Table 16
Intergenerational social mobility for the born until 1939 cohort– three classes: outflow percentages
Respondent’s class – 3 categories
(Class destination) Father’s class – 3 categories
(Class origin) Privileged class Middle class Deprived class
N
Privileged class 20.0 73.3 6.7 15 Middle class 17.9 71.7 10.4 106 Deprived class 5.0 45.0 50.0 282 Total 8.9 53.1 38.0 403
Chi-square = 64.015; Phi = .399; Cramer’s V = .282; Contingency Coefficient = .370; p (sig) = .000.
Table 17
Intergenerational social mobility of the 1940–1954 cohort– three classes: outflow percentages
Respondent’s class – 3 categories
(Class destination) Father’s class – 3 categories
(Class origin) Privileged class Middle class Deprived class
N
Privileged class 69.6 30.4 0 23 Middle class 16.9 71.5 11.5 295 Deprived class 6.9 61.1 31.9 404 Total 13.0 64.4 22.6 722
Chi-square = 115.410; Phi = .400; Cramer’s V = .283; Contingency Coefficient = .371; p (sig) = .000.
19 Social Mobility Patterns in Romania 47
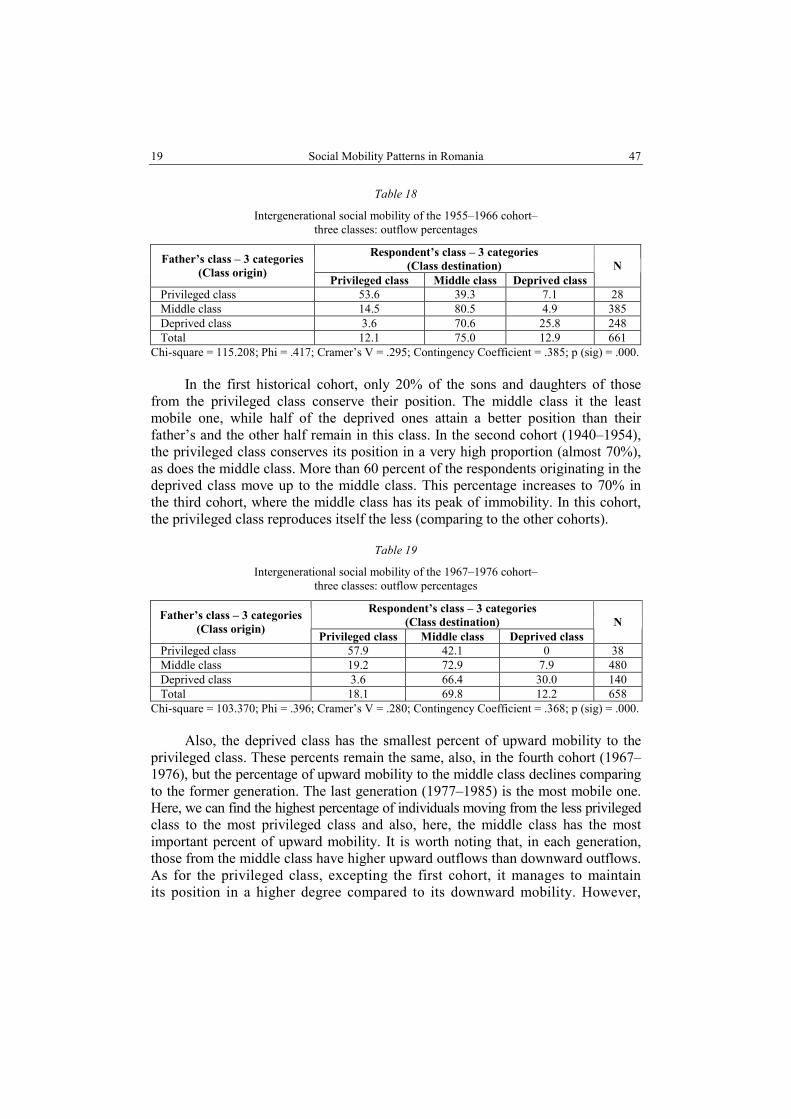
Table 18
Intergenerational social mobility of the 1955–1966 cohort– three classes: outflow percentages
Respondent’s class – 3 categories
(Class destination) Father’s class – 3 categories
(Class origin) Privileged class Middle class Deprived class
N
Privileged class 53.6 39.3 7.1 28 Middle class 14.5 80.5 4.9 385 Deprived class 3.6 70.6 25.8 248 Total 12.1 75.0 12.9 661
Chi-square = 115.208; Phi = .417; Cramer’s V = .295; Contingency Coefficient = .385; p (sig) = .000.
In the first historical cohort, only 20% of the sons and daughters of those from the privileged class conserve their position. The middle class it the least mobile one, while half of the deprived ones attain a better position than their father’s and the other half remain in this class. In the second cohort (1940–1954), the privileged class conserves its position in a very high proportion (almost 70%), as does the middle class. More than 60 percent of the respondents originating in the deprived class move up to the middle class. This percentage increases to 70% in the third cohort, where the middle class has its peak of immobility. In this cohort, the privileged class reproduces itself the less (comparing to the other cohorts).
Table 19
Intergenerational social mobility of the 1967–1976 cohort– three classes: outflow percentages
Respondent’s class – 3 categories
(Class destination) Father’s class – 3 categories
(Class origin) Privileged class Middle class Deprived class
N
Privileged class 57.9 42.1 0 38 Middle class 19.2 72.9 7.9 480 Deprived class 3.6 66.4 30.0 140 Total 18.1 69.8 12.2 658
Chi-square = 103.370; Phi = .396; Cramer’s V = .280; Contingency Coefficient = .368; p (sig) = .000. Also, the deprived class has the smallest percent of upward mobility to the
privileged class. These percents remain the same, also, in the fourth cohort (1967–1976), but the percentage of upward mobility to the middle class declines comparing to the former generation. The last generation (1977–1985) is the most mobile one. Here, we can find the highest percentage of individuals moving from the less privileged class to the most privileged class and also, here, the middle class has the most important percent of upward mobility. It is worth noting that, in each generation, those from the middle class have higher upward outflows than downward outflows. As for the privileged class, excepting the first cohort, it manages to maintain its position in a higher degree compared to its downward mobility. However,

Cristian Pop 20 48
the question of the difference in the individuals’ chances to end up in a class rather than in another one remains open.
Table 20
Intergenerational social mobility of the 1977–1985 cohort– three classes: outflow percentages
Respondent’s class – 3 categories
(Class destination) Father’s class – 3 categories
(Class origin) Privileged class Middle class Deprived class
N
Privileged class 58.7 39.7 1.6 63 Middle class 24.7 67.4 7.9 429 Deprived class 12.1 55.2 32.8 58 Total 27.3 62.9 9.8 550
Chi-square = 73.119; Phi = .365; Cramer’s V = .258; Contingency Coefficient = .343; p (sig) = .000. Source: STRATSOC 2010 dataset, own calculations.
RELATIVE MOBILITY RATES
Another important question is related to the odds ratios5, describing the relative mobility rates. More accurate: how much difference can we find between people coming from different origin classes in their chances of occupying a place in one destination class rather than in another? Speaking about the interpretation of the odds ratios, Breen (2004) warns that from the association between class origins and different chances to arrive in one or another social class, we observe differences in outcomes and not in inequality. Even though these outcomes reflect some degree of inequality of opportunity, they can be, also, a result of other things, and one should interpret them with caution.
I use odds ratios to capture the association between origins (represented by father’s social class) and destinations (represented by respondent’s social class). Table 21 contains series of logistic regressions with the aim to capture the relative chances of individuals from different social classes of ending up in one or another destination class. For this purpose, I maintained constant the class of origin composed by unskilled workers, and the results were compared against it.
With bolded figures I represent the results that are statistically significant with a probability of more than 95%. For some results, the probability is larger than 90%.
5 The odds ratio is the change in odds of being in one of the categories of outcome when the value of a predictor increases by one unit. Odds ratios greater than 1 reflect the increase in odds of an outcome of 1 (the “response” category), with a one-unit increase in the predictor; odds ratios less than one reflect the decrease in odds of the outcome with a one-unit change (Tabachnick and Fidell, 2006).

21 Social Mobility Patterns in Romania 49

Cristian Pop 22 50
An individual whose father is employer has almost 10 times more chances of becoming employer than the son/daughter of an unskilled worker. If her/his father is skilled worker, she/he has 2 times more chances of ending up in employers’ class; the same is true if the respondent’s father is a supervisor. However, if the respondent originates in the farmers class, her/his chances of becoming an entrepreneur are less than 1 (0.42) as compared to one that originates in the unskilled workers class (with a probability of 90%). The chances of ending up in the social class of managers are 9 times higher if the respondent has her/his origins in the managers class, almost 4 times higher for a supervisor origin, 3 times more for a professional origin, almost 5 times higher if the respondent’s father is a technician or office worker, and a 78% percent increase if one has her/his origins in the skilled workers class. The professionals seem to be one of the most open classes, as all the individuals originating in different social classes have more chances of becoming professionals than those whose fathers are unskilled workers (the reference category). As a result, those with professional fathers are 21 times more likely to become professional. These chances are almost 7.5 bigger for the offspring of managers, almost 5 times for those of employers, 3.5 times more for the children of technicians and office workers and 2.7 times bigger for the children of supervisors. In addition, the skilled workers origin offers 38% more chances of becoming a professional than the unskilled worker origin. But, originating in some categories decreases one’s chances of becoming a professional: with 0.21 for the sons and daughters of service and trade workers and with 0.25 for those of farmers. However, this seemingly open class is based mostly on individuals coming from top classes and upper-middle classes. The employers’ offspring are 5.7 times more likely to become supervisors than those of unskilled workers. This probability is 3.2 in the case of supervisor’s children and the chances of becoming a supervisor are increased with 65% if one’s father was part of the service and trade class.The only origin category that significantly enhances the chances of becoming self-employed is that of managers, compared to the reference category. The chances of ending up in the technicians and office workers category is 3.2 times bigger if one originates in the same category compared with the reference case and 2 times larger for the ones with skilled worker fathers. Also, a 62 percentage increase is presented by the individuals whose fathers are supervisors. Many origin classes offer smaller chances of becoming skilled workers, compared to the unskilled worker origin. This is the case of the managers’ offspring, who have only a 0.37 chance of becoming skilled workers, compared to the reference category. This chance is 0.32 for the children of technicians and office workers, 0.64 for those of supervisors and 0.68 for those of service and trade workers. The possibility of becoming service and trade workers is increased by 77% if one has a skilled worker father, and is 3 times more likely if the father is from the same category. Compared to the unskilled worker origin, almost every origin class protects the

23 Social Mobility Patterns in Romania 51
individual from the unskilled worker destination. As a result, the sons/daughters of managers have only a 0.08 chance to become unskilled workers. The chance is 0.13 for the children of the self-employed, 0.2 for those of supervisors, 0.24 those of technicians and office workers, 0.48 for those of skilled workers, and a 0.69 chance for the farmers’ offspring. Originating in the supervisors’ or in the skilled workers’ category decreases one’s chances of having the farmer’s class as a destination by 0.37 compared to the reference category and by 0.42 if the individual’s father is a technician or office worker. However, the farmers’ children are 3.7 times more likely to become farmers than are those of unskilled workers.
Table 22
Odds ratios for respondent’s social class depending on father’s social class: born until 1939
Respondent’s class
Father’s class Privileged Middle Farmers
Deprived
(unskilled
workers)
Privileged (sig.) [95% C.I. for Exp (B)]
3.946+ (.056) [.97–16.13]
4.022* (.013) [1.34–12.08]
.000 (.998) [.0 – .0]
.738 (.776) [.09–5.98]
Middle (sig.) [95% C.I. for Exp (B)]
2.753* (.013) [1.24–6.13]
2.278* (.000) [1.45–3.59]
.331 (.020) [.13 – .84]
.419 (.101) [.15–.1.18]
Farmers (sig.) [95% C.I. for Exp (B)]
.616 (.260) [.27 – 1.43]
.864 (.443) [.59–1.26]
2.973* (.000) [1.81 – 4.9]
.759 (.420) [.39–1.49]
Deprived-unskilled workers (reference category)
– – – –
Negelkerke R Square .071 .055 .132 .011 * p <0.05; +p<0.10; Source: STRATSOC 2010 dataset, own calculations.
The next five tables present the odds ratios based on a reduced class schema
for the different historical cohorts of individuals. For this purpose, I collapsed the ten social classes in four: 1. the privileged class, composed of the employers, managers and professionals; 2. the middle class, made out of supervisors, self-employed, technicians and office workers, skilled workers, and service and trade workers; 3. the farmers class, containing only farmers and 4. the deprived (less privileged) class, which consists of unskilled manual workers. Like in the case of the entire population, this deprived class (as a predictor – father’s class) is the reference one.
In the first generation (Table 22), those originating in the privileged class are almost 4 times more likely to remain in this class compared to those originating in

Cristian Pop 24 52
the deprived class. At the same time, individuals with fathers from the privileged class have 4 times more chances to arrive in the middle class than the reference category. In the same cohort, if one has its origins in the middle class, she/he has 2.7 more chances to move to the privileged class and 2.3 more chances to remain in this class than if she/he has a father in the deprived class. Farmers are 3 times more likely to become farmers than part of the unskilled class. As a result, all class origins seem to protect individuals from a deprived class destination.
The inequalities rise in the next cohort, born in the period of the Second World War and immediately after (Table 23).
Table 23
Odds ratios for respondent’s social class depending on father’s social class: born between 1940–1954
Respondent’s class
Father’s class Privileged Middle Farmers
Deprived
(unskilled
workers)
Privileged (sig.) [95% C.I. for Exp (B)]
23.167* (.000) [8.99–59.64]
.401* (.049) [.16 – .99]
.000 (.998) [.0 – .0]
.000 (.998) [.0 – .0]
Middle (sig.) [95% C.I. for Exp (B)]
1.963* (.010) [1.18–3.28]
1.533* (.007) [1.12 – 2.1]
.783 (.444) [.42 – 1.47]
.709 (.353) [.34 – 1.46]
Farmers (sig.) [95% C.I. for Exp (B)]
.603
(.093) [.33–1.09]
.913 (.538) [.68 – 1.22]
2.971* (.000) [1.82 – 4.86]
1.197 (.563) [.65 – .2.2]
Deprived-unskilled workers (reference category)
– – – –
Negelkerke R Square .124 .023 .079 .014 * p <0.05; +p<0.10; Source: STRATSOC 2010 dataset, own calculations.
Here, those born in a privileged class have 23 times more chances to maintain
their privilege, comparing to the reference category. Also, they have only a 0.4 chance to end up in the middle class. As a result, the reproduction of the privileged class is the highest among the individuals born in this period. Individuals originating in the middle class are two times more likely to move up to the privileged class than the deprived ones. These individuals have also 50% more chances to remain in their class compared to the reference category. Similarly to the previous cohort, the sons/daughters of farmers have 3 times more chances to remain in this category.
The individuals born between 1955–1966 (Table 24) face new realities that shaped their lives: the communist industrialization project and the end of the forced agriculture cooperation initiative/ideology.

25 Social Mobility Patterns in Romania 53
Table 24
Odds ratios for respondent’s social class depending on father’s social class born between 1955–1966
Respondent’s class
Father’s class Privileged Middle Farmers
Deprived
(unskilled
workers)
Privileged (sig.) [95% C.I. for Exp (B)]
11.837* (.000) [5.04 – 27.82]
.399* (.023) [.18 – .88]
.610 (.639) [.08 – 4.81]
.299 (.245) [.04 – 2.29]
Middle (sig.) [95% C.I. for Exp (B)]
1.709* (.047) [1.01 – 2.90]
1.876* (.000) [1.34 – 2.62]
.123* (.001) [.04 – .43]
.377* (.002) [.20 – .69]
Farmers (sig.) [95% C.I. for Exp (B)]
.420* (.034) [.19 – .94]
1.075 (.693) [.75 – 1.54]
2.461* (.007) [1.28 – 4.75]
.741 (.332) [.40 – 1.36]
Deprived-unskilled workers (reference category)
– – – –
Negelkerke R Square .107 .040 .144 .029 * p <0.05; Source: STRATSOC 2010 dataset, own calculations.
These projects dislocated many families from the rural space, forcing them to
move in the cities to work in factories. In this period, the privileged ones had almost 12 times more odds to remain privileged compared to those from the deprived class. They had only 0.4 chances to move to the middle class. People originating in the middle class have 70% more chances to climb to the privileged class, and 88% more chances to remain in their category, compared to the reference deprived class. Moreover, these individuals have small chances to become farmers (0.12) or unskilled workers (0.38). The offspring of farmers have 2.4 more chances to remain in the same category and have fewer chances to move to the privileged class (0.42) compared to those originating in the unskilled workers class.
The next generation (Table 25) was born in a period when Nicolae Ceasescu’s regime explicitly manipulated the demographic politics of Romania, trying to increase the population. As in the previous generations, the privileged are 12 times more probable to maintain their status quo, and are only 0.48 more likely to arrive in the middle class compared to those from the deprived class. A middle class origin helps one to secure a privileged position 2 times more likely than those from the deprived class. They are 43% more likely to remain in the same category.
They have, at the same time, only 0.42 chances to become unskilled workers. If the father is part of the farmers’ class, his offspring has 5 times more chances to remain in this class. Those from a farmer origin have only 0.34 chances to end up in the deprived class and have 0.4 odds to become privileged, compared to the reference category.

Cristian Pop 26 54
Table 25
Odds ratios for respondent’s social class depending on father’s social class: born between 1967–1976
Respondent’s class
Father’s class Privileged Middle Farmers
Deprived
(unskilled
workers)
Privileged (sig.) [95% C.I. for Exp (B)]
12.029* (.000) [5.51 – 26.28]
.478* (.036) [.24 – .95]
.000 (.998) [.0 – .0]
.000 (.998) [.0 – .0]
Middle (sig.) [95% C.I. for Exp (B)]
2.091* (.006) [1.24 – 3.53]
1.433* (.033) [1.03 – 1.99]
.688 (.397) [.29 – 1.58]
.281* (.000) [.16 – .49]
Farmers (sig.) [95% C.I. for Exp (B)]
.397+
(.073) [.14 – 1.09]
.850 (.473) [.55 – 1.33]
5.003* (.000) [2.24–11.16]
.337* (.013) [.14 – .79]
Deprived-unskilled workers (reference category)
– – – –
Negelkerke R Square .112 .026 .124 .072 * p <0.05; +p<0.10; Source: STRATSOC 2010 dataset, own calculations.
Table 26
Odds ratios for respondent’s social class depending on father’s social class: born between 1977–1985
Respondent’s class
Father’s class Privileged Middle Farmers
Deprived
(unskilled
workers)
Privileged (sig.) [95% C.I. for Exp (B)]
5.586* (.000) [2.95 – 10.58]
.856 (.602) [.48 – 1.54]
.000 (.997) [.0 – .0]
.157** (.079) [.02 – 1.24]
Middle (sig.) [95% C.I. for Exp (B)]
1.343 (.241) [.82 – 2.19]
1.930* (.001) [1.33 – 2.80]
.769 (.619) [.27 – 2.17]
.440* (.030) [.21 – .92]
Farmers (sig.) [95% C.I. for Exp (B)]
.375+
(.082) [.12 – 1.13]
.841 (.587) [.45 – 1.57]
7.588* (.000) [2.57–22.37]
.378 (.212) [.08 – 1.74]
Deprived-unskilled workers (reference category)
– – – –
Negelkerke R Square .083 .040 .141 .028 * p <0.05; +p<0.10; Source: STRATSOC 2010 dataset, own calculations.
The youngest generation (Table 26) presents some new patterns compared to
the older cohorts. This is the most mobile generation, still searching for a place in the socio-occupational structure. As in the case of the other cohorts, the privileged ones have the same class as origin and destination, but here those originating in a
27 Social Mobility Patterns in Romania 55
privileged class are only 5 times more probable to remain in this class as compared to the reference unskilled workers class. They have also only 0.16 chances to end up in the deprived class. Those with the origins in the middle class are almost two times more likely to remain there as a class destination and are 0.440 more likely to move down to the deprived class, compared to de reference category. In this cohort, farmers are less mobile compared to the other cohorts, because they have 7.5 more chances to remain in this category. They have fewer chances to advance to the privileged class (0.38) compared to those originating in the deprived class.
CONCLUSION AND DISCUSSION
My analyses portray a Romanian society with different chances of mobility for social classes that fluctuate in time and within them. A first observation is that, in Romania, there is still an important contrast between men and women in what respects their destination classes, where the first ones are at an obvious advantage, being better represented in the classes with more decision power (the employers, the managers, and the professionals). Nevertheless, men seem to be more influenced by the changes in the structure of the society (i.e. disappearance and/or creation of occupations) than women. However, we can observe that for both, men and women, the degree of class reproduction is higher in the case of the privileged (please notice that this term must be read into the light of social mobility literature, and not as groups that own some kind of “special attentions”) classes compared to the less privileged ones, as the first try to maintain their power position, while the last to climb to a better position. Though, for the deprived class, composed of “farmers” and unskilled manual workers, the gender biased consists mostly in the concentration of the women in villages. Also, the upward mobility happens mostly in the case of men and the downward one in the case of women. In addition, the privileged class and the deprived one are the opposed ends of a scale, as, for the first end, the upward mobility is not possible, while, for the last end, the downward one is impossible. Here, an observation is required: I’m talking about the
impossibility to measure with these instruments the upward mobility for the privileged classes and the downward one for the deprived classes. Actually, the rich can get richer and the poor can get poorer, and we can observe how the wealth accumulates in the hand of fewer people and a larger share of the population is more and more deprived; the employers, managers, and professionals tend to be more and more important (as power, influence, and number) as time passes, while, in a similar manner, the number of farmers (an important representative of the deprived ones) tends to decline, and so does their influence. The other social classes follow more sinuous patterns in time.
Thus, the mobility for each cohort (upward or downward) seems to be in a large proportion a horizontal one, individuals mostly moving into similar classes

Cristian Pop 28 56
(as income and education), a result confirmed by a three-point scale of the social classes. In a time perspective, using a scale with privileged, middle and deprived classes, if we move from the oldest to the youngest generation, the number of those arriving at the privileged class destination is increasing. These results point out to better upward mobility chances in time, so, to a more open society. Even more, in the first two cohorts, most of the respondents reside in the deprived class, but their number is shrinking in the younger generations. But does this really mean that the deprived ones have better chances of upward mobility? If we look at the odds ratios, we find out that in relationship with the reference category of unskilled workers, if one’s father is an entrepreneur he/she has more chances of becoming employer, professional or supervisor. At the same time, if one originates in the farmers’ class, with a high probability, she/he will remain in this class, being less likely to become an employer, a professional or an unskilled worker, than in the case of the reference category.
However, all social origins offer better upward mobility chances than does the unskilled worker origin. As a result, if the father is manager, the children have more chances of ending up as managers, professionals or self-employed, and they are protected against becoming skilled or unskilled workers. If the class of origin is professionals, the most likely, the class of destination will be the same, because this is the social class that reproduces itself in the most important manner. A supervisor origin increases one’s chances of becoming manager, or professional, or supervisor or technician, and decreases the odds of being skilled worker, unskilled worker or farmer, so that it offers some advantages in terms of possibilities of upward mobility. Having a father self-employed significantly protects against becoming unskilled worker, compared to having a father who is unskilled worker. If the father is from the technicians and office workers class, the individual is more likely to remain in the same category or to move to managers or professionals, while having less chances of ending up skilled or unskilled worker. Originating in the skilled workers class increases the odds of moving to one of the next classes: employers, managers, professionals, technicians, or service and trade workers, while decreasing the odds of arriving in a less privileged class, as is the case of unskilled workers or farmers. The fathers working in services and trade are more likely to transmit this position to their offspring, and less likely to have children in professionals’ class.
All in all, the largest mobility takes place between some similar categories, seen as middle class. Important shares from their ranks have also the possibility to arrive in the privileged class. But these parts are not equal in every cohort: the largest are in the oldest cohort and in the 1967–1976 cohort, while the smallest is in the youngest cohort. But, as expected, the privileged class recruits its members from the same class, even though this auto-reproduction suffers changes in time, reaching a minimum level in the youngest cohort. In other words, the privileged classes succeed, with some variations in time, to maintain their position, while the

29 Social Mobility Patterns in Romania 57
deprived one struggles for a better position, but without significant success, the (horizontal or upward) movement being more pronounced among those from the middle class. These results can be understand as consequences of the years of systematic industrialization from the socialist period that dislocated many of the farmers from their villages and transformed them in manual workers employed in factories from the cities, but also as a result of the hardship from the post-communist transition period.
Despite the fact that our social reality, seen through the lens of the social mobility, presents only some moderate changes, actually it is quite hard to find out which are the consequences for our daily lives brought by the new post 1989 stratification schema. In other words, it is important, beyond numbers and trends, to find out how the possibility for social mobility is perceived by individuals inhabiting several social classes in order to better specify what upward and downward social mobility really is. This is an invitation for a more complex and profound future analysis of the phenomenon.
REFERENCES
Breen, R. (Ed.). (2004). Social Mobility in Europe. University Press: Oxford. Bendix, R., Lipset, S. M. (1962). Social Mobility in Industrial Society. Berkeley: University of
California Press. Cucu, A. S. (2007). The Romanian Middle Class. A Topological Analysis. Studia UBB Sociologia,
52, 18–40. Cucu, A. S., & Culic, I. (2012). Procese de configurare a claselor sociale în Romania. O analiză
relaŃională a căsătoriilor pentru cinci generaŃii. În T. Rotariu & V. Voineag (Eds.), Intertie si
schimbare. Dimensiuni sociale ale tranzitiei in Romania (pp. 159–179). Iasi: Polirom. Featherman, D. L., Jones, F. L., & Hauser, R. M. (1975). Assumptions of social mobility research in
the US: The case of occupational status. Social Science Research, 4, 329–360. Lipset, S. M., & Zetterberg, H. L. (1959). Social mobility in industrial societies. In S. M., Lipset & R.
Bendix (Eds.), Social Mobility in Industrial Society (pp. 11–76). Berkeley: University of California Press.
Jecan, D., & Pop, C. (2012). Education and Occupation for Five Generations in Romania: A Sequential Analysis of Cohort Status Consistency. Studia UBB Sociologia, 57, 61–83.
Kohn, M. L., & Slomczynski, K. M. (2006). Social Structure and Self-Direction. A Comparative
Analysis of the United States and Poland. Warsaw: IFIS Publishers. Nunn, A. (2011). Social Mobility and Social Cohesion. Report on Fostering Social Mobility as a
Contribution to Social Cohesion. Report presented at The European Committee of Social Cohesion, Strasbourg. Retrieved from https://www.google.ro/url?sa=t&rct=j&q=&esrc=s& source=web&cd=1&cad=rja&uact=8&ved=0CCYQFjAA&url=http%3A%2F%2Fwww.coe.int%2Ft%2Fdg3%2Fsocialpolicies%2Fsource%2FECDCS%2520%25282011%2529%25204%2520Draft%2520report%2520on%2520social%2520mobility.doc&ei=xW7iVM_PNYWrPKa4gKgD&usg=AFQjCNEHGWjZjH997u7YLv50dqpkeQ0KVA&bvm=bv.85970519,d.ZWU.
Pop, C. (2013). Social Classes in Romania. A New Class Schema. Romanian Journal of Population
Studies, VII, 75–102. Pop, C. (2014). Status Attainment Patterns in Romania. A Class-Based Analysis. Studia UBB Sociologia,
59, 137–158.

Cristian Pop 30 58
RaŃ, C. (2014). Social Stratification and Mobility. Personal collection of notes for C. RaŃ’s course at “Babeş-Bolyai” University, Cluj-Napoca.
Rotariu, T. (1980). Şcoala şi mobilitatea socială în Ńările capitaliste dezvoltate. Bucuresti: Editura StiinŃifică şi Enciclopedică.
Rotariu, T. (2004). Câteva consideraŃii asupra rolului şcolii în mobilitatea socială. Studia Universitatis
Babes-Bolyai, Seria Sociologica, 2. Retrieved from http://studia.ubbcluj.ro/arhiva/abstract_ en.php?editie=SOCIOLOGIA&nr=2&an=2004&id_art=1173.
Statistical Office of the European Communities. (2014). EUROSTAT: Regional statistics: Reference
guide. Luxembourg: Eurostat. Accessed in 26.01.2015 at http://ec.europa.eu/eurostat/web/ education-and-training/data/main-tables.
Tabachnick, B.G, & Fidell, L. S. (2006). Using Multivariate Statistics. Boston: Pearson. Tomescu-Dubrow, I. (2006). Intergenerational Social Mobility in Romania: Changes in the Patterns
of Flows and Relationships in the Postcommunist Era. International Journal of Sociology, 36, 46–68.