social housing quarterly report – june 2017 · social housing quarterly report ... social housing...
TRANSCRIPT

Social Housing Quarterly Report
March 2017
The Social Housing Quarterly Report provides key facts and data on Social Housing. The report will be published quarterly and contains information on the housing support provided by the Ministry, the supply of social houses, emergency and transitional housing, demand for social housing and the movement of people through the social housing system.
June 2017

Key facts
This year the Ministry will spend $2.3 billion on housing support, helping more than 310,000 households.
Last year, $144.5 million over four years was announced to secure additional social housing places from Community Housing Providers (CHPs). This provides CHPs with upfront funding and/or an operating supplement for new supply.
$354 million was also committed for Transitional Housing – which will provide 8,600 housing places per year.
There are currently more than 66,000 social houses, and MSD has a Purchasing Strategy that would see an additional 6,400 places by June 2020.
In this report
Housing Support
Accommodation Supplement .......................................2Temporary Additional Support .....................................2Income-Related Rent Subsidy ......................................2
Social Housing Supply
Social Houses ............................................................3
Emergency & Transitional Housing
Emergency Housing Special Needs Grant ...................... 4Transitional Housing Places ........................................ 4
Social Housing Demand
Social Housing Register ...............................................5Characteristics of People on the Social Housing Register ... 6
Transitions
Applications Housed and Average Time to House ............7Housing Support Products ...........................................7
Social Housing Quarterly Report | June 2017 1

Social housing in Wellington Region
Housing Support
Accommodation Supplement
Accommodation Supplement (AS) is a non-taxable benefit that provides assistance towards accommodation costs for beneficiaries and low and middle-income earners. Recipients must meet a cash asset test, an income test and have ‘high’ accommodation costs.
Temporary Additional Support
Temporary Additional Support is a non-taxable supplementary that can be paid for a maximum of 13 weeks. It is paid as a last resort to help people with their regular essential living costs that cannot be met from their income and other resources.
Income-Related Rent Subsidy
Most tenants in Social Housing pay an Income-Related Rent (IRR) which limits the amount of rent they pay to no more than 25 per cent of their net income. The Ministry of Social Development pays an Income-Related Rent Subsidy (IRRS) to registered housing providers to cover the balance between the tenant’s rental payment and the market rent for the property.
284,572People receiving Accommodation Supplements as at 30 June 2017 (285,174 – 31 March 2017)
$565.2 millionTotal housing support provided in the quarter ($549.6 million – 31 March 2017)
$20.3 millionAS payments per week ($20.4 million – 31 March 2017)
$4.1 millionTAS payments per week ($4.0 million – 31 March 2017)
64,449People receiving Temporary Additional Support as at 30 June 2017 (63,392 – 31 March 2017)
62,926IRRS tenancies as at 30 June 2017 (62,459 – 31 March 2017)
$16.2 millionIRRS payments per week ($15.6 million – 31 March 2017)
Note: The IRRS payment figure is a weekly average based on a quarterly total of $211 million.
Social Housing Quarterly Report | June 2017 2

Social Houses
Social houses are properties owned or leased by Housing New Zealand and registered Community Housing Providers that are able to be tenanted by people who have been assessed as being eligible for social housing.
Notes:
• There may be some variations in MSD and HNZ reporting. This is due to differences in timing and processes. The MSD data provides a snapshot at a specific point in time, the HNZ data is drawn from an operational database that reflects changes in tenant status.
• HNZ short-term vacant properties are those that are currently between tenancies and are about to be re-tenanted.
• As advised by HNZ, HNZ long-term vacant properties are generally vacant for the following reasons: methamphetamine contaminated, undergoing major repairs or upgrades, pending redevelopment, or properties that are pending sale, lease expiry or demolition.
= 66,332
1,541HNZ Market Renters
537HNZ Short-term Vacant
1,257HNZ Long-term Vacant
71Registered CHP Market Renters
58,277HNZ IRRS Places
4,649Registered CHP IRRS Places
Total Social Houses (65,979 – 31 March 2017)
Social Housing Supply
The Ministry of Social Development is planning for
social houses to be available by June 2020.
72,000
Social Housing Quarterly Report | June 2017 3

Emergency Housing Special Needs Grant
The Special Needs Grant for emergency housing pays for short-term accommodation provided by commercial and community providers who are not contracted by the Ministry of Social Development where people cannot meet the cost of this from their own resources or from other sources.
Notes:
• This is a count of grants. A client can have more than one grant in the time period.
• Emergency Housing assistance payments are granted as Special Needs Grants.
• This is the amount granted. The total amount granted may not be the same as the amount spent.
11,446Grants (9,218 – 31 March 2017)
3,108Individual clients (2,616 – 31 March 2017)
$12.6 millionAmount granted per quarter ($8.8 million – 31 March 2017)
1,123Places tenanted or available for tenanting as at 30 June 2017 (737 – 31 March 2017)
2,158Places in 2017
Transitional Housing Places
The Ministry of Social Development has established a panel of emergency housing providers to deliver transitional housing places and associated support services for people in severe housing need.
Emergency & Transitional Housing
Transitional Housing Target
645Rest of the country
915Auckland
74Hamilton
58Tauranga
185Wellington
259Christchurch
22Dunedin
Transitional Housing Delivery
Note: The 2,158 Transitional Housing Places will be used to provide 8,600 placements per year, based on four 12-week stays.
Social Housing Quarterly Report | June 2017 4
Social housing in Wellington Region
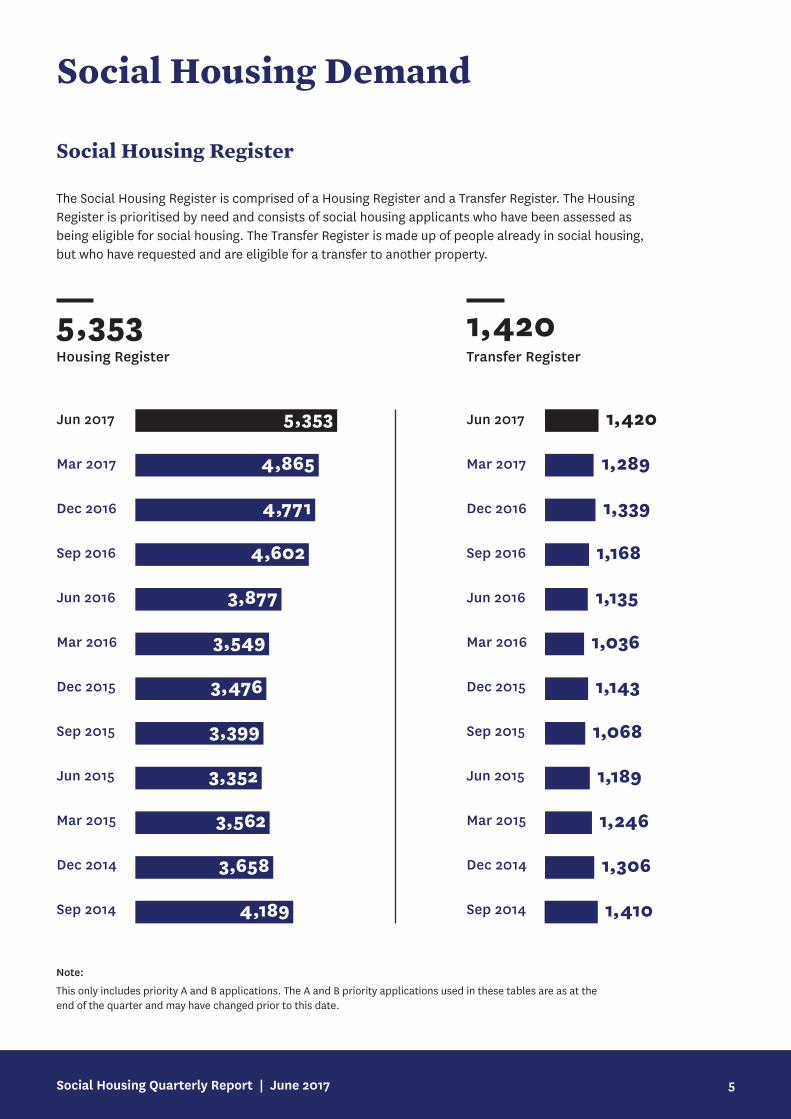
Social Housing Register
The Social Housing Register is comprised of a Housing Register and a Transfer Register. The Housing Register is prioritised by need and consists of social housing applicants who have been assessed as being eligible for social housing. The Transfer Register is made up of people already in social housing, but who have requested and are eligible for a transfer to another property.
Social Housing Demand
5,353 1,420
Note:
This only includes priority A and B applications. The A and B priority applications used in these tables are as at the end of the quarter and may have changed prior to this date.
Housing Register Transfer Register
Jun 2017
Mar 2017
Dec 2016
Sep 2016
Jun 2016
Mar 2016
Dec 2015
Sep 2015
Jun 2015
Mar 2015
Dec 2014
Sep 2014
4,865
5,353 1,420
1,289
4,771 1,339
4,602 1,168
3,877 1,135
3,549 1,036
3,476 1,143
3,399 1,068
3,352 1,189
3,562 1,246
3,658 1,306
4,189 1,410
Jun 2017
Mar 2017
Dec 2016
Sep 2016
Jun 2016
Mar 2016
Dec 2015
Sep 2015
Jun 2015
Mar 2015
Dec 2014
Sep 2014
Social Housing Quarterly Report | June 2017 5

Social housing in Wellington Region
Bedrooms required*
1 bedroom 2,843
2 bedrooms 2,341
3 bedrooms 962
4 bedrooms 460
Age of main applicant
25–39 2,432
40–54 1,989
55–64 942
24 and under 761
Household composition
Single aged 25 years + 2,885
Single with child(ren) 2,433
2+ adults with child(ren) 802
Ethnicity of main applicant
Māori 2,926
NZ European 1,681
Other 1,125
** As reporting of ethnicity is voluntary, ‘unknown’ indicates applicants have decided not to report their ethnicity.
* As at 30 June 2017 one client did did not have a bedrooms required figure assigned and another’s age of main applicant was missing from their information in the register. These issues have now been resolved.
Characteristics of People on the Social Housing Register
42+35+14+7+2+A 42+36+12+7+3+A5 or more bedrooms 166 2+ adults
476
Single aged 24 years or younger 177
36+29+14+11+10+A 43+25+16+14+2+A65 and over 648
Pacific peoples 927
Unknown** 114
Note: Social housing register includes the housing register and transfer register.
Social Housing Quarterly Report | June 2017 6

Applications Housed and Average Time to House
Transitions
Housing Support Products
Housing Support Products (HSPs) consist of a range of products designed to assist people to achieve or sustain independence in the private housing market. HSPs help to ensure that those who most need social housing can access it by reducing the number of people on the register, and by helping those who can sustain alternative housing to transition out of social housing.
$156,312Transition to Alternative Housing Grant ($134,391)
= 554Grants for 371 distinct clients (total $631,074) (555 grants for 397 distinct clients, total $640,212 – 31 March 2017)
$366,544Bond Grants ($405,173)
$55,105Moving Assistance ($48,117)
$45,527Letting Fees ($44,763)
$7,586Tenancy Costs Cover ($7,767)
Notes:
• A client may have multiple grants during the period for different purposes, but will only be counted once in the overall total of distinct clients.
• HSP hardship assistance payments are granted as Special Needs Grants.• This does not include the HSP Relocation from Auckland Assistance.
Notes:
• After September 2015 time to house is defined as the number of calendar days between the date an application is first confirmed live on the Social Housing Register as an ‘A’ or ‘B’ priority and the date a tenancy is activated for that application. The date a tenancy is activated may differ from the tenancy start date.
• This table includes both A and B priority applications.• The quarter in which the tenancy was activated is the quarter in which the application has been reported as housed in.• Applications housed may have been housed with Housing New Zealand Corporation or with a Community Housing Provider.
1,725
1,800
Applications housed
115.9
107.4
Mean time to house (days)
55
52
Median time to house (days)
Mar 2017
Jun 2017
Note: Number in bracket as at 31 March 2017.
Social Housing Quarterly Report | June 2017 7