snow surface temperature on cross-country ski …home.chpc.utah.edu/~u0035056/crst_wagner.pdfsnow...
TRANSCRIPT

Snow Surface Temperature on
Cross-Country Ski Racing Courses
Wendy Wagner*,a and John Horela
aUniversity of Utah Department of Atmospheric Sciences, 135 South 1480 East,
Salt Lake City, Utah, 84112, USA
Submitted to: Cold Regions Science and Technology
Abstract
Fast skis are essential for an Olympic cross-country skiing athlete. Accurate and
timely estimates of the snow surface conditions on a race course are needed to prepare
race skis. For training purposes prior to the 2010 Winter Olympics, snow surface and
snowpack observations were collected on the cross-country racing track at the Whistler
Olympic Park, British Columbia during February 2008 and 2009. During periods with
clear skies, snow surface temperatures varied by more than 10°C around the course while
temperatures in the stadium area increased by more than 16°C from morning to early
afternoon. Simulations using the SNOWPACK model of snow surface temperature in the
stadium area were within 1°C of those observed during most of a four day period.
Idealized simulations were completed varying cloud cover, slope and aspect.
Keywords: Snow surface temperature, Cross-country skiing, Snow surface modeling * Corresponding author. Tel.: +1 435 640 6508; fax +1 801 585 3681. E-mail addresses: [email protected] (W. Wagner), [email protected] (J. Horel).

1. Introduction
Ski speed is of primary concern for ski racers. Maximizing ski speed is achieved
through minimizing friction at the ski-snow interface. Frictional heating while skiing
produces a thin liquid water film at the ski-snow interface and is the principal reason skis
on snow or ice surfaces possess such low coefficients of friction (Bowden and Hughes
1939; Colbeck 1988). Ski bases are prepared with an etched-in structure and various wax
coatings to reduce friction allowing a skier to travel faster (Bowden 1955; Colbeck 1994).
The coefficient of friction is largely dependent on the snow surface temperature as well
as other snow surface and ski properties (Buhl et al. 2001; Fauve et al. 2005; Bäurle et al.
2006). Skiers and waxing technicians are faced with estimating the upcoming race course
snow conditions with sufficient time to prepare the skis appropriately. They often make
ski preparation decisions as a function of the terrain and shading on a specific race
course. They must also factor in the variability of snow surface temperature expected
around the course as well as temperature changes anticipated throughout a race.
Many studies have examined the physical properties, metamorphism and thermal
properties of a natural seasonal undisturbed snowpack (e. g., Seligman 1936; Colbeck
1982; Warren 1982; Sturm et al. 1997). However, ski tracks tend to have decreased snow
depth, increased snow density and thermal conductivity compared to undisturbed
snowpacks, as well as differences in temperature, grain type, size, bond size and albedo
(Colbeck 1994; Løset and Moldestad 2000; Fauve et al. 2002; Keller et al. 2004; Rixen et
al. 2004; Moldestad, D. A., 2005). Although this study focuses on snow surface
temperature, other factors controlling ski speed include the snow grain type, grain size,
density, thermal conductivity, liquid water content, roughness, and hardness, which all
contribute to the nature of the liquid water film at the ski-snow interface (Glenne 1987;
Colbeck 1994; Buhl et al. 2001). The roughness, hardness, thermal conductivity, and
hydrophobicity of the ski base as well as the flex, load, and speed of the ski also
contribute to water film generation. In addition, black ski bases can absorb solar energy
through multiple scattering of shortwave radiation from the snow to the ski base (Colbeck
and Perovich 2004).
Waxing decisions made by skiers and technicians become crucial when snow
surface and weather conditions lead to substantive variations in ski-snow friction around
the track during a race. The relationship between ski-snow friction and snow surface
temperature is nonlinear and not completely understood. When the snow surface
temperature remains below -3°C, the laboratory results of Buhl et al. (2001) suggest that
the coefficient of friction for a polyethylene ski base carrying light loads decreases as the
temperature increases. The decreased friction results from additional lubrication and
thickening of the liquid water film at the ski-snow interface as the temperature increases.
However, the coefficient of friction increases with increasing temperature very rapidly
above -2°C due to effects of capillary drag. Therefore, at snow surface temperatures near
-3°C the coefficient of friction tends to be near its minimum. Fauve et al. (2005) also
found skis to be fastest at snow surface temperatures near -3°C by performing field tests
that recorded skier run times on a snow slope.
The weather support team of the host country for the Winter Olympics is required
to provide observations of snow surface temperature at several locations on the cross-
country course while national teams collect more detailed information for ski preparation.
Prior to the 2002 Salt Lake City Winter Olympics, snow surface temperature

observations around the entire cross-country ski course were collected by the second
author for training of the 2002 weather support team. This thermal mapping approach
was expanded upon by the 2006 Torino weather support team leading up to and during
the 2006 Winter Olympics. Several skiing event race courses (cross-country, biathlon and
alpine) were monitored using thermal maps for training and operational applications
during the games (ARPA 2006).
The goal of this study is to examine methods to monitor and simulate snow
surface temperature that could be used to estimate snow surface temperature for
upcoming ski racing events. The 2010 Olympic cross-country ski racing course at the
Whistler Olympic Park, British Columbia during February 2008 and 2009 was used to
test those methods. Snow surface temperature, air temperature, relative humidity,
subsurface temperature and snowpack physical properties were observed with greater
attention placed on conditions during the hours of competitive events scheduled during
the February 2010 Olympic period. Three methods are used to examine the spatial and
temporal variability in snow surface temperature: 1) thermal maps, which provide
snapshots of the spatial variability of snow surface temperature along the course; 2)
displays of snow surface temperature as a function of slope, which provides information
on uphill, downhill and flat sections of the racing course; and 3) continuous
measurements of snow surface temperature in the Olympic cross-country stadium.
Model simulations of snowpack evolution are completed using the SNOWPACK
model, a one-dimensional snow cover model, to simulate the temporal evolution of snow
surface temperature (Lehning et al. 1999, 2002a, b; Bartelt and Lehning 2002). Snow
surface temperature on alpine ski racing courses has been modeled using SNOWPACK

for use as a forecasting tool (Bethke et al. 2005; Fauve et al. 2008). However, no peer-
reviewed literature exists on modeling the evolution of snow surface temperature on
cross-country ski racing courses. The model simulations presented here are validated
using observed data and idealized cases are generated varying synoptic weather
conditions, slope and aspect. Wagner (2010) provides more detailed information on the
observations and model simulations completed as part of this study.
2. Data Collection
Joe et al. (2010) describe the weather support efforts required for the 2010 Winter
Olympics and Paralympics. The Whistler Olympic Park was the official venue for the
Nordic events, which include cross-country skiing, Nordic combined, ski jumping and
biathlon. Located in the Callaghan Valley, the Whistler Olympic Park lies approximately
10 km west of Whistler and 90 km north of Vancouver. Atmospheric conditions at 2 m
above the surface were obtained from Environment Canada’s weather observing site
VOD (884 m), located approximately 250 m northeast from the cross-country stadium
and 24 m higher in elevation. The 2010 Olympic cross-country ski race courses are
comprised of 10 km of groomed cross-country ski track winding within a ~1 km square
area. Each Olympic cross-country event used either all or part of the 10 km track as the
racing course. Fig. 1 shows the location of the Whistler Olympic Park, cross-country
stadium, VOD observing site and ski racing trails.
Snow surface temperature was measured using an Everest Interscience, Inc. series
4000.4G infrared temperature sensor with a viewing angle of 4°. The accuracy of this
sensor is ±0.5°C and has a linear response over the range of interest. The infrared sensor

was calibrated using a cup of ice water daily. Surface temperature and GPS location were
logged by a Campbell Scientific CR-10X datalogger. Two methods for generating
thermal maps were implemented: snowmobile transport and skier transport of the
instruments. The use of a snowmobile was necessary to cover the 10 km course quickly.
One 10 km thermal map was generated typically per day. However, there were two days
when two thermal maps were generated and one day when three thermal maps were
generated. Skier transport was used for a 2.4 km representative loop, allowing for one
thermal map to be completed every 30 minutes, for a total of 12 maps, over the course of
one day. This approach allowed us to examine both the spatial and temporal evolution of
the snow surface temperature over varied terrain and shading.
The snowmobile transport technique consisted of the infrared sensor housed in a
watertight enclosure along with a GPS and datalogger (Fig. 2a). This system was
originally built and tested for the 2002 Winter Olympics. A 5 cm diameter hole was cut
in the bottom of the enclosure to expose the infrared sensor to the snow below. The
enclosure was attached to the side of a snowmobile, with the infrared sensor 20 cm above
the snow surface, enabling the sensor to measure the prepared race course undisturbed by
the snowmobile (Fig. 2b). The sensor was carefully aimed with an unimpeded view and
normal to the snow surface. Snow surface temperature was recorded every 5 seconds at
snowmobile speeds between 10 – 15 km hr-1 along the course (Figs. 2c and d). Direction
of travel was consistent with the planned Olympic racing courses. Complete thermal map
time intervals averaged 40 - 50 minutes for the 10 km race course. For comparison, an
Olympic athlete takes approximately 25-30 minutes to complete a 10 km race.

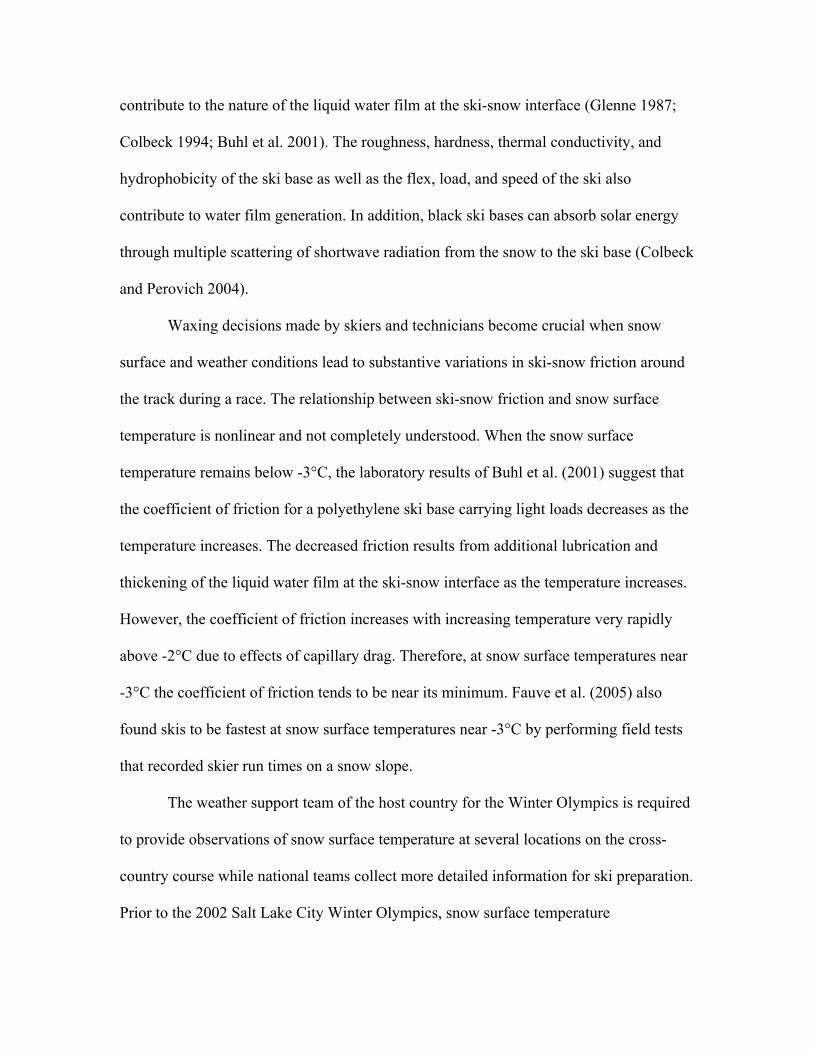
The skier transport approach was accomplished by placing the datalogger and
GPS into a backpack, which was worn while skiing around the 2.4 km representative
course. The infrared sensor was attached to a handle and manually held off to the side.
Care was taken to hold the sensor normal to and ~75 cm above the snow surface as well
as not to obstruct the field of view with skis or other equipment while skiing (Fig. 3a).
Thermal map time intervals averaged 10 – 13 minutes for completion of the 2.4 km
course. The first author’s speed had to be reduced by snowplowing on the downhill
sections of the course in order to sample adequately those slopes.
Point measurements of 50 cm air temperature, 50 cm relative humidity, snow
surface temperature and 10 cm subsurface temperature were collected in the cross-
country stadium (Fig. 3b). Air temperature and relative humidity were measured with a
Campbell Scientific CS500 sensor. Snow surface temperature was measured using the
same infrared sensor described earlier for the thermal mapping technique. Subsurface
snow temperature at 10 cm was measured using an Omega TJ180 – CP 16 thermocouple.
All thermal mapping and point measurement data are displayed in Table 1.
Snowpack properties were collected for use in initializing the SNOWPACK
model. Vertical profiles of snow density, temperature, grain size and grain type were
collected for both the groomed snowpack and the adjacent undisturbed natural snowpack.
Snow density was measured using a 100 cc snow density cutter. Snow temperature
measurements were taken with two Raytek Raynger ST20 infrared temperature sensors
and grain size and type were estimated using a 8X30 RF Inter-Science ocular scope with
a 1 millimeter gridded card. Two complete snow pits were dug in different locations on
the edge of the racing track. Additional snowpack measurements were taken from the
surface to 20 cm depth in the stadium and various sections along the race course to obtain
a more complete set of near-surface layer observations.
3. Analysis of Observations
3.1. Spatial Variability
A total of 22 thermal maps were generated, 10 on the complete 10 km of racing
courses and 12 on a representative 2.4 km section of the 10 km course. For all thermal
maps generated on the 2010 Olympic courses, snow surface temperature ranged between
-17°C and 0°C. Spatial variability observed within each thermal map ranged from over
10°C during clear sky conditions to less than 2°C during overcast conditions. Of the 22
thermal maps generated, 18 were during clear sky conditions. The highest spatial
variability observed over the entire course was 10.6°C (ranging from -11.8°C to -1.2°C)
just before noon on 21 February 2009 (Fig. 4). Fig. 5 illustrates high variability (over
2.7°C) within the stadium area, which spans only ~120 x 60 m. The smallest spatial
variability was observed on the afternoon of 28 February 2008 when snow surface
temperatures ranged between only -1.9°C to -0.7°C. Ambient conditions consisted of
overcast skies while VOD air temperature averaged 3.7°C during the period of thermal
mapping and a trace of snow was reported the previous night.
On 20 February 2009, twelve thermal maps were generated over a 2.4 km
representative course (Fig. 6). The 2.4 km course included the stadium area and the
warmest and coldest locations typically found along the 10 km race course. Thermal
mapping on the 2.4 km course was repeated every 30 minutes, beginning approximately
at 9:45 and ending at 15:45 PST. The time required to travel the 2.4 km course varied

between 11 and 14 minutes. Ambient conditions were clear skies, an overnight low air
temperature of -4.8°C and a daytime high of 8.2°C. Rapid warming trends in the
morning followed by the beginning of afternoon cooling trends can be seen in Fig. 6. The
greatest temperature variability along the course (9.6°C) was between 11:01 and 11:12
PST while the smallest spatial variability occurred between 9:47 and 9:59 PST due to
limited solar forcing during that time. The majority of the race course warmed to
temperatures approaching 0°C from 13:00 to 15:46 PST, except for a few locations with
persistent shade. These shaded locations reached a maximum in temperature of
approximately -4°C.
In order to delineate the sensitivity of snow surface temperature to slope, Fig. 7
presents elevation profiles along the 2.4 km course. Temperatures begin around -17°C
and approach 0°C by the early afternoon. Shaded sections of the course during the
afternoon are evident by relatively low temperatures.
3.2. Temporal Variability
Stadium point measurements were collected during 16-19 February 2009 between
approximately 8:00 and 17:00 PST. Clear sky conditions prevailed for the duration of the
4 day period with the exception of a broken altocumulus layer developing overnight on
17 February and dissipating midday on 18 February (Fig. 8). The observations, at 5
second intervals, were smoothed using a 5 minute median smoother. The -3°C line is
shown for reference since the dependence of the coefficient of friction on temperature
may differ above and below that threshold (Buhl et al. 2001). The largest diurnal increase

in snow surface temperature was from -17°C to -0.3°C during 17 February from 8:20 to
14:50 PST.
To examine daytime snow surface temperature evolution along the course,
differences in temperature between consecutive 2.4 km thermal maps were calculated.
Linear interpolation was used to smooth snow surface temperature and location for each
thermal map, resulting in 12 maps containing an equal number of data points.
Temperature differences between data points show a general warming of 12°C in 4 hours
(between 9:45 and 14:00 PST). Fig. 9 illustrates the change of snow surface temperature
with time at three points along the 2.4 km course; 1) horizontal exposed terrain (stadium
area), 2) southern exposure (20° south facing slope); and 3) persistent shade. As one
would expect, the greatest magnitude in temperature change is seen between 10:00 and
11:30 on south facing slopes where warming rates approached 10°C per hour until
surface temperatures increased to above -2°C. Between 11:30 and 15:45 south aspects
remained above -2°C. The stadium area saw an 8°C per hour temperature change during
10:00 to 11:30 until remaining close to -3°C during midday. Lowest rates in temperature
change were seen in locations with persistent shade and were approximately 6°C per
hour. However, shaded locations experienced a longer period of temperature increase,
from 10:00 to 14:00, until a maximum of -4°C was reached.
3.3. Snow Surface Temperature with respect to Synoptic Conditions
The clear sky conditions that prevailed during February 2008 and 2009 over the
Whistler Olympic Park produced daytime maxima for VOD 2 m air temperature above
6°C while nighttime minima fell below -8°C. As discussed earlier, the highest snow

surface temperature variability was seen during these high pressure and clear sky
conditions due to the snow surface radiating efficiently, often dropping nighttime snow
surface temperatures below -17°C by 6:00 PST. A maximum in solar forcing with clear
skies raised daytime southerly exposed snow surface temperatures to between -1°C and
0°C for all observations by 14:30 PST.
Two consecutive observation days with different synoptic conditions were
observed beginning late morning on 19 February 2008 (a clear sky day) where surface
temperatures ranged between -9°C and 0°C. That night high- to mid-level clouds moved
into the valley associated with the approach of a low pressure system. By the morning of
20 February, moderate mid-level cloud cover was observed and snow surface
temperatures along the course remained between -4°C and -1°C. This case illustrates how
cloud cover can reduce the spatial variability by limiting the loss of energy in the
snowpack and thus affect ski preparation decisions.
Overcast skies were observed on two occasions: 28 February and 11 March 2008.
The snow surface temperature in these cases remained between -2°C and 0°C. Broken
mid-level clouds were observed on 17 February 2009 when only stadium diurnal snow
measurements were collected. Snow surface temperature remained in the range between
-7°C to 0°C in this case.
There were no observations during periods of accumulating precipitation.
However, there was a light precipitation event overnight on 27 February 2008 and into
the early morning of 28 February. This event occurred while the track was being prepared
and only a trace of new snow on top of the prepared track was present at the time of
thermal mapping. Snow surface temperature varied from -9°C to -4°C in the morning and

by late afternoon variability was reduced to less than 1.2°C while VOD 2m air
temperature at observation times averaged 1.2°C and 3.7°C respectively.
4. Model Simulations of Snow Surface Temperature
4.1. SNOWPACK Model
Snow surface temperature and its sensitivity to atmospheric conditions and
snowpack initialization parameters are examined using the SNOWPACK model, which
was developed for an avalanche warning system (Lehning et al. 1999, 2002a, b; Bartelt
and Lehning 2002). The SNOWPACK model is a one dimensional, finite element snow-
cover model using a full energy balance approach. The model solves the heat transfer and
settlement equations within multiple layers and calculates effects due to metamorphism,
phase changes, transport of water vapor and liquid water, densification, and temperature
diffusion. It is now being used for both research and operational purposes in hydrology,
ecology and climate and has been applied over a wide range of temporal scales from
daily to seasonal and longer (Lundy et al. 2001; Spreitzhofer et al. 2004; Essery et al.
2009). The SNOWPACK model was used as a forecasting tool to predict ski race course
snow surface temperatures at the Alpine Skiing World Championships during 2003 in St.
Moritz, Switzerland and select alpine skiing events at the 2006 Winter Olympics in
Torino, Italy (Bethke et al. 2005; Fauve et al. 2008).
4.2. SNOWPACK Model Initialization
The SNOWPACK model uses both meteorological input (air temperature, relative
humidity, wind speed and direction, incoming and/or reflected shortwave radiation,
incoming longwave radiation and precipitation rate) and initialization of the existing
snowpack in predetermined layers (volumetric fraction of ice, water and void, grain and
bond radius, sphericity and dendricity). For this study, hourly meteorological data were
obtained from both Environment Canada’s regional-15 km GEM 24-hour forecasts
beginning at 0000 UTC or observations reported at the Callaghan Valley VOD weather
observing site. The snowpack was initialized once, at the beginning of each model
simulation, due to the assumed homogenization of the snow through grooming. Table 2
lists specific values for snowpack initialization. Several model simulations were
completed using different combinations of input data to examine responses in snow
surface temperature.
4.3. Model Simulations
While Bethke et al. (2005) and Fauve et al. (2008) have shown the SNOWPACK
model’s ability to predict surface temperatures for an alpine ski course within 1°C, a
model validation study was completed by comparing model results to observations from
stadium point measurements collected 16-19 February 2009. The validation was
completed for 5 days, which included a 24 hour spinup, using hourly meteorological
input from VOD (2 m air temperature, relative humidity, wind speed and direction and
precipitation rate) and the regional-15 km GEM 24-hour forecasts (radiation data). The
existing snowpack was initialized according to Table 2 with the cold snowpack
temperature profile. Results are shown in Fig. 10 and good agreement is seen with
observations. However, there is an overestimation of 1.5°C and 2.5°C on 17 February
2009 in the early morning and late afternoon respectively.

Examining snow surface temperature responses to various weather conditions and
changes in slope and aspect were completed using idealized cases representative of past
conditions observed at the Whistler Olympic Park. Four weather (clear sky, overcast with
cloud base at 1 km, fog, and ongoing precipitation) and three slope (flat, 20o north slope
and 20o south slope) scenarios were examined. Each scenario used a best estimate of
atmospheric parameters likely for the middle of February from VOD and the regional-15
km GEM 24 hour forecasts. Simulations were completed for 38 hour periods using
meteorological input at 30 minute intervals. The idealized case approach allowed for a 24
hour spinup period followed by a 14 hour simulation from 6:00 to 20:00 PST. The
snowpack was initialized using vertical profiles dependent upon either a warm or cold
idealized snowpack.
Clear sky idealized simulations are shown in Fig. 11a. Radiation input was
representative of the regional-15 km GEM 24 hour forecast beginning at 0000 UTC for
17 February 2009, a clear sky day. Warm and cold snowpack cases were initialized
keeping all atmospheric parameters the same except air temperature. Minimum morning
2 m air temperatures were set to -5°C and -10°C with afternoon maxima of 4°C and -5°C
for the warm and cold snowpack cases respectively. Snow surface temperatures in the
warm case increase to at or just above -2°C.
The impact of imposing clouds with bases at 1km is shown in Fig. 11b. Input
incoming longwave radiation was calculated using a 6.5°C km-1 standard lapse rate from
the estimated daytime air temperature. Shortwave radiation input was maintained at 200
Wm-2 during the day. Minimum morning 2 m air temperature was set to -5°C and -10°C
while the afternoon maxima were set to 4°C and -5°C for the warm and cold snowpack

cases respectively. The primary differences in snow surface temperature between clear
and cloudy skies occur in the early morning where snow temperatures are significantly
warmer in the overcast case (compare Figs. 11a and 11b). Surface temperatures for the
warm snowpack case follow air temperature closely until 0°C is reached just after 11:00.
After 11:00, temperatures remain at 0°C while liquid water increases in the 3 cm surface
layer until 15:30; complete refreezing occurs just after 18:00 PST. The changes through
the day for the cold snowpack case rise from -9°C to a maximum near -6°C and are
similar, yet reduced in amplitude, to those simulated for the clear sky cases.
The impact of imposing fog (cloud base at the surface) is shown in Fig. 11c.
Increasing longwave radiation corresponds to surface air temperatures of 0°C and -5°C
for the warm and cold cases respectively. Incoming shortwave radiation was set at 200
Wm-2 during the day. Minimum 2 m air temperature was set to -3°C and -10°C for the
warm and cold case while afternoon maxima were set to 2°C and -5°C respectively.
Similar to the overcast warm snowpack case, snow surface temperature closely follows
air temperature and increases to 0°C where it remains for the majority of the day. Liquid
water is present in the surface layer and remains until refreezing occurs around 18:00
PST. The cold snowpack simulation is largely unchanged from the situation where cloud
base is imposed at 1 km rather than at the surface (compare Figs. 11b and 11c).
Ongoing precipitation is considered in Fig. 11d. All input values are the same as
the fog case, except for the addition of precipitation beginning after the spinup period at
7:00 PST (since final grooming of the race course typically occurs in the early morning
hours). For the cold snowpack case, 10% density snow is allowed to fall continuously at
1 cm hr-1. Snow surface temperatures, for the cold case, are lowered slightly in the

morning as a result of the falling snow onto the cold snowpack (compare Figs. 11c and
11d). Accordingly, surface temperatures remain slightly lower than the air temperature
throughout the simulation as snow is allowed to continue to fall. The warm snowpack
case begins with snow falling at the same rate of 1 cm hr-1 and transitions to rain (1 mm
hr-1) around 11:30 PST. Snow surface temperatures remain slightly below the air
temperature for the morning hours while snow is accumulating. Rain on snow begins by
11:30 and surface temperatures reach and remain at 0°C until 16:00 when rain changes
back to snow, at which point surface temperatures follow just below the input air
temperature while snow accumulation continues. This drop in surface temperature with
the onset of snowfall can be explained by how the model resolves additional mass. For
this case, the model simulates the additional liquid water from the daytime rain to
penetrate the top three layers of the snowpack (15 cm depth). However at the rain-snow
transition, new snow, containing only ice and no water, accumulates into a new surface
layer above the existing wet surface layers. The new snow surface layer does not interact
on the time scale of the simulation and therefore surface temperatures fall below 0°C.
Dependency of snow surface temperature on the slope and aspect were also
investigated (Fig. 12). Assuming clear skies, the horizontal case represents the stadium
area while 20° slopes facing south and north represent exposed south facing and shaded
sections on the course respectively. Clearly, the south facing slopes are exposed to much
higher incoming solar radiation than the north facing aspects. Fig. 12 is similar to Fig.
11a except the snowpack was initialized using the warm snowpack as opposed to the cold
snowpack used in Fig. 11a. Other characteristics follow those seen in Fig. 9. Snow
surface temperature for the horizontal location approaches 0°C by 12:30 PST while for

the south aspect, temperatures rapidly increase to 0°C by 11:15 PST and remain at that
temperature until sunset. For the north facing aspect, temperatures increase more slowly
through the morning and remain below -4°C. Note that model input for air temperature is
the same for each case. It is likely areas with persistent shade on the racing course have
lower air temperatures than south and flat exposed locations, which could result in lower
surface temperatures than those simulated here.
5. Summary and Discussion
Despite the tendency for homogeneity of the snowpack on a cross-country course
through grooming, large spatial and temporal variability can remain in snow surface
temperature. Large changes in snow surface temperature were observed along the
Whistler Olympic Park course on clear sky days during February 2008 and 2009. The
largest range in temperature around the 10 km course was 10.6°C during late morning on
a clear day while the smallest range was 1.2°C on a day with overcast skies.
An analysis was done comparing exposed horizontal locations, exposed south
slopes and persistent shaded locations during clear sky days on the course. Horizontal
locations saw temperature increases at rates of 8°C per hour while tracks on south facing
slopes saw more rapid increases, nearing 10°C per hour between 10:00 and 11:30 PST
before leveling out above -3°C. Shaded areas warmed more slowly, at rates between 4°C
and 6°C per hour, yet these rates were maintained longer, from 10:00 till 14:00 PST, until
temperatures reached a maximum near -4°C.
Although the spatial and temporal variability around the course was expected,
changes within the stadium area were unexpected and verified as well with additional

measurements using handheld infrared sensors. Considering the stadium is mostly flat,
careful examination of the stadium and its periphery suggests that an increase in
shortwave radiation by reflection of a south facing snow slope on the north end of the
track combined with a section of the easterly track also having a south facing incline
increased temperatures locally.
Snow surface temperature was simulated by the SNOWPACK model using both
realistic and idealized initial and boundary conditions. A model simulation of snow
surface temperatures in the stadium using VOD observations from 16-19 February 2009
as well as output from the regional-15 km GEM atmospheric model were within 1°C of
those observed, except for an overestimation on 17 February of approximately 1.5°C and
2.5°C during the early morning and late afternoon respectively.
Idealized simulations were initialized using weather conditions thought to be
possible at the Whistler Olympic Park during February 2010 including clear sky, overcast
with cloud base at 1 km above the surface, foggy, and ongoing precipitation. During
these types of situations, with rapidly changing snow temperatures during parts of the
day, waxing decisions can be quite difficult. These simulations with varying weather
conditions, solar exposure, and snowpack temperature profiles provided realistic
appearing changes in snow surface temperature as a function of time of day.
However, during the first five days of the 2010 Winter Olympics (12-16
February) overcast skies with occasional precipitation falling as rain, snow or rain and
snow took place (personal communication, Andrew Teakles, Environment Canada and
Doug McDonnal, Seattle National Weather Service). Clear skies prevailed from 17-22
February, with air temperatures as much as 5°C warmer than those observed during

February 2008 and 2009. For the final five days of the Winter Olympic period, overcast
skies with occasional precipitation returned. During the entire 2010 Winter Olympic
period, snow surface temperatures were much warmer than those measured the two
previous seasons and remained for much of the time near 0°C. Based on feedback from
Olympic athletes, coaches and waxing technicians at the 2010 Winter Olympics, our
simulations seem realistic (personal communication, Pete Vordenberg, U.S. Ski Team
Head Coach and waxing technician, Matt Whitcomb, U. S. Ski Team World Cup coach
and waxing technician, Liz Stephen and Kikkan Randall, 2010 U. S. Ski Team and
Olympic Team members). However, actual waxing decisions during the 2010 Winter
Olympics depended much more on the liquid water content of the snow than snow
surface temperature, since the snow remained near 0°C much of the time.
The character of a cross-country course is largely dependent upon the techniques
and frequencies of grooming, which vary extensively from one venue to another. Hosts
for Winter Olympics are not required to provide information on snow temperature around
the entire course as they are only required to report conditions in the stadium and high
and low points of the course. Detailed measurements are left to the waxing technicians,
and many teams can not afford the time and expense to collect the data. Use of snow-
cover models such as the SNOWPACK model as a real-time forecasting tool for
international cross-country ski racing is a logical step to advance common waxing
technology and strategy. The Alpine3D forecast system has been used for alpine skiing
events (Fauve et al. 2008). Using this, or similar models, may aid waxing technicians in
the evaluation of snow surface temperature with respect to changes in slope and aspect
along cross-country ski racing courses. However, weather support teams, waxing

technicians, and athletes always need to prepare as well for the unexpected, as was
demonstrated by the conditions observed during February 2010 relative to those during
the previous winters.
Acknowledgements
This project was funded through Environment Canada in association with the
Vancouver 2010 Olympic Winter Games weather forecasting effort. We would like to
thank Environment Canada’s Chris Doyle, Brad Snyder and Trevor Smith along with the
Whistler Olympic Park venue weather forecasting team. The data collection effort also
depended on the cooperation of the staff of the Vancouver Organizing Committee
(VANOC) and the Whistler Olympic Park. The approval and use of the SNOWPACK
model for simulations was provided by Michael Lehning from the Swiss Federal Institute
for Snow and Avalanche Research (SLF).

References
Agenzia Regionale per la Protezione Ambientale (ARPA), 2006. Arpa and the Games Final report on the activities performed by the Regional Agency for the Environmental Protection of Piedmont for the XX Olympic Winter Games Torino 2006, Stargrafica, Torino.
Bartelt P., Lehning, M., 2002. A physical SNOWPACK model for the Swiss avalanche
warning Part I: numerical model. Cold Reg. Sci. Technol. 35, 123-145. Bäurle, L., Szabó, D., Fauve, M., Rhyner, H., Spencer, N.D., 2006. Sliding friction of
polyethylene on ice: tribometer measurements. Tribol. Lett. 24, 77-84. Bethke, S., Fierz, C., Lehning, M., Martius, O., Rhyner, H., 2005. Predicting Snow
Conditions for the Optimization of Piste Preparation. Science and Skiing III, Meyer & Meyer Sport, Oxford, pp. 395-400.
Bowden, F. P., 1955. Friction on Snow and Ice and the Development of some Fast-
Running Skis. Nature 176, 946-947. Bowden, F. P., Hughes, T.P., 1939. The mechanics of sliding on ice and snow. Proc. R.
Soc. London, Ser. A 217, 280-298. Buhl, D., Fauve, M., Rhyner, H., 2001. The Kinetic Friction of Polyethylen on Snow: the
Influence of the Snow Temperature and the Load. Cold Reg. Sci. Technol. 33, 133-140.
Colbeck, S. C., 1982. An Overview of Seasonal Snow Metamorphism. Rev. Geophys. 20,
45–61. Colbeck, S.C., 1988. The kinetic friction of snow. J. Glaciol. 34, 78-86. Colbeck, S. C., 1994. A review of the Friction of Snow Skis. J. Sports Sci. 12, 285- 295. Colbeck, S. C., Perovich, D.K., 2004. Temperature effects of black versus white
polyethylene bases for snow skis. Cold Reg. Sci. Technol. 39, 33-38. Essery, R., Rutter, N., Pomeroy, J., Baxter, R., Stahli, M., Gustafsson, D., Barr, A.,
Bartlett, P.,Elder, K., 2009. SNOWMIP2: An Evaluation of Forest Snow Process Simulations. Bull. Amer. Meteor. Soc. 90, 1120-1135.
Fauve, M., Rhyner, H., Lüthi, A., Schneebeli, M., Lehning, M., 2008 . Putting snow
knowledge into the development of winter sports equipment. Sports Technol. 1,145-151.

Fauve, M., Buhl, D., Rhyner, M., Schneeleli, M., Ammann, W., 2005. Influence of Snow and Weather Characteristics on the Gliding Properties of Skis. Science and Skiing III, Meyer & Meyer Sport, Oxford, pp. 401-410.
Fauve, M., Rhyner, H., Schneebeli, M., 2002. Preparation and Maintenance of Pistes:
Handbook for Practitioners, Swiss Federal Institute for Snow and Avalanche Research SLF, Davos.
Glenne, B., 1987. Sliding Friction and Boundary Lubrication of Snow. J. Tribol. 109,
614-617. Joe, P., Doyle, C., Wallace, A., Cober, S. G., Scott, B., Isaac, G.A., Smith, T., Mailhot, J.,
Snyder, B., Belair, S., Jansen, Q., Denis, B., 2010. Weather Services, Science Advances, and the Vancouver 2010 Olympic and Paralympic Winter Games. Bull. Amer. Meteor. Soc. 91, 31-36.
Keller, T., Pielmeier, C., Rixen, C., Gadient, F., Gustafsson, D., Stähli, M., 2004. Impact
of artificial snow and ski-slope grooming on snowpack properties and soil thermal regime in a sub-alpine ski area. Ann. Glaciol. 38, 314-318.
Lehning, M., Bartelt, P., Brown, B., Russi, T., Stöckli, U., Zimmerli, M., 1999.
SNOWPACK model calculations for avalanche warning based upon a new network of weather and snow stations. Cold Reg. Sci. Technol. 30, 145-157.
Lehning, M., Bartelt, P., Brown, B., Fierz, C., 2002. A physical SNOWPACK model for
the Swiss avalanche warning Part II: Snow microstructure. Cold Reg. Sci. Technol. 35, 147-167.
Lehning, M., Bartelt, P., Brown, B., Fierz, C., 2002. A physical SNOWPACK model for
the Swiss avalanche warning Part III: meteorological forcing, thin layer formation and evaluation. Cold Reg. Sci. Technol. 35, 169-184.
Løset, S., Moldestad, D. A., 2000. Characterization of snow structure in a cross-country
ski track. Proc. 4th International Conference on Snow Engineering, Trondheim, Norway, 123-128.
Lundy, C., Brown, R., Adams, E. E., Birkeland, K., Lehning, M., 2001. A statistical
validation of the snowpack model in a Montana climate. Cold Reg. Sci. Technol. 33, 237-246.
Moldestad, D. A., 2005. Characteristics of liquid water content and snow density in a
cross-country race ski track. Bull. Glaciol. Res., 22, 39-49. Rixen, C., Haeberli, W., Stoeckli, V., 2004. Ground Temperatures under Ski Pistes with
Artificial and Natural Snow. Arct. Antarct. Alp. Res. 36, 419-427.

Seligman, G., 1936. Snow Structure and Ski Fields, International Glaciological Society, Cambridge.
Spreitzhofer G., Fierz, C., Lehning, M., 2004. SN_GUI: a graphical user interface for
snowpack modeling. Computers and Geosciences 30, 809-816. Sturm, M., Jolmgrem, J., Konig, M., Morris, K., 1997. The Thermal Conductivity of
Seasonal Snow. J. Glaciol. 43, 36-41. Wagner, W., 2010. Observing, Analyzing and Simulating Snow Surface Temperature for
Cross-Country Ski Racing courses: M.S. Thesis, Univ. of Utah, pp. 74. Warren, S., 1982. Optical Properties of Snow. Rev. Geophys. 20, 67-89.

Table 1
Snow Surface Temperature Data
Thermal Maps Point Measurements
10 km course 2.4 km course Stadium
Data collected February 2008 8 maps
Data collected February 2009 2 maps 12 maps
4 observation days: Snow surface temperature
50 cm air temperature and RH
10 cm subsurface temperature
Spatial analysis X X
Temporal analysis X X

Tab
le 2
Sn
ow
pack
Initializatio
n V
alues
Lay
era
Dep
th
(m)
Tem
peratu
re
(°C)
warm
cold
Den
sity
(kg
m-3)
Grain
radiu
s
(mm
)
Bo
nd
radiu
s
(mm
)
Bo
nd
radiu
s
to G
rain
radiu
s ratio
Den
dricity
(fraction
)
Sp
hericity
(fraction
)
1
.03
-3
-1
0
52
5
.15
.0
37
5
.25
0
.6
2
.05
-3
-8
5
25
.3
.1
2
.4
0
.6
3
.07
-2
-8
5
00
.5
.2
.4
0
.7
4
.15
-1
-5
5
00
1
.3
.3
0
.8
5
.70
-1
-1
4
50
1
.5
.37
5
.25
0
.8
a Lay
er 1 is d
efined
as the su
rface layer an
d lay
er 5 is th
e bo
ttom
layer d
irectly ab
ov
e the so
il.

50.144
50.14 123.114 123.11
Fig. 1. The Whistler Olympic Park cross-country racing trails, stadium and VOD weather observing site. Latitude and longitude are labeled on the corners. Map courtesy of VANOC.

(a) (b)
(c) (d)
Fig. 2. (a) Instruments and watertight enclosure. (b) Enclosure attached to side of snowmobile. (c) Snowmobile transport of sensors and (d) close up view.
(a) (b)
Fig. 3. (a) Skier transport of sensors along the race course. (b) Snow surface, 50cm air and 10cm subsurface temperature point measurements taken in the cross-country stadium between the Olympic start and finish lanes.

Fig. 4. Distribution of snow surface temperature along the 2010 Olympic cross-country racing course between 10:10 to 11:02 PST 21 February 2009. Light values occur along southern exposures while dark values occur in shaded locations on the course according to the right hand scale. Contours represent elevation in meters while latitude and longitude are marked on the y and x axes respectively.
837
850
864
891
918 945
972
123.116 123.114 123.112 123.11 123.108 123.106
50.139
50.14
50.141
50.142
50.143
50.144
50.145
50.146
!!"#$!!% !!"#$!!& !!"#$!!' !!"#$!!" !!"#$!! !!"#$!(% !!"#$!(& !!"#$!(')($!#*
)($!'
)($!'!
)($!'"
)($!'#
)($!''
)($!')
)($!'&
)($!'+
)($!'%
,
,
-°./
!!"
!!(
!%
!&
!'
!"
(

Fig. 5. Stadium snow surface temperature observations according to the scale at the bottom for ~11:15 PST 19 February 2008. The Stadium represents a ~120 x 60 m area. Map courtesy of Google.
!"##$% !"##$% !"##$% !"##$% !"##$% !"##$% !"##$% !"##$% !"##$% !"##$%
&'()*
$+)
$+*
$*)
$**
$,)
$,*
$!)
$!*
$$)
$$*
$-)
'
'
./01'2345678'98:;8469348'<°=>
!* !+ !# !% !( )

Fig. 6. Snow surface temperature observations along the 2.4 km representative course during 20 February 2009. Latitude and longitude are marked on the y and x axes respectively
09:47 to 09:59 PST
123.114 123.11
50.14
50.144
10:29 to 10:41 PST
123.114 123.11
50.14
50.144
11:01 to 11:12 PST
123.114 123.11
50.14
50.144
11:29 to 11:41 PST
123.114 123.11
50.14
50.144
12:01 to 12:13 PST
123.114 123.11
50.14
50.144
12:29 to 12:41 PST
123.114 123.11
50.14
50.144
13:00 to 13:13 PST
123.114 123.11
50.14
50.144
13:30 to 13:43 PST
123.114 123.11
50.14
50.144
14:00 to 14:14 PST
123.114 123.11
50.14
50.144
14:30 to 14:44 PST
123.114 123.11
50.14
50.144
15:02 to 15:15 PST
123.114 123.11
50.14
50.144
15:32 to 15:46 PST
123.114 123.11
50.14
50.144
! "!!! #!!!$%!
&!!
!&'()**+,**!&'%&*-./
! "!!! #!!!$%!
&!!
"!'#&**+,**"!'("*-./
! "!!! #!!!$%!
&!!
""'!"**+,**""'"#*-./
! "!!! #!!!$%!
&!!
""'#&**+,**""'("*-./
! "!!! #!!!$%!
&!!
"#'!"**+,**"#'"0*-./
! "!!! #!!!$%!
&!!
"#'#&**+,**"#'("*-./
! "!!! #!!!$%!
&!!
"0'!!**+,**"0'"0*-./
! "!!! #!!!$%!
&!!
"0'0!**+,**"0'(0*-./
! "!!! #!!!$%!
&!!
"('!!**+,**"('"(*-./
! "!!! #!!!
"('0!**+,**"('((*-./
! "!!! #!!!
"%'!#**+,**"%'"%*-./
! %!! "!!! "%!! #!!!
"%'0#**+,**"%'(1*-./
* *
!"$ !"1 !"( !"# !"! !$ !1 !( !# !
.2,3*456789:*+:;<:68+56:*=°>?
!"% !"! !% !
! "!!! #!!!$%!
&!!
!&'()**+,**!&'%&*-./
! "!!! #!!!$%!
&!!
"!'#&**+,**"!'("*-./
! "!!! #!!!$%!
&!!
""'!"**+,**""'"#*-./
! "!!! #!!!$%!
&!!
""'#&**+,**""'("*-./
! "!!! #!!!$%!
&!!
"#'!"**+,**"#'"0*-./
! "!!! #!!!$%!
&!!
"#'#&**+,**"#'("*-./
! "!!! #!!!$%!
&!!
"0'!!**+,**"0'"0*-./
! "!!! #!!!$%!
&!!
"0'0!**+,**"0'(0*-./
! "!!! #!!!$%!
&!!
"('!!**+,**"('"(*-./
! "!!! #!!!
"('0!**+,**"('((*-./
! "!!! #!!!
"%'!#**+,**"%'"%*-./
! %!! "!!! "%!! #!!!
"%'0#**+,**"%'(1*-./
* *
!"$ !"1 !"( !"# !"! !$ !1 !( !# !
.2,3*456789:*+:;<:68+56:*=°>?
!"% !"! !% !
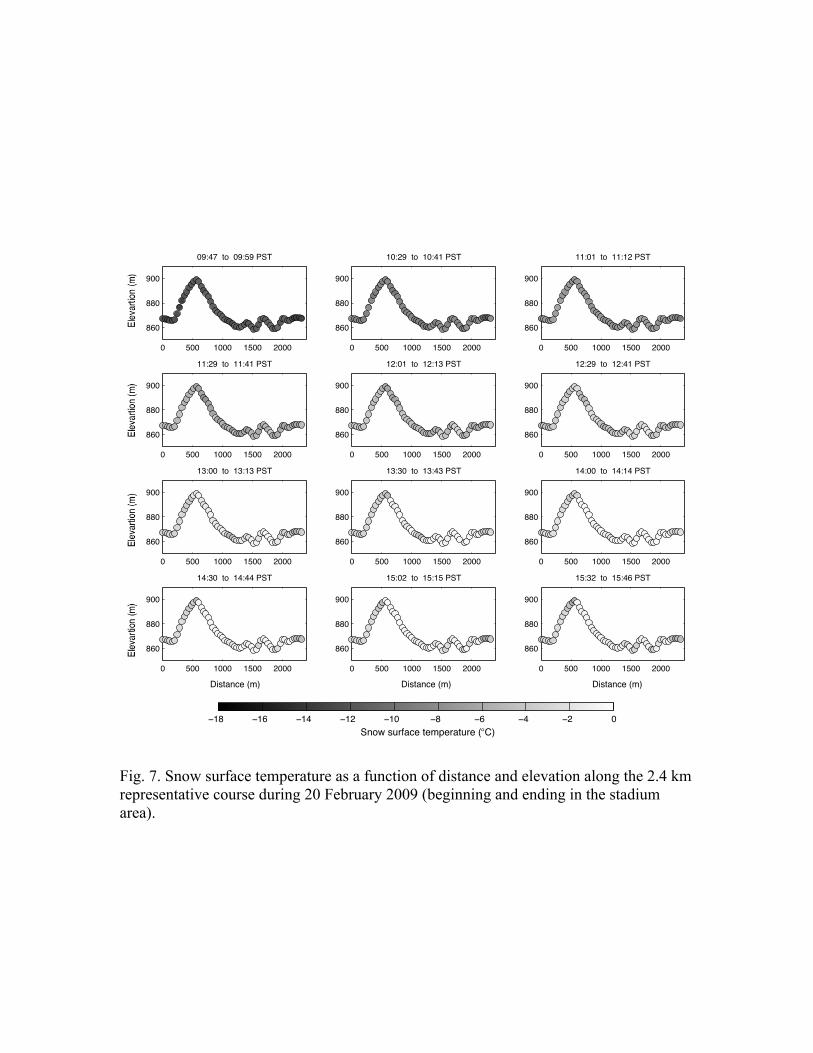
Fig. 7. Snow surface temperature as a function of distance and elevation along the 2.4 km representative course during 20 February 2009 (beginning and ending in the stadium area).
0 500 1000 1500 2000
860
880
900
09:47 to 09:59 PST
0 500 1000 1500 2000
860
880
900
10:29 to 10:41 PST
0 500 1000 1500 2000
860
880
900
11:01 to 11:12 PST
0 500 1000 1500 2000
860
880
900
11:29 to 11:41 PST
0 500 1000 1500 2000
860
880
900
12:01 to 12:13 PST
0 500 1000 1500 2000
860
880
900
12:29 to 12:41 PST
0 500 1000 1500 2000
860
880
900
13:00 to 13:13 PST
0 500 1000 1500 2000
860
880
900
13:30 to 13:43 PST
0 500 1000 1500 2000
860
880
900
14:00 to 14:14 PST
0 500 1000 1500 2000
860
880
900
14:30 to 14:44 PST
0 500 1000 1500 2000
860
880
900
15:02 to 15:15 PST
0 500 1000 1500 2000
860
880
900
15:32 to 15:46 PST
0 500 1000 1500 2000
860
880
900
Distance (m)
09:47 to 09:59 PST
0 500 1000 1500 2000
860
880
900
Distance (m)
10:29 to 10:41 PST
0 500 1000 1500 2000
860
880
900
Distance (m)
11:01 to 11:12 PST
0 500 1000 1500 2000
860
880
900
Distance (m)
11:29 to 11:41 PST
0 500 1000 1500 2000
860
880
900
Distance (m)
12:01 to 12:13 PST
0 500 1000 1500 2000
860
880
900
Distance (m)
12:29 to 12:41 PST
0 500 1000 1500 2000
860
880
900
Distance (m)
13:00 to 13:13 PST
0 500 1000 1500 2000
860
880
900
Distance (m)
13:30 to 13:43 PST
0 500 1000 1500 2000
860
880
900
Distance (m)
14:00 to 14:14 PST
0 500 1000 1500 2000
860
880
900
Distance (m)
14:30 to 14:44 PST
0 500 1000 1500 2000
860
880
900
Distance (m)
15:02 to 15:15 PST
0 500 1000 1500 2000
860
880
900
Distance (m)
15:32 to 15:46 PST
! "!!! #!!!$%!
&!!
!&'()**+,**!&'%&*-./
! "!!! #!!!$%!
&!!
"!'#&**+,**"!'("*-./
! "!!! #!!!$%!
&!!
""'!"**+,**""'"#*-./
! "!!! #!!!$%!
&!!
""'#&**+,**""'("*-./
! "!!! #!!!$%!
&!!
"#'!"**+,**"#'"0*-./
! "!!! #!!!$%!
&!!
"#'#&**+,**"#'("*-./
! "!!! #!!!$%!
&!!
"0'!!**+,**"0'"0*-./
! "!!! #!!!$%!
&!!
"0'0!**+,**"0'(0*-./
! "!!! #!!!$%!
&!!
"('!!**+,**"('"(*-./
! "!!! #!!!
"('0!**+,**"('((*-./
! "!!! #!!!
"%'!#**+,**"%'"%*-./
! %!! "!!! "%!! #!!!
"%'0#**+,**"%'(1*-./
* *
!"$ !"1 !"( !"# !"! !$ !1 !( !# !
.2,3*456789:*+:;<:68+56:*=°>?
!"% !"! !% !
! "!!! #!!!$%!
&!!
!&'()**+,**!&'%&*-./
! "!!! #!!!$%!
&!!
"!'#&**+,**"!'("*-./
! "!!! #!!!$%!
&!!
""'!"**+,**""'"#*-./
! "!!! #!!!$%!
&!!
""'#&**+,**""'("*-./
! "!!! #!!!$%!
&!!
"#'!"**+,**"#'"0*-./
! "!!! #!!!$%!
&!!
"#'#&**+,**"#'("*-./
! "!!! #!!!$%!
&!!
"0'!!**+,**"0'"0*-./
! "!!! #!!!$%!
&!!
"0'0!**+,**"0'(0*-./
! "!!! #!!!$%!
&!!
"('!!**+,**"('"(*-./
! "!!! #!!!
"('0!**+,**"('((*-./
! "!!! #!!!
"%'!#**+,**"%'"%*-./
! %!! "!!! "%!! #!!!
"%'0#**+,**"%'(1*-./
* *
!"$ !"1 !"( !"# !"! !$ !1 !( !# !
.2,3*456789:*+:;<:68+56:*=°>?
!"% !"! !% !

Fig. 8. Air temperature, snow surface temperature and 10 cm subsurface temperature from 16-19 February 2009 in the 2010 Olympic cross-country stadium. For reference, the -3ºC isotherm is shown marking where skis may have a minimum in ski-snow friction. Also shown is the 0ºC isotherm.

Fig. 9. Evolution of snow surface temperature for a (a) stadium (horizontal location), (b) 20º south facing exposed slope and (c) shaded location on 20 February 2009.
!"## $#"## $$"## $%"## $&"## $'"## $("## $)"##!$)
!$'
!$%
!$#
!*
!)
!'
!%
#
+,-.,/012/,34°56
+7-,3489+6
3
3
:;/7<;=10>34?10@72-6
9;21A3B0C7=D
9A0@,

Fig. 10. Simulated snow surface temperature, observed snow surface temperature in the 2010 Olympic cross-country stadium and VOD 2 m air temperature for February 16-19 2009.
!"#$% !"#$& !"#$' !"#$(
!"!
!$)
!$!
!)
!
)
$!
*+,-
.-/0-1+,21-34°56
3
3
789-: ;<= >;*3+?1

(a) (b)
(c) (d)
Fig. 11. (a) Simulated snow surface temperature for a clear sky case with initialized warm and cold snowpacks. Input air temperature is also shown for the warm and cold cases. (b) As in (a) except for cloud cover with cloud base at 1 km. (c) As in (a) except with fog. (d) As in (a) except with precipitation falling after 7:00 PST.
!"## $"## %#"## %&"## %'"## %!"## %$"## &#"##!%(
!%#
!(
#
(
)*+,*-./0-*12°34
35*.-1678129:*.59;*:4
!"## $"## %#"## %&"## %'"## %!"## %$"## &#"##!%(
!%#
!(
#
(
<=*->.6/129:*.59;*:4
!"## $"## %#"## %&"## %'"## %!"## %$"## &#"##!%(
!%#
!(
#
(
)*+,*-./0-*12°34
)9+*12?@)4
ABC129:*.59;*:4
!"## $"## %#"## %&"## %'"## %!"## %$"## &#"##!%(
!%#
!(
#
(
)9+*12?@)4
?-*>9,9/./9BD129:*.59;*:4
!"## $"## %#"## %&"## %'"## %!"## %$"## &#"##!%(
!%#
!(
#
(
)*+,*-./0-*12°34
35*.-1678129:*.59;*:4
!"## $"## %#"## %&"## %'"## %!"## %$"## &#"##!%(
!%#
!(
#
(
<=*->.6/129:*.59;*:4
!"## $"## %#"## %&"## %'"## %!"## %$"## &#"##!%(
!%#
!(
#
(
)*+,*-./0-*12°34
)9+*12?@)4
ABC129:*.59;*:4
!"## $"## %#"## %&"## %'"## %!"## %$"## &#"##!%(
!%#
!(
#
(
)9+*12?@)4
?-*>9,9/./9BD129:*.59;*:4
!"## $"## %#"## %&"## %'"## %!"## %$"## &#"##
!%'
!%&
!%#
!$
!!
!'
!&
#
&
'
!
$
()*+),-./,)01°23
(4*)0156(3
27)-,089:014;)-74<);3
0
0
=>;)70?-,* @4,0?-,* =>;)70A>7; @4,0A>7;

Fig. 12. Simulated snow surface temperature for an exposed horizontal, 20° south facing and 20° north facing ski track, also shown is model input air temperature.
!"## $"## %#"## %&"## %'"## %!"## %$"## &#"##!%(
!%#
!(
#
(
)*+,*-./0-*12°34
)5+*1267)4
1
1
89-5:9;/.< =90/81&#° ;9-/81&#° >5-