snap education and evaluation case study report · u.s. department of agriculture, food and...
TRANSCRIPT
Nutrition Assistance Program Report Series Office of Research and Analysis Supplemental Nutrition Assistance Program
SNAP Education and Evaluation Case Study Report:
University of Nevada Cooperative Extension’s
All 4 Kids Program
Volume II: Appendices
United States Food and Department of Nutrition Agriculture Service
January 2012

Non-Discrimination Policy The U.S. Department of Agriculture (USDA) prohibits discrimination in all its programs and activities on the basis of race, color, national origin, age, disability, and where applicable, sex, marital status, familial status, parental status, religion, sexual orientation, genetic information, political beliefs, reprisal, or because all or part of an individual’s income is derived from any public assistance program. (Not all prohibited bases apply to all programs.) Persons with disabilities who require alternative means for communication of program information (Braille, large print, audiotape, etc.) should contact USDA’s TARGET Center at (202) 720-2600 (voice and TDD). To file a complaint of discrimination, write USDA, Director, Office of Adjudication, 1400 Independence Avenue, SW, Washington, D.C. 20250-9410 or call toll free (866) 632-9992 (Voice). Individuals who are hearing impaired or have speech disabilities may contact USDA through the Federal Relay Service at (800) 877-8339; or (800) 845-6136 (Spanish). USDA is an equal opportunity provider and employer.

SNAP Education and Evaluation Case Study Report:
University of Nevada Cooperative Extension’s All 4 Kids Program
Volume II: Appendices Authors: Gloria Aponte Clarke Sheryl Cates Vivian Gabor Jonathan Blitstein Loren Bell James Hersey Submitted by: Submitted to: Altarum Institute Office of Research and Analysis 1200 18th Street N.W. Suite 700 Food and Nutrition Service Washington, DC 20036 3101 Park Center Drive Alexandria, VA 22302-1500 Project Director: Project Officer: Loren Bell Sara Olson This study was conducted under Contract number AG-3198-D-08-0098 with the Food and Nutrition Service. This report is available on the Food and Nutrition Service website: http://www.fns.usda.gov Suggested Citation: U.S. Department of Agriculture, Food and Nutrition Service, Office of Research and Analysis, SNAP Education and Evaluation Case Study Report: University of Nevada Cooperative Extension’s All 4 Kids Program. Volume II: Appendices by Gloria Aponte Clarke, Sheryl Cates, Vivian Gabor, Loren Bell, Jonathan Blitstein, and James Hersey. Project Officer: Sara Olson, Alexandria, VA: January 2012.
United States Food and Department of Nutrition Agriculture Service
Supplemental Nutrition Assistance Program January 2012


Appendix A Process Evaluation Data Collection Instruments


All 4 Kids UNCE ● Program Evaluation
List of Contents A.1: Program Information Abstraction Form for Demonstration Project Application to FNS and 2010
SNAP-Ed Plans
A.2: Discussion Guide for Program Administrator [Pre-Implementation]
A.3: Discussion Guide for Program Administrator [Post-Implementation]
A.4: Discussion Guide for Direct Educators [Pre-Implementation]
A.5: Discussion Guide for Direct Educators [Post-Implementation]
A.6: Discussion Guide for Center Directors [Pre-Implementation]
A.7: Discussion Guide for Center Directors [Post-Implementation]
A.8: Discussion Guide for Classroom Teachers [Post-Implementation]
A.9: Discussion Guide for Parents [Post-Implementation]
A.10: Spanish Discussion Guide for Parents [Post-Implementation]
A.11: Project Resource and Expense Tracking Form
A.12: SNAP-Ed 1Nutrition Education Observation Form


All 4 Kids UNCE ● Program Evaluation
A.1: Program Information Abstraction Form for Demonstration Project Application to FNS and 2010 SNAP-Ed Plans


Program Information Abstraction Form for
UNCE All 4 Kids Demonstration Project Application to FNS and 2010 SNAP-Ed Plans
[PRE-IMPLEMENTATION]
IA:
State:
Program name:
Data abstractor:
Date of abstraction:
Resources used:

TOPIC AREA 1: Formative Research and Intervention Design
1-1. Target audience(s)
1-2. Reach or intended size of intervention 1-3. Description of nutrition education intervention.
A. Overall intervention goal(s)
B. Describe the key education methods that are being used in the nutrition education intervention, including how this may vary for different target audiences (e.g. children versus their caregivers).
C. Describe each nutrition education lesson in detail using the following format. [Please copy
and paste as many copies of this table as you need to capture all nutrition education messages and number them accordingly).
Lesson #1
Short title:
Detailed description of education message(s):
Specific objectives:
Intended impact/change
Materials supporting lesson
Lesson #2
Short title:
Detailed description of education
message:
Specific objectives:
Intended impact/change
Materials supporting lesson
Lesson #3
Short title:
Detailed description of education message:
Specific objectives:
Intended impact/change
Materials supporting lesson
Lesson #4
Short title:
Detailed description of education message:
Specific objectives:
Intended impact/change

Materials supporting lesson
D. List and describe other key components of the nutrition education intervention that supports or reinforces its objectives (e.g. the family activity nights in NV).
1-4. Anticipated dose and intensity of each nutrition education intervention method
___ A. Direct education
Dose (# of contacts with each participant)
Intensity (# of contacts X length of contact)
___ B. Indirect education
Dose (# of contacts with each participant)
Intensity (# of contacts X length of contact)
____ C. Social marketing
Dose (# of contacts with each participant)
Intensity (# of contacts X length of contact)
____ D. Other
Dose (# of contacts with each participant)
Intensity (# of contacts X length of contact)
1-5. Nutrition education materials (Title, source, how to locate source)
____ A. Materials developed by FNS
If modified FNS materials, how and why?
____ B. Materials developed by other State SNAP-Ed programs
If modified these existing materials, how and why?
___ C. Materials developed by other public nutrition educations programs
If modified these existing materials, how and why?
___ D. Materials developed by private agencies
If modified these existing materials, how and why?
____ E. Materials developed by project
Justification for development?
____ F. Other
1-6. Theoretical underpinnings for nutrition education
1-7. Evidence that suggest the intervention will be successful (i.e., pilot project results, previously tested instruments, etc.)
1-8. Key players in the design of the intervention
a. Who were the key players from the implementing agency? b. Were there any partnerships with other public or private organizations that were key
to the design and implementation plan of the intervention? c. If so, how were these partnerships formed? d. Other key players?

TOPIC AREA 2: Operational Steps Involved in Intervention Implementation
2-1. Management and oversight structure
a. Who are the program administrators and coordinators? b. Who is responsible for quality control and monitoring the nutrition education
delivery?
2-2. Qualifications of nutrition educator trainer(s)
a. Level of education b. On-the-job training c. Years of experience
2-3. Qualifications of nutrition education provider(s)
a. Level of education b. Specialized training c. Years of experience delivering nutrition education
2-4. Plans for training of nutrition education providers (Describe frequency and duration of training, training agenda and method, etc.)
2-5. Recruitment of intervention sites/participants
a. How were individual intervention sites selected to participate in the intervention (specifically for this FNS evaluation component)?
b. How will individual classrooms be selected to participate in the intervention (for CNNS, NYSDOH, and UNV only)?
c. How will the adult participants be recruited to participate in the intervention (for
NYSDOH, UNV, and PSU only)?
2-6. Efforts planned to retain participants in order to receive the desired maximum dose of the intervention

All 4 Kids UNCE ● Program Evaluation
A.2: Discussion Guide for Program Administrator [Pre-Implementation]


Discussion Guide for Program Administrator
[PRE-IMPLEMENTATION] State: ________________________ Interviewer: ______________ Respondent: ________________________ Date of Interview: ______________ Title: ________________________ Study ID No: ______________ Organization: ________________________ Address: ________________________ ________________________ ________________________ Phone: ________________________ Fax: ________________________ Email: ________________________
Thank you for taking the time for this interview. The U.S. Department of Agriculture’s Food and Nutrition Service has contracted with Altarum Institute to conduct a study of the All 4 Kids that is offering information to children and their families about healthy foods to eat and the importance of being active. Altarum is a health and nutrition policy research and consulting institute and our work focuses on helping improve the health and nutrition status of children, families, and adults. The purpose of the study is to evaluate several SNAP (Supplemental Nutrition Education Program)-Education models around the country and to provide recommendations for how these interventions could be improved to better serve the children and families in your community. We also will be evaluating how the intervention might be replicated in other communities.
Although there are only a select number of programs participating in this evaluation, we will do our best to aggregate data wherever possible in order to avoid information being tied back to a particular respondent. Nothing said today will be attached to you, and nothing that you say will affect your job or be shared with your employers.
Today we will specifically be discussing the planning process and your expectations for the intervention. Once it has been implemented, we will follow up with you to find out whether the intervention met
OMB. No. 0584-0554 Expiration date: 01/31/2013 Public reporting burden for this collection of information is estimated to average 40 minutes per response, including the time for reviewing instructions, searching existing data sources, gathering and maintaining the data needed, and completing and reviewing the collection of information. An agency may not conduct or sponsor, and a person is not required to respond to, a collection of information unless it displays a currently valid OMB control number. Send comments regarding this burden estimate or any other aspect of this collection of information, including suggestions for reducing this burden, to: U.S. Department of Agriculture, Food and Nutrition Services, Office of Research and Analysis, Room 1014, Alexandria, VA 22302 ATTN: PRA (0584-0554*). Do not return the completed form to this address.

your expectations and how it might be improved. I expect that this interview will take about 45 minutes. Thank you for taking the time to speak with me.
Before I begin, do you have any questions?
Thank you for reviewing the project summary we created and providing this feedback. Now let’s briefly talk about the planning and design phase of your project.
1. What challenges, if any, have you faced during the design and planning phases of this nutrition education program?
a) What factors do you feel have contributed most to a successful design and planning phase (prompts: using education materials that were already developed, good communication between contributors, knowledgeable staff, establishment of strong partnerships, etc.)?
b) What lessons have you learned during this key phase of program development? What would you do differently? What would you do the same?
Okay, now I would like to shift our focus to the upcoming implementation of your SNAP-Ed project.
2. Now that you are ready to transition from the planning and design phase of your project to the implementation phase, what challenges, if any, are you anticipating?
3. Do you feel that the environment in which the intervention will take place will be able to support the intended change in behavior, knowledge, and/or attitudes?
c) For example, do you have any sense of the teacher’s buy-in and/or enthusiasm about the intervention and what impact this might have on the children?
d) Does the school/child care center offer the children healthy foods options and are healthy foods otherwise available?
e) What, if any, other nutrition education messages are the children in the intervention sites being exposed to (that you are aware of)?
4. Did the program have any difficulty recruiting adequate staff for the nutrition education delivery?
[IF YES] a) What were the recruitment challenges/problems?
5. Please describe any quality control and monitoring efforts that will take place during implementation?

6. Could you please clarify when and where the pilot took place?
7. Were the same evaluation tools used during the pilot phase If yes, were modifications made for any reason and what were they?
8. What training will the data collectors be required to have before beginning data collection (e.g. classroom education and/or format and content of training by intervention evaluation staff- agenda of training, format)?
• What I know is : training for evaluators will be conducted the week of January 23rd by UNCE staff.
9. Who specifically is providing the evaluation training for your staff?
10. How will data from the Preschool Movement Assessment, Parent interviews, Snack Assessment, activity logs and accelerometers be captured and analyzed?
11. Can you please tell me how you will collect reach and dosage of the intervention? The format for the activity logs (most updated) you plan to use to document the reach and dosage of your lessons and family activity nights in each classroom and center.
• Ultimately- we would like to know number of unduplicated children who attended at least one lesson and the number of children who attended each lesson by classroom. Ex: Classroom X (3 yr old room , teacher name) # of kids Classroom Y (4 yr old room, teachers name) # of kids
12. Description of evaluation trainings. Please send any training materials and agendas.
13. What other nutrition education efforts/classes were offered to the children in the intervention classrooms by Head Start?
14. What other nutrition and physical activity activities are taking place in the head start centers. (Body start? I am moving I am learning – from national head start office)
• Get ideas for how to collect that information from intervention and CONTROLS. Perhaps Altarum develop a form to be sent by Teresa?
15. Can you please provide an updated staffing plan? With FTE and Salary?
16. Focus groups and post interviews
• Regarding focus group recruitment- do you think the educators could help with recruitment?

• Perhaps during the last parent activity night?
• And posting recruiting fliers in the classroom? And putting flier in the activity packs?
• And should people call the educator to sign up- or could we ask the teacher to keep a sign up sheet?
That ends my formal interview questions. Do you have any comments or recommendations that you would like to add?
Thank you very much for your time and input on this very important project. As I mentioned, we will follow up and talk with you after the intervention and evaluation period are over.

All 4 Kids UNCE ● Program Evaluation
A.3: Discussion Guide for Program Administrator [Post-Implementation]


Discussion Guide for Implementing Agency Program Administrator
[POST-IMPLEMENTATION]
State: ________________________ Interviewer: ______________ Respondent: ________________________ Date of Interview: ______________ Title: ________________________ Study ID No: ______________ Organization: ________________________ Address: ________________________ ________________________ ________________________ Phone: ________________________ Fax: ________________________ Email: ________________________
Thank you for taking the time for this interview. As I told you during our last meeting, the U.S. Department of Agriculture’s Food and Nutrition Service has contracted with Altarum Institute to conduct a study of the [NAME OF INTERVENTION] that is offering information to children and their families about healthy foods to eat and the importance of being active. Altarum is a health and nutrition policy research and consulting institute and our work focuses on helping improve the health and nutrition status of children, families, and adults.
As mentioned during our last meeting, nothing said today will be attached to you, and nothing that you say will affect your job or be shared with your employers.
Today we will specifically discuss how the implementation of the program differed from your expectations. We also will discuss lessons learned and your feedback on how the program might be
OMB No. 0584-0554 Expiration date: 01-31-2013 Public reporting burden for this collection of information is estimated to average 40 minutes per response, including the time for reviewing instructions, searching existing data sources, gathering and maintaining the data needed, and completing and reviewing the collection of information. An agency may not conduct or sponsor, and a person is not required to respond to, a collection of information unless it displays a currently valid OMB control number. Send comments regarding this burden estimate or any other aspect of this collection of information, including suggestions for reducing this burden, to: U.S. Department of Agriculture, Food and Nutrition Services, Office of Research and Analysis, Room 1014, Alexandria, VA 22302 ATTN: PRA (0584-0554*). Do not return the completed form to this address.

improved. I expect that this discussion will take about 45 minutes. I appreciate you taking the time to speak with me today.
Before I begin, do you have any questions?
Formative research and program design (Topic 1)
I’d like to briefly discuss how, if at all, the implementation of your nutrition education intervention differed from what was originally planned. There are several aspects of implementation that I would like to cover.
1. Nutrition education messages. Were the nutrition education messages modified at any point
during implementation? (RQ #1-2) (RQ #4-1)
[IF YES]
a) How and why were they modified? (RQ #4-2)
2. Target audience. Did the target audience differ from what was originally planned? (RQ #1-6)
[IF YES]
a) How and why did they differ? (RQ #4-2)
3. Method of delivery. Were the methods of delivery (i.e., direct education, indirect education)
modified during implementation for any reason? (RQ #1-2) (RQ #4-1)
[IF YES]
a) How and why were they changed?
4. Dose. Did the dose of nutrition education vary from what was originally planned (i.e., the number
of lessons, the length of each lesson, etc.)? (RQ #1-4)
[IF YES]
a) How and why did this vary from what was planned? (RQ #4-1)
5. Reach. Were you able to implement the intervention at the originally proposed number of sites
and do you feel that you reached the intended number of participants? Were there any factors
that affected your ability to achieve the full, intended reach? (RQ #1-7)
Nutrition education materials. Were the nutrition education materials modified at any point
during implementation? (RQ #1-3)

[IF YES]
a) How were the materials modified and why?
6. Timeline. To what extent were the original implementation timelines met? (RQ #1-10)
a) What are the reasons for and implications of any departures from the original timelines?
Operational steps involved in program implementation (Topic 2)
7. Did you find the level of staff, both in terms of qualifications and total number of staff (and types
of staff), adequate for optimally delivering your nutrition education intervention? (RQ #3-1)
8. What changes, if any, were made to planned key staff involvement and what were the reasons
for any such changes? (RQ #2-1)
9. Were any quality control and monitoring processes employed to maximize the fidelity/quality of
the intervention delivery? (RQ #2-7)
10. How effective were staff in delivering the intended nutrition education messages? (RQ #2-3)
a) Why do you think these staff were effective/ineffective? b) What could they have done differently to improve their effectiveness?
11. Do you think the nutrition educator training was sufficient? (RQ #2-6)
a) What worked well?
b) What could have been improved?
12. Were planned recruitment (of participants/parents) efforts modified during implementation?
(RQ #1-7) (RQ #6-1)
[IF YES]
a) How were recruitment efforts modified and for what reasons?
13. What recruitment methods did you find to be most effective/least effective?
14. In your opinion, how well was the program able to track participation? (RQ #6-1)
15. Did previously identified partners remain engaged throughout the intervention? (RQ #1-13)
16. Were these partnerships successful? (RQ #1-13)

[IF YES] a) What would you say contributed to their success?
[IF NO] b) Why not?
Resources devoted to intervention (Topic 3)
17. What were the actual time commitments for key staff (FTEs) if different than planned? (RQ #3-2)
[IF YES]
a) Why did they differ?
18. How closely did the actual program cost components reflect the budgeted costs?
a) If there was a difference between budgeted and actual, what factors might have contributed to this?
19. Were the necessary type and quantity of materials, technology, etc. available to carry out the
implementation as planned? If not, what else was needed? (RQ #3-3 )
Lessons learned for improvement and replicability (Topic 4)
Next I’d like to talk about lessons learned during implementation of the study.
20. Overall, what factors were key to the success of this nutrition education program?
21. What factors hindered or limited the success of this nutrition education program?
22. Looking back over the past [NUMBER OF MONTHS] months, what lessons have you learned?
What would be most valuable for another State or implementing agency to know if they were
considering using this model? (RQ #4-3)
23. In your opinion, are there any aspects of this SNAP-Ed program that would make it difficult to
implement on a larger scale?
24. How did the FNS requirements for this demonstration project influence the design of your
intervention project in ways that you had not anticipated when you applied to become
a demonstration project?
Assessment of IA-led evaluation (Topic 7)

25. What methods were used to conduct the evaluation, if different than originally planned? If
different, why? (RQ #7-1 )
26. Were the evaluation tools modified for any reason since the intervention began? If so, how and
why? (RQ #7-1 )
27. Did the planned staff conduct the evaluation? If not, why not and who ended up conducting the
evaluation? (RQ #7-1 )
28. Did the actual costs of the evaluation vary from what was planned? If so, how and why?
That ends my formal interview questions. Do you have any comments or recommendations that you would like to add?
Thank you very much for your time and input on this very important project.


All 4 Kids UNCE ● Program Evaluation
A.4: Discussion Guide for Direct Educators [Pre-Implementation]


Discussion Guide for Direct Educators
[PRE-IMPLEMENTATION] State: ________________________ Interviewer: ______________ Respondent: ________________________ Date of Interview: ______________ Title: ________________________ Study ID No: ______________ Organization: ________________________ Address: ________________________ ________________________ ________________________ Phone: ________________________ Fax: ________________________ Email: ________________________
Thank you for taking the time for this interview. The U.S. Department of Agriculture’s Food and Nutrition Service has contracted with Altarum Institute to conduct a study of All 4 Kids that is offering information to children and their families about healthy foods to eat and the importance of being active. Altarum is a health and nutrition policy research and consulting institute and our work focuses on helping to improve the health and nutrition status of children, families, and adults. The purpose of the study is to evaluate several SNAP-Education models around the country and to provide recommendations for how these interventions could be improved to better serve the children and families in your community. We also will be evaluating how the intervention might be replicated in other communities.
We will be using first names only today. Everything you say will be kept private. After we conduct several of these interviews, we will write a report for the U.S. Department of Agriculture’s Food and Nutrition Service. Your name will not appear anywhere in the report. Nothing said today will be attached to your name at any point. Nothing that you say will affect your job or be shared with your employers.
Today we will specifically be discussing your background and other qualifications as an educator for this education program, the planning process that has already begun with the intervention sites, and your expectations for the reach and design of the program. Once you have completed teaching one complete session of All 4 Kids , we will follow up with you for one more interview to find out how things may have
OMB No. 0584-0554 Expiration date: 01/31/2013 Public reporting burden for this collection of information is estimated to average 30 minutes per response, including the time for reviewing instructions, searching existing data sources, gathering and maintaining the data needed, and completing and reviewing the collection of information. An agency may not conduct or sponsor, and a person is not required to respond to, a collection of information unless it displays a currently valid OMB control number. Send comments regarding this burden estimate or any other aspect of this collection of information, including suggestions for reducing this burden, to: U.S. Department of Agriculture, Food and Nutrition Services, Office of Research and Analysis, Room 1014, Alexandria, VA 22302 ATTN: PRA (0584-0554). Do not return the completed form to this address.

changed from what you planned to do and to obtain your experiences and views on what worked well or not and why, and what you might change to improve the program.
I expect that our discussion today will take about 30 minutes. Before I begin, do you have any questions?
Educator’s Job Title, Qualifications and Capabilities
First I would like to ask you a few questions about your position and your background for this type of work.
1. What is your job title in this role as educator for All 4 Kids?
2. Do you also provide nutrition education or community education for any other programs?
[IF YES]
a) Please tell me a little bit about your other related work?
3. Prior to this role as an educator for All 4 Kids have you had any other job or volunteer experience in nutrition or health education for children and families?
[IF YES] a) Please describe these job or volunteer experiences? b) How many total years of experience in nutrition or health education for children and families
did you have before you came to be an educator in All 4 Kids?
4. What is the highest level of education you have completed to date?
a) [For those who have college or graduate school degrees] What subject was your major or degree in?
5. Outside of any formal education, have you had any specialized training or certification either in nutrition education or health education?
[IF YES] a) Could you please describe this training for me?
6. What else from your life experience do you think makes you a good educator for All 4 Kids?
7. What are some of the challenges that you or others like you might face in being a good educator for this intervention?

Recruitment and Implementation Plans
Next I would like to discuss what is being planned to recruit sites and participants for the intervention and how many sites, classes and students you plan to be working with.
8. Do you know yet how the sites were recruited?
a) Who did the recruiting and how did they reach out to enroll the sites? b) Do you think this was an effective way to select the sites? Why or why not?
9. At how many sites do you plan to teach the All 4 Kids classes?
10. How many classrooms or groups of children will you be working with at each of these sites?
a) How often will you be going out to these groups, and how long will each class or activity be? b) Will you have one joint class or a separate class for each classroom? c) How many children do you expect will be involved in each class?
11. At the Head Start centers that are implementation sites for FNS evaluation where you will be implementing All 4 Kids, do you feel that the environment in which the intervention will take place will be able to support the intended change in behavior, knowledge, and/or attitudes?
a) Does the school/child care center offer the children healthy foods options and are healthy
foods otherwise available? b) What, if any, other nutrition education messages are the children in the intervention sites being
exposed to (that you are aware of)?
12. Can you tell me about the Family Activity Nights?
[IF YES] a) How many of these family events do you plan to hold at each site? b) How often will they occur? c) At what time of day and how long will each session be planned for?
13. How will you be recruiting adults to participate in the intervention?
14. How many adults do you expect will be attending each of the classes for parents/caregivers?
15. What efforts will be made to retain the parents in the classes so that they receive the entire intervention or attend as many of the six classes as possible for them?

16. Aside from yourself as the nutrition educator, will there be anyone else involved teaching the All 4 Kids curriculum at these sites?
[IF YES] a) What are their roles? b) Do you have any sense of their buy-in and/or enthusiasm about the intervention and what
impact this might have on the children?
17. What physical resources will you need at the sites to implement the intervention? (e.g. space, a/v equipment, computers)?
Scheduling
18. Have you been in contact with the site yet to talk about your plans for the intervention?
a) If yes, when do you plan to start the intervention at the Head start centers you will work with?
Please name centers.
b) If yes, Do you have a schedule yet of the dates and times for all the 6 child and parent classes? By when could we get a copy of this schedule? How can we best stay in touch with you to firm up these dates?
19. Are you planning on doing any direct training of the teachers or other staff at the centers?
20. Is there anything unique about this center or the population of children they serve that you think will require you to tailor the program to better meet the needs of the children and/or their parents at this center? If yes, how are you planning to tailor the program to address these needs?
Perceived Facilitators and Challenges to Intervention Success
21. Based on what you know about the curriculum, materials and other aspects of All 4 Kids , what aspects of these do you think will be most effective with the target audiences you are trying to reach?
22. Before we close, I would like to ask you whether you foresee any challenges in implementing the intervention as designed or planned?
[IF YES] a) What are those potential challenges and how might they be overcome?

That ends my formal interview questions. Do you have any comments or recommendations that you would like to add?
Thank you very much for your time and input on this important project. My colleagues and I at Altarum will get be getting back in touch with you to schedule a follow-up interview after you finish teaching All 4 Kids . I am looking forward to talking with you then.


All 4 Kids UNCE ● Program Evaluation
A.5: Discussion Guide for Direct Educators [Post-Implementation]


Discussion Guide for Direct Educators
[POST-IMPLEMENTATION]
State: ________________________ Interviewer: ______________ Respondent: ________________________ Date of Interview: ______________ Title: ________________________ Study ID No: ______________ Organization: ________________________ Address: ________________________ ________________________ ________________________ Phone: ________________________ Fax: ________________________ Email: ________________________
Thank you for taking the time for this interview. As I told you during our first meeting, the U.S. Department of Agriculture’s Food and Nutrition Service has contracted with our Altarum Institute to conduct a study of the [NAME OF INTERVENTION] that is offering information to children and their families about healthy foods to eat and the importance of being active. Altarum is a health and nutrition policy research and consulting institute and our work focuses on helping to improve the health and nutrition status of children, families, and adults.
The purpose of the study is to describe how several SNAP-Education program models are being carried out across the country and evaluate their impact on nutrition behaviors. The study will also highlight recommendations for how to replicate and improve these SNAP-Education models –based on what we observe and learn from the program planners, from the people who are implementing these interventions—like yourselves—and from the intervention participants.
OMB No. 0584-0554 Expiration date: 1/31/2013 Public reporting burden for this collection of information is estimated to average 30 minutes per response, including the time for reviewing instructions, searching existing data sources, gathering and maintaining the data needed, and completing and reviewing the collection of information. An agency may not conduct or sponsor, and a person is not required to respond to, a collection of information unless it displays a currently valid OMB control number. Send comments regarding this burden estimate or any other aspect of this collection of information, including suggestions for reducing this burden, to: U.S. Department of Agriculture, Food and Nutrition Services, Office of Research and Analysis, Room 1014, Alexandria, VA 22302 ATTN: PRA (0584-0554*). Do not return the completed form to this address.

We will be using first names only today. Everything you say will be kept private. After we conduct several of these interviews, we will write a report for the U.S. Department of Agriculture’s Food and Nutrition Service. Your name will not appear anywhere in the report. Nothing said today will be attached to your name at any point. Nothing that you say will affect your job or be shared with your employers.
Today we will talk first about the training and assistance you were provided, then about differences between what your planned implementation versus what actually happened. After we cover that information, I want to spend most of our today hearing what you think worked well and your suggestions for any revisions or improvements to [NAME OF INTERVENTION].
I expect that our discussion will take about 30 minutes today. Before I begin, do you have any questions?
Experience and Satisfaction with Training
Let’s start with your views on the training you received from (NAME OF ADMINISTERING AGENCY) before you began implementing the [NAME OF INTERVENTION].
1. Please describe the format of initial training you received from [NAME OF INTERVENTION] staff
to teach this curriculum. (e.g., was it in a large or small group or one-on-one, was observation of
implementation involved, etc.)
2. How much training did you initially receive (number and length of sessions)?
3. What aspects of the training did you find most useful?
4. What additional information, tools, skills, or other training do you think should be provided in the
initial training to help you or other educators like yourself be more effective in delivering [NAME
OF INTERVENTION]?
5. Are there any other changes you would suggest to improve the content or format or other
aspects of the educator trainings for [NAME OF INTERVENTION]?
Did you receive any ongoing training or assistance—in a structured or unstructured format—
after your initial training for [NAME OF INTERVENTION]?
[IF YES]
a) What was the format? b) What was the content? c) How much of this assistance did you receive? d) What was helpful about this follow-up training or assistance? e) What other follow-up training or assistance could have helped your or other educators like
you teach the nutrition education curriculum to this target population more effectively?

[IF NO] f) What kind of follow-up training or technical assistance do you think could have helped you
more effectively teach the [curriculum]?
Reach, Dosage and Intensity of Intervention- Actual Compared to Planned
6. How did the number of sites, groups, classes and activities you implemented with the children
differ, if at all, from what you had planned?
7. How did the amount of time you spent in direct education with the children differ, if at all, from
what you had planned?
[ASK NEXT TWO QUESTIONS FOR NY AND NV INTERVENTIONS ONLY]
8. How did the number of sites, groups, classes and activities you implemented with
parents/caregivers/families differ, if at all, from what you had planned?
9. How did the amount of time you spent in direct education with the parents/caregivers/families
differ, if at all, from what you had planned?
Recruitment and Retention [ASK THIS SECTION FOR NY AND NEVADA INTERVENTIONS ONLY.]
10. Who carried out the outreach/recruitment efforts to encourage adults to participate in
intervention?
11. How effective do you think the recruitment efforts were and why?
12. What were barriers to recruiting parents to come to classes or events and how do you think that
these barriers could be reduced?
13. What efforts were made to retain parents beyond their first class or activity night?
a) How effective do you think the retention efforts were and why?
14. What were barriers to retaining parents in the intervention that might be different from
recruitment barriers and how do you think that these barriers could be reduced?
Differences between Actual and Planned Implementation

15. In addition to any changes in the number, size and length of your educational activities you
mentioned earlier, were there other differences in how you implemented the [NAME OF
INTERVENTION] compared to what you and the program planners had intended?
[IF YES] a) In what ways was it implemented differently from what was planned? b) Why did these changes from the original plan occur? c) In what ways were the changes positive? d) In what ways were the changes negative?
Lessons Learned for Improvement and Replicability
16. What do you think worked well about the direct education, in-classroom education format of
[NAME OF INTERVENTION] for children and why do you think it worked well?
17. What could be improved about the direct education, in-classroom education format of [NAME OF
INTERVENTION] for children and why would you suggest this change?
18. What do you think worked well about the nutrition education materials and lesson activities
designed for the children and why do you think it worked well?
19. What could be improved about the nutrition education materials and lesson activities designed
for the children and why would you suggest this change?
[ASK NEXT 4 QUESTIONS FOR NY AND NV INTERVENTIONS ONLY]
20. What do you think worked well about the direct education formats that are designed to engage
parents or caregivers in [NAME OF INTERVENTION] and why do you think these worked well?
21. What could be improved about the direct education formats for parents or caregivers and why
would you suggest this change?
22. What about the take-home nutrition education materials and lessons targeted to parents or
caregivers worked well and why do think this worked well?
23. What could be improved about the take-home nutrition education materials and lessons targeted
to parents or caregivers and why would you suggest this change?
24. [IF NOT ALREADY MENTIONED IN RESPONSE TO QUESTIONS 24-28] Do you think that the
nutrition educational materials and lessons and other aspects of the [NAME OF INTERVENTION]
are tailored to be culturally-appropriate to the racial and ethnic groups that are in the target
audience?

[IF YES] a) What features of the materials and lessons make them culturally-appropriate?
[IF NO] b) What do you think specifically could be changed or tailored in the materials and/or lessons
or class form to make them more culturally appropriate for the racial and ethnic groups that are in the target audience for [NAME OF INTERVENTION]?
25. In addition to what we have already talked about already, are there any other specific aspects of
the [NAME OF INTERVENTION] that you think worked well?
26. Are there other particular aspects of the program do you think did not work well?
27. Do you have any other suggestions for ways that [NAME OF INTERVENTION] could be improved
to be more effective in improving the nutrition behaviors of its target audiences?
That ends my formal interview questions. Do you have any comments or recommendations that you would like to add?
Thank you very much for your time and input on this important project.


All 4 Kids UNCE ● Program Evaluation
A.6: Discussion Guide for Center Directors [Pre-Implementation]


Discussion Guide for Head Start Center Directors
[PRE-IMPLEMENTATION] State: ________________________ Interviewer: ______________ Respondent: ________________________ Date of Interview: ______________ Title: ________________________ Study ID No: ______________ Organization: ________________________ Address: ________________________ ________________________ ________________________ Phone: ________________________ Fax: ________________________ Email: ________________________
Thank you for taking the time to participate in this interview. The U.S. Department of Agriculture’s Food and Nutrition Service has contracted with Altarum Institute to conduct a study of the All 4 Kids that is offering information to children and their families about healthy foods to eat and the importance of being active. Altarum is a health and nutrition policy research and consulting institute and our work focuses on helping to improve the health and nutrition status of children, families, and adults.
This study will provide information on how the All 4 Kids works from the perspective of the people who planned the program, the program teachers, you and your staff and some of the parents whose children participated. We also will use what you tell us today to provide recommendations for how All 4 Kids can be improved to better work with organizations like yours and the children and families you serve.
Any answers you provide for this study will be kept private and your name will not be identified with any answers you provide. The estimated amount of time required to complete this interview is 30 minutes. I want to thank you for taking the time today to speak with me.
Before I begin, do you have any questions?
OMB No. 0584-0554 Expiration date: 01/31/2013 Public reporting burden for this collection of information is estimated to average 30 minutes per response, including the time for reviewing instructions, searching existing data sources, gathering and maintaining the data needed, and completing and reviewing the collection of information. An agency may not conduct or sponsor, and a person is not required to respond to, a collection of information unless it displays a currently valid OMB control number. Send comments regarding this burden estimate or any other aspect of this collection of information, including suggestions for reducing this burden, to: U.S. Department of Agriculture, Food and Nutrition Services, Office of Research and Analysis, Room 1014, Alexandria, VA 22302 ATTN: PRA (0584-0554). Do not return the completed form to this address.

Initial Engagement and Response to the Program
1. How did you find out about the All 4 Kids program?
2. Why did your child care center/school decide to participate in the All 4 Kids at this time?
3. What do you see as the most important messages and goals of the All 4 Kids for the children and families it is trying to reach?
4. How would you say that the messages and goals of All 4 Kids will fit into other aspects of the curriculum you have for the children in the targeted classrooms?
5. What are your initial impressions of the educator who will be teaching the All 4 Kids to the children (and their parents) at your center/school?
Implementation Plans
6. How many classrooms and children are planned to be involved in All 4 Kids at your center/school over the next couple of months?
7. How will the All 4 Kids take home materials be distributed to the parents of the children in these classrooms?
8. What mechanisms are in place to find out if the parents saw or used the materials?
9. How many children are in those classrooms? What age ranges?
10. When will classes for the parents and other caregivers be scheduled at your center?
11. Why was this time period selected?
12. What have or are you planning to do to invite and encourage parents or other caregivers to participate in these classes or other parent-focused activities of All 4 Kids?
Implementation Challenges and Solutions
13. What do you see as the logistical challenges that your teachers or you as the principal/director may face in fitting All 4 Kids into the daily schedule and activities that are already going on at the center/school for the children?
14. In addition to the in-classroom logistical issues we discussed earlier, do you anticipate any other challenges or issues that in implementing the All 4 Kids as planned?

15. If any unanticipated challenges arise during the next couple of months while the intervention is going on, how do you think they can be addressed?
Planning April and May tasks
16. We will be coming back to visit this head Start Center in April and May. Specifically we will come to see the All 4 Kids program in the classrooms in April and run parent group discussions in May. I wanted to run some dates by you. How would April _______ work for the center?
• In May I will be conducting group discussions with the parents whose children were part of the All 4 kids program. Do the following dates for you? May 4-7th?
I know it is a long ways away in May- but it would be good to talk briefly about the Parent group discussions in May. I will lead the group discussion and we will ask questions about how they liked the All 4 Kids program. The parents will get $50 for participating. We would also like to provide child care for the focus group and would pay for 2 staff to do so. Would that work?
Suitable Space for focus group: Can you tell me what sort of space you have at the center for a group discussion and child care? Door? Private? Chairs in a circle?
At the moment I am thinking that the nutrition educators will have parents sign up during the last parent night. But it would be great to have the teachers put up the recruitment flier in the cubby area and be able to answer questions parents may have. Would that be OK with you?
17. Can I please have the name and contact information of the teachers who will have the All 4 Kids program in their classrooms?
That ends my formal interview questions. Do you have any comments or recommendations that you would like to add?
Thank you very much for your time and input on this very important project. As I mentioned earlier, we will follow up with you after the intervention has been implemented to hear your experience and recommendations.


All 4 Kids UNCE ● Program Evaluation
A.7: Discussion Guide for Center Directors [Post-Implementation]


Discussion Guide for Head Start Center Directors
[POST-IMPLEMENTATION]
State: ________________________ Interviewer: ______________ Respondent: ________________________ Date of Interview: ______________ Title: ________________________ Study ID No: ______________ Organization: ________________________ Address: ________________________ ________________________ ________________________ Phone: ________________________ Fax: ________________________ Email: ________________________
Thank you for taking the time for this interview. As I explained during our first meeting, the U.S. Department of Agriculture’s Food and Nutrition Service has contracted with Altarum to conduct a study of the (NAME OF INTERVENTION)that is offering information to children and their families about healthy foods to eat and importance of being active.
This study will provide information on how the All 4 Kids program works from the perspective of the people who planned the program, the program teachers, you and your staff and some of the parents whose children participated. We also will use what you tell us today to provide recommendations for how All 4 Kids can be improved to better work with organizations like yours and the children and families you serve.
OMB No. 0584-0554 Expiration date: 01/31/2103 Public reporting burden for this collection of information is estimated to average 30 minutes per response, including the time for reviewing instructions, searching existing data sources, gathering and maintaining the data needed, and completing and reviewing the collection of information. An agency may not conduct or sponsor, and a person is not required to respond to, a collection of information unless it displays a currently valid OMB control number. Send comments regarding this burden estimate or any other aspect of this collection of information, including suggestions for reducing this burden, to: U.S. Department of Agriculture, Food and Nutrition Services, Office of Research and Analysis, Room 1014, Alexandria, VA 22302 ATTN: PRA (0584-0554*). Do not return the completed form to this address.

Again, everything you say will be kept private. After we conduct several of these interviews, we will write a report for the U.S. Department of Agriculture’s Food and Nutrition Service. Your name will not appear anywhere in the report. Nothing said today will be attached to your name at any point.
Today I have just a few questions about how the All 4 Kids program was carried out at your center, and your views on whether it was effective and how it could be improved.
The estimated amount of time required to complete this interview is 30 minutes. I want to thank you for taking the time today to speak with me.
Before I begin, do you have any questions?
1. First I would like to know how involved you have you been in overseeing the implementation of
All 4 Kids?
REQUIRED PROBES:
a) Have you observed any of the in-classroom activities for the children? b) Have you read any of the All 4 Kids materials that were sent home with children to their
parents? c) Have you observed any of the sessions tailored to engage parents or caregivers in the All 4
Kids program?
2. Now that the intervention is over what are your views on the educator who led the classes?
3. What would you say are the most useful aspects of All 4 Kids overall for the age groups of
children it is targeting?
4. How do you think the various strategies that were used by All 4 Kids to encourage parent
involvement (e.g. take home materials and/or activities targeted to parents and caregivers)
succeeded?
a) What worked well? Why? b) What could be changed or improved to increase parent or other caregiver engagement in
the program’s nutrition education components?
5. What challenges or issues did you face in implementing this program at your center?
a) How did you address these? b) Did you need to communicate with the All 4 Kids program staff to address any of these
issues? If so what did you need to communicate to them about and how were those issues addressed?
6. What could be done to make All 4 Kids more appealing to child care centers like yours?
7. Do you have any other suggestions for ways that this educational program could be improved?

8. Thinking outside of the way All 4 Kids works, do you have any suggestions for other ways that
child care centers like yours can encourage preschool children to eat more fruits and vegetables
at home and encourage their parents to serve more fruits and vegetables?
9. My final and very straightforward question for you today is: would you want the All 4 Kids to
come to your center in the future?
[IF YES] a) Why would you want this program back at your [center or school] again?
[IF NO] b) Why not?
That ends my formal interview questions. Do you have any comments or recommendations that you would like to add?
Thank you very much for your time and input on this very important project. We have a small gift for the child care center classrooms to thank you for your time.


All 4 Kids UNCE ● Program Evaluation
A.8: Discussion Guide for Classroom Teachers [Post-Implementation]


Discussion Guide for Head Start Center Classroom Teachers
[POST-IMPLEMENTATION]
State: ________________________ Interviewer: ______________ Respondent: ________________________ Date of Interview: ______________ Title: ________________________ Study ID No: ______________ Center name: ________________________ Address: ________________________ ________________________ ________________________ Phone: ________________________ Fax: ________________________ Email: ________________________
Thank you for taking the time for this interview. The U.S. Department of Agriculture’s Food and Nutrition Service has contracted with Altarum Institute to conduct a study of the [NAME OF INTERVENTION] that is offering information to children and their families about healthy foods to eat and the importance of being active. Altarum is a health and nutrition policy research and consulting institute and our work focuses on helping to improve the health and nutrition status of children, families, and adults. This study will include not only outcome evaluation information but also process information on how it is being implemented and how you are evaluating the intervention. All of this will be useful to both FNS and to other SNAP-Ed implementing agencies that are planning to evaluate their own SNAP-Ed interventions.
We will be using first names only today. Everything you say will be kept private. After we conduct several of these interviews, we will write a report for the U.S. Department of Agriculture’s Food and
OMB No. 0584-0554 Expiration date: 01/31/2013 Public reporting burden for this collection of information is estimated to average 30 minutes per response, including the time for reviewing instructions, searching existing data sources, gathering and maintaining the data needed, and completing and reviewing the collection of information. An agency may not conduct or sponsor, and a person is not required to respond to, a collection of information unless it displays a currently valid OMB control number. Send comments regarding this burden estimate or any other aspect of this collection of information, including suggestions for reducing this burden, to: U.S. Department of Agriculture, Food and Nutrition Services, Office of Research and Analysis, Room 1014, Alexandria, VA 22302 ATTN: PRA (0584-0554*). Do not return the completed form to this address.
Nutrition Service. Your name will not appear anywhere in the report. Nothing said today will be attached to your name at any point. Nothing that you say will affect your job or be shared with your employers.
The purpose of my interview today is primarily to ask you about your experiences with perceptions of the [NAME OF INTERVENTION] Program at your center. I will use what you tell us today to provide recommendations for how the [NAME OF INTERVENTION] Program could be improved to better serve the children and families in your community and those in other communities like yours.
I expect that our discussion today will take about 30 minutes. Before I begin, do you have any questions?
Background Information
1. First, I would like to confirm that you are a teacher who works in a preschool room at [Insert
Name] child care center?
2. What is your current job title here at the center?
3. How long have you worked in this position at this center?
4. On a scale of 0 to 5, with 1 being totally unimportant and 5 being extremely important, how
important would you say eating more fruits and vegetables is for preschool children and their
families? (RQ #5-5)
a) Why do you think this?
5. On a scale of 0 to 5, with 1 being totally unimportant and 5 being extremely important, how
important would you say choosing 1% or non-fat dairy products is for preschool children and
their families? Why do you think this?
a) Why do you think this?
Exposure and Satisfaction with Intervention Classes Targeted to Child Care Center Staff
Now I would like to ask you about your experience with the classes that [NAME OF INTERVENTION] held here for child care teachers and administrators. I understand that there were [FILL IN NUMBER] of classes/orientation sessions provided for staff at your center by the [NAME OF INTERVENTION] nutritionist.
6. For how many of the [Insert name of program] lessons taught by the program educator
/nutritionist were you able to stay in the classroom?
A. [FOR RESPONDENTS WHO ANSWER ZERO OR LESS THAN THE MAXIMUM NUMBER OF CLASSES
OFFERED] What could have made it easier for you to come to these classes? (e.g., scheduling
issues, length of class, language barriers, etc.)
7. What do you think worked well about these in-classroom activities? (RQ #5-5) (RQ #5-6)
8. What changes or improvements, if any, would you suggest to these in-classroom activities? Why
do you think this? (RQ #5-6)
9. Did you incorporate these messages, sample activities or tools from the [NAME OF
INTERVENTION] in the classroom? (RQ #5-7)
[IF YES]
a) Please describe how you incorporated these in your classroom b) How often would you estimate you use the new information you received from the [Insert
Name of Program] program in your classroom?
□ A couple of times
□ Once every week
□ A few times a week
□ More than a few times a week
10. Did you incorporate any nutrition messages, sample activities or tools from the [Insert name of
program] program in your classroom? (RQ #5-7)
Yes or No
a) If yes- how did you incorporate these messages in your classroom?
11. What aspects of the [NAME OF INTERVENTION] content or design of the messages, sample
activities or tools made it easier for you to incorporate these into your classroom activities? (e.g.,
ease of use in the classroom setting, cultural sensitivity, age appropriateness of the materials for
the target audience) (RQ #6-7)
Lessons Learned and Recommendations
Now, I would like to hear about any recommendations you have for the classes and other supports provided by [NAME OF INTERVENTION] and on any other aspects of program as you observed it being implemented at your center.
A. Classes Taught by Program educator/ RDs for Children
12. Have you stayed in the classroom and observed the activities that the [NAME OF INTERVENTION]
RD/nutritionist conducts with the children?
[IF YES]
a) How many of the RD/nutritionist classes did you observe?
13. What was your role there? (e.g., to deal with emergencies, to assist, to meet mandated staffing
levels in the classroom, to supervise the RD)
14. What do you think worked well about these in-classroom activities? (RQ #6-7)
15. What changes or improvements, if any, would you suggest to these in-classroom activities? (RQ
#6-9)
B. Classes for Parents/Family Members
16. How many of the [Insert name of program] parent/family activities that were held at your center
were you able to attend?
{PLEASE COLLECT CONCRETE NUMBER}
[IF YES]
a) How many of these classes did you observe?
17. What do you think worked well about these activities for parents and families? (RQ #6-7)
18. What do you think did not worked well about these activities for parents and families (RQ #6-9)
19. What changes or improvements would suggest to better reach the parents with the messages of
the [Insert name of Program] Program?
20. Do you have any other recommendations or suggestions for ways that the [Insert Name of
Program] Program could be improved?
C. Take-home Materials (informational materials and recipes) (RQ #6-5)
21. Considering your available time, how much have you been able to look over and read any of the
All 4 Kids take-home materials designed for parents or guardians of the children in your
classroom?
□ Not looked over or read at all
□ Glanced at materials
□ Browsed through most materials
□ Read thoroughly
22. What do you think were the most helpful aspects of these take-home materials?
23. What changes or improvements, if any, would you suggest to the take-home materials?
24. What aspects prevented you from using these tools in your classroom? (e.g., lack of time, lack of
money for supplies, lack of confidence) (RQ #6-9)
25. Do you have suggestions for the take-home materials provided by the program to better
reinforce the program’s nutrition messages for children, families and other caregivers? (RQ #6-5)
26. Do you have any other recommendations or suggestions for ways that the program could be
improved?
27. Do you have any other suggestions for how child care centers like yours can encourage
preschool children to eat more fruits and vegetables at home and encourage their parents to
serve more fruits and vegetables?
That ends my formal interview questions. Do you have any comments or recommendations that you would like to add?
Thank you very much for your time and input on this very important project. We have a gift card to thank you for your time.


All 4 Kids UNCE ● Program Evaluation
A.9: Discussion Guide for Parents [Post-Implementation]


GROUP Discussion Guide for Parents/Caregivers
[POST-IMPLEMENTATION ONLY]
Date of discussion: ______________ Location: ________________________ Study ID No: ______________ Facilitator: ________________________ Note Taker: ______________ Number of participants: ____________ Start Time: ______________ End Time: ______________
Welcome! My name is ______ I am here with my co-worker ______. Thank you for taking the time for this group discussion. The U.S. Department of Agriculture’s Food and Nutrition Service has contracted with Altarum Institute to conduct a study of the [NAME OF INTERVENTION] that is offering information to children and their families about healthy foods to eat and the importance of being active. Altarum is a health and nutrition policy research consulting institute and our work focuses on helping improve the health and nutrition status of children, families, and adults.
This study will provide information on how the program in which your children participates works from the perspective of: the people who planned the program, the teachers, you and your child. The purpose of today’s group is to hear from you—about you and your child’s experiences and satisfaction with this program that recently took place at your child’s day care/school. We also will use what you tell us today provide recommendations for how [NAME OF INTERVENTION] can be improved to better serve the children and families in your community and those in other communities like yours.
We will be using first names only today. Everything you say will be kept private. After we conduct several of these group discussions, we will write a report for the U.S. Department of Agriculture’s Food and Nutrition Service. Your name will not appear anywhere in the report. Nothing said today will be attached to your name at any point. Nothing that you say will affect the services you receive through any of the programs we talk about today.
OMB No. 0584-0554 Expiration date: 01/31/2013 Public reporting burden for this collection of information is estimated to average 2 hours per response, including the time for reviewing instructions, searching existing data sources, gathering and maintaining the data needed, and completing and reviewing the collection of information. An agency may not conduct or sponsor, and a person is not required to respond to, a collection of information unless it displays a currently valid OMB control number. Send comments regarding this burden estimate or any other aspect of this collection of information, including suggestions for reducing this burden, to: U.S. Department of Agriculture, Food and Nutrition Services, Office of Research and Analysis, Room 1014, Alexandria, VA 22302 ATTN: PRA (0584-0554*). Do not return the completed form to this address.

Before we begin, I would like to review a few details about our discussion:
• First, your participation in today’s discussion is voluntary. You are free to leave at any time.
• There are no right or wrong answers. Remember that we don’t work for the child care center or with the educators, so please feel free to say whatever you think.
• Also, it is okay to have ideas or opinions that are different from each other. We want to hear everyone’s point of view.
It would be helpful to have only one person talking at a time. We are tape recording this session so that we don’t miss anything important. If two people talk at once, we can’t understand what anyone is saying. We may remind you of this during the group discussion.
• We would like everyone to participate. But, you each don’t have to answer every question. You don’t have to raise your hand either. If, however, some of you are shy or we really want to know what you think about a particular question, we may ask you what you think.
• We have a lot to talk about today. So, don’t be surprised if at some point we interrupt the discussion and move to another topic. But, don’t let us cut you off. If there is something important you want to say, let us know and you can add your thoughts before we change subjects.
• Finally, we just want to emphasize what we said earlier: we will be using first names only. Everything you say is private. What you say today will not be attached to your name at any point. Nothing that you say will affect the child care you receive at this site or any other services you receive from this or any other program.
The group will last no more than 2 hours. You will not get out any later than _______. We will not be taking a formal break, but if you need to leave for a restroom break, the bathrooms are _____________. And feel free to get snacks.
For this session, I will read a question and then listen to your responses. I also may ask follow up questions to get some more detail.
Let’s get started! I can’t wait to hear what you think of the [NAME OF INTERVENTION].
Do you have any questions before we begin?
Introductions/Icebreaker
Let’s go around the room for this one: Please introduce yourself, tell us how long you have been coming to this child care center with your child, and name one fun activity you like doing with your preschooler. [MODERATOR NOTE: it is helpful to go in order of how the group is sitting. This will allow the

transcriptionist to label responses by person. Also for note taking you can then label person1, person2, person 3 etc- to be able to write comments]
Exposure and Accessibility of SNAP-Ed Intervention for Parents/Caregivers
Please raise your hand if you know that your child has been participating in a program at this school (or child care center) where they learn about what healthy foods and being active. [ASK FOLLOWING QUESTIONS FOR THOSE WHO RAISE HAND]
1. What did your children tell you about what they did in these classes or sessions?
PROBES: Food they tried? Activities they did? Games they played? What they learned?
2. Did you see any take home materials on food and physical activity recently provided for you by
the [NAME OF INTERVENTION]? [MODERATOR SHOULD PROMPT RESPONSE BY SHOWING SOME
SAMPLE TAKE-HOME MATERIALS USED IN THE INTERVENTION]
3. What were the most helpful aspects of these take home materials? (RQ 6-4)
4. Did you hear about the parent classes/family activity nights that were offered at [NAME OF CHILD
CARE CENTER]?
a) If yes, how did you hear about them?
5. Raise your hand if you went to at least one class?
a) If you raised your hand: what made you decide to go? b) If you didn’t raise your hand: what were the reasons that you didn’t go? (e.g., barriers
related to timing and location, other barriers related to accessibility, level or interest or perceived need)
6. Please think for a moment about what could be done to encourage more people like you to
participate in these classes/family nights. I will hand out a pencil and paper if you want to write
down your ideas before you answer out loud. (RQ 6-1)
[AFTER ABOUT 2 MINUTES TAKE ANSWERS VIA ROUND ROBIN QUESTIONING]
7. If you went to any of these classes did you receive any handouts? (RQ 6-4)
a) Which handouts were most helpful and why? b) Which handouts were not helpful and why?
8. Do you think the educator who led the classes provided information in a way that was easy for
the people in the class to understand? (RQ 6-8)

9. Would you say that the educator who led the classes was a good teacher for you?
10. If yes, what made her a good teacher? If not, why not?
Satisfaction/Likes and Dislikes with Intervention
11. Tell me about the parts of the program overall—including the classes for your children, the take
home materials, and any classes you may have participated in, that you liked the best and why
you liked these parts? (RQ 6-7)
12. Now, I would like to know what parts of the program you liked least and why? (RQ 6-8) (RQ 6-9)
13. What parts of the program do you think your child liked the best and why? (RQ 6-8)
14. What parts of the program did your child like the least and why? (RQ 6-8) (RQ 6-9)
Perceptions of Goals and Relevancy of Intervention
We are interested in hearing more about what you thought about the purpose of the classes, whether they helped you and provided useful information to you.
15. What do you think the [NAME OF INTERVENTION] was trying to teach you and your child? (RQ 6-
2)
16. How useful was the information the program offered for parents like you with young children?
(RQ 6-3)
17. How well did the program suggestions and information fit with the ways that people of your
racial or ethnic background live your life? (RQ 6-5)
18. How well did the program suggestions and information fit with the challenges faced by people
who do not have a lot of money? (RQ 6-3)
Intervention Impacts
These next few questions are about how you think [NAME OF INTERVENTION] classes and materials may have helped you learn new information or other ways it may have changed things for you or your children.
19. What are the most important things that your child learned from this program? (RQ 6-6)
20. What are the most important things that you learned from this program? (RQ 6-6)

21. Now I would like to ask you a question that you probably need more time to think about: What
are the most significant change or changes that have taken place in your household because of
this program? (RQ 6-6)
I am passing out pieces of paper again if you want to write down your response.
[AFTER ABOUT 2 MINUTES TAKE ANSWERS VIA ROUND ROBIN QUESTIONING] OPTIONAL PROBES AS NEEDED:
• Changes in food parents serve to their children? • Changes in the food children select? • Changes in physical activity at home?
Factors Affecting Fruit and Vegetable Availability at Home and Ways of Addressing these Barriers
Now I would like to take a few moments to ask you about the difficulties that parents who live in your neighborhood might face in trying to buy, store, and prepare fruits and vegetables for your preschool child.
22. What makes it harder for you or other parents like you to buy and keep fruits and vegetables at
home? (e.g., cost, access, and storage) (RQ 5-2)
23. What makes it harder for you or other parents of young children like you to prepare and serve
fruits and vegetables to your young children? (RQ 5-2)
24. Did the information or take home materials provided to you by [NAME OF INTERVENTION] help
you to address any of these difficulties or barriers?
a) For those of you that said “yes”, how was the information or materials helpful?
25. For those who said “no”, what could have been done to make the information or take home
materials more helpful for parents?
Recommendations
26. Would you recommend this program to friends?
[IF YES] a) Why?
[IF NO] b) Why not?

27. If you could change anything about the classes or take home materials or other aspects of the
(NAME OF INTERVENTION) program – what would it be?
28. Is there anything we haven’t asked that you would like to tell us about your experience with and
opinions of the (NAME OF INTERVENTION) program?
29. Before we close, I would like you to help us by giving us your ideas for other ways that child care
centers/schools could encourage children to eat more fruits and vegetables and encourage their
parents to serve fruits and vegetables more often.
Thank you very much for participating in this discussion group today. We have learned a lot from your experiences and recommendations.
In appreciation of your time and trouble today, we have gift cards for each of you today. Before you leave, please take one of these and sign the form indicating you have received one of these cards.

All 4 Kids UNCE ● Program Evaluation
A.10: Spanish Discussion Guide for Parents [Post-Implementation]


Guía de Discusión de GRUPO para Padres/Cuidadores
[POST-IMPLEMENTACIÓN SOLAMENTE]
Fecha de Discusión: ___________________ Ubicación: ________________________ No ID Estudio: __________________ Facilitador: ________________________ Tomador de Notas: ______________ Número de participantes: ____________ Hora Inicio: ______________________ Hora Fin: ____________________
¡Bienvenidos! Mi nombre es _________, estoy aquí con mi compañero/a de trabajo . Gracias por tomarse el tiempo para participar en este grupo de discusión. El Departamento de Agricultura de los Estados Unidos y el Servicio de Comida y Nutrición han contratado al Instituto Altarum para llevar a cabo un estudio de [NOMBRE DE INTERVENCIÓN] que está ofreciendo información para niños y sus familias acerca de alimentos saludables para comer y la importancia de ser activo. Altarum es un instituto de consulta e investigación de políticas de salud y nutrición y nuestro trabajo se enfoca en ayudar a mejorar la situación de salud y nutrición de niños, familias y adultos.
Este estudio proporcionará información acerca de cómo el programa en el cual sus niños participan, trabaja desde la perspectiva de: la gente que diseño el programa, los maestros, ustedes y sus niños. El propósito del grupo de hoy es escucharlos a ustedes – acerca de las experiencias y satisfacción de ustedes y de sus hijos con este programa que recientemente tuvo verificativo en la guardería/escuela de sus hijos. También usaremos lo que ustedes nos digan hoy para proporcionar recomendaciones acerca de cómo [NOMBRE DE INTERVENCIÓN] puede ser mejorado para mejor servir a los niños y familias en su comunidades y aquellos en otras comunidades como la suya.
Hoy usaremos nombres solamente. Todo lo que ustedes digan será mantenido privado. Después de que llevemos a cabo varias de estas discusiones de grupo, nosotros vamos a escribir un reporte para el Servicio de Alimentos y Nutrición del Departamento de Agricultura de los EEUU. Sus nombres no
OMB No. 0584-0554 Fecha de expiración: 31/01/2013 La carga de reportar públicamente la recolección de información se estima que promedia 2 horas por respuesta, incluyendo el tiempo de revisar instrucciones, buscar fuentes de datos existentes, recolectando y manteniendo los datos necesarios, y contemplando y revisando la recolección de información. Una agencia no puede conducir o patrocinar, y una persona no está obligada a responder a, una recolección de información a menos que utilice un número de control OMB valido. Enviar comentarios respecto de este estimado de carga o cualquier otro aspecto de esta recolección de información, incluyendo sugerencias para reducir este carga, a: U.S. Department of Agriculture, Food and Nutrition Services, Office of Research and Analysis, Room 1014, Alexandria, VA 22302 ATTN: PRA (0584-0554*). No regrese la información completa a esta dirección.

aparecerán en ninguna parte del reporte. Nada de lo dicho hoy será adjuntando a sus nombres en momento alguno. Nada de lo que digan hoy afectará los servicios que ustedes reciben a través de cualquiera de los programas de los que hablemos hoy.
Antes de comenzar, me gustaría revisar algunos cuantos detalles acerca de nuestra discusión:
• Primero, su participación en la discusión del día de hoy es voluntaria. Ustedes son libres de irse en cualquier momento.
• No hay respuestas correctas o incorrectas. Recuerden que no trabajamos en la guardería o con los educadores, así que por favor siéntanse libres de decir lo que sea que piensen.
• También, está bien tener ideas u opiniones que son diferentes de uno a otro. Queremos escuchar el punto de vista de todos.
Sería de enorme ayuda que sólo una persona hable a la vez. Estamos grabando esta sesión para que no se nos pase algo importante. Si dos personas hablan a la vez, no podemos entender lo que cualquiera está diciendo. Es posible que les recordemos esto durante la discusión de grupo.
• Nos gustaría que todos participes. Pero, cada uno de ustedes no tiene de contestar cada pregunta. Tampoco tienen que levantar su mano. Si, no obstante, algunos de ustedes son penosos o realmente queremos saber lo que ustedes piensan acerca de una pregunta en particular, les podremos preguntar lo que piensan.
• Tenemos mucho de qué hablar el día de hoy. Así que, no se sorprenda si en algún momento interrumpimos la discusión y cambiamos de tema. Pero, no nos dejen cortarlos. Si hay algo importante que ustedes quieran decir, háganoslo saber y ustedes pueden compartir sus pensamientos antes de que cambiemos de tema.
• Finalmente, sólo queremos enfatizar lo que dijimos antes: estaremos usando nombre (no apellidos) solamente. Todo lo que digan es privado. Lo que ustedes digan hoy no será adjuntado a sus nombres en ningún momento. Nada de lo que digan afectará los servicios de guardería que ustedes reciben en este sitio o en cualesquier otros servicios que ustedes reciban de este o cualquier otro programa.
El grupo no durará más de 2 horas. Ustedes no saldrán más tarde de _______. No vamos a tomar un descanso formal, pero si necesitan ir a los baños, estos se encuentran en _____________. Y por favor siéntanse con la confianza de tomar los refrigerios.
Para esta sesión, voy a leer una pregunta y después escuchar sus respuestas. También, puedo hacerles preguntas de seguimiento para tener un poco más detalle.
¡Vamos a comenzar! No puede esperar para escuchar lo que piensa de [NOMBRE DE INTERVENCIÓN].
¿Tienen cualquier pregunta antes de que comencemos?
Presentaciones / Rompehielos
Demos la vuelta al salón para esto: Por favor cada uno de ustedes preséntense, díganos cuanto tiempo han venido a esta guardería con sus niño(a), y mencionen una actividad divertida que a ustedes les gusta realizar con su niño(a) pre-escolar. [NOTA AL MODERADOR: Es de ayuda ir en el orden de cómo se está sentado el grupo. Esto le permitirá al transcriptor etiquetar las respuestas por persona. También la toma de notas puede etiquetar como persona 1, persona 2, persona 3, etc.- para poder escribir los comentarios]
Exposición y Accesibilidad de la Intervención SNAP-Ed para Padres/Cuidadores
Por favor alcen su mano si saben que su niño(a) ha estado participando en un programa en esta escuela (o guardería) donde ellos aprenden acerca de alimentos saludables y a ser activos. [PREGUNTAR LAS SIGUIENTES PREGUNTAS PARA AQUELLOS QUE ALZARON LA MANO]
1. ¿Qué es lo que sus niños les dijeron acerca de lo que ellos hicieron en esas clases o sesiones?
INDAGAR: ¿Comida que probaron? ¿Actividades que ellos realizaron? ¿Juegos que jugaron? ¿Qué
aprendieron?
2. ¿Ustedes vieron algunos materiales para llevar a casa acerca de comida y actividad física
proporcionada recientemente a ustedes por [NOMBRE DE INTERVENCIÓN? [EL MODERADOR
DEBE PROVOCAR RESPUESTA MOSTRANDO ALGUNAS MUESTRAS DE MATERIALES PARA LLEVAR
A CASA USADOS EN LA INTERVENCIÓN ]
3. ¿Cuáles fueron los aspectos de mayor ayuda en estos materiales para llevar a casa? (RQ 6-4)
4. ¿Ustedes escucharon acerca de las clases para padres/noches de actividad familiar que fueron
ofrecidas en [NOMBRE DE GUARDERÍA]?
a) Si la respuesta es sí, ¿cómo supieron de ellas?
5. Alcen su mano si fueron por lo menos a una clase
a) Si alzaron su mano: ¿qué les hizo tomar la decisión de asistir? b) Si no alzaron su mano: ¿cuáles fueron las razones para no asistir? (por ejemplo, barreras
relacionadas con la hora y ubicación, otras barreras relacionadas con la accesibilidad, nivel o interés o necesidad percibida)

6. Por favor piense por un momento acerca de lo que pudiera hacerse para alentar a un mayor
número de personas como ustedes para participar en estas clases/noches familiares. Les daré
lápiz y papel si quieren escribir sus ideas antes de decirlas en voz alta. (RQ 6-1)
[DESPUÉS DE ALREDEDOR DE 2 MINUTOS TOMAR RESPUESTA AL PREGUNTAR A TODOS EN ORDEN (ROUND ROBIN)]
7. Si asistieron a cualquier de estas clases, ¿recibieron algún material? (RQ 6-4)
a) ¿Cuáles folletos fueron los de mayor ayuda y por qué? b) ¿Qué folletos no fueron de ayuda y por qué?
8. ¿Piensan ustedes que la educadora que encabezó las clases proporcionó la información de una
manera que era fácil de entender para la personas en la clase? (RQ 6-8)
9. ¿Dirían usted que el educador que encabezó las clases fue un buen maestro para ustedes?
10. Si la respuesta fue afirmativa, ¿qué es lo que la hizo una buena maestra? En caso negativo, ¿por
qué no?
Satisfacción/Gustos y Disgustos con Intervención
11. Háblenme acerca de las partes del programa en general – incluyendo las clases para sus niños, los
materiales para llevar a casa, y cualesquier clases en las cuales han participado, que más les
gustaron y del por qué les gustaron esas partes (RQ 6-7)
12. Ahora, me gustaría saber ¿qué partes del programa fueron las que menos les gustaron y por qué?
(RQ 6-8) (RQ 6-9)
13. ¿Qué partes del programa piensan que a sus niños más les gustaron y por qué? (RQ 6-8)
14. ¿Qué partes del programa piensan que a sus niños menos les gustaron y por qué? (RQ 6-8) (RQ 6-
9)
Percepciones de Objetivos y Relevancia de Información
Estamos interesados en escuchar más acerca de lo que ustedes pensaron acerca del propósito de las clases, si ellas les ayudaron y les proporcionaron a ustedes información útil.
15. ¿Qué piensa que [NOMBRE DE INTERVENCIÓN] estaba tratando de enseñarles a ustedes y a sus
niños? (RQ 6-2)
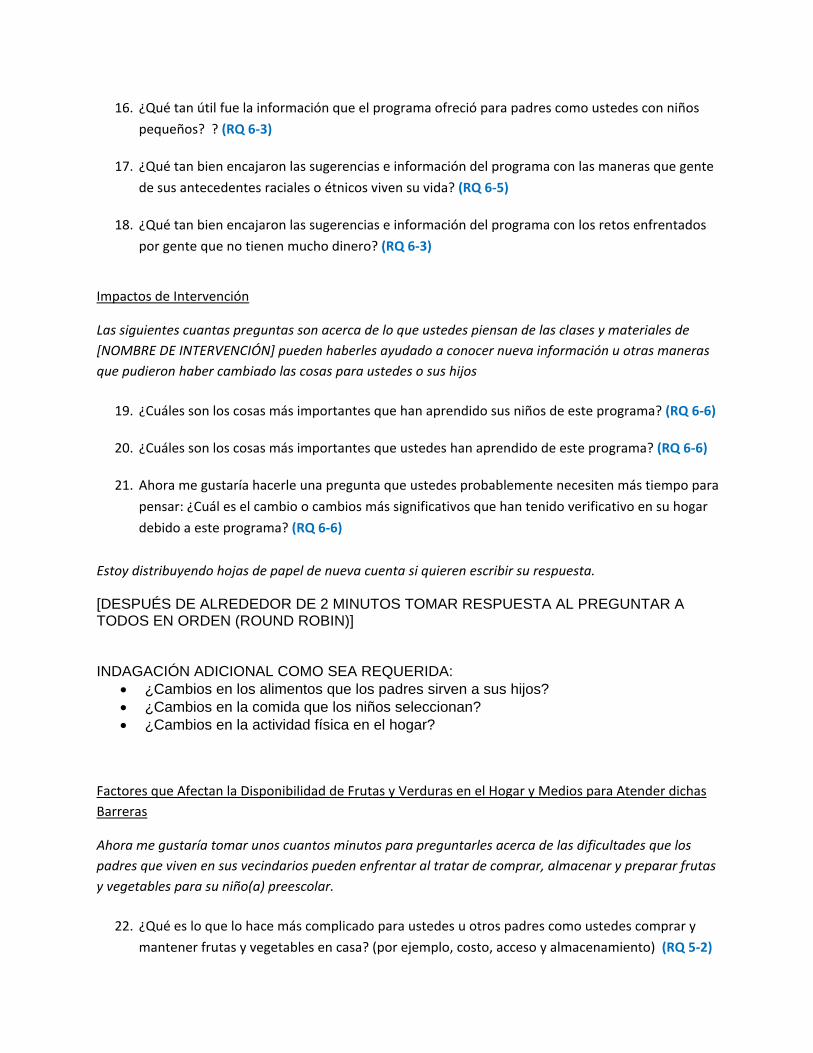
16. ¿Qué tan útil fue la información que el programa ofreció para padres como ustedes con niños
pequeños? ? (RQ 6-3)
17. ¿Qué tan bien encajaron las sugerencias e información del programa con las maneras que gente
de sus antecedentes raciales o étnicos viven su vida? (RQ 6-5)
18. ¿Qué tan bien encajaron las sugerencias e información del programa con los retos enfrentados
por gente que no tienen mucho dinero? (RQ 6-3)
Impactos de Intervención
Las siguientes cuantas preguntas son acerca de lo que ustedes piensan de las clases y materiales de [NOMBRE DE INTERVENCIÓN] pueden haberles ayudado a conocer nueva información u otras maneras que pudieron haber cambiado las cosas para ustedes o sus hijos
19. ¿Cuáles son los cosas más importantes que han aprendido sus niños de este programa? (RQ 6-6)
20. ¿Cuáles son los cosas más importantes que ustedes han aprendido de este programa? (RQ 6-6)
21. Ahora me gustaría hacerle una pregunta que ustedes probablemente necesiten más tiempo para
pensar: ¿Cuál es el cambio o cambios más significativos que han tenido verificativo en su hogar
debido a este programa? (RQ 6-6)
Estoy distribuyendo hojas de papel de nueva cuenta si quieren escribir su respuesta.
[DESPUÉS DE ALREDEDOR DE 2 MINUTOS TOMAR RESPUESTA AL PREGUNTAR A TODOS EN ORDEN (ROUND ROBIN)] INDAGACIÓN ADICIONAL COMO SEA REQUERIDA:
• ¿Cambios en los alimentos que los padres sirven a sus hijos? • ¿Cambios en la comida que los niños seleccionan? • ¿Cambios en la actividad física en el hogar?
Factores que Afectan la Disponibilidad de Frutas y Verduras en el Hogar y Medios para Atender dichas Barreras
Ahora me gustaría tomar unos cuantos minutos para preguntarles acerca de las dificultades que los padres que viven en sus vecindarios pueden enfrentar al tratar de comprar, almacenar y preparar frutas y vegetables para su niño(a) preescolar.
22. ¿Qué es lo que lo hace más complicado para ustedes u otros padres como ustedes comprar y
mantener frutas y vegetables en casa? (por ejemplo, costo, acceso y almacenamiento) (RQ 5-2)

23. ¿Qué es lo que lo hace más complicado para ustedes u otros padres de niños pequeños como
ustedes preparar y servir frutas y vegetales para sus niños pequeños? (RQ 5-2)
24. ¿La información o materiales para llevar proporcionados a ustedes por [NOMBRE DE
INTERVENCIÓN] les ayudó a atender cualquiera de estas dificultades o barreras?
c) Para aquellos que contestaron “sí”, ¿cómo fueron la información o materiales de ayuda?
25. Para aquellos que dijeron “no”, ¿qué pudo haberse hecho para hacer la información o materiales
para llevar de mayor ayuda para padres?
Recomendaciones
26. ¿Recomendarían ustedes este programa a amigos?
[EN CASO DE “SÍ”] a) ¿Por qué?
[EN CASO DE “NO”] b) ¿Por qué no?
27. Si usted pudiera cambiar cualquier cosa acerca de clases o materiales para llevar a casa u otros
aspectos del programa (NOMBRE DE INTERVENCIÓN)– ¿qué sería?
28. ¿Hay algo que no les haya preguntando que ustedes quisieran decirnos acerca de su experiencia
con y opiniones acerca del programa (NOMBRE DE INTERVENCIÓN)?
29. Antes de que terminemos, me gustaría que nos ayudaran dándonos sus ideas para otras maneras
en las que guarderías/escuelas pueden alentar a niños a comer más frutas y vegetales y alentar a
sus padres a servir más frutas y vegetables más seguido.
Muchas gracias por participar en este grupo de discusión el día de hoy. Hemos aprendido mucho de sus experiencias y recomendaciones.
En agradecimiento por su tiempo y por tomarse la molestia el día de hoy, tenemos tarjetas de regalo para cada uno de ustedes. Antes de que se vayan, por favor tomen una de éstas y firmen el formato indicando que han recibido una de estas tarjetas.

All 4 Kids UNCE ● Program Evaluation
A.11: Project Resource and Expense Tracking Form


Project Resource and Expense Tracking Form for
Implementation of All 4 Kids Program
This data collection form will be used to summarize information about ACTUAL resources used for and expenses related to the implementation of your SNAP-Ed intervention.
Implementation In the following tables, please provide the requested information as it relates to the implementation of your project. Please do not include resources or expenses related to your planning and design or evaluation.
1.1 Summarize staff costs (human capital) for the implementation of your SNAP-Ed project
a) At the administrative, coordination, oversight level, trainer level
Title of position Brief description
of responsibilities
FTEs Average salary
for this position Salary range for
this position
b) At the nutrition educator level (per intervention site), IF APPLICABLE
Title of position Brief description
of responsibilities
FTEs Average salary
for this position Salary range for
this position

c) IT/Technical Staff, IF APPLICABLE
Title of position Brief description
of responsibilities
FTEs Average salary
for this position Salary range for
this position
d) Other
Title of position Brief description
of responsibilities
FTEs Average salary
for this position Salary range for
this position
1.2 Describe the ACTUAL costs other than staff costs (physical capital) required to implement project
a) Space b) Audio/visual c) Computer/software d) Other

1.3 Please provide the following information for ACTUAL expenditures related to the implementation of your SNAP-Ed intervention only (NOT FOR EVALUATION)
Expenses (a) Non-Federal Public Funds
(b) Non-Federal,
Non-cash
(c) Total Non-Federal Funds (a+b)
(d) Federal Funds
Total Funds (c+d)
Cash In-kind
Donations
1. Salary/benefits
2. Contracts/grants agreements
3. Non-capital equipment/ supplies
4. Materials
5. Travel
6. Administrative
7. Building/space
8. Maintenance
9. Equipment and other capital expenditures
10. TOTAL Direct Costs
11. Indirect costs
12. TOTAL Costs


All 4 Kids UNCE ● Program Evaluation
A.12: SNAP-Ed 1Nutrition Education Observation Form


Snap-Ed 1 Nutrition Education Observation Form 1
SNAP-Ed 1 Nutrition Education Observation Form
The purpose of this observation tool is to describe the intervention as it is being implemented and inform the process evaluation of this project. This observation is not intended to evaluate the teaching abilities of the instructor. Name of observer: Date of class observed: Name of intervention: Name of instructor: Name and type of site:
PART A: GENERAL PLAN BACKGROUND (to be filled out prior to class) Name of lesson to be taught: Lesson topic(s): Intended Lesson Objective(s): Target audience(s):
Children Yes No Grade/Age range of children in class: Parents/Guardians Yes No
PART B: CLASS OBSERVATION
1. Length of Class Class Start Time: Class End Time:
2. Reach
Number of participants: How many of the participants were exposed to the complete class (e.g. most relevant for NY parent classes where some may arrive or leave late):

Snap-Ed 1 Nutrition Education Observation Form 2
3. Description of the Setting
• Physical Location In the children’s regular classroom Indoors, in a general purpose room in the building (describe briefly) Indoors, in an informal area of the building not structured for group classes
(describe briefly-- e.g. in the hallway, in the front waiting area, etc.) In an outdoor area
• Adequacy of space Space is very ample for the number of participants and activities planned Space is sufficient, but somewhat limited for the number of participants and
activities planned Space is insufficient for the number of participants and activities planned
• Any other facilitators or barriers related to classroom setting: Facilitators to teaching the lesson, carrying out planned activities and engaging participants: Barriers to teaching the lesson, carrying out planned activities and engaging participants:
• Other observations about adequacy of space or class environment/setting:
4. Teaching Methods Teaching Techniques Used: Check the teaching techniques used in teaching the lesson.
Lecture/verbal presentation Educator engages the children in discussions Story reading Food rreparation demonstration Food tasting Movement activity Student performance (e.g. dance) Small group discussions or activities (likely only relevant with large parent classes) Other
• Types of Teaching aids used: Check the types of teaching aids used in the lesson. Food models Posters Music DVD or Video Handouts Foods for demonstration purposes and tasting Other

Snap-Ed 1 Nutrition Education Observation Form 3
• Materials Distributed: Check the materials that were distributed during the lesson. Recipes Nutrition education newsletters Handouts: Other:
5. Student Engagement in the Lesson
Describe the level of engagement of students in the lesson as presented. For example: did it appear the students were engaged in the lesson; was the lesson age appropriate; was the literacy level appropriate for this grade level; was it culturally appropriate; did it appear that this was new information for the students.
PART C. LESSON WAS TAUGHT AS PLANNED IN PROJECT Overall, did the instructor follow the curriculum for this lesson as developed? If not, how was it different and what are the apparent reasons for this deviation?
Observer Comments/Notes:
PART D. ENVIRONMENTAL REINFORCEMENTS/INFLUENCES (relevant to classes for children -not necessary to complete for the parent classes) 1. Teacher Involvement
What role (s) did the school/childcare teacher(s) play during the intervention class? Was not in the classroom during the lesson Silent observer who did not participate or support the educator during the lesson , Assisted the nutrition educator in handing out materials Assisted the nutrition educator in activities beyond handing out materials Additional or other roles: What other role, if any, does the classroom teacher play in
supporting the intervention messages?
2. Availability of Fruits and Vegetables At the intervention sites Request and review the current weekly or cycle menu to see the extent and variation in fruits and vegetables offered at the school/center for meals and snacks. Below, provide a general description of the number of the fruits and vegetables on menu each day and the variety of fruits and vegetables offered on menu. Attach a copy of the menu.
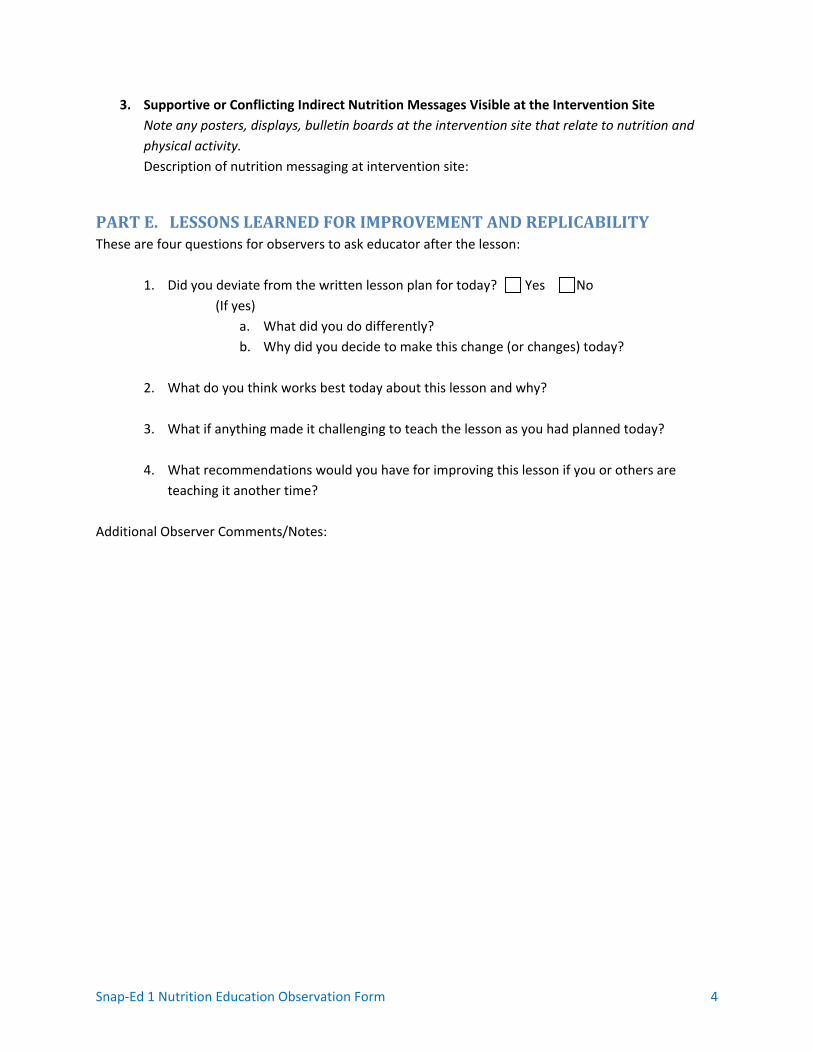
Snap-Ed 1 Nutrition Education Observation Form 4
3. Supportive or Conflicting Indirect Nutrition Messages Visible at the Intervention Site Note any posters, displays, bulletin boards at the intervention site that relate to nutrition and physical activity. Description of nutrition messaging at intervention site:
PART E. LESSONS LEARNED FOR IMPROVEMENT AND REPLICABILITY These are four questions for observers to ask educator after the lesson:
1. Did you deviate from the written lesson plan for today? Yes No (If yes)
a. What did you do differently? b. Why did you decide to make this change (or changes) today?
2. What do you think works best today about this lesson and why?
3. What if anything made it challenging to teach the lesson as you had planned today? 4. What recommendations would you have for improving this lesson if you or others are
teaching it another time? Additional Observer Comments/Notes:

Appendix B Process Evaluation Data and Supplemental Information


All 4 Kids UNCE ● Program Evaluation
List of Contents B.1: Program Pilot Results (Spring 2008)
B.2: Program Take Home Materials
B.3: Program Resources by Lesson
B.4: Program Classroom Materials
B.5: Project Resource and Expense Tracking Form
B.6: Parent Follow-up Survey Descriptive Tables for Process Questions
B.7: Demographic Characteristics of Focus Group Participants


All 4 Kids UNCE ● Program Evaluation
B.1: Program Pilot Results (Spring 2008)


Results for Spring 2008 All 4 Kids Program Pilot
Food Type
Changes in Percentage of Caregivers Reporting their Children “Often” Consume Fruits and
Vegetables Fresh Fruit Increased from 83.3% to 91.7% Canned Fruit Increased from 66.7% to 70% Fresh Vegetables Increased from 62.5% to 91.7% Canned Vegetables Increased from 75.0% to 87.5%
Source: University of Nevada, Cooperative Extension


All 4 Kids UNCE ● Program Evaluation
B.2: Program Take Home Materials


1
All 4 Kids Family Pack Materials
Week, Lessons Materials Sent Home Items Taken Home
How Materials Reinforce Weekly Lessons
Week 1, Lessons 1-3
• Rainbow ribbon and instructions (need to be updated with new logo)
Rainbow ribbons are used to promote physical activity, particularly cardiovascular fitness. Instructions are provided to give caregivers ideas of how the rainbow ribbon can be used at home. Examples include: wave the ribbon up high, wave it behind you, march and wave the ribbon, etc. The idea is to incorporate whole body movements in a way that is fun for the child.
• Family Pack Children are provided with an insulated lunch bag that we refer to as the “All 4 Kids Family Pack.” This is what they will use to transport their All 4 Kids items home. Children are instructed to take it home at the end of the week with the item in it, and bring it back empty at the beginning of the next week so they can take home the next item. We write each child’s name on the bottom of the bag to identify which bag belongs to each child.
Week 2, Lessons 4-6
• Count my Moves cards, dice and directions
This is an activity that the children participate in during the All 4 Kids program, and the dice provide a way for them to do it at home as well. One die contains movements that the children have learned during All 4 Kids (i.e. hop on one foot, spin around, etc.), and the other has numbers on it, which tells the child how many times (s)he is to perform the movement shown on the other die. This provides the child with additional opportunities to practice the new movements at home.
Week 3, Lessons 7-8
• TV Moves Me coloring book
• TV Moves Me Handout (pages 23-25 of book)
TV Moves Me is a book that the children read in All 4 Kids. It promotes physical activity by encouraging children and their families to be physically active during the commercial breaks of television programs. The coloring book is taken home so caregivers can read it with their children, and the children have an opportunity to color it how they wish.
Week 4, Lessons 9-11
• Go and Whoa Snack Cards and directions
These are given to the children to reinforce the concept of “Go” and “Whoa” snacks that is emphasized throughout All 4 Kids. Some of these foods may be new to the children, so it provides additional opportunities to learn which foods belong to each category. The cards are small and portable, so they can be used at home or outside the home. For example, they could be used at a grocery store to pick out healthy snacks for the week.
Week 5, Lessons 12-14
• Tummy Talks coloring book • Phrases that Help and
Hinder handout
One of the main messages promoted in All 4 Kids is to “Eat when you’re hungry, stop when you’re full.” The Hungry Meter provides a pictorial representation of this concept that enables children to communicate to their caregivers what stage of “hunger” or “fullness” they are. This can be used at mealtimes to ensure that children get enough to eat without overeating.
Week 6, Lessons 15-16
• Hungry Meter and directions Scarves are used as a prop by the children each time they dance to “Ven Conmigo.” Children are encouraged to move the scarves in various directions and at various speeds throughout the dance in order to be active with their whole body.

2
Week 7, Lessons 17-19
• All 4 Kids Memory game and directions
Children are given small cards to take home that have pictures of characters from the TV Moves Me book. These can be used to play “Memory,” and it is an activity in which caregivers can be involved.
Week 8, Lessons 20-22
• My Family is Unique Booklet
Throughout Unit 3, children decorate a shape with their picture on it that is representative of their body type (i.e. circle, rectangle, or diamond). They color it, add pictures of their favorite hobbies, ways to be active, and snack foods in order to make it their own. All of these activities reinforce the concept that each child is unique, which is the theme of Unit 3. Children get to take these shapes home at the end of the All 4 Kids program.
Week 9, Lessons 23-24
• Medals • Certificates • Family Pack
Each child receives a medal and a certificate of completion for participating in the All 4 Kids program. In addition, the family pack is now theirs to keep.

All 4 Kids UNCE ● Program Evaluation
B.3: Program Resources by Lesson


All 4 Kids Resources by Lesson
Lesson Number/Name Resources
Lesson 1 Energy!
• Audio Player • All 4 Kids Audio CD • Energy pictures (1 set) • Promise poster (Decorate a poster board and
include the words “I promise to be Healthy, Happy, Active and Fit”)
• Crayons/markers
Lesson 2 Let’s Boogie!
• Audio Player • All 4 Kids Audio CD • Boogie Oogie Slide Instrument pictures • Energy pictures (swimming and dancing) • Painter’s tape – 1 roll
Lesson 3 Heart Smart
• Audio Player • All 4 Kids Audio CD • Rainbow Ribbons (1 per child and teacher) • Painter’s tape (optional)
Lesson 4 The Beats of My Heart
• Audio Player • All 4 Kids Audio CD • Foam Heart Toys (one per child and teacher) • Energy pictures ( 1 set) • Painter’s tape (optional)
Lesson 5 Muscles in Motion
• Audio Player • All 4 Kids Audio CD • Jumbo Dice (2) • Count my Moves pictures • Painter’s tape (optional)
Lesson 6 Bones, Bones, Bones
• Audio Player • All 4 Kids Audio CD • Skeleton Floor Puzzle • Painter’s tape (optional)
Lesson 7 TV Moves Me
• Audio Player • All 4 Kids Audio CD • TV Moves Me by Rosann Ohlund
Engelbretson • Brown egg shakers (1 per child and teacher) • Painter’s tape (optional)
Lesson 8 Boogie Oogie Slide
• Audio Player • All 4 Kids Audio CD • Boogie Oogie Slide Instrument pictures (1 set) • Cowboy Hats (optional- 1 per child and
teacher) • Painter’s tape (optional)

Lesson 9 GO and WHOA Snacks
• Audio Player • All 4 Kids Audio CD • GO and WHOA snack cards (1 set) • Fresh fruits and vegetables (4 each) • Knife & cutting board • Food Faces on craft sticks (1 per child and
teacher) • Plates and napkins • Serving tongs (2) • Cooler (optional)
Lesson 10 Let’s Hip Hop!
• Audio Player • All 4 Kids Audio CD • Eating the Alphabet by Lois Ehlert • Go and WHOA Snack cards ( 1 set)
Lesson 11 Fun with Balance
• Audio Player • All 4 Kids Audio CD • Balance beams • Fiona Flamingo picture • GO and WHOA snack cards (1 set) • Fruit and vegetable bean bags
Lesson 12 Tummy Talks
• Audio Player • All 4 Kids Audio CD • Tummy Talks, edited by M. Sigman-Grant • GO and WHOA snack cards (1 set)
Lesson 13 Watch me Jump!
• Audio Player • All 4 Kids Audio CD
Kids In Motion CD by Greg and Steve • Tummy Talks book • Painter’s tape (optional)
Lesson 14 Hungry Meter
• Audio Player • All 4 Kids Audio CD • Hoot Poster • Magnetic letters • Cookie sheet (optional) • Hungry Meters (1 per child and teacher) • Packing tape (1 roll) • Brads (1 Box) • Painter’s tape (optional)
Lesson 15 Go and Whoa Foods
• Audio Player • All 4 Kids Audio CD • GO and WHOA snack cards (1 set) • Yogurt • Apple Slices • Plates, spoons, napkins • Knife, cutting board, cooler (optional) • Food Faces pictures (1 per child and teacher)

Lesson 16 Pack it Up
• Audio Player • All 4 Kids Audio CD • Hunger Meter • Jerseys - Green, yellow and red (optional – 1
per child and teacher)
Lesson 17 Let’s Salsa
• Audio Player • All 4 Kids Audio CD • Scarves (1 pair per child and teacher) • Ven Conmigo Instrument pictures • My Shape Pictures • Crayons/ markers
Lesson 18 Friends of Many Shapes and Colors
• Audio Player • All 4 Kids Audio CD • Persona Dolls (Katie & Eddie) • Fat vest for Katie persona doll • Scarves (1 pair per child and teacher)
Lesson 19 Shapesville
• Audio Player • All 4 Kids Audio CD • We are All Unique Poster • Contact Paper • Velcro • My Shape Picture (from Lesson #17) • SHAPESVILLE by Andy Mills and Becky
Olsen • Self-inked stamp • My Shape Picture stickers (hobby) • Scarves (1 pair per child and teacher)
Lesson 20 Step to It!
• Audio Player • All 4 Kids Audio CD • We are All Unique Poster • My Shape Pictures • Stickers for My Shape Pictures (Physical
Activity) • Jumbo Dice (2) • Shapes for jumbo dice (2 circles, 2 rectangles,
and 2 diamonds) • Scarves (1 pair per child and teacher)
Lesson 21 We got the Beat
• Audio player (1) • All 4 Kids Audio CD (1) • Real/Plastic fruits and vegetables (2 round, 2
skinny, 2 little) • Rhythm Sticks (2 per child and teacher) • Scarves (1 pair per child and teacher) • We are All Unique Poster • My Shape pictures

Lesson 22 We All Play Together
• Audio Player • All 4 Kids Audio CD • Persona dolls (1 each – “Katie”, “Eddie” and
“Felicity”) • Fat vest for Katie Persona doll • Scarves (1 pair per child and teacher) • Park Picture • We are All Unique Poster • My Shape Pictures • My Shape Pictures stickers (GO snacks)
Lesson 23 Ven Conmigo
• Audio Player • All 4 Kids Audio CD • Scarves (1 pair per child and teacher)
Lesson 24 Healthy, Happy, Active and Fit Kids
• Audio Player • All 4 Kids Audio CD • Scarves (1 pair per child and teacher) • We are All Unique Poster • All 4 Kids medals • All 4 Kids certificates • My Shape Pictures

All 4 Kids UNCE ● Program Evaluation
B.4: Program Classroom Materials


Materials Used in the All 4 Kids Child Classes
Name/Author Description TV Moves Me. Written by R.O. Englebretson; illustrated by P. O. Abbott. Edited by Sigman-Grant, M.
A children’s book encouraging movement (English/Spanish)
Tummy Talks, Edited by M. Sigman-Grant; Illustrated by P. Abbott.
A children’s book encouraging self-regulation of food intake by children (English/Spanish)
Have Fun and Be Active. USDA Food Stamp Program DVD (English/Spanish)
Depicts affordable and creative ways to be physically active inside and outside the house
Go, Slow, Whoa Foods. National Institutes of Health.
Presents the concept of all foods can fit within a plan of balance, variety and moderation
Nibbles for Health: Nutrition Newsletters for Parents of Young Children. FNS
USDA Parent newsletters designed for preschool parents with children attending a Child and Adult Care Food Program (CACFP). (English/Spanish)
SHAPESVILLE Written by Andy Mills and Becky Osborn; illustrated by Erica Neitz.
A children’s book promoting positive body image and diversity through proper nutrition and physical activity. (English)
All 4 Kids: CD and DVD University of Nevada Cooperative Extension, Southern Area.
A preschool audio CD and DVD designed to promote program concepts and encourage physical development through dance. (English and some Spanish)


All 4 Kids UNCE ● Program Evaluation
B.5: Project Resource and Expense Tracking Form


Project Resource and Expense Tracking Form for Program Administrator
ALL 4 Kids
[POST‐IMPLEMENTATION]
This data collection form will be used to summarize information about ACTUAL resources used for and expenses related to your SNAP‐Ed intervention. In Section 1 we are requesting information that is specific to the implementation of your project. In Section 2 we are requesting information that is specific only to the evaluation (Demonstration Project‐led assessment) component of your intervention.
SECTION 1. Implementation In the following tables, please provide the requested information as it relates to the implementation of your project. Please do not include resources or expenses related to your planning and design or evaluation.
1.1. Summarize staff costs (human capital) for the implementation of your SNAP‐Ed project
a) At the administrative, coordination, oversight level, trainer level (Represents 9 months of effort)
Title of position Brief description of responsibilities
FTEs Average salary for
this position Salary range for this position
UNCE Faculty
‐Supervises staff and coordinate program
.15 90,000 $70,000 to 130,000
Program Officer III
‐ Coordinate intervention program training and implantation
‐ Supervise program staff
‐ Order program supplies and materials
.6 $54,204.48 $45,560 to $67,693

b) At the nutrition educator level (per intervention site), IF APPLICABLE
Title of position Brief description of responsibilities
FTEs Average salary for
this position Salary range for this position
Community Based Instructor (4 total)
‐ Teach All 4 Kids lessons and Family Events – 2 Instructors at 30 hours/week and 2 instructors at 16/hours/week
1.75 $35,475.12 $30,192 to $43,639
c) IT/Technical Staff, IF APPLICABLE
Title of position Brief description of responsibilities
FTEs Average salary for
this position Salary range for this position
d) Other
Title of position Brief description of responsibilities
FTEs Average salary for
this position Salary range for this position
1.2. Describe the ACTUAL costs other than staff costs (physical capital) required to implement project
a) Space‐ An offsite storage facility was utilized for program implementation supplies
and materials for $1200.00. b) Audio/visual c) Computer/software d) Other

1.3. Please provide the following information for ACTUAL expenditures related to the implementation of your SNAP‐Ed intervention only (NOT FOR EVALUATION)
Expenses
(a) Non‐Federal Public Funds (b) Non‐
Federal, Non‐cash
(c) Total Non‐
Federal Funds (a+b)
(d) Federal Funds
Total Funds (c+d)
Cash In‐kind
Donations
1. Salary/benefits $42,576 $42,576 $67,483 $110,059
1. Contracts/grants agreements
1. Non‐capital equipment/ supplies
1. Materials $15,300 $15,300
1. Travel $900 $900
1. Administrative
1. Building/space $900 $900
1. Maintenance
1. Equipment and other capital expenditures
1. TOTAL Direct Costs $42,576 $42,576 $84,583 $127,159
1. Indirect costs 0 0 $21,992 (26%) $21,992
1. TOTAL Costs $42,576 $42,576 $106,575 $149,151

SECTION 2. Evaluation In the following tables, please provide the requested information as it relates to the evaluation of your SNAP‐Ed project.
2.1. Summarize actual staff costs (human capital) used for your evaluation At the administrative, coordination, oversight level: (Represents 12 months of effort):
Title of position Brief description of responsibilities
FTEs Average salary for
this position Salary range for this position
Area Extension Specialist, Early Care and Education
‐PI ‐ Oversee evaluation design and data collection efforts
.50 $75,000 $55,000 to
$100,000
Area Extension Specialist, Exercise Physiology
‐Co‐PI ‐ Oversee evaluation design and data collection efforts for PMAs
.50 $75,000 $55,000 to
$100,000
Area Extension Specialist, Maternal/Child Health and Nutrition Education
‐ Co‐PI ‐ Facilitate data collection efforts at selected sites
‐ Data analysis and final reports
.10 $100,000 $70,000 to
$130,000
Letter of Appointment
‐Coordinate all staffing and evaluation efforts at control and experimental sites
.48 $20,837.28
(@48% FTE) $17,364 to $43,411
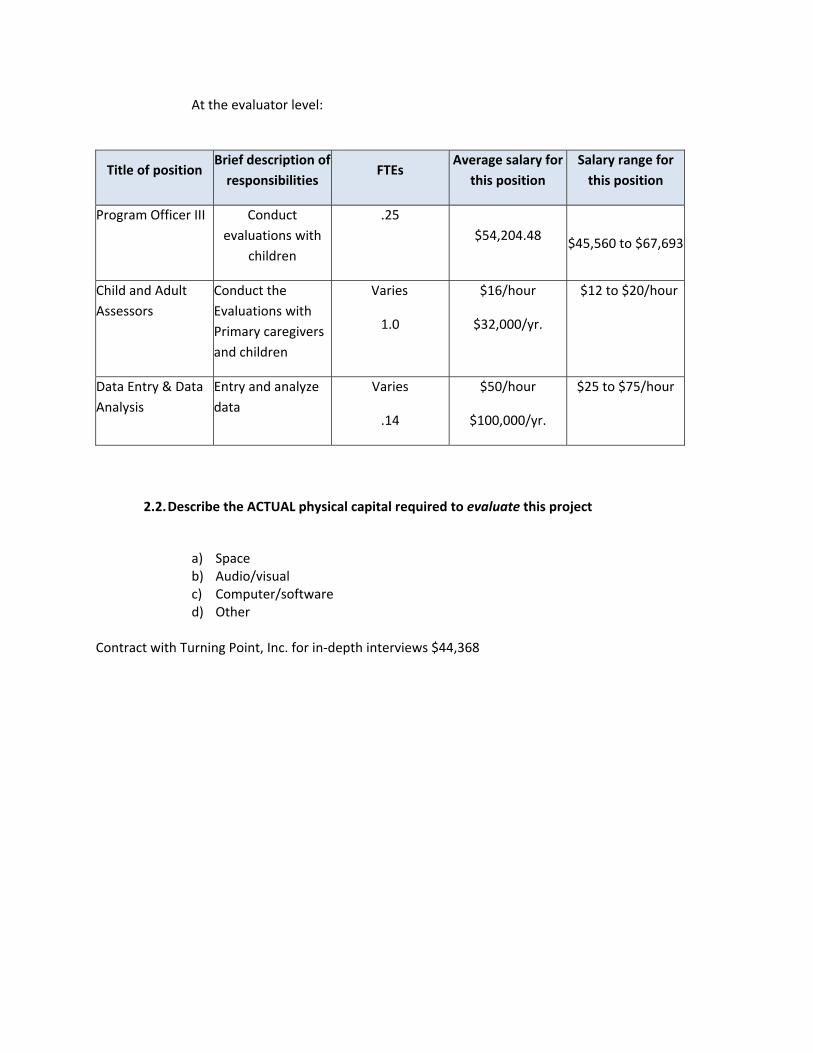
At the evaluator level:
Title of position Brief description of responsibilities
FTEs Average salary for
this position Salary range for this position
Program Officer III Conduct evaluations with
children
.25 $54,204.48 $45,560 to $67,693
Child and Adult Assessors
Conduct the Evaluations with Primary caregivers and children
Varies
1.0
$16/hour
$32,000/yr.
$12 to $20/hour
Data Entry & Data Analysis
Entry and analyze data
Varies
.14
$50/hour
$100,000/yr.
$25 to $75/hour
2.2. Describe the ACTUAL physical capital required to evaluate this project
a) Space b) Audio/visual c) Computer/software d) Other
Contract with Turning Point, Inc. for in‐depth interviews $44,368

2.3. Please provide the following information for ACTUAL expenditures related to the evaluation of your SNAP‐Ed intervention only (NOT FOR IMPLEMENTATION)
Expenses (a) Non‐Federal
Public Funds (b) Non‐
Federal, Non‐cash
(c) Total Non‐Federal Funds
(a+b)
(d) Federal Funds
Total Funds (c+d)
Cash In‐kind
Donations
1. Salary/benefits $162,750 $162,750 $30,240 $192,990
1. Contracts/grants agreements
$44,368 $44,368
1. Non‐capital equipment/ supplies
1. Materials $2,540 $2,540 $3,254 $5794
1. Travel $1,000 $1,000
1. Administrative
1. Building/space
1. Maintenance
1. Equipment and other capital expenditures
1. TOTAL Direct Costs $165,290 $165,290 $78,862 $244,152
1. Indirect costs 0 0 $20,504 (26%)
$20,504
1. TOTAL Costs $165,290 $165,290 $99,366 $264,656

SECTION 3. Total Budget Costs In the following table, please provide the requested information as it relates to the TOTAL cost of your SNAP‐Ed project.
Provide the total proposed budget for the SNAP‐Ed project (Sum of 1.2, 2.3 and 3.3)
Expenses (a) Non‐Federal Public Funds
(b) Non‐Federal, Non‐
cash
(c) Total Non‐Federal Funds
(a+b)
(d) Federal Funds
Total Funds (c+d)
Cash In‐kind
Donations
1. Salary/benefits $205,326 $205,326 $97,723 $303,049
1. Contracts/grants agreements
$44,368 $44,368
1. Non‐capital equipment/ supplies
1. Materials $2,540 $2,540 $18,554 $21,094
1. Travel $1,900 $1,900
1. Administrative
1. Building/space $900 $900
1. Maintenance
1. Equipment and other capital expenditures
1. TOTAL Direct Costs $207,866 $207,866 $163,445 $371,311
1. Indirect costs $42,496 $42,496
1. TOTAL Costs $211,546 $211,546 $205,941 $413,807


All 4 Kids UNCE ● Program Evaluation
B.6: Parent Follow-up Survey Descriptive Tables for Process Questions


All 4 Kids Program Evaluation Parent Follow-up Survey
Descriptive Tables for Process Questions


Table B-1. Number of All 4 Kids Program Family Activity Classes Attended— Overall and by Wave of Intervention
Overall Spring Wave
Summer Wave
n % n % n %
Number of family activity classesa attended (mean = 1.70)
None 59 24.69 32 25.00 27 24.32
One 33 13.81 18 14.06 15 13.51
Two 68 28.45 37 28.91 31 27.93
Three 79 33.05 41 32.03 38 34.23
Number of respondentsb 239 128 111
a Participating Head Start centers had a total of three family activity classes at the site over the intervention period. These events talked about how to be healthy and included food tastings and dancing.
b Five respondents did not answer the questions on attendance at the family activity classes.
Source: Parent Follow-up Survey, data collected in May–June 2010 for the spring wave of the intervention and in August–September 2010 for the summer wave.

Table B-2. Reasons for Nonparticipation in All 4 Kids Program Family Activity Classes—Overall and by Wave of Intervention
Overall Spring Wave
Summer Wave
n % n % n %
Reasons for not attending all three of the family activity classesa
Did not know about the classes 23 22.55 14 25.45 9 19.15
The classes were offered at times that did not work 44 43.14 28 50.91 16 34.04
Did not think the classes would be useful 1 0.98 0 0.00 1 2.13
Do not like to go to classes like this 1 0.98 1 1.82 0 0.00
Had to workb 4 3.92 1 1.82 3 6.38
Respondent/child was sickb 6 5.88 4 7.27 2 4.26
Conflicted with other plans 13 12.75 5 9.09 8 17.02
Don’t know/refusal 14 13.73 5 9.09 9 19.15
Number of respondentsc 102 55 47
Reasons for not attending any of the family activity classesa
Did not know about them 22 37.29 9 28.13 13 48.15
The classes were offered at times that did not work 28 47.46 20 62.50 8 29.63
Did not think the classes would be useful 1 1.69 1 3.13 0 0.00
Do not like to go to classes like this 0 0.00 0 0.00 0 0.00
Lack of timeb 2 3.39 2 6.25 0 0.00
Had to workb 7 11.86 2 6.25 5 18.52
Children at home/no babysitterb 2 3.39 1 3.13 1 3.70
Conflicted with other plans 7 11.86 4 12.50 3 11.11
Don’t know/refusal 1 1.69 1 3.13 0 0.00
Number of respondents 59 32 27
a Respondents could select multiple responses. b Write-in responses. c Includes one respondent who did not answer the question on number of classes attended.
Source: Parent Follow-up Survey, data collected in May–June 2010 for the spring wave of the intervention and in August–September 2010 for the summer wave.

Table B-3. Parent/Caregiver Use of All 4 Kids Program Take-Home Materials—Overall and by Wave of Intervention
Overall Spring Wave
Summer Wave
n % n % n %
Completed “Smart Snack Cards” activity with childa
Yes 183 75.00 104 81.25 79 68.10
No 26 10.66 15 11.72 11 9.48
Did not receive “Smart Snack Cards” 33 13.52 9 7.03 24 20.69
Don’t know/refusal 2 0.82 0 0.00 2 1.72
Number of respondents 244 128 116
Completed “Let’s Hunt for Healthy Foods” worksheet with childb
Yes 160 65.57 86 67.19 74 63.79
No 38 15.57 19 14.84 19 16.38
Did not receive “Let’s Hunt for Healthy Foods” 42 17.21 19 14.84 23 19.83
Don’t know/refusal 4 1.64 4 3.13 0 0.00
Number of respondents 244 128 116
Completed “Hungry Meter” activity with childc
Yes 178 72.95 105 82.03 73 62.93
No 27 11.07 10 7.81 17 14.66
Did not receive “Hungry Meter” 37 15.16 12 9.38 25 21.55
Don’t know/refusal 2 0.82 1 0.78 1 0.86
Number of respondents 244 128 116
a “Smart Snack Cards” were sent home with participating students. Each card had a picture of a healthy snack food and the serving size. Parents were encouraged to use the “Smart Snack Cards” with their child to pick a healthy snack.
b “Let’s Hunt for Healthy Foods” worksheet was sent home with participating students. The worksheet asked parents and the child to find specific foods at the grocery store and check them off the worksheet.
c “Hungry Meter” activity sheet was sent home with participating students. The purpose of the activity sheet was to reinforce the concept of knowing when one is hungry or full.
Source: Parent Follow-up Survey, data collected in May–June 2010 for the spring wave of the intervention and in August–September 2010 for the summer wave.

Table B-4. Parent/Caregiver Satisfaction with All 4 Kids Program Materials and Family Activity Classes—Overall and by Wave of Intervention
Overall Spring Wave
Summer Wave
n % n % n %
Parent/caregivers’ level of understanding of the University of Nevada All 4 Kids program materialsa
Very easy 126 51.64 71 55.47 55 47.41
Easy 73 29.92 39 30.47 34 29.31
Somewhat easy 26 10.66 14 10.94 12 10.34
Not very easy 3 1.23 1 0.78 2 1.72
Not at all easy 0 0.00 0 0.00 0 0.00
Did not read or use the materials 13 5.33 2 1.56 11 9.48
Don’t know/refusal 3 1.23 1 0.78 2 1.72
Number of respondents 244 128 116
Perceived usefulness of the University of Nevada All 4 Kids program materials in helping child eat healthier foods
Very useful 147 60.25 83 64.84 64 55.17
Useful 60 24.59 36 28.13 24 20.69
Somewhat useful 19 7.79 6 4.69 13 11.21
Not very useful 2 0.82 1 0.78 1 0.86
Not at all useful 0 0.00 0 0.00 0 0.00
Did not read or use the materials 13 5.33 2 1.56 11 9.48
Don’t know/refusal 3 1.23 0 0.00 3 2.59
Number of respondents 244 128 116
Perceived usefulness of the family activity classesb in helping child eat healthier foods
Very useful 132 72.93 72 75.00 60 70.59
Useful 36 19.89 19 19.79 17 20.00
Somewhat useful 9 4.97 5 5.21 4 4.71
Not very useful 3 1.66 0 0.00 3 3.53
Not at all useful 0 0.00 0 0.00 0 0.00
Don’t know/refusal 1 0.55 0 0.00 1 1.18
Number of respondentsc 181 96 85
a University of Nevada All 4 Kids program materials included the “Smart Snack Cards,” the “Let’s Hunt for Healthy Foods” worksheet, the “Hungry Meter” activity, and other materials and activities.
b Participating Head Start centers had a family activity class with parents and children together. These events were held once a month for the 3-month intervention period. The All 4 Kids instructor talked about how to be healthy and included food tastings and dancing. Responses are for parents/caregivers who attended one or more of these classes.
c Includes one respondent who did not answer the question on number of classes attended.
Source: Parent Follow-up Survey, data collected in May–June 2010 for the spring wave of the intervention and in August–September 2010 for the summer wave.

All 4 Kids UNCE ● Program Evaluation
B.7: Demographic Characteristics of Focus Group Participants


Demographic Characteristics of All 4 Kids Focus Group Participants (N=20)
Select Characteristics n %
Relationship to Child Mother/Step-Mother 15 75.0 Father/Step-Father 3 15.0 Other 2 10.0
Age of Child
One year old or less 1 5.0 Two years old 0 0.0 Three years old 2 10.0 Four years old 12 60.0 Five years old 2 10.0 Did not answer 3 15.0
Responsible for most of their households’ food shopping Yes 17 85.0 No 3 15.0
Responsible for most of their households’ food preparation Yes 15 75.0 No 5 25.0
Highest Education Level Attained 8th grade or less 4 20.0 Some high school but did not graduate 8 40.0 High school grad or GED 3 15.0 Some college or 2-year degree 3 15.0 Four year college grad or more 2 10.0
Ethnicity Hispanic or Latino 16 80.0 Not Hispanic or Latino 4 20.0
Race White 12 60.0 Black/African American 2 10.0 Asian 0 0.0 Native Hawaiian/Pacific Islander 0 0.0 American Indian/Alaska Native 0 0.0 Other (Hispanic or Latino) 3 15.0 Did not answer 3 15.0
Age
20-29 years old 9 45.0 30-39 years old 8 40.0 40-49 years old 2 10.0 50-59 years old 1 5.0


Appendix C Parent Survey Instruments


All 4 Kids UNCE ● Program Evaluation
List of Contents C.1: Baseline Survey, Intervention and Comparison Groups
C.2: Follow-up Survey, Intervention Group
C.3: Follow-up Survey, Comparison Group


All 4 Kids UNCE ● Program Evaluation
C.1: Baseline Survey, Intervention and Comparison Groups*
*Cups of fruits and vegetables graphics courtesy of Dr. Marilyn Townsend and Kathryn Sylva, University of California, Davis.


NV – Pre
OMB No. 0584-0554
Expiration date: 1/31/2013
See OMB statement on inside cover
Thank you for taking part in this important study!
Please fill out and return the survey in the enclosed envelope within the next week. If you have any questions about the What Does Your Child Eat? study, please send an e‐mail to
[email protected] or call toll‐free at 1‐866‐800‐9176.
Put Label Here
Date:___________________
Time:___________________

Public reporting burden for this collection of information is estimated to average 15 minutes per response, including the time for reviewing instructions, searching existing data sources, gathering and maintaining the data needed, and completing and reviewing the collection of information. An agency may not conduct or sponsor, and a person is not required to respond to, a collection of information unless it displays a currently valid OMB control number. Send comments regarding this burden estimate or any other aspect of this collection of information, including suggestions for reducing this burden, to: U.S. Department of Agriculture, Food and Nutrition Services, Office of Research and Analysis, Room 1014, Alexandria, VA 22302 ATTN: PRA (0584-0554). Do not return the completed form to this address. If you have questions regarding your rights as a research participant, you may contact RTI’s Office of Research Protection toll-free at 866-214-2043.

1
This survey asks about what your child eats. The survey will take about 15 minutes to
complete. You will receive $10 for completing this survey and $15 for completing a second
survey that we will mail you in about 2 months.
All of your answers to the survey will be kept private. We will not share your answers with
anyone. You may skip any questions you do not want to answer.
1. To begin the survey, I’m going to read a list of foods. For each food, please tell me if it
was available in your home during the past week. Please include fresh, frozen,
canned, and dried foods. Answer yes or no for each food. The first food is…
a. Bananas YES NO DK RF
b. Apples YES NO DK RF
c. Grapes YES NO DK RF
d. Mangoes YES NO DK RF
e. Kiwis YES NO DK RF
f. Carrots YES NO DK RF
g. Jicamas (HE-kă-mă) YES NO DK RF
h. Potato chips, nacho chips, or corn chips YES NO DK RF
i. Graham crackers YES NO DK RF
j. String cheese YES NO DK RF
k. Regular soft drinks or sodas YES NO DK RF
l. Diet or low calorie soft drinks or sodas YES NO DK RF
For the next questions think about what your child ate during the past week, or the past 7
days. Do not include school or day care time.
2. How many days during the past week did your child eat more than one kind of fruit
each day? Do not include fruit juice. Would you say…? SELECT ONE.
1. None
2. 1 to 2 days
3. 3 to 4 days
4. 5 to 6 days
5. Every day
-4. DON’T KNOW
-7. REFUSAL

2
3. During the past week, how many cups of fruit did your child eat each day? Do not
include fruit juice. Would you say your child had…? GIVE RESPONDENT PICTURE OF
CUPS. SELECT ONE.
1. No fruit
2. ½ cup
3. 1 cup
4. 1 ½ cups
5. 2 cups
6. 2 ½ cups
7. 3 cups or more
-4. DON’T KNOW
-7. REFUSAL
4. How many days during the past week did your child eat more than one kind of
vegetable each day? Do not include vegetable juice. Would you say…? SELECT ONE.
1. None
2. 1 to 2 days
3. 3 to 4 days
4. 5 to 6 days
5. Every day
-4. DON’T KNOW
-7. REFUSAL
5. During the past week, how many cups of vegetables did your child eat each day? Do
not include vegetable juice. Would you say your child had …? GIVE RESPONDENT
PICTURE OF CUPS. SELECT ONE.
1. No vegetables
2. ½ cup
3. 1 cup
4. 1 ½ cups
5. 2 cups
6. 2 ½ cups
7. 3 cups or more
-4. DON’T KNOW
-7. REFUSAL

3
6. During the past week, did your child eat any meals or snacks that were provided by his
or her school or day care? You can select all the answers that apply. Would you say…?
SELECT ALL THAT APPLY.
1. Yes, breakfast
2. Yes, lunch
3. Yes, snacks
4. No, did not eat breakfast, lunch, or snacks provided by school or day care
-4. DON’T KNOW
-7. REFUSAL
7. Is your child willing to try a new kind of fruit? Would you say…? SELECT ONE.
1. No
2. Maybe
3. Yes
-4. DON’T KNOW
-7. REFUSAL
8. How many days during the past week did you give your child fruit as a snack? Would
you say…? SELECT ONE.
1. None
2. 1 to 2 days
3. 3 to 4 days
4. 5 to 6 days
5. Every day
-4. DON’T KNOW
-7. REFUSAL
9. How many days during the past week did your child ask or help himself or herself to fruit
as a snack? Would you say…? SELECT ONE.
1. None
2. 1 to 2 days
3. 3 to 4 days
4. 5 to 6 days
5. Every day
-4. DON’T KNOW
-7. REFUSAL

4
10. How many days during the past week did you give your child fruit at dinner? Would you
say…? SELECT ONE.
1. None
2. 1 to 2 days
3. 3 to 4 days
4. 5 to 6 days
5. Every day
-4. DON’T KNOW
-7. REFUSAL
11. Is your child willing to try a new kind of vegetable? Would you say…? SELECT ONE.
1. No
2. Maybe
3. Yes
-4. DON’T KNOW
-7. REFUSAL
12. How many days during the past week did you give your child a vegetable as a snack?
Would you say…? SELECT ONE.
1. None
2. 1 to 2 days
3. 3 to 4 days
4. 5 to 6 days
5. Every day
-4. DON’T KNOW
-7. REFUSAL
13. How many days during the past week did your child ask or help himself or herself to
vegetables as a snack? Would you say…? SELECT ONE.
1. None
2. 1 to 2 days
3. 3 to 4 days
4. 5 to 6 days
5. Every day
-4. DON’T KNOW
-7. REFUSAL

5
14. How many days during the past week did you give your child a vegetable at dinner?
Would you say…? SELECT ONE.
1. None
2. 1 to 2 days
3. 3 to 4 days
4. 5 to 6 days
5. Every day
-4. DON’T KNOW
-7. REFUSAL
15. How many days during the past week did you make your child eat everything on his or
her dinner plate? Would you say…? SELECT ONE.
1. None
2. 1 to 2 days
3. 3 to 4 days
4. 5 to 6 days
5. Every day
-4. DON’T KNOW
-7. REFUSAL
16. During the past month, when ordering food for your child at a fast food restaurant,
how often did you order fruits or vegetables, for example, apple slices or carrot sticks,
instead of French fries? Would you say…? SELECT ONE.
1. DID NOT EAT AT FAST FOOD RESTAURANTS [Go to Question 18.]
2. Never
3. Seldom
4. Sometimes
5. Most of the times
6. Almost always
-4. DON’T KNOW
-7. REFUSAL

6
17. During the past month, when eating out at a fast food restaurant, how often did your
child ask for fruits or vegetables, for example, apple slices or carrot sticks, instead of
French fries? Would you say…? SELECT ONE.
1. DID NOT EAT AT FAST FOOD RESTAURANTS
2. Never
3. Seldom
4. Sometimes
5. Most of the times
6. Almost always
-4. DON’T KNOW
-7. REFUSAL
For the next two questions, I’m going to read a statement. For each statement,
please tell me if you strongly agree, agree, disagree, or strongly disagree with the
statement.
18. How much do you agree or disagree with the following statement? “If my child eats
healthy, he or she will be healthier when he or she gets older.” Would you say…?
SELECT ONE.
1. Strongly agree
2. Agree
3. Disagree
4. Strongly disagree
-4. DON’T KNOW
-7. REFUSAL
19. How much do you agree or disagree with the following statement? “I am a good role
model for my child by eating healthy foods.” Would you say…? SELECT ONE.
1. Strongly agree
2. Agree
3. Disagree
4. Strongly disagree
-4. DON’T KNOW
-7. REFUSAL

7
20. During the past year, how often did you run out of food before the end of the month?
SELECT ONE.
1. Did not run out of food
2. Seldom
3. Sometimes
4. Most of the time
5. Almost always
-4. DON’T KNOW
-7. REFUSAL
21. How many people under 18 years of age live in your household?
____
-4. DON’T KNOW
-7. REFUSAL
22. Including yourself, how many people 18 years of age or older live in your household?
____
-4. DON’T KNOW
-7. REFUSAL
23. Which of the following categories best describes your age? SELECT ONE.
1. 18 to 24
2. 25 to 34
3. 35 to 44
4. 45 to 54
5. 55 to 64
6. 65 to 74
7. Over 74
-4. DON’T KNOW
-7. REFUSAL
24. What is your gender? SELECT ONE. (IF NECESSARY.)
1. MALE
2. FEMALE
-4. DON’T KNOW
-7. REFUSAL

8
25. Are you Hispanic or Latino? SELECT ONE.
1. YES
2. NO
-4. DON’T KNOW
-7. REFUSAL
26. What is your race? SELECT ALL THAT APPLY.
1. American Indian or Alaska Native
2. Asian
3. Black or African American
4. Native Hawaiian or other Pacific Islander
5. White
-4. DON’T KNOW
-7. REFUSAL
27. Does your family speak English at home? Would you say… SELECT ONE.
1. Speak English all of the time at home.
2. Speak English some of the time at home and speak another language some of the
time.
3. Never speak English at home. We speak another language.
-4. DON’T KNOW
-7. REFUSAL
Thank you for completing our survey.

9
Fr
uit
3 c
ups
2 c
ups
1 c
up
None

10
Vegetables
3 c
ups
2 c
ups
1 c
up
None

All 4 Kids UNCE ● Program Evaluation
C.2: Follow-up Survey, Intervention Group


NV – Post T
OMB No. 0584-0554
Expiration date: 1/31/2013
See OMB statement on inside cover
Thank you for taking part in this important study!
Please fill out and return the survey in the enclosed envelope within the next week. If you have any questions about the What Does Your Child Eat? study, please send an e‐mail to
[email protected] or call toll‐free at 1‐866‐800‐9176.
Put Label Here

Public reporting burden for this collection of information is estimated to average 15 minutes per response, including the time for reviewing instructions, searching existing data sources, gathering and maintaining the data needed, and completing and reviewing the collection of information. An agency may not conduct or sponsor, and a person is not required to respond to, a collection of information unless it displays a currently valid OMB control number. Send comments regarding this burden estimate or any other aspect of this collection of information, including suggestions for reducing this burden, to: U.S. Department of Agriculture, Food and Nutrition Services, Office of Research and Analysis, Room 1014, Alexandria, VA 22302 ATTN: PRA (0584-0554). Do not return the completed form to this address. If you have questions regarding your rights as a research participant, you may contact RTI’s Office of Research Protection toll-free at 866-214-2043.

1
This survey asks about what your child eats. You may recall that we asked some of the
same questions in the last survey. This study is being sponsored by the U.S. Department of
Agriculture’s Food & Nutrition Service and conducted by RTI International, a non-profit
research organization. The survey will take about 15 minutes to complete. You will receive
$15 for completing this survey.
All of your answers to the survey will be kept private. We will not share your answers with
anyone. You may skip any questions you do not want to answer. If you have any questions,
please call Matthew Bensen at RTI International at 1-866-800-9176.
Questions on Whether Certain Foods Are Available at Home
1. Were any of the following foods available in your home during the past week? Include
fresh, frozen, canned, and dried foods. (Circle yes or no for each food.)
a. Bananas Yes No
b. Apples Yes No
c. Grapes Yes No
d. Mangoes Yes No
e. Kiwis Yes No
f. Carrots Yes No
g. Jicamas Yes No
h. Potato chips, nacho chips, or corn chips Yes No
i. Graham crackers Yes No
j. String cheese Yes No
k. Regular soft drinks or sodas Yes No
l. Diet or low calorie soft drinks or sodas Yes No
Questions on the Fruits and Vegetables Your Child Eats
For the next questions think about what your child ate during the past week, or the past 7
days. Do not include school or day care time.
2. How many days during the past week did your child eat more than one kind of fruit each
day? Do not include fruit juice. (Circle one.)
1. None
2. 1 to 2 days
3. 3 to 4 days
4. 5 to 6 days
5. Every day

2
3. During the past week, how many cups of fruit did your child eat each day? Do not
include fruit juice. (Circle one.)
1. None
2. 1/2 cup
3. 1 cup
4. 1 ½ cups
5. 2 cups None 1 cup 2 cups 3 cups
6. 2 ½ cups
7. 3 cups or more
4. How many days during the past week did your child eat more than one kind of vegetable
each day? Do not include vegetable juice. (Circle one.)
1. None
2. 1 to 2 days
3. 3 to 4 days
4. 5 to 6 days
5. Every day
5. During the past week, how many cups of vegetables did your child eat each day? Do not
include vegetable juice. (Circle one.)
1. None
2. 1/2 cup
3. 1 cup
4. 1 ½ cups
5. 2 cups None 1 cup 2 cups 3 cups
6. 2 ½ cups
7. 3 cups or more
6. During the past week, did your child eat any meals or snacks that were provided by his
or her school or day care? (Circle all that apply.)
1. Yes, breakfast
2. Yes, lunch
3. Yes, snacks
4. No, did not eat breakfast, lunch, or snacks provided by school or day care
7. Is your child willing to try a new kind of fruit? (Circle one.)
1. No
2. Maybe
3. Yes

3
8. How many days during the past week did you give your child fruit as a snack? (Circle
one.)
1. None
2. 1 to 2 days
3. 3 to 4 days
4. 5 to 6 days
5. Every day
9. How many days during the past week did your child ask or help himself or herself to fruit
as a snack? (Circle one.)
1. None
2. 1 to 2 days
3. 3 to 4 days
4. 5 to 6 days
5. Every day
10. How many days during the past week did you give your child fruit at dinner? (Circle
one.)
1. None
2. 1 to 2 days
3. 3 to 4 days
4. 5 to 6 days
5. Every day
11. Is your child willing to try a new kind of vegetable? (Circle one.)
1. No
2. Maybe
3. Yes
12. How many days during the past week did you give your child a vegetable as a snack?
(Circle one.)
1. None
2. 1 to 2 days
3. 3 to 4 days
4. 5 to 6 days
5. Every day

4
13. How many days during the past week did your child ask or help himself or herself to
vegetables as a snack? (Circle one.)
1. None
2. 1 to 2 days
3. 3 to 4 days
4. 5 to 6 days
5. Every day
14. How many days during the past week did you give your child a vegetable at dinner?
(Circle one.)
1. None
2. 1 to 2 days
3. 3 to 4 days
4. 5 to 6 days
5. Every day
Questions on Your Child’s Eating Habits
15. How many days during the past week did you make your child eat everything on his or
her dinner plate? (Circle one.)
1. None
2. 1 to 2 days
3. 3 to 4 days
4. 5 to 6 days
5. Every day
16. During the past month, when ordering food for your child at a fast food restaurant, how
often did you order fruits or vegetables, for example, apple slices or carrot sticks,
instead of French fries? (Circle one.)
1. Did not eat at fast food restaurants
2. Never
3. Seldom
4. Sometimes
5. Most of the times
6. Almost always

5
17. During the past month, when eating out at a fast food restaurant, how often did your
child ask for fruits or vegetables, for example, apple slices or carrot sticks, instead of
French fries? (Circle one.)
1. Did not eat at fast food restaurants
2. Never
3. Seldom
4. Sometimes
5. Most of the times
6. Almost always
18. How much do you agree or disagree with the following statement? “If my child eats
healthy, he or she will be healthier when he or she gets older.” (Circle one.)
1. Strongly agree
2. Agree
3. Disagree
4. Strongly disagree
19. How much do you agree or disagree with the following statement? “I am a good role
model for my child by eating healthy foods.” (Circle one.)
1. Strongly agree
2. Agree
3. Disagree
4. Strongly disagree
Questions on Nutrition Education Materials Your Child Got at Child Care
20. Your child got “Smart Snack Cards.” Each card had a picture of a healthy snack food and
the serving size. Did you or someone else in your household use the “Smart Snack
Cards” with your child to pick a healthy snack? (Circle one.)
1. Yes
2. No
3. Did not get Smart Snack Cards

6
21. Your child got a worksheet called, “Let’s Hunt for Healthy Foods.” The worksheet asked
you and your child to find specific foods at the grocery store and check them off the
worksheet. Did you or someone else in your household do the worksheet with your
child? (Circle one.)
1. Yes
2. No
3. Did not get worksheet
22. Your child got a “Hungry Meter” that helps your child know when he or she is hungry or
full. Did you or someone else in your household do the “Hungry Meter” activity with your
child? (Circle one.)
1. Yes
2. No
3. Did not get the Hungry Meter
23. How easy was it to understand the materials and activities sent home with your child?
(Circle one.)
1. Very easy
2. Easy
3. Somewhat easy
4. Not very easy
5. Not at all easy
6. Did not read the materials or do the activities sent home with my child
24. How useful were the materials and activities in helping you to get your child to eat
healthier? (Circle one.)
1. Very useful
2. Useful
3. Somewhat useful
4. Not very useful
5. Not at all useful
6. Did not read the materials or do the activities sent home with my child
25. Your child’s Head Start center had a Family Activity event each month for 3 months.
These events talked about how to be healthy and included food tastings and dancing.
Did you or someone else in your household go to any of the Family Activity events?
(Circle one.)
1. Yes
2. No [Go to Question 29]

7
26. How many Family Activity events did you or someone else in your household attend?
(Circle one.)
1. One
2. Two
3. Three [Go to Question 28]
27. Why did you decide not to go to all of the Family Activity events? (Circle all that apply.)
1. Did not know about the other events
2. The events were offered at times that did not work for me
3. Did not think the events would be useful
4. Do not like to go to events like this
5. Other reason (specify): ______________________________________________
28. How useful were the Family Activity events in helping you to get your child to eat
healthier? (Circle one.) [Go to Question 30 after answering this question.]
1. Very useful
2. Useful
3. Somewhat useful
4. Not very useful
5. Not at all useful
29. Why did you decide not to go to any of the Family Activity events? (Circle all that apply.)
1. Did not know about the events
2. The events were offered at times that did work for me
3. Did not think the events would be useful
4. Do not like to go to events like this
5. Other reason (specify): _______________________________________________
30. Please share any comments about the materials, activities, and the Family Activity
events.
_________________________________________________________________________________
_________________________________________________________________________________
_________________________________________________________________________________
_________________________________________________________________________________
_________________________________________________________________________________

8
Thank you for completing our survey.
Please return the survey in the enclosed envelope.
If you have misplaced the envelope, call 1-866-800-9176
for a replacement or mail the survey to
RTI INTERNATIONAL
ATTN: Data Capture (0211890.001.008.002)
PO Box 12194
Research Triangle Park, NC 27709-9779

All 4 Kids UNCE ● Program Evaluation
C.3: Follow-up Survey, Comparison Group


NV – Post C
OMB No. 0584-0554
Expiration date: 1/31/2013
See OMB statement on inside cover
Thank you for taking part in this important study!
Please fill out and return the survey in the enclosed envelope within the next week. If you have any questions about the What Does Your Child Eat? study, please send an e‐mail to
[email protected] or call toll‐free at 1‐866‐800‐9176.
Put Label Here

Public reporting burden for this collection of information is estimated to average 15 minutes per response, including the time for reviewing instructions, searching existing data sources, gathering and maintaining the data needed, and completing and reviewing the collection of information. An agency may not conduct or sponsor, and a person is not required to respond to, a collection of information unless it displays a currently valid OMB control number. Send comments regarding this burden estimate or any other aspect of this collection of information, including suggestions for reducing this burden, to: U.S. Department of Agriculture, Food and Nutrition Services, Office of Research and Analysis, Room 1014, Alexandria, VA 22302 ATTN: PRA (0584-0554). Do not return the completed form to this address. If you have questions regarding your rights as a research participant, you may contact RTI’s Office of Research Protection toll-free at 866-214-2043.

1
This survey asks about what your child eats. You may recall that we asked some of the
same questions in the last survey. This study is being sponsored by the U.S. Department of
Agriculture’s Food & Nutrition Service and conducted by RTI International, a non-profit
research organization. The survey will take about 15 minutes to complete. You will receive
$15 for completing this survey.
All of your answers to the survey will be kept private. We will not share your answers with
anyone. You may skip any questions you do not want to answer. If you have any questions,
please call Matthew Bensen at RTI International at 1-866-800-9176.
Questions on Whether Certain Foods Are Available at Home
1. Were any of the following foods available in your home during the past week? Include
fresh, frozen, canned, and dried foods. (Circle yes or no for each food.)
a. Bananas Yes No
b. Apples Yes No
c. Grapes Yes No
d. Mangoes Yes No
e. Kiwis Yes No
f. Carrots Yes No
g. Jicamas Yes No
h. Potato chips, nacho chips, or corn chips Yes No
i. Graham crackers Yes No
j. String cheese Yes No
k. Regular soft drinks or sodas Yes No
l. Diet or low calorie soft drinks or sodas Yes No
Questions on the Fruits and Vegetables Your Child Eats
For the next questions think about what your child ate during the past week, or the past 7
days. Do not include school or day care time.
2. How many days during the past week did your child eat more than one kind of fruit each
day? Do not include fruit juice. (Circle one.)
1. None
2. 1 to 2 days
3. 3 to 4 days
4. 5 to 6 days
5. Every day

2
3. During the past week, how many cups of fruit did your child eat each day? Do not
include fruit juice. (Circle one.)
1. None
2. 1/2 cup
3. 1 cup
4. 1 ½ cups
5. 2 cups None 1 cup 2 cups 3 cups
6. 2 ½ cups
7. 3 cups or more
4. How many days during the past week did your child eat more than one kind of vegetable
each day? Do not include vegetable juice. (Circle one.)
1. None
2. 1 to 2 days
3. 3 to 4 days
4. 5 to 6 days
5. Every day
5. During the past week, how many cups of vegetables did your child eat each day? Do not
include vegetable juice. (Circle one.)
1. None
2. 1/2 cup
3. 1 cup
4. 1 ½ cups
5. 2 cups None 1 cup 2 cups 3 cups
6. 2 ½ cups
7. 3 cups or more
6. During the past week, did your child eat any meals or snacks that were provided by his
or her school or day care? (Circle all that apply.)
1. Yes, breakfast
2. Yes, lunch
3. Yes, snacks
4. No, did not eat breakfast, lunch, or snacks provided by school or day care
7. Is your child willing to try a new kind of fruit? (Circle one.)
1. No
2. Maybe
3. Yes

3
8. How many days during the past week did you give your child fruit as a snack? (Circle
one.)
1. None
2. 1 to 2 days
3. 3 to 4 days
4. 5 to 6 days
5. Every day
9. How many days during the past week did your child ask or help himself or herself to fruit
as a snack? (Circle one.)
1. None
2. 1 to 2 days
3. 3 to 4 days
4. 5 to 6 days
5. Every day
10. How many days during the past week did you give your child fruit at dinner? (Circle
one.)
1. None
2. 1 to 2 days
3. 3 to 4 days
4. 5 to 6 days
5. Every day
11. Is your child willing to try a new kind of vegetable? (Circle one.)
1. No
2. Maybe
3. Yes
12. How many days during the past week did you give your child a vegetable as a snack?
(Circle one.)
1. None
2. 1 to 2 days
3. 3 to 4 days
4. 5 to 6 days
5. Every day

4
13. How many days during the past week did your child ask or help himself or herself to
vegetables as a snack? (Circle one.)
1. None
2. 1 to 2 days
3. 3 to 4 days
4. 5 to 6 days
5. Every day
14. How many days during the past week did you give your child a vegetable at dinner?
(Circle one.)
1. None
2. 1 to 2 days
3. 3 to 4 days
4. 5 to 6 days
5. Every day
Questions on Your Child’s Eating Habits
15. How many days during the past week did you make your child eat everything on his or
her dinner plate? (Circle one.)
1. None
2. 1 to 2 days
3. 3 to 4 days
4. 5 to 6 days
5. Every day
16. During the past month, when ordering food for your child at a fast food restaurant, how
often did you order fruits or vegetables, for example, apple slices or carrot sticks,
instead of French fries? (Circle one.)
1. Did not eat at fast food restaurants
2. Never
3. Seldom
4. Sometimes
5. Most of the times
6. Almost always

5
17. During the past month, when eating out at a fast food restaurant, how often did your
child ask for fruits or vegetables, for example, apple slices or carrot sticks, instead of
French fries? (Circle one.)
1. Did not eat at fast food restaurants
2. Never
3. Seldom
4. Sometimes
5. Most of the times
6. Almost always
18. How much do you agree or disagree with the following statement? “If my child eats
healthy, he or she will be healthier when he or she gets older.” (Circle one.)
1. Strongly agree
2. Agree
3. Disagree
4. Strongly disagree
19. How much do you agree or disagree with the following statement? “I am a good role
model for my child by eating healthy foods.” (Circle one.)
1. Strongly agree
2. Agree
3. Disagree
4. Strongly disagree
Thank you for completing our survey.
Please return the survey in the enclosed envelope.
If you have misplaced the envelope, call 1-866-800-9176
for a replacement or mail the survey to
RTI INTERNATIONAL
ATTN: Data Capture (0211890.001.008.002)
PO Box 12194
Research Triangle Park, NC 27709-9779


Appendix D Parent Survey Materials


All 4 Kids UNCE ● Program Evaluation
List of Contents D.1: Information Sheet
D.2: Contact Card
D.3: Brochure


All 4 Kids UNCE ● Program Evaluation
D.1: Information Sheet

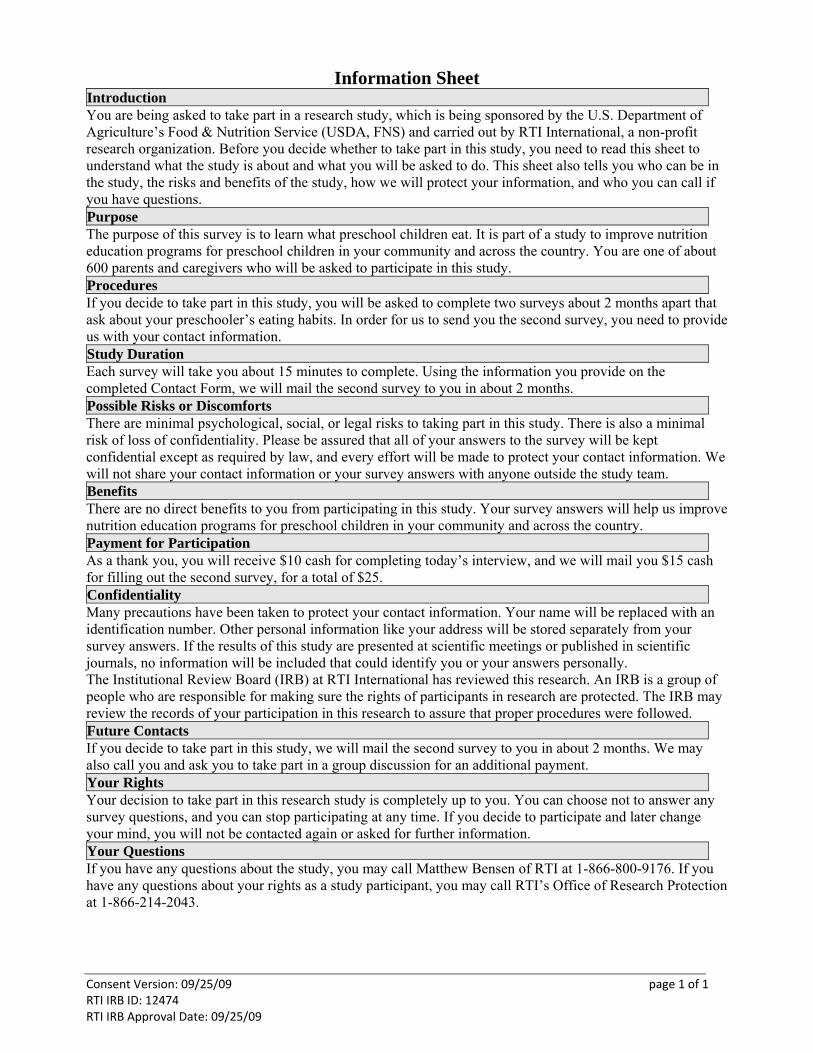
Consent Version: 09/25/09 page 1 of 1 RTI IRB ID: 12474 RTI IRB Approval Date: 09/25/09
Information Sheet Introduction You are being asked to take part in a research study, which is being sponsored by the U.S. Department of Agriculture’s Food & Nutrition Service (USDA, FNS) and carried out by RTI International, a non-profit research organization. Before you decide whether to take part in this study, you need to read this sheet to understand what the study is about and what you will be asked to do. This sheet also tells you who can be in the study, the risks and benefits of the study, how we will protect your information, and who you can call if you have questions. Purpose The purpose of this survey is to learn what preschool children eat. It is part of a study to improve nutrition education programs for preschool children in your community and across the country. You are one of about 600 parents and caregivers who will be asked to participate in this study. Procedures If you decide to take part in this study, you will be asked to complete two surveys about 2 months apart that ask about your preschooler’s eating habits. In order for us to send you the second survey, you need to provide us with your contact information. Study Duration Each survey will take you about 15 minutes to complete. Using the information you provide on the completed Contact Form, we will mail the second survey to you in about 2 months. Possible Risks or Discomforts There are minimal psychological, social, or legal risks to taking part in this study. There is also a minimal risk of loss of confidentiality. Please be assured that all of your answers to the survey will be kept confidential except as required by law, and every effort will be made to protect your contact information. We will not share your contact information or your survey answers with anyone outside the study team. Benefits There are no direct benefits to you from participating in this study. Your survey answers will help us improve nutrition education programs for preschool children in your community and across the country. Payment for Participation As a thank you, you will receive $10 cash for completing today’s interview, and we will mail you $15 cash for filling out the second survey, for a total of $25. Confidentiality Many precautions have been taken to protect your contact information. Your name will be replaced with an identification number. Other personal information like your address will be stored separately from your survey answers. If the results of this study are presented at scientific meetings or published in scientific journals, no information will be included that could identify you or your answers personally. The Institutional Review Board (IRB) at RTI International has reviewed this research. An IRB is a group of people who are responsible for making sure the rights of participants in research are protected. The IRB may review the records of your participation in this research to assure that proper procedures were followed. Future Contacts If you decide to take part in this study, we will mail the second survey to you in about 2 months. We may also call you and ask you to take part in a group discussion for an additional payment. Your Rights Your decision to take part in this research study is completely up to you. You can choose not to answer any survey questions, and you can stop participating at any time. If you decide to participate and later change your mind, you will not be contacted again or asked for further information. Your Questions If you have any questions about the study, you may call Matthew Bensen of RTI at 1-866-800-9176. If you have any questions about your rights as a study participant, you may call RTI’s Office of Research Protection at 1-866-214-2043.


All 4 Kids UNCE ● Program Evaluation
D.2: Contact Card


Consent Version: 09/25/09 page 1 of 1 RTI IRB ID: 12474 RTI IRB Approval Date: 09/25/09
CONTACT CARD
Are you willing to take part in this study? YES NO If “YES”, please clearly PRINT your contact information below.
Your First Name: ________________ Your Last Name: ____________________ Title: Mr. Mrs. Ms. Child’s First Name: _______________ Child’s Last Name: _____________________ Child’s Gender: Male Female Head Start Center: __________________________________________ Child’s Month and Year of Birth (ex. April, 2005 → “04/2005”): ___ ___ / ___ ___ ___ ___
M M / Y Y Y Y
Mailing Address: ________________________________________________________ Apt. Number: ______ City: ______________________________________ State: _________ Zip Code: ____________ Primary Phone Number: (______) __________________ Home Cell Work Alternate Phone Number: (______) _________________ Home Cell Work
For this study, would you like to be interviewed in English or Spanish? English Spanish
According to the Paperwork Reduction Act of 1995, an agency may not conduct or sponsor, and a person is not required to respond to, a collection of information unless it displays a valid OMB control number. The valid OMB control number for this information collection is 0584-0554 and the expiration date is 1/31/2013. The time required to complete this information collection is estimated to average 5 minutes per response, including the time for reviewing instructions, searching existing data sources, gathering and maintaining the data needed, and completing and reviewing the collection of information.
CONTACT CARD
Are you willing to take part in this study? YES NO If “YES”, please clearly PRINT your contact information below.
Your First Name: ________________ Your Last Name: ____________________ Title: Mr. Mrs. Ms. Child’s First Name: _______________ Child’s Last Name: _____________________ Child’s Gender: Male Female Head Start Center: __________________________________________ Child’s Month and Year of Birth (ex. April, 2005 → “04/2005”): ___ ___ / ___ ___ ___ ___
M M / Y Y Y Y
Mailing Address: ________________________________________________________ Apt. Number: ______ City: ______________________________________ State: _________ Zip Code: ____________ Primary Phone Number: (______) __________________ Home Cell Work Alternate Phone Number: (______) _________________ Home Cell Work For this study, would you like to be interviewed in English or Spanish?
English Spanish
According to the Paperwork Reduction Act of 1995, an agency may not conduct or sponsor, and a person is not required to respond to, a collection of information unless it displays a valid OMB control number. The valid OMB control number for this information collection is 0584-0554 and the expiration date is 1/31/2013. The time required to complete this information collection is estimated to average 5 minutes per response, including the time for reviewing instructions, searching existing data sources, gathering and maintaining the data needed, and completing and reviewing the collection of information.


All 4 Kids UNCE ● Program Evaluation
D.3: Brochure


Appendix E Impact Evaluation Methodological Analyses

All 4 Kids UNCE ● Program Evaluation
List of Contents Table E-1. Baseline Demographic Characteristics for Parent Respondents and Their Children Who
Participated in the All 4 Kids Program Evaluation Study, Overall and by Wave of Intervention
Table E-2. Baseline Demographic Characteristics for Parent Respondents and Their Children Who Participated in the All 4 Kids Program Evaluation Study, by Condition
Table E-3. Baseline Outcome Measures for the Evaluation of the All 4 Kids Program, Overall and by Wave of Intervention
Table E-4. Baseline Outcome Measures for the Evaluation of the All 4 Kids Program, by Condition
Table E-5. Unadjusted Baseline Means of Participants Providing Post-intervention Follow-Up Data for the Evaluation of the All 4 Kids Program, by Condition
Table E-6. Unadjusted Post-test Means for the Evaluation of the All 4 Kids Program, by Condition
Table E-7. Attrition Analysis for the Evaluation of the All 4 Kids Program


Table E-1. Baseline Demographic Characteristics for Parent Respondents and Their Children Who Participated in the All 4 Kids Program Evaluation Study, Overall and by Wave of Intervention
Characteristic Overall
(SE) Spring Wave
(SE) Summer Wave
(SE) Difference t-statistic p-value
Child’s sex, % male 48.87 (2.6139) 51.22 (2.8639) 44.88 (4.0109) 6.34 1.29 0.2272 Child’s age 4.60 (0.0467) 4.53 (0.0426) 4.77 (0.0589) −0.24** −3.27 0.0085 Parenta/household demographics
Respondent’s age, % 18 to 34 70.06 (1.7496) 70.92 (2.1941) 68.27 (3.1365) 2.64 0.69 0.5055 35 to 44 23.10 (1.4238) 22.86 (1.8285) 23.56 (2.6580) −0.70 −0.22 0.8319 45 or older 7.05 (1.2558) 6.25 (1.4986) 8.36 (2.0923) −2.11 −0.82 0.4323
Respondent’s sex, % male 14.54 (1.6592) 14.09 (2.0226) 15.43 (2.8322) −1.34 −0.39 0.7078 Respondent’s ethnicity, %
Hispanic or Latino 65.55 (5.6170) 64.37 (6.6168) 71.18 (8.9284) −6.81 −0.61 0.5538 Not Hispanic or Latino 34.45 (5.6170) 35.63 (6.6168) 28.82 (8.9284) 6.81 0.61 0.5538
Respondent’s race, % American Indian or Alaska Native 2.29 (0.7836) 2.25 (1.0089) 2.24 (1.5890) 0.00 0.00 0.9982 Asian 1.95 (0.7121) 2.73 (0.9511) 0.00 (1.4900) 2.73 1.55 0.1529 Black or African American 41.66 (5.4340) 40.21 (6.2952) 43.47 (8.9184) −3.26 −0.30 0.7712 Native Hawaiian or other Pacific
Islander 1.68 (1.0145) 0.94 (1.1667) 4.28 (1.7475) −3.34 −1.59 0.1427
White 49.68 (5.2340) 51.19 (6.1930) 46.63 (8.8027) 4.56 0.42 0.6807 More than one raceb 3.20 (0.8703) 2.78 (1.0399) 4.62 (1.7105) −1.84 −0.92 0.3798
Size of household 5.00 (0.1428) 5.10 (0.1688) 4.87 (0.2304) 0.24 0.83 0.4258 Single-adult household, % 17.60 (3.0925) 16.49 (3.5174) 19.44 (4.7897) −2.95 −0.50 0.6303 Language spoken by family at home, %
Speak English all of the time 32.17 (6.3283) 33.17 (7.4401) 27.30 (10.0238) 5.87 0.47 0.6485 Speak English some of the time and
speak another language some of the time
53.50 (4.3093) 52.41 (5.0141) 55.38 (6.8135) −2.96 −0.35 0.7334
Speak another language all of the time 14.61 (3.2533) 14.66 (4.3774) 17.43 (5.9242) −2.77 −0.38 0.7144
(continued)

Table E-1. Baseline Demographic Characteristics for Parent Respondents and Their Children Who Participated in the All 4 Kids Program Evaluation Study, Overall and by Wave of Intervention (continued)
Characteristic Overall
(SE) Spring Wave
(SE) Summer Wave
(SE) Difference t-statistic p-value
Center-provided food, % Received no food from center 3.63 (1.0376) 3.52 (1.3020) 4.64 (1.7966) −1.13 −0.51 0.6227 Received snacks only 4.30 (1.3612) 6.6 (2.5694) 1.39 (3.4750) 5.22 1.21 0.2553 Received one meal (breakfast or
lunch)c 33.89 (2.6479) 35.85 (3.5089) 31.39 (4.8180) 4.45 0.75 0.4721
Received two meals (breakfast and lunch)c
58.44 (3.9545) 54.06 (5.5396) 61.94 (7.5021) −7.87 −0.84 0.4183
Number of respondents (%) 622 417 (67.04) 205 (32.96) Number of centersd 12 9 5
**Indicates statistical significance if the p-value is less than or equal to 0.01. a Represents the parent/caregiver who completed the survey. b Includes respondents who selected more than one race category. c Some in this category also reported receiving center-provided snacks. d Two centers were included in both the spring and summer intervention waves.
Notes: Standard errors (SEs) and t-statistic used to test the assumption of no difference between the spring and summer waves were derived from model-based comparisons adjusted for clustering of students within centers.
Source: Parent Baseline Survey, spring wave data collected February–March 2010 and summer wave data collected May 2010.

Table E-2. Baseline Demographic Characteristics for Parent Respondents and Their Children Who Participated in the All 4 Kids Program Evaluation Study, by Condition
Characteristic Intervention Group (SE)
Comparison Group (SE) Difference t-statistic p-value
Child demographics
Sex, % male 48.04 (3.9664) 49.60 (3.7982) −1.56 −0.28 0.7823
Age 4.64 (0.0689) 4.57 (0.0671) 0.08 0.78 0.4515
Parenta/household demographics
Respondent’s age, %
18 to 34 70.41 (2.6794) 69.73 (2.5406) 0.68 0.18 0.8572
35 to 44 23.47 (2.4592) 22.63 (2.3318) 0.84 0.25 0.8094
45 or older 6.22 (1.8877) 7.83 (1.8025) −1.61 −0.62 0.5517
Respondent’s sex, % male 17.18 (2.2918) 12.12 (2.1741) 5.06 1.60 0.1400
Respondent’s ethnicity, %
Hispanic or Latino 65.87 (8.3645) 65.21 (8.2879) 0.67 0.06 0.9561
Not Hispanic or Latino 34.13 (8.3645) 34.79 (8.2879) −0.67 −0.06 0.9561
Respondent’s race, %
American Indian or Alaska Native 1.32 (1.2088) 3.13 (1.1743) −1.80 −1.07 0.3105
Asian 2.65 (1.1215) 1.25 (1.0895) 1.40 0.89 0.3920
Black or African American 45.10 (7.9651) 38.31 (7.8347) 6.78 0.61 0.5573
Native Hawaiian or other Pacific Islander 2.82 (1.4042) 0.66 (1.3632) 2.15 1.10 0.2968
White 47.05 (7.7240) 52.28 (7.5869) −5.23 −0.48 0.6396
More than one raceb 1.99 (1.4369) 4.38 (1.3959) −2.39 −1.19 0.2607
Size of household 5.01 (0.2136) 4.98 (0.2078) 0.03 0.10 0.9237
Single-adult household, % 19.29 (4.5699) 15.99 (4.4745) 3.30 0.52 0.6168
Language spoken by family at home, %
Speak English all of the time 31.19 (9.4072) 33.15 (9.3437) −1.96 −0.15 0.8855
Speak English some of the time and speak another language some of the time
53.19 (6.4456) 53.74 (6.3256) −0.55 −0.06 0.9528
Speak another language all of the time 15.80 (4.8418) 13.43 (4.7565) 2.36 0.35 0.7349
(continued)

Table E-2. Baseline Demographic Characteristics for Parent Respondents and Their Children Who Participated in the All 4 Kids Program Evaluation Study, by Condition (continued)
Characteristic Intervention Group (SE)
Comparison Group (SE) Difference t-statistic p-value
Center-provided food, %
Received no food from center 5.31 (1.3834) 2.19 (1.3199) 3.12 1.63 0.1342
Received snacks only 4.82 (2.0084) 3.78 (1.9429) 1.04 0.37 0.7169
Received one meal (breakfast or lunch)c 35.08 (3.9615) 32.79 (3.8082) 2.29 0.42 0.6854
Received two meals (breakfast and lunch)c 55.61 (5.7458) 61.16 (5.6179) −5.55 −0.69 0.5054
Number of respondents 294 328
Number of centers 6 6
a Represents the parent/caregiver who completed the survey. b Includes respondents who selected more than one race category. c Some in this category also reported receiving center-provided snacks.
Note: Standard errors (SEs) and t-statistic used to test the null hypothesis of no difference between intervention and comparison groups were derived from model-based comparisons adjusted for clustering of students within centers.
Source: Parent Baseline Survey, spring wave data collected February–March 2010 and summer wave data collected May 2010.

Table E-3. Baseline Outcome Measures for the Evaluation of the All 4 Kids Program, Overall and by Wave of Intervention
Measurea Overallb Spring Wave
(SE) Summer Wave
(SE) Difference t-statistic p-value Primary outcomes (at-home consumption)
Cups of fruits and vegetables 2.39 (0.1016) 2.43 (0.1237) 2.32 (0.1684) 0.11 0.54 0.6043 Cups of fruits 1.34 (0.0555) 1.36 (0.0694) 1.31 (0.0945) 0.04 0.36 0.7250 Cups of vegetables 1.04 (0.0522) 1.07 (0.0618) 1.01 (0.0845) 0.06 0.61 0.5523
Child’s other dietary behaviors Ate variety of fruitsc 4.55 (0.1039) 4.67 (0.1113) 4.27 (0.1582) 0.40 2.05 0.0675 Ate variety of vegetablesc 3.38 (0.1495) 3.54 (0.1599) 3.06 (0.2200) 0.48 1.77 0.1078 Helped self/requested fruit as snackc 3.57 (0.1349) 3.68 (0.1587) 3.36 (0.2196) 0.32 1.18 0.2637 Helped self/requested vegetable as snackc 1.24 (0.0736) 1.30 (0.1005) 1.16 (0.1399) 0.13 0.77 0.4602 Willingness to try new fruitsd 58.31 (2.1530) 57.95 (2.6883) 58.98 (3.7909) −1.03 −0.22 0.8288 Willingness to try new vegetablesd 41.58 (1.6176) 41.83 (2.4200) 40.98 (3.4473) 0.85 0.20 0.8439 Child asked for fruits or vegetables instead of
French fries at least some of the time when eating at fast food restaurantse
40.32 (1.3942) 41.70 (2.0507) 36.35 (3.0298) 5.35 1.46 0.1743
Parent behavior and household variables Availability of fruits and vegetablesf 3.98 (0.0990) 3.95 (0.1250) 4.10 (0.1696) −0.15 −0.72 0.4891 Parent offered fruit as snackc 4.13 (0.1030) 4.15 (0.1278) 4.06 (0.1793) 0.09 0.42 0.6832 Parent offered fruit at dinnerc 1.58 (0.1012) 1.55 (0.1262) 1.66 (0.1759) −0.11 −0.50 0.6262 Parent offered vegetable as snackc 1.79 (0.1010) 1.87 (0.1152) 1.66 (0.1603) 0.21 1.06 0.3145 Parent offered vegetable at dinnerc 3.02 (0.3059) 3.200 (0.3492) 2.51 (0.4714) 0.70 1.19 0.2606 Parent made child eat everything on his/her platec 3.36 (0.1258) 3.26 (0.1354) 3.50 (0.1947) −0.24 −1.01 0.3377 Parent ordered fruits or vegetables for child
instead of French fries at least some of the time when eating at fast food restaurantse
48.85 (3.3467) 51.65 (3.7971) 43.24 (5.1646) 8.41 1.31 0.2187
Number of respondents 622 417 205 Number of centersg 12 9 5
a Based on continuous measures of the identified construct, unless otherwise indicated. b For categorical variables, the count (percentage) is provided, and for continuous variables, the mean (standard deviation) is provided.
c Reported as the number of days in the past week. d Dichotomous variable indicates the proportion responding yes. e Response categories were converted to a dichotomous variable, with 0 = “never” or “seldom” and 1 = “sometimes,” “most of the time,” or “almost always.” f Index score (0–7) based on reported household availability of seven fruits and vegetables. g Two centers were included in both the spring and summer intervention waves.
Notes: Standard errors (SEs) and t-statistic used to test the assumption of no difference between the spring and summer waves were derived from model-based comparisons adjusted for clustering of students within centers.
Source: Parent Baseline Survey, spring wave data collected February–March 2010 and summer wave data collected May 2010.

Table E-4. Baseline Outcome Measures for the Evaluation of the All 4 Kids Program, by Condition
Measurea
Baseline Means (SE)
Difference t-statistic p-value Intervention Group Comparison
Group Primary outcomes (at-home consumption)
Cups of fruits and vegetables 2.45 (0.1491) 2.32 (0.1457) 0.13 0.64 0.5379 Cups of fruits 1.37 (0.0826) 1.32 (0.0805) 0.06 0.49 0.6368 Cups of vegetables 1.09 (0.0758) 1.00 (0.0737) 0.08 0.79 0.4467
Child’s other dietary behaviors Ate variety of fruitsb 4.54 (0.1599) 4.56 (0.1524) −0.02 −0.08 0.9381 Ate variety of vegetablesb 3.31 (0.2245) 3.45 (0.2177) −0.14 −0.45 0.6625 Helped self/requested fruit as snackb 3.59 (0.2043) 3.55 (0.1966) 0.04 0.13 0.9000 Helped self/requested vegetable as snackb 1.20 (0.1145) 1.28 (0.1089) −0.08 −0.50 0.6251 Willingness to try new fruitsc 55.53 (3.1453) 60.80 (2.9855) −5.27 −1.22 0.2518 Willingness to try new vegetablesc 41.98 (2.8835) 41.16 (2.7253) 0.82 0.21 0.8402 Child asked for fruits or vegetables instead of at
French fries at least some of the time when eating at fast food restaurantsd
39.15 (2.4269) 41.22 (2.3442) −2.07 −0.61 0.5534
Parent behavior and household variables Availability of fruits and vegetablese 3.97 (0.1486) 4.00 (0.1457) −0.03 −0.12 0.9058 Parent offered fruit as snackb 4.10 (0.1567) 4.16 (0.1489) −0.06 −0.29 0.7753 Parent offered fruit at dinnerb 1.54 (0.1550) 1.60 (0.1483) −0.06 −0.27 0.7906 Parent offered vegetable as snackb 1.69 (0.1509) 1.87 (0.1447) −0.18 −0.87 0.4032 Parent offered vegetable at dinnerb 2.75 (0.4406) 3.28 (0.4360) −0.53 −0.86 0.4094 Parent made child eat everything on his/her plateb 3.52 (0.1836) 3.21 (0.1738) 0.31 1.21 0.2552 Parent ordered fruits or vegetables for child instead of
French fries at least some of the time when eating at fast food restaurantsd
42.33 (4.3408) 55.04 (4.2118) −12.70 −2.10 0.0621
Number of respondents 294 328 Number of centers 6 6
a Based on continuous measures of the identified construct, unless otherwise indicated. b Reported as the number of days in the past week. c Dichotomous variable indicates the proportion responding yes. d Response categories were converted to a dichotomous variable, with 0 = “never” or “seldom” and 1 = “sometimes,” “most of the time,” or “almost always.” e Index score (0–7) based on reported household availability of seven fruits and vegetables.
Note: Standard errors (SEs) and t-statistic used to test the null hypothesis of no difference between intervention and comparison groups were derived from model-based comparisons adjusted for clustering of students within centers.
Source: Parent Baseline Survey, spring wave data collected February–March 2010 and summer wave data collected May 2010.

Table E-5. Unadjusted Baseline Means of Participants Providing Post-intervention Follow-Up Data for the Evaluation of the All 4 Kids Program, by Condition
Measurea
Baseline Means (SE)
Difference t-statistic p-value Intervention
Group Comparison
Group Primary outcomes (daily at-home consumption)
Cups of fruits and vegetables 2.45 (0.1519) 2.30 (0.1479) 0.15 0.69 0.5053 Cups of fruits 1.38 (0.0886) 1.30 (0.0863) 0.08 0.65 0.5281 Cups of vegetables 1.08 (0.0748) 1.00 (0.0723) 0.08 0.73 0.4814
Child’s other dietary behaviors at home Ate variety of fruitsb 4.50 (0.1864) 4.54 (0.1782) −0.04 −0.15 0.8868 Ate variety of vegetablesb 3.30 (0.2654) 3.45 (0.2583) −0.15 −0.41 0.6877 Helped self/requested fruit as snackb 3.48 (0.1766) 3.37 (0.1684) 0.12 0.47 0.6464 Helped self/requested vegetable as snackb 1.24 (0.1135) 1.31 (0.1082) −0.07 −0.44 0.6721 Willingness to try new fruitsc 59.02 (3.1187) 62.41 (2.9876) −3.39 −0.78 0.4511 Willingness to try new vegetablesc 44.24 (2.9591) 44.62 (2.8391) −0.38 −0.09 0.9286 Child asked for fruits and vegetables instead of
French fries at least some of the time when eating at fast food restaurantsd
38.83 (3.3186) 42.60 (3.2031) −3.77 −0.82 0.4329
Parent behavior and household variables Availability of fruits and vegetablese 3.99 (0.1625) 4.07 (0.1590) −0.09 −0.38 0.7133 Parent offered fruit as snackb 4.09 (0.1530) 4.14 (0.1459) −0.05 −0.26 0.8004 Parent offered fruit at dinnerb 1.55 (0.1322) 1.68 (0.1271) −0.12 −0.68 0.5111 Parent offered vegetable as snackb 1.74 (0.1606) 1.83 (0.1538) −0.09 −0.41 0.6888 Parent offered vegetable at dinnerb 2.70 (0.4858) 3.30 (0.4807) −0.60 −0.88 0.4005 Parent made child eat everything on his/her plateb 3.53 (0.2176) 3.11 (0.2071) 0.42 1.39 0.1957 Parent ordered fruits or vegetables for child instead of
French fries at least some of the time when eating at fast food restaurantsd
41.74 (5.0075) 54.22 (4.8608) −12.48 −1.79 0.1041
Number of respondents 244 267 Number of centers 6 6
a Based on continuous measures of the identified construct, unless otherwise indicated. b Reported as the number of days in the past week. c Dichotomous variable indicates the proportion responding yes. d Response categories were converted to a dichotomous variable, with 0 = never or seldom and 1 = sometimes, most of the time, or almost always. e Index score (0–7) based on reported household availability of seven fruits and vegetables. Note: Standard errors (SEs) and t-statistic used to test the null hypothesis of no difference between intervention and comparison groups were derived from
model-based comparisons adjusted for clustering of students within centers. Source: Parent Baseline Survey, spring wave data collected February–March 2010 and summer wave data collected May 2010.

Table E-6. Unadjusted Post-test Means for the Evaluation of the All 4 Kids Program, by Condition
Measurea
Post-test Means (SE)
Difference t-statistic p-value Intervention
Group Comparison
Group
Primary outcomes (daily at-home consumption) Cups of fruits and vegetables 3.04 (0.1161) 2.88 (0.1107) 0.16 0.98 0.3517 Cups of fruits 1.71 (0.0587) 1.54 (0.0560) 0.17 2.05 0.0672 Cups of vegetables 1.32 (0.0701) 1.34 (0.0671) −0.02 −0.18 0.8572
Child’s other dietary behaviors at home Ate variety of fruitsb 4.39 (0.1782) 4.34 (0.1708) 0.05 0.19 0.8539 Ate variety of vegetablesb 3.60 (0.1488) 3.56 (0.1424) 0.04 0.21 0.8349 Helped self/requested fruit as snackb 3.64 (0.1740) 3.47 (0.1663) 0.17 0.72 0.4880 Helped self/requested vegetable as snackb 1.92 (0.1545) 1.63 (0.1473) 0.29 1.34 0.2086 Willingness to try new fruitsc 65.15 (3.3423) 58.76 (3.1974) 6.38 1.38 0.1976 Willingness to try new vegetablesc 52.07 (3.2727) 42.48 (3.1179) 9.59 2.12 0.0598 Child asked for fruits or vegetables instead of French fries
at least some of the time when eating at fast food restaurantsd
53.08 (3.2900) 49.39 (3.0199) 3.69 0.83 0.4280
Parent behavior and household variables Availability of fruits and vegetablese 4.54 (0.1824) 4.49 (0.1788) 0.05 0.19 0.8562 Parent offered fruit as snackb 4.03 (0.1541) 4.11 (0.1469) −0.07 −0.35 0.7344 Parent offered fruit at dinnerb 2.18 (0.1353) 2.20 (0.1291) −0.02 −0.12 0.9053 Parent offered vegetable as snackb 2.18 (0.1593) 2.16 (0.1523) 0.02 0.10 0.9210 Parent offered vegetable at dinnerb 3.04 (0.3861) 3.28 (0.3803) −0.23 −0.43 0.6745 Parent made child eat everything on his/her plateb 3.32 (0.2629) 2.88 (0.2524) 0.44 1.20 0.2574 Parent ordered fruits or vegetables for child instead of
French fries at least some of the time when eating at fast food restaurantsd
57.65 (4.3440) 57.45 (4.0571) 0.20 0.03 0.9736
Number of respondents 244 267 Number of centers 6 6
a Based on continuous measures of the identified construct, unless otherwise indicated. b Reported as the number of days in the past week. c Dichotomous variable indicates the proportion responding yes. d Response categories were converted to a dichotomous variable, with 0 = never or seldom and 1 = sometimes, most of the time, or almost always. e Index score (0–7) based on reported household availability of seven fruits and vegetables. Note: Standard errors (SEs) and t-statistic used to test the null hypothesis of no difference between intervention and comparison groups were derived from
model-based comparisons adjusted for clustering of students within centers.
Source: Parent Follow-Up Survey, spring wave data collected May–June 2010 and summer wave data collected August–September 2010.

Table E-7. Attrition Analysis for the Evaluation of the All 4 Kids Program
Estimated Odds Ratioa
95% Wald Confidence Limits
Characteristic Lower Upper p-value
Child demographics
Sex
Male (reference group) 1.00 — — —
Female 0.86 0.56 1.31 0.4717
Age 1.01 0.72 1.41 0.9698
Parentb/household demographics
Respondent’s age
18 to 34 (reference group) 1.00 — — —
35 to 44 0.64 0.40 1.03 0.0677
45 or older 3.72* 1.07 12.94 0.0387
Respondent’s sex
Male (reference group) 1.00 — — —
Female 0.43** 0.25 0.75 0.0030
Respondent’s ethnicity
Hispanic or Latino 2.86** 1.45 5.64 0.0024
Black non-Hispanic 2.13 0.99 4.62 0.0540
White, non-Hispanic (reference group) 1.00 — — —
Other or more than one racec 11.63* 1.38 97.82 0.0240
Size of household 0.99 0.89 1.11 0.8870
*Indicates statistical significance if the p-value is less than or equal to 0.05.
**Indicates statistical significance if the p-value is less than or equal to 0.01. a Estimate (with 95% confidence limits) indicates the odds ratio of completers to noncompleters. b Represents the parent/caregiver who completed the survey. c Includes respondents who selected Asian, Native Hawaiian/Pacific Islander, Native American/Native Alaskan, or
more than one race category. Estimate for odds ratio questionable because of small cell size. e Attrition analysis includes 503 completers (provided follow-up data) and 109 noncompleters (did not provide
follow-up data).
Notes: Generalized linear mixed model (SAS PROC GLIMMIX) was used to evaluate program attrition while accounting for the clustering of students within centers. Dichotomous participation indicator (based on availability of post-intervention data) was regressed on child and parent demographic characteristics and household descriptors. CI = confidence interval.
Source: Parent Follow-Up Survey, spring wave data collected May–June 2010 and summer wave data collected August–September 2010.


Appendix F Impact Evaluation Analysis of the Treated


All 4 Kids UNCE ● Program Evaluation
List of Contents Table F-1. Demographic Characteristics for Analysis of the Treated for Parent Respondents and their
Children Who Participated in the All 4 Kids Program Evaluation Study, by Condition
Table F-2. Child’s Dietary Intake for Analysis of the Treated: Primary Impacts for the Evaluation of the All 4 Kids Program
Table F-3. Child’s Other Dietary Behaviors for Analysis of the Treated: Secondary Impacts for the Evaluation of the All 4 Kids Program
Table F-4. Parent Offerings and Fruit and Vegetable Availability in Households for Analysis of the Treated: Secondary Impacts for the Evaluation of the All 4 Kids Program


Table F-1. Demographic Characteristics for Analysis of the Treated for Parent Respondents and their Children Who Participated in the All 4 Kids Program Evaluation Study, by Condition
Characteristic Intervention Group (SE)
Comparison Group (SE) Difference t-statistic p-value
Child demographics
Sex, % male 48.56 (3.4713) 48.67 (3.2262) −0.11 −0.02 0.9822
Age 4.64 (0.0750) 4.57 (0.0724) 0.06 0.61 0.5568
Parenta/household demographics
Respondent’s age, %
18 to 34 71.72 (3.7603) 69.63 (3.5334) 2.10 0.41 0.6929
35 to 44 21.30 (2.7176) 21.80 (2.5270) −0.50 −0.13 0.8955
45 or older 7.56 (2.4808) 8.97 (2.3489) −1.41 −0.41 0.6879
Respondent’s sex , % male 15.94 (2.5613) 8.86 (2.3975) 7.08 2.02 0.0711
Respondent’s ethnicity, %
Hispanic or Latino 69.19 (8.0913) 65.56 (7.9670) 3.63 0.32 0.7560
Not Hispanic or Latino 30.81 (8.0913) 34.44 (7.9670) −3.63 −0.32 0.7560
Respondent’s race, %
American Indian or Alaska Native 0.85 (1.1670) 2.34 (1.1205) −1.50 −0.92 0.3768
Asian 2.54 (1.3036) 1.56 (1.2516) 0.98 0.54 0.5995
Black or African American 44.99 (7.8217) 38.14 (7.5879) 6.85 0.63 0.5437
Native Hawaiian or other Pacific Islander 3.59 (1.7894) 0.81 (1.7145) 2.77 1.12 0.2897
White 46.07 (8.0004) 51.65 (7.7630) −5.58 −0.50 0.6273
More than one raceb 2.54 (1.8204) 5.47 (1.7478) −2.93 −1.16 0.2731
Size of household 5.02 (0.2420) 5.01 (0.2334) 0.01 0.02 0.9807
Single-adult household, % 17.78 (4.6751) 15.45 (4.5342) 2.32 0.36 0.7286
Language spoken by family at home, %
Speak English all of the time 28.79 (9.5163) 32.13 (9.4197) −3.33 −0.25 0.8084
Speak English some of the time and speak another language some of the time
55.25 (6.5200) 54.51 (6.3314) 0.74 0.08 0.9365
Speak another language all of the time 16.20 (4.8842) 13.91 (4.7456) 2.29 0.34 0.7437
(continued)

Table F-1. Baseline Demographic Characteristics for Analysis of the Treated for Parent Respondents and their Children who Participated in the All 4 Kids Program Evaluation Study, by Condition (continued)
Characteristic Intervention Group (SE)
Comparison Group (SE) Difference t-statistic p-value
Center-provided food, %
Received no food from center 4.91 (1.3420) 2.72 (1.2485) 2.19 1.20 0.2589
Received snacks only 5.81 (2.2837) 4.05 (2.1771) 1.76 0.56 0.5897
Received one meal (breakfast or lunch)c 37.44 (4.3832) 34.18 (4.1457) 3.26 0.54 0.6007
Received two meals (breakfast and lunch)c 52.77 (5.9895) 59.13 (5.7842) −6.36 −0.76 0.4629
Number of respondents 230 267
Number of centers 6 6
a Represents the parent/caregiver who completed the survey. b Includes respondents who selected more than one race category. c Some in this category also report receiving center-provided snacks.
Note: Standard errors (SEs) and t-statistic used to test the null hypothesis of no difference between intervention and comparison groups were derived from model-based comparisons adjusted for clustering of students within centers. Analysis was limited to respondents whose children were enrolled at Head Start at the end of the intervention (intervention group) and respondents who provided baseline and follow-up data (intervention and comparison groups).
Source: Parent Baseline Survey, spring wave data collected February–March 2010 and summer wave data collected May 2010.

Table F-2. Child’s Dietary Intake for Analysis of the Treated: Primary Impacts for the Evaluation of the All 4 Kids Program
Child’s Dietary Intake (at-home consumption)
Model-Adjusted Baseline Means (SE)
Model-Adjusted Follow-Up Means (SE)
Estimated Impacta (95% CI)
Wald Chi-Square p-value
Intervention Group
Comparison Group
Intervention Group
Comparison Group
Cups of fruits and vegetables 2.42 (0.1454) 2.32 (0.1388) 3.00 (0.1453) 2.92 (0.1388) −0.02 (−0.41, 0.36) 0.9021
Cups of fruits 1.37 (0.0771) 1.31 (0.0732) 1.71 (0.0770) 1.56 (0.0733) 0.08 (−0.17, 0.33) 0.4906
Cups of vegetables 1.05 (0.0788) 1.01 (0.0751) 1.29 (0.0788) 1.36 (0.0752) −0.11 (−0.3, 0.08) 0.2401
Number of respondents 230 267 230 267
Number of centers 6 6 6 6
a Program impact (with 95% confidence limits) estimated via difference-in-difference models comparing change across time in the intervention versus comparison groups. Analysis was limited to respondents whose children were enrolled at Head Start at the end of the intervention (intervention group) and respondents who provided baseline and follow-up data (intervention and comparison groups).
Notes: General linear mixed models (SAS PROC MIXED) were used to evaluate the program impact while accounting for the clustering of students within centers. Covariates in the model included child age, child sex, number of people in the household, respondent race/ethnicity, respondent age, and respondent sex. SE = standard error. CI = confidence interval.
Source: Parent Survey, spring wave: February–March 2010 (Baseline) and May–June 2010 (Follow-Up); summer wave: May 2010 (Baseline) and August–September 2010 (Follow-Up).

Table F-3. Child’s Other Dietary Behaviors for Analysis of the Treated: Secondary Impacts for the Evaluation of the All 4 Kids Program
Child’s Other Dietary Behaviorsa
Model-Adjusted Baseline Means (SE)
Model-Adjusted Follow-Up Means (SE)
Estimated Impactb (95% CI)
Wald Chi-Square p-value
Intervention Group
Comparison Group
Intervention Group
Comparison Group
Ate variety of fruitsc 4.55 (0.2238) 4.56 (0.2145) 4.37 (0.2242) 4.35 (0.2148) 0.04 (−0.43, 0.52) 0.8440
Ate variety of vegetablesc 3.32 (0.2192) 3.43 (0.2094) 3.64 (0.2190) 3.59 (0.2098) 0.16 (−0.3, 0.62) 0.4595
Helped self/requested fruit as snackc
3.50 (0.1656) 3.34 (0.1540) 3.66 (0.1656) 3.44 (0.1542) 0.05 (−0.51, 0.62) 0.8372
Helped self/requested vegetable as snackc
1.24 (0.1400) 1.31 (0.1308) 1.95 (0.1404) 1.64 (0.1310) 0.37 (−0.02, 0.76) 0.0582
Willingness to try new fruitsd 58.86 (0.0390) 62.79 (0.0357) 64.34 (0.0377) 59.49 (0.0365) 1.45 (0.87, 2.42) 0.1387
Willingness to try new vegetablesd 43.23 (0.0369) 44.91 (0.0344) 50.98 (0.0374) 43.62 (0.0343) 1.44 (0.92, 2.24) 0.0970
Child asked for fruits or vegetables instead of French fries at least some of the time when eating at fast food restaurantse
38.94 (0.0356) 41.92 (0.0338) 53.91 (0.0382) 49.66 (0.0347) 1.34 (0.78, 2.31) 0.2569
Number of respondents 230 267 230 267
Number of centers 6 6 6 6
a Based on continuous measures of the identified construct, unless otherwise indicated. b Program impact (with 95% confidence limits) was estimated via difference-in-difference models comparing change across time in the intervention versus
comparison groups. Impact estimates are provided as odds ratios for dichotomous outcomes. Analysis was limited to respondents whose children were enrolled at Head Start at the end of the intervention (intervention group) and respondents who provided baseline and follow-up data (intervention and comparison groups).
c Reported as the number of days in the past week. d Dichotomous variable indicates the proportion responding yes. e Response categories were converted to a dichotomous variable, with 0 = never or seldom and 1 = sometimes, most of the time, or almost always.
Notes: General linear mixed models (SAS PROC MIXED) for continuous impact variables and generalized linear mixed models (SAS PROC GLIMMIX) for dichotomous impact variables were used to evaluate the program impact while accounting for the clustering of students within centers. Covariates in the model included child age, child sex, number of people in the household, respondent race/ethnicity, respondent age, and respondent sex. SE = standard error. CI = confidence interval.
Source: Parent Survey, spring wave: February–March 2010 (Baseline) and May–June 2010 (Follow-Up); summer wave: May 2010 (Baseline) and August–September 2010 (Follow-Up).

Table F-4. Parent Offerings and Fruit and Vegetable Availability in Households for Analysis of the Treated: Secondary Impacts for the Evaluation of the All 4 Kids Program
Parent Behavior and Household Variables
Model-Adjusted Baseline Means (SE)
Model-Adjusted Follow-Up Means (SE)
Estimated Impact (95% CI)a
Wald Chi-Square p-
value Intervention
Group Comparison
Group Intervention
Group Comparison
Group
Availability of fruits and vegetablesb 4.01 (0.1108) 4.09 (0.1052) 4.60 (0.1108) 4.53 (0.1052) 0.15 (−0.16, 0.45) 0.3040
Parent offered fruit as snackc 4.10 (0.1909) 4.15 (0.1808) 4.15 (0.1912) 4.11 (0.1809) 0.09 (−0.38, 0.57) 0.6767
Parent offered fruit at dinnerc 1.60 (0.1501) 1.66 (0.1402) 2.19 (0.1499) 2.20 (0.1396) 0.04 (−0.43, 0.51) 0.8485
Parent offered vegetable as snackc 1.76 (0.1600) 1.84 (0.1506) 2.19 (0.1604) 2.17 (0.1508) 0.10 (−0.4, 0.61) 0.6626
Parent offered vegetable at dinnerc 2.69 (0.2892) 3.19 (0.2810) 3.02 (0.2893) 3.21 (0.2809) 0.31 (−0.2, 0.81) 0.2021
Parent made child eat everything on his/her platec
3.44 (0.2331) 3.20 (0.2229) 3.06 (0.2336) 2.92 (0.2233) −0.11(−0.34, 0.13) 0.3274
Parent ordered fruits or vegetables for child instead of French fries at least some of the time when eating at fast food restaurantsd
44.31 (0.0439) 53.31(0.0418) 58.71(0.0451) 57.39 (0.0419) 1.51 (0.86, 2.68) 0.1350
Number of respondents 230 267 230 267
Number of centers 6 6 6 6
a Program impact (with 95% confidence limits) was estimated via difference-in-difference models comparing change across time in the intervention versus comparison groups. Impact estimates are provided as odds ratios for dichotomous outcomes. Analysis was limited to respondents whose children were enrolled at Head Start at the end of the intervention (intervention group) and to respondents who provided baseline and follow-up data (intervention and comparison groups).
b Index score (0–7) based on reported household availability of seven fruits and vegetables. c Reported as the number of days in the past week. d Response categories were converted to a dichotomous variable, with 0 = never or seldom and 1 = sometimes, most of the time, or almost always.
Notes: General linear mixed models (SAS PROC MIXED) for continuous impact variables and generalized linear mixed models (SAS PROC GLIMMIX) for dichotomous impact variables were used to evaluate the program impact while accounting for the clustering of students within centers. Covariates in the model included child age, child sex, number of people in the household, respondent race/ethnicity, respondent age, and respondent sex. SE = standard error. CI = confidence interval.
Source: Parent Survey, spring wave: February–March 2010 (Baseline) and May–June 2010 (Follow-Up); summer wave: May 2010 (Baseline) and August–September 2010 (Follow-Up).


Appendix G Instruments for Assessment of the Demonstration Project’s Evaluation


All 4 Kids UNCE ● Program Evaluation
List of Contents G.1: Pre-evaluation Interview Guide for Evaluation Lead
G.2: Review Form for Assessment of the Demonstration Project’s Evaluation
G.3: Outline for Demonstration Project’s Evaluation
G.4: Post-evaluation Interview Guide for Evaluation Lead
G.5: Resource and Expense Tracking Form


All 4 Kids UNCE ● Program Evaluation
G.1: Pre-evaluation Interview Guide for Evaluation Lead


Discussion Guide for Implementing Agency Evaluation Manager
[Pre-Implementation]
State: ________________________ Interviewer: ______________ Respondent: ________________________ Date of Interview: ______________ Title: ________________________ Study ID No: ______________ Organization: ________________________ Address: ________________________ ________________________ ________________________ Phone: ________________________ Fax: ________________________ Email: ________________________
Thank you for taking the time for this interview. The U.S. Department of Agriculture’s Food and Nutrition Service has contracted with Altarum Institute to conduct a study of the All 4 Kids program. Altarum is a health and nutrition policy research and consulting institute and our work focuses on helping to improve the health and nutrition status of children, families, and adults. This study will include not only outcome evaluation information but also process information on how it is being implemented and how you are evaluating the intervention. All of this will be useful to both FNS and to other SNAP-Ed implementing agencies that are planning to evaluate their own SNAP-Ed interventions.
We will be using first names only today. Everything you say will be kept private. After we conduct several of these interviews, we will write a report for the U.S. Department of Agriculture’s Food and Nutrition Service. Your name will not appear anywhere in the report. Nothing said today will be attached to your name at any point. Nothing that you say will affect your job or be shared with your employers.
I expect that our discussion today will take 30 minutes. Before I begin, do you have any questions?
Overview of IA-Led Evaluation Design, Budget and Staffing
Several weeks ago we reviewed the IA application submitted to FNS, 2010 SNAP-Ed Plan, and additional updated materials you have provided to us about your evaluation plans.
OMB No. 0584-0554 Expiration date: 01/31/2013 Public reporting burden for this collection of information is estimated to average 30 minutes per response, including the time for reviewing instructions, searching existing data sources, gathering and maintaining the data needed, and completing and reviewing the collection of information. An agency may not conduct or sponsor, and a person is not required to respond to, a collection of information unless it displays a currently valid OMB control number. Send comments regarding this burden estimate or any other aspect of this collection of information, including suggestions for reducing this burden, to: U.S. Department of Agriculture, Food and Nutrition Services, Office of Research and Analysis, Room 1014, Alexandria, VA 22302 ATTN: PRA (0584-0554). Do not return the completed form to this address.

1. We want to be sure we understand your staffing plan for the evaluation. Which project staff or other staff will be responsible for conducting the evaluation? Please name staff and time allotted and if they will be involved in data collection only, data analysis only, in project implementation, or in any combination of these three activities.
2. Will any quality control or monitoring take place during data collection? If so, please describe.
Evaluation Planning Phase
Now let’s briefly talk about your experiences in the design and planning phase for this evaluation.
1. What challenges, if any, have you faced during the design and planning phases of this evaluation?
2. What factors do you feel have contributed most to a successful design and planning phase?
3. What lessons have you learned during this key phase of the evaluation design? What would you do differently? What would you do the same?
4. How will data be inputted from the various evaluation instruments?
5. Can you please tell me how you will collect reach and dosage of the intervention? The format for the activity logs (most updated) you plan to use to document the reach and dosage of your lessons and family activity nights in each classroom and center.
• Ultimately- we would like to know number of unduplicated children who attended at least one lesson and the number of children who attended each lesson by classroom.
• Ex: Classroom X (3 yr old room , teacher name) # of kids
• Classroom Y (4 yr old room, teachers name) # of kids
Anticipated Challenges for Implementation
1. What challenges do you anticipate for this evaluation as you now approach your initial evaluation data collection phase?
Dissemination of Evaluation Results
1. When do you expect to complete data collection?
2. When do you anticipate that you will complete data analysis?
3. How do you intend to use and/or disseminate your evaluation results?
4. Do you have an updated evaluation plan to share with us?
That ends my formal interview questions. Do you have any information about your evaluation plans, comments or recommendations that you would like to add?
Thank you very much for your time and input on this very important project.

All 4 Kids UNCE ● Program Evaluation
G.2: Review Form for Assessment of the Demonstration Project’s Evaluation


ASSESSMENT OF IA-LED IMPACT EVALUATION
REVIEW FORM
To develop the evaluation review form, we started by emulating the data abstraction form that the Center for Substance Abuse Prevention (CSEP) used in development of the National Registry of Evidence-based Programs and Practices (NREPP) database, a service of the Substance Abuse and Mental Health Services Administration (SAMHSA; http://www.nrepp.samhsa.gov/). Then we compared the data abstraction form against the Society for Prevention Research Standards of Evidence criteria to ensure that the review form captured all relevant evaluation components (http://www.preventionresearch.org/StandardsofEvidencebook.pdf). We expect raters to complete this review form after reading Implementing Agencies’ (IA) State SNAP Ed Annual Final Reports and information extracted from other data sources as indicated in the accompanying matrix. We plan to collect much of the data for this review from data abstractions of IAs’ applications and evaluation reports. Other data will be obtained from in-depth interviews with the evaluation manager at each of the IA sites. Implementing Agency: ____________________________________
Reviewer: ____________________________________ Date: __________________
Rating scale
The evaluation component being rated…
Not Acceptable
1 …is missing or so poorly described that its value to the evaluation cannot be determined.
2 …is inappropriate, misunderstood, or misrepresented in such a way that it cannot contribute to an effective evaluation of the program. The actions or materials reported are not appropriate from the evaluation effort proposed.
3 …shows a general understanding of its role in the evaluation. However, key details have been overlooked or not thoroughly reported. Needs moderate revision to be considered acceptable.
Acceptable
4 …is appropriate for the evaluation, technically correct, and is described well enough to show a general understanding of its role in the overall evaluation. Evidence shows that it will or has been implemented properly, but minor details may be missing or unclear.
5 …is appropriate for the program being evaluated and is presented in a way that shows the evaluator has a clear understanding of its role in the evaluation.

A. Research Objectives and Hypotheses Score: _____________________
• Clarity of research questions/hypotheses the evaluation is addressing o Are the objectives stated in SMART terms (specific, measurable, achievable,
realistic, time-bound)? o A clear theory of causal mechanisms should be stated.
• Alignment of evaluation goals and objectives with intervention activities o Do the objectives/hypotheses include endpoints that are behavioral, meaningful,
and related to the program’s theory of change?
B. Viable Comparison Strategy Score: _____________________ (Outcome Evaluation Research Design)
Note: under no circumstances should self-selection into treatment or control be viewed as an acceptable method for developing a comparison strategy.
• Appropriateness of the control or comparison group o Are the members of the control/comparison groups likely to be similar to the
members of the treatment group? Is the study an experimental (randomized) or a quasi-experimental (non-randomized) design? Does this strategy make sense in the context of the treatment program?
• Threats to the validity of the design o Have plausible threats to validity (i.e., factors that permit alternative
explanations of program outcomes) been discussed? o The evaluator must be able to rule out other factors that could explain changes,
such as competing programs, concurrent media campaigns, and the effects of maturation among evaluation participants.
o Absent true randomization, there is additional onus on the program to identify and rule out alternative explanations of program effects.

C. Sampling Size/Sampling Strategy Score: ______________________
• Sample size estimations o Should be supported by power analysis that indicates the sample is sufficient to
detect statistically significant differences in outcomes between treatment and control/comparison groups.
o The power analysis should be matched to the outcome evaluation design. It should be based on an anticipated program effect size that is empirically valid (i.e., drawn from published literature or pilot work).
• Method of selecting sample participants from the population. o Should specify what/who the sample is and how it was obtained. Should be
detailed and provide a reasonable basis for generalization of program effects to the broader population of people ‘like those’ in the study.
• Recruitment plans. o Description of steps to be taken by project staff to increase the likelihood that
members of the target population approached by the program will agree to participate in the program NOTE: no program will have 100% recruitment, but rates below 70% - 80% should be closely examined for justification.
D. Outcome Measures Score: ______________________
• Quality of the data collection instruments (surveys, interviews) o Information on reliability (internal consistency (alpha), test-retest reliability,
and/or reliability across raters) and construct validity of measures should be provided.
o When possible, the use of scales is preferable to single item measures.
• Alignment of evaluation measures with the intervention activities. o Outcome measures assess actual behavior change. o Outcome measures should map onto research objectives/hypotheses o Higher scores should be considered for measures that include intermediate
factors in the behavior change process.
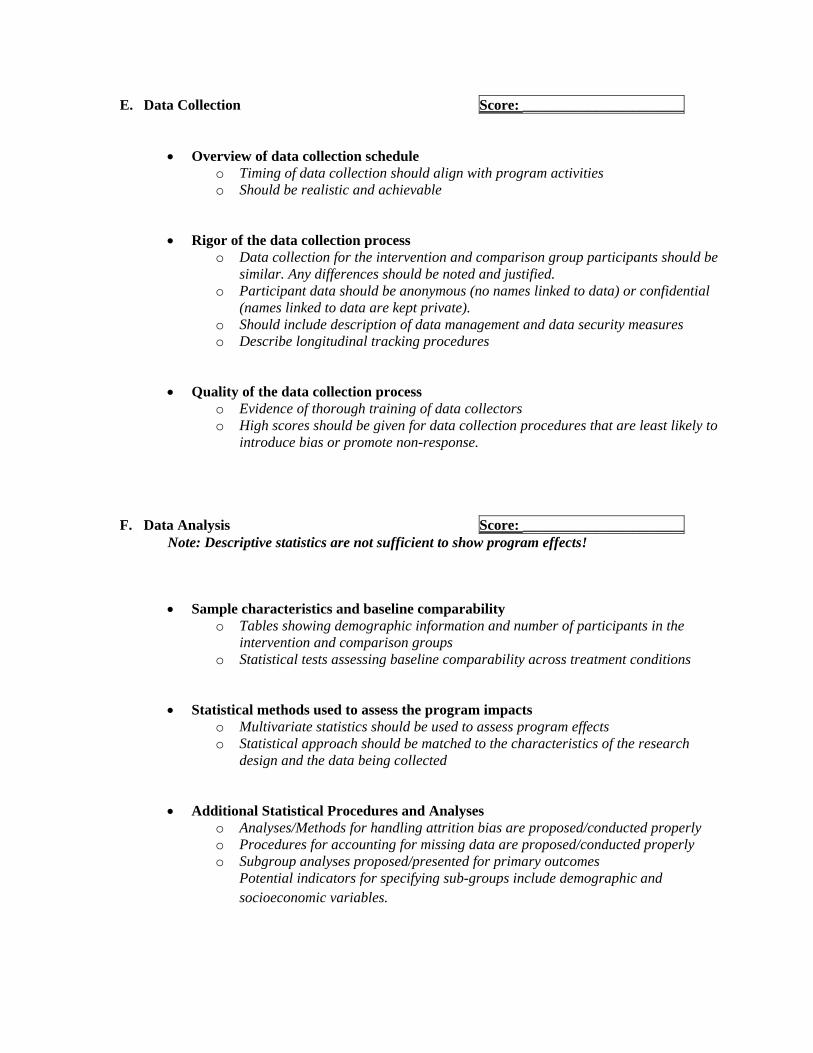
E. Data Collection Score: ______________________
• Overview of data collection schedule o Timing of data collection should align with program activities o Should be realistic and achievable
• Rigor of the data collection process o Data collection for the intervention and comparison group participants should be
similar. Any differences should be noted and justified. o Participant data should be anonymous (no names linked to data) or confidential
(names linked to data are kept private). o Should include description of data management and data security measures o Describe longitudinal tracking procedures
• Quality of the data collection process o Evidence of thorough training of data collectors o High scores should be given for data collection procedures that are least likely to
introduce bias or promote non-response.
F. Data Analysis Score: ______________________ Note: Descriptive statistics are not sufficient to show program effects!
• Sample characteristics and baseline comparability o Tables showing demographic information and number of participants in the
intervention and comparison groups o Statistical tests assessing baseline comparability across treatment conditions
• Statistical methods used to assess the program impacts o Multivariate statistics should be used to assess program effects o Statistical approach should be matched to the characteristics of the research
design and the data being collected
• Additional Statistical Procedures and Analyses o Analyses/Methods for handling attrition bias are proposed/conducted properly o Procedures for accounting for missing data are proposed/conducted properly o Subgroup analyses proposed/presented for primary outcomes
Potential indicators for specifying sub-groups include demographic and socioeconomic variables.

G. Attrition (loss of participants) Score: ______________________
• Attrition is program drop out. It is the differences between the number of participants completing baseline survey and the number completing the post-intervention and follow-up survey(s). Modest attrition should be anticipated in the design. Lowest scores given for extraordinary attrition rates.
H. Missing Data (incomplete survey/items) Score: ______________________
• Missing data is survey non-response. It represents the absence of, or gaps in, information from participants who remain involved in the evaluation. Lowest scores given for a large amount of missing data.


All 4 Kids UNCE ● Program Evaluation
G.3: Outline for Demonstration Project’s Evaluation

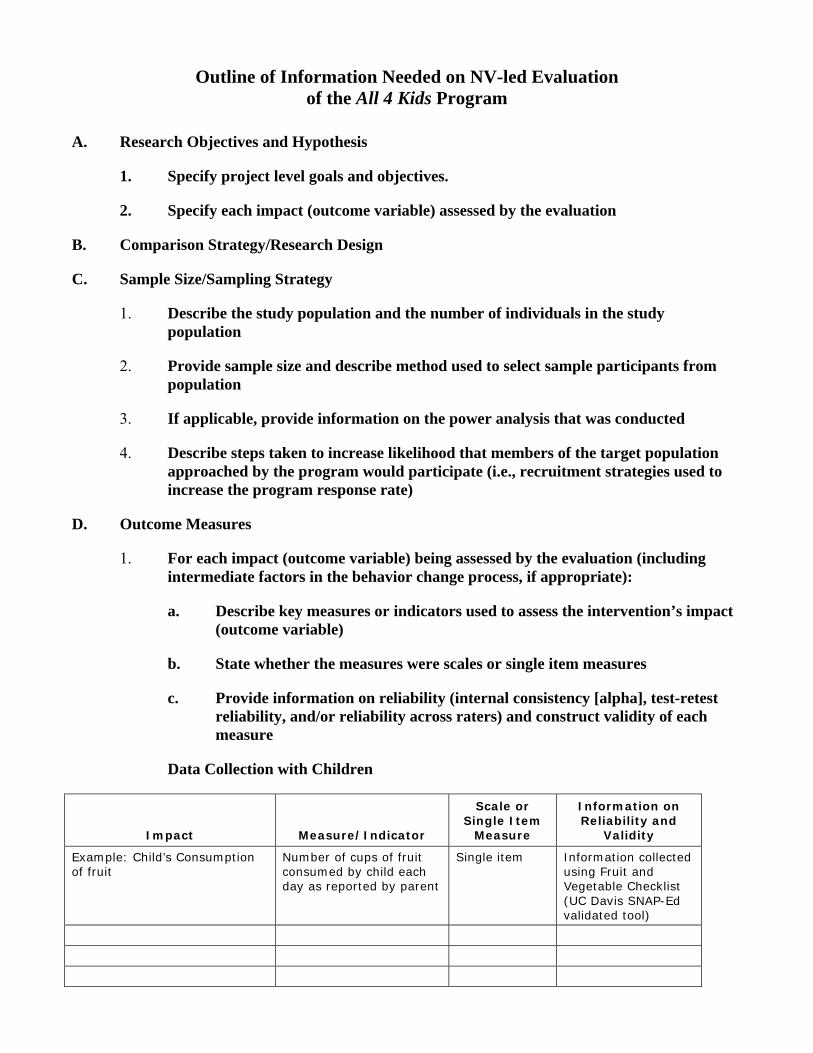
Outline of Information Needed on NV-led Evaluation of the All 4 Kids Program
A. Research Objectives and Hypothesis
1. Specify project level goals and objectives.
2. Specify each impact (outcome variable) assessed by the evaluation
B. Comparison Strategy/Research Design
C. Sample Size/Sampling Strategy
1. Describe the study population and the number of individuals in the study population
2. Provide sample size and describe method used to select sample participants from population
3. If applicable, provide information on the power analysis that was conducted
4. Describe steps taken to increase likelihood that members of the target population approached by the program would participate (i.e., recruitment strategies used to increase the program response rate)
D. Outcome Measures
1. For each impact (outcome variable) being assessed by the evaluation (including intermediate factors in the behavior change process, if appropriate):
a. Describe key measures or indicators used to assess the intervention’s impact (outcome variable)
b. State whether the measures were scales or single item measures
c. Provide information on reliability (internal consistency [alpha], test-retest reliability, and/or reliability across raters) and construct validity of each measure
Data Collection with Children
Impact Measure/Indicator
Scale or Single Item
Measure
Information on Reliability and
Validity
Example: Child’s Consumption of fruit
Number of cups of fruit consumed by child each day as reported by parent
Single item Information collected using Fruit and Vegetable Checklist (UC Davis SNAP-Ed validated tool)

Data Collection with Parents
Impact Measure/Indicator
Scale or Single Item
Measure
Information on Reliability and
Validity
E. Data Collection
1. Describe data collection methods and timing of pre- and-post intervention data collection
2. Note and describe any differences in data collection for the intervention and control group participants
3. Describe procedures used to track participants longitudinally
4. Describe training provided to data collectors
5. Provide information on survey response rates at pre- and post-intervention
F. Data Analysis
1. Provide table showing demographic information for all participants and number of participants in the intervention and control group. Describe tests of statistical significance to assess baseline comparability across treatment and control groups. Table 1 provides a suggested format for providing this information.
2. For each outcome measure, compare intervention and control groups at pre- and post-intervention, the number of participants measured at each time period, and the program impact (i.e., difference in the change for the intervention and control groups). Describe tests of statistical significance and their results. Table 2 provides a suggested format for providing this information for means and Table 3 provides a suggested format for providing this information for percentages.
3. Describe modeling approach (model specification) used, including variables included in the model, software package used, and estimation procedures
G. Attrition
1. Describe analyses and methods used to handle attrition bias, if any
2. If conducted, provide results of attrition analyses. (For example, indicate if any characteristics distinguished between participants lost to attrition and those who completed the post-intervention data collection.)

H. Missing Data (item non-response)
1. Describe procedures used to account for missing data, if any
2. Provide amount of missing data on an item-by-item basis for the demographic and outcome variables included in the model (# of cases, % missing)
Table 1. Suggested Format for Providing Information on the Demographic Characteristics of the Full Sample and Comparisons between Intervention and Control Groups at Baseline
Characteristic Full Sample
(N = 484) Intervention
(n = 246) Control (n = 238) χ2 p
Age in years M (SD) 48.29 (14.08)a 48.34 (13.74)a 48.30 (14.50)a 0.07b 0.981
Gender % 3.97 0.052
Female 77.69 81.30 73.73 Male 22.31 18.70 26.27
Etc. a Mean (standard deviation).
b t-values from studentized t-test.

Table 2. Suggested Format for Providing Information on Outcome Measures (Means)
Intervention Control Estimated Impact
(95% CI)a
Wald Chi-square p-
value Pre Post t p Pre Post t p
Outcome
Variable 1
Sample size 246 175 238 169
Mean (SE) 1.42 (0.14) 1.69 (0.15) 1.92 0.057 1.68 (0.21) 1.71 (0.22) 0.17 0.861 0.23 (0.22, 0.24) 0.355
Etc. a Program impact (with 95% confidence limits) estimated via difference-in-difference models comparing change across time in the intervention versus control groups. Ratios of impact estimates of 1.00 indicate no interaction between time and program group (i.e., no program impact).
Table 3. Suggested Format for Providing Information on Outcome Measures (Percentages)
Intervention Control Estimated Impact
(95% CI)a
Wald Chi-square p-
value Pre Post χ2 p Pre Post χ2 p
Outcome
Variable 2
Sample size 246 174 238 168
Percent (SE) 53.91 (4.41) 67.92 (4.13) 7.45 0.059 59.0 (6.33) 62.3 (6.23) 1.50 0.683 10.8 (9.8, 11.8) 0.090
Etc. a Program impact (with 95% confidence limits) estimated via difference-in-difference models comparing change across time in the intervention versus control groups. Ratios of impact estimates of 1.00 indicate no interaction between time and program group (i.e., no program impact).
All 4 Kids UNCE ● Program Evaluation
G.4: Post-evaluation Interview Guide for Evaluation Lead


Discussion Guide for Implementing Agency Evaluation Manager [Post-Implementation]
State: _________________ Interviewer: _____________________ Respondent: _________________ Date of Interview _____________________ Title: _________________ Study ID No: _____________________ Organization: _________________ Address: ________________________ ________________________ ________________________ Phone: ________________________ Fax: ________________________ Email: ________________________
Thank you for taking the time for this interview. As you know, the U.S. Department of Agriculture’s Food and Nutrition Service has contracted with Altarum Institute to conduct a study of the All 4 Kids that is offering information to children and their families about healthy foods to eat and the importance of being active. Altarum is a health and nutrition policy research and consulting institute and our work focuses on helping to improve the health and nutrition status of children, families, and adults.
This study will include not only outcome evaluation information but also process information on how it is being implemented and how you are evaluating the intervention. All of this will be useful to both FNS and to other SNAP-Ed implementing agencies that are planning to evaluate their own SNAP-Ed interventions.
As I mentioned during our last meeting, we will be using first names only today. Everything you say will be kept private. After we conduct several of these interviews, we will write a report for the U.S. Department of Agriculture’s Food and Nutrition Service. Your name will not appear anywhere in the report. Nothing said today will be attached to your name at any point. Nothing that you say will affect your job or be shared with your employers.
I expect that our discussion will take about 1. 5 hours today. Before I begin, do you have any questions?
OMB No. 0584-0554 Expiration date: 1/31/2013 Public reporting burden for this collection of information is estimated to average 30 minutes per response, including the time for reviewing instructions, searching existing data sources, gathering and maintaining the data needed, and completing and reviewing the collection of information. An agency may not conduct or sponsor, and a person is not required to respond to, a collection of information unless it displays a currently valid OMB control number. Send comments regarding this burden estimate or any other aspect of this collection of information, including suggestions for reducing this burden, to: U.S. Department of Agriculture, Food and Nutrition Services, Office of Research and Analysis, Room 1014, Alexandria, VA 22302 ATTN: PRA (0584-0554). Do not return the completed form to this address.

Outcome/Impact related questions for All 4 KIDS
The first set of questions is intended to clarify any information provided in your evaluation report that was unclear or for which we need additional information.
[Ask questions to clarify information provided in evaluation report]
Process Related Questions
Specific Changes from Planned to Actual Evaluation
We would like to know about the specific aspects of your evaluation that might have changed along the way. We want to be able to describe any deviations from the evaluation plan you described to us during our first meeting, and also know why you had to make any specific changes from your plans.
1. The language used to describe your project outcome level objectives varies from what was included in your application to FNS. Can you please describe why?
Table 1. Crosswalk of Final Project Level Outcome objectives to those Originally proposed in All 4 Kids application to FNS.
Original Objectives (based on FNS application)
Final Objectives
1. At the end of the twelve week All 4 Kids program, 80% of the intervention children’s primary caregivers will report that their preschooler increased daily consumption of fruits and vegetables while in their care. 2. At the end of the twelve week All 4 Kids program, 90% of the intervention children’s primary caregivers will report their child engaged in physical activity every day as part of a healthy lifestyle when in their care.
• The All 4 Kids lessons provide physical, social, emotional and cognitive development opportunities for young children through appropriate movement, nutrition, and behavioral concept activities.
• All lessons are designed to promote healthful eating and active lifestyles using messages not traditionally covered by current Head Start curricula.
2. Your original research design called for the evaluation study, accelerometers will be used on a randomly selected subset of 20% or 80 preschoolers. But you report 60 children received the accelerometer. Could you please explain why or identify reasons for this deviation from what was originally planned?
3. Your original research design called for collection of grocery receipts (from both experimental and control group primary caregivers to collect and bring in receipts during week one and week eleven. Receipts from grocery stores, markets and the like as well as from restaurants will be reviewed for fruit and vegetable purchases. These purchases will be compared between the two time points and to responses to other evaluation responses.) Can you describe why the receipt portion of the study was not completed?
4. The pre-school teachers notebooks were reported as most teachers not completing. Can you explain why?
5. Outlined in the FNS proposal was a “post environmental scan of fruits and vegetables” Was that conducted? If so- please include the results.

6. In Table 1: Demographic characteristics of the full sample. There was a significant difference between participated in SNAP ED and not. Can you hypothesize why?
7. Table 11: Crossing the Midline: Indicated improvement in the intervention and control groups. Why do you think that is?
8. In Table 18: Information on Outcome Measures Reported Pre-post. You describe a “ceiling effect” with most responders indicating often and always. Can you hypothesize as to why you observed these results?
9. In Table 19 Info on Outcome Measures reported by Hispanic caregivers pre-post. More of the variables were significant than for the entire sample. Can you hypothesize why?
10. Did you make any changes to your data collection tools based on results from the pilot?
11. Did you make any changes to your planned data collection techniques? What caused these changes?
12. Is there anything about the training for data collectors that you would do differently?
13. What changes, if any, did you make in the methods for protecting participant privacy? What caused these changes?
14. What changes did you make to your data analysis plan? What caused these changes?
a. What changes if any did you make in the staffing for your data collection or staffing for your data analysis?
b. Did you need more or less time than budgeted for staff to spend on the data collection? On the data analysis? Why do you think you needed more/less time than budgeted for these evaluation tasks?
15. Did you have any increased non-personnel costs or resources required for the evaluation? If yes, what additional costs or resources were needed compared to what you planned for?
16. With many programs, there are alternative explanations of program outcomes that need to be ruled out due to plausible threats to validity. Based on your analysis, you saw changes in many items (Healthy snack assessment, 11 of the 12 movement skills, eats fruits and vegetables). Are there any other factors that could explain the changes you observed (e.g. competing programs, concurrent media campaigns, effects of maturation among evaluation participants)?

Lessons Learned
Now we’d like to ask a few questions about lessons learned about your evaluation now that it is complete.
17. Other than those we discussed above, what challenges, if any, have you faced during the implementation of this evaluation?
18. What do you think worked very well in the implementation of your evaluation? What factors contributed to what worked well?
19. What do you think did not work well and what factors contributed to this?
20. What lessons have you learned from conducting this evaluation?
21. Are you planning a future evaluation of your program?
22. Whether or not you are planning a future evaluation, what would you do differently?
23. What would you be sure to do the same?
24. Was your evaluation influenced/impacted at all because of the need to coordinate with an external evaluator? If so, how?
Dissemination Plans
25. Finally, how do you now plan to use and/or disseminate your evaluation results?
That ends my formal interview questions. Do you have any comments or recommendations that you would like to add? Thank you very much for your time and input on this important project.

All 4 Kids UNCE ● Program Evaluation
G.5: Resource and Expense Tracking Form


Project Resource and Expense Tracking Form for UNCE All 4 Kids Program
This data collection form will be used to summarize information about ACTUAL resources used for and expenses related to your evaluation of the All 4 Kids program.
2.1 Summarize actual staff costs (human capital) used for your evaluation a) At the administrative, coordination, oversight level
Title of position Brief description
of responsibilities
FTEs Average salary for this position
Salary range for this position
b) At the evaluator level, IF APPLICABLE
Title of position Brief description
of responsibilities
FTEs Average salary for this position
Salary range for this position

c) IT/Technical Staff, IF APPLICABLE
Title of position Brief description
of responsibilities
FTEs Average salary for this position
Salary range for this position
d) Other
Title of position Brief description
of responsibilities
FTEs Average salary for this position
Salary range for this position
2.2 Describe the ACTUAL physical capital required to evaluate this project
a) Space b) Audio/visual c) Computer/software d) Other

2.3 Please provide the following information for ACTUAL expenditures related to the evaluation of your SNAP-Ed intervention only (NOT FOR IMPLEMENTATION)
Expenses (a) Non‐Federal
Public Funds (b) Non‐Federal, Non‐cash
(c) Total Non‐Federal Funds (a+b)
(d) Federal Funds
Total Funds (c+d)
Cash In‐kind
Donations
1. Salary/benefits
2. Contracts/grants agreements
3. Non-capital equipment/ supplies
4. Materials
5. Travel
6. Administrative
7. Building/space
8. Maintenance
9. Equipment and other capital expenditures
10. TOTAL Direct Costs
11. Indirect costs
12. TOTAL Costs


Appendix H Process Evaluation Methodology

Process Evaluation Methodology
As described in chapter I, the following six broad research questions provided the framework for the process evaluation design and approach:
• What are the demonstration project’s overall objectives and approach? • How was the intervention implemented and administered? • How many people did the intervention reach and how much exposure did participants have to it? • What resources and associated costs were needed for the intervention? • What are the challenges, facilitators, and lessons learned regarding implementation and
administration of the intervention? • What feedback do participants have about the implementation of and their satisfaction with the
intervention?
These broad research questions and more specific indicators, also described in chapter I, guided the design of the All 4 Kids evaluation, including respondent samples, instrument development, data collection procedures, response rates, and analysis approach, all of which are described in detail in the following sections. The distinctive characteristics of this program, as well as their influence on the tailored research design, are summarized in exhibit VI-1.
1. Research Design and Data Sources
The Food and Nutrition Service (FNS) process evaluation methodology was designed to ensure comparable data collection across the four demonstration projects while allowing for project-specific tailoring of the approach based on the unique aspects of each of the four demonstration projects. The research design for the All 4 Kids process evaluation was primarily qualitative in approach and allowed for the systematic collection of information that could best inform the research questions posed in the previous section.

Exhibit VI-1.— Characteristics of the All 4 Kids Program that Contribute to a Tailored Evaluation Research Design
Characteristic Implications for Research Design
1 Many families at the centers where All 4 Kids is conducted do not use English as their primary language.
Because of the prevalence of Spanish speakers in the All 4 Kids target audience, University of Nevada Cooperative Extension (UNCE) translated all of their nutrition education materials into Spanish and utilized bilingual teaching and data collection staff. Further, family activities at three of the four sites in the spring wave and three of the four sites in the summer wave were taught in English and Spanish as the majority of parents were Spanish speaking. For this reason, process evaluation interviews and focus groups were conducted in Spanish at the sites with a predominantly Spanish-speaking staff and parents.
2 There were two waves of data collection— spring and summer.
To reach the number of participants needed to achieve adequate power, the All 4 Kids program was implemented in two waves—one in the spring and one in the summer. The process evaluation focused on the spring wave for primary data collection. All pre-intervention interviews took place prior to the spring wave. Post-intervention interviews for the childcare center staff and parent focus groups were conducted at the end of the spring wave. Six of the nutrition education observations occurred during the spring wave. Four nutrition observations were also performed during the summer wave. All post-intervention interviews with the All 4 Kids staff transpired at the end of the summer wave.
To address each of the research questions it was necessary to gather both objective and subjective information, as such, the process evaluation team acquired and assessed data from secondary and primary data sources using multiple methods, including data abstraction; in-depth, open-ended interviews with stakeholders; direct nutrition education observation; focus groups with parents and caregivers who participated in the Family Activity sessions; and paper questionnaires designed to collect information on other nutrition education activities. Exhibit VI-2 summarizes how various sources were used to inform the seven broad process-related research questions by providing a crosswalk of data sources—both secondary and primary—to the indicators that were collected and analyzed for the All 4 Kids demonstration project. More detail on the specific secondary and primary sources of information for the process evaluation is provided below.

Exhibit VI-2.— Crosswalk of Process Evaluation Research Questions and Indicators to All 4 Kids Data Sources
Research Questions and Indicators
Secondary Data
Sources
Primary Data Sources
Principal Investigators and Program
Officer Direct
Educators
Head Start Directors
and Classroom Teachers
Parent and Caregivers
Nutrition Education
Observation
What were the demonstration project’s overall objectives and approach?
Target audience and intended reach
Intended effects
Method and setting of education delivery
Theoretical underpinnings
Project development timeline
Formative research and pilot testing
Number and topic of lessons
Key nutrition education messages and activities
Education dose and intensity
Types and sources of nutrition education materials
How was the intervention implemented and administered?
Management and oversight structure
Partnerships
Direct educators’ qualifications, characteristics, or training
Recruitment approach (for intervention sites, for parents)
Quality control and monitoring procedures
How many people did the intervention reach and how much exposure did participants have to it?
Number of participating schools and classrooms
Number and demographics of participating children
Indirect education reach and dose
continued
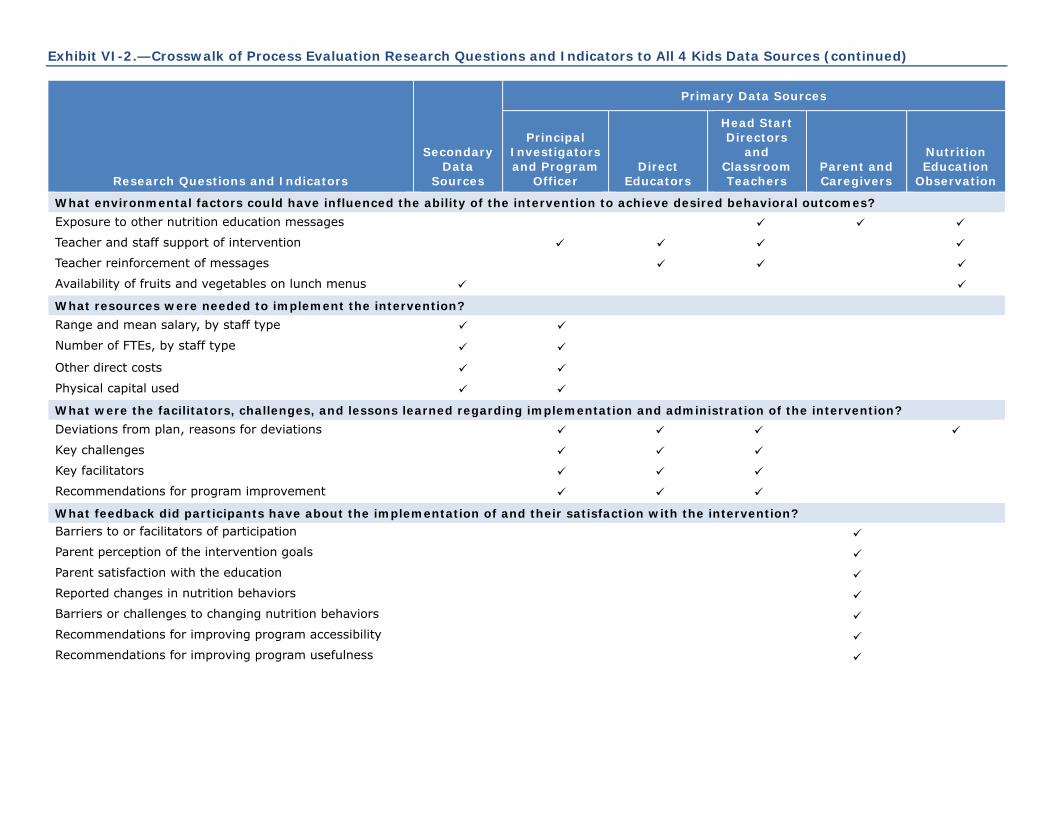
Exhibit VI-2.— Crosswalk of Process Evaluation Research Questions and Indicators to All 4 Kids Data Sources (continued)
Research Questions and Indicators
Secondary Data
Sources
Primary Data Sources
Principal Investigators and Program
Officer Direct
Educators
Head Start Directors
and Classroom Teachers
Parent and Caregivers
Nutrition Education
Observation
What environmental factors could have influenced the ability of the intervention to achieve desired behavioral outcomes?
Exposure to other nutrition education messages
Teacher and staff support of intervention
Teacher reinforcement of messages
Availability of fruits and vegetables on lunch menus
What resources were needed to implement the intervention?
Range and mean salary, by staff type
Number of FTEs, by staff type
Other direct costs
Physical capital used
What were the facilitators, challenges, and lessons learned regarding implementation and administration of the intervention?
Deviations from plan, reasons for deviations
Key challenges
Key facilitators
Recommendations for program improvement
What feedback did participants have about the implementation of and their satisfaction with the intervention? Barriers to or facilitators of participation
Parent perception of the intervention goals
Parent satisfaction with the education
Reported changes in nutrition behaviors
Barriers or challenges to changing nutrition behaviors
Recommendations for improving program accessibility
Recommendations for improving program usefulness

a. Secondary data sources
The secondary data sources that were collected and reviewed at various stages of the evaluation are provided in exhibit VI-3. These sources served as rich sources of descriptive, objective information on key aspects of the demonstration project’s design and implementation. Abstracting this type of information from secondary sources helped to reduce the burden on key informants who would have otherwise needed to supply this information through interviews or surveys. The existing sources that we collected and reviewed can be categorized into four groups: planning and reporting, implementation, administrative data on program reach and dosage, and program costs.
Exhibit VI-3.— Secondary Data Sources for the Process Evaluation of the UNCE Demonstration Project
Document Category Specific Documents Reviewed
Planning and Reporting Documents
• Demonstration project application
• FY 2010 SNAP-Ed Plan
• UNCE’s IRB proposal
• Reports from UNCE’s All 4 Kids pilot
Implementation Documents • All 4 Kids curriculum
• Educational materials
• Training agendas and protocols
• Quality assurance materials and logs
Administrative Data on Program Reach and Dosage
• Daily attendance of children by Head Start center site
• Numbers and demographics of children who participated in All 4 Kids classes at each site
• Number of parents or caregivers who were enrolled in each of the family activities by site
Program Costs* • Standardized cost tables consistent with FNS SNAP-Ed expenditure reporting requirements
*Altarum Institute provided cost tables for UNCE to complete to ensure cost data were collected in a standardized way.
i. Planning and reporting documents
The application UNCE submitted to FNS in response to the solicitation for this study provided detailed background and objective information related to how UNCE planned to develop, implement, and evaluate the All 4 Kids demonstration project. UNCE’s IRB proposal was also reviewed and provided information related to the program’s stated objectives, approach, administration, and design. The All 4 Kids curriculum gave detail on the objectives and resources needed for each lesson. The administrative data collected provided details for the reach and the dose of All 4 Kids by site. The program cost information was gathered from the cost tables submitted by All 4 Kids based on the template provided.
ii. Implementation documents
Implementation documents, such the All 4 Kids curriculum, parent and caregiver handouts, training agenda, staffing plans, planning calendars, and quality assurance tools, contributed substantial objective information on the program’s educational messages and planned activities. The All 4 Kids curriculum was also instrumental to understanding the program’s stated objectives, approach, administration, and design.

iii. Administrative data on program reach and dosage
The All 4 Kids program staff tabulated program reach and dosage using child and parent and caregiver attendance information that is routinely collected at each site by the nutrition educators. The All 4 Kids staff provided these data for each of the intervention sites in Microsoft Excel. The Excel file included information on the classes that each parent or caregiver and child attended, as well as information on when a child no longer attended the childcare center. Because the center provided the data, we were able to examine similarities and differences across centers with regard to the number of classes children attended (i.e., the dosage) as well as the number of parents who participated in any Family Activities.
iv. Program costs
UNCE provided data on resources and costs associated with implementing and evaluating the All 4 Kids program. Although we provided UNCE with a series of cost-related tables to complete, this information was categorized as a secondary data source because it was requested in a format that is consistent with FNS SNAP-Ed reporting requirements, thus it should have already existed in some form.
a. Primary data sources
Primary data were collected from five categories of key informants—principal and co-principal investigators, program-level managers, direct educators, intervention site key contacts (directors, family advocates, and teachers), and the target audience (parents or caregivers of children in the intervention classrooms)—as well as through direct nutrition education observation. The information gathered from key informants was descriptive and primarily qualitative in nature. The timing of data collection from key informants was strategic, with interviews with state level staff taking place in January prior to the start of the intervention. The pre- and post-intervention data collection for the direct educators, childcare center staff, and parents focused on the spring wave, though we did receive completed mail questionnaires from six of the child care teachers in the summer wave classrooms.
Exhibit VI-4 lists the respondent types, methods used, and the number of respondents for the pre- and post-intervention primary data collection efforts by respondent category for the All 4 Kids process evaluation. Direct observation of the program took place at three sites in April 2010 for the spring wave and at two sites in July 2010 for the summer wave.

Exhibit VI-4.— All 4 Kids Respondent Type, Data Collection Methods and Number of Respondents
Type of Respondents Data Collection
Method
Number of Respondents
Pre-Intervention Post-Intervention
Program Staff
UNCE Principal Investigators Interview 3 3
All 4 Kids Program Officer Interview 1 1
All 4 Kids Evaluator Interview 1 1
All 4 Kids Direct Educators Interview 3 3
Intervention Site Staff
Childcare Center Directors
Interview 6 6
Lead teachers in classrooms where All 4 Kids was taught (spring wave)
On-site interview
n/a
11
(summer wave) Mail Questionnaire n/a 6
Program Participants
Parents or caregivers of children who participated in All 4 Kids
Focus Group n/a 20
Survey (process questions included in parent follow-up survey)
n/a 244
Note: n/a = not applicable
i. Program-level staff
In the selection of program level staff for interviews, we worked directly with the principal investigator to identify key members of the All 4 Kids management team and to gain a basic understanding of their respective roles and responsibilities. Based on this information, the process data collection plan included interviewing the All 4 Kids principal investigator, co-principal investigators, and program manager, all of whom work at UNCE. These individuals were involved in the initial design and implementation of the All 4 Kids program and currently oversee its administration, implementation, and design changes. Our data collection approach also included a joint interview with the principal investigator, co-principal investigators, and program manager for the post-intervention evaluation interview, all of whom were involved in the evaluation of the All 4 Kids program. This interview was important because of the high degree of shared duties among the principal investigator, co-principal investigators, and the program manager.
ii. Direct educators
Collecting information from each of the direct educators who taught the program at the intervention sites was very important to document variations in their background and training and in program implementation, if any, and to ascertain their differing views on the facilitators and challenges in program recruitment and implementation. The principal investigator identified All 4 Kids direct educators.

Data Collection Instruments Used to Collect Process Data on the All 4 Kids Program.
▪ Data abstraction tools
▪ Program cost form
▪ In-depth, open-ended key informant interview guides
▪ Questionnaire for childcare teachers
▪ Parent and caregiver focus group guide
▪ Nutrition education observation protocol
▪ Parent and caregiver follow-up survey (the subset of process questions)
iii. Intervention site directors and teachers
The center directors and classroom teachers were identified as the key process evaluation respondents from the intervention sites. Directors were selected for onsite interviews because of their familiarity with the facilitators and challenges to program implementation from the perspective of the center administration. The directors were also the most knowledgeable about other classes and trainings that may have gone on at the center; thus, directors from each of the six intervention centers were asked to complete a brief questionnaire to list other nutrition education activities that had occurred at their centers.
The lead teachers in each of the intervention classrooms provided an important and unique perspective as direct observers of the child classes and a secondary target audience for the intervention. Through a post-intervention questionnaire, their input was sought to gain insights into what aspects of the program worked well or could be improved in the preschool classroom setting. They also were the only ones who could report on whether and how the center teachers are incorporating All 4 Kids nutrition messages at mealtime and in the classroom.
iv. Parents and caregivers of preschoolers in the intervention classrooms
Because they would be knowledgeable about their child’s nutrition-related behaviors and because they were direct recipients of the All 4 Kids handouts and family activities, parents or caregivers of the preschool children in the intervention classrooms were determined to be key informants for the process evaluation and the most appropriate respondents from the All 4 Kids target audiences. As is described in detail below, parents or caregivers were an important and primary source of information related to accessibility of the nutrition education materials to parents, participant satisfaction, relevance of the messages and materials, and recommendations for improvement. As shown in exhibit VI-4 above, a total of 20 adults participated in the three focus groups we conducted. The number of discussants in each group and their demographic characteristics are provided in appendix B (“focus group participant demographics”).
v. Direct observation of nutrition education
The fourth primary data collection source was direct observation of a convenience sample of intervention classes. As noted above, the focus of these observations was on the education environment (e.g., classroom setting, classroom teachers’ engagement) and factors related to program fidelity (e.g., Did the nutrition educator implement the lesson as planned? Was the lesson implemented consistently across classrooms?).
2. Instrumentation
Data collectors used standardized secondary data abstraction tools and primary data collection instruments across the four demonstration projects. The wording of many of the questions in each key informant interview and the focus group discussion guide was tailored to each of the demonstration projects. While such customization was important to capture the unique aspects of each demonstration program, at each data collection occasion, we worked from the same core set of questions. All data collectors were trained on the use of these approved

instruments to collect information essential to answering the process-related research questions and queries. In addition, key informant interviews included relevant, probing questions to allow for in-depth discussions of critical issues or topics. Data collection commenced in December 2009. Detailed descriptions of the instruments developed and implemented as part of the process evaluation of the All 4 Kids, including their intent and various characteristics of their administration, are provided below. Secondary data collection tools are described first, followed by descriptions of the primary data collection tools. Copies of the instruments are provided in appendix A.
a. Secondary data collection instruments
i. Data abstraction tools
Data abstraction from secondary data sources helped to reduce the burden on key informants who would have otherwise needed to supply this information through interviews or surveys. The data abstraction tool was designed to capture objective yet descriptive information related to formative research conducted to inform the project; the demonstration project’s design (e.g., descriptions of the target audience, intervention goals, nutrition education delivery methods, curriculum content); and operational aspects of the program’s implementation.
ii. Program cost form
The All 4 Kids management team compiled and provided us with resource and cost information for the program implementation statewide, and a separate form to document the cost of their program evaluation. This information was collected using a standardized program cost information form, which we provided, that was consistent with FNS SNAP-Ed reporting requirements. Specifically, we requested data on human capital (e.g., staff roles and responsibilities, number of FTEs, as well as averages and ranges of salaries for each), physical capital (e.g., printing, labels, computers, folders), and line-item expenditures (e.g., salary and benefits, materials, travel) by funding source (i.e., non-Federal or Federal funds).
a. Primary data collection instruments
i. In-depth, open-ended key informant interview guides
Consistent with a participant-oriented approach, primary data were elicited through in-depth open-ended discussions with a number of key informants —namely, All 4 Kids principal investigator, co-principal investigators, program manager, the direct educators of the program, childcare center directors, and childcare center teachers. A separate discussion guide was developed for each key informant type.
One pre-intervention interview guide was developed for each of these key informants to capture information from them on the planning and design of the demonstration project, the training that had taken place, and their views on the facilitators and challenges of implementation based on their many years of experience with the program and childcare.
The interviews with the childcare center teachers and the center directors at the four intervention sites in the spring wave were conducted before and after program implementation at the intervention sites. Hence, for these key informants, two discussion guides were developed—one for use prior to implementation of the classes at the intervention sites and one for use post-intervention. The pre-intervention interview guides were structured to gather descriptive information on the background of the direct educators and information on center recruitment and reasons center directors had agreed to participate in the program.

Post-intervention interview guides with these key informants captured their views on the program’s implementation at their intervention site, what worked well, and what could have gone better, as well as their broader recommendations for the program.
ii. Questionnaire for childcare teachers
An instrument with close-ended questions was used to assess the perceptions and impacts of the All 4 Kids program on the classroom teachers. This questionnaire specifically asked the teachers to rate how important they think eating more fruits and vegetables is for preschool children and their families. With open-ended questions, this instrument sought teachers’ views on what worked well and what could be improved in the program, with separate questions that focused on the All 4 Kids child classes, the All 4 Kids take-home materials, and the activities targeted to parents and caregivers. The questionnaires for teachers also asked whether and how they had incorporated the All 4 Kids messages into their own lesson plans.
iii. Parent and caregiver focus group discussion guide
The focus group guide was designed to elicit experiences and perspectives from parents or caregivers whose children participated in the All 4 Kids intervention and who participated in at least one All 4 Kids parent class. These individuals were also recipients of indirect education through the distribution of nutrition education take-home materials. Each focus group covered topics related to exposure to and accessibility of the intervention, level of satisfaction with the program, relevancy of the information and materials provided, perceived impacts on their or their child’s nutrition-related behaviors, factors affecting fruit and vegetable availability at home, and recommendations for improving the program.
iv. Parent and caregiver post-intervention impact survey (subset of process questions)
A short series of process-related questions were included on the FNS post-intervention parent and caregiver impact survey. The process questions focused on respondents’ participation in the Family Activities and reasons for nonparticipation in any or all of the Family Activities, and their perceptions of the usefulness of the All 4 Kids handouts provided to parents and caregivers. The survey also included an open-ended question to capture respondents’ other views and recommendations for the program.
v. Structured nutrition education observation protocol
The nutrition education observation tool allowed for the documentation of environmental influences (e.g., classroom setting, classroom teachers’ engagement), participants’ interest in the nutrition education lessons, and program fidelity. The tool also included several questions that were to be asked of the direct educator at the completion of each of the observed lessons. These questions offered the direct educator an opportunity to reflect on the previous lesson and describe any deviations from their lesson plan as well as anything that did or did not go particularly well. Because the All 4 Kids direct educators routinely met at the end of each lesson to engage in this type of reflective process, our observer opted to listen in on these discussions rather than to administer the questions included in the observer form.
3. Data Collector Training
Several months prior to onsite data collection, data collection team members participated in a comprehensive training. The purpose of this training was to review the logistics of the data collection plan, walk through the process of respondent recruitment, and provide guidance and instructions on scheduling these early site visits and coordinating interviews with multiple respondents. In addition, to

ensure that data collectors used each interview instrument correctly and consistently, the training included a review of the intent of each data collection instrument, the schedule of interviews, and the specific study research questions underlying the topics and questions within each of the respondent-specific interview discussion guides.
4. Data Collection Procedures
The data collection team for the All 4 Kids program comprised four evaluators, one of whom took a lead role on all recruitment and data collection activities. This section provides a detailed description of the procedures used to recruit program participants, collect process information from various sources, and document responses.
a. Data abstraction from secondary sources
All secondary data sources were collected directly from the demonstration project administrators as they became available. Because most secondary data sources were available prior to implementation, data abstraction was completed before onsite data collection commenced. We carefully reviewed all documentation provided by the demonstration projects and abstracted key information to be included in the analysis and final summation of the project. Further, this review of materials substantially informed revisions made to key informant interview guides. This data abstraction tool and the information contained within it were used to develop a summary of the demonstration project’s design and program content. When updated materials were provided to the project team or updated information was obtained through interviews, this summary was revised accordingly.
b. Data collection procedures for program-level key informant interviews
At the onset of the study and throughout the study period, we maintained informal communication with the demonstration project staff, primarily the principal investigator. This ongoing communication fostered a strong working relationship, and, as a result, formal recruitment of the program-level staff for key informant interviews was not necessary. However, to officially kick off our recruitment effort and to ensure timely, efficient communication of information required to finalize plans for onsite data collection, a packet of materials was submitted to the UNCE program staff approximately 4 months prior to the start of the intervention at the four spring sites—or 2 months prior to the first process evaluation interviews. This packet, which was sent electronically, included the following:
• Brief overview memorandum, or cover email, which described the packet of materials (sent as attachments) and outlined next steps, including timelines and expectations;
• Respondent contact information form for the program staff to complete with potential respondents’ contact information;
• Draft letter for the program staff to review, revise as necessary, and submit to intervention and control site contacts to inform them about the independent evaluation and request their cooperation; and
• Data collection plan summary, which provided an overview of our data collection plan for each site, including the number and type of respondents and timing of data collection.
The All 4 Kids principal investigator was very responsive to this form of communication and effectively facilitated the recruitment of staff and identified a date, block of time, and location for the evaluation team to conduct the pre-intervention onsite interviews with the program staff.

c. Data collection procedures for implementation site key informant interviews
In addition to facilitating and accommodating onsite data collection with demonstration project staff, the All 4 Kids principal investigator sent the introductory letter described above to the director at each of the four intervention sites in the spring. Once delivery of this communication to the intervention sites had been confirmed, we took the following steps to complete recruitment of the intervention site contacts for the process evaluation:
• Follow-up letter to provide overview of the impact and process evaluation design. A follow-up email, which provided a detailed description of the type and timing of data we planned to collect and what we would need from them during the study period, was submitted to the center director at the four spring intervention childcare centers. These letters described both the process and impact evaluation processes.
• Follow-up telephone call. Once the above correspondence was sent, we followed up with the directors to formally recruit them into the study, answer any questions they had, schedule a convenient time for the pre-intervention telephone interviews, and plan potential dates for the onsite nutrition education observations and the post-intervention interviews and focus groups.
The All 4 Kids principal investigator had an established relationship with Acelero Head Start, the agency that coordinates the Las Vegas Head Start centers. For this reason, the principal investigator facilitated the recruitment of the intervention sites into the evaluation by holding informational meetings with each center director to describe the evaluation process.
d. Recruitment and data collection procedures for parent and caregiver focus groups
Three parent and caregiver focus groups were conducted post-intervention in May 2010. Approximately 2½ weeks prior to the focus group date, we helped facilitate focus group recruitment while onsite for nutrition education observations. One of the eligibility criteria for parent or caregiver participation in a focus group was attendance at a minimum of one Family Activity session. For this reason, we actively recruited parents and caregivers into the focus groups by distributing letters and fliers to them during one of the Family Activities. Attendees were able to ask questions and register for one of the focus groups at the end of the event.
To meet an ideal focus group size of 6 to 8 participants, 10 to 12 parents and caregivers were recruited for each focus group to allow for an approximate 50 percent no-show rate. The following measures were taken to meet recruitment targets and maximize actual participation on the day of the focus group:
• Groups were scheduled while preschool was in session (either at drop-off time or one hour before the end of the preschool day) so that parents and caregivers would not have to be concerned with childcare during each focus group.
• A $50 gift card incentive was offered to every parent and caregiver for participation in the group. • Breakfast or dinner was provided before each focus group. • Approximately 1 week prior to the focus group, we sent the All 4 Kids program manager
reminder note cards to distribute in the family packs to parents or caregivers who were registered for one of the focus groups.
• One or 2 days before each focus group was held, we made reminder phone calls to parents and caregivers who had signed up.

Gift cards in the amount of $50 were distributed to participants at the time of the interview, after each adult had signed an informed consent form. In addition to the privacy-related information provided on the consent form, privacy assurance was offered verbally prior to the start of the interview, along with a reminder that participation in the interview was voluntary. The focus group discussions were recorded using a digital recorder and transcribed for future coding and analysis.
e. Classroom observations
All three of the All 4 Kids nutrition lead educators were observed as well as all of the childcare centers in the spring wave and two centers in the summer wave. Multiple classrooms in each childcare center were visited and several different nutrition education lessons and Family Activities were observed. Nutrition education observations took place in April (spring wave) and July 2010 (summer wave) at the childcare centers in Las Vegas. We completed the observation form during each lesson, and listened to the reflective process of the nutrition educators at the end of the lesson. The observation form was then reviewed for completeness, and handwritten information was transcribed into an electronic copy of the form.
5. Analysis Approach
We applied an analysis approach to the data that takes into account the range of data and respondent types used in the process evaluation. Key informant responses from UNCE program staff and center contacts to each interview and questionnaire item were compiled into a master Microsoft Word 2007 document and organized by broad process evaluation research question and process indicator. This approach helped to organize the extensive amount of information that was available and allowed for the identification of broad themes (e.g., implementation challenges) and specific topics (e.g., lesson plan scheduling) as well as agreement and disagreement amongst respondents. Direct quotations were also identified where relevant and used to support key findings.
Transcripts from the focus groups with parents and caregivers were coded in QSR International NVivo Version 8, which allowed us to systematically organize, process, and summarize information provided by this key stakeholder group. It also allowed us to capture the breadth of opinions offered by parents or caregivers, while identifying common themes and issues. Direct quotations were also identified and used to support key findings.
Quantitative process data were primarily used to describe objective aspects of the All 4 Kids program, such as those related to dose, reach, and costs. Quantitative process data collected from parents and caregivers through the follow-up parent survey were analyzed using SAS 9.2. Frequencies of participant responses to each process question were reported.


Appendix I Impact Evaluation Methodology


This appendix describes the methodology for the impact evaluation of the All 4 Kids program. We identify the research questions and describe the research design and sample selection, the survey instrument development and testing procedures, and the survey administration procedures for the baseline and follow-up surveys. We describe the procedures for data handling and data processing and the methodology for the impact analysis.
1. Impact Evaluation Research Questions
The primary objective of the impact evaluation was to assess whether All 4 Kids yielded positive and statistically significant changes in observed nutrition behaviors. The specific primary and secondary outcomes for the impact evaluation are described below.
▲ Primary Outcome
Based in FNS’ interest in observing a minimum increase in children’s dietary intake of 0.30 standard deviation units, we hypothesized that children participating in the All 4 Kids program would increase their average daily in-home consumption of fruits and vegetables by approximately 0.30 cups per day compared with children not participating in the program.
▲ Secondary Outcomes
We hypothesized that children and parents of children participating in the program will increase other nutrition behaviors that may lead to children’s increased fruit and vegetable consumption in the home compared with those not participating in the program. Specifically, we considered the following secondary outcome measures in the impact evaluation:
• Variety: eat more than one type of fruit or vegetable each day • Snacking: help self to or request fruit or vegetable as snack • Willingness: willingness to try new fruits or vegetables • Choosing healthy foods: ask for fruits or vegetables instead of French fries when eating at fast
food restaurants • Availability: average weekly in-home availability of fruits and vegetables • Parental offerings at home: frequency of offerings of fruits or vegetables as a snack and at dinner • Parental offerings at fast food restaurants: order child fruits or vegetables instead of French fries
when eating at fast food restaurants
2. Research Design and Sample Selection
The study population for the All 4 Kids program included parents or caregivers of preschool children ages 3 to 5 years attending Acelero Head Start centers in Clark County, Nevada. For the independent impact evaluation of the All 4 Kids program, we employed a quasi-experimental research design with data collected at pre- and post-intervention. A fully randomized design was not appropriate because two of the centers (Martin Luther King and Professional Development Center) had been previously exposed to the intervention and needed to be assigned to the intervention condition to avoid potential contamination and compensatory behaviors. Centers matched to Martin Luther King and Professional Development Center were assigned to the comparison condition. Among the remaining centers, assignment to condition was random.
The evaluation of All 4 Kids included six matched pairs of childcare centers. Table I-1 presents the target assignment of centers. Pairs of centers were generated based on primary language and center size (i.e., number of children enrolled at the time of sample selection). Center sizes varied from 57 to 265 preschool

children. Assuming an 80 percent attrition rate, we anticipated an average of 40 completed surveys per center for the follow-up survey. All 12 centers were stratified based on the primary language spoken by participants (six English, six Spanish) and ordered by size within language group. Centers within each language group were then matched based on size. Two pairs included one center that had been previously exposed to the intervention. In these pairs, the previously exposed center was allocated to the intervention group and its match was allocated to the comparison group. Among the remaining pairs, allocation to the intervention and comparison groups followed a random process. Pairs of centers were assigned to the spring or summer wave of the evaluation study.
We faced several challenges during the baseline data collection that affected the final assignment of centers. Center enrollment was much lower than anticipated; we had anticipated a starting population of 60 students per center, but actual enrollment was about 50 to 55 students per center. Owens (a comparison center) was closed for a few days because of plumbing and sewage problems, and two comparison centers had as many as half of the students absent because of illness. Also, Cecile Walnut, a comparison center that was matched with an intervention center for the summer wave of the evaluation study, did not operate during the summer, so we had to collect data from this center during the spring wave. To increase the number of study participants for the intervention group, the UNCE implemented the intervention at additional classrooms at the Herb Kaufman and the Yvonne Atkinson Gates centers during the summer wave of the evaluation. Table I-2 presents the final assignment of centers.
▲ Sample Size Estimation
Sample size estimation procedures are used to quantify researchers’ level of confidence regarding their ability to accurately reject the null hypothesis when empirical differences are statistically significant. Our main outcome measure and the focus of sample size estimation was the change in consumption of servings of fruits and vegetables by children participating in All 4 Kids as reported by their parents or caregivers. Our sample size estimation procedures follow the convention of estimating sample size allowing for a type II error rate of 0.20 (yielding 80 percent statistical power) and a type I error rate of 0.05, with a two-tailed test.
Sample size estimation was predicated on FNS’s interest in observing a minimum increase in children’s dietary intake of 0.30 standard deviation units and was carried out to identify the minimum number of parents from each childcare center that would be needed to obtain sufficient power. Few studies in the published literature provide data on parent-reported values of children’s fruit and vegetable consumption.
We used estimates from a trial in Chicago that includes means and standard deviations for parent-reported measures of their children’s fruit and vegetable consumption. The study included six lower socioeconomic status communities and collected data from 516 parents on their young children’s dietary intake. In this study population, mean fruit and vegetable consumption was 3.83 servings per day, with a standard deviation of 2.04 servings (Evans, Necheles, Longjohn, & Christoffle, 2007). Next, we determined an appropriate expectation for the magnitude of the program impact, often referred to as the effect size or the minimum detectable effect. This number describes the anticipated change in observed outcomes among participants as a result of participating in the intervention. For our purposes, we aim to identify a change of 0.30 standard deviation units or greater. Based on the findings from the Chicago study, the realized net change is expected to be 0.30 cups of fruit and vegetables from baseline values between the two groups. This expectation is consistent with findings reported in a recent meta-analysis by Knai, Pomerleau, Lock, and McKee (2006) who found that across a range of dietary interventions, children’s fruit and vegetable consumption increased by 0.30 to 0.99 servings (i.e., 0.15 to 0.50 cups) per day.

Table I-1.— Target Assignment of Centers for the All 4 Kids Program Impact Evaluation
Intervention Group Comparison Group
Center Center
Size Primary
Language Zone Center Center
Size Primary
Language Zone
Spring Wave Spring Wave
Yvonne Atkinson Gates 102 Spanish North Jefferson 56 Spanish North
Spring Valley Learning Center 268 Spanish Central Reynaldo Martinez 162 Spanish Central
Herb Kaufman 104 English South Owens 119 English North
Martin Luther Kinga 137 English North Henderson 302 English South
Summer Wave Summer Wave
Sunflower 134 Spanish South Cecile Walnut 135 Spanish North
Professional Development Centera 57 English Central Stewart 88 English South
a The center was previously exposed to the All 4 Kids program.
Notes: Center size = number of children enrolled at time of sample selection.

Table I-2.— Actual Assignment of Centers for the All 4 Kids Program Impact Evaluation
Intervention Group Comparison Group
Center Center
Size Primary
Language Zone Center Center
Size Primary
Language Zone
Spring Wave Spring Wave
Yvonne Atkinson Gates 102 Spanish North Jefferson 56 Spanish North
Spring Valley Learning Center 268 None Central Reynaldo Martinez 162 Spanish Central
Herb Kaufman 104 English South Owens 119 English North
Martin Luther Kinga 137 English North Henderson 302 English South
Cecile Walnutb 135 Spanish North
Summer Wave Summer Wave
Sunflower 134 Spanish South — — — —
Professional Development Centera 57 English Central Stewart 88 None South
Herb Kaufmanc 104 English South — — — —
Yvonne Atkinson Gatesc 102 Spanish North — — — —
a The center was previously exposed to the All 4 Kids program.
b Cecile Walnut, a comparison center that was matched with an intervention center for the summer wave of the evaluation study, did not operate during the summer, so we had to collect data from this center during the spring wave.
c To increase the number of study participants for the intervention group, UNCE implemented the intervention at additional classrooms at the Herb Kaufman and the Yvonne Atkinson Gates centers during the summer wave of the evaluation.
Notes: Center size = number of children enrolled at time of sample selection.

Additional assumptions relate to the form of the standard error of the test of the intervention effect. These include the anticipated intraclass correlation coefficient (ICC), the proportion of variation attributable to the cluster (i.e., school or center) over and above the variation attributable to the individual, and the form of the statistical model. At present, we are unaware of any study that has published ICC estimates on parents’ reports of children’s dietary intake. However, a study of middle school youth reported an ICC of 0.034 for self-reported fruit and vegetable consumption (Murray, Phillips, Birnbaum, & Lytle, 2001). Using this study as a starting point, and recognizing the differences between the participants in Murray et al. (2001) and our study, we employed an ICC 0.05 for our calculations.
The final assumption involves the form of the statistical model. Our calculations are appropriate for a mixed model regression model that includes baseline and follow-up measures of the outcome of interest (i.e., pretest and posttest model) and allows for the inclusion of covariates associated with the outcome variable, but independent of the intervention. This model allows for two sources of reduction to the variance of the outcome. First, the use of a pretest and posttest model helps ensure that baseline differences and potential confounding influences will be minimized. Second, the inclusion of covariates associated with the outcome of interest, but independent of the intervention, can further reduce unwanted variation in the outcome and improve statistical power. The decision of which variables to include in the model was determined through examination of the baseline data. Demographic variables such as age, sex, and race or ethnicity are typically included.
We estimated sample size with the aim of detecting a change in consumption of servings of fruits and vegetables of 0.30 standard deviation units or better based on the parameters described above. Our calculations indicate an 80 percent probability of properly rejecting a false null hypothesis given complete data (pretest and posttest) on an average of 40 participants per center with six centers in each condition. Table I-3 provides details of the sample size estimate for the All 4 Kids evaluation and our assumptions regarding response rate and attrition.
Table I-3.— Sample Size for the All 4 Kids Program Impact Evaluation
Group Number of
Centers Number of Childrena
Number of Completed Surveys
Baseline Survey (Number of Parents
and Caregivers)b
Follow-Up Survey (Number of Parents
and Caregivers)c
Intervention 6 360 300 240
Comparison 6 360 300 240
a Assumed 3 classrooms per center, with an average number of 20 students per classroom.
b Assumed an 83 percent response rate for the baseline survey.
c Assumed an 80 percent response and retention rate between the baseline and follow-up surveys.
3. Survey Instrument Development and Testing
We developed drafts of the survey instruments for the baseline (pre-intervention) and follow-up (post-intervention) surveys and conducted two rounds of interviews with parents and caregivers to test and refine the instruments. The impact instruments for the three demonstration projects with children as the target audience (All 4 Kids, Eagle Adventure, and Eat Well Play Hard in Child Care Settings) were very
similar because the primary outcome measures, and some of the secondary outcome measures, were the same. Our survey instrument development and testing procedures are described below.
a. Outcome measures and instrument development
To develop the impact evaluation instrument, we reviewed UNCE’s application and the All 4 Kids curriculum and talked with UNCE project staff to identify the primary and secondary outcome measures for the intervention. We then reviewed the instruments compiled as part of the literature review conducted for this study (Altarum Institute and RTI International, 2009) to identify instruments that address these outcomes and are feasible, appropriate for the target audience, reliable, valid, and sensitive to change. We worked with our consultant, Dr. Marilyn Townsend, a Cooperative Extension Specialist at the University of California Davis, to develop the impact evaluation instrument.
The impact evaluation instrument for the All 4 Kids program collected information on the following:
• Primary outcomes: child’s average daily in-home consumption of fruits and vegetables • Secondary outcomes: child’s other dietary behaviors (i.e., variety, snacking, preparation, and
willingness) • Secondary outcomes: parent behavior and household variables • Parent use of the educational materials sent home with the child • Parent satisfaction with the educational materials sent home with the child • Demographic characteristics of the household, respondent, and child
In developing the impact instrument, we assessed the appropriateness of the instrument for collecting data on fruit and vegetable outcomes. Exhibit I-1 provides information on the study population, mode(s) of data collection, reliability, validity, and sensitivity to change for the instruments used to develop the questionnaire items on outcome measures for the impact evaluation. The majority of the items were taken or adapted from instruments that have been administered successfully with low-income audiences, validated, and demonstrated to be reliable and sensitive to change in previous studies.
For the primary outcome measures, child’s dietary behavior, we modified questions from the Food Stamp Program Fruit and Vegetable Checklist (Townsend, Kaiser, Allen, Joy, & Murphy, 2003) and University of California Cooperative Extension Food Behavior Checklist (Townsend, Silva, Martin, Metz, & Wooten-Swanson, 2008) to ask the respondent (parent or caregiver) to report on his or her child’s consumption of fruits and vegetables. Respondents were instructed not to include meals eaten at school or day care, but rather to report only on observed consumption behavior.
We assessed the readability of the instrument using the Fry Test (Fry, 1968). This test examines the proportion of syllables and sentence length and is a commonly used measure of reading level. Generally, the questions themselves were at the fifth -grade reading level.

Exhibit I-1.— Summary of Instruments Used to Develop Impact Instrument for the All 4 Kids Program Impact Evaluation
Outcome Measures Instrument Study
Population(s) Mode(s) of Data
Collection Reliability Validity Sensitivity to
Change
Cups of fruits, vegetables, and fruits and vegetables consumed by child each daya Child ate variety of fruits each daya Child ate variety of vegetables each daya
Food Stamp Program Fruit and Vegetable Checklist (Townsend et al., 2003) University of California Cooperative Extension Food Behavior Checklist (Townsend et al., 2008)
Low-income women
Self-administered, self-administered in group setting, and interviewer administered individually and in groups
The internal consistency for the 7-item fruit and vegetable subscale was high (α = 0.80)
The 7-item fruit and vegetable subscale showed a significant correlation with serum carotenoid values (r = 0.44, p < 0.001), indicating acceptable criterion validity and showed significant correlation with dietary variables
Demonstrated sensitivity to change for items expected to change as a result of the study intervention
Willingness of child to try new fruits Willingness of child to try new vegetables
Willingness to try new fruits and vegetables (Jamelske, Bica, McCarty, & Meinen, 2008)
4th, 7th, and 9th graders
Self-administered Not reported Not reported Compared to comparisons, intervention participants reported an increased willingness to try new fruits and vegetables at school (p < 0.01)
Availability of fruits and vegetables at home during past week
Fruit, juice, and vegetable availability questionnaire (Marsh, Cullen, & Baranowski, 2003; Cullen et al., 2003)
Parents of 4th and 6th graders
Self-administered and interviewer administered via telephone
The internal consistencies for the fruit and vegetable availability items were high
There was significant agreement between self-reported and observed in-home availability for all fruit juices and most fruits and vegetables
Fruit, juice, and vegetable availability was a significant predictor of child fruit, juice, and vegetable consumption (p < 0.05)
(continued)
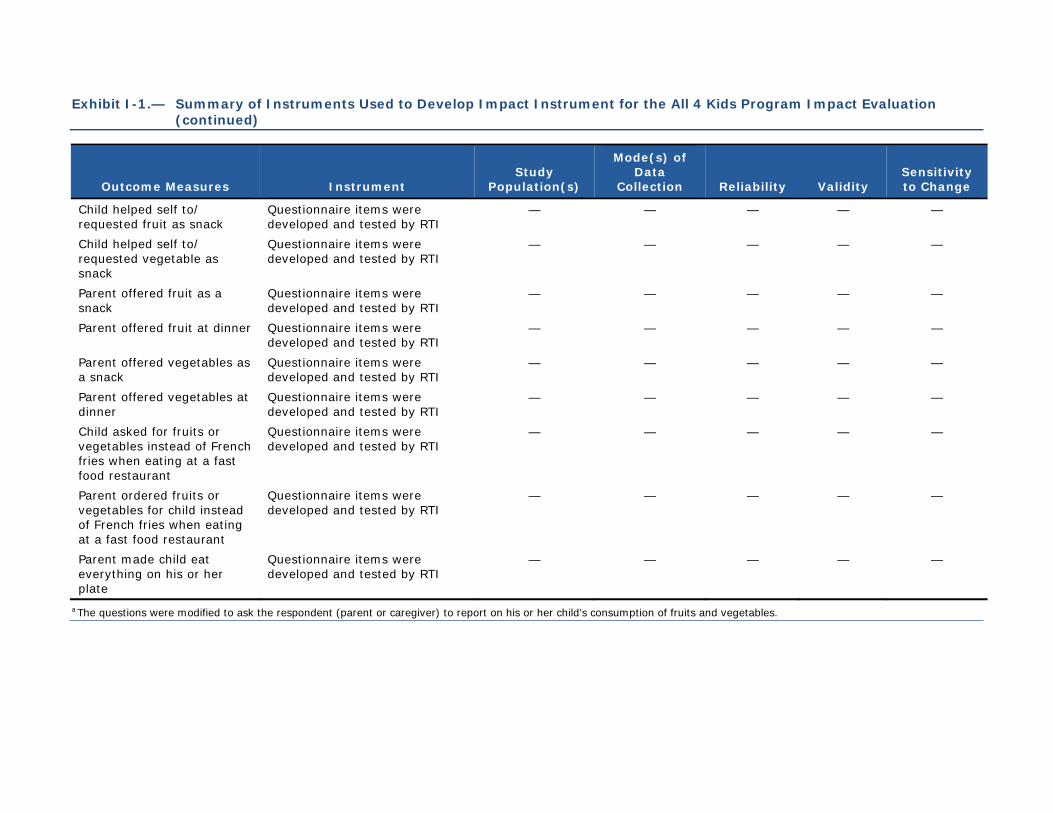
Exhibit I-1.— Summary of Instruments Used to Develop Impact Instrument for the All 4 Kids Program Impact Evaluation (continued)
Outcome Measures Instrument Study
Population(s)
Mode(s) of Data
Collection Reliability Validity Sensitivity to Change
Child helped self to/ requested fruit as snack
Questionnaire items were developed and tested by RTI
— — — — —
Child helped self to/ requested vegetable as snack
Questionnaire items were developed and tested by RTI
— — — — —
Parent offered fruit as a snack
Questionnaire items were developed and tested by RTI
— — — — —
Parent offered fruit at dinner Questionnaire items were developed and tested by RTI
— — — — —
Parent offered vegetables as a snack
Questionnaire items were developed and tested by RTI
— — — — —
Parent offered vegetables at dinner
Questionnaire items were developed and tested by RTI
— — — — —
Child asked for fruits or vegetables instead of French fries when eating at a fast food restaurant
Questionnaire items were developed and tested by RTI
— — — — —
Parent ordered fruits or vegetables for child instead of French fries when eating at a fast food restaurant
Questionnaire items were developed and tested by RTI
— — — — —
Parent made child eat everything on his or her plate
Questionnaire items were developed and tested by RTI
— — — — —
a The questions were modified to ask the respondent (parent or caregiver) to report on his or her child’s consumption of fruits and vegetables.

b. Instrument testing
To pretest the draft impact instrument, we conducted in-person interviews in July 2009 with SNAP-Ed recipients or eligibles who were parents and caregivers of children ages 3 to 5 years enrolled in a preschool or a Head Start program. Working with the North Carolina State coordinator of the Expanded Food and Nutrition Education Program (EFNEP) and the EFNEP program assistant from Pitt County, North Carolina, we recruited and interviewed three individuals to evaluate the draft instrument for the baseline survey for NYSDOH, CNNS, and University of Nevada. The interviews were conducted at the Pitt County Center in Greenville, North Carolina.
After obtaining informed consent, the interviewer went through the draft instrument question by question. After asking each question, the interviewer asked the respondent to provide his or her response, to explain the reason for that response choice, and whether the question or response items were confusing or difficult to understand. Each interview lasted 30 to 45 minutes, and participants received a $60 honorarium.
Based on the findings from these interviews and the five interviews conducted with Native Americans for the CNNS demonstration project, we modified questions and response items to improve understanding and deleted several questions that were redundant. The draft impact instrument asked questions on fruit and vegetable intake in terms of both servings and cups. We found that participants were not consistent in their responses for these questions and decided to limit the intake questions to ask for intake in terms of cups because this is the unit of measure used by My Pyramid.
In August 2009, we conducted five in-person interviews in Raleigh, North Carolina, to test the revised instrument. The purpose of the interviews was to test the revised questions about fruit and vegetable intake using cups (instead of servings) and to test the revised scale for questions that ask about the frequency of certain activities during the week (number of days or yes, sometimes; yes, often; yes, everyday; no scale). We worked with an extension associate for the EFNEP at the Wake County Cooperative Extension Center to recruit individuals for the interviews. Participants were parents of children ages 3 to 8 years and SNAP-Ed recipients or eligibles. One participant was male and four were female; two participants were White, Hispanic and three were Black, non-Hispanic. One participant was 18 to 24 years old, three were 25 to 34 years old, and one was 35 to 44 years old. After reading and signing the informed consent form, participants completed the questionnaire, and the interviewer timed how long it took each participant to complete the questionnaire. Following completion of the questionnaire, the interviewer used a debriefing guide to lead participants in a discussion to understand why they chose their responses and to identify questions or terms that were confusing or difficult to understand. Participants received a cash honorarium of $60 for participating in the 30-minute interview.
Participants were able to answer the questions on their child’s intake of fruits and vegetables in terms of cups. They found the graphics of the fruits and vegetables shown in measuring cups for different quantities (1, 2, and 3 cups) useful. These graphics were developed by Drs. Marilyn Townsend and Kathryn Sylva, University of California Davis. Participants were able to answer questions with the revised scale of none, 1 to 2 days, 3 to 4 days, 5 to 6 days, every day. Participants were able to think back over the past week and “count” the number of times their children did a particular activity (e.g., number of days ate more than one kind of fruit or vegetable), so we decided to use the revised scale in the final instrument. Additionally, we made some revisions to questions and response items to improve understanding and consistency in answering the questions.

We developed three versions of the instrument.
• Baseline survey—The same instrument was used for the intervention and comparison groups. This instrument collected information on the primary and secondary outcomes and demographic information.
• Follow-up survey for the intervention group—This instrument collected information on the primary and secondary outcomes and included questions on use and satisfaction with the intervention materials.
• Follow-up survey for the comparison group—This instrument collected information on the primary and secondary outcomes.
Each survey took about 15 minutes to complete. The baseline survey was administered in person by our interviewers. For the follow-up surveys, we prepared separate versions of the instruments for administration by mail (survey booklet) and telephone (computer-assisted telephone interviewing [CATI] script). For the CATI version, respondents did not have access to the graphics with cups of fruits and vegetables. The survey instrument and other survey materials were available in English and Spanish. Copies of the final survey instruments (English version) are provided as appendix C.
4. Survey Administration Procedures and Response
To maximize the response rate for the survey, we used a multimodal survey approach. For the baseline survey, we used interviewers to administer the survey in person. For the follow-up survey, we mailed the survey questionnaire, and contacted nonrespondents and attempted to complete the survey over the phone. We describe below the training of data collectors, the survey administration procedures, and the response to the survey.
a. Data collector training
We provided training for two types of data collectors: (1) field interviewers who conducted the in-person interviews for the baseline survey and (2) telephone interviewers who administered the follow-up survey to study participants who did not respond to the mail survey.
Each training class included a detailed training manual. The training manual provided background materials, including a study overview and glossary of terms; answers to frequently asked questions; description of likely data collection challenges and recommendations for avoiding or resolving them; confidentiality and data security procedures; interviewing techniques for the telephone interviewing training; procedures for logging completed interviews; and procedures for submitting data from the field.
Field interviewers participated in a 2-day 16-hour training session held in the UNCE offices approximately 3 weeks prior to the start of the intervention. Before attending training, each candidate received a training manual to read and home-study exercises to complete. Each field interviewer had to pass a certification exercise demonstrating proficiency in the required skills in both English and Spanish before beginning work.
Telephone interviewers were trained to work on the data collection for all four demonstration projects. Interviewers attended a 2 day evening training totaling 8 hours. For bilingual interviewers, an additional 2 hours of training were required to review the Spanish language version of the instrument. Before beginning work on the administration of the survey, each telephone interviewer had to pass certification exercises demonstrating knowledge of the study, facility with the instrument and comparison system for documenting

their work, and use of the equipment. The training included information on gaining respondent cooperation and time for interviewers to practice administering the questionnaire and documenting calls. The training used multiple formats, including classroom-style teaching, discussions, and role-playing. The survey protocol was reinforced by trainer demonstrations and post-classroom practice.
b. Data collection procedures
Exhibit I-2 illustrates the data collection procedures for the baseline and follow-up surveys. The baseline data collection was conducted during February and March 2010 for the spring wave and May 2010 for the summer wave of the evaluation study. We worked with UNCE to coordinate study recruitment and the administration of the baseline survey at the intervention and comparison childcare centers. UNCE made the initial contact with the intervention and comparison centers to encourage their cooperation in the study.
The baseline survey was conducted 2 to 3 weeks before the intervention for the intervention centers and 1 to 2 weeks before the intervention for the comparison centers. At each participating center, sign-up sheets were posted so parents or caregivers could schedule a 45-minute time slot to complete the baseline survey in person on a predetermined date.1 During the interviews, study participants were asked to complete a questionnaire administered by UNCE staff members and a separate questionnaire administered by our field interviewer. Consent was obtained separately for each questionnaire. To control for starting point bias, half of the study participants completed the UNCE questionnaire first and half completed the FNS questionnaire first. Our interviewer also collected contact information so study participants could be contacted by mail or telephone for the follow-up survey. Respondents received $10 cash for completing the baseline survey.
The data collection for the follow-up survey was conducted during May and June 2010 for the spring wave and August and September 2010 for the summer wave. During the last week of the intervention, an advance notification letter was mailed reminding study participants about the follow-up survey. The mail survey packet was mailed approximately 1 week later, which was 1 week after completion of the intervention. Five days later, we mailed a follow-up postcard reminding participants to complete the survey and/or thanking them for their participation if they had already done so. Telephone contact of nonrespondents began 2 weeks after the second mailing; at least 15 call attempts were made to each working phone number at various times over several days. Respondents received $15 cash for completing the follow-up survey. Appendix D provides copies of the survey materials for the baseline survey.
1 To increase the number of participating parents at centers where participation was low, parents unable to
schedule an onsite baseline interview were allowed to complete the survey over the phone.

Exhibit I-2.— Data Collection Procedures for the Impact Evaluation of the All 4 Kids Program
a To increase the number of participants at centers where participation was low, we allowed parents who were unable to schedule an in-person interview to complete the survey over the phone.

c. Survey response
Table I-4 provides the number of completed surveys for the intervention and comparison groups at baseline and follow-up. At baseline, 294 participants in the intervention group and 328 participants in the comparison group completed the survey. The response rate for the baseline survey was 80 percent for the treatment group and 54 percent for the comparison group. The response rate for the comparison group is lower than anticipated because study enrollment was open to the entire center, instead of specific classrooms, thus greatly increasing the size of the eligible population.
At follow-up, 244 participants in the intervention group and 267 participants in the comparison group completed the survey, thus meeting our target of 240 participants per group at follow-up. The response rate for the follow-up survey was 83 percent for the treatment group and 81 percent for the comparison group.
5. Data Processing and File Production Procedures
Data processing steps included entering the survey data, editing and cleaning the data, creating derived variables, creating the analysis data files, and producing data documentation. Throughout data processing and file production, we implemented quality control and assurance procedures as described below.
a. Data entry
Data entry consisted of entering data from the contact cards, in-person interviews (baseline survey), and mail surveys (follow-up survey), as well as entering data through computer-assisted telephone interviews (CATI) for respondents contacted by phone for the follow-up survey. Double-keying verification was performed on all hard copy data collection instruments, and any data entry errors were resolved by comparing the first- and second-keying files. Item nonresponse was keyed as a “refusal,” and data were checked for chronic item refusals. For the follow-up survey, parents or caregivers who did not complete the mail survey in a specific amount of time were contacted by telephone. Telephone interviewers entered the survey responses using CATI; thus, data entry was not required. The CATI program incorporated the questionnaire skip logic and included out-of-range checks for numeric responses.
b. Data editing
To prepare the analysis data files, we made the following edits to the survey data:
• Investigated and addressed responses that fell outside a specified range for the contact card, in-person interview, and mail survey data. For example, child’s age was reviewed to identify and address observations that fell outside a reasonable range for children enrolled in the study.
• Verified responses to categorical questions to ensure that they corresponded to a valid response. • Checked for contradictory responses and investigated and addressed inconsistent responses, if
necessary. • Checked for incorrect flows through prescribed question skip patterns. This step was not
necessary for CATI surveys because the programming logic incorporated the skip patterns. • Checked for omission or duplication of records; for example, several missing items in a row can
indicate that one or more pages in the survey were not keyed or there are other errors in the data entry process.

Table I-4.— Number of Completed Surveys and Cooperation Rates for the Baseline and Follow-Up Surveys
Center
Eligible Population (Number of Students)a
Number of Completed
Baseline Surveys
Response Rate for the Baseline
Survey (%)b
Number of Completed Follow-
Up Surveys
Response Rate for the Follow-Up Survey (%)c
Intervention
Spring Wave
Yvonne Atkinson Gates 52 48 92.31 45 93.75
Spring Valley Learning Center 49 33 67.35 28 84.85
Herb Kaufman 47 32 68.09 27 84.38
Martin Luther King 60 37 61.67 28 75.68
Summer Wave
Sunflower 42 39 92.86 29 74.36
Professional Development Center 31 29 93.55 24 82.76
Herb Kaufmand 45 36 80.00 28 77.78
Yvonne Atkinson Gates 42 40 95.24 35 87.50
Total 368 294 79.89 244 82.99
Comparison
Spring Wave
Jefferson 57 35 61.40 30 85.71
Reynaldo Martinez 166 81 48.80 68 83.95
Owens 98 51 52.04 41 80.39
Henderson 64 45 70.31 33 73.33
Cecile Walnut 134 55 41.04 47 85.45
Summer Wave
Stewart 91 61 67.03 48 78.69
Total 610 328 53.77 267 81.40 a The eligible population is based on class enrollment data available at the start of the intervention. The eligible population may differ from the reach data
reported in chapter II, which are equal to the actual number of unduplicated children who attended at least one All 4 Kids class at their childcare center.
b Response rate for the baseline survey = number of completed baseline surveys
eligible population
c Response rate for the follow-up survey = number of completed follow-up surveysnumber of completed baseline surveys
d During the summer wave at Herb Kaufman, seven students were transferred to a different center shortly after the start of the intervention; thus, we excluded these students from the eligible population for the calculation of the cooperation rate for the baseline survey.

• For questions with an “other, specify” response, responses were coded to existing categorical responses and additional response codes were added as necessary. Additions of response codes are noted in the survey result tables. Open-ended responses recorded in Spanish at the data entry stage were translated to English and provided in the final dataset.
c. File production
Preparing the analysis data file for the impact analysis required several steps as described below.
• Combine the in-person interview, mail survey, and phone survey responses: For the follow-up survey, in cases where a CATI survey was completed before a mail survey was received for the same respondent, the mail survey data were kept for analysis.
• Create derived variables: Several analysis variables were derived using contact card information, survey responses, or a combination of both. Creation of these variables is described in the next section.
• Combine the baseline and follow-up survey data: Baseline and follow-up survey responses were combined to form a single analysis data file. Demographic information provided by respondents in the baseline survey and child contact card data were merged with the respective follow-up survey responses.
6. Impact Analysis
We compared changes in an intervention group that participated in the All 4 Kids program (six Acelero Head Start centers in Clark County, Nevada) and a comparison group that did not participate in the program (six Head Start centers also in Clark County, Nevada). We used parent and caregiver reports of the child’s behavior to collect information on the child’s consumption and other dietary behaviors at baseline and follow-up. We describe below the measures and variables used in the statistical analyses and our modeling specifications.
a. Description of measures and variables used in statistical analyses
The contact card collected information on the child’s age and gender, and the baseline survey collected demographic information on the parent or caregiver respondent and their household. Exhibit I-3 identifies the demographic variables included in the impact analysis and provides information on procedures used to derive new variables.
The baseline and follow-up surveys collected information on the primary outcomes, the child secondary outcomes, and the parent secondary outcomes. Exhibits I-4 through I-6 identify the variables for the impact analysis and provide information on procedures used to derive new variables.

Exhibit I-3.— Description of Demographics Variables Used in the Analysis
Variable Question(s)a Analysis Variable Derivation
Child sex Contact card Male children were included as the reference group for the analysis.
Child age Contact card Child’s age was determined using the date of birth information provided on the contact card (month and year of birth) at study enrollment and the date the baseline survey was conducted.
Respondent age Question 23, “Which of the following best describes your age?”
Age categories were combined to create a three-level categorical variable: “18 to 34” (reference group for the analysis), “35 to 44,” and “45 or older.”
Respondent sex Question 24, “What is your gender?” Male respondents were included as the reference group for the analysis.
Size of household
Question 21, “How many people under 18 years of age live in your household?” Question 22, “Including yourself, how many people 18 years or older live in your household?”
Responses to the two questions were summed to calculate the total number of individuals in the household, provided the respondent provided information for both questions.
Respondent race or ethnicity
Question 25, “Are you Hispanic or Latino?” Question 26, “What is your race?” Multiple responses were allowed for the race question.
Responses to the two questions were combined to create a five-level categorical variable. Respondents indicating they were Hispanic or Latino were given priority over other race and ethnicity designations and assigned to “Hispanic.” Respondents indicating they were not Hispanic and only selected Black or African-American as their race were assigned to “Black, non-Hispanic.” Respondents indicating they were not Hispanic and only selected White or Caucasian as their race were assigned to “White, non-Hispanic” and is the reference group for the analysis. Respondents indicating they were American Indian or Alaska Native, Asian or Native Hawaiian, or who selected more than one race were assigned to “other or more than one.”

Exhibit I-4.— Description of Primary Outcome Variables
Variable Question(s) Analysis Variable Derivation
Cups of fruits Question 3, “During the past week, how many cups of fruit did your child eat each day? Do not include fruit juice.”a
Continuous variable in half-cup increments.
Cups of vegetables Question 5, “During the past week, how many cups of vegetables did your child eat each day?a
Continuous variable in half-cup increments.
Cups of fruits and vegetables
Questions 3 and 5 (above) Summed responses to questions 3 and 5 to create continuous variable in half-cup increments.
a Response options were in half-cup increments ranging from 0 to 3 cups. Mail questionnaires provided visuals for none, one, two, and three cups.

Exhibit I-5.— Description of Child Secondary Outcome Variables
Variable Question(s) Analysis Variable Derivation
Ate variety of fruits Question 2, “How many days during the past week did your child eat more than one kind of fruit each day? Do not include fruit juice.”a
Created continuous variable ranging from 0 to 7 using the midpoint for the 2-day responses (e.g., “1 to 2 days” was assigned a value of 1.5).
Ate variety of vegetables Question 4, “How many days during the past week did your child eat more than one kind of vegetable each day? Do not include vegetable juice.”a
Created continuous variable ranging from 0 to 7 using the midpoint for the 2-day responses.
Helped self to/requested fruit as snack
Question 9, “How many days during the past week did your child ask for or help himself or herself to fruit for a snack?”a
Created continuous variable ranging from 0 to 7 using the midpoint for the 2-day responses.
Helped self to/requested vegetable as snack
Question 13, “How many days during the past week did your child ask for or help himself or herself to a vegetable for a snack?”a
Created continuous variable ranging from 0 to 7 using the midpoint for the 2-day responses.
Willingness to try new fruits Question 7, “Is your child willing to try a new kind of fruit?”
Binary variable was created with “Yes” responses assigned a value of “1” and “No” or “Maybe” responses assigned a value of “0.”
Willingness to try new vegetables Question 11, “Is your child willing to try a new kind of vegetable?”
Binary variable was created with “Yes” responses assigned a value of “1” and “No” or “Maybe” responses assigned a value of “0.”
Child asked for fruits or vegetables instead of French fries at least some of the time when eating at fast food restaurants
Question 17, “During the past month, when eating out at a fast food restaurant, how often did your child ask for fruits or vegetables, for example, apple slices or carrot sticks, instead of French fries?”
Binary variable was created with “Almost always,” “Most of the times” and “Sometimes” assigned a value of “1” and “Never” and “Seldom” assigned a value of “0.”
a Response options were “None,” “1 to 2 days,” “3 to 4 days,” “5 to 6 days,” and “Every day.”

Exhibit I-6.— Description of Parent Secondary Outcome Variables
Variable Question(s) Analysis Variable Derivation
Availability of fruits and vegetables Question 1, “Were any of the following foods available in your home during the past week? bananas, apples, grapes, mangoes, kiwis, carrots, and jicamas Include fresh, frozen, canned, and dried foods.”
Created continuous variable ranging from 0 to 7 based on the number of “Yes” responses for availability of seven fruits and vegetables
Parent offered fruit as snack Question 8, “How many days during the past week did you give your child fruit as a snack?”a
Created continuous variable ranging from 0 to 7 using the midpoint for the 2-day responses.
Parent offered fruit at dinner Question 10, “How many days during the past week did you give your child fruit at dinner?”a
Created continuous variable ranging from 0 to 7 using the midpoint for the 2-day responses.
Parent offered vegetable as snack Question 12, “How many days during the past week did you give your child a vegetable as a snack?”a
Created continuous variable ranging from 0 to 7 using the midpoint for the 2-day responses.
Parent offered vegetable at dinner Question 14, “How many days during the past week did you give your child a vegetable at dinner?”a
Created continuous variable ranging from 0 to 7 using the midpoint for the 2-day responses.
Parent made child eat everything on his or her plate
Question 15, “How many days during the past week did you make your child eat everything on his or her dinner plate?”a
Created continuous variable ranging from 0 to 7 using the midpoint for the 2-day responses.
Parent ordered fruits or vegetables for child instead of French fries at least some of the time when eating at fast food restaurants
Question 16, “During the past month, when ordering food for your child at a fast food restaurant, how often did you order fruits or vegetables, for example, apple slices or carrot sticks, instead of French fries?”
Binary variable was created with “Almost always,” “Most of the times” and “Sometimes” assigned a value of “1” and “Never” and “Seldom” assigned a value of “0.”
a Response options were “None,” “1 to 2 days,” “3 to 4 days,” “5 to 6 days,” and “Every day.”

b. Model selection
The independent evaluation of the All 4 Kids program was based on a quasi-experimental design that included 12 Head Start childcare centers that were matched based on primary language (English or Spanish) and center size. A fully randomized design was not appropriate given that two of the centers (Martin Luther King and Professional Development Center) had been exposed to the intervention and needed to be assigned to the intervention condition to avoid potential contamination and compensatory behaviors. Centers matched to Martin Luther King and Professional Development Center were assigned to the comparison condition. Among the remaining centers, assignment to condition was random.
i. Potential seasonality effects
Data collection for the evaluation of the All 4 Kids program was planned in the spring of 2010. Because of data collection issues that arose in the course of program implementation, two centers—Kaufman and Atkinson-Gates—provided the All 4 Kids program and collected data from parents in the spring and again in the summer. To control for potential seasonality effects in the data, we examined whether parental reports of their children’s fruit and vegetable intake were significantly different between those surveyed during the spring period and those surveyed during the summer period. We ran one model comparing spring data to summer data in each center. Additionally, we ran a model that combined data from Kaufman and Atkinson-Gates; the third model combined parents from both centers to provide a larger sample. Each model was specified as a simple repeated-measures regression that examined the relative change (pre-intervention to post-intervention) between enrollment periods (spring or summer). None of the models demonstrated significant findings, indicating that parental data collected during the spring were not statistically different from parental data reported during the summer. Below we discuss the observations we made in the combined model.
In table I-5, the values in the difference column examine pre-intervention differences and post-intervention differences separately. The value in the overall column indicates the pre-intervention to post-intervention change (i.e., difference of differences) among spring responders relative to summer responders. These findings indicate a trend (marginally significant) at baseline such that parents surveyed during the spring reported higher levels of fruit and vegetable consumption than parents surveyed during the summer. This trend, however, was not evident at follow-up. Furthermore, the overall difference shows that change among spring responders is not significantly different from the change among summer responders. These findings support the decision to combine spring and summer responders in these two centers.
Table I-5.— Assessing the Impact of Seasonality Effects on Reported Outcomes
Period Spring
Mean (SE) Summer
Mean (SE) Difference (p-value)
Overall (p-value)
Baseline 2.66 (0.1645) 2.20 (0.1688) 0.46 (0.0539)
Follow-up 3.08 (0.1734) 2.87 (0.1869) 0.21 (0.4064)
Baseline to follow-up –0.25 (0.4796)
Note: SE = standard error

ii. Assessing the pair-matched cohort model vs. the repeated-measures cohort
Next, the pair-matched model was compared with the repeated-measures cohort model. Matching is commonly used for two purposes. First, it ensures a similar distribution of factors that might otherwise bias the impact estimates. For the independent evaluation of the All 4 Kids program, we felt it was important to have a similar distribution in terms of the primary language spoken by center participants and center size. We retain this benefit regardless of which analytic model we choose. Second, matching can improve the precision of the model when the matching of similar units reduces random error by a degree that is strong enough to offset the reduction in degrees of freedom. In a matched design, the loss of degrees of freedom is a function of basing the analysis on independent pairs (n = 6), rather than centers (n = 12).
The data in table I-6 show that there is no precision gained from employing pairs in the analysis. Inspection of the covariance parameters indicated that this occurs because the random effects associated with pairs were essentially zero. Our evaluation of modeling options shows that the repeated-measures cohort model comparing intervention centers to comparison centers offers a greater parsimony and provides a level of precision that is similar to the pair-matched model.
Table I-6.— Comparison of Factors Used to Select Statistical Models for the Independent Evaluation of All 4 Kids
Model Type
Treatment Impact
Standard Error
Degrees of Freedom
AIC (model fit)
Pair-matched model –.00465 0.1827 5 3,861.3
Repeated-measures cohort model
–.00465 0.1827 10 3,861.3
c. Repeated-measures cohort models for program outcomes
All 4 Kids was evaluated with a research design that includes multiple levels of nesting. The term “nested” refers to situations that arise when one unit of analysis is uniquely located in a supra-ordinate unit of analysis (i.e., cluster). The independent evaluation of All 4 Kids included repeated measures on individual respondents (e.g., observation nested within respondent), with respondents who are nested within centers and centers that are nested in a study condition (i.e., intervention or comparison). When data are nested, responses within the same cluster tend to be correlated. If the correlated nature of the data is ignored in the selection and specification of the model, it is likely to lead to inflated type-I error rates. The study team developed a series of hierarchical, or mixed-effects, regression models to evaluate All 4 Kids outcomes. These models account for correlated responses by allowing for the inclusion of multiple sources of random variation.
Below we provide additional detail on the sampling models and link functions that describe the statistical models used to assess program outcomes and the structural models that detail the explanatory variables and the model coefficients. The sampling models vary at level one depending on the characteristics of the outcome measure; these characteristics determine the appropriate link function. All sampling models at level two and higher are assumed to conform to the assumptions of linearity (McCulloch & Searle, 2001; Raudenbush & Bryk, 2002).

Primary outcomes include parents’ reports on children’s fruit and vegetable consumption in the home and a combined fruit and vegetable score derived from these measures. These outcomes have a continuous measure, so we employed general linear mixed models with Gaussian (i.e., normal) distributions and an identity link function. Secondary impact variables include both a continuous measure and dichotomous measures. For those based on dichotomous measures, we employed generalized linear mixed models with a binomial distribution and a logit link function.
The structural model is assumed to be a linear and additive function of the outcome variable; for the binary models, the assumptions of linearity and additivity apply to the transformed outcome variable. These models are determined by the research question addressed rather than by the characteristics of the outcome.
i. Sampling models and linking functions
The sampling model describes the expectation and distributional characteristics of the outcome at each level of the model. For the variables that constitute the outcomes of interest for this evaluation, level-one sampling models vary according to the characteristics of the outcome under consideration.
For variables that express the outcome of interest as a continuous measure, the level-one sampling model can be expressed as
( )2: : : : : :| ~ ,ti j k ti j k ti j kY Nμ μ σ . (1)
This indicates that, given the predicted value : :ti j kμ , the outcome ( ): :ti j kY measured at time t (t = 0, 1) for respondent i (i = 1... m) from the jth center (j = 1…10) assigned to the kth condition (k = 0, 1) is normally distributed with expected value of :j:μ ti k and a constant variance, 2σ . The expectations of these values are expressed as
:j: :j: :j:|ti k ti k ti kE Y μ μ⎡ ⎤ =⎣ ⎦ and ( ) 2:j: :j:Var ti k ti kY | μ σ= (2)
for the mean and variance, respectively. When the outcome of interest follows a normal distribution, it can be expressed directly as a function of a set of explanatory variables. However, to simplify the expression of the structural models that follow, we note that
:j: :j:ti k ti kη μ= , (3)
which indicates that the modeled outcome :j:ti kη is equal to the expected value of : :ti j kY .
The level-one sampling model for variables that express the outcome of interest as a binary outcome follows a binomial distribution that can be expressed as
( ):j: :j: :j: :j:| ~ ,ti k ti k ti k ti kY B sϕ ϕ, (4)
where :j:ti kY is the number of “successes” in each of :j:ti ks trials, and :j:ti kϕ represents the probability of success on each trial. In the evaluation of All 4 Kids, :j:ti ks = 1 and the binary variable follows a Bernoulli distribution where :j:ti kY takes on the value 1 (success) with probability :j:ti kϕ , and the expected value and variance of :j:ti kY can be expressed as
:j: :j: :j:|ti k ti k ti kE Y ϕ ϕ⎡ ⎤ =⎣ ⎦ and ( ) ( ):j: :j: :j: :j:Var | 1ti k ti k ti k ti kY ϕ ϕ ϕ= − . (5)

The canonical link when the level-one sampling distribution is binomial is the logit link, which can be expressed as follows:
:j:
:j:
:j:
log1ti k
ti k
ti k
ϕη
ϕ⎛ ⎞
= ⎜ ⎟⎜ ⎟−⎝ ⎠ (6)
and indicates that the modeled outcome : :ti j kη is equal to the log of the odds of success.
The sampling distributions for level-two (and higher) models express the characteristics of the modeled random effects. Here, the term ( )0: :j ku is used to indicate random effects. For all of the structural models presented below, random effects are assumed to follow a normal distribution with
( )20 : 0 : 0 :: j k : j k : j k uu | ~ N ,σζ ζ . (7)
ii. Structural models
The structural models are used to express the expectation of the outcome as the function of a series of explanatory variables. In general form,
: : : 0 : 0 :ti: j k ti: j k ti: j k : j k : j kx β z uη = +∑ ∑ . (8)
Here, :ti: j kη is the expected value of the outcome; : : : :ti j k ti j kx β∑ is a shorthand representation for the set of fixed-effect covariates and coefficients; and 0 : 0 :: j k : j kz u∑ is a shorthand representation for the set of random-effect covariates and coefficients.
As noted in the previous section, when the outcome of interest is represented by a variable that has a continuous measure, :ti: j kη represents the identity link, and from equation (3) it follows that
: : : :ti j k ti j kE Y η⎡ ⎤ =⎣ ⎦ . (9)
When the outcome of interest is represented by a binomial variable, :j:ti kE Y⎡ ⎤⎣ ⎦ is the predicted probability :j:ti kϕ which can be derived from equation (6) by taking ( ):exp ti: j kη as follows:
( ): :: :
11 expti j k
ti j k
E Yη
⎡ ⎤ =⎣ ⎦ +. (10)
For continuous outcomes, we employ general linear mixed models where the expectation for Yti:j:k in equation (9) is the appropriate form. However, when response options are binary, we employ generalized linear models where the expectation for Yti:j:k in equation (10) is the appropriate form.
(a) Generalized Hierarchical Linear Model (HLM) Presentation
The structural model used to assess the effects of All 4 Kids can be articulated as a three-level HLM. The observation-level model (level one) describes the outcome of interest as a function of initial status and change over time. The individual-level model (level two) includes two models, one for each of the two parameters of the observation-level model. The center-level model (level three) also includes two models, one for each of the intercepts in the two individual-level models.

Observation-level model (level one). In this model, kjti ::η represents the response of the ith parent or caregiver measured on occasion t, whose child attends the jth center and is in the kth condition. The model includes two parameters, one describing initial status, ( kji ::0β ) and the other describing the incremental change in kjti ::η associated with a one-unit change in the variable TIME. For this model, TIME is indexed as “0” for baseline measures and as “1” for follow-up measures, leading to the interpretation of kji ::1β as a change, or growth, parameter. Any variation between the predicted value and the observed value is accounted for by residual error ( kjtie :: ) in the Gaussian model but is a function of the expected probability in the Bernoulli model:2
kjtikjikjikjti e ::::1::0:: TIME++= ββη . (11)
Individual-level models (level two). At the respondent level, each of the parameters (β ) from the observation-level model is expanded. The first individual-level model, equation (12), describes kji ::0β , the initial status of the ith respondent in the jth center of the kth condition, as a function of the intercept value of all respondents associated with center j ( kj ::00γ ) and a random effect ( kjiu ::0 ) that allows for variation from the intercept value. A set of covariates characterizes the survey respondent (R_SEX, R_AGE, R_RACE), the index child (CH_SEX, CH_AGE), and the family household (HH); the coefficients associated with these covariates are not of direct interest.
0 : : 00: : 01: : 02: : 03: : 04: :
05: : 06: : 0 : :
CH_SEX+ CH_AGE+ R_SEX+ R_AGE+
R_RACE+ HHi j k j k j k j k j k j k
j k j k i j ku
β γ γ γ γ γ
γ γ
= +
+ (12)
kjikjkji u ::1::10::1 +γ=β (13)
The second student-level model, equation (13), describes kji ::1β , the change or growth over time of the ith respondent in the jth center of the kth condition as a function of the mean slope associated with center j (
ki ::10γ ) and a random effect ( kjiu ::1 ) that allows for individual variation from the center-specific slope. Given the structure of the data being modeled, kjiu ::1 is not directly estimable separate from kjtie :: , as noted in the mixed model specification by the brackets [ ] in equation (16) below.
Center-level models (level three). At the center level, the intercepts from the individual-level models are expanded. The first center-level model. equation (14), describes kj ::00γ , the initial status of the jth center of the kth condition as a function of the mean intercept value across all centers ( k:0:00λ ) and random effect ( kju ::00 ) that allows for center-to-center variation from the overall intercept value. This model includes an indicator variable (COND) identifying centers as a member of either the intervention or comparison condition; its coefficient ( k:1:00λ ) accounts for any difference in initial status between centers in the two conditions.
00: : 00:0: 00:1: 00: :CONDj k k k j kuγ λ λ= + + (14)
kjkkkj u ::10:1:10:0:10::10 COND+λ+λ=γ (15)
The second center-level model, equation (15), describes kj ::10γ , the change over time of the jth center of the kth condition as a function of the mean slope across all centers k:0:10λ and a random effect that ( 2 For the Bernoulli model, kp:iε is ( ): : : :1ti j k ti j kϕ ϕ− .

kju ::10 ) allows for center-to-center variation from the condition-specific mean slope. This model also includes an indicator variable (COND) identifying centers as a member of either the intervention or comparison condition; its coefficient ( k:1:10λ ) accounts for any difference in mean slope between centers in the two conditions.
(b) Generalized Mixed Model Presentation
The five models described above can be combined into the familiar mixed-effects model shown in equation (16). In this expression of the model, fixed-effect terms are presented in standard typeface, and random-effect terms are presented in bold typeface. Fixed effects associated with lambdas (λ ) represent center-level effects, while those associated with gammas ( γ ) represent individual-level effects.
: : 00:0: 00:1: 10:0: 10:1: 01: :
02: : 03: : 04: : 05: : 06: :
COND TIME COND*TIME CH_SEX
+ CH_AGE+ R_SEX+ R_AGE+ R_RACE+ HH
+
ti j k k k k k j k
j k j k j k j k j k
η λ λ λ λ γ
γ γ γ γ γ
= + + + +
⎡ ⎤⎣ ⎦00:j:k 0i:j:k 10:j:k 1i:j:k ti:j:ku + u + u TIME + u TIME + e .
(16)
In equation (16), TIMEi:j:ku1 is the component of variation associated with repeated measures within a person at a given point in time; as previously noted, that component cannot be estimated apart from residual error in this model and is dropped from further notation. Thus,
kjtikjkjkji euuu ::::10::00::0 TIME+++ represents the total variation in the outcome, Yti:j:k.
d. Analytic approaches for mixed-model regression
To account properly for the multiple sources of random variation that result from randomizing centers to conditions with measurements taken on the child and parent nested within those centers, the study specified multilevel regression equations using SAS PROC MIXED (SAS Institute, 2004) and SAS PROC GLIMMIX (SAS Institute, 2006) for general and generalized linear mixed models, respectively. These two procedures offer a flexible approach to modeling the longitudinal and multilevel regression models specified here. A primary strength of the mixed model approach is that multiple random effects can be modeled independently. Under the general linear mixed model, the random effects are assumed to be independent and normally distributed; the random effects necessary to avoid misspecification for each model are identified in the preceding subsection. The analyses can be extended to non-Gaussian data in the generalized linear mixed model through the appropriate specification of an alternative error distribution and link function. The standard errors estimated and significance tests conducted account for the fact that centers (not the child/parent) are the units of random assignment.
The models were estimated using restricted maximum likelihood (REML) for general linear mixed models and the restricted pseudo-likelihood (RPL) for generalized linear mixed models. These approaches provide parameter estimates by maximizing the probability that the predicted values agree with the observed data. They are iterative, similar to maximum likelihood (ML) estimation, but provide separate estimation for fixed and random effects. Separate estimation of the fixed and random components is less efficient, which may result in a slightly larger mean square error; however, estimates obtained in this manner are considered preferable because they produce less of a downward bias than ML estimates (Murray, 1998; SAS Institute, 2004, 2006).


Appendix J Methodology for Assessment of the Demonstration Project’s Evaluation


This section describes the methodology for our assessment of the evaluation of the All 4 Kids program conducted by UNCE. We identify the research questions, describe the research design and data sources, and discuss the analysis approach.
1. Research Questions
The purpose of the assessment of UNCE’s evaluation was to provide a detailed description of their evaluation methods, measure the quality of their evaluation, examine the soundness of the outcome measures, and determine the strengths and weaknesses of the evaluation’s design and implementation. Specifically, this assessment addressed the following three broad research questions:
• How did each demonstration project plan to and actually evaluate the success of its intervention(s)?
• What were the results of each demonstration project’s evaluation, and how do they compare with the contractor/FNS impact evaluation?
• What lessons are learned about each demonstration project’s evaluation?
2. Research Design and Data Sources
Determining the effectiveness of the UNCE evaluation required a clear understanding of the planning, design, and implementation of the evaluation based on both objective and subjective measures. To the extent possible, our assessment was based on objective information (e.g., the evaluation report prepared by UNCE). Qualitative methods were used to gather in-depth information as well as perspectives of key players in the evaluation (e.g., program administrators and the evaluation manager). We describe below the data sources for our assessment of UNCE’s evaluation, including the evaluation review form, evaluation cost form, abstraction of UNCE’s evaluation report, and the post-evaluation interview guide.
a. Evaluation review form
To assess the quality of UNCE’s evaluation, we used the evaluation review form provided in appendix G. To develop the evaluation review form, we started by emulating the data abstraction form that the Center for Substance Abuse Prevention used in developing the National Registry of Evidence-based Programs and Practices database, a service of the Substance Abuse and Mental Health Services Administration (http://www.nrepp.samhsa.gov). This is an evaluation form with which we had previous experience and had found to be valuable.
The evaluation review form includes eight criteria (see exhibit J-1), each of which is scored on a scale of 1 to 5, with 1 = “missing or so poorly described that its value to the evaluation cannot be determined” and 5 = “is appropriate for the program being evaluated and is presented in a way that shows the evaluator has a clear understanding of its role in the evaluation.”

Exhibit J-1.— Criteria for Assessing the Quality of UNCE’s Self-Evaluation
Evaluation Component Specific Criteria
Research objectives and hypothesis
Clarity of research questions and hypotheses that the evaluation addresses Alignment of evaluation goals and objectives with intervention activities
Viable comparison strategy
Appropriateness of the control or comparison group Threats to the validity of the design
Sampling size and strategy
Sample size estimation Method of selecting sample participants from population Recruitment plans
Outcome measures Quality of data collection instruments Alignment of evaluation measures with intervention activities
Data collection Overview of data collection schedule Rigor of data collection process Quality of the data collection process
Data analysis Sample characteristics and baseline comparability Statistical methods used to assess program impacts Additional statistical procedures and analyses
Attrition Attrition rate
Missing data Level of item nonresponse
b. Evaluation cost form
To document the resources used and costs incurred by UNCE to evaluate the All 4 Kids program, we provided UNCE with a series of tables to complete at the end of their project. These tables, which were specific to the evaluation phase of the All 4 Kids project, were included in the previously referenced Resource and Expense Tracking Form (see appendix G), which aimed to capture consistent resource and cost-related data for each of three phases of the All 4 Kids project—planning and design, implementation, and evaluation. The format of the tables and the information requested therein was consistent with FNS SNAP-Ed reporting requirements, thus minimizing reporting burden. Specifically, we requested data on the following:
• Human capital (e.g., staff roles and responsibilities, number of FTEs, as well as averages and ranges of salaries for each);
• Physical capital (e.g., printing, labels, computers, folders); and • Line-item expenditures (e.g., salary and benefits, materials, travel) by funding source (non-
Federal or Federal funds).
UNCE completed the evaluation cost tables and submitted them at the completion of the demonstration project, or once all evaluation-related costs had been incurred. We reviewed these forms for completeness and used this information to summarize UNCE evaluation-related costs.

c. Abstraction of demonstration project’s evaluation report
We provided UNCE with an outline for their evaluation report that followed directly from the evaluation review form. For each evaluation component, we developed an outline heading, thereby facilitating the UNCE Principal and Co-Principal Investigators in providing the type of data necessary for us to evaluate that aspect of their evaluation. The outline also included tables for providing information on outcome measures and the results of the evaluation. We then sent the outline report to the evaluation manager to review the populated information and provide the additional information requested. We reviewed and abstracted key information from the report to complete our assessment of UNCE’s evaluation.
d. Pre-evaluation and post-evaluation interview guides
We elicited primary data related to UNCE’s evaluation of the All 4 Kids program from five key stakeholders—the principal investigator, co-principal investigators, evaluator, and the program manager—through in-depth, open-ended discussions. This method was used to capture rich, subjective information both pre- and post-intervention. A pre-intervention interview, which focused on the planning and design of the evaluation, sought to capture the experiences and perspectives of, as well as lessons learned by the principal and co-principal investigators and evaluator on this phase of the project. Several questions related to anticipated challenges were also administered at this time. A post-intervention interview with the principal and co-principal investigators and program manager sought to capture similar information, but for the implementation and analysis phases of the evaluation. The post-intervention interview included the All 4 Kids program manager who was integral in documenting lessons learned with regard to the evaluation from a programmatic perspective. Because of the varying foci of the interviews at each of these key time periods, two interview guides were developed—one for use prior to the evaluation and one for use post-evaluation . Each guide was developed to be as concise as possible. Anticipated response time ranged from 60 minutes for the pre-evaluation interview and 120 minutes for the post-evaluation interview, based on the timing of the data collection and respondent type and number of respondents.
3. Analysis Approach
The assessment of the evaluation conducted by UNCE included a descriptive assessment of the management and costs of the evaluation; a descriptive assessment of the quality of their evaluation; a comparison of UNCE’s study design and results with the FNS independent evaluation; and an assessment of lessons learned based on the quality assessment, cost analysis, and reported factors affecting evaluation implementation. Our analysis procedures are described below.
a. Descriptive assessment of evaluation management and costs
To assess and describe UNCE’s management of their evaluation, including roles and responsibilities, training, and aspects of quality control, we gathered and compared descriptive information provided by UNCE through their evaluation report and key informant interviews. We applied an analysis approach similar to that described for the process evaluation, which entailed compiling key informant responses to each interview question into a master Microsoft Word 2007 document and identifying direct quotations where relevant to support key findings. Costs associated with the demonstration project’s own evaluation were reported directly by UNCE through the previously described evaluation cost form; these numbers were reported as is and were not manipulated or used for any additional calculations.

b. Descriptive assessment of the quality of UNCE’s evaluation
To assess the quality of UNCE’s evaluation, we used the evaluation review form provided in appendix G. We collected much of the data to complete the review form by examining UNCE’s evaluation report that was organized explicitly to address each of the evaluation criteria on our form. Other data were obtained from in-depth interviews with the UNCE program staff. RTI had two people rate the evaluation (one rater was the designated impact evaluation leader for the FNS evaluation). We assessed inter-rater agreement and came to a consensus score. In addition to reporting the score for each category and the overall score, we prepared a descriptive assessment of the strengths and weaknesses of UNCE’s evaluation and identified potential areas for improvement.
c. Comparison of UNCE’s study design and results with the FNS independent evaluation
We described the study design employed by UNCE for their evaluation and compared the designs of the UNCE and FNS independent evaluations, noting the similarities and differences in the two research designs and anticipated effects. We compared the results of UNCE’s evaluation with the FNS independent evaluation for constructs included in both evaluations, noting whether the results were similar or different in terms of direction and magnitude. The description of the study design and results of the UNCE evaluation was based on the abstraction of UNCE’s evaluation report and the interview with the evaluation manager and other program staff members.
d. Assessment of lessons learned
We used information collected primarily through key informant interviews to assess and describe lessons learned from the perspective of the demonstration project staff. Key informant responses to each interview question were entered into a master Microsoft Word 2007 document and reviewed for the identification of lessons the program manager reported learning through their evaluation of the All 4 Kids program.

Appendix K References


References Altarum Institute and RTI International. (2009, February). Model of Supplemental Nutrition Assistance
Program Nutrition Education and Evaluation, Final Nutrition Education Impact Measurements/Instruments Template.
Blitstein, J. L., Hannan, P. J., Murray, D. M., & Shadish, W. R. (2005). Increasing the degrees of freedom in existing group randomized trials: The df* approach. Evaluation Review, 29(3), 241–267.
Casey, P. H., Simpson, P. M., Gossett, J. M., Bogle, M. L., Champagne, C. M., Connell, C., et.al. (2006, November). The association of child and household food insecurity with childhood overweight status. Pediatrics, 118, e1406–e1413.
Copple, C. & Bredekamp, S. (Eds.). (2009). Developmentally Appropriate Practice in Early Childhood Programs Serving Children from Birth through Age 8 (3rd ed.). Washington, D.C.: National Association for the Education of Young Children.
Cullen, K. W., Baranowski, T., Owens, E., Marsh, T., Rittenberry, L., & de Moor, C. (2003). Availability, accessibility, and preferences for fruit, 100% fruit juice, and vegetables influence children’s dietary behavior. Health Education and Behavior, 30(5), 615–626.
Epstein, L. H., Valoski, A., Wing, R. R., & McCurley, J. (1990, November). Ten-year follow-up of behavioral family-based treatment for obese children. JAMA, 264, 2591–2523.
Evans, W. D., Necheles, J., Longjohn, M., & Christoffel, K. K. (2007). The 5-4-3-2-1 Go! intervention: Social marketing strategies for nutrition. Journal of Nutrition Education and Behavior, 39(2, supplement 1), s55–s59.
Fry, E. (1968). A readability formula that saves time. Journal of Reading, 11(7), 265–271.
Green, L. W., Kreuter, M. W., Deeds, S. G., & Partridge, K. B. (1980). Health education planning: A diagnostic approach. Palo Alto, CA: Mayfield Publishing Co.
Jamelske, E., Bica, L. A., McCarty, D. J., & Meinen, A. (2008). Preliminary findings from an evaluation of the USDA fresh fruit and vegetable program in Wisconsin schools. Wisconsin Medical Journal, 107(5), 225–230.
Knai, C., Pomerleau, J., Lock, K., & McKee, M. (2006). Getting children to eat more fruit and vegetables: A systematic review. Preventive Medicine, 42(2), 85–95.
Maher, E. Li, G., Carter, L., & Johnson, D. (2008, August). Preschool child care participation and obesity at the start of kindergarten. Pediatrics, 122(2), 322–330.
Marsh, T., Cullen, K. W., & Baranowski, T. (2003). Validation of a fruit, juice, and vegetable availability questionnaire. Journal of Nutrition Education Behavior, 35, 100–104.
McCulloch, C. E., & Searle, S. R. (2001). Generalized, linear, and mixed models. New York: John Wiley and Sons, Inc.

Mullen, P. D., Hersey, J. C., & Iverson, D. C. (1987). Health behavior models compared. Social Science and Medicine, 24, 973–981.
Murray, D. M. (1998). Design and analysis of group-randomized trials. New York: Oxford University Press.
Murray, D. M., Phillips, G. A., Birnbaum, A. S., & Lytle, L. A. (2001). Intraclass correlation for measures from a middle school nutrition intervention study: Estimates, correlates, and applications. Health, Education, and Behavior, 28(6), 666–679.
Murray, D. M., Hannan, P. J., & Baker, W. L. (1996). A Monte Carlo study of alternative responses to intraclass correlation in community trails: Is it ever possible to avoid Cornfield’s penalties? Evaluation Review, 20(3), 313–337.
Pate, R., Pfeiffer, K. A., Trost, S. G., Ziegler, P., & Dowda, M. (2004, November). Physical activity among children attending preschools. Pediatrics, 114, 1258–1263.
Pica, R, (2006) A Running Start: How Play, Physical Activity and Free Time Create a Successful Child. New York, New York: Marlowe and Company.
Polhamus, B., Dalenius, K., Borland, E., Smith, B., & Grummer-Strawn, L. (2007). Pediatric nutrition surveillance report 2006. Atlanta, GA: Department of Health and Human Services, Centers for Disease Control and Prevention.
Raudenbush, S. W., & Bryk, A. S. (2002). Hierarchical linear models: Applications and data analysis methods (2nd ed.). Thousand Oaks, CA: Sage Publications.
SAS Institute (2004). SAS procedures guide, on-line version 9. Cary, NC: SAS Institute, Inc.
SAS Institute (2006). Multilevel modeling of hierarchical and longitudinal data using SAS. Cary, NC: SAS Institute, Inc.
Satter, E. (2007). Eating competence: Nutrition education with the Satter eating competence model. Journal of Nutrition Education and Behavior, 39, S189–S194.
Shonkoff, J. P., & Phillips, D. A., eds. (2000). From neurons to neighborhoods: The science of early childhood development. Washington, DC: National Academy Press.
Townsend, M. S., Kaiser, L. L., Allen, L., Joy, A., & Murphy, S. (2003). Selecting items for a food behavior checklist for a limited-resource audience. Journal of Nutrition Education and Behavior, 35(2), 69–82.
Townsend, M., Sylva, K., Martin, A., Metz, D., & Wooten-Swanson, P. (2008). Improving readability of an evaluation tool for low-income clients using visual information processing theories. Journal of Nutrition Education and Behavior, 40(3), 181–186.
U.S. Department of Agriculture. (2011, August 4).ChooseMyPlate.gov. Retrieved from http://www.choosemyplate.gov.
U.S. Department of Agriculture, Center for Nutrition Policy and Promotion. (2011). Dietary Guidelines for Americans. Retrieved from http://www.cnpp.usda.gov/DGAs2010-PolicyDocument.htm.

U.S. Department of Agriculture, Food and Nutrition Service. (2006, September). Food Stamp Nutrition Education systems review: Final report. Retrieved from http://www.fns.usda.gov/ora/menu/published/NutritionEducation/Files/FSNEP-FinalReport.pdf.
U.S. Department of Agriculture, Food and Nutrition Service. (2011). Supplemental Nutrition Assistance Program Education (SNAP-Ed) Plan Guidance FY 2012. Retrieved from http://www.nal.usda.gov/fsn/Guidance/FY2012SNAP-EdGuidance.pdf.
University of Nevada Cooperative Extension. (2008). UNCE models of food stamp nutrition and education demonstration project application. Submitted to the U.S. Department of Agriculture, Food and Nutrition Service.
University of Nevada Cooperative Extension. (2011). UNCE evaluation report. Submitted to Altarum Institute and RTI International.
Zucker, D. M. (1990). An analysis of variance pitfall: The fixed effects analysis in a nested design. Education and Psychological Measurement, 50, 731–738.