smrp best practices metrics workshop · [work completed on preventive maintenance work orders,...
TRANSCRIPT

SMRP BEST PRACTICES METRICS WORKSHOP
Copyright SMRP 2018
Safety Topic
Copyright SMRP 2018
Copyright SMRP 2018
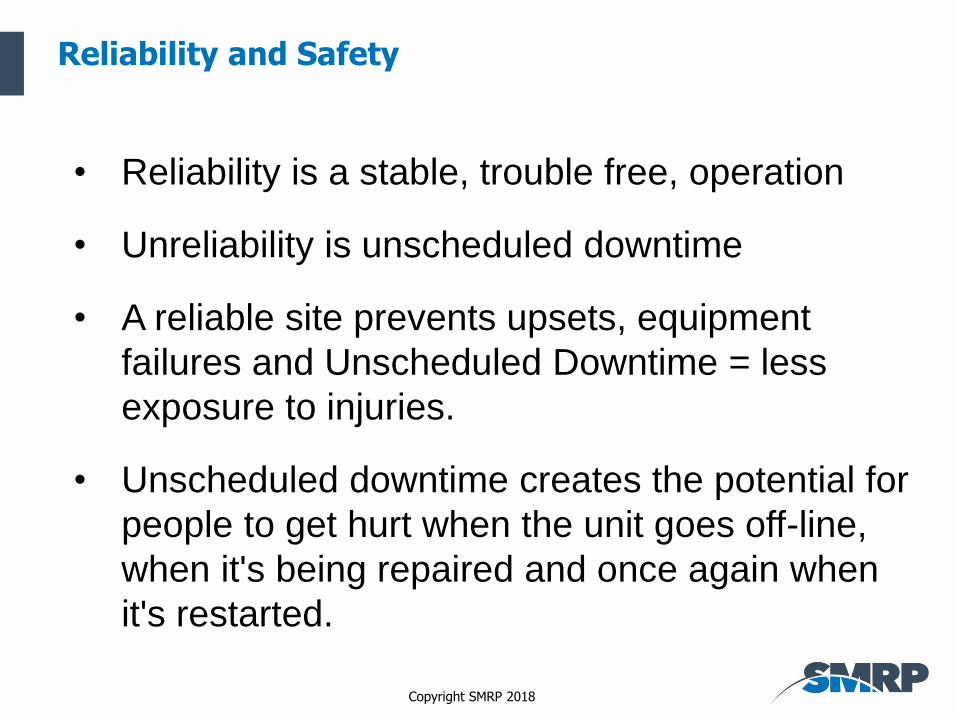
Reliability and Safety
• Reliability is a stable, trouble free, operation
• Unreliability is unscheduled downtime
• A reliable site prevents upsets, equipment
failures and Unscheduled Downtime = less
exposure to injuries.
• Unscheduled downtime creates the potential for
people to get hurt when the unit goes off-line,
when it's being repaired and once again when
it's restarted.
Copyright SMRP 2018
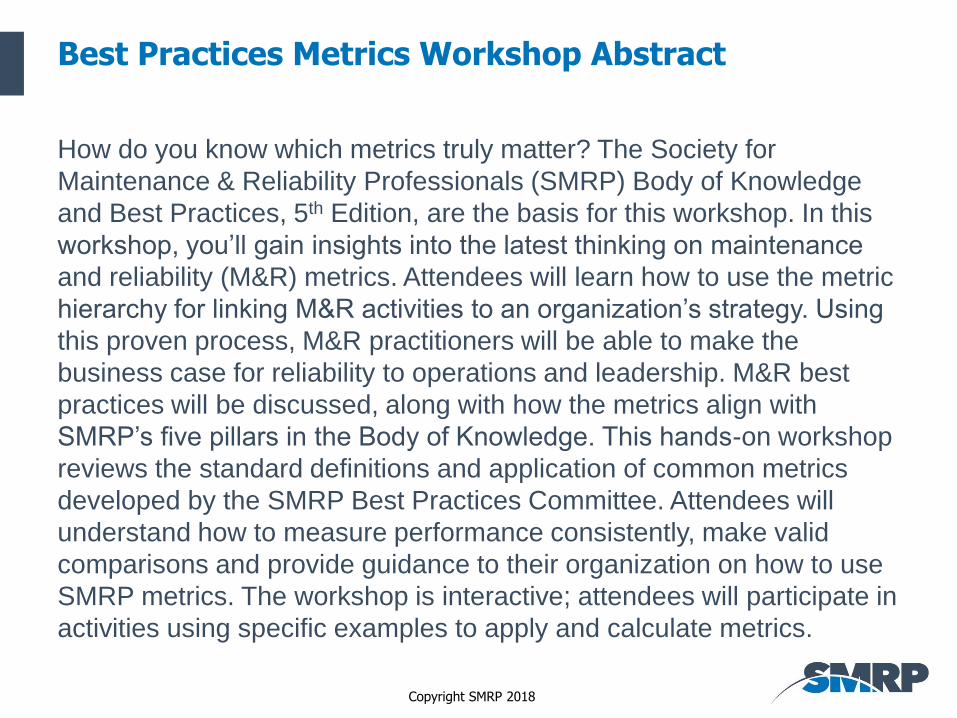
Best Practices Metrics Workshop Abstract
How do you know which metrics truly matter? The Society for
Maintenance & Reliability Professionals (SMRP) Body of Knowledge
and Best Practices, 5th Edition, are the basis for this workshop. In this
workshop, you’ll gain insights into the latest thinking on maintenance
and reliability (M&R) metrics. Attendees will learn how to use the metric
hierarchy for linking M&R activities to an organization’s strategy. Using
this proven process, M&R practitioners will be able to make the
business case for reliability to operations and leadership. M&R best
practices will be discussed, along with how the metrics align with
SMRP’s five pillars in the Body of Knowledge. This hands-on workshop
reviews the standard definitions and application of common metrics
developed by the SMRP Best Practices Committee. Attendees will
understand how to measure performance consistently, make valid
comparisons and provide guidance to their organization on how to use
SMRP metrics. The workshop is interactive; attendees will participate in
activities using specific examples to apply and calculate metrics.
Copyright SMRP 2018
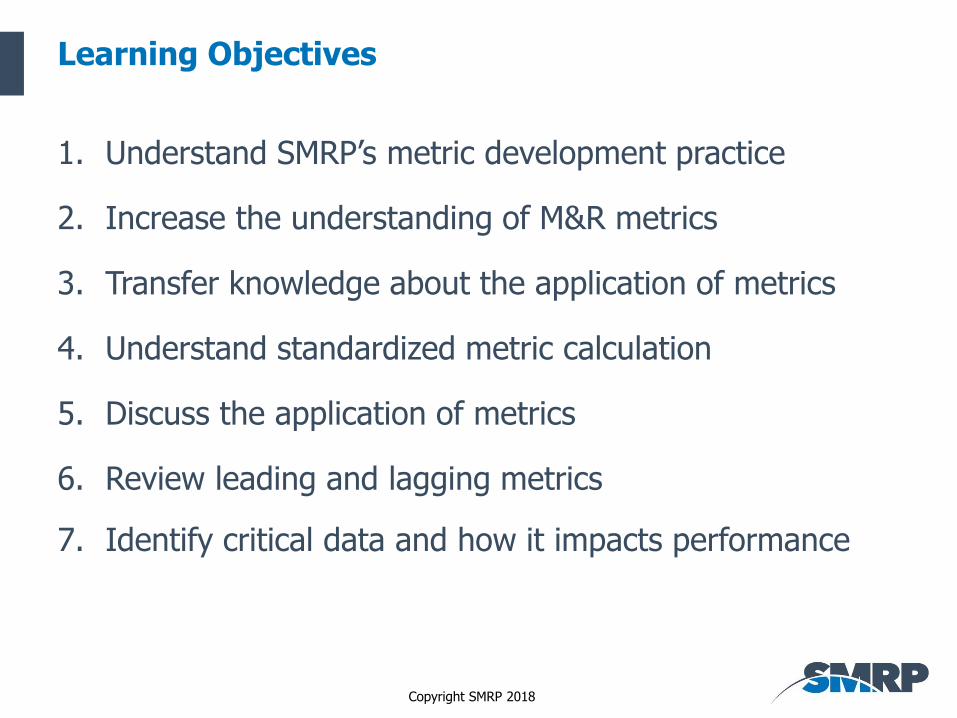
Learning Objectives
1. Understand SMRP’s metric development practice
2. Increase the understanding of M&R metrics
3. Transfer knowledge about the application of metrics
4. Understand standardized metric calculation
5. Discuss the application of metrics
6. Review leading and lagging metrics
7. Identify critical data and how it impacts performance

Copyright SMRP 2018
Today’s Agenda
1. Introductions and Workshop Objectives
2. History of SMRP and Metric Development Process
3. Sample Metric Calculations
4. Why Use Maintenance and Reliability Metrics
5. Group Exercise; Speedy Mac Reliability Products (SMRP)
6. Selecting the Right Metrics
7. Benchmarking
8. Critical Information Needs
9. Data Quality
10.Summary
Copyright SMRP 2018
Introductions
1. Your name and where do you live?
2. Who do you work for?
3. What’s your job?
4. What is your interest in reliability management?
5. What do you want to get from today’s
workshop?
6. Tell us an interesting fact about
yourself
0
7.50
15
22.5

Copyright SMRP 2018
Introductions
1. Your name and where do you live?
2. Who do you work for?
3. What’s your job?
4. What is your interest in reliability management?
5. What do you want to get from today’s
workshop?
6. Tell us an interesting fact about
yourself
0
7.50
15
22.5

Copyright SMRP 2018
Introductions
1. Your name and where do you live?
2. Who do you work for?
3. What’s your job?
4. What is your interest in reliability management?
5. What do you want to get from today’s
workshop?
6. Tell us an interesting fact about
yourself
0
7.50
15
22.5

Copyright SMRP 2018
Introductions
1. Your name and where do you live?
2. Who do you work for?
3. What’s your job?
4. What is your interest in reliability management?
5. What do you want to get from today’s
workshop?
6. Tell us an interesting fact about
yourself
0
7.50
15
22.5
Copyright SMRP 2018
Instructor Biography

Copyright SMRP 2018
Key SMRP BOK Documents

Copyright SMRP 2018
Today’s Workshop is Interactive

Copyright SMRP 2018
Section 2
Section 2:SMRP History and the Metric Development
Process

Copyright SMRP 2018
Learning Objectives
1. Review History of SMRP
2. Understand the Metric Development Process
3. European Federation of National Maintenance Societies (ERNMS) and SMRP Harmonization Project

Copyright SMRP 2018
History of SMRP
• SMRP – Society for Maintenance & Reliability
Professionals
• An organization “By Practitioners, for Practitioners”
• Formed and Chartered in 1992
• 6500+ members worldwide
• 210 Executive Company members
• SMRP’s certifying organization, SMRPCO, manages the
certification program for M&R professionals
Copyright SMRP 2018
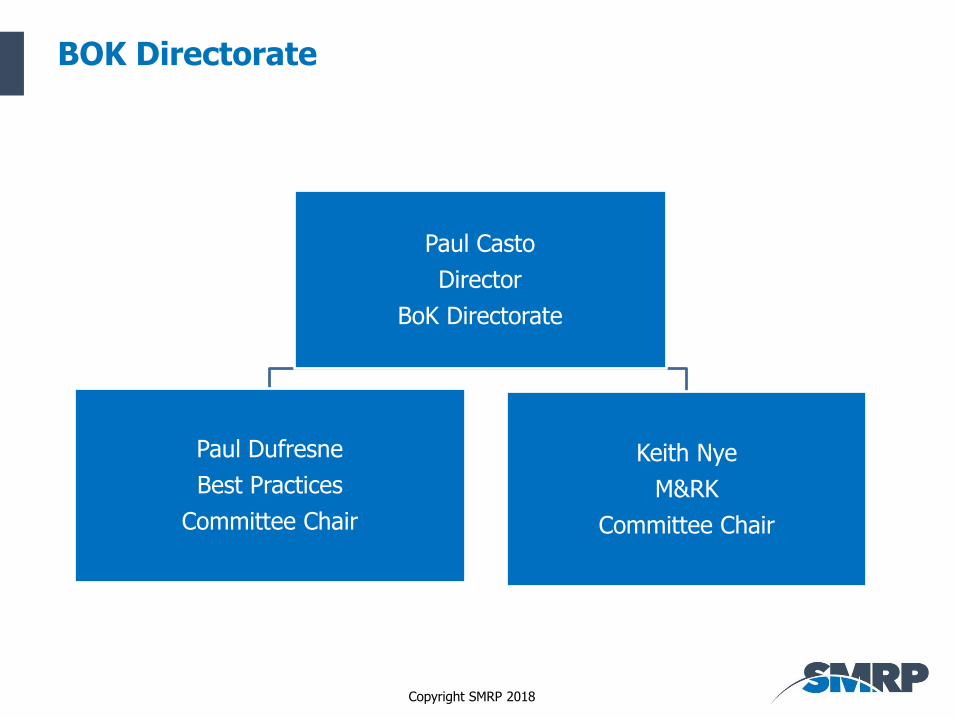
BOK Directorate
Paul Casto
Director
BoK Directorate
Paul Dufresne
Best Practices
Committee Chair
Keith Nye
M&RK
Committee Chair

Copyright SMRP 2018
Body of Knowledge Mission
Establish SMRP as a Global Authority on theMaintenance and Reliability Body of Knowledgefor Best Asset Management Practices.

Copyright SMRP 2018
SMRP Metric Initiative
Benchmarking
Committee
Require Standard
Definitions
Best Practices Committee
Formed
0

Copyright SMRP 2018
Purpose of SMRP Metrics Initiative
1. Develop maintenance and reliability metrics using common terminology
2. Standardize M&R terms and definitions (Glossary)
3. Establish standard calculation methods for metrics
4. Provide a common platform to benchmark performance between peers and across industry verticals

Copyright SMRP 2018
Purpose of SMRP Metrics Initiative
Why do we need standardization and common terminology?

Copyright SMRP 2018
Define Maintenance
Everyone grab your pen and write down your definition of maintenance and be prepared to read it to the class.
0
7.50
15
22.5
Copyright SMRP 2018
Defining Maintenance
The set of actions taken to ensure that systems, equipment and components provide their intended functions when required. (The primary focus of this definition is on maintaining the intended function of an item rather than its design performance.) Many designs provide excess performance capacity or endurance as an inherent characteristic of the design (e.g. the pump selected for a system may be rated at 100 gpm when the system design requirement is only 75 gpm). Maintenance that is oriented to sustaining excess capability not needed for operations expends resources without benefit. This is not good maintenance practice. This definition requires the function being maintained to be available when it is required. Since certain functions, such as weapons firing and overpressure relief, may not be required continuously, there may be a need to verify their availability. The terms “component, equipment and systems”, as used in this definition, apply to hardware at a particular level where the analysis is being performed. This may be a system, a subsystem, equipment or component, depending on the specific task being examined.

Copyright SMRP 2018
Break into Groups
Take five minutes and describe what you think a good process would be to develop common, standard metrics
1:15
2:30
3:45
0:005:00

Copyright SMRP 2018
What Did Your Group Agree On?

Copyright SMRP 2018
Metrics Development Process

Copyright SMRP 2018
Metric Definition Process
A. Definition
B. Objectives
C. Formula
D. Component Definitions
E. Qualifications
F. Sample Calculation
G. Best in Class Target
H. Cautions
I. Harmonization Comments
J. References
Standard Approach to Defining Metrics

Copyright SMRP 2018
Metrics and the Five Pillars
Pillar 1 - Business and Management
1.1 - Ratio of Replacement Asset Value (RAV) to Craft-Wage Head Count
1.3 - Maintenance Unit Cost
1.4 - Stocked Maintenance, Repair, and Operating (MRO) Inventory Value as a Percent of Replacement Value
1.5 - Total Maintenance Cost as a Percent of Replacement Asset Value (RAV)
Pillar 2 - Manufacturing Process Reliability
2.1.1 - Overall Equipment Effectiveness (OEE)
2.1.2 - Total Effective Equipment Performance (TEEP)
2.2 - Availability
2.3 - Uptime
2.4 - Idle Time
2.5 - Utilization Time
Copyright SMRP 2018
Metrics and the Five Pillars
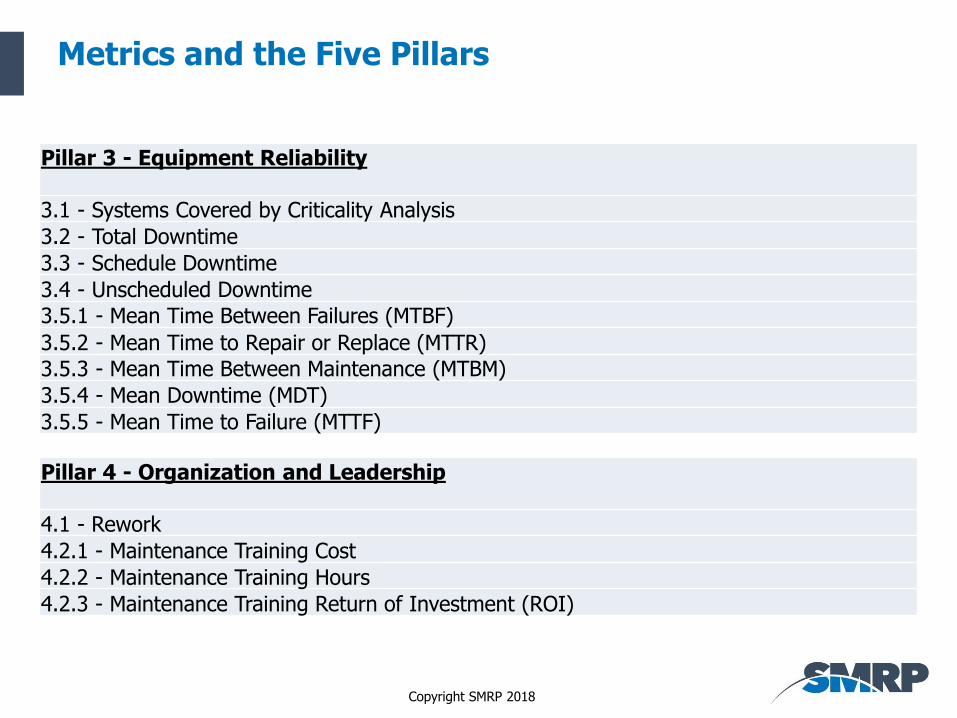
Pillar 3 - Equipment Reliability
3.1 - Systems Covered by Criticality Analysis
3.2 - Total Downtime
3.3 - Schedule Downtime
3.4 - Unscheduled Downtime
3.5.1 - Mean Time Between Failures (MTBF)
3.5.2 - Mean Time to Repair or Replace (MTTR)
3.5.3 - Mean Time Between Maintenance (MTBM)
3.5.4 - Mean Downtime (MDT)
3.5.5 - Mean Time to Failure (MTTF)
Pillar 4 - Organization and Leadership
4.1 - Rework
4.2.1 - Maintenance Training Cost
4.2.2 - Maintenance Training Hours
4.2.3 - Maintenance Training Return of Investment (ROI)
Copyright SMRP 2018
Metrics and the Five Pillars
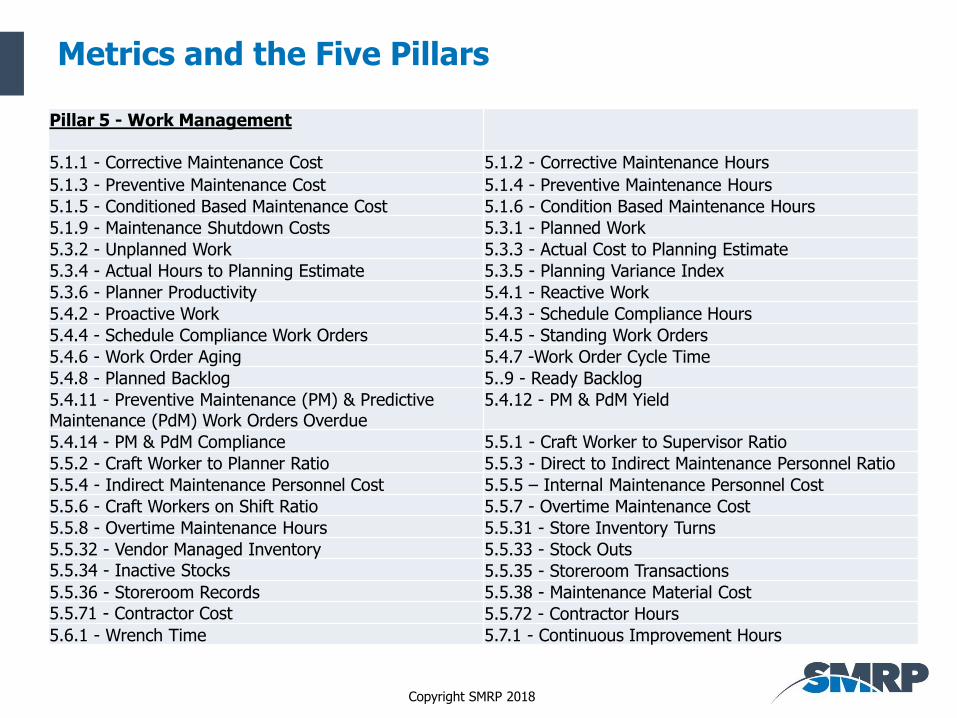
Pillar 5 - Work Management
5.1.1 - Corrective Maintenance Cost 5.1.2 - Corrective Maintenance Hours
5.1.3 - Preventive Maintenance Cost 5.1.4 - Preventive Maintenance Hours
5.1.5 - Conditioned Based Maintenance Cost 5.1.6 - Condition Based Maintenance Hours
5.1.9 - Maintenance Shutdown Costs 5.3.1 - Planned Work
5.3.2 - Unplanned Work 5.3.3 - Actual Cost to Planning Estimate
5.3.4 - Actual Hours to Planning Estimate 5.3.5 - Planning Variance Index
5.3.6 - Planner Productivity 5.4.1 - Reactive Work
5.4.2 - Proactive Work 5.4.3 - Schedule Compliance Hours
5.4.4 - Schedule Compliance Work Orders 5.4.5 - Standing Work Orders
5.4.6 - Work Order Aging 5.4.7 -Work Order Cycle Time
5.4.8 - Planned Backlog 5..9 - Ready Backlog
5.4.11 - Preventive Maintenance (PM) & Predictive Maintenance (PdM) Work Orders Overdue
5.4.12 - PM & PdM Yield
5.4.14 - PM & PdM Compliance 5.5.1 - Craft Worker to Supervisor Ratio
5.5.2 - Craft Worker to Planner Ratio 5.5.3 - Direct to Indirect Maintenance Personnel Ratio
5.5.4 - Indirect Maintenance Personnel Cost 5.5.5 – Internal Maintenance Personnel Cost
5.5.6 - Craft Workers on Shift Ratio 5.5.7 - Overtime Maintenance Cost
5.5.8 - Overtime Maintenance Hours 5.5.31 - Store Inventory Turns
5.5.32 - Vendor Managed Inventory 5.5.33 - Stock Outs
5.5.34 - Inactive Stocks 5.5.35 - Storeroom Transactions
5.5.36 - Storeroom Records 5.5.38 - Maintenance Material Cost
5.5.71 - Contractor Cost 5.5.72 - Contractor Hours
5.6.1 - Wrench Time 5.7.1 - Continuous Improvement Hours

Copyright SMRP 2018
EFNMS-SMRP Metric Harmonization
• European Federation of National Maintenance Societies, Developed European standard EN 15341
• EFNMS and SMRP Developed List of harmonized metrics

Copyright SMRP 2018
EFNMS 22 Members

Copyright SMRP 2018
EFNMS
Copyright SMRP 2018
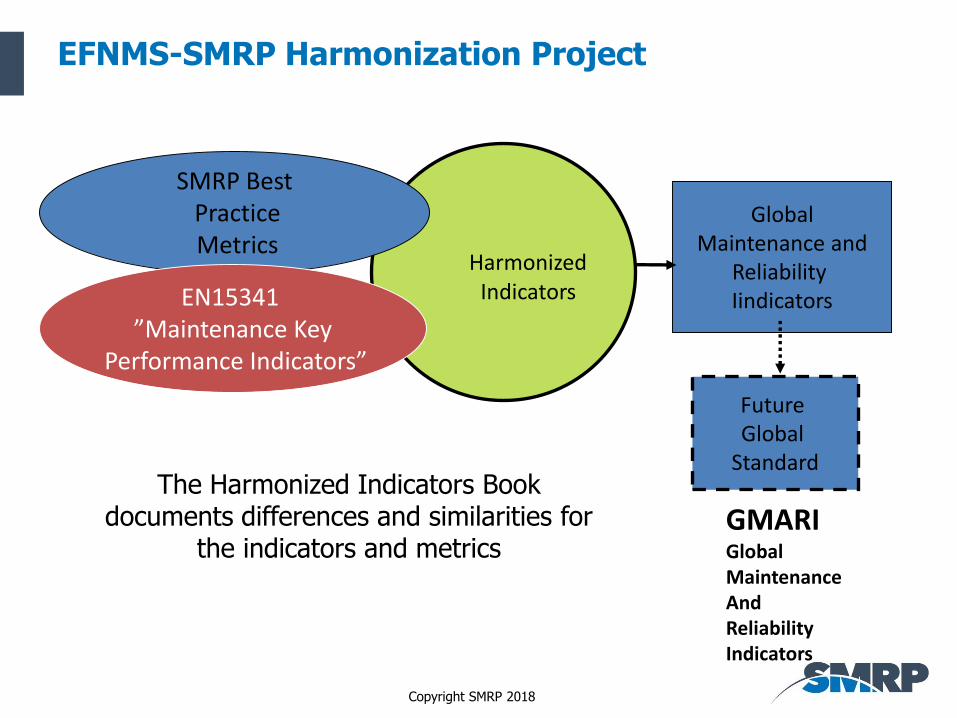
EFNMS-SMRP Harmonization Project
HarmonizedIndicators
Future Global
Standard
GlobalMaintenance and
Reliability Iindicators
The Harmonized Indicators Book documents differences and similarities for
the indicators and metrics
SMRP BestPracticeMetrics
EN15341 ”Maintenance Key
Performance Indicators”
GMARIGlobalMaintenanceAndReliabilityIndicators

Copyright SMRP 2018
The Harmonization Process
EN 15341 Indicator
SMRP Best Practice Metric
Compare
Common?End ProcessNo
Eliminate Differences /Qualify and
Explain
Yes

Copyright SMRP 2018
Harmonization Classification
Each harmonized indicator is given a qualitative classification
IDENTICAL – the bases of the indicators are the same, although there
may be some differences in how they are presented. The differences are
detailed in the comments.
SIMILAR – there are some differences in the differences that are detailed
in the comments.
SAME PERFORMANCE – the indicators measure the same performance
area, but there are significant differences in the definitions or calculations
that are detailed in the comments.

Copyright SMRP 2018
Section 3
Section 3
Sample Metric Calculations
Copyright SMRP 2018
Learning Objectives
1. Understand how metrics are documented in the BP Compendium
2. Learn the standardized process for metric calculation

Copyright SMRP 2018
Sample Metric Calculations

Copyright SMRP 2018
Metric 5.4.2 Proactive Work
• Refer to the Metric Definition 5.4.2 handout as we walk through the document and the sample calculation
• Lets calculate together Proactive Work for each of the three sample plants A, B and C.
A. Definition
B. Objectives
C. Formula
D. Component Definitions
E. Qualifications
F. Sample Calculation
G. Best in Class Target
H. Cautions
I. Harmonization Comments
J. References
Remember there are 10 elements

Copyright SMRP 2018
Metric 5.4.2 Proactive Work
DEFINITIONThis metric is maintenance work that is completed to avoid failures or to identify defects that could lead to failures. Includes routine preventive and predictive maintenance activities and corrective work tasks identified from them.
OBJECTIVES
This metric is used to measure and monitor the amount of work that is being done in order to prevent failures or to identify defects that could lead to failures.
FORMULA
Proactive Work (%) =
[Work completed on preventive maintenance work orders, predictive maintenance work orders, and corrective work identified from preventive and predictive work orders (hours) / Total Maintenance Labor Hours] × 100
PW (%) = (PWC / TML) × 100

Copyright SMRP 2018
Metric 5.4.2 Proactive Work
• % Proactive work =
PM + PdM + Corrective from PM & PdM X 100
Total Maintenance Labor Hours
• Let’s look at the definitions for:
PM, PdM, Corrective work, Failure, Total Maintenance Labor Hours

Copyright SMRP 2018
Metric 5.4.2 Proactive Work Component Definitions
Preventive Maintenance (PM)
Actions performed on a time- or machine-run-based schedule that detect, preclude or mitigate degradation of a component or system with the aim of sustaining or extending its useful life through controlling degradation to an acceptable level.
Predictive Maintenance
An equipment maintenance strategy based on assessing the condition of an asset to determine the likelihood of failure and then taking appropriate action to avoid failure. The condition of equipment can be measured using condition monitoring technologies, statistical process control, equipment performance indicators or through the use of human senses.
Copyright SMRP 2018
Metric 5.4.2 Proactive Work Component Definitions
Corrective Work Identified from Preventive and Predictive Maintenance Work Orders
Work identified from preventive maintenance (PM) and predictive maintenance (PdM) work orders is work that was identified through PM and/or PdM tasks and completed prior to failure in order to restore the function of an asset.
Failure
When an asset is unable to perform its required function.
Copyright SMRP 2018
Metric 5.4.2 Proactive Work Component Definitions
Total Maintenance Labor Hours
Expressed in hours and includes all maintenance labor hours for normal operating times as well as outages, shutdowns and turnarounds. If operator hours spent on maintenance activities are captured, they should be included in the numerator and denominator of all applicable metrics. Include labor hours for capital expenditures directly related to end-of-life machinery replacement so that excessive replacement versus proper maintenance is not masked. Does not include labor hours used for capital expansions or improvements. Typically, total maintenance labor hours do not include temporary contractor labor hours.
Copyright SMRP 2018
Metric 5.4.2 Proactive Work Component Definitions
Total Maintenance Labor Hours
• Expressed in hours and includes all maintenance labor hours for normal operating times as well as outages, shutdowns and turnarounds.
• If operator hours spent on maintenance activities are captured, they should be included in the numerator and denominator of all applicable metrics.
• Include labor hours for capital expenditures directly related to end-of-life machinery replacement so that excessive replacement versus proper maintenance is not masked. Does not include labor hours used for capital expansions or improvements.
• Typically, total maintenance labor hours do not include temporary contractor labor hours.

Copyright SMRP 2018
Calculate Metric 5.4.2 Proactive Work
% Proactive work =
PM + PdM + Corrective from PM & PdM X 100
Total Maintenance Labor Hours
No.
Data Units Plant A Plant B Plant C
2-7 Total Maintenance Hours
Hrs/Year 82,799 311,291 460,021
4-4 Corrective Work Identified
Hrs/Month 1,939 2,529 411
4-9 PM/PdM Work Completed
Hrs/Month 2,456 3,995 1,765

Copyright SMRP 2018
Metric 5.4.2 Proactive Work Calculation

Copyright SMRP 2018
Metric 5.4.2 Proactive Work
% Proactive work =
PM + PdM + Corrective from PM & PdM X 100
Total Maintenance Labor Hours
= 2456 + 1939 = 64.5% for plant A
(82,799/12)
25.1% for plant B, 5.7% for plant C

Copyright SMRP 2018
Metric 5.4.2 Proactive Work
Concerns at each facility?
What is included in Proactive work?
What is Corrective work?
What is the difference between Proactive and Reactive Work?
PM, PdM and Corrective work ID’d from PM and PDM that was done before the failure
Corrective work is done after the failure or when a failure
is imminent. Corrective work can be either Proactive or
reactive

Copyright SMRP 2018
Proactive WorkThis metric is maintenance work that is completed to avoid failures or to identify defects that could lead to failures. Includes routine preventive and predictive maintenance activities and corrective work tasks identified from them.
Reactive workThis metric is maintenance work that interrupts the weekly schedule, calculated as a percentage of the total maintenance labor hours.
Is reactive work planned or unplanned work?
Is proactive work planned or unplanned work?
Copyright SMRP 2018
Section 3
Section 4
Why Use Maintenance and Reliability Metrics

Copyright SMRP 2018
Learning Objectives
1. Why Use Metrics?
2. Linking Business Results to the Shop Floor
3. Metric Hierarchy

Copyright SMRP 2018
Why Use Metrics
“If you don’t measure it, you can’t manage it”
Dr. Joseph Juran

Copyright SMRP 2018
Why Use Metrics
Metrics
Common Language Communication
Challenge
Best PracticesImprovement
Celebrate
Copyright SMRP 2018
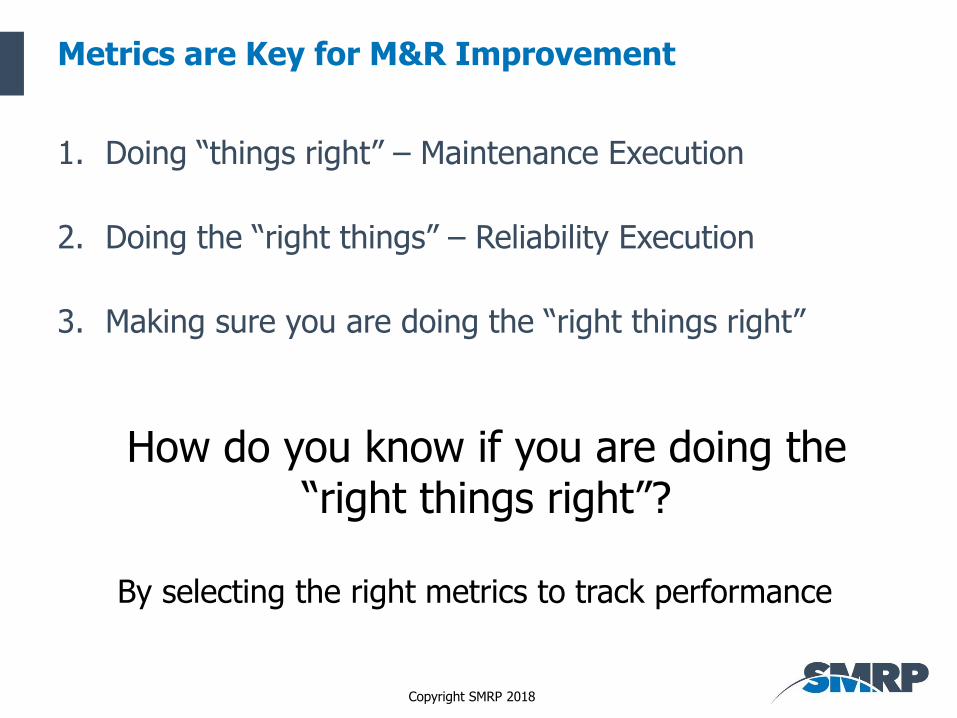
Metrics are Key for M&R Improvement
1. Doing “things right” – Maintenance Execution
2. Doing the “right things” – Reliability Execution
3. Making sure you are doing the “right things right”
How do you know if you are doing the “right things right”?
By selecting the right metrics to track performance

Copyright SMRP 2018
Linking M&R to Business Results
CORPORATEStrategic
Metric Classification Metric Hierarchy
INDUSTRY PERFORMANCE/EFFECTIVENESS
OPERATING EFFECTIVENESS COST EFFECTIVENESS
Operating
CAPITAL EFFECTIVENESS
RELIABILTY MANAGEMENT
STORES EFFECTIVENESS
WORK PROCESS EFFICIENCY
PROGRAM EFFECTIVENESS
Effectiveness(Tactical)

Copyright SMRP 2018
Comparing Apples to Apples
When comparing figures and evaluating results please take into account:
• Location
• Laws & regulations
• Process severity
• Plant size
• Age of the plant
• Others
• It is better to be consistently inaccurate than absolutely correct?
• Consider using metrics that are cost independent … man-hours
Example:Labor costs vary widely across the
globe

Copyright SMRP 2018
Linking Business and Shop Floor
Work OrdersPM, PdM, CBMBolts and NutsBearings
Market PositionCost of Goods SoldRevenueReturn on Capital
METRICS

Copyright SMRP 2018
Goals and Strategies for Maintenance
Methods
Vision for company
Mission for company
Companyvalues
(The way thingsare done)
Maintenance policy
Goals/objectives
Strategy
Activities
Organization
Technical

Copyright SMRP 2018
Line of Sight to Top Goals
• How do you pick your metrics?
• What are the linkages from measurements to goals?
• Need a clear line of sight to the top vision and mission, otherwise you will be measuring things that have no impact on top goals

Copyright SMRP 2018
Metrics Linked to Business Goals
CORPORATEStrategic
Metric Classification Metric Hierarchy
INDUSTRY PERFORMANCE/EFFECTIVENESS
OPERATING EFFECTIVENESS COST EFFECTIVENESS
Operating
CAPITAL EFFECTIVENESS
RELIABILTY MANAGEMENT
STORES EFFECTIVENESS
WORK PROCESS EFFICIENCY
PROGRAM EFFECTIVENESS
Effectiveness(Tactical)

Copyright SMRP 2018
Metric Hierarchy
CORPORATERONA, ROCE, ROA
Strategic Corporate Metrics:Return on Net Assets (RONA)Return on Capital Expended (ROCE)Return on Assets (ROA)Return on Active Capital Employed (ROACE)Return on Average Assets (ROAA)Return on Invested Capital (ROIC)True Reject Rate (TRR)
Strategic
CORPORATEStrategic Metric Classification Metric Hierarchy
INDUSTRYPERFORMANCE/EFFECTIVENESS
OPERATINGEFFECTIVENESS COSTEFFECTIVENESS CAPITALEFFECTIVENESS
Operating
RELIABILTYMANAGEMENT STORESEFFECTIVENESS
WORKPROCESSEFFICIENCY
PROGRAMEFFECTIVENSS
Effectiveness (Tactical)
Copyright SMRP 2018
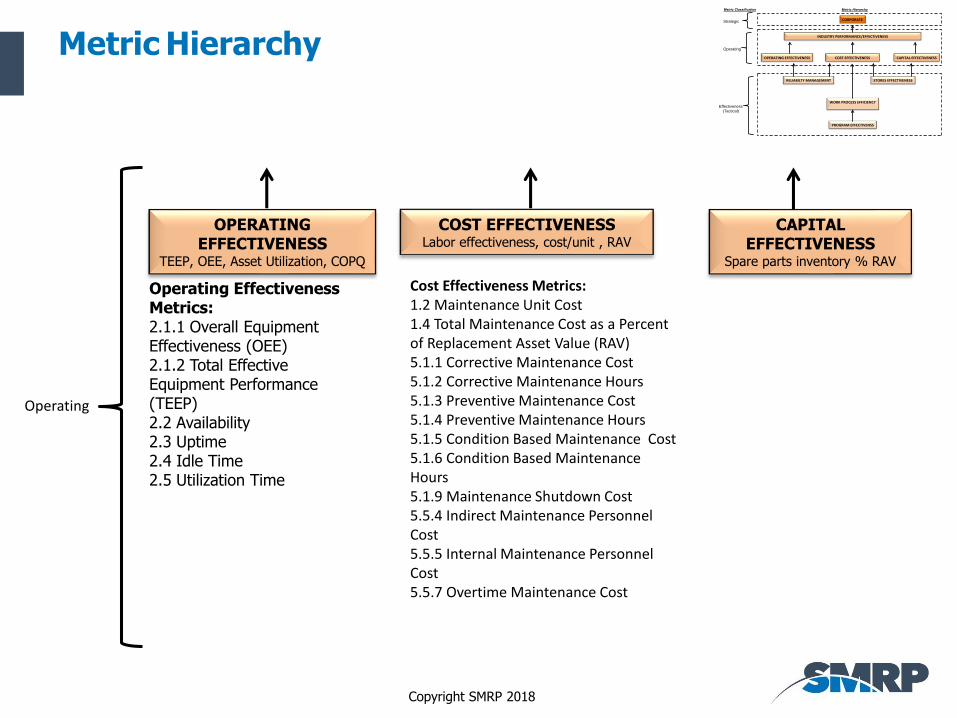
Metric Hierarchy
Operating
OPERATING EFFECTIVENESS
TEEP, OEE, Asset Utilization, COPQ
COST EFFECTIVENESSLabor effectiveness, cost/unit , RAV
CAPITAL EFFECTIVENESS
Spare parts inventory % RAV
Operating Effectiveness Metrics:2.1.1 Overall Equipment Effectiveness (OEE)2.1.2 Total Effective Equipment Performance (TEEP)2.2 Availability 2.3 Uptime2.4 Idle Time2.5 Utilization Time
Cost Effectiveness Metrics:1.2 Maintenance Unit Cost1.4 Total Maintenance Cost as a Percent of Replacement Asset Value (RAV)5.1.1 Corrective Maintenance Cost5.1.2 Corrective Maintenance Hours5.1.3 Preventive Maintenance Cost5.1.4 Preventive Maintenance Hours5.1.5 Condition Based Maintenance Cost5.1.6 Condition Based Maintenance Hours5.1.9 Maintenance Shutdown Cost5.5.4 Indirect Maintenance Personnel Cost5.5.5 Internal Maintenance Personnel Cost5.5.7 Overtime Maintenance Cost
CORPORATEStrategic Metric Classification Metric Hierarchy
INDUSTRYPERFORMANCE/EFFECTIVENESS
OPERATINGEFFECTIVENESS COSTEFFECTIVENESS CAPITALEFFECTIVENESS
Operating
RELIABILTYMANAGEMENT STORESEFFECTIVENESS
WORKPROCESSEFFICIENCY
PROGRAMEFFECTIVENSS
Effectiveness (Tactical)
Copyright SMRP 2018
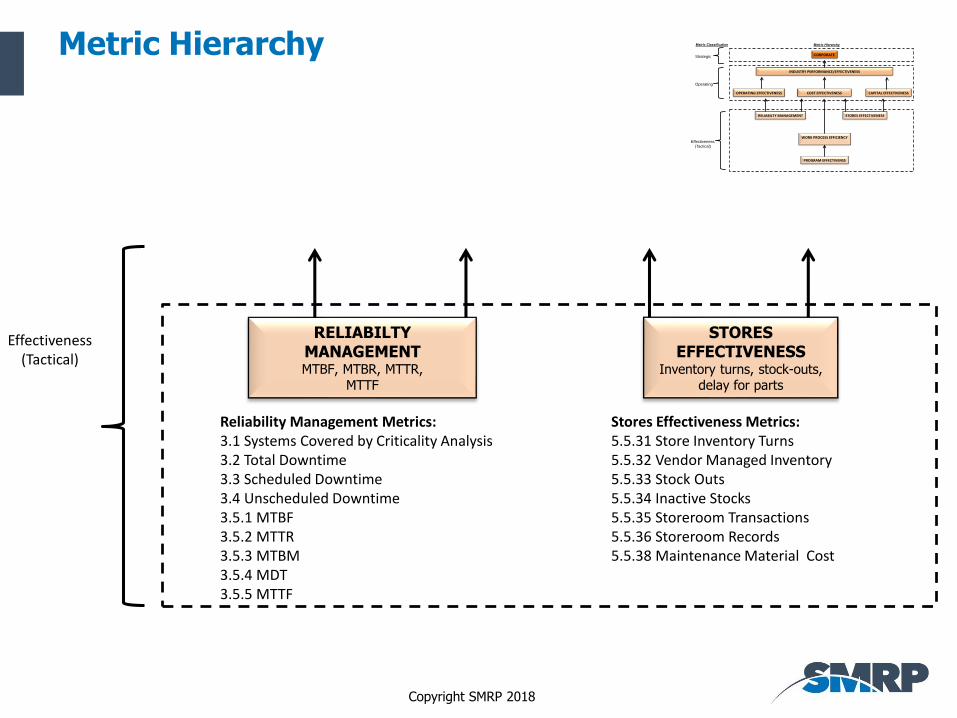
Metric Hierarchy
RELIABILTY MANAGEMENTMTBF, MTBR, MTTR,
MTTF
STORES EFFECTIVENESS
Inventory turns, stock-outs, delay for parts
Effectiveness(Tactical)
Reliability Management Metrics:3.1 Systems Covered by Criticality Analysis3.2 Total Downtime3.3 Scheduled Downtime3.4 Unscheduled Downtime3.5.1 MTBF3.5.2 MTTR3.5.3 MTBM3.5.4 MDT3.5.5 MTTF
Stores Effectiveness Metrics:5.5.31 Store Inventory Turns5.5.32 Vendor Managed Inventory5.5.33 Stock Outs5.5.34 Inactive Stocks5.5.35 Storeroom Transactions5.5.36 Storeroom Records5.5.38 Maintenance Material Cost
CORPORATEStrategic Metric Classification Metric Hierarchy
INDUSTRYPERFORMANCE/EFFECTIVENESS
OPERATINGEFFECTIVENESS COSTEFFECTIVENESS CAPITALEFFECTIVENESS
Operating
RELIABILTYMANAGEMENT STORESEFFECTIVENESS
WORKPROCESSEFFICIENCY
PROGRAMEFFECTIVENSS
Effectiveness (Tactical)
Copyright SMRP 2018 68
CORPORATEStrategic Metric Classification Metric Hierarchy
INDUSTRYPERFORMANCE/EFFECTIVENESS
OPERATINGEFFECTIVENESS COSTEFFECTIVENESS CAPITALEFFECTIVENESS
Operating
RELIABILTYMANAGEMENT STORESEFFECTIVENESS
WORKPROCESSEFFICIENCY
PROGRAMEFFECTIVENSS
Effectiveness (Tactical)
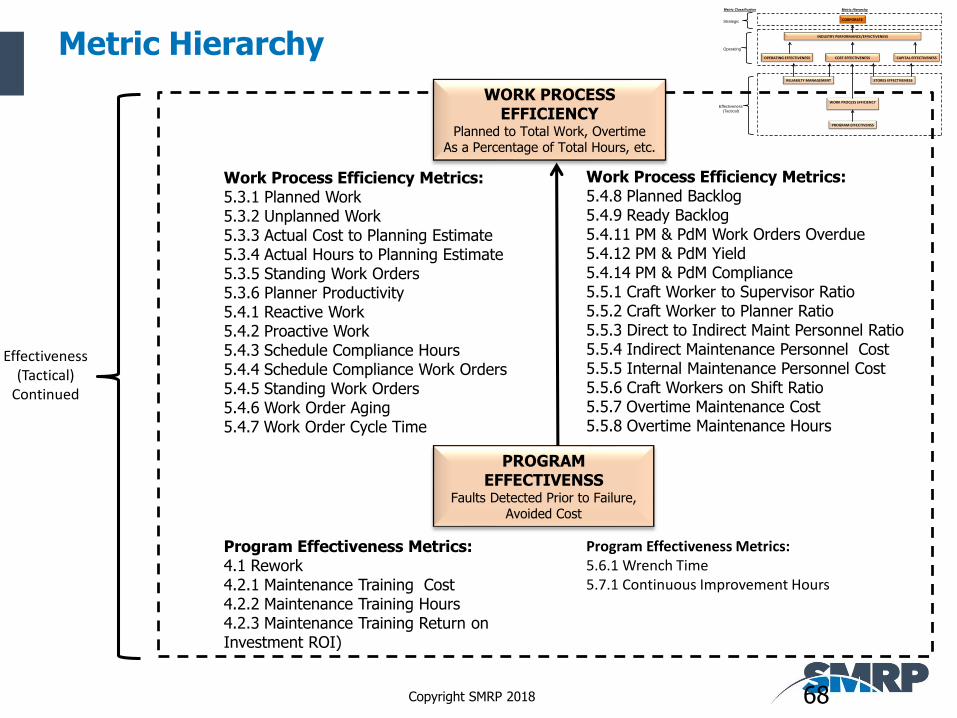
Effectiveness(Tactical)
Continued
Work Process Efficiency Metrics:5.4.8 Planned Backlog5.4.9 Ready Backlog5.4.11 PM & PdM Work Orders Overdue5.4.12 PM & PdM Yield5.4.14 PM & PdM Compliance5.5.1 Craft Worker to Supervisor Ratio5.5.2 Craft Worker to Planner Ratio5.5.3 Direct to Indirect Maint Personnel Ratio5.5.4 Indirect Maintenance Personnel Cost5.5.5 Internal Maintenance Personnel Cost5.5.6 Craft Workers on Shift Ratio5.5.7 Overtime Maintenance Cost5.5.8 Overtime Maintenance Hours
Program Effectiveness Metrics:5.6.1 Wrench Time5.7.1 Continuous Improvement Hours
Work Process Efficiency Metrics:5.3.1 Planned Work5.3.2 Unplanned Work5.3.3 Actual Cost to Planning Estimate5.3.4 Actual Hours to Planning Estimate5.3.5 Standing Work Orders5.3.6 Planner Productivity5.4.1 Reactive Work5.4.2 Proactive Work5.4.3 Schedule Compliance Hours5.4.4 Schedule Compliance Work Orders5.4.5 Standing Work Orders5.4.6 Work Order Aging5.4.7 Work Order Cycle Time
Program Effectiveness Metrics:4.1 Rework4.2.1 Maintenance Training Cost4.2.2 Maintenance Training Hours4.2.3 Maintenance Training Return on Investment ROI)
PROGRAM EFFECTIVENSS
Faults Detected Prior to Failure,Avoided Cost
Metric Hierarchy
WORK PROCESS EFFICIENCY
Planned to Total Work, OvertimeAs a Percentage of Total Hours, etc.
Copyright SMRP 2018
Section 4
Section 5
Group Exercise
Speedy Mac Reliability Products (SMRP)
Copyright SMRP 2018
Group Session
• Benchmarking the model company, Speedy Mac Reliable Products (SMRP)
• Calculate metrics using the SMRP Metric Definitions
• There will be Three breakout sessions

Copyright SMRP 2018
Workbook Review

Copyright SMRP 2018
•The CEO – Seymour Profit• The Director of Corporate Reliability – Noah Lott• The Maintenance Manager – Ben Ignored• The Operations Manager – Maury Ficiency• The Maintenance Planner – Claire Voyant

Copyright SMRP 2018
Breakout Instructions
• Workbook has all data and information
• Glossary has additional information (I have one copy to share)
• Each Team will calculate metrics for the 3 plants for each metric in the session
• Data is provided in tables 1 – 9 and constants in table 10
• Formulas are provided
• Full metric definitions are in the Compendium

Copyright SMRP 2018
Instructions
Table 1 – Data from the Finance Department
Table 2 – Data from HR
Table 3 – Operations Data
Table 4 – Work Management Data
Table 5 – Planner Data
Table 6 – Storeroom Data
Table 7 – Cost Improvement Analysis Data
Table 8 – Work Study Data
Table 9 – Reliability Study Data on Pump Group 9
Table 10 - Constants

Copyright SMRP 2018
Instructions
• When you are complete with the calculations: 1. Pick the worst performing plant for each metric 2. Define a strategy to close the gap to the best performing plant
• Then write the metric data and the defined strategy on a flip chart – 1 flip chart for each of the three plants A, B and C (one per group)

Copyright SMRP 2018
Instructions
• When you are complete with the calculations:
1. Pick the work performing plant for each metric
2. Define a strategy to close the gap with the best performing plant
• Then record the metric data defined strategy for gap closure for class discussion
Copyright SMRP 2018
Break out Session 1
Metric 1.1 RAV per Craft/Wage Headcount
Metric 1.5 Maintenance Cost per RAV
Metric 2.1.1 OEE
Metric 5.5.71 Contractor Cost
1. Must we aim for a high or a low value?
2. Please give the strategies or activities which can improve the performance measured by the indicators?
Copyright SMRP 2018
Break out Session 1
Metric 1.1 RAV per Craft/Wage Headcount
Metric 1.5 Maintenance Cost per RAV
Metric 2.1.1 OEE
Metric 5.5.71 Contractor Cost
10:00
2:30
5:00
7:30
30:00
22:30
25:00
27:30
20:00
12:30
15:00
17:30

Copyright SMRP 2018
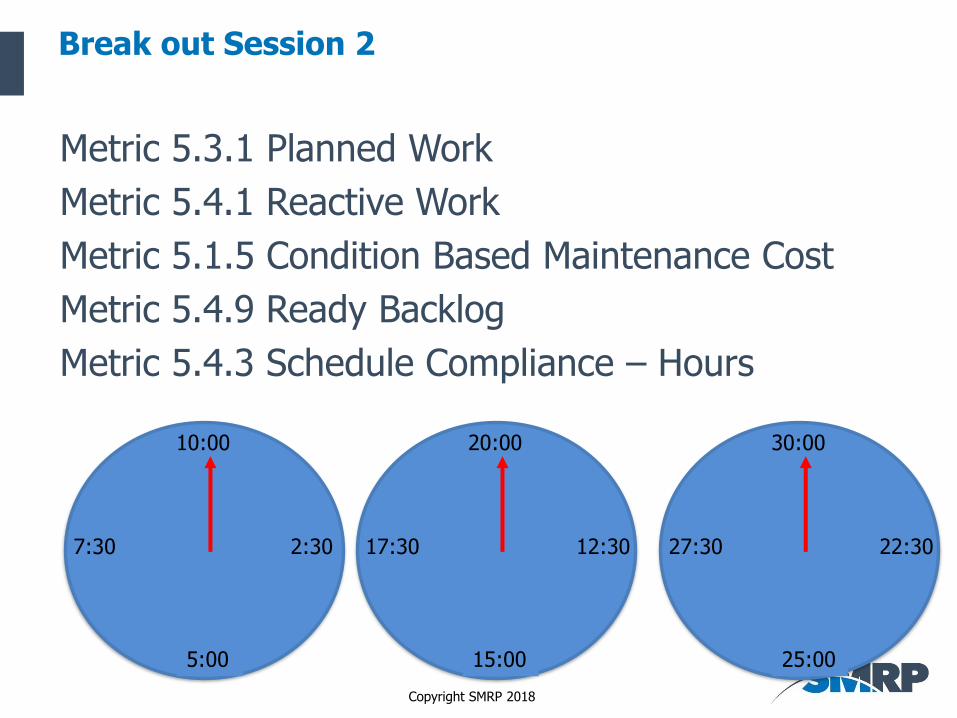
Break out Session 2
Metric 5.3.1 Planned Work
Metric 5.4.1 Reactive Work
Metric 5.1.5 Condition Based Maintenance Cost
Metric 5.4.9 Ready Backlog
Metric 5.4.3 Schedule Compliance – Hours
1. Must we aim for a high or a low value?
2. Please give the strategies or activities which can improve the performance measured by the indicators
Copyright SMRP 2018
Break out Session 2
10:00
2:30
5:00
7:30
30:00
22:30
25:00
27:30
20:00
12:30
15:00
17:30
Metric 5.3.1 Planned Work
Metric 5.4.1 Reactive Work
Metric 5.1.5 Condition Based Maintenance Cost
Metric 5.4.9 Ready Backlog
Metric 5.4.3 Schedule Compliance – Hours

Copyright SMRP 2018
Section 6
Section 6
Selecting the Right Metric
Copyright SMRP 2018
Learning Objectives
1. Discuss a process for selecting metrics
2. Adjusting standard metrics
3. Leading versus Lagging Indicators
Copyright SMRP 2018
Process for Selection of Indicators
• What are the strategies in your organization?
• What are the goals and objectives?
• What is in the maintenance policy?
• Who are your customers and what do they
expect from your organization?
• When are your customers ready?
• Are you familiar with the company values?
Copyright SMRP 2018
Metrics Development
• Still other considerations
• Same thing done in different facilities?
• Capital vs. expense discussions
• Still may have to work inside your company to get a standard definition
Even with standardized definitions some adjustments may still have to be made at the enterprise level

Copyright SMRP 2018
Developing Maintenance Metrics

Copyright SMRP 2018
Developing Maintenance Metrics
1. Appoint a task force, team, group
2. Agree on results, scope and objectives
3. Identify the 5 – 10 most important strategies in the company
4. Check for relevant metrics in….. SMRP, EFNMS, Web, others
5. If none are applicable develop company-relevant metrics
6. Perform as a test “is this the only measurement of strategy XX?”
7. Present metrics to others and adjust from comments
8. Present the system of metrics as Version 1
9. Re-evaluate
Copyright SMRP 2018
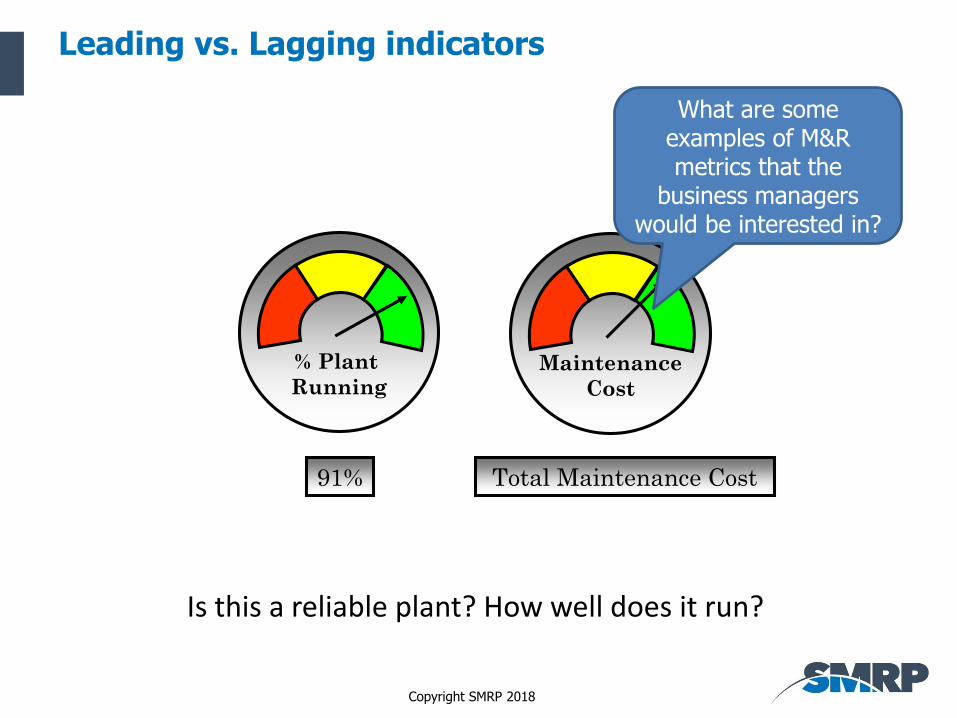
Leading vs. Lagging indicators
Total Maintenance Cost
Maintenance
Cost
% Plant
Running
91%
Is this a reliable plant? How well does it run?
What are some examples of M&R metrics that the
business managers would be interested in?
Copyright SMRP 2018
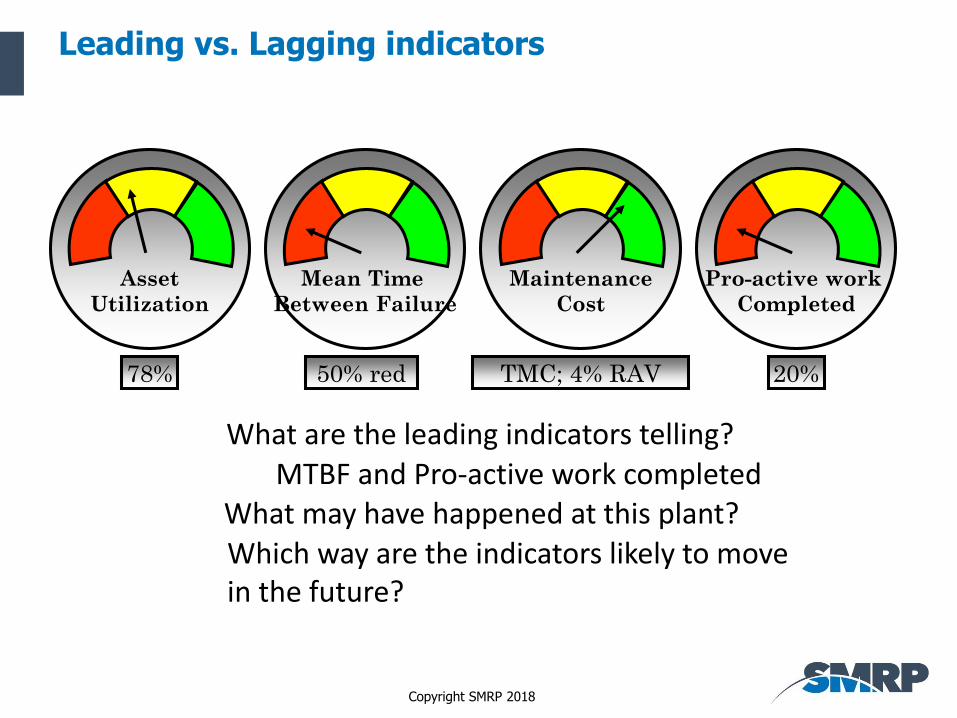
Leading vs. Lagging indicators
What are the leading indicators telling?
Maintenance
Cost
Pro-active work
Completed
Mean Time
Between Failure
Asset
Utilization
20%50% red78% TMC; 4% RAV
MTBF and Pro-active work completedWhat may have happened at this plant?Which way are the indicators likely to move in the future?

Copyright SMRP 2018
Leading vs. Lagging indicators
Poor MTBF reduces asset reliability and assets fail, driving up the Maintenance Cost.
The failing assets force reactive work, which takes available crew capacity from proactive work
MaintenanceCost
Mean Time Between Failure
Asset
UtilizationPro-active work
Completed
Asset
Utilization

Copyright SMRP 2018
Death Spiral of Reactive Maintenance
No Preventive Maintenance
No Predictive Maintenance
Poor Data Quality
No Data Analysis
Breakdown
Reactive Work
Less Planned Work
Breakdown Culture
increased Safety Incidents
Poor Work Culture
More Breakdowns
More Emergencies
Postpone PM Work
Ignore Predictive Results
More Breakdowns
Increased Urgency
More Failures
Reactive Work
Less Planned Work
Less time for PM/PdM
More Breakdowns
Increased Reactive Work
Increase Injury Rate
Less Dependability
MAINTENANCE COST
PRODUCTIVITY

Copyright SMRP 2018
Leading vs. Lagging indicators
What is being indicated in this plant?
Maintenan
Costeted
Asset
UtilizatioMaintenance
Cost
Pro-active work
Completed
Mean Time
Between Failure
Asset
Utilization
Which direction are the indicators likely to go? Why?

Copyright SMRP 2018
Leading vs. Lagging indicators
What is the relationship between these metrics?
Mai
CostCompleteden
AssetUtilization
Maintenance
Cost
Pro-active work
Completed
Mean Time
Between FailureAsset
Utilization
High level of pro-active work completed, will increase MTBF, will increase asset utilization and reduce maintenance cost
How do the metrics interact?
A good understanding of what going on requires a balanced scorecard of indicators

Copyright SMRP 2018
Section 7
Section 7
Benchmarking

Copyright SMRP 2018
Learning Objectives
1. Using Standardized Metrics for Benchmarking

Copyright SMRP 2018
Benchmarking
Data benchmarking:
My position compared to the others
Process benchmarking:
What are the processes others have used to achieve the results
Benchmarking:
Learn, adopt, and improve

Copyright SMRP 2018
Benchmarking
1. Intra-company; Inside a Site or Plant, Site to Site, Plant to Plant, Division to Division, etc.
2. Against Peer Group in Similar Industry
3. Against Best Practice Numbers
Using Standardized Metrics for Benchmarking

Copyright SMRP 2018
Results from Benchmarking
• Cost and availability improvement ideas
• Understand your contribution to department or plant
results
• Attracts focus to areas which need improvement
• Identification of areas with excellent performance
• Motivates employees
• An understanding to each individual on how to
contribute to improved performance
• Ability to compare plant performance

Copyright SMRP 2018
“Rules” for Using Metrics
1. Metrics must be understood
2. Must be able to influence
3. Use several metrics
4. Metrics are a management tool
3. Metrics must be coordinated to the business objectives
4. Use positive Metrics (Availability versus downtime)
5. Check definitions – compare apples to apples
Metrics are not a substitute for good management

Copyright SMRP 2018
Considerations
Is it possible to measure everything in a company?
“Bath scale syndrome”
All areas measured will change
Leading or lagging indicator?
Ensure management commitment
Be careful of suboptimization
Is it possible to describe a complex body such as an organization with 10 – 50 indicators?
Remember what gets measured and socialized will change

Copyright SMRP 2018
Break Out Session 3
Metric 1.4 Stock MRO Inventory per RAV
Metric 5.6.1 Wrench Time
Metric 3.5.1 MTBF
Metric 3.5.2 MTTR
Must we aim for a high or a low value?
Please give the strategies or activities which can improve the performance measured by the indicators?

Copyright SMRP 2018
Break out Session 3
10:00
2:30
5:00
7:30
30:00
22:30
25:00
27:30
20:00
12:30
15:00
17:30
Metric 1.4 Stock MRO Inventory per RAV
Metric 5.6.1 Wrench Time
Metric 3.5.1 MTBF
Metric 3.5.2 MTTR

Copyright SMRP 2018
Section 8
Section 8
Critical Information Needs

Copyright SMRP 2018
Learning Objectives
1. Effective Work Management
2. Effective Reliability Management
3. Effective Resource Stewardship

Copyright SMRP 2018
Critical Information Needs
Three major areas of interest for a Maintenance Manager:
1. Are we managing the work effectively?
2. Are we maintaining the necessary level of reliability?
3. Are we effective stewards of the company’s resources (labor, material, financial)?
Copyright SMRP 2018
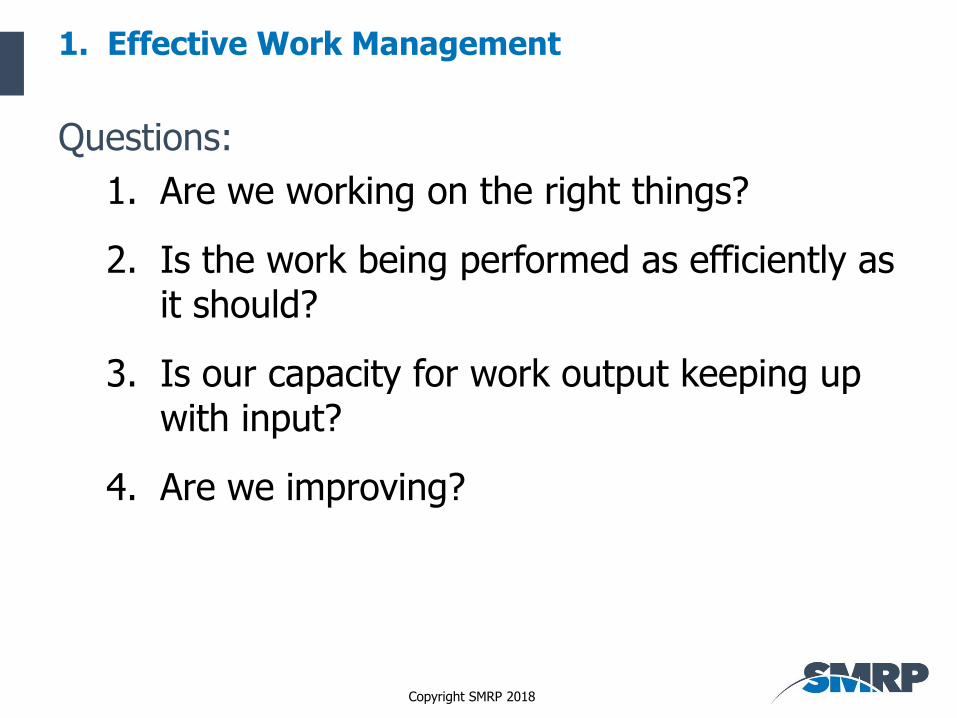
1. Effective Work Management
Questions:
1. Are we working on the right things?
2. Is the work being performed as efficiently as it should?
3. Is our capacity for work output keeping up with input?
4. Are we improving?

Copyright SMRP 2018
Working on the Right Things
• Need to measure Labor Distribution:- Corrective Maintenance Hours- Preventive Maintenance Hours- Condition Based Maintenance Hour
Best in Class Target Values• Preventive Maintenance: 15% of total hours• Corrective Maintenance identified through PM: 15%• Predictive Maintenance: 15%• Corrective Maintenance identified through PdM: 35%

Copyright SMRP 2018
Work Efficiency
Need to measure:
Planned Work vs. Unplanned Work
Will either need a status code or other indicator to mark the work order as “planned”
Schedule Compliance Hours
Calculated each week as part of the scheduling process (not necessarily done in the CMMS/EAM)
Can validate by calculating the Ratio of Replacement Asset Value (RAV) to Craft Headcount

Copyright SMRP 2018
Work Capacity
Need to measure:
Planned Backlog
Ready Backlog
PM and PdM Work Order Backlog
These will indicate if craft resource capacity is balanced with workload demand
Can also measure Planner Productivity
Indicates whether Planners have enough capacity to plan incoming work

Copyright SMRP 2018
Is Work Management Improving?
Monitor:
Actual Cost to Planning Estimate
Actual Hours to Planning Estimate
As Planning and Supervisory skills improve, variances should improve
Trend:
Mean Time to Repair (MTTR)
Wrench Time
Both can indicate whether unnecessary delays are being eliminated
Copyright SMRP 2018
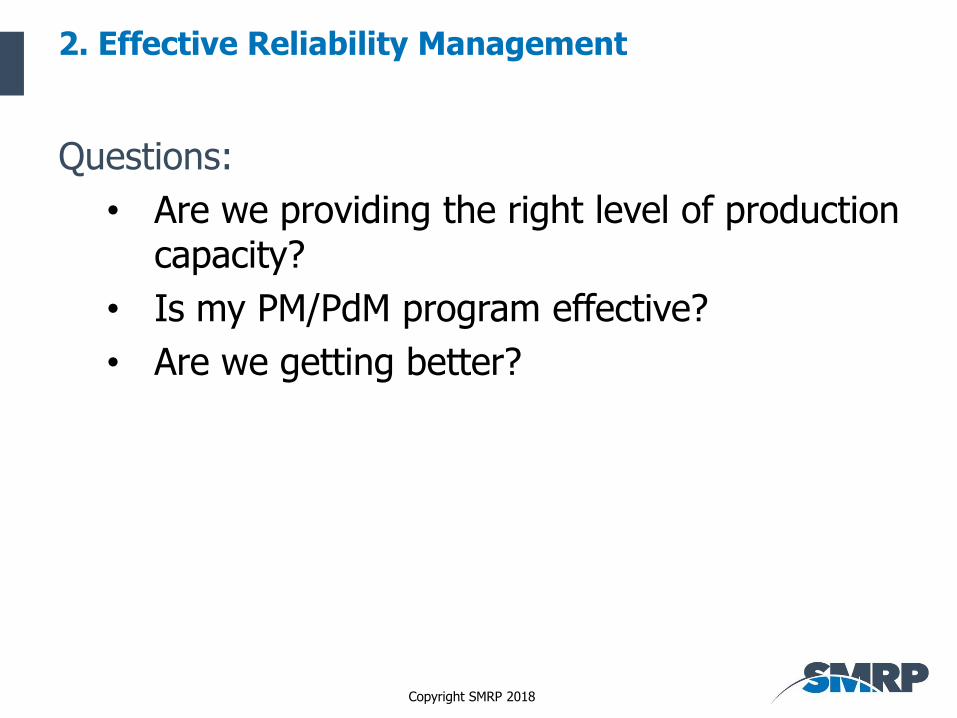
2. Effective Reliability Management
Questions:
• Are we providing the right level of production capacity?
• Is my PM/PdM program effective?
• Are we getting better?

Copyright SMRP 2018
Production Capacity
• Overall Equipment Effectiveness (OEE) is the best measure of capacity utilization
o Availability
o Performance Efficiency
o Quality Rate
• Should also measure Uptime
• Data can reside in different systems
Copyright SMRP 2018
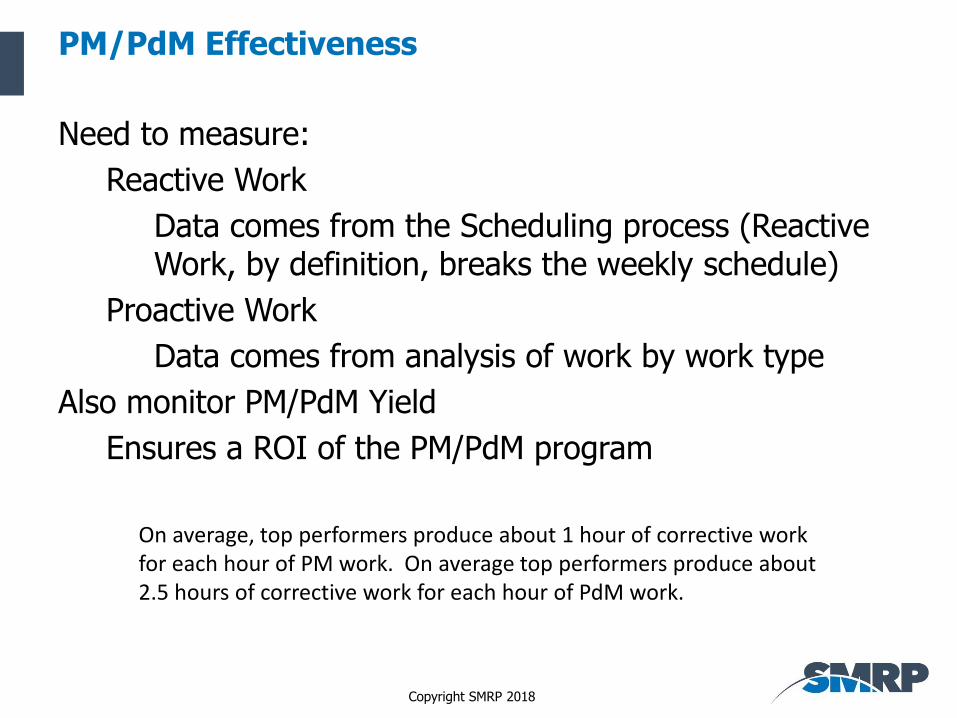
PM/PdM Effectiveness
Need to measure:
Reactive Work
Data comes from the Scheduling process (Reactive Work, by definition, breaks the weekly schedule)
Proactive Work
Data comes from analysis of work by work type
Also monitor PM/PdM Yield
Ensures a ROI of the PM/PdM program
On average, top performers produce about 1 hour of corrective work for each hour of PM work. On average top performers produce about 2.5 hours of corrective work for each hour of PdM work.

Copyright SMRP 2018
Improving Reliability
Trend:
• Mean Time Between Failure (MTBF) and Mean Time To Failure (MTTF)
o Can measure by individual equipment or by equipment class / subclass
• Unscheduled Downtime
• Equipment Availability
Copyright SMRP 2018
3. Effective Resource Stewardship
Questions:
• Are our maintenance costs appropriate and under control?
• Do we have the right quantity and type of spare parts?
• Do our craftspeople have the right skills?
• Are we getting better?

Copyright SMRP 2018
Maintenance Costs
Need to measure Maintenance Cost as a Percent of Replacement Asset Value (RAV)
Compare to other plants in the company or to industry benchmarks
Trend Maintenance Unit Costs
Decreasing trend can be a result of both cost reduction and capacity improvement
Top performers in all industries can maintain reliable plants for under 3% of RAV –regardless of industry.

Copyright SMRP 2018
Spare Parts
• Need to measure Stocked MRO Inventory Value as a Percent of RAV
o Compare to other plants in the company or to industry benchmarks
• Monitor:
o Inactive Stock
o Stores Inventory Turns
• Recognize that inventory reductions should not be based on these factors alone; they should be accompanied by a risk analysis

Copyright SMRP 2018
Craft Skills
• Need to measure:
o Maintenance Training Cost
o Maintenance Training Hours
• Both can be compared to industry benchmarks to determine if the appropriate investment is being made in skills development
• Can also monitor Rework to infer whether skills are appropriate

Copyright SMRP 2018
Improving Resource Stewardship
Trend:
• Stock Outs
• Overtime Maintenance Hours
• Training ROI

Copyright SMRP 2018
Section 9
Section 9
Data Quality

Copyright SMRP 2018
Learning Objectives
1. Data Quality
2. Work Order Data
3. Equipment Data

Copyright SMRP 2018
Data Quality
• None of the aforementioned metrics will be accurate, nor will the data be trustworthy, without:
o Accurate and thorough static Master Data
o A well designed and operating Work Management process that creates accurate Transactional Data
• Transactional Data quality is dependent on Master Data quality
Copyright SMRP 2018
Static Master Data Examples
• Locations
• Equipment
• Class / Subclass
• Specifications
• Failure Hierarchies
• Work Order Types
• Status Codes
• Priority Codes
• Material Items
• Bills of Material

Copyright SMRP 2018
Locations
• The record type that stores system information relevant to accounting and process descriptions
• Sometimes referred to as “Functional Locations”
• Primary record depicted in a CMMS/EAM hierarchy using a parent/child relationship
• Descriptions typically represent a process function
o Turbine Generator Lube Oil System
• Number 1 Lube Oil Pump
• A best practice is to limit the hierarchy to 5-6 levels at most; navigation difficulty increases with additional levels
• ISO 14224 provides a good model for a Hierarchy

Copyright SMRP 2018
Class / Subclass
A List of Values (LOV) that contains a specific breakdown of equipment types:
Pump, Centrifugal
Pump, Rotary Gear
Pump, Peristaltic
Pump, Vacuum
Etc.
Not sufficient to merely classify as a “Pump”
Attributes, failure codes, PM plans etc. will be different for each subclass

Copyright SMRP 2018
Failure Hierarchies
• A set of codes that enable the user to classify the failure for grouping and analysis
o Problem, Cause, Remedy
o Object Part, Damage, Cause, Action
• Enables validation of failure mode assumptions
• Most CMMS/EAM systems have the capability to develop the code structure by class/subclass
o Failure modes for a Centrifugal Pump are different than those of a Peristaltic Pump or a Vacuum Pump

Copyright SMRP 2018
Work Order Types
• Represents the types of work being performed
o Preventive Maintenance
o Predictive/Condition Based Maintenance
o Corrective Maintenance
o Corrective Maintenance as a result of a PM
o Corrective Maintenance as a result of a PDM
o Etc.
• Should not reflect work urgency or priority
• Some systems also allow classification by activity type, enabling further analytical granularity
Copyright SMRP 2018
Work Order Status Codes
• Tracks the work order through the various stages of its life:
o Creation/Initiation through Closure
• Used to manage the flow of work through the system
o Approvers query work orders in “created” status
o Material expediters follow up on work orders in “waiting for material” status
o Schedulers build schedules with work orders in “ready to schedule” status
• Status codes needed are determined by your work management process
o Look for steps where people need to query the system to perform their job tasks

Copyright SMRP 2018
Transactional Data Quality
• Good Master Data quality is not enough; you must have a well-defined work order system
• The work order system should be mapped with a process flow diagram
o Eliminates ambiguity and clearly spells out individual responsibilities
o Excellent training tool
o Provides a basis for performing a work order system audit

Copyright SMRP 2018
Work Process “Absolutes”
• No maintenance work shall be performed, and no maintenance parts shall be purchased without a work order
• Maintenance charges to the accounting system must flow through the work order system
• The system must be populated completely with high quality master data
• Well-designed code lists are required:
o Work types
o Activity types
o Status codes
o Failure codes
• Make code lists practical!

Copyright SMRP 2018
Work Order System Audit
• Examine critical attributes of the workflow
• Select a representative work order
• Gather all personnel associated with the work:• Requestor
• Planner
• Scheduler
• Maintenance Supervisor
• Crafts
• Storeroom Attendant
• Make copies of relevant documents
• “Score” the work order
Copyright SMRP 2018
Data Summary
To effectively manage the maintenance function, you must have accurate and trustworthy information
The majority of this information comes from a good work management process with accurate static master data and transactional data
Remember, BAD DATA IS WORSE THAN NO DATA!

Copyright SMRP 2018
Equipment
• This is the record that represents a physical asset in the field
• Equipment is “installed” in a location
• The record houses equipment specific attribute information:
o MFG, Model, Serial #, Class/Subclass
• Descriptions should be equipment specific without reference to process information
o Not “Lube Oil pump motor”
o Instead, “Motor, AC, 75HP, 365T, 460V, 85A, 1800RPM”

Copyright SMRP 2018
SMRP Best-in-Class Targets
• All metrics were evaluated
• Committee members assigned to create a Best-in-class target for that metric
• Researched authoritative guidance on targets
• Draft target along with the references was presented to the BP Committee
• Target values, along with any cautions and target references were incorporated into metrics documents

Copyright SMRP 2018

Copyright SMRP 2018
Next project for the Best Practices Committee
1. Guidance on setting up the Second Phase hierarchy of metrics?
2. Evaluate level of effort required and value to a support ISO 55000
3. Update Compendium to version 5
4. Increase delivery of Metric workshop

Copyright SMRP 2018
Feedback
Please let us know what you’d like changed so we can improve this workshop

Copyright SMRP 2018
Contacts
Paul Casto – Director Body of [email protected]
Paul Dufresne – Chair, Best Practices [email protected]