smoking, drinking and drug use among young people in...
TRANSCRIPT

Smoking, drinking and drug useamong young people in Englandin 2013
Elizabeth Fuller and Victoria Hawkins
A survey carried out for the Health and Social Care Information Centre
by NatCen Social Research and the
National Foundation for Educational Research
UK Data Archive SN 7662 - Smoking, Drinking and Drug Use among Young People, 2013

Smoking, drinking and drug use among young people in England in 2013

Smoking, drinking and druguse among young people inEngland in 2013
Elizabeth Fuller and Victoria Hawkins

Published by the Health and Social Care Information Centre
Health and Social Care Information Centre Responsible statistician: Alison Neave, Lifestyles Statistics Section HeadContact via [email protected], tel: 0845 300 6016
For queries about printed copies of this report, contact:NatCen Social Research35, Northampton SquareLondon EC1V 0AXContact via [email protected], tel: 020 7250 1866
The full text of this publication has been made available to you on the internet. You can find this athttp://www.hscic.gov.uk/pubs/sdd13
This is a National Statistics publicationThe United Kingdom Statistics Authority has designated these statistics as National Statistics, inaccordance with the Statistics and Registration Service Act 2007 and signifying compliance with theCode of Practice for Official Statistics.Designation can be broadly interpreted to mean that the statistics:· meet identified user needs;· are well explained and readily accessible;· are produced according to sound methods; and· are managed impartially and objectively in the public interest.Once statistics have been designated as National Statistics it is a statutory requirement that the Code ofPractice shall continue to be observed.Find out more about the Code of Practice for Official Statistics atwww.statisticsauthority.gov.uk/assessment/code-of-practice
Copyright © 2013, Health and Social Care Information Centre, Lifestyles Statistics. All rights reserved.
This work remains the sole and exclusive property of the Health and Social Care Information Centre andmay only be reproduced where there is explicit reference to the ownership of the Health and Social CareInformation Centre.
This work may be re-used by NHS and government organisations without permission. Commercial re-use of this work must be granted by the Health and Social Care Information Centre.
This work is subject to the Re-use of Public sector Information Regulations and permission forcommercial use must be obtained from the copyright holder.
First published 2014ISBN 978-1-78386-155-2
Designed by Davenport Associates

Acknowledgements 7
Summary 9
1 Introduction 11
1.1 About the survey 11
1.2 Background 11
1.3 The 2013 survey 12
1.4 How reliable are young people’s answers 13
1.5 Precision of estimates 13
1.6 About the tables 13
2 Drug use 17
2.1 Introduction 18
2.2 Prevalence and frequency of drug use 20
2.3 Vulnerable pupils and drug use 23
2.4 Availability and awareness of drugs 23
2.5 Sources of information about drugs 24
Tables 27
3 Smoking 53
3.1 Introduction 54
3.2 Smoking behaviour 56
3.3 Cigarettes smoked in the last week 56
Tables 59
4 Drinking alcohol 67
4.1 Introduction 68
4.2 Prevalence of drinking alcohol 70
4.3 Patterns of drinking alcohol in the last week 71
Tables 76
Contents
5 Smoking, drinking and drug use 95
5.1 Introduction 96
5.2 How many pupils smoke, drink or take drugs? 96
5.3 The prevalence of smoking, drinking and drug use 96
5.4 Attitudes 97
5.5 School teaching about smoking, drinking alcohol and drug use 98
Tables 101
Appendices
A Survey design, fieldwork and response 107
B Weighting, analysis methods and design effects 115
C Questionnaire 121
D School questionnaire 149

Smoking, drinking and drug use among young people in England in 2013 7
Acknowledgements
Social surveys are the work of a team. The authors take full responsibility for the content ofthis report, but gratefully acknowledge the contribution of many colleagues.
In particular, thanks are due at NatCen to the interviewers who administered the survey inschools; researchers Helen Henderson, Sarah Morris and Rachel Whalley; Kay Renwick,Rebecca Aldridge, Wendy Watson, and their colleagues in the Operations department, fororganising the fieldwork and data processing; programmers John Hurn and Sue Corbett;statisticians Kevin Pickering and Evie Calcutt.
At NFER, we would like to thank Jennie Jupp, Joanne Haswell and their team, whomanaged the initial contact with schools.
We are also grateful to Sharon Thandi, Paul Glossop, Victoria Cooper, Robert Dobson, PaulEastwood and Alison Neave at the Health and Social Care Information Centre; andeveryone else in the project team.
Above all, the authors would like to thank all the schools that took part for their cooperation,and, most importantly, the pupils who took part in the study.

BLANK PAGE

Copyright © 2014, Health and Social Care Information Centre. All rights reserved.
Smoking, drinking and drug use among young people in England in 2013 9
Summary
This survey is the latest in a series designed to monitor smoking, drinking and drug useamong secondary school pupils aged 11 to 15. Information was obtained from 5,187 pupils in174 schools throughout England in the autumn term of 2013.
Drug Use (Part 2)
The prevalence of illegal drug use in 2013 was at similar levels to 2011 and 2012, thoughconsiderably lower than in 2001, when the current method of measurement was first used.16% of pupils had ever taken drugs, 11% had taken them in the last year and 6% in the lastmonth.
Older pupils were more likely than younger ones to take drugs. The prevalence of ever havingtaken drugs increased with age from 5% of 11 year olds to 30% of 15 year olds. There weresimilar patterns for drug use in the last year (from 3% to 24%) and in the last month (from 1%to 14%).
Pupils were more likely to have taken cannabis in the last year than any other drug.
In 2013, 28% of pupils reported that they had ever been offered drugs.
The report also includes findings on the use of individual drugs, frequency of taking drugs,drug use by vulnerable pupils and sources of information about drugs that young people findhelpful.
Smoking (Part 3)
In 2013, less than a quarter of pupils said that they had smoked at least once. At 22%, thiswas the lowest level recorded since the survey began in 1982, and continues the declinesince 2003, when 42% of pupils had tried smoking.
3% of pupils reported that they smoked at least one cigarette a week, the survey definition ofregular smoking. This was also at the lowest level measured since 1982, and considerablybelow the 9% recorded in 2003.
The prevalence of smoking increased with age. In 2013, less than 0.5% of 11 and 12 year oldssaid that they smoked at least one cigarette a week, compared with 4% of 14 year olds and8% of 15 year olds.
This report also includes findings about cigarette smoking in the last week, including thenumbers of cigarettes smoked and the days on which pupils smoke.
Drinking alcohol (Part 4)
In 2013, around two-fifths of pupils (39%) had drunk alcohol at least once. Boys and girlswere equally likely to have done so. The proportion of pupils who have had an alcoholic drinkincreased with age from 6% of 11 year olds to 72% of 15 year olds.
Less than one in ten pupils (9%) had drunk alcohol in the last week. This continues thedownward trend since 2003, when a quarter (25%) of pupils had drunk alcohol in the last

week. Older pupils were more likely to have drunk alcohol in the last week: the proportionincreased from 1% of 11 year olds to 22% of 15 year olds.
Pupils who had drunk in the last week had drunk an average (mean) of 8.2 units, less than inrecent years. Boys and girls drank similar amounts.
Most pupils who had drunk alcohol in the last week had consumed more than one type ofdrink. Beer, lager and cider accounted for the majority of the alcohol boys drank (63%).Among girls, less than a third of the alcohol was drunk as beer, lager or cider (30%). Theremainder was likely to be in the form of wine (25%), spirits (22%), or alcopops (20%).
The report also includes findings about pupils’ patterns of drinking.
Smoking, drinking and drug use (Part 5)
The estimates from this survey indicate that in England in 2013 around 100,000 pupils agedbetween 11 and 15 were regular smokers, around 280,000 had drunk alcohol in the pastweek, around 190,000 had taken drugs in the last month, and around 350,000 had takendrugs in the last year.
Under half (48%) of pupils aged between 11 and 15 said that they had tried smoking, drunkalcohol or taken drugs at least once in their lives. 16% had done one or more of theserecently. They were most likely to have drunk alcohol in the last week (9%), rather thansmoked in the last week (6%) or taken drugs in the last month (also 6%).
More than half (53%) of pupils thought it was OK for someone of their age to try drinkingalcohol, and about a third (31%) thought that it was OK to try smoking. Pupils were muchless likely to approve of drug use: 9% thought it was OK for someone to try cannabis, 7%sniffing glue, and just 2% thought that it was OK for someone their age to try cocaine.
Almost all schools reported that they provided pupils with lessons about tobacco, alcoholand legal and illegal drugs, and most schools said that they provided pupils with at leastone lesson a year about each of these topics.
Around three in five pupils said that they recalled having lessons about smoking, drinkingalcohol or drug use in the last year. Most pupils thought that their school gave them enoughinformation about smoking (73%), drinking (70%) and drug use (66%).
Copyright © 2014, Health and Social Care Information Centre. All rights reserved.
10 Smoking, drinking and drug use among young people in England in 2013
Copyright © 2014, Health and Social Care Information Centre. All rights reserved.
Smoking, drinking and drug use among young people in England in 2013 11
1 Introduction
1.1 About the survey
This is the latest in the series of surveys of secondary school children in England whichprovides the national estimates of how many young people aged 11 to 15 smoke cigarettes,drink alcohol or take illicit drugs. The first survey in the series, carried out in 1982, measuredthe prevalence of smoking among pupils and described their smoking behaviour. Trends insmoking were monitored by similar surveys carried out every two years. Questions on alcoholconsumption were added to the survey in 1988; the 1998 survey was the first to includequestions on the prevalence of drug use. Since 2000, the survey has been carried out annuallyby the National Centre for Social Research (NatCen Social Research since February 2012) andthe National Foundation for Educational Research (NFER).
Each survey now includes a core section of questions covering the following:• pupils’ experience of smoking, drinking and drug use;• consumption of cigarettes and alcoholic drinks in the last week; and • awareness and availability of specific named drugs.
This report covers the key findings in each of these areas, including a comparison of trendsover time.
As well as these core measures, questionnaires since 2000 have included more detailedquestions, with the focus alternating between smoking and drinking in one year and drug usethe next. In 2013, the focus was on drug use. The questionnaire covered pupils’ experiences ofdrug use, considering both the first and most recent occasions when this happened, includingwhere the drugs came from, where pupils were when they took drugs, and what they felt whenthey took drugs. There were also questions about buying drugs in shops and through theinternet, reasons for refusing drugs, what pupils learned in school lessons about drugs andfamilies’ attitudes to drug taking. The full questionnaire is included in Appendix C of this report.
In previous years, these additional questions have been analysed in full in the annual surveyreport.1 For resource reasons, this report omits these detailed findings. Other findings includedin previous reports, for example multivariate analyses of the factors associated with smoking,drinking and drug use and key estimates by region, have also been omitted.
The full 2013 survey data set will be deposited at the UK Data Service in late 2014, and will beavailable for further analysis.
1.2 Background
Smoking cigarettes, drinking alcohol and the use of illicit drugs, particularly by young people,have long been seen as key policy concerns. Since 2010 there have been several strategicinitiatives in each of these areas.2
• Underage drinking was highlighted in the coalition government’s Programme forgovernment.3
• The White Paper Healthy lives, healthy people: our strategy for public health in England,published in November 2010, included alcohol and drug misuse and smoking as key publichealth priorities, and also identified ways in which healthy behaviour could be promotedamong children and young people at school.4

• In December 2010, the Home Office published a new drug strategy,5 which also includedalcohol dependence within its scope.
• Actions to reduce smoking were set out in the tobacco control plan, published in March2011.6 This included the ambition to reduce rates of regular smoking among 15 year oldsto 12% or less by 2015.7
• An initiative including government, business and the voluntary sector, The public healthresponsibility deal, was also published in March 2011.8 It includes a number of pledgeson alcohol, and new pledges have been added since.9
• The government’s alcohol strategywas published in March 2012.10
• In September 2012, the Department for Education, jointly with the Association of ChiefPolice Officers, published drug advice for schools, which summarised the twinapproaches of delivering quality drug education (including education about smoking andalcohol), and having a clear disciplinary approach to drug-related problems withinschools.11
More detail about these and other government policies on smoking, drinking alcohol anddrug use can be found in the relevant sections of this report.
1.3 The 2013 survey
1.3.1 Survey design
The survey design has remained unchanged since 2000, when it was first carried out byNatCen and NFER. The exception is the sample design, which has been modified slightlysince 2009.
For surveys between 2000 and 2009, the sample of schools was stratified by school typeand sex of intake, and selected across regions in proportion to the distribution of thepopulation of 11 to 15 year olds.12 Following consultation with survey users, in 2010, thesample was stratified by Strategic Health Authority (SHA); within each SHA an equalnumber of schools was sampled.13 This design was also used in 2011, although stratified bynine regions rather than by ten Strategic Health Authorities.14 This change was designed toenable the publication of more up-to-date regional analyses of the data than was possiblewith the original design.15 In 2013, the issued sample of schools was reduced from 522schools to 400 schools for resource reasons. Given the risk that satisfactory samples ofschools and pupils might not be achieved in all nine regions, the sample was selectedaccording to the design used in 2009 and earlier years.
Data were collected from pupils using a self-completion paper questionnaire. These wereusually completed during a single school period, generally between 30 and 40 minutes inlength. The time taken by individual pupils to complete the questionnaire was not recordedand it is not possible to estimate an average. However, the allotted time was sufficient foralmost all pupils to answer the questionnaire in full. The content of the questionnaire isoutlined in Section 1.1, above.
Data were also collected from a school staff member about their school’s approach toteaching about smoking, drinking and illicit drug use.16
For further details of the 2013 survey design, see Appendix A.
1.3.2 Response
The 2013 survey achieved a sample of 5,187 pupils aged between 11 and 15 in 174schools. In addition, school-level data were collected from 161 schools.
Further details on survey response are given in Appendix A.
1.3.3 Weighting
The 2013 data collected from pupils have been weighted; both unweighted and weightedbases are shown in the tables. For further information, see Appendix B.
No weights have been applied to the school-level data.
Cop
yright © 201
4, Hea
lth and
Soc
ial C
are Inform
ation Cen
tre. All rig
hts reserved
.
12 Smoking, drinking and drug use among young people in England in 2013

1.4 How reliable are young people’s answers?
1.4.1 Are pupils honest?
This survey relies on several strategies to encourage honest reporting of behaviours whichpupils may wish to conceal from adults or to exaggerate to their peers; these includecollecting information in school classrooms rather than homes, and repeated assurances ofconfidentiality, backed up by survey procedures which demonstrate this.17 But, as withmost surveys, there are limited opportunities to provide independent verification of pupils’responses. This has been investigated in two main ways.
Between 1990 and 1998 the survey obtained saliva samples from pupils in half of theparticipating schools. The samples were tested for the presence of cotinine, a majormetabolite of nicotine that indicates recent exposure to tobacco smoke, in order to validatethe estimates of the prevalence of smoking derived from the questionnaire. Results fromthese surveys consistently indicated that children were largely honest about their smoking;only a few children in each survey had saliva cotinine levels that clearly contradicted theirself-reported smoking behaviour, and there were no significant differences in theprevalence of smoking between children who supplied saliva samples for testing and thosewho did not.18,19
Since questions about drugs were introduced in 1998, the questionnaire has asked aboutSemeron, a fictional drug. In 2013, only 6 pupils (0.1% of the total sample) reported thatthey had ever taken Semeron; this matches the experience of previous years, and lendssupport to the view that most pupils do not exaggerate their drug use. However, reportedrates of awareness may be exaggerated, given that 10% of pupils claimed to have heard ofSemeron (this, too, has remained at a similar level since the question was introduced).
1.4.2 Are pupils accurate?
Honesty is not the only factor affecting the accuracy of responses. In particular, recall of thenumber of cigarettes smoked or the amount of alcohol drunk can be problematic, given thatpupils’ patterns of behaviour between the ages of 11 and 15 may be experimental andepisodic rather than habitual and regular. In order to minimise the difficulties of reporting‘usual’ behaviour, questions are asked about consumption of alcohol and cigarettes in thelast week. In each case the series of questions is designed to provide effective prompts tomemory while minimising data loss caused by incomplete recording. These are discussedin more detail in the relevant chapters of this report.
1.5 Precision of estimates
As the data are based on a sample (rather than a census) of pupils, the estimates aresubject to sampling error. Appendix B details how to calculate sampling errors for thissurvey, and includes true standard errors and design effects calculated for key surveyestimates.
Differences are generally commented upon in the text only if they are significant at the 95%confidence level, implying no more than a 5% chance that any reported difference is not areal one but a consequence of sampling error.
1.6 About the tables
• Percentages may not add up to 100% because of rounding.• The following conventions have been used:
‘0’ = less than 0.5%, but not zero‘-‘ = zero (i.e. no responses were recorded in this answer category)
• Unweighted bases and weighted bases are shown. Weighted bases are rounded to thenearest integer and individual weighted bases may not add up to the total base becauseof rounding.
Cop
yright © 201
4, Hea
lth and
Soc
ial C
are Inform
ation Cen
tre. All rig
hts reserved
.
Smoking, drinking and drug use among young people in England in 2013 13

Cop
yright © 201
4, Hea
lth and
Soc
ial C
are Inform
ation Cen
tre. All rig
hts reserved
.
14 Smoking, drinking and drug use among young people in England in 2013
• A few pupils failed to answer each question. Pupils that did not answer a question havebeen excluded from its analysis, and so tables describing the same population may haveslightly different bases.
• Square brackets are used in tables to warn of small sample bases (between 30 and 49).Estimates based on 29 or fewer cases would not normally be shown.
• In tables where age is a variable, those aged 16 have been grouped with 15 year olds.This is because the survey did not include pupils in Year 12, and the small number ofpupils aged 16 sampled from Year 11 were not representative of all pupils aged 16.Similarly, pupils aged 10 have been grouped with 11 year olds.
• The school year classification is based on the standard system of years used inmaintained secondary schools. The school years of pupils attending other types ofschool have been adjusted accordingly.
Notes and references
1 Most recently in Fuller E (ed) (2012) Smoking, drinking and drug use among young people in England in2011. NHS Information Centre, Leeds. http://www.hscic.gov.uk/pubs/sdd11fullreport
2 For more information about official strategy, guidance and legislation between 1998 and 2011, see pastreports in this survey series.
3 HM Government (2010) The coalition: our programme for government. London.https://www.gov.uk/government/publications/the-coalition-documentation
4 Department of Health (2010) Healthy lives, healthy people: our strategy for public health in England.http://www.dh.gov.uk/prod_consum_dh/groups/dh_digitalassets/documents/digitalasset/dh_127424.pdf
5 Home Office (2010) Drug strategy 2010 reducing demand, restricting supply, building recovery:supporting people to live a drug-free life. https://www.gov.uk/government/publications/drug-strategy-2010--2
6 Department of Health (2011) Healthy lives, healthy people: a tobacco control plan for England.http://www.dh.gov.uk/prod_consum_dh/groups/dh_digitalassets/documents/digitalasset/dh_124960.pdf
7 Department of Health (2011a), cited above. This aspiration had already been achieved by the time thepolicy was published, although this was not known by the authors of the tobacco control plan. SeeWright V, Gill V (2011) ‘Smoking’ in Fuller E (ed) Smoking, drinking and drug use among young people inEngland in 2010. NHS Information Centre, Leeds. http://www.hscic.gov.uk/pubs/sdd10fullreport
8 https://responsibilitydeal.dh.gov.uk/alcohol-pledges/
9 Up to date information on the Public Health Responsibility Deal can be found on the website.
10 https://www.gov.uk/government/publications/alcohol-strategy
11 Department for Education and the Association of Chief Police Officers (2012) DfE and ACPO drug advicefor schools.http://www.education.gov.uk/schools/pupilsupport/pastoralcare/health/drug/a00202357/drug-advice-for-schools
12 For a description of the sample design of these surveys, see Appendix A in Fuller E & Sanchez M (eds)(2010) Smoking, drinking and drug use among young people in England in 2009. NHS InformationCentre, Leeds http://www.hscic.gov.uk/pubs/sdd09fullreport
13 See Appendices A and B of the 2010 report for full details and a discussion of the possible impact onsurvey estimates. Fuller E (ed) Smoking, drinking and drug use among young people in England in 2010.NHS Information Centre, Leeds. http://www.hscic.gov.uk/pubs/sdd10fullreport
14 This change was made in anticipation of the proposed abolition of Strategic Health Authorities (SHAs)outlined in the Health and Social Care Bill 2011, subsequently enacted in the Health and Social Care Act2012. http://www.legislation.gov.uk/ukpga/2012/7/contents/enacted/data.htm
For the purposes of this survey, the boundaries of SHAs and regions are effectively the same, except thatthe South East region is split into South Central and South East Coast SHAs.
15 Analysis of key estimates was included in the 2011 and 2012 reports, cited in note 1.
16 A questionnaire about school policies was included in surveys between 2000 and 2009, but the responserate was poor and the topic coverage became increasingly irrelevant. The school-level questionnaire wasre-introduced in the 2012 survey, with a focus on lessons and other activities designed to teach pupilsabout smoking, drinking and drug use.
17 For example the omission of names or other identifiers from the questionnaires pupils complete.
18 See Goddard E & Higgins V (1999) Smoking, drinking and drug use among young teenagers in 1998,TSO, London, for a fuller discussion.
19 The Health Survey for England (HSE) measures smoking among 8 to 15 year olds using confidential self-completion questionnaires. The prevalence of self-reported smoking among 11 to 15 year olds isconsistently lower than that reported by pupils in this survey; for example in 2008, 3% of 11 to 15 yearolds reported to the HSE that they smoked at least once a week, compared with 6% reported to thissurvey. The HSE also collects saliva samples which are tested for cotinine. 15ng/ml of cotinine is used asa threshold, above which the subject can be reliably considered to have smoked in recent days. Oncechildren with cotinine at this level have been taken into account, HSE estimates of the prevalence ofsmoking are at levels similar to those measured by this survey. See Moody A, Reilly N (2009) Children’ssmoking and exposure to others’ smoke in Craig R, Mindell J, Hirani V (eds) Health Survey for England2008: Volume 1: Physical activity and fitness. NHS Information Centre, Leedshttp://www.hscic.gov.uk/pubs/hse08physicalactivity
Cop
yright © 201
4, Hea
lth and
Soc
ial C
are Inform
ation Cen
tre. All rig
hts reserved
.
Smoking, drinking and drug use among young people in England in 2013 15

BLANK PAGE

Cop
yrig
ht ©
201
4, H
ealth
and
Soc
ial C
are
Info
rmat
ion
Cen
tre.
All
right
s re
serv
ed.
Smoking, drinking and drug use among young people in England in 2013 17
2 Drug use
Key findings for 2013
� In 2013, 16% of pupils had ever taken drugs, 11% had taken them in the last yearand 6% had taken them in the last month. This is similar to the levels of drug userecorded in 2011 and 2012. Between 2003 and 2011 drug use amongst 11 to 15 yearolds declined.
� In line with previous years, the prevalence of drug taking amongst young peopleincreased with age. In 2013, 5% of 11 year olds reported that they had ever takendrugs and this increased to 30% amongst 15 year olds. Similar patterns were seenfor drug use in the last year (from 3% to 24%) and in the last month (from 1% to14%).
� Boys and girls were equally as likely to have taken drugs.
� Cannabis was the most widely used drug among 11 to 15 year olds in 2013, with 7%of pupils reporting having taken it in the last year.
� 3% of pupils said that they usually took drugs at least once a month (the survey’sdefinition of frequent drug use). This has declined from a peak of 7% in 2003.
� Pupils who reported that they had ever truanted or been excluded were more likely tosay that they usually took drugs at least once a month than those who had nevertruanted or been excluded (10% and 1% respectively).
� 28% of pupils had ever been offered drugs. Pupils were most likely to say that theyhad been offered cannabis, with 18% of all pupils reporting this.
� In line with previous years, teachers and parents were most likely to be seen ashelpful sources of information about drugs, with TV seen as the most helpful of themedia (69%, 68% and 59% respectively).

2.1 Introduction
2.1.1 Background
Addressing the use of illicit drugs, particularly amongst young people, has long been afocus of government policy due to the awareness and concern over the damage it cancause to the health and wellbeing of young people.
The use of legal and illegal drugs by young people is associated with immediate and long-term risks to their health and wellbeing, which vary with the type of drug taken.1 There areconcerns about the relationship between drug use and mental health problems amongyoung people. For example, there is evidence to suggest that young people who userecreational drugs run the risk of damage to mental health including suicide, depression,psychotic symptoms and disruptive behaviour disorders.2,3 Over time, drug users run therisk of dependence.1 Already vulnerable young people have an increased risk of drug use:10 to 15 year olds are more likely to take drugs if they have experienced truancy, exclusionfrom school, homelessness, time in care, or serious or frequent offending.4
Drug misuse by young people was central to the first ten-year drug strategy, Tackling drugsto build a better Britain,5 published by the previous government in 1998. The Updated drugstrategy, published in 2002, emphasised education, prevention and treatment as ways totackle problematic drug use.6 The second ten-year drug strategy, Drugs: protecting familiesand communities, published in 2008,7 was based on a three-year action plan, whichincluded measures designed to increase young people’s awareness of the risks of drug andalcohol misuse in order to change their attitudes and behaviour, as well as providing adviceand information to parents to increase their involvement in preventing young people’s drugtaking.8
In December 2010, the coalition government published its drug strategy, Reducingdemand, restricting supply, building recovery: supporting people to live a drug-free life.9 Thestrategy aims to reduce drug use both by discouraging young people from trying illicit drugsand by providing support and treatment for those with drug problems.
The strategy focuses on early intervention and support for vulnerable young people andfamilies through local authorities. Youth justice services will be encouraged to address drugor alcohol misuse as contributory factors in young people’s offending. Young people at riskor already showing signs of dependency will have rapid access to specialist support thattackles their misuse as well as the wider issues they face.
Schools have a vital part to play in delivering the strategy. The strategy identifies the needfor high quality drug and alcohol education within schools that will give young people theskills and confidence to resist substance misuse. From December 2010, schools were givenstronger disciplinary powers (in terms of wider search and confiscation powers) to addressproblem behaviour. In September 2012, the Department for Education, jointly with theAssociation of Chief Police Officers, published drug advice for schools, which summarisedthe twin approaches of delivering quality drug education (including education aboutsmoking and alcohol), and having a clear disciplinary approach to drug-related problemswithin schools.10
The 2010 drug strategy identified a new class of drug, known as new psychoactivesubstances, also known as NPS or legal highs.9 These are drugs that mimic, or claim tomimic, the effects of illegal drugs such as ecstasy, cannabis or cocaine, and come in avariety of forms (herbal mixtures, powders, crystals or tablets). Awareness and concernabout them has grown among the public and policy makers due to their increasedavailability and supply, and the unknown risks they present.11 In 2011, the 1971 Misuse ofDrugs Act was amended to allow for the passing of ‘temporary class orders’, effectivelybanning new drugs in order to consider the need for permanent restrictions on their saleand possession.12
Cop
yrig
ht ©
201
4, H
ealth
and
Soc
ial C
are
Info
rmat
ion
Cen
tre.
All
right
s re
serv
ed.
18 Smoking, drinking and drug use among young people in England in 2013

2.1.2 Measuring drug use
Survey measures
Principal survey measures include the proportion of pupils who had taken specific drugs inthe last year and last month, including particular Class A drugs. The questionnaire coversthe following drugs or types of drugs: amphetamines, cannabis, cocaine, crack, ecstasy,heroin, ketamine, LSD, magic mushrooms, mephedrone, methadone, poppers (e.g. amylnitrite), tranquillisers, volatile substances such as gas, glue, aerosols and other solvents,and ‘other’ drugs (not obtained from a doctor or chemist). Within the questionnaire, pupilsare asked about each drug in turn, including a series of questions on whether they hadheard of the drug, been offered it, ever tried it and, if so, when they had last taken the drug.A fictional drug, Semeron, is also asked about to measure for exaggerations in the reportingof drug use; it is not discussed within the report.
Changes in the method of measuring drug use
This series of surveys first collected information on the prevalence of drug use amongyoung people in 1998, and the current method of measuring drug use was introduced in2001.13 The effect of the changes, from a grid format to a repeated sequence of questionsabout each drug, was such that findings from 2001 onwards are not comparable with thosefrom surveys between 1998 and 2000. As a result, trend data are shown in this report from2001 only. Data from previous surveys can be found in earlier reports.14
There have been three other small changes made to the core questions about drugs since2001. In 2004, the questions relating to amphetamines were reworded to refer to ‘speedand other amphetamines’, instead of ‘amphetamines’, the wording taken in previousyears.15 Ketamine was added to the list of drugs asked about in 2005. In 2012, mephedronewas added, and anabolic steroids were dropped from the list.
Drug classification
The following table lists the specific drugs that pupils were asked about in this survey, andindicates the classification under the Misuse of Drugs Act (1971) and its subsequentamendments.16 The Act classifies controlled substances into three categories according totheir potential for harm, with Class A drugs considered the most harmful.17
Cop
yrig
ht ©
201
4, H
ealth
and
Soc
ial C
are
Info
rmat
ion
Cen
tre.
All
right
s re
serv
ed.
Smoking, drinking and drug use among young people in England in 2013 19
Table 2AClassifications of drugs covered by the survey
Drug Mode of use Classification
Amphetamines Inject A
Ecstasy Swallow A
Cocaine Inhale, inject A
Crack Inject, smoke A
Heroin Smoke, inject, inhale A
LSD Swallow A
Magic mushrooms Swallow A
Methadone Swallow A
Amphetamines Inhale, swallow B
Cannabis Smoke, swallow B
Mephedrone Inhale, swallow, Bsmoke, inject
Tranquillisers Swallow, inject B/C (depends on drug)
Ketamine Swallow, inhale or Cinject
Poppers Inhale It is an offence for anyone other than a licensed outlet, such as a pharmacist, to supply amyl nitrite.18
Other types of poppers, for example butyl nitrite and isobutyl nitrite, are legal to possess and supply.19
Glue Inhale It is an offence to supply these substances if it is likely Gas Inhale that the product is intended for abuse.
This chapter includes estimates of the prevalence of use of Class A drugs. It is important tonote the following points. • The Class A drugs mentioned in the survey (amphetamines if prepared for injection,
ecstasy, cocaine, crack, heroin, LSD, magic mushrooms and methadone) are not anexhaustive list of Class A drugs.
• Some drugs are classified according to the method of delivery taken. For example,amphetamines are Class B drugs if taken orally and Class A drugs if injected.
• Methylamphetamine (crystal meth), included in the category ‘Speed and otheramphetamines’, was reclassifed to Class A in all its forms on 18th January 2007. Thecurrent questionnaire does not allow a distinction between methylamphetamine andother forms of amphetamines. For the sake of comparability with previous years, thissurvey has continued to define all amphetamines as Class A if injected, and otherwiseClass B.
• Within the Drugs Act 2005,20 raw magic mushrooms were classified as Class A drugs; thiscame into force on 18th July 2005. Previously, magic mushrooms were Class A drugsonly if prepared, for example dried or stewed. The survey questionnaire has never madethe distinction and magic mushrooms have always been counted as Class A drugs in theanalysis.
• Cannabis was reclassified from a Class C to a Class B drug on 26th January 2009.21
• Mephedrone was classified as a Class B drug from April 2010.
2.1.3 Outline of content
This chapter covers the following topics: • Prevalence and frequency of drug use• Drug use among vulnerable young people• Availability and awareness of drugs• Sources of information about drugs.
2.2 Prevalence and frequency of drug use
2.2.1 Prevalence of drug use
After 2003, the prevalence of drug use amongst young people aged between 11 and 15years old declined. In 2013, 16% of pupils reported having ever taken drugs, little more thanhalf the proportion in 2003, which was 30%. Similar patterns are seen when looking atreported drug use in the last year and the last month. The proportion of pupils who reportedtaking drugs in the last year declined from 21% in 2003 to 11% in 2013, and the proportionwho reported taking drugs in the last month fell from 12% in 2003 to 6% in 2013. Thedecline from 2003 appears to have tailed off in recent years with levels of drug use in 2013similar to those reported in 2011 and 2012. (Tables 2.1-2.3, Figure 2.1)
The proportion of young people who reported ever having taken drugs increased with age,from 5% of 11 year olds to 30% of 15 year olds. Similar patterns were seen for those whoreported drug use in the last year (3% of pupils had taken drugs in the last year, comparedwith 24% of 15 year olds) and those who reported drug use in the last month (1% of 11 yearolds reported taking drugs in the last month, compared with 14% of 15 year olds).
Similar proportions of boys and girls took drugs, whether this was measured ever, in the lastyear or in the last month. (Tables 2.4, 2.5, Figure 2.2)
2.2.2 Types of drugs taken in the last year
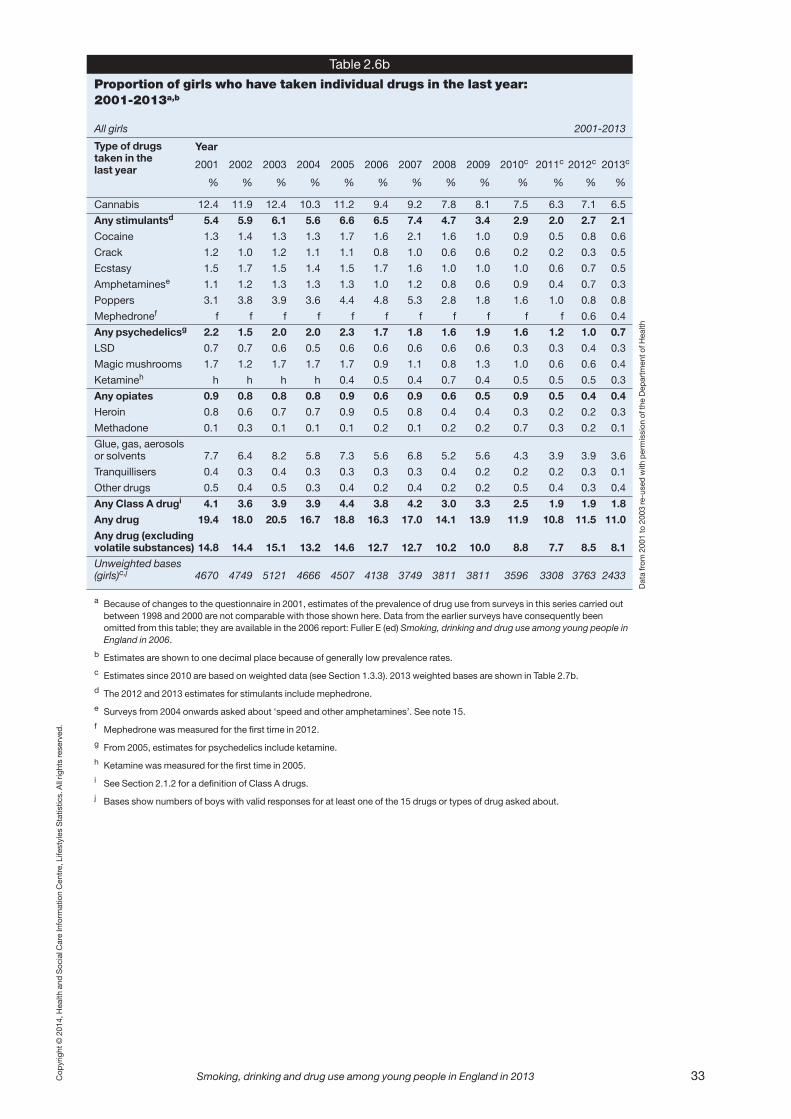
In line with previous years, in 2013, cannabis was the most widely used drug among 11 to15 year olds, with 7.0% of pupils reporting having taken it in the last year.22 This continuesthe overall decline in cannabis use since 2001, when 13.4% of pupils reported using it in thelast year.
Volatile substances, such as glues, gases, aerosols and solvents, were the next mostcommonly used, with 3.6% of pupils having inhaled them in the last year. This is similar tothe proportion of pupils who reported using volatile substances in 2011 and 2012.
Cop
yrig
ht ©
201
4, H
ealth
and
Soc
ial C
are
Info
rmat
ion
Cen
tre.
All
right
s re
serv
ed.
20 Smoking, drinking and drug use among young people in England in 2013

In 2013, 0.8% of pupils reported sniffing poppers in the last year, continuing the declinefrom a high of 4.9% in 2007. For all other drug types, the proportion of pupils who reportedany drug use in the last year was below 1%.
In 2013, 1.9% of pupils reported that in the last year they had taken one of the Class Adrugs asked about. This has declined over time, from 4.3% in 2001.
(Tables 2.6a-2.6c, Figure 2.3)
As in previous years, in 2013, the prevalence of cannabis use in the last year increased withage, with 0.4% of 11 year olds reporting having used cannabis in the last year, comparedwith 18.7% of 15 year olds. The use of Class A drugs in the last year also increased with age(from 0.6% of 11 year olds, to 4.0% of 15 year olds). However, the likelihood of sniffingglues, gases and volatile substances in the last year did not differ significantly with age.
(Table 2.7a-2.8, Figure 2.4)
In 2013, 73% of pupils who had taken drugs in the last year reported only having taken onetype of drug. The remaining 27% had taken two or more types of drugs.
Older pupils were more likely than their younger counterparts to have taken two or moretypes of drugs in the last year: 31% of 15 year olds who had taken drugs within the last yearreported taking two or more types of drugs compared to 15% of 11 to 13 year olds.
Cop
yrig
ht ©
201
4, H
ealth
and
Soc
ial C
are
Info
rmat
ion
Cen
tre.
All
right
s re
serv
ed.
Smoking, drinking and drug use among young people in England in 2013 21
Took drugs in the last month, last year and ever: 2001-2013All pupils
Figure 2.1
Per
cent
0
10
20
30
40
Year
Ever taken drugsIn the last yearIn the last month
2007 2008 2009 2010 2011 2012 20132002 20052004 20062001 2003
Took drugs in the last month, last year and ever, by ageAll pupils
11 years 13 years 12 years
Took drugs, not in the last yearIn the last year (but not last month)In the last month
Figure 2.2
Per
cent
Age14 years 15 years
0
10
20
30
40
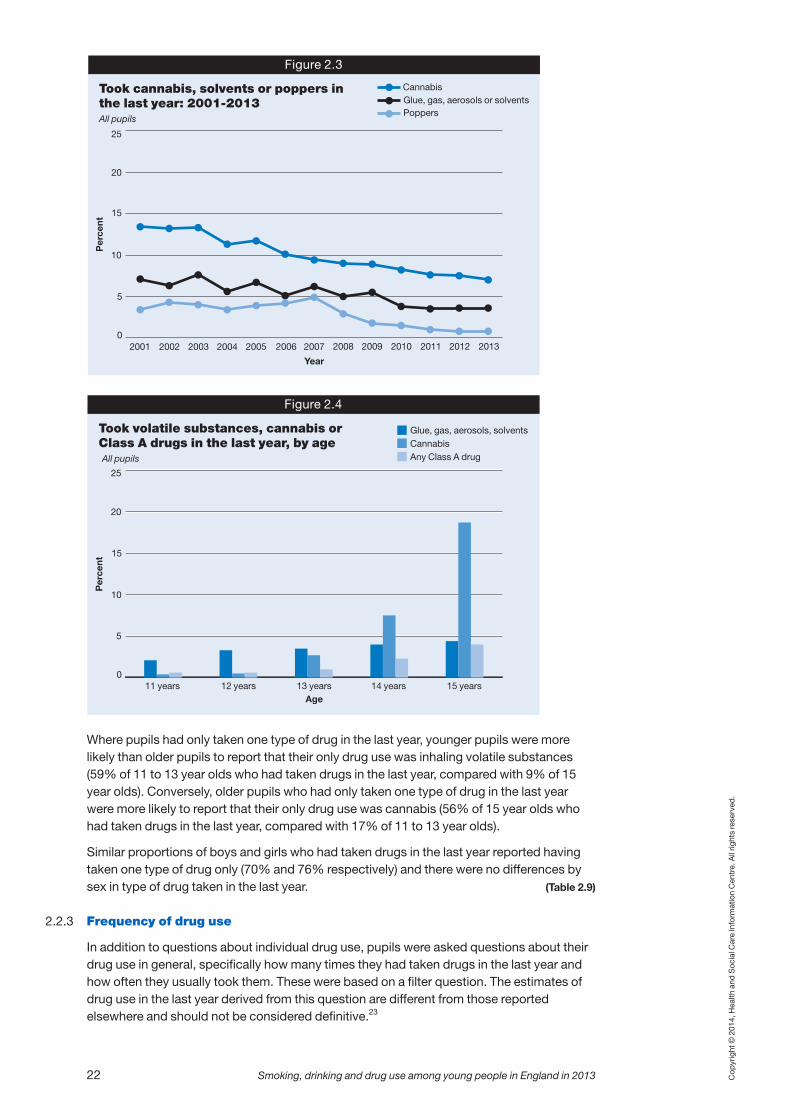
Where pupils had only taken one type of drug in the last year, younger pupils were morelikely than older pupils to report that their only drug use was inhaling volatile substances(59% of 11 to 13 year olds who had taken drugs in the last year, compared with 9% of 15year olds). Conversely, older pupils who had only taken one type of drug in the last yearwere more likely to report that their only drug use was cannabis (56% of 15 year olds whohad taken drugs in the last year, compared with 17% of 11 to 13 year olds).
Similar proportions of boys and girls who had taken drugs in the last year reported havingtaken one type of drug only (70% and 76% respectively) and there were no differences bysex in type of drug taken in the last year. (Table 2.9)
2.2.3 Frequency of drug use
In addition to questions about individual drug use, pupils were asked questions about theirdrug use in general, specifically how many times they had taken drugs in the last year andhow often they usually took them. These were based on a filter question. The estimates ofdrug use in the last year derived from this question are different from those reportedelsewhere and should not be considered definitive.23
Cop
yrig
ht ©
201
4, H
ealth
and
Soc
ial C
are
Info
rmat
ion
Cen
tre.
All
right
s re
serv
ed.
22 Smoking, drinking and drug use among young people in England in 2013
Took cannabis, solvents or poppers in the last year: 2001-2013All pupils
Figure 2.3
Per
cent
0
5
10
15
20
25
Year
CannabisGlue, gas, aerosols or solventsPoppers
2007 2008 2009 2010 2011 2012 20132002 20052004 20062001 2003
Took volatile substances, cannabis or Class A drugs in the last year, by age All pupils
11 years 12 years 13 years 14 years 15 years
Glue, gas, aerosols, solventsCannabisAny Class A drug
Figure 2.4
Per
cent
0
5
10
15
20
25
Age

In 2013, 3% of all pupils reported that they had only ever taken drugs on one occasion,another 3% said they had taken drugs on two to five occasions, 1% said they had takendrugs on six to ten occasions and 2% said they had taken drugs on more than tenoccasions. The majority of pupils (86%) had never taken any drugs. This is in line withprevious years. (Tables 2.10, 2.11)
In 2013, 3% of all pupils said that they usually take drugs once a month. This has remainedat a similar level since 2010, but has decreased over time from 7% in 2003. (Table 2.12)
The proportion of pupils who reported taking drugs at least once a month increased withage: 1% of 11 to 12 year olds reported taking drugs at least once a month and this rose to6% among 15 year olds. Boys were also more likely than girls to report taking drugs at leastonce a month (3% of boys, compared with 2% of girls). (Tables 2.13, 2.14)
2.3 Vulnerable pupils and drug use
Young people whose circumstances or behaviour already make them the focus of concernalso have an increased risk of problematic drug use.4 This group includes pupils who truantor have been excluded from school.24
Pupils were asked whether they had ‘ever stayed away from school without permission(truanted/bunked off)’ or been excluded from school. It should be noted that pupil’s ownreports of truancy and exclusion are not verified as part of the survey and so they should beinterpreted with caution. In addition, regular truants and those excluded from school duringthe fieldwork period were almost certainly underrepresented in the sample, despiteadditional effort to include them.25 In 2013, 11% of young people aged 11 to 15 reportedthat they had ever truanted from school and 7% had been excluded. Overall, 17% reportedeither truanting, having been excluded from school or both (data not shown).
In line with previous years, in 2013, pupils who reported that they had ever truanted or beenexcluded were more likely to report frequent drug use than those who said that they hadnever truanted or been excluded: 10% of pupils who had played truant or been excludedsaid they usually take drugs once a month, compared with 1% of pupils who had nevertruanted or been excluded. This maintains the overall decline in frequent drug use amongstthis group of vulnerable pupils since 2003, when 21% of pupils who had truanted or beenexcluded reported taking drugs at least once a month. (Table 2.15)
Similarly, pupils who reported that they had ever truanted or been excluded were more likelythan those who had never truanted or been excluded to have taken Class A drugs in the lastyear (8% of those who have truanted or been excluded, compared with 1% of those whohad never truanted or been excluded). This has declined gradually over time since 2003,when 14% of pupils who had truanted or been excluded reported taking Class A drugs inthe last year. (Table 2.16)
2.4 Availability and awareness of drugs
2.4.1 Whether pupils have been offered drugs
For each drug asked about in the survey, pupils were asked if they had ever been offeredthat drug. In 2013, 28% of pupils reported that they had been offered at least one of thedrugs asked about. This is similar to the proportion of pupils that had been offered drugsfrom 2010 to 2012 and maintains the overall decline from 2001, when 42% of pupilsreported that they had been offered any drug. In line with previous years, in 2013, pupilswere most likely to have been offered cannabis (18%) or glue, gas, aerosols or solvents(10%). (Table 2.17, Figure 2.5)
The likelihood that pupils had ever been offered drugs increased with age, and this wasevident for all types of drugs asked about. In 2013, 9% of 11 year olds reported that theyhad ever been offered any drugs and this increased to 51% amongst 15 year olds. As pupils
Cop
yrig
ht ©
201
4, H
ealth
and
Soc
ial C
are
Info
rmat
ion
Cen
tre.
All
right
s re
serv
ed.
Smoking, drinking and drug use among young people in England in 2013 23
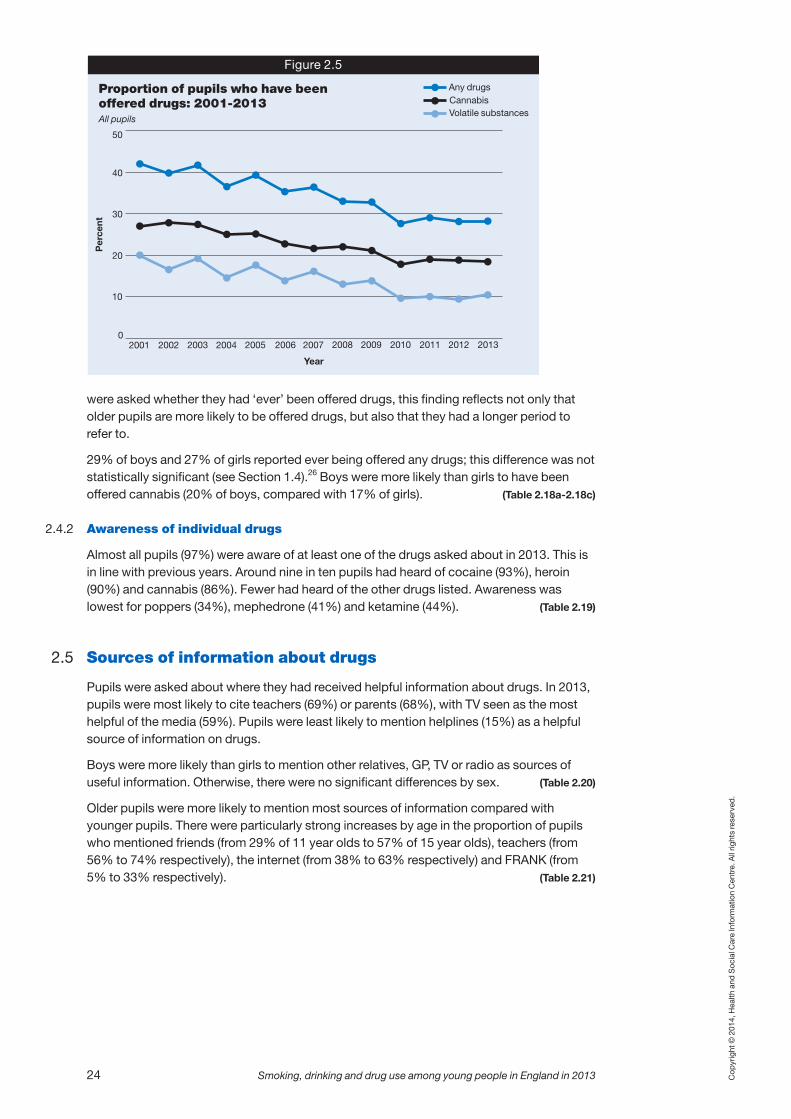
were asked whether they had ‘ever’ been offered drugs, this finding reflects not only thatolder pupils are more likely to be offered drugs, but also that they had a longer period torefer to.
29% of boys and 27% of girls reported ever being offered any drugs; this difference was notstatistically significant (see Section 1.4).26 Boys were more likely than girls to have beenoffered cannabis (20% of boys, compared with 17% of girls). (Table 2.18a-2.18c)
2.4.2 Awareness of individual drugs
Almost all pupils (97%) were aware of at least one of the drugs asked about in 2013. This isin line with previous years. Around nine in ten pupils had heard of cocaine (93%), heroin(90%) and cannabis (86%). Fewer had heard of the other drugs listed. Awareness waslowest for poppers (34%), mephedrone (41%) and ketamine (44%). (Table 2.19)
2.5 Sources of information about drugs
Pupils were asked about where they had received helpful information about drugs. In 2013,pupils were most likely to cite teachers (69%) or parents (68%), with TV seen as the mosthelpful of the media (59%). Pupils were least likely to mention helplines (15%) as a helpfulsource of information on drugs.
Boys were more likely than girls to mention other relatives, GP, TV or radio as sources ofuseful information. Otherwise, there were no significant differences by sex. (Table 2.20)
Older pupils were more likely to mention most sources of information compared withyounger pupils. There were particularly strong increases by age in the proportion of pupilswho mentioned friends (from 29% of 11 year olds to 57% of 15 year olds), teachers (from56% to 74% respectively), the internet (from 38% to 63% respectively) and FRANK (from5% to 33% respectively). (Table 2.21)
Cop
yrig
ht ©
201
4, H
ealth
and
Soc
ial C
are
Info
rmat
ion
Cen
tre.
All
right
s re
serv
ed.
24 Smoking, drinking and drug use among young people in England in 2013
Proportion of pupils who have been offered drugs: 2001-2013All pupils
2007 2008 2009 2010 2011 2012 20132002 20052004
Figure 2.5
Per
cent
0
10
20
30
40
50
20062001 2003
Year
Any drugsCannabisVolatile substances

Notes and references
1 Advisory Council on the Misuse of Drugs (2006) Pathways to problems.http://www.homeoffice.gov.uk/acmd1/pathways-to-problems/
2 BMA (2003) Adolescent Health, BMA London. http://bma.org.uk/about-the-bma/how-we-work/professional-activities-and-special-interest/board-of-science/board-of-science-publications
3 Patton G et al (2002) Cannabis use and mental health in young people: cohort study. BMJ. 2002November 23; 325(7374): 1195–1198. http://www.bmj.com/content/325/7374/1195.1.full.pdf
4 Becker J and Roe S (2005) Drug use among vulnerable groups of young people: findings from the 2003Crime and Justice Survey. http://webarchive.nationalarchives.gov.uk/20110218140603/http://rds.homeoffice.gov.uk/rds/pdfs05/r254.pdf
5 Home Office (1998). Tackling drugs to build a better Britain, Cm 3945, Stationery Office.http://www.archive.official-documents.co.uk/document/cm39/3945/3945.htm
6 Home Office (2002) Updated drug strategy 2002, which can be accessed via the University of Stirling’sonline drug and alcohol library http://www.drugslibrary.stir.ac.uk/documents/uk_ds2002.pdf
7 Home Office (2008) Drugs: protecting Families and Communities. The 2008 drugs strategyhttp://webarchive.nationalarchives.gov.uk/20100418065544/http://drugs.homeoffice.gov.uk/drug-strategy/
8 HM Government (2008). Drugs: protecting families and communities. action plan 2008-2011.http://webarchive.nationalarchives.gov.uk/20100418065544/http://drugs.homeoffice.gov.uk/publication-search/drug-strategy/drug-strategy-2008f6ce.html?view=Standard&pubID=531716
9 Home Office (2010) Drug strategy 2010 reducing demand, restricting supply, building recovery:supporting people to live a drug-free life. https://www.gov.uk/government/publications/drug-strategy-2010--2
10 Department for Education and the Association of Chief Police Officers (2012) DfE and ACPO drug advicefor schools. http://www.education.gov.uk/schools/pupilsupport/pastoralcare/health/drug/a00202357/drug-advice-for-schools
11 Advisory Council on the Misuse of Drugs (2011) Consideration of the Novel Psychoactive Substances(‘Legal Highs’). https://www.gov.uk/government/uploads/system/uploads/attachment_data/file/119139/acmdnps2011.pdf
12 The amendment was part of the Police Reform and Social Responsibility Act 2011http://www.legislation.gov.uk/ukpga/2011/13/part/4/crossheading/misuse-of-drugs/enacted
13 The questionnaire was revised following development work for the 2001 survey, which included cognitivetesting of questions about drug use, described in full in the 2001 report (Boreham R and Shaw A (2002)Drug use, smoking and drinking among young people in England in 2001 TSO, London). As a result, twomajor changes were made to the questionnaire.
The core drug questions were changed to the current format; information is collected about pupils’knowledge and experience of 15 individual drugs by asking a series of questions about each drugseparately. This replaced the approach of previous surveys; pupils were presented with a list of around15 drugs shown in grid format on a single page, and were asked which ones they had heard of, beenoffered and had taken. Evidence from testing suggested that pupils found the grid format difficult toanswer, and as a result they were more likely to miss some questions.
At the same time, it was found that the term ‘using’ drugs was associated with regular use rather thantrying drugs once or taking them occasionally, and the question wording was changed so that pupilswere asked about whether they had ever ‘tried’ drugs rather than ever ‘used’ drugs.
Comparison of data from the 2000 and 2001 surveys showed that in 2001 there was less missing dataand significantly higher reporting of volatile substance use. Given that volatile substances were at thebottom of the list of drugs taken in previous survey questionnaires, it is likely that the difference inreporting was due to the change in question format rather than a real change in behaviour.
14 Trend data concerning drug use from surveys in this series between 1998 and 2000 are available in FullerE (ed) (2006) Smoking, drinking and drug use among young people in England in 2005. The NHSInformation Centre, Leeds. http://www.hscic.gov.uk/pubs/sdd05fullreport
15 Recorded awareness of amphetamines since 2001 had not followed the increase generally observed forother drugs. Cognitive testing suggested two potential problems; low awareness of the term‘amphetamines’ (the drug was more commonly known as ‘speed’); and, for some children, problems withreading the word ‘amphetamines’ on a written questionnaire though they might recognise it when saidout loud. Because of this change, the measures of awareness, having been offered and having ever triedthis drug in this report are not strictly comparable with estimates from 2003 and before.
16 The 1971 Misuse of Drugs Act, HMSO, London http://www.legislation.gov.uk/ukpga/1971/38/contents
17 See https://www.gov.uk/penalties-drug-possession-dealing for a summary of current classifications.
18 Amyl nitrite is covered by the Medicines Act 1968; it is legally available on prescription only. Seehttp://www.opsi.gov.uk/RevisedStatutes/Acts/ukpga/1968/cukpga_19680067_en_1
19 There is some question as to whether these alkyl nitrites, legally available in products such as roomdeodorants, but also sold by sex shops and other outlets, should be covered by the Medicines Act. Seehttp://www.drugscope.org.uk/resources/drugsearch/drugsearchpages/nitrites.htm
Cop
yrig
ht ©
201
4, H
ealth
and
Soc
ial C
are
Info
rmat
ion
Cen
tre.
All
right
s re
serv
ed.
Smoking, drinking and drug use among young people in England in 2013 25
20 The 2005 Drugs Act can be found at http://www.opsi.gov.uk/acts/acts2005/ukpga_20050017_en_1
21 Cannabis was previously reclassified from Class B to Class C on 29th January 2004.
22 Because of generally low prevalence rates, percentages for the use of individual drugs are shown to onedecimal place.
23 The prevalence rates of drug use measured by the questions about drugs in general are lower than thekey survey estimates reported earlier, based on pupils’ responses to questions about individual drugs;the latter estimates should be considered definitive. In response to the question about drug use ingeneral, 13% of pupils reported that they had ever taken any drug, whereas the proportion who had evertaken any of the 15 individual drugs listed in the questionnaire (including ‘other’ drugs) was 17%. Thefigures for drug use in the last year were 8% in response to the single question, and 12% when reporteduse of individual drugs was combined. Similar disparities have been noted in previous years.
24 Other groups include looked-after children, those who have experienced homelessness and persistentoffenders, none of whom are identified by this survey.
25 If more than four pupils were absent when the survey was carried out, the interviewer returned to theschool at a time when those pupils were likely to be present (see Appendix A).
26 The p-value for the difference was 0.053, so just outside the 95% confidence interval.
Cop
yrig
ht ©
201
4, H
ealth
and
Soc
ial C
are
Info
rmat
ion
Cen
tre.
All
right
s re
serv
ed.
26 Smoking, drinking and drug use among young people in England in 2013

Copyright © 2014, Health and Social Care Information Centre, Lifestyles Statistics. All rights reserved.
Smoking, drinking and drug use among young people in England in 2013 27
Table 2.1
Proportion of pupils who have ever taken drugs, by sex and age: 2001-2013a,b,c
All pupils 2001-2013
Year
2001 2002 2003 2004 2005 2006 2007 2008 2009 2010c 2011c 2012c 2013c
% % % % % % % % % % % % %
Boys
11 years 13 12 16 11 15 10 13 10 9 7 7 7 6
12 years 16 18 17 14 16 13 15 12 14 8 7 8 10
13 years 30 24 28 24 22 19 20 23 17 14 15 15 11
14 years 35 39 37 36 36 32 35 26 27 21 21 18 15
15 years 51 49 49 44 46 40 42 38 43 33 31 32 32
Total 30 29 31 26 28 24 26 23 23 18 18 17 17
Girls
11 years 12 12 15 10 13 10 8 6 9 11 6 7 4
12 years 17 12 17 15 15 11 12 11 13 9 7 7 7
13 years 27 24 27 20 23 19 21 19 16 13 14 14 11
14 years 37 32 38 32 36 31 32 27 27 20 20 20 21
15 years 45 43 48 42 44 40 41 38 37 30 28 29 28
Total 28 25 30 25 27 24 24 21 21 18 16 17 16
Total
11 years 12 12 15 11 14 10 11 8 9 9 6 7 5
12 years 17 15 17 14 16 12 14 11 13 9 7 8 9
13 years 28 24 27 22 22 19 20 21 17 13 14 15 11
14 years 36 35 38 34 36 32 33 26 27 20 20 19 18
15 years 48 46 49 43 45 40 41 38 40 32 29 31 30
Total 29 27 30 26 28 24 25 22 22 18 17 17 16
Unweighted basesc
Boys
11 years 782 803 820 795 680 553 558 578 549 523 457 513 384
12 years 877 950 980 962 864 769 783 734 714 715 610 663 501
13 years 902 968 1024 960 904 734 758 732 729 689 564 708 498
14 years 866 921 974 944 881 781 745 729 684 665 591 708 501
15 years 1008 1092 1123 1052 967 870 889 908 865 826 717 869 629
Total 4435 4734 4921 4713 4296 3707 3733 3681 3541 3418 2939 3461 2513
Girls
11 years 762 754 811 778 670 586 542 586 575 546 495 527 369
12 years 939 929 1023 886 836 787 692 737 725 681 605 715 463
13 years 920 905 1012 902 877 808 741 725 724 699 662 733 442
14 years 920 925 940 890 929 754 683 741 720 720 600 733 448
15 years 933 998 1086 1005 940 971 856 852 849 787 755 838 550
Total 4474 4511 4872 4461 4252 3906 3514 3641 3593 3433 3117 3546 2272
Total
11 years 1544 1557 1631 1573 1350 1139 1100 1164 1124 1069 952 1040 753
12 years 1816 1879 2003 1848 1700 1556 1475 1471 1439 1396 1215 1378 964
13 years 1822 1873 2036 1862 1781 1542 1499 1457 1453 1388 1226 1441 940
14 years 1786 1846 1914 1834 1810 1535 1428 1470 1404 1385 1191 1441 949
15 years 1941 2090 2209 2057 1907 1841 1745 1760 1714 1613 1472 1707 1179
Total 8909 9245 9793 9174 8548 7613 7247 7322 7134 6851 6056 7007 4785
a Because of changes to the questionnaire in 2001, estimates of the prevalence of drug use from surveys in this seriescarried out between 1998 and 2000 are not comparable with those shown here. Data from the earlier surveys haveconsequently been omitted from this table; they are available in the 2006 report: Fuller E (ed) Smoking, drinking anddrug use among young people in England in 2006.
b The 2003 report contained revisions of the previously published estimates for 2002.
c Estimates since 2010 are based on weighted data (see Section 1.3.3). 2013 weighted bases are of a similar magnitudeto the weighted bases shown in Table 2.5.
Evertakendrugs
Data from 2001 to 2003 re-used with permission of the Department of Health

Copyright © 2014, Health and Social Care Information Centre, Lifestyles Statistics. All rights reserved.
28 Smoking, drinking and drug use among young people in England in 2013
Table 2.2
Proportion of pupils who took drugs in the last year, by sex and age: 2001-2013a,b,c
All pupils 2001-2013
Year
2001 2002 2003 2004 2005 2006 2007 2008 2009 2010c 2011c 2012c 2013c
% % % % % % % % % % % % %
Boys
11 years 7 7 8 6 7 7 8 5 5 4 2 4 4
12 years 8 10 11 8 11 8 8 6 7 4 3 6 5
13 years 20 17 19 16 15 13 11 14 10 9 10 9 7
14 years 26 29 27 27 26 23 24 19 19 16 16 13 11
15 years 41 39 39 33 34 28 32 30 32 27 26 24 26
Total 21 21 22 18 19 17 18 16 16 13 13 12 12
Girls
11 years 4 6 7 4 6 5 4 2 4 5 3 4 2
12 years 9 6 9 8 8 6 7 5 6 5 4 3 4
13 years 18 16 17 13 14 12 14 13 10 8 9 9 7
14 years 27 25 29 23 27 23 24 18 18 13 13 14 14
15 years 36 34 36 32 34 30 30 28 27 24 21 23 22
Total 19 18 20 17 19 16 17 14 14 12 11 12 11
Total
11 years 6 6 8 5 6 6 6 4 5 5 3 4 3
12 years 9 8 10 8 9 7 8 5 7 4 3 4 4
13 years 19 16 18 14 15 12 12 13 10 8 9 9 7
14 years 27 27 28 25 26 23 24 19 19 14 14 13 12
15 years 39 37 38 32 34 29 31 29 30 25 23 24 24
Total 20 20 21 18 19 17 17 15 15 12 12 12 11
Unweighted basesc
Boys
11 years 779 797 812 792 673 553 554 576 547 521 453 512 383
12 years 865 945 976 958 858 765 780 728 710 711 607 662 501
13 years 894 960 1012 953 899 727 750 730 723 686 561 708 494
14 years 860 916 964 936 867 770 735 722 679 663 588 707 497
15 years 996 1088 1112 1044 956 866 878 903 861 820 713 867 623
Total 4394 4706 4876 4683 4253 3681 3697 3659 3520 3401 2922 3456 2498
Girls
11 years 759 753 808 774 668 583 541 585 574 546 494 525 369
12 years 939 927 1020 885 827 783 687 735 722 681 605 714 462
13 years 915 903 1004 899 870 805 733 719 723 694 658 730 442
14 years 916 921 936 886 927 752 679 739 716 718 597 730 448
15 years 929 993 1077 999 931 965 849 848 845 785 752 835 550
Total 4458 4497 4845 4443 4223 3888 3489 3626 3580 3424 3106 3534 2271
Total
11 years 1538 1550 1620 1566 1341 1136 1095 1161 1121 1067 947 1037 752
12 years 1804 1872 1996 1843 1685 1548 1467 1463 1432 1392 1212 1376 963
13 years 1809 1863 2016 1852 1769 1532 1483 1449 1446 1380 1219 1438 936
14 years 1776 1837 1900 1822 1794 1522 1414 1461 1395 1381 1185 1437 945
15 years 1925 2081 2189 2043 1887 1831 1727 1751 1706 1605 1465 1702 1173
Total 8852 9203 9721 9126 8476 7569 7186 7285 7100 6825 6028 6990 4769
a Because of changes to the questionnaire in 2001, estimates of the prevalence of drug use from surveys in this seriescarried out between 1998 and 2000 are not comparable with those shown here. Data from the earlier surveys haveconsequently been omitted from this table; they are available in the 2006 report: Fuller E (ed) Smoking, drinking anddrug use among young people in England in 2006.
b The 2003 report contained revisions of the previously published estimates for 2002.
c Estimates since 2010 are based on weighted data (see Section 1.3.3). 2013 weighted bases are of a similar magnitudeto the weighted bases shown in Table 2.5.
Tookdrugs inthe lastyear
Data from 2001 to 2003 re-used with permission of the Department of Health

Copyright © 2014, Health and Social Care Information Centre, Lifestyles Statistics. All rights reserved.
Smoking, drinking and drug use among young people in England in 2013 29
Table 2.3
Proportion of pupils who took drugs in the last month, by sex and age: 2001-2013a,b,c
All pupils 2001-2013
Year
2001 2002 2003 2004 2005 2006 2007 2008 2009 2010c 2011c 2012c 2013c
% % % % % % % % % % % % %
Boys
11 years 4 4 4 4 4 4 4 2 3 2 1 3 2
12 years 4 5 5 4 5 4 4 4 4 1 1 3 3
13 years 11 9 11 8 8 7 5 9 6 5 5 4 3
14 years 17 19 17 17 16 15 14 10 10 9 8 7 6
15 years 25 26 25 21 22 18 19 18 21 16 15 15 16
Total 13 13 13 11 11 10 10 9 9 7 7 7 6
Girls
11 years 2 3 3 1 3 3 2 1 2 2 2 1 1
12 years 4 3 5 4 4 3 4 2 3 3 2 1 2
13 years 9 8 8 7 8 6 7 7 6 3 4 6 4
14 years 15 15 18 13 16 12 15 11 11 6 5 8 8
15 years 22 19 22 20 19 16 16 14 13 13 10 11 12
Total 11 10 12 9 10 8 9 7 7 6 5 6 6
Total
11 years 3 3 4 3 3 3 3 2 2 2 2 2 1
12 years 4 4 5 4 4 3 4 3 3 2 2 2 2
13 years 10 8 9 7 8 6 6 8 6 4 5 5 3
14 years 16 17 17 15 16 13 15 10 10 7 7 7 7
15 years 24 22 23 21 20 17 17 16 17 14 13 13 14
Total 12 12 12 10 11 9 10 8 8 7 6 6 6
Unweighted basesc
Boys
11 years 778 794 810 792 672 552 551 576 545 520 452 512 383
12 years 861 941 973 954 851 764 772 728 707 707 606 659 500
13 years 887 950 1005 952 891 722 745 722 720 685 561 708 492
14 years 852 910 951 932 853 764 727 716 673 659 584 704 493
15 years 982 1077 1101 1034 941 855 868 899 848 812 711 860 619
Total 4360 4672 4840 4664 4208 3657 3663 3641 3493 3383 2914 3443 2487
Girls
11 years 759 751 806 774 667 582 540 584 572 546 493 524 369
12 years 937 924 1017 883 825 780 685 732 721 680 605 714 459
13 years 913 897 997 897 865 801 730 716 722 691 652 730 442
14 years 911 914 929 878 921 745 677 737 714 715 593 727 446
15 years 919 987 1069 990 922 958 838 837 835 778 744 829 545
Total 4439 4473 4818 4422 4200 3866 3470 3606 3564 3410 3087 3524 2261
Total
11 years 1537 1545 1616 1566 1339 1134 1091 1160 1117 1066 945 1036 752
12 years 1798 1865 1990 1837 1676 1544 1457 1460 1428 1387 1211 1373 959
13 years 1800 1847 2002 1849 1756 1523 1475 1438 1442 1376 1213 1438 934
14 years 1763 1824 1880 1810 1774 1509 1404 1453 1387 1374 1177 1431 939
15 years 1901 2064 2170 2024 1863 1813 1706 1736 1683 1590 1455 1689 1164
Total 8799 9145 9658 9086 8408 7523 7133 7247 7057 6793 6001 6967 4748
a Because of changes to the questionnaire in 2001, estimates of the prevalence of drug use from surveys in this seriescarried out between 1998 and 2000 are not comparable with those shown here. Data from the earlier surveys haveconsequently been omitted from this table; they are available in the 2006 report: Fuller E (ed) Smoking, drinking anddrug use among young people in England in 2006.
b The 2003 report contained revisions of the previously published estimates for 2002.
c Estimates since 2010 are based on weighted data (see Section 1.3.3). 2013 weighted bases are of a similar magnitudeto the weighted bases shown in Table 2.5.
Tookdrugs inthe lastmonth
Data from 2001 to 2003 re-used with permission of the Department of Health

Copyright © 2014, Health and Social Care Information Centre, Lifestyles Statistics. All rights reserved.
30 Smoking, drinking and drug use among young people in England in 2013
Table 2.4
Proportion of pupils who have taken drugs (including and excluding volatile substances)ever, in the last year and in the last month, by sex: 2001-2013a,b,c
All pupils 2001-2013
Year
2001 2002 2003b 2004 2005 2006 2007 2008 2009 2010c 2011c 2012c 2013c
% % % % % % % % % % % % %
Boys
All drugs
Ever taken drugs 30 29 31 26 28 24 26 23 23 18 18 17 17
Taken drugs in the last year 21 21 22 18 19 17 18 16 16 13 13 12 12
Taken drugs in the last month 13 13 13 11 11 10 10 9 9 7 7 7 6
Excluding volatile substances
Ever taken drugs 21 21 22 19 19 18 17 16 15 13 12 12 11
Taken drugs in the last year 17 18 18 15 15 14 14 13 12 11 11 10 9
Taken drugs in the last month 11 11 10 9 10 9 8 8 8 6 6 6 5
Girls
All drugs
Ever taken drugs 28 25 30 25 27 24 24 21 21 18 16 17 16
Taken drugs in the last year 19 18 20 17 19 16 17 14 14 12 11 12 11
Taken drugs in the last month 11 10 12 9 10 8 9 7 7 6 5 6 6
Excluding volatile substances
Ever taken drugs 17 17 18 16 18 16 15 13 12 11 9 10 9
Taken drugs in the last year 15 14 15 13 15 13 13 10 10 9 8 8 8
Taken drugs in the last month 9 8 9 7 8 7 7 5 5 4 4 4 4
Total
All drugs
Ever taken drugs 29 27 30 26 28 24 25 22 22 18 17 17 16
Taken drugs in the last year 20 20 21 18 19 17 17 15 15 12 12 12 11
Taken drugs in the last month 12 12 12 10 11 9 10 8 8 7 6 6 6
Excluding volatile substances
Ever taken drugs 19 19 20 18 18 17 16 14 13 12 11 11 10
Taken drugs in the last year 16 16 16 14 15 13 13 12 11 10 9 9 9
Taken drugs in the last month 10 10 10 8 9 8 7 6 6 5 5 5 5
Unweighted basesc,d
Boys 4360 4734 4921 4713 4296 3707 3733 3681 3540 3417 2951 3473 2531
Girls 4439 4511 4872 4461 4252 3906 3514 3641 3602 3435 3127 3557 2288
Total 8799 9145 9658 9086 8408 7523 7247 7322 7142 6852 6078 7030 4819
a Because of changes to the questionnaire in 2001, estimates of the prevalence of drug use from surveys in this series carried out between1998 and 2000 are not comparable with those shown here. Data from the earlier surveys have consequently been omitted from this table;they are available in the 2006 report: Fuller E (ed) Smoking, drinking and drug use among young people in England in 2006.
b The 2003 report contained revisions of the previously published estimates for 2002.
c Estimates since 2010 are based on weighted data (see Section 1.3.3). 2013 weighted bases are of a similar magnitude to those shown inTable 2.5.
d Bases shown for any drug use excluding volatile substances. Other bases may vary slightly.
Taken drugs
Data from 2001 to 2003 re-used with permission of the Department of Health

Copyright © 2014, Health and Social Care Information Centre, Lifestyles Statistics. All rights reserved.
Smoking, drinking and drug use among young people in England in 2013 31
Table 2.5
Proportion of pupils who have taken drugs (includingand excluding volatile substances) ever, in the last yearand in the last month, by age and sex
All pupils 2013
Age
11 12 13 14 15 Totalyears years years years years
% % % % % %
Boys
All drugs
Ever taken drugs 6 10 11 15 32 17
Taken drugs in the last year 4 5 7 11 26 12
Taken drugs in the last month 2 3 3 6 16 6
Excluding volatile substances
Ever taken drugs 1 2 6 10 29 11
Taken drugs in the last year 1 2 4 8 24 9
Taken drugs in the last month 1 1 2 4 15 5
Girls
All drugs
Ever taken drugs 4 7 11 21 28 16
Taken drugs in the last year 2 4 7 14 22 11
Taken drugs in the last month 1 2 4 8 12 6
Excluding volatile substances
Ever taken drugs 1 1 4 12 21 9
Taken drugs in the last year 1 1 3 11 19 8
Taken drugs in the last month 0 0 2 6 10 4
Total
All drugs
Ever taken drugs 5 9 11 18 30 16
Taken drugs in the last year 3 4 7 12 24 11
Taken drugs in the last month 1 2 3 7 14 6
Excluding volatile substances
Ever taken drugs 1 2 5 11 25 10
Taken drugs in the last year 1 1 4 9 21 9
Taken drugs in the last month 1 1 2 5 12 5
Unweighted basesa
Boys 385 503 503 508 632 2531
Girls 373 463 444 454 554 2288
Total 758 966 947 962 1186 4819
Weighted basesa
Boys 364 470 466 494 629 2423
Girls 360 472 459 473 633 2397
Total 724 942 926 967 1262 4821
a Bases shown for any drug use excluding volatile substances. Other bases may varyslightly.
Taken drugs

Copyright © 2014, Health and Social Care Information Centre, Lifestyles Statistics. All rights reserved.
32 Smoking, drinking and drug use among young people in England in 2013
Table 2.6a
Proportion of boys who have taken individual drugs in the last year: 2001-2013a,b
All boys 2001-2013
Year
2001 2002 2003 2004 2005 2006 2007 2008 2009 2010c 2011c 2012c 2013c
% % % % % % % % % % % % %
Cannabis 14.3 14.4 14.2 12.2 12.2 10.8 9.6 10.1 9.8 8.8 8.9 7.9 7.4
Any stimulantsd 5.8 6.5 6.2 5.3 5.7 5.8 6.4 5.1 3.7 2.5 2.9 2.5 2.1
Cocaine 1.1 1.2 1.3 1.4 2.1 1.6 1.6 1.9 1.5 0.8 1.1 1.0 0.7
Crack 0.9 0.9 1.2 1.0 0.9 0.8 1.0 0.7 0.7 0.4 0.5 0.7 0.3
Ecstasy 1.7 1.3 1.3 1.4 1.4 1.5 1.0 1.5 1.4 0.8 1.1 1.1 0.7
Amphetaminese 1.1 1.1 1.1 1.4 1.0 1.4 0.9 1.1 0.9 0.7 1.0 0.8 0.5
Poppers 3.7 4.7 4.1 3.2 3.4 3.6 4.5 3.0 1.8 1.3 1.0 0.7 0.7
Mephedronef f f f f f f f f f f f 0.8 0.5
Any psychedelicsg 2.7 2.1 2.8 2.6 2.5 2.7 2.0 2.6 2.4 1.6 1.6 1.3 1.4
LSD 0.6 0.7 0.7 0.9 0.7 0.9 0.7 0.8 0.7 0.5 0.6 0.4 0.6
Magic mushrooms 2.4 1.8 2.6 2.2 1.9 1.9 1.2 1.7 1.8 1.1 1.1 0.7 0.6
Ketamineh h h h h 0.5 0.6 0.4 0.8 0.7 0.5 0.5 0.5 0.5
Any opiates 0.7 0.8 1.0 0.7 0.8 0.7 0.5 0.8 0.8 0.7 0.8 0.7 0.4
Heroin 0.6 0.8 0.9 0.7 0.7 0.6 0.4 0.6 0.5 0.4 0.6 0.5 0.2
Methadone 0.2 0.2 0.2 0.2 0.3 0.4 0.2 0.4 0.4 0.4 0.4 0.3 0.3
Glue, gas, aerosols or solvents 6.6 6.2 7.0 5.3 6.1 4.6 5.6 4.8 5.4 3.2 3.1 3.2 3.5
Tranquillisers 0.5 0.5 0.5 0.4 0.5 0.5 0.5 0.6 0.5 0.3 0.7 0.4 0.5
Other drugs 0.6 0.4 0.8 0.5 0.7 0.2 0.6 0.4 0.5 0.4 0.7 0.2 0.2
Any Class A drugi 4.5 3.8 4.8 3.9 4.4 4.7 3.8 4.3 3.8 2.3 2.7 2.4 2.0
Any drug 21.3 21.4 21.6 18.5 19.3 16.8 17.6 15.9 15.7 13.0 12.7 12.3 11.6
Any drug (excluding volatile substances) 17.4 17.4 17.5 14.9 15.3 14.1 13.9 12.9 12.2 10.6 10.8 9.8 9.0
Unweighted bases (boys)c,j 4687 5081 5250 5000 4667 3994 4064 3943 3837 3646 3138 3771 2735
a Because of changes to the questionnaire in 2001, estimates of the prevalence of drug use from surveys in this series carried outbetween 1998 and 2000 are not comparable with those shown here. Data from the earlier surveys have consequently beenomitted from this table; they are available in the 2006 report: Fuller E (ed) Smoking, drinking and drug use among young people inEngland in 2006.
b Estimates are shown to one decimal place because of generally low prevalence rates.
c Estimates since 2010 are based on weighted data (see Section 1.3.3). 2013 weighted bases are shown in Table 2.7a.
d The 2012 and 2013 estimates for stimulants include mephedrone.
e Surveys from 2004 onwards asked about ‘speed and other amphetamines’. See note 15.
f Mephedrone was measured for the first time in 2012.
g From 2005, estimates for psychedelics include ketamine.
h Ketamine was measured for the first time in 2005.
i See Section 2.1.2 for a definition of Class A drugs.
j Bases show numbers of boys with valid responses for at least one of the 15 drugs or types of drug asked about.
Type of drugtaken in thelast year
Data from 2001 to 2003 re-used with permission of the Department of Health
Copyright © 2014, Health and Social Care Information Centre, Lifestyles Statistics. All rights reserved.
Smoking, drinking and drug use among young people in England in 2013 33
Table 2.6b
Proportion of girls who have taken individual drugs in the last year: 2001-2013a,b
All girls 2001-2013
Year
2001 2002 2003 2004 2005 2006 2007 2008 2009 2010c 2011c 2012c 2013c
% % % % % % % % % % % % %
Cannabis 12.4 11.9 12.4 10.3 11.2 9.4 9.2 7.8 8.1 7.5 6.3 7.1 6.5
Any stimulantsd 5.4 5.9 6.1 5.6 6.6 6.5 7.4 4.7 3.4 2.9 2.0 2.7 2.1
Cocaine 1.3 1.4 1.3 1.3 1.7 1.6 2.1 1.6 1.0 0.9 0.5 0.8 0.6
Crack 1.2 1.0 1.2 1.1 1.1 0.8 1.0 0.6 0.6 0.2 0.2 0.3 0.5
Ecstasy 1.5 1.7 1.5 1.4 1.5 1.7 1.6 1.0 1.0 1.0 0.6 0.7 0.5
Amphetaminese 1.1 1.2 1.3 1.3 1.3 1.0 1.2 0.8 0.6 0.9 0.4 0.7 0.3
Poppers 3.1 3.8 3.9 3.6 4.4 4.8 5.3 2.8 1.8 1.6 1.0 0.8 0.8
Mephedronef f f f f f f f f f f f 0.6 0.4
Any psychedelicsg 2.2 1.5 2.0 2.0 2.3 1.7 1.8 1.6 1.9 1.6 1.2 1.0 0.7
LSD 0.7 0.7 0.6 0.5 0.6 0.6 0.6 0.6 0.6 0.3 0.3 0.4 0.3
Magic mushrooms 1.7 1.2 1.7 1.7 1.7 0.9 1.1 0.8 1.3 1.0 0.6 0.6 0.4
Ketamineh h h h h 0.4 0.5 0.4 0.7 0.4 0.5 0.5 0.5 0.3
Any opiates 0.9 0.8 0.8 0.8 0.9 0.6 0.9 0.6 0.5 0.9 0.5 0.4 0.4
Heroin 0.8 0.6 0.7 0.7 0.9 0.5 0.8 0.4 0.4 0.3 0.2 0.2 0.3
Methadone 0.1 0.3 0.1 0.1 0.1 0.2 0.1 0.2 0.2 0.7 0.3 0.2 0.1
Glue, gas, aerosols or solvents 7.7 6.4 8.2 5.8 7.3 5.6 6.8 5.2 5.6 4.3 3.9 3.9 3.6
Tranquillisers 0.4 0.3 0.4 0.3 0.3 0.3 0.3 0.4 0.2 0.2 0.2 0.3 0.1
Other drugs 0.5 0.4 0.5 0.3 0.4 0.2 0.4 0.2 0.2 0.5 0.4 0.3 0.4
Any Class A drugi 4.1 3.6 3.9 3.9 4.4 3.8 4.2 3.0 3.3 2.5 1.9 1.9 1.8
Any drug 19.4 18.0 20.5 16.7 18.8 16.3 17.0 14.1 13.9 11.9 10.8 11.5 11.0
Any drug (excluding volatile substances) 14.8 14.4 15.1 13.2 14.6 12.7 12.7 10.2 10.0 8.8 7.7 8.5 8.1
Unweighted bases(girls)c,j 4670 4749 5121 4666 4507 4138 3749 3811 3811 3596 3308 3763 2433
a Because of changes to the questionnaire in 2001, estimates of the prevalence of drug use from surveys in this series carried outbetween 1998 and 2000 are not comparable with those shown here. Data from the earlier surveys have consequently beenomitted from this table; they are available in the 2006 report: Fuller E (ed) Smoking, drinking and drug use among young people inEngland in 2006.
b Estimates are shown to one decimal place because of generally low prevalence rates.
c Estimates since 2010 are based on weighted data (see Section 1.3.3). 2013 weighted bases are shown in Table 2.7b.
d The 2012 and 2013 estimates for stimulants include mephedrone.
e Surveys from 2004 onwards asked about ‘speed and other amphetamines’. See note 15.
f Mephedrone was measured for the first time in 2012.
g From 2005, estimates for psychedelics include ketamine.
h Ketamine was measured for the first time in 2005.
i See Section 2.1.2 for a definition of Class A drugs.
j Bases show numbers of boys with valid responses for at least one of the 15 drugs or types of drug asked about.
Type of drugstaken in thelast year
Data from 2001 to 2003 re-used with permission of the Department of Health

Copyright © 2014, Health and Social Care Information Centre, Lifestyles Statistics. All rights reserved.
34 Smoking, drinking and drug use among young people in England in 2013
Table 2.6c
Proportion of pupils who have taken individual drugs in the last year: 2001-2013a,b
All pupils 2001-2013
Year
2001 2002 2003 2004 2005 2006 2007 2008 2009 2010c 2011c 2012c 2013c
% % % % % % % % % % % % %
Cannabis 13.4 13.2 13.3 11.3 11.7 10.1 9.4 9.0 8.9 8.2 7.6 7.5 7.0
Any stimulantsd 5.6 6.2 6.1 5.4 6.2 6.2 6.9 4.9 3.6 2.7 2.5 2.6 2.1
Cocaine 1.2 1.3 1.3 1.4 1.9 1.6 1.8 1.7 1.2 0.9 0.8 0.9 0.7
Crack 1.1 1.0 1.2 1.1 1.0 0.8 1.0 0.7 0.6 0.3 0.4 0.5 0.4
Ecstasy 1.6 1.5 1.4 1.4 1.5 1.6 1.3 1.3 1.2 0.9 0.8 0.9 0.6
Amphetaminese 1.1 1.2 1.2 1.3 1.2 1.2 1.0 0.9 0.8 0.8 0.7 0.7 0.4
Poppers 3.4 4.3 4.0 3.4 3.9 4.2 4.9 2.9 1.8 1.5 1.0 0.8 0.8
Mephedronef f f f f f f f f f f f 0.7 0.4
Any psychedelicsg 2.4 1.8 2.4 2.3 2.4 2.2 1.9 2.1 2.2 1.6 1.4 1.1 1.1
LSD 0.7 0.7 0.6 0.7 0.6 0.7 0.6 0.7 0.7 0.4 0.5 0.4 0.4
Magic mushrooms 2.1 1.5 2.1 2.0 1.8 1.4 1.2 1.3 1.5 1.0 0.9 0.6 0.5
Ketamineh h h h h 0.4 0.5 0.4 0.7 0.6 0.5 0.5 0.5 0.4
Any opiates 0.8 0.8 0.9 0.7 0.9 0.7 0.7 0.7 0.7 0.8 0.7 0.5 0.4
Heroin 0.7 0.7 0.8 0.7 0.8 0.5 0.5 0.5 0.4 0.3 0.4 0.4 0.3
Methadone 0.2 0.2 0.2 0.1 0.2 0.3 0.2 0.3 0.3 0.5 0.4 0.2 0.2
Glue, gas, aerosols or solvents 7.1 6.3 7.6 5.6 6.7 5.1 6.2 5.0 5.5 3.8 3.5 3.6 3.6
Tranquillisers 0.5 0.4 0.5 0.4 0.4 0.4 0.4 0.5 0.4 0.2 0.4 0.4 0.3
Other drugs 0.6 0.4 0.7 0.4 0.6 0.2 0.5 0.3 0.4 0.4 0.5 0.2 0.3
Any Class A drugi 4.3 3.7 4.3 3.9 4.4 4.3 4.0 3.6 3.6 2.4 2.3 2.2 1.9
Any drug 20.4 19.7 21.0 17.6 19.1 16.5 17.3 15.0 14.8 12.5 11.8 11.9 11.3
Any drug (excluding volatile substances) 16.1 15.9 16.3 14.0 15.0 13.4 13.3 11.6 11.1 9.7 9.3 9.1 8.5
Unweighted bases (pupils)c,j 9357 9830 10371 9666 9174 8132 7813 7754 7648 7242 6491 7534 5168
a Because of changes to the questionnaire in 2001, estimates of the prevalence of drug use from surveys in this series carried outbetween 1998 and 2000 are not comparable with those shown here. Data from the earlier surveys have consequently beenomitted from this table; they are available in the 2006 report: Fuller E (ed) Smoking, drinking and drug use among young people inEngland in 2006.
b Estimates are shown to one decimal place because of generally low prevalence rates.
c Estimates since 2010 are based on weighted data (see Section 1.3.3). 2013 weighted bases are shown in Table 2.7c.
d The 2012 and 2013 estimates for stimulants include mephedrone.
e Surveys from 2004 onwards asked about ‘speed and other amphetamines’. See note 15.
f Mephedrone was measured for the first time in 2012.
g From 2005, estimates for psychedelics include ketamine.
h Ketamine was measured for the first time in 2005.
i See Section 2.1.2 for a definition of Class A drugs.
j Bases show numbers of boys with valid responses for at least one of the 15 drugs or types of drug asked about.
Type of drugtaken in thelast year
Data from 2001 to 2003 re-used with permission of the Department of Health

Copyright © 2014, Health and Social Care Information Centre, Lifestyles Statistics. All rights reserved.
Smoking, drinking and drug use among young people in England in 2013 35
Table 2.7a
Proportion of boys who have taken individualdrugs in the last year, by agea
All boys 2013
Age
11 12 13 14 15 Totalyears years years years years
% % % % % %
Cannabis 0.5 0.5 3.5 6.1 20.9 7.4
Any stimulants 0.5 0.1 1.1 1.3 5.8 2.1
Cocaine - 0.1 0.4 0.3 2.2 0.7
Crack - 0.1 0.4 - 0.8 0.3
Ecstasy - - 0.5 0.2 2.2 0.7
Amphetamines - 0.1 0.6 0.2 1.3 0.5
Poppers 0.5 0.1 0.1 0.6 1.8 0.7
Mephedrone - 0.1 - 0.2 1.7 0.5
Any psychedelics 0.4 0.6 0.5 1.2 3.5 1.4
LSD 0.2 0.3 0.2 0.5 1.4 0.6
Magic mushrooms 0.2 0.4 0.5 0.6 1.2 0.6
Ketamine - - - 0.3 1.9 0.5
Any opiates 0.3 0.1 0.1 0.2 1.0 0.4
Heroin - 0.1 0.1 0.2 0.5 0.2
Methadone 0.3 0.1 - - 0.9 0.3
Glue, gas, aerosols or solvents 2.5 4.2 2.8 3.5 4.3 3.5
Tranquillisers - 0.7 - 0.3 1.0 0.5
Other drugs - 0.4 0.2 - 0.4 0.2
Any Class A drugb 0.7 0.7 1.4 1.7 4.5 2.0
Any drug 3.6 5.3 6.6 10.7 25.6 11.6
Any drug (excluding volatile substances) 1.1 1.5 4.2 7.9 23.6 9.0
Unweighted bases (boys)c 422 546 547 554 666 2735
Weighted bases (boys)c 399 511 507 539 662 2618
a Estimates are shown to one decimal place because of generally lowprevalence rates.
b See Section 2.1.2 for a definition of Class A drugs.
c Bases show numbers of boys with valid responses for at least one of the 15drugs or types of drug asked about.
Type of drugtaken in thelast year
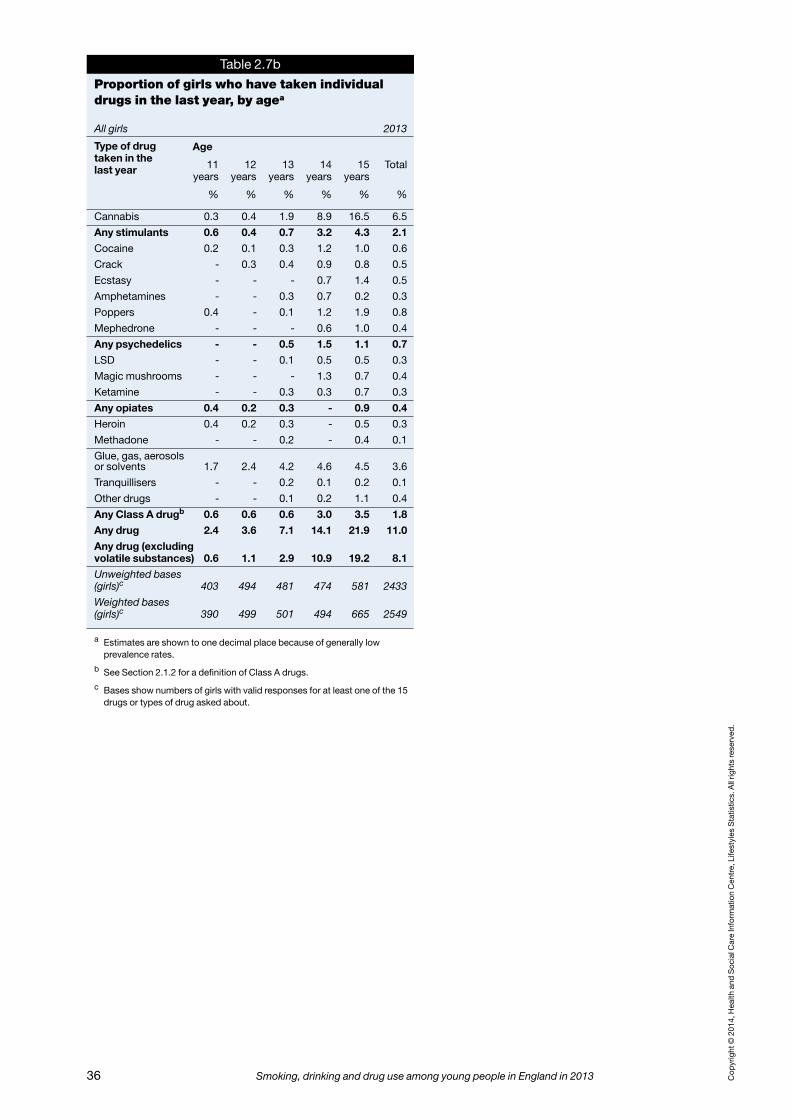
Copyright © 2014, Health and Social Care Information Centre, Lifestyles Statistics. All rights reserved.
36 Smoking, drinking and drug use among young people in England in 2013
Table 2.7b
Proportion of girls who have taken individualdrugs in the last year, by agea
All girls 2013
Age
11 12 13 14 15 Totalyears years years years years
% % % % % %
Cannabis 0.3 0.4 1.9 8.9 16.5 6.5
Any stimulants 0.6 0.4 0.7 3.2 4.3 2.1
Cocaine 0.2 0.1 0.3 1.2 1.0 0.6
Crack - 0.3 0.4 0.9 0.8 0.5
Ecstasy - - - 0.7 1.4 0.5
Amphetamines - - 0.3 0.7 0.2 0.3
Poppers 0.4 - 0.1 1.2 1.9 0.8
Mephedrone - - - 0.6 1.0 0.4
Any psychedelics - - 0.5 1.5 1.1 0.7
LSD - - 0.1 0.5 0.5 0.3
Magic mushrooms - - - 1.3 0.7 0.4
Ketamine - - 0.3 0.3 0.7 0.3
Any opiates 0.4 0.2 0.3 - 0.9 0.4
Heroin 0.4 0.2 0.3 - 0.5 0.3
Methadone - - 0.2 - 0.4 0.1
Glue, gas, aerosols or solvents 1.7 2.4 4.2 4.6 4.5 3.6
Tranquillisers - - 0.2 0.1 0.2 0.1
Other drugs - - 0.1 0.2 1.1 0.4
Any Class A drugb 0.6 0.6 0.6 3.0 3.5 1.8
Any drug 2.4 3.6 7.1 14.1 21.9 11.0
Any drug (excluding volatile substances) 0.6 1.1 2.9 10.9 19.2 8.1
Unweighted bases (girls)c 403 494 481 474 581 2433
Weighted bases (girls)c 390 499 501 494 665 2549
a Estimates are shown to one decimal place because of generally lowprevalence rates.
b See Section 2.1.2 for a definition of Class A drugs.
c Bases show numbers of girls with valid responses for at least one of the 15drugs or types of drug asked about.
Type of drugtaken in thelast year

Copyright © 2014, Health and Social Care Information Centre, Lifestyles Statistics. All rights reserved.
Smoking, drinking and drug use among young people in England in 2013 37
Table 2.7c
Proportion of pupils who have taken individualdrugs in the last year, by agea
All pupils 2013
Age
11 12 13 14 15 Totalyears years years years years
% % % % % %
Cannabis 0.4 0.5 2.7 7.5 18.7 7.0
Any stimulants 0.5 0.3 0.9 2.3 5.0 2.1
Cocaine 0.1 0.1 0.4 0.7 1.6 0.7
Crack - 0.2 0.4 0.4 0.8 0.4
Ecstasy - - 0.3 0.4 1.8 0.6
Amphetamines - 0.1 0.5 0.4 0.8 0.4
Poppers 0.4 0.1 0.1 0.9 1.8 0.8
Mephedrone - 0.1 - 0.4 1.3 0.4
Any psychedelics 0.2 0.3 0.5 1.4 2.3 1.1
LSD 0.1 0.1 0.2 0.5 0.9 0.4
Magic mushrooms 0.1 0.2 0.3 1.0 1.0 0.5
Ketamine - - 0.2 0.3 1.3 0.4
Any opiates 0.3 0.2 0.2 0.1 0.9 0.4
Heroin 0.2 0.2 0.2 0.1 0.5 0.3
Methadone 0.1 0.1 0.1 - 0.6 0.2
Glue, gas, aerosols or solvents 2.1 3.3 3.5 4.0 4.4 3.6
Tranquillisers - 0.3 0.1 0.2 0.6 0.3
Other drugs - 0.2 0.2 0.1 0.8 0.3
Any Class A drugb 0.6 0.6 1.0 2.3 4.0 1.9
Any drug 3.0 4.4 6.8 12.4 23.7 11.3
Any drug (excluding volatile substances) 0.8 1.3 3.6 9.4 21.4 8.5
Unweighted bases (pupils)c 825 1040 1028 1028 1247 5168
Weighted bases (pupils)c 789 1010 1008 1033 1327 5167
a Estimates are shown to one decimal place because of generally lowprevalence rates.
b See Section 2.1.2 for a definition of Class A drugs.
c Bases show numbers of pupils with valid responses for at least one of the15 drugs or types of drug asked about.
Type of drugtaken in thelast year

Copyright © 2014, Health and Social Care Information Centre, Lifestyles Statistics. All rights reserved.
38 Smoking, drinking and drug use among young people in England in 2013
Table 2.8
Proportion of pupils who have taken individual drugs ever, in thelast year and in the last month, by sexa
All pupils 2013
Boys Girls Total
Ever Taken Taken Ever Taken Taken Ever Taken Takentaken in last in last taken in last in last taken in last in last
year month year month year month
% % % % % % % % %
Cannabis 9.1 7.4 4.2 7.5 6.5 3.7 8.3 7.0 4.0
Any stimulants 2.9 2.1 1.0 2.9 2.1 0.7 2.9 2.1 0.9
Cocaine 1.1 0.7 0.3 0.7 0.6 0.2 0.9 0.7 0.2
Crack 0.5 0.3 0.2 0.5 0.5 0.2 0.5 0.4 0.2
Ecstasy 0.9 0.7 0.5 0.6 0.5 0.2 0.7 0.6 0.3
Amphetamines 0.6 0.5 0.1 0.5 0.3 0.1 0.5 0.4 0.1
Poppers 1.2 0.7 0.3 1.3 0.8 0.2 1.2 0.8 0.2
Mephedrone 0.7 0.5 0.3 0.5 0.4 - 0.6 0.4 0.1
Any psychedelics 1.9 1.4 0.7 0.9 0.7 0.2 1.4 1.1 0.5
LSD 0.7 0.6 0.3 0.3 0.3 0.0 0.5 0.4 0.2
Magic mushrooms 0.9 0.6 0.3 0.6 0.4 0.1 0.8 0.5 0.2
Ketamine 0.6 0.5 0.2 0.3 0.3 0.1 0.5 0.4 0.2
Any opiates 0.6 0.4 0.3 0.6 0.4 0.1 0.6 0.4 0.2
Heroin 0.4 0.2 0.2 0.4 0.3 0.1 0.4 0.3 0.2
Methadone 0.4 0.3 0.2 0.2 0.1 0.0 0.3 0.2 0.1
Glue, gas, aerosols or solvents 7.0 3.5 1.4 8.1 3.6 1.4 7.6 3.6 1.4
Tranquillisers 0.6 0.5 0.3 0.2 0.1 - 0.4 0.3 0.1
Other drugs 0.3 0.2 0.1 0.4 0.4 0.2 0.4 0.3 0.2
Any Class A drugb 2.8 2.0 1.2 2.3 1.8 0.5 2.6 1.9 0.8
Any drug 16.6 11.6 6.5 15.7 11.0 5.7 16.1 11.3 6.1
Any drug (excluding volatile substances) 11.1 9.0 5.2 9.1 8.1 4.4 10.1 8.5 4.8
Unweighted basesc 2735 2735 2735 2433 2433 2433 5168 5168 5168
Weighted basesc 2618 2618 2618 2549 2549 2549 5167 5167 5167
a Estimates are shown to one decimal place because of generally low prevalence rates.
b See Section 2.1.2 for a definition of Class A drugs.
c Bases show numbers of pupils with valid responses for at least one of the 15 drugs or types of drugasked about.
Type of drugtaken

Copyright © 2014, Health and Social Care Information Centre, Lifestyles Statistics. All rights reserved.
Smoking, drinking and drug use among young people in England in 2013 39
Table 2.9
Summary of drugs taken in the last year, by age and sex
Pupils who took drugs in the last year 2013
Age
11-13 14 15 Totalyears years years
% % % %
Boys
Took one type of drug only 78 73 66 70
Cannabis only 18 43 57 45
Volatile substances only 55 25 7 22
Any Class A druga 5 - 1 2
Any other type of drug - 4 2 2
Took two or more types of drug 22 27 34 30
Two or more types of drug, but no Class A drugsa 13 16 17 16
Two or more types of drug, including at least one Class A druga 9 11 17 14
Girls
Took one type of drug only 92 71 72 76
Cannabis only 16 45 55 44
Volatile substances only 64 21 11 26
Any Class A druga 8 3 2 4
Any other type of drug 4 1 3 3
Took two or more types of drug 8 29 28 24
Two or more types of drug, but no Class A drugsa 5 19 14 14
Two or more types of drug, including at least one Class A druga 3 10 14 10
Total
Took one type of drug only 85 72 69 73
Cannabis only 17 44 56 45
Volatile substances only 59 23 9 24
Any Class A druga 7 2 1 3
Any other type of drug 2 2 2 2
Took two or more types of drug 15 28 31 27
Two or more types of drug, but no Class A drugsa 9 18 16 15
Two or more types of drug, including at least one Class A druga 6 10 15 12
Unweighted bases
Boys 73 51 157 281
Girls 57 65 115 237
Total 130 116 272 518
Weighted bases
Boys 68 52 159 279
Girls 58 66 137 261
Total 126 117 296 539
a See Section 2.1.2 for a definition of Class A drugs.
Summary of drugstaken

Copyright © 2014, Health and Social Care Information Centre, Lifestyles Statistics. All rights reserved.
40 Smoking, drinking and drug use among young people in England in 2013
Table 2.10
Number of occasions pupils have ever taken drugs, by sex: 2003-2013a
All pupils 2003-2013
Year
2003 2004 2005 2006 2007 2008 2009 2010a 2011a 2012a 2013a
% % % % % % % % % % %
Boys
Once 4 4 4 3 4 3 3 2 3 2 2
2-5 occasions 5 4 4 3 4 4 3 3 3 2 2
6-10 occasions 2 2 2 2 2 1 1 1 1 1 1
More than 10 occasions 6 5 5 4 4 3 4 2 3 3 3
Taken drugs, not in last yearb 8 7 9 6 9 6 7 5 5 4 5
Never taken drugsb 75 80 77 82 78 83 81 87 85 88 87
Girls
Once 5 3 4 3 4 3 3 2 3 3 3
2-5 occasions 5 4 5 4 4 5 4 3 3 3 3
6-10 occasions 3 2 2 2 2 1 1 1 1 1 1
More than 10 occasions 5 4 5 4 4 3 3 2 2 2 2
Taken drugs, not in last yearb 8 7 8 7 7 6 7 5 6 5 5
Never taken drugsb 75 80 76 81 79 83 82 86 86 87 86
Total
Once 4 3 4 3 4 3 3 2 3 3 3
2-5 occasions 5 4 5 4 4 4 3 3 3 3 3
6-10 occasions 2 2 2 2 2 1 1 1 1 1 1
More than 10 occasions 5 4 5 4 4 3 3 2 3 2 2
Taken drugs, not in last yearb 8 7 8 6 8 6 7 5 5 4 5
Never taken drugsb 75 80 76 81 78 83 82 86 85 88 86
Unweighted basesa
Boys 5053 4914 4468 3900 3878 3855 3696 3600 2979 3687 2558
Girls 5006 4615 4366 4070 3657 3757 3720 3567 3156 3700 2298
Total 10059 9529 8834 7970 7535 7612 7416 7167 6135 7387 4856
a Estimates since 2010 are based on weighted data (see Section 1.3.3). 2013 weighted bases are shown in Table 2.11.
b Estimates shown in this table for the proportion of pupils who had taken drugs, but not in the last year, and the proportionwho had never taken drugs are based on a filter question. They are not definitive and may vary from estimates shownelsewhere in this report. See note 23.
Number of occasionstaken drugs
Data from
2003 re-used with permission of the Department of H
ealth
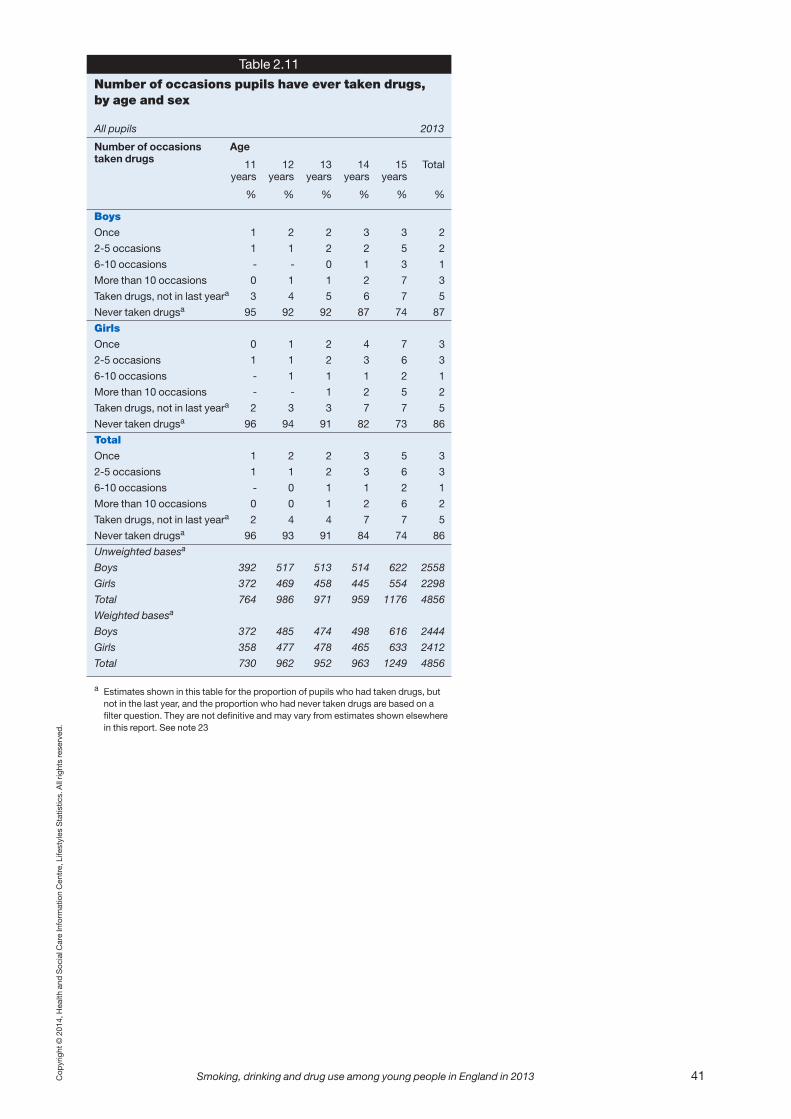
Copyright © 2014, Health and Social Care Information Centre, Lifestyles Statistics. All rights reserved.
Smoking, drinking and drug use among young people in England in 2013 41
Table 2.11
Number of occasions pupils have ever taken drugs, by age and sex
All pupils 2013
Age
11 12 13 14 15 Totalyears years years years years
% % % % % %
Boys
Once 1 2 2 3 3 2
2-5 occasions 1 1 2 2 5 2
6-10 occasions - - 0 1 3 1
More than 10 occasions 0 1 1 2 7 3
Taken drugs, not in last yeara 3 4 5 6 7 5
Never taken drugsa 95 92 92 87 74 87
Girls
Once 0 1 2 4 7 3
2-5 occasions 1 1 2 3 6 3
6-10 occasions - 1 1 1 2 1
More than 10 occasions - - 1 2 5 2
Taken drugs, not in last yeara 2 3 3 7 7 5
Never taken drugsa 96 94 91 82 73 86
Total
Once 1 2 2 3 5 3
2-5 occasions 1 1 2 3 6 3
6-10 occasions - 0 1 1 2 1
More than 10 occasions 0 0 1 2 6 2
Taken drugs, not in last yeara 2 4 4 7 7 5
Never taken drugsa 96 93 91 84 74 86
Unweighted basesa
Boys 392 517 513 514 622 2558
Girls 372 469 458 445 554 2298
Total 764 986 971 959 1176 4856
Weighted basesa
Boys 372 485 474 498 616 2444
Girls 358 477 478 465 633 2412
Total 730 962 952 963 1249 4856
a Estimates shown in this table for the proportion of pupils who had taken drugs, butnot in the last year, and the proportion who had never taken drugs are based on afilter question. They are not definitive and may vary from estimates shown elsewherein this report. See note 23
Number of occasionstaken drugs

Copyright © 2014, Health and Social Care Information Centre, Lifestyles Statistics. All rights reserved.
42 Smoking, drinking and drug use among young people in England in 2013
Table 2.12
Proportion of pupils who usually take drugs at least once a month,by sex and age: 2003-2013a,b
All pupils 2003-2013
Year
2003 2004 2005 2006 2007 2008 2009 2010a 2011a 2012a 2013a
% % % % % % % % % % %
Boys
11-12 years 1 1 1 2 1 1 1 1 1 1 1
13 years 4 3 3 3 3 3 2 1 2 2 1
14 years 10 8 7 5 7 4 5 3 5 4 2
15 years 16 12 13 8 9 8 12 5 10 5 8
Total 7 5 5 4 4 4 4 2 4 3 3
Girls
11-12 years 1 1 1 1 1 0 1 1 0 0 1
13 years 5 4 4 2 2 2 2 2 0 2 2
14 years 9 5 9 6 7 6 5 3 2 3 3
15 years 13 11 12 8 10 6 7 4 6 4 4
Total 6 5 6 4 5 3 3 2 2 2 2
Total
11-12 years 1 1 1 1 1 1 1 1 0 0 1
13 years 5 4 3 2 3 3 2 1 1 2 1
14 years 10 7 8 5 7 5 5 3 4 3 3
15 years 15 11 13 8 10 7 10 5 8 5 6
Total 7 5 6 4 5 3 4 2 3 2 3
Unweighted basesb
Boys
11-12 years 1889 1878 1651 1427 1416 1403 1355 1313 1102 1273 909
13 years 1051 997 947 768 795 771 776 727 570 747 511
14 years 984 959 897 812 774 752 689 698 588 765 511
15 years 1116 1062 953 883 883 917 868 857 712 896 621
Total 5040 4896 4448 3890 3868 3843 3688 3595 2972 3681 2552
Girls
11-12 years 1907 1739 1574 1449 1313 1374 1363 1285 1119 1321 839
13 years 1036 934 894 850 771 742 755 732 658 768 458
14 years 961 911 934 772 695 764 737 739 616 751 445
15 years 1089 1017 934 988 867 866 853 802 755 856 551
Total 4993 4601 4336 4059 3646 3746 3708 3558 3148 3696 2293
Total
11-12 years 3796 3617 3225 2876 2729 2777 2718 2598 2221 2594 1748
13 years 2087 1931 1841 1618 1566 1513 1531 1459 1228 1515 969
14 years 1945 1870 1831 1584 1469 1516 1426 1437 1204 1516 956
15 years 2205 2079 1887 1871 1750 1783 1721 1659 1467 1752 1172
Total 10033 9497 8784 7949 7514 7589 7396 7153 6120 7377 4845
a The answer categories for usual frequency of drug use were slightly different in 2004. In every year shown,the question included the categories ‘I take drugs most days’ and ‘I take drugs at least once a week’. Inevery year except 2004, there was an additional category, ‘I take drugs once or twice a month’. In 2004,this category was replaced by two different categories: ‘I take drugs two or three times a month’ and ‘Itake drugs once a month’.
b Estimates since 2010 are based on weighted data (see Section 1.3.3). 2013 weighted bases are shown inTable 2.13.
Usuallytakes drugsat least oncea month
Data from 2001 to 2003 re-used with permission of the Department of Health
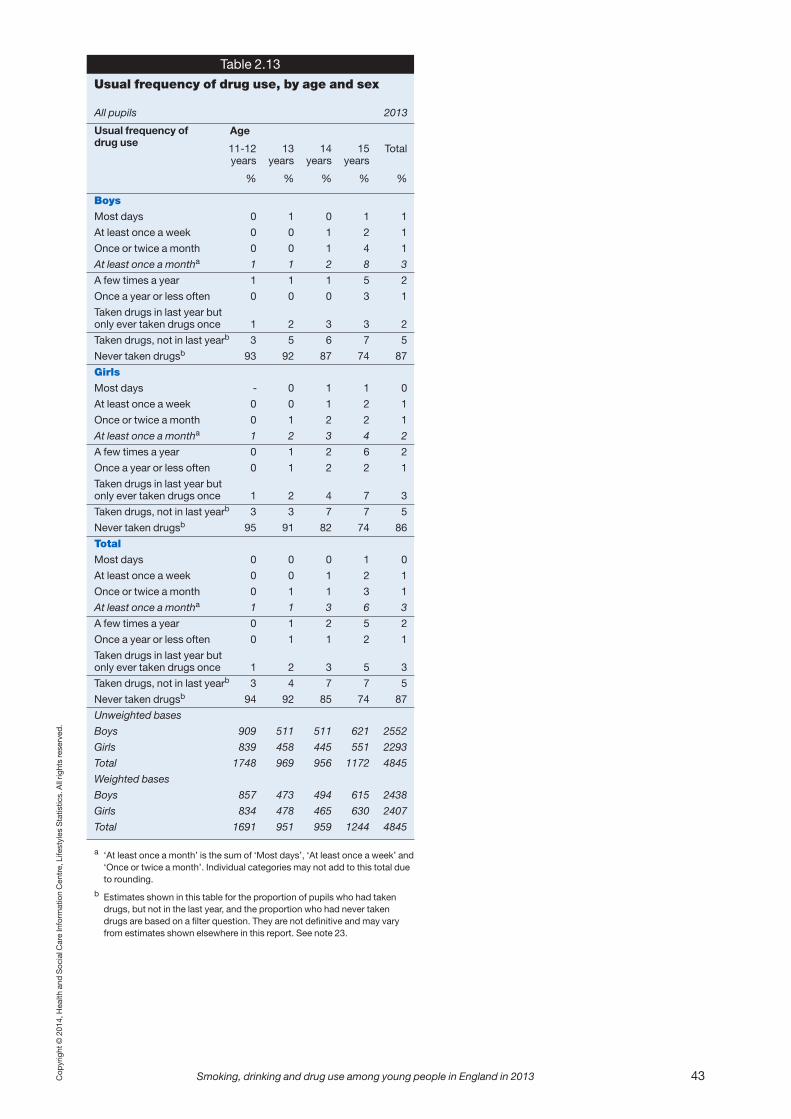
Copyright © 2014, Health and Social Care Information Centre, Lifestyles Statistics. All rights reserved.
Smoking, drinking and drug use among young people in England in 2013 43
Table 2.13
Usual frequency of drug use, by age and sex
All pupils 2013
Age
11-12 13 14 15 Totalyears years years years
% % % % %
Boys
Most days 0 1 0 1 1
At least once a week 0 0 1 2 1
Once or twice a month 0 0 1 4 1
At least once a montha 1 1 2 8 3
A few times a year 1 1 1 5 2
Once a year or less often 0 0 0 3 1
Taken drugs in last year but only ever taken drugs once 1 2 3 3 2
Taken drugs, not in last yearb 3 5 6 7 5
Never taken drugsb 93 92 87 74 87
Girls
Most days - 0 1 1 0
At least once a week 0 0 1 2 1
Once or twice a month 0 1 2 2 1
At least once a montha 1 2 3 4 2
A few times a year 0 1 2 6 2
Once a year or less often 0 1 2 2 1
Taken drugs in last year but only ever taken drugs once 1 2 4 7 3
Taken drugs, not in last yearb 3 3 7 7 5
Never taken drugsb 95 91 82 74 86
Total
Most days 0 0 0 1 0
At least once a week 0 0 1 2 1
Once or twice a month 0 1 1 3 1
At least once a montha 1 1 3 6 3
A few times a year 0 1 2 5 2
Once a year or less often 0 1 1 2 1
Taken drugs in last year but only ever taken drugs once 1 2 3 5 3
Taken drugs, not in last yearb 3 4 7 7 5
Never taken drugsb 94 92 85 74 87
Unweighted bases
Boys 909 511 511 621 2552
Girls 839 458 445 551 2293
Total 1748 969 956 1172 4845
Weighted bases
Boys 857 473 494 615 2438
Girls 834 478 465 630 2407
Total 1691 951 959 1244 4845
a ‘At least once a month’ is the sum of ‘Most days’, ‘At least once a week’ and‘Once or twice a month’. Individual categories may not add to this total dueto rounding.
b Estimates shown in this table for the proportion of pupils who had takendrugs, but not in the last year, and the proportion who had never takendrugs are based on a filter question. They are not definitive and may varyfrom estimates shown elsewhere in this report. See note 23.
Usual frequency ofdrug use

Copyright © 2014, Health and Social Care Information Centre, Lifestyles Statistics. All rights reserved.
44 Smoking, drinking and drug use among young people in England in 2013
Table 2.14
Usual frequency of drug use among pupils who took drugs in the last year, by age and sex
Pupils who took drugs in the last year 2013
Age
11-13 14 15 Totalyears years years
% % % %
Boys
Most days [11] [2] 6 6
At least once a week [8] [15] 12 12
Once or twice a month [4] [15] 23 17
At least once a montha [22] [32] 41 35
A few times a year [23] [21] 25 24
Once a year or less often [10] [7] 16 13
Taken drugs in last year but only ever taken drugs once [45] [40] 18 28
Girls
Most days [2] 6 5 4
At least once a week [11] 5 9 8
Once or twice a month [16] 18 9 13
At least once a montha [30] 29 22 25
A few times a year [16] 16 33 25
Once a year or less often [14] 17 8 12
Taken drugs in last year but only ever taken drugs once [40] 37 37 38
Total
Most days 6 5 5 5
At least once a week 9 9 11 10
Once or twice a month 10 17 16 15
At least once a montha 26 30 32 30
A few times a year 20 18 29 25
Once a year or less often 12 13 12 12
Taken drugs in last year but only ever taken drugs once 43 38 28 33
Unweighted bases
Boys 48 34 115 197
Girls 41 50 100 191
Total 89 84 215 388
Weighted bases
Boys 43 34 115 193
Girls 44 51 119 214
Total 88 85 234 406
a ‘At least once a month’ is the sum of ‘Most days’, ‘At least once aweek’ and ‘Once or twice a month’. Individual categories may notadd to this total due to rounding.
Usual frequency ofdrug use
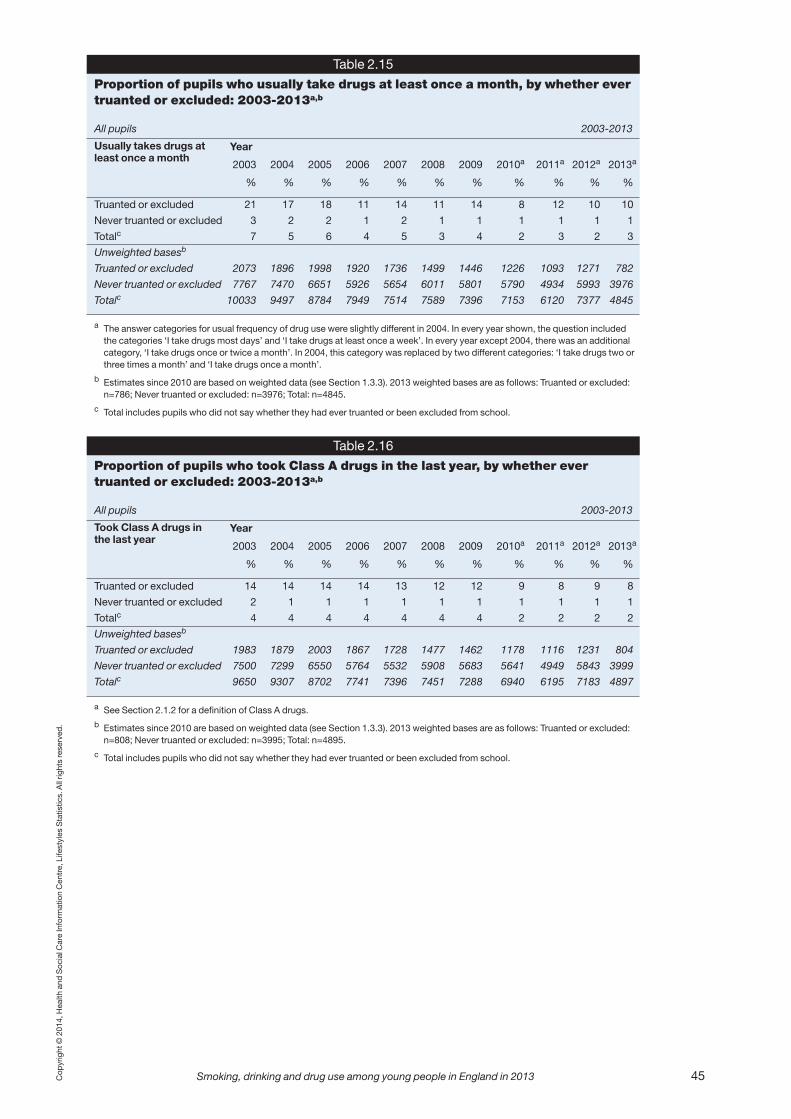
Copyright © 2014, Health and Social Care Information Centre, Lifestyles Statistics. All rights reserved.
Smoking, drinking and drug use among young people in England in 2013 45
Table 2.15
Proportion of pupils who usually take drugs at least once a month, by whether evertruanted or excluded: 2003-2013a,b
All pupils 2003-2013
Year
2003 2004 2005 2006 2007 2008 2009 2010a 2011a 2012a 2013a
% % % % % % % % % % %
Truanted or excluded 21 17 18 11 14 11 14 8 12 10 10
Never truanted or excluded 3 2 2 1 2 1 1 1 1 1 1
Totalc 7 5 6 4 5 3 4 2 3 2 3
Unweighted basesb
Truanted or excluded 2073 1896 1998 1920 1736 1499 1446 1226 1093 1271 782
Never truanted or excluded 7767 7470 6651 5926 5654 6011 5801 5790 4934 5993 3976
Totalc 10033 9497 8784 7949 7514 7589 7396 7153 6120 7377 4845
a The answer categories for usual frequency of drug use were slightly different in 2004. In every year shown, the question includedthe categories ‘I take drugs most days’ and ‘I take drugs at least once a week’. In every year except 2004, there was an additionalcategory, ‘I take drugs once or twice a month’. In 2004, this category was replaced by two different categories: ‘I take drugs two orthree times a month’ and ‘I take drugs once a month’.
b Estimates since 2010 are based on weighted data (see Section 1.3.3). 2013 weighted bases are as follows: Truanted or excluded:n=786; Never truanted or excluded: n=3976; Total: n=4845.
c Total includes pupils who did not say whether they had ever truanted or been excluded from school.
Usually takes drugs atleast once a month
Table 2.16
Proportion of pupils who took Class A drugs in the last year, by whether evertruanted or excluded: 2003-2013a,b
All pupils 2003-2013
Year
2003 2004 2005 2006 2007 2008 2009 2010a 2011a 2012a 2013a
% % % % % % % % % % %
Truanted or excluded 14 14 14 14 13 12 12 9 8 9 8
Never truanted or excluded 2 1 1 1 1 1 1 1 1 1 1
Totalc 4 4 4 4 4 4 4 2 2 2 2
Unweighted basesb
Truanted or excluded 1983 1879 2003 1867 1728 1477 1462 1178 1116 1231 804
Never truanted or excluded 7500 7299 6550 5764 5532 5908 5683 5641 4949 5843 3999
Totalc 9650 9307 8702 7741 7396 7451 7288 6940 6195 7183 4897
a See Section 2.1.2 for a definition of Class A drugs.
b Estimates since 2010 are based on weighted data (see Section 1.3.3). 2013 weighted bases are as follows: Truanted or excluded:n=808; Never truanted or excluded: n=3995; Total: n=4895.
c Total includes pupils who did not say whether they had ever truanted or been excluded from school.
Took Class A drugs inthe last year
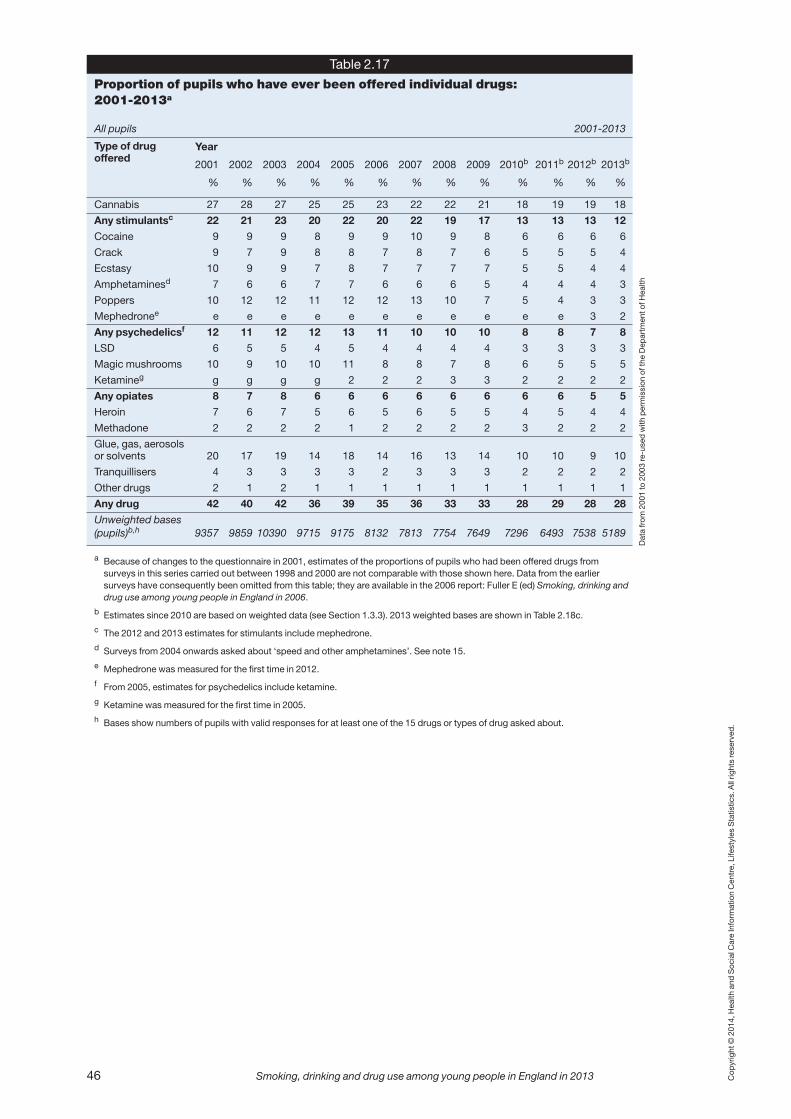
Copyright © 2014, Health and Social Care Information Centre, Lifestyles Statistics. All rights reserved.
46 Smoking, drinking and drug use among young people in England in 2013
Table 2.17
Proportion of pupils who have ever been offered individual drugs: 2001-2013a
All pupils 2001-2013
Year
2001 2002 2003 2004 2005 2006 2007 2008 2009 2010b 2011b 2012b 2013b
% % % % % % % % % % % % %
Cannabis 27 28 27 25 25 23 22 22 21 18 19 19 18
Any stimulantsc 22 21 23 20 22 20 22 19 17 13 13 13 12
Cocaine 9 9 9 8 9 9 10 9 8 6 6 6 6
Crack 9 7 9 8 8 7 8 7 6 5 5 5 4
Ecstasy 10 9 9 7 8 7 7 7 7 5 5 4 4
Amphetaminesd 7 6 6 7 7 6 6 6 5 4 4 4 3
Poppers 10 12 12 11 12 12 13 10 7 5 4 3 3
Mephedronee e e e e e e e e e e e 3 2
Any psychedelicsf 12 11 12 12 13 11 10 10 10 8 8 7 8
LSD 6 5 5 4 5 4 4 4 4 3 3 3 3
Magic mushrooms 10 9 10 10 11 8 8 7 8 6 5 5 5
Ketamineg g g g g 2 2 2 3 3 2 2 2 2
Any opiates 8 7 8 6 6 6 6 6 6 6 6 5 5
Heroin 7 6 7 5 6 5 6 5 5 4 5 4 4
Methadone 2 2 2 2 1 2 2 2 2 3 2 2 2
Glue, gas, aerosols or solvents 20 17 19 14 18 14 16 13 14 10 10 9 10
Tranquillisers 4 3 3 3 3 2 3 3 3 2 2 2 2
Other drugs 2 1 2 1 1 1 1 1 1 1 1 1 1
Any drug 42 40 42 36 39 35 36 33 33 28 29 28 28
Unweighted bases (pupils)b,h 9357 9859 10390 9715 9175 8132 7813 7754 7649 7296 6493 7538 5189
a Because of changes to the questionnaire in 2001, estimates of the proportions of pupils who had been offered drugs fromsurveys in this series carried out between 1998 and 2000 are not comparable with those shown here. Data from the earliersurveys have consequently been omitted from this table; they are available in the 2006 report: Fuller E (ed) Smoking, drinking anddrug use among young people in England in 2006.
b Estimates since 2010 are based on weighted data (see Section 1.3.3). 2013 weighted bases are shown in Table 2.18c.
c The 2012 and 2013 estimates for stimulants include mephedrone.
d Surveys from 2004 onwards asked about ‘speed and other amphetamines’. See note 15.
e Mephedrone was measured for the first time in 2012.
f From 2005, estimates for psychedelics include ketamine.
g Ketamine was measured for the first time in 2005.
h Bases show numbers of pupils with valid responses for at least one of the 15 drugs or types of drug asked about.
Type of drugoffered
Data from 2001 to 2003 re-used with permission of the Department of Health

Copyright © 2014, Health and Social Care Information Centre, Lifestyles Statistics. All rights reserved.
Smoking, drinking and drug use among young people in England in 2013 47
Table 2.18a
Proportion of boys who have ever been offeredindividual drugs, by age
All boys 2013
Age
11 12 13 14 15 Totalyears years years years years
% % % % % %
Cannabis 3 7 11 20 47 20
Any stimulants 4 7 8 12 27 13
Cocaine 3 4 5 4 14 7
Crack 2 4 3 5 7 4
Ecstasy 1 1 1 5 10 4
Amphetamines 1 1 2 2 8 3
Poppers 0 2 1 2 9 3
Mephedrone 0 1 1 1 7 2
Any psychedelics 2 3 5 10 18 9
LSD 1 1 1 3 7 3
Magic mushrooms 1 2 4 6 12 5
Ketamine 0 1 1 2 7 3
Any opiates 2 3 5 5 8 5
Heroin 2 2 4 4 6 4
Methadone 0 1 1 2 4 2
Glue, gas, aerosols or solvents 6 10 8 12 14 10
Tranquillisers 0 1 1 3 5 2
Other drugs - 0 0 1 1 1
Any drug 10 17 21 31 54 29
Unweighted bases (boys)a 422 546 548 554 666 2736
Weighted bases (boys)a 399 511 508 539 662 2619
a Bases show numbers of boys with valid responses for at least one of the 15drugs or types of drug asked about.
Type of drugoffered

Copyright © 2014, Health and Social Care Information Centre, Lifestyles Statistics. All rights reserved.
48 Smoking, drinking and drug use among young people in England in 2013
Table 2.18b
Proportion of girls who have ever been offeredindividual drugs, by age
All girls 2013
Age
11 12 13 14 15 Totalyears years years years years
% % % % % %
Cannabis 2 4 10 21 38 17
Any stimulants 2 4 9 13 25 12
Cocaine 1 2 4 8 10 5
Crack 1 2 3 4 7 4
Ecstasy - - 2 4 10 4
Amphetamines 1 1 1 4 9 4
Poppers 0 1 2 4 9 4
Mephedrone 1 0 1 3 7 3
Any psychedelics 0 3 3 8 15 7
LSD - 0 1 3 7 3
Magic mushrooms 0 2 2 5 10 5
Ketamine - 0 1 3 6 2
Any opiates 1 2 3 5 9 5
Heroin 1 2 3 5 6 4
Methadone - 0 1 1 5 2
Glue, gas, aerosols or solvents 4 8 10 13 14 10
Tranquillisers 0 0 1 3 5 2
Other drugs - - 1 0 2 1
Any drug 7 14 21 33 48 27
Unweighted bases (girls)a 403 494 482 474 581 2434
Weighted bases (girls)a 390 499 502 494 665 2550
a Bases show numbers of girls with valid responses for at least one of the 15drugs or types of drug asked about.
Type of drugoffered

Copyright © 2014, Health and Social Care Information Centre, Lifestyles Statistics. All rights reserved.
Smoking, drinking and drug use among young people in England in 2013 49
Table 2.18c
Proportion of pupils who have ever been offeredindividual drugs, by age
All pupils 2013
Age
11 12 13 14 15 Totalyears years years years years
% % % % % %
Cannabis 2 5 10 21 42 18
Any stimulants 3 6 8 12 26 12
Cocaine 2 3 4 6 12 6
Crack 1 3 3 5 7 4
Ecstasy 0 0 2 4 10 4
Amphetamines 1 1 2 3 8 3
Poppers 0 1 1 3 9 3
Mephedrone 0 1 1 2 7 2
Any psychedelics 1 3 4 9 16 8
LSD 0 1 1 3 7 3
Magic mushrooms 1 2 3 6 11 5
Ketamine 0 1 1 3 6 2
Any opiates 1 3 4 5 8 5
Heroin 1 2 4 4 6 4
Methadone 0 1 1 2 4 2
Glue, gas, aerosols or solvents 5 9 9 12 14 10
Tranquillisers 0 0 1 3 5 2
Other drugs - 0 1 1 2 1
Any drug 9 15 21 32 51 28
Unweighted bases (pupils)a 825 1040 1030 1028 1247 5170
Weighted bases (pupils)a 789 1010 1010 1033 1327 5169
a Bases show numbers of pupils with valid responses for at least one of the15 drugs or types of drug asked about.
Type of drugoffered
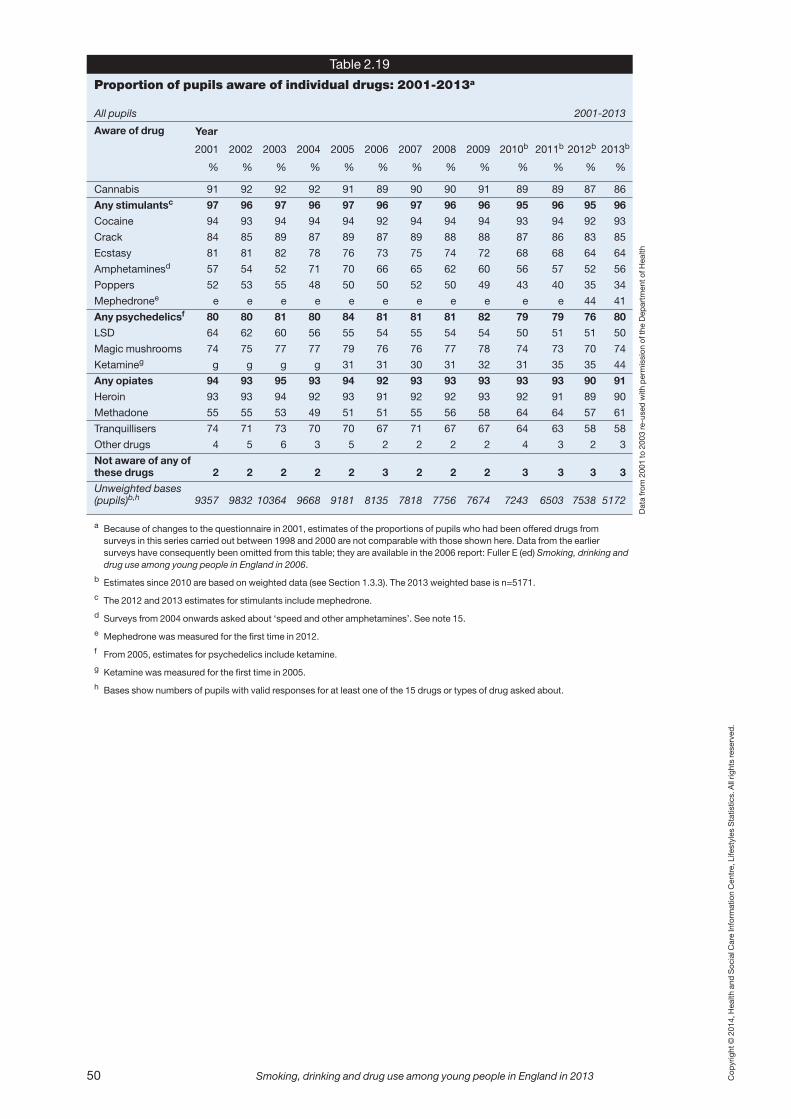
Copyright © 2014, Health and Social Care Information Centre, Lifestyles Statistics. All rights reserved.
50 Smoking, drinking and drug use among young people in England in 2013
Table 2.19
Proportion of pupils aware of individual drugs: 2001-2013a
All pupils 2001-2013
Year
2001 2002 2003 2004 2005 2006 2007 2008 2009 2010b 2011b 2012b 2013b
% % % % % % % % % % % % %
Cannabis 91 92 92 92 91 89 90 90 91 89 89 87 86
Any stimulantsc 97 96 97 96 97 96 97 96 96 95 96 95 96
Cocaine 94 93 94 94 94 92 94 94 94 93 94 92 93
Crack 84 85 89 87 89 87 89 88 88 87 86 83 85
Ecstasy 81 81 82 78 76 73 75 74 72 68 68 64 64
Amphetaminesd 57 54 52 71 70 66 65 62 60 56 57 52 56
Poppers 52 53 55 48 50 50 52 50 49 43 40 35 34
Mephedronee e e e e e e e e e e e 44 41
Any psychedelicsf 80 80 81 80 84 81 81 81 82 79 79 76 80
LSD 64 62 60 56 55 54 55 54 54 50 51 51 50
Magic mushrooms 74 75 77 77 79 76 76 77 78 74 73 70 74
Ketamineg g g g g 31 31 30 31 32 31 35 35 44
Any opiates 94 93 95 93 94 92 93 93 93 93 93 90 91
Heroin 93 93 94 92 93 91 92 92 93 92 91 89 90
Methadone 55 55 53 49 51 51 55 56 58 64 64 57 61
Tranquillisers 74 71 73 70 70 67 71 67 67 64 63 58 58
Other drugs 4 5 6 3 5 2 2 2 2 4 3 2 3
Not aware of any of these drugs 2 2 2 2 2 3 2 2 2 3 3 3 3
Unweighted bases (pupils)b,h 9357 9832 10364 9668 9181 8135 7818 7756 7674 7243 6503 7538 5172
a Because of changes to the questionnaire in 2001, estimates of the proportions of pupils who had been offered drugs fromsurveys in this series carried out between 1998 and 2000 are not comparable with those shown here. Data from the earliersurveys have consequently been omitted from this table; they are available in the 2006 report: Fuller E (ed) Smoking, drinking anddrug use among young people in England in 2006.
b Estimates since 2010 are based on weighted data (see Section 1.3.3). The 2013 weighted base is n=5171.
c The 2012 and 2013 estimates for stimulants include mephedrone.
d Surveys from 2004 onwards asked about ‘speed and other amphetamines’. See note 15.
e Mephedrone was measured for the first time in 2012.
f From 2005, estimates for psychedelics include ketamine.
g Ketamine was measured for the first time in 2005.
h Bases show numbers of pupils with valid responses for at least one of the 15 drugs or types of drug asked about.
Aware of drug
Data from 2001 to 2003 re-used with permission of the Department of Health

Copyright © 2014, Health and Social Care Information Centre, Lifestyles Statistics. All rights reserved.
Smoking, drinking and drug use among young people in England in 2013 51
Table 2.20
Sources of helpfulinformation about druguse, by sex
All pupils 2013
Sex
Boys Girls Total
% % %
Parents 69 67 68
Siblings 32 34 33
Other relatives 45 41 43
Friends 42 43 42
GP 37 34 35
Teachers 68 69 69
Other adults at school 34 36 35
Police in schools 52 49 50
Youth workers 25 25 25
TV 62 57 59
Radio 30 25 28
Newspapers or magazines 40 43 41
Internet 54 52 53
FRANK 18 18 18
Helplines 15 15 15
Unweighted basesa 2535 2295 4830
Weighted basesa 2424 2407 4831
a Bases shown are for those responding tothe question about ‘parents’. Bases forother variables may vary slightly.
Sources ofhelpfulinformation
Table 2.21
Sources of helpful information about druguse, by age
All pupils 2013
Age
11 12 13 14 15 Totalyears years years years years
% % % % % %
Parents 62 64 67 71 73 68
Siblings 27 33 30 34 37 33
Other relatives 39 42 41 46 45 43
Friends 29 32 37 46 57 42
GP 36 34 36 35 36 35
Teachers 56 65 70 73 74 69
Other adults at school 30 31 34 40 38 35
Police in schools 46 49 53 53 49 50
Youth workers 18 23 26 29 28 25
TV 52 57 56 64 65 59
Radio 28 30 29 27 25 28
Newspapers or magazines 37 39 42 45 42 41
Internet 38 44 52 60 63 53
FRANK 5 8 13 21 33 18
Helplines 16 16 13 14 16 15
Unweighted basesa 752 965 968 957 1188 4830
Weighted basesa 719 937 952 960 1263 4831
a Bases shown are for those responding to the question about ‘parents’.Bases for other variables may vary slightly.
Sources ofhelpfulinformation

BLANK PAGE

Cop
yright © 2014, Health and
Social C
are Inform
ation Centre. All rig
hts reserved
.
Smoking, drinking and drug use among young people in England in 2013 53
3 Smoking
Key findings for 2013
� In 2013, less than a quarter of pupils reported that they had tried smoking at leastonce. At 22%, this is the lowest level recorded since the survey began in 1982, andcontinues the decline since 2003, when 42% of pupils had tried smoking.
� 3% of pupils said that they smoked at least one cigarette a week, the surveydefinition of regular smoking. This is also at the lowest level measured since 1982,and considerably below the 9% who smoked regularly in 2003.
� The prevalence of regular smoking increased with age. Less than 0.5% of 11 yearolds were regular smokers in 2013, and this increased to 8% amongst 15 year olds.
� 6% of pupils reported that they had smoked cigarettes in the last week. Older pupilswere more likely than younger pupils to have smoked in the last week (13% of 15 yearolds, compared with 1% of 11 year olds).
� Regular smokers consumed, on average (mean), 31.1 cigarettes a week. Occasionalsmokers consumed 3.4 cigarettes a week.
3.1 Introduction
3.1.1 Background
Smoking has long been a public health concern due to the ever increasing awareness of theharmful effects it can have on public health. In November 2010, the coalition governmentpublished their White Paper Healthy lives, healthy people: our strategy for public health inEngland.1 This paper set out the government’s long-term ambitions for improving publichealth in England. It recognised the harmful effects that smoking has on health and statedthat the reduction of tobacco consumption would continue to be a public health priority,pledging to publish a Tobacco Control Plan aimed at reducing tobacco use in England.
The Tobacco Control Plan, Healthy lives, healthy people: a tobacco control plan forEngland,2 was published in March 2011 and set out the government’s plans for reducingtobacco consumption in the next five years. The plan acknowledged that, in order to reducethe number of young people who begin smoking, tobacco use amongst adults must beaddressed. The paper set out three national ambitions to reach by the end of 2015:• to reduce smoking prevalence among adults to 18.5% or less;• to reduce rates of regular smoking (that is, those who smoke one cigarette or more aweek) among 15 year olds to 12% or less; and
• to reduce rates of smoking throughout pregnancy to 11% or less.
In order to achieve these ambitions, the government pledged to support strategies acrosssix key areas:• stopping the promotion of tobacco;• making tobacco less affordable;• effective regulation of tobacco products;• helping tobacco users quit;• reducing exposure to second-hand smoke; and • effective communications for tobacco control.
A number of initiatives aimed at reducing tobacco use among children and young peoplewere in place before the 2010 White Paper, following the 1998 White Paper Smoking kills,3
which included a target for reducing regular smoking among 11 to 15 year olds from 13%(the proportion in 1996) to 11% by 2005 and 9% by 2010.4
In order to reduce availability of tobacco as a means of reducing the levels of smokingamong young people, successive governments have taken steps towards stopping thepromotion of tobacco and increasing the difficulty in purchasing cigarettes.• In October 2007, it became illegal to sell tobacco products to anyone under the age of 18(rather than 16, although it is not currently illegal to buy cigarettes if under the age of 18).
• The Health Act 20095 prohibited the sale of tobacco products from vending machinesfrom 2011.
• The Health Act 20095 also prohibited the display of tobacco products at all points of saleby 2015 (all large shops and supermarkets were prohibited from displaying tobaccoproducts from 6th April 2012, and smaller shops will be obliged to do the same by 2015).
• The Children and Families Act 2014 prohibits adults from buying tobacco products onbehalf of young people under the age of 18. It also puts in place powers for the Secretaryof State to enforce regulations to ban young people aged under 18 from buying tobaccoproducts; and to enforce restrictions on the design of cigarette packaging.6
Reducing exposure to second-hand smoke is a key priority in tobacco control because ofthe immediate and long-term health effects that are caused as a result of breathing insecond-hand smoke. The Health Act 20067 introduced changes in the law aimed atreducing exposure to second-hand smoke. In July 2007, the SmokeFree legislation wasenforced, which prohibited smoking in enclosed public spaces. Exposure to second-handsmoke is particularly harmful in confined spaces, such as cars.8 Whilst there are currentlyno laws prohibiting smoking in vehicles (unless they are used for work purposes), theChildren and Families Act 2014 includes provision for regulations that would make it anoffence to smoke in a vehicle carrying children.6
Cop
yright © 2014, Health and
Social C
are Inform
ation Centre. All rig
hts reserved
.
54 Smoking, drinking and drug use among young people in England in 2013
Electronic cigarettes, often referred to as e-cigarettes, are increasing in use.9 These aredesigned to look and feel like tobacco cigarettes and mimic the sensation of smoking, butare thought to be less harmful. However, little is currently known about exactly how safethey are. E-cigarettes are not regulated in the same way as tobacco cigarettes and there arecurrently no laws restricting sales of e-cigarettes to adults only. However, the Children andFamilies Act 20146 includes powers to make it an offence to sell e-cigarettes to those agedunder 18 years old.10
3.1.2 Smoking and health
Extensive research has demonstrated the harmful effects that smoking has on health.Smoking can contribute to a variety of health conditions, including cancers and respiratory,digestive and circulatory diseases.11 Moreover, smoking causes more preventable deathsthan any other single cause12,13 – in 2011, 80,000 preventable deaths in England wereattributed to smoking.
Young people who smoke can be particularly susceptible to negative effects of smoking ontheir health, both in the short and the long-term. They are more susceptible to respiratoryillness and tend to have poorer lung function than young people who don’t smoke. Smokingcan also impair lung growth in children and young people.14 Those who start smoking at ayoung age tend to have higher-age-specific rates for all types of tobacco related cancersthroughout their lives, primarily linked to their earlier exposure to the harmful toxins fromcigarettes.14 Young people who smoke experience high rates of nicotine dependence andare more likely to continue the habit into adulthood.15
Smoking not only affects the smoker, but it also has harmful effects for those breathing insecond-hand smoke. Children of parents who smoke are more likely to develop seriousrespiratory illnesses, asthma symptoms and ear, nose and throat problems.2 Every yearthere are almost 10,000 children admitted into UK hospitals with illnesses related tosecond-hand smoke.13
3.1.3 Measuring smoking
All pupils were asked whether they had ever smoked cigarettes. Those who had were askedhow many cigarettes they smoked and how often they smoked. Pupils were categorised inthree ways based on the responses given:• Regular smokers (defined as usually smoking at least one cigarette per week);• Occasional smokers (defined as usually smoking less than one cigarette per week); or • Non-smokers.
The term ‘current smoker’ used in this chapter refers to those who smoke regularly oroccasionally. Pupils who stated that they did not smoke, but recorded elsewhere that theyhave smoked at least one cigarette in the past seven days, were reclassified in the analysisas occasional smokers, regardless of the number of cigarettes recorded.16
Until 2002, a detailed smoking diary was used to cover smoking behaviour in the past sevendays. This method was replaced in 2003 by a question recording the number of cigarettessmoked in each of the previous seven days. This change in method means that estimates ofthe number of cigarettes smoked in the last seven days since 2003 are not comparable withestimates from earlier surveys.17
3.1.4 Outline of content
Pupils’ smoking behaviour has been collected on this survey since the series began in1982. Smoking behaviour was monitored every two years until 2000, and every year since.From 2000, core smoking questions have been included each year and in alternate yearsmore detailed smoking questions are also asked. The survey in 2013 focused on drug useand included the core smoking questions only.
This section of the report covers the prevalence of smoking among 11 to 15 year olds andpatterns of cigarette consumption.
Cop
yright © 2014, Health and
Social C
are Inform
ation Centre. All rig
hts reserved
.
Smoking, drinking and drug use among young people in England in 2013 55

3.2 Smoking behaviour
3.2.1 Whether pupils have ever smoked
In 2013, 22% of pupils had tried smoking at least once. This is the lowest level recordedsince the survey began in 1982. The proportion of pupils who had ever tried smokingpeaked in 1996, when almost half (49%) of pupils had smoked at least once. In the last tenyears there has been a steady decline from 42% in 2003. (Tables 3.1a, 3.1b, Figure 3.1)
Girls were more likely than boys to have tried smoking (23% of girls, 20% of boys).
As in previous years, the proportion of pupils who have ever smoked increased with age,from 4% of 11 year olds to 43% of 15 year olds. (Table 3.2)
3.2.2 Regular smoking
Pupils who reported smoking at least one cigarette a week were defined as regularsmokers. In 2013, 3% of pupils smoked regularly. This has decreased from 9% in 2003, andreflects the decline in the proportion of pupils who have ever smoked.
In 2013, similar proportions of boys and girls were regular smokers (3% and 4%respectively). (Tables 3.3a, 3.3b, Figure 3.2)
As in previous years, the proportion of pupils who were classified as regular smokersincreased with age. Less than 0.5% of 11 year olds were regular smokers, increasing to 8%amongst 15 year olds. The rate of regular smoking among 15 year olds has been below12% since 2011 and continues to meet the government’s ambition, defined in 2011, toreduce the rate of regular smoking within this age group to 12% or less by 2015.2
(Tables 3.2-3.3b, Figure 3.3)
3.3 Cigarettes smoked in the last week
3.3.1 Numbers of cigarettes smoked in the last week
In addition to questions about their usual smoking habits, all pupils were asked if they hadsmoked any cigarettes in the last seven days, and if so, how many cigarettes they hadsmoked on each day. In 2013, 6% of pupils said that they had smoked cigarettes in the lastweek. This increased with age, with older pupils more likely to report having smoked in thelast week than younger pupils (13% of 15 year olds, compared with 1% of 11 year olds).Similar proportions of boys and girls had smoked cigarettes in the last week (5% and 7%respectively). (Table 3.4)
Cop
yright © 2014, Health and
Social C
are Inform
ation Centre. All rig
hts reserved
.
56 Smoking, drinking and drug use among young people in England in 2013
Ever smoked, by sex: 1982-2013All pupils
Figure 3.1
Per
cent
0
10
20
30
40
50
60
70
GirlsBoys
Year
96 00 01 02 03 0495 97 05 08 09 10 11 12 130683 85 89 9187 0786 8882 84 90 92 93 94 98 99

As in previous years, the findings suggest that pupils tended to underestimate theircigarette consumption when categorising their smoking behaviour. For example:
• 9% of pupils who reported that they used to smoke cigarettes sometimes but never donow went on to report that they had smoked one or more cigarettes in the last week;
• 39% of pupils who said that they sometimes smoked cigarettes (but less than one aweek) reported having smoked one or more cigarettes in the last week; and
• 61% of those who reported that they smoked between one and six cigarettes a week alsoreported smoking seven or more cigarettes in the last week. (Table 3.5)
Boys and girls who smoked regularly consumed similar numbers of cigarettes per week(means of 34.4 cigarettes and 28.5 cigarettes respectively). The proportions of boys andgirls who smoked on different days of the week did not vary significantly.
The majority (95%) of regular smokers said that they had smoked on at least one day in thelast week. Occasional smokers were less likely to report having smoked a cigarette in thelast week (54%). Regular smokers consumed more cigarettes in the last week thanoccasional smokers: the mean consumption for regular smokers was 31.1 cigarettes in thelast week, compared with 3.4 cigarettes amongst occasional smokers. (Tables 3.6-3.8)
Cop
yright © 2014, Health and
Social C
are Inform
ation Centre. All rig
hts reserved
.
Smoking, drinking and drug use among young people in England in 2013 57
Prevalence of regular cigarette smoking, by sex: 1982-2013All pupils
Figure 3.2
Per
cent
0
5
10
15
20
25
GirlsBoys
Year
96 00 01 02 03 0495 97 05 08 09 10 11 12 130683 85 89 9187 0786 8882 84 90 92 93 94 98 99
Prevalence of regular cigarette smoking, by sex and ageAll pupils
11 years 12 years 13 years 14 years 15 years
BoysGirls
Figure 3.3
Per
cent
0
5
10
15
20
25
Age

3.3.2 Patterns of cigarette consumption
Pupils who had smoked in the last week were more likely to have smoked on Fridays andSaturdays, compared with other days of the week. This is in line with patterns seen in previousyears. This is largely accounted for by occasional smokers. Between 13% and 16% ofoccasional smokers said that they had smoked on each day from Sunday to Thursday, andthis increased to 23% on Fridays and 31% on Saturdays. The proportion of regular smokerswho reported that they had smoked at least one cigarette on any given day in the last weekwas far higher, but varied less (between 78% and 83% each day). (Table 3.8)
Regular smokers’ average daily consumption was 5.8 cigarettes on both Fridays andSaturdays, and ranged between 4.4 cigarettes and 5.0 cigarettes the rest of the week.Occasional smokers’ average daily consumption was 1.5 cigarettes on Fridays and 1.9cigarettes on Saturdays and varied between 0.7 cigarettes and 1.1 cigarettes on other days.
(Table 3.10)
Notes and references
1 Department of Health (2010) Healthy lives, healthy people: our strategy for public health in England.http://www.dh.gov.uk/prod_consum_dh/groups/dh_digitalassets/documents/digitalasset/dh_127424.pdf
2 Department of Health (2011) Healthy lives, healthy people: a tobacco control plan for England.http://www.dh.gov.uk/prod_consum_dh/groups/dh_digitalassets/documents/digitalasset/dh_124960.pdf
3 The Stationery Office (1998) Smoking Kills: a White Paper on tobacco. Cm4177, Londonhttp://www.archive.official-documents.co.uk/document/cm41/4177/4177.htm
4 All these goals were met, as this survey series has demonstrated.
5 The Health Act 2009. http://www.legislation.gov.uk/ukpga/2009/21/contents
6 http://www.legislation.gov.uk/ukpga/2014/6/part/5/crossheading/tobacco-nicotine-products-and-smoking/enacted
7 The Health Act 2006. http://www.legislation.gov.uk/ukpga/2006/28/contents
8 Ash Fact Sheet (2014). Smoking in Cars. http://ash.org.uk/files/documents/ASH_714.pdf
9 Ash Briefing Paper (2014), Electronic Cigarettes, http://ash.org.uk/files/documents/ASH_715.pdf
10 Smoking was not the focus of the 2013 survey, so there was no scope to add new questions about e-cigarette use. These questions will be included in the 2014 survey.
11 The NHS Information Centre for Health and Social Care. Statistics on smoking: England 2012.http://www.hscic.gov.uk/catalogue/PUB07019/smok-eng-2012-rep.pdf
12 Ash Fact Sheet (2013). Smoking and Disease. http://www.ash.org.uk/files/documents/ASH_94.pdf
13 https://www.gov.uk/government/policies/reducing-smoking
14 Muller, T (2007) Breaking the cycle of children’s exposure to tobacco smoke. British Medical Association,London. http://www.co.marquette.mi.us/departments/health_department/smokefreeup_org/docs/Children_Smoking_Report.pdf
15 Gervais A, O’Loughlin J et al (2006). Milestones in the natural course of onset of cigarette use amongadolescents. Canadian Medical Association Journal, 175(3): 255-261.
16 From 1982 to 1998, and in 2000 and 2002, around 2% to 3% of pupils said they did not smoke, but recordedin the smoking diary that they smoked at least one cigarette in the last week. They were consequentlyreclassified as occasional smokers. In 1999 there was no smoking diary, so pupils could not be reclassifiedin this way. In 2001, pupils were asked a question about smoking on each of the last seven days, and thediary was replaced by this question from 2003 onwards. In response to this question, around 1% of pupilseach year recorded that they had smoked at least one cigarette in the last seven days and wereconsequently reclassified as occasional smokers. The number of cigarettes recorded in the additionalquestions does not affect the definition of a regular smoker.
17 The changes were made for a number of reasons.• Interviewers reported that pupils had problems completing the diary: they were confused by having towork backwards from ‘yesterday’ and didn't fill in entries for all seven days.
• The large amount of missing data on the diaries led to potentially unreliable estimates of the numbers ofcigarettes smoked. Analysis was based on the assumption that, where sections of the diary had been leftblank, no cigarettes had been smoked, even when there were whole days with no data and the parts of thediary that were completed indicated that the pupil had smoked some cigarettes.
• The diary could be used only in alternate years because it took up too much time to complete in a yearwhere the focus was on drugs. This affected the estimates for occasional smokers, by excluding pupilswho described themselves as non-smokers but who had smoked in the past seven days. Consequently, inyears when the diary was not included, the prevalence of occasional smokers was underestimated by 2%to 3%.
Cop
yright © 2014, Health and
Social C
are Inform
ation Centre. All rig
hts reserved
.
58 Smoking, drinking and drug use among young people in England in 2013
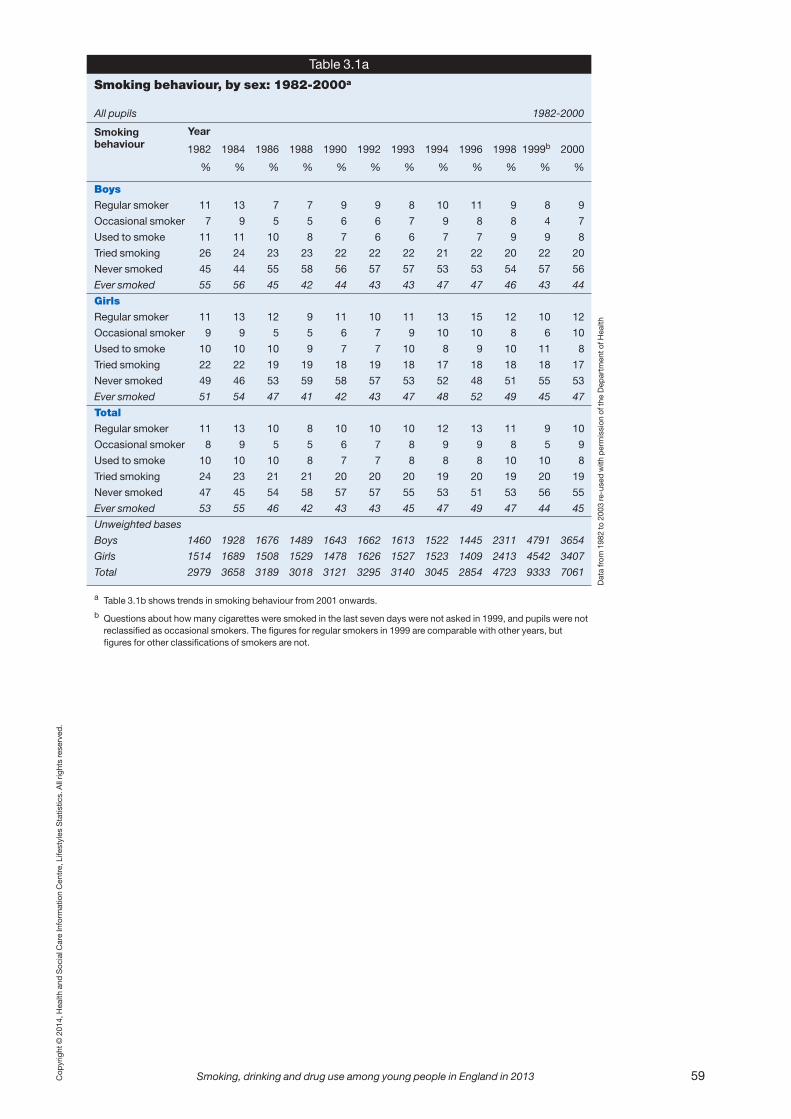
Copyright © 2014, Health and Social Care Information Centre, Lifestyles Statistics. All rights reserved.
Smoking, drinking and drug use among young people in England in 2013 59
Table 3.1a
Smoking behaviour, by sex: 1982-2000a
All pupils 1982-2000
Year
1982 1984 1986 1988 1990 1992 1993 1994 1996 1998 1999b 2000
% % % % % % % % % % % %
Boys
Regular smoker 11 13 7 7 9 9 8 10 11 9 8 9
Occasional smoker 7 9 5 5 6 6 7 9 8 8 4 7
Used to smoke 11 11 10 8 7 6 6 7 7 9 9 8
Tried smoking 26 24 23 23 22 22 22 21 22 20 22 20
Never smoked 45 44 55 58 56 57 57 53 53 54 57 56
Ever smoked 55 56 45 42 44 43 43 47 47 46 43 44
Girls
Regular smoker 11 13 12 9 11 10 11 13 15 12 10 12
Occasional smoker 9 9 5 5 6 7 9 10 10 8 6 10
Used to smoke 10 10 10 9 7 7 10 8 9 10 11 8
Tried smoking 22 22 19 19 18 19 18 17 18 18 18 17
Never smoked 49 46 53 59 58 57 53 52 48 51 55 53
Ever smoked 51 54 47 41 42 43 47 48 52 49 45 47
Total
Regular smoker 11 13 10 8 10 10 10 12 13 11 9 10
Occasional smoker 8 9 5 5 6 7 8 9 9 8 5 9
Used to smoke 10 10 10 8 7 7 8 8 8 10 10 8
Tried smoking 24 23 21 21 20 20 20 19 20 19 20 19
Never smoked 47 45 54 58 57 57 55 53 51 53 56 55
Ever smoked 53 55 46 42 43 43 45 47 49 47 44 45
Unweighted bases
Boys 1460 1928 1676 1489 1643 1662 1613 1522 1445 2311 4791 3654
Girls 1514 1689 1508 1529 1478 1626 1527 1523 1409 2413 4542 3407
Total 2979 3658 3189 3018 3121 3295 3140 3045 2854 4723 9333 7061
a Table 3.1b shows trends in smoking behaviour from 2001 onwards.
b Questions about how many cigarettes were smoked in the last seven days were not asked in 1999, and pupils were notreclassified as occasional smokers. The figures for regular smokers in 1999 are comparable with other years, butfigures for other classifications of smokers are not.
Smokingbehaviour
Data from 1982 to 2003 re-used with permission of the Department of Health

Copyright © 2014, Health and Social Care Information Centre, Lifestyles Statistics. All rights reserved.
60 Smoking, drinking and drug use among young people in England in 2013
Table 3.1b
Smoking behaviour, by sex: 2001-2013a
All pupils 2001-2013
Year
2001 2002 2003 2004 2005 2006 2007 2008 2009 2010b 2011b 2012b 2013b
% % % % % % % % % % % % %
Boys
Regular smoker 8 9 7 7 7 7 5 5 5 4 4 4 3
Occasional smoker 7 6 6 4 5 4 4 4 4 4 4 3 4
Used to smoke 8 6 7 7 7 7 6 5 5 4 4 4 3
Tried smoking 20 18 20 19 18 18 16 16 15 13 13 12 11
Never smoked 58 61 60 63 63 64 69 69 71 75 75 77 80
Ever smoked 42 39 40 37 37 36 31 31 29 25 25 23 20
Girls
Regular smoker 11 11 11 10 10 10 8 8 7 6 5 4 4
Occasional smoker 9 8 8 7 8 6 6 6 6 5 5 4 5
Used to smoke 8 8 8 8 8 8 7 6 5 5 4 4 4
Tried smoking 17 16 17 15 16 16 15 13 12 12 11 11 11
Never smoked 55 56 56 59 58 59 64 67 70 72 74 76 77
Ever smoked 45 44 44 41 42 41 36 33 30 28 26 24 23
Total
Regular smoker 10 10 9 9 9 9 6 6 6 5 5 4 3
Occasional smoker 8 7 7 5 6 5 5 5 5 4 4 4 4
Used to smoke 8 7 8 8 8 7 6 6 5 5 4 4 3
Tried smoking 19 17 18 17 17 17 15 15 14 13 12 12 11
Never smoked 56 58 58 61 60 61 67 68 71 73 75 77 78
Ever smoked 44 42 42 39 40 39 33 32 29 27 25 23 22
Unweighted basesb
Boys 4652 5064 5179 4989 4623 4018 4021 3950 3820 3663 3166 3785 2713
Girls 4625 4732 5081 4629 4469 4134 3717 3800 3792 3591 3280 3753 2408
Total 9277 9796 10260 9618 9092 8152 7738 7750 7612 7254 6446 7538 5121
a Table 3.1a shows trends in smoking behaviour from 1982 to 2000.
b Estimates since 2010 are based on weighted data (see Section 1.3.3). 2013 weighted bases are shown in Table 3.2.
Smokingbehaviour
Data from 2001 to 2003 re-used with permission of the Department of Health

Copyright © 2014, Health and Social Care Information Centre, Lifestyles Statistics. All rights reserved.
Smoking, drinking and drug use among young people in England in 2013 61
Table 3.2
Smoking behaviour, by age and sex
All pupils 2013
Age
11 12 13 14 15 Totalyears years years years years
% % % % % %
Boys
Regular smoker 1 0 1 2 8 3
Occasional smoker 0 0 2 4 10 4
Used to smoke - 1 3 3 7 3
Tried smoking 5 8 10 13 16 11
Never smoked 95 91 85 78 59 80
Ever smoked 5 9 15 22 41 20
Girls
Regular smoker 0 0 1 7 8 4
Occasional smoker - 1 3 6 11 5
Used to smoke 0 1 2 4 8 4
Tried smoking 2 6 8 16 19 11
Never smoked 97 91 86 66 55 77
Ever smoked 3 9 14 34 45 23
Total
Regular smoker 0 0 1 4 8 3
Occasional smoker 0 1 3 5 10 4
Used to smoke 0 1 2 4 7 3
Tried smoking 3 7 9 14 17 11
Never smoked 96 91 85 72 57 78
Ever smoked 4 9 15 28 43 22
Unweighted bases
Boys 416 545 545 551 656 2713
Girls 401 480 477 472 578 2408
Total 817 1025 1022 1023 1234 5121
Weighted bases
Boys 394 510 506 536 651 2597
Girls 388 484 498 491 661 2522
Total 782 994 1004 1027 1312 5119
Smokingbehaviour

Copyright © 2014, Health and Social Care Information Centre, Lifestyles Statistics. All rights reserved.
62 Smoking, drinking and drug use among young people in England in 2013
Table 3.3a
Proportion of pupils who were regular smokers, by sex and age: 1982-2000a
All pupils 1982-2000
Year
1982 1984 1986 1988 1990 1992 1993 1994 1996 1998 1999 2000
% % % % % % % % % % % %
Boys
11 years 1 0 0 0 0 0 0 1 1 1 1 1
12 years 2 2 2 2 2 2 3 2 2 3 2 2
13 years 8 10 5 5 6 6 3 4 8 5 4 6
14 years 18 16 6 8 10 14 14 14 13 15 10 11
15 years 24 28 18 17 25 21 19 26 28 19 21 21
Total 11 13 7 7 9 9 8 10 11 9 8 9
Girls
11 years 0 1 0 1 1 0 0 0 0 1 0 1
12 years 1 2 2 0 2 2 3 3 4 3 3 2
13 years 6 9 5 4 9 9 5 8 11 9 8 10
14 years 14 19 16 12 16 15 18 20 24 19 15 19
15 years 25 28 27 22 25 25 26 30 33 29 25 26
Total 11 13 12 9 11 10 11 13 15 12 10 12
Total
11 years 0 0 0 0 0 0 0 1 1 1 1 1
12 years 2 2 2 1 2 2 3 2 3 4 3 2
13 years 7 10 5 5 7 7 4 6 10 8 6 8
14 years 16 17 11 10 13 14 16 17 18 19 12 15
15 years 25 28 22 20 25 23 22 28 30 24 23 23
Total 11 13 10 8 10 10 10 12 13 11 9 10
Unweighted bases
Boys
11 years 299 260 236 229 313 289 251 268 272 300 870 618
12 years 298 378 320 280 350 336 318 310 297 349 1011 751
13 years 303 416 347 318 313 351 349 307 282 302 946 736
14 years 277 376 352 311 305 311 337 306 298 612 918 752
15 years 348 490 421 350 360 369 358 331 296 754 1046 797
Total 1525 1920 1676 1488 1641 1656 1613 1522 1445 2317 4791 3654
Girls
11 years 250 254 213 226 296 307 253 236 274 303 870 572
12 years 276 332 314 315 281 359 316 307 278 375 892 686
13 years 303 355 266 297 292 335 325 329 278 390 924 697
14 years 312 333 314 315 302 297 323 310 288 670 933 688
15 years 372 412 400 376 304 320 310 341 291 673 923 764
Total 1513 1686 1507 1529 1475 1618 1527 1523 1409 2411 4542 3407
Total
11 years 549 514 449 455 609 596 504 504 546 603 1740 1190
12 years 574 710 634 595 631 695 634 617 575 724 1903 1437
13 years 606 771 613 615 605 686 674 636 560 692 1870 1433
14 years 589 709 666 626 607 608 660 616 586 1282 1851 1440
15 years 720 902 821 726 664 689 668 672 587 1427 1969 1561
Total 3038 3606 3183 3017 3116 3274 3140 3045 2854 4728 9333 7061
a Table 3.3b shows trends in the prevalence of regular smoking from 2001 onwards.
Regularsmokers
Data from 1982 to 2000 re-used with permission of the Department of Health
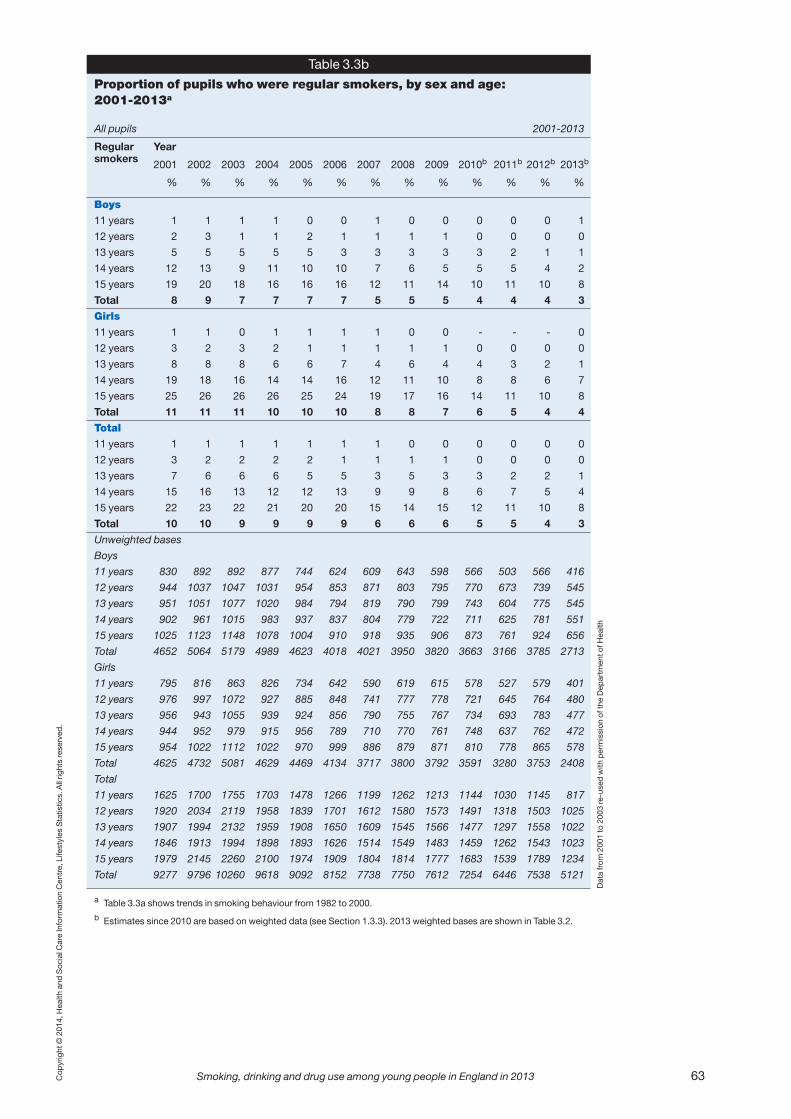
Copyright © 2014, Health and Social Care Information Centre, Lifestyles Statistics. All rights reserved.
Smoking, drinking and drug use among young people in England in 2013 63
Table 3.3b
Proportion of pupils who were regular smokers, by sex and age: 2001-2013a
All pupils 2001-2013
Year
2001 2002 2003 2004 2005 2006 2007 2008 2009 2010b 2011b 2012b 2013b
% % % % % % % % % % % % %
Boys
11 years 1 1 1 1 0 0 1 0 0 0 0 0 1
12 years 2 3 1 1 2 1 1 1 1 0 0 0 0
13 years 5 5 5 5 5 3 3 3 3 3 2 1 1
14 years 12 13 9 11 10 10 7 6 5 5 5 4 2
15 years 19 20 18 16 16 16 12 11 14 10 11 10 8
Total 8 9 7 7 7 7 5 5 5 4 4 4 3
Girls
11 years 1 1 0 1 1 1 1 0 0 - - - 0
12 years 3 2 3 2 1 1 1 1 1 0 0 0 0
13 years 8 8 8 6 6 7 4 6 4 4 3 2 1
14 years 19 18 16 14 14 16 12 11 10 8 8 6 7
15 years 25 26 26 26 25 24 19 17 16 14 11 10 8
Total 11 11 11 10 10 10 8 8 7 6 5 4 4
Total
11 years 1 1 1 1 1 1 1 0 0 0 0 0 0
12 years 3 2 2 2 2 1 1 1 1 0 0 0 0
13 years 7 6 6 6 5 5 3 5 3 3 2 2 1
14 years 15 16 13 12 12 13 9 9 8 6 7 5 4
15 years 22 23 22 21 20 20 15 14 15 12 11 10 8
Total 10 10 9 9 9 9 6 6 6 5 5 4 3
Unweighted bases
Boys
11 years 830 892 892 877 744 624 609 643 598 566 503 566 416
12 years 944 1037 1047 1031 954 853 871 803 795 770 673 739 545
13 years 951 1051 1077 1020 984 794 819 790 799 743 604 775 545
14 years 902 961 1015 983 937 837 804 779 722 711 625 781 551
15 years 1025 1123 1148 1078 1004 910 918 935 906 873 761 924 656
Total 4652 5064 5179 4989 4623 4018 4021 3950 3820 3663 3166 3785 2713
Girls
11 years 795 816 863 826 734 642 590 619 615 578 527 579 401
12 years 976 997 1072 927 885 848 741 777 778 721 645 764 480
13 years 956 943 1055 939 924 856 790 755 767 734 693 783 477
14 years 944 952 979 915 956 789 710 770 761 748 637 762 472
15 years 954 1022 1112 1022 970 999 886 879 871 810 778 865 578
Total 4625 4732 5081 4629 4469 4134 3717 3800 3792 3591 3280 3753 2408
Total
11 years 1625 1700 1755 1703 1478 1266 1199 1262 1213 1144 1030 1145 817
12 years 1920 2034 2119 1958 1839 1701 1612 1580 1573 1491 1318 1503 1025
13 years 1907 1994 2132 1959 1908 1650 1609 1545 1566 1477 1297 1558 1022
14 years 1846 1913 1994 1898 1893 1626 1514 1549 1483 1459 1262 1543 1023
15 years 1979 2145 2260 2100 1974 1909 1804 1814 1777 1683 1539 1789 1234
Total 9277 9796 10260 9618 9092 8152 7738 7750 7612 7254 6446 7538 5121
a Table 3.3a shows trends in smoking behaviour from 1982 to 2000.
b Estimates since 2010 are based on weighted data (see Section 1.3.3). 2013 weighted bases are shown in Table 3.2.
Regularsmokers
Data from 2001 to 2003 re-used with permission of the Department of Health

Copyright © 2014, Health and Social Care Information Centre, Lifestyles Statistics. All rights reserved.
64 Smoking, drinking and drug use among young people in England in 2013
Table 3.4
Proportion of pupils who smoked in thelast week, by age and sex
All pupils 2013
Age
11 12 13 14 15 Totalyears years years years years
% % % % % %
Boys 1 1 2 5 14 5
Girls 1 2 3 11 12 7
Total 1 2 3 8 13 6
Unweighted bases
Boys 395 527 521 533 643 2619
Girls 390 478 475 464 572 2379
Total 785 1005 996 997 1215 4998
Weighted bases
Boys 374 493 482 517 639 2505
Girls 378 483 494 485 655 2494
Total 752 975 977 1002 1293 4999
Smoked in the lastweek
Table 3.5
Cigarettes smoked in the last week, by smoking behavioura
All pupils 2013
Smoking behaviour
Never Tried Used to Less 1 to 6 a More than Totala,b
smoked smoking smoke, than one week 6 a weekonce never now a week
% % % % % % %
None 100 94 91 61 11 1 95
1 to 6 0 5 8 29 28 5 2
7 to 69 0 0 1 10 61 68 2
70 or more - - - - - 25 0
Unweighted bases 3974 474 164 142 56 86 4954
Weighted bases 3932 487 176 154 56 89 4953
a Based on pupils who gave information on the number of cigarettes smoked for all seven days of the last week.
b Total column includes pupils who did not answer the question about their smoking behaviour.
Cigarettessmoked inthe lastweek
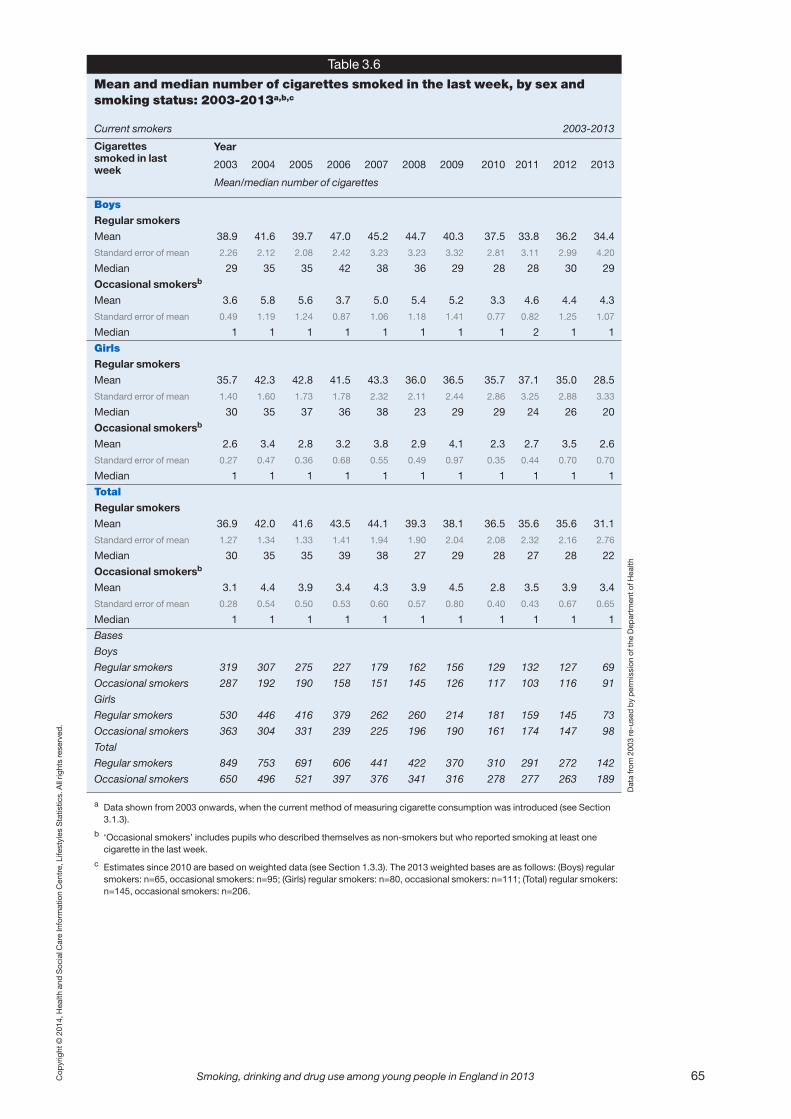
Copyright © 2014, Health and Social Care Information Centre, Lifestyles Statistics. All rights reserved.
Smoking, drinking and drug use among young people in England in 2013 65
Table 3.6
Mean and median number of cigarettes smoked in the last week, by sex andsmoking status: 2003-2013a,b,c
Current smokers 2003-2013
Year
2003 2004 2005 2006 2007 2008 2009 2010 2011 2012 2013
Mean/median number of cigarettes
Boys
Regular smokers
Mean 38.9 41.6 39.7 47.0 45.2 44.7 40.3 37.5 33.8 36.2 34.4
Standard error of mean 2.26 2.12 2.08 2.42 3.23 3.23 3.32 2.81 3.11 2.99 4.20
Median 29 35 35 42 38 36 29 28 28 30 29
Occasional smokersb
Mean 3.6 5.8 5.6 3.7 5.0 5.4 5.2 3.3 4.6 4.4 4.3
Standard error of mean 0.49 1.19 1.24 0.87 1.06 1.18 1.41 0.77 0.82 1.25 1.07
Median 1 1 1 1 1 1 1 1 2 1 1
Girls
Regular smokers
Mean 35.7 42.3 42.8 41.5 43.3 36.0 36.5 35.7 37.1 35.0 28.5
Standard error of mean 1.40 1.60 1.73 1.78 2.32 2.11 2.44 2.86 3.25 2.88 3.33
Median 30 35 37 36 38 23 29 29 24 26 20
Occasional smokersb
Mean 2.6 3.4 2.8 3.2 3.8 2.9 4.1 2.3 2.7 3.5 2.6
Standard error of mean 0.27 0.47 0.36 0.68 0.55 0.49 0.97 0.35 0.44 0.70 0.70
Median 1 1 1 1 1 1 1 1 1 1 1
Total
Regular smokers
Mean 36.9 42.0 41.6 43.5 44.1 39.3 38.1 36.5 35.6 35.6 31.1
Standard error of mean 1.27 1.34 1.33 1.41 1.94 1.90 2.04 2.08 2.32 2.16 2.76
Median 30 35 35 39 38 27 29 28 27 28 22
Occasional smokersb
Mean 3.1 4.4 3.9 3.4 4.3 3.9 4.5 2.8 3.5 3.9 3.4
Standard error of mean 0.28 0.54 0.50 0.53 0.60 0.57 0.80 0.40 0.43 0.67 0.65
Median 1 1 1 1 1 1 1 1 1 1 1
Bases
Boys
Regular smokers 319 307 275 227 179 162 156 129 132 127 69
Occasional smokers 287 192 190 158 151 145 126 117 103 116 91
Girls
Regular smokers 530 446 416 379 262 260 214 181 159 145 73
Occasional smokers 363 304 331 239 225 196 190 161 174 147 98
Total
Regular smokers 849 753 691 606 441 422 370 310 291 272 142
Occasional smokers 650 496 521 397 376 341 316 278 277 263 189
a Data shown from 2003 onwards, when the current method of measuring cigarette consumption was introduced (see Section3.1.3).
b ‘Occasional smokers’ includes pupils who described themselves as non-smokers but who reported smoking at least onecigarette in the last week.
c Estimates since 2010 are based on weighted data (see Section 1.3.3). The 2013 weighted bases are as follows: (Boys) regularsmokers: n=65, occasional smokers: n=95; (Girls) regular smokers: n=80, occasional smokers: n=111; (Total) regular smokers:n=145, occasional smokers: n=206.
Cigarettessmoked in lastweek
Data from 2003 re-used by permission of the Department of Health
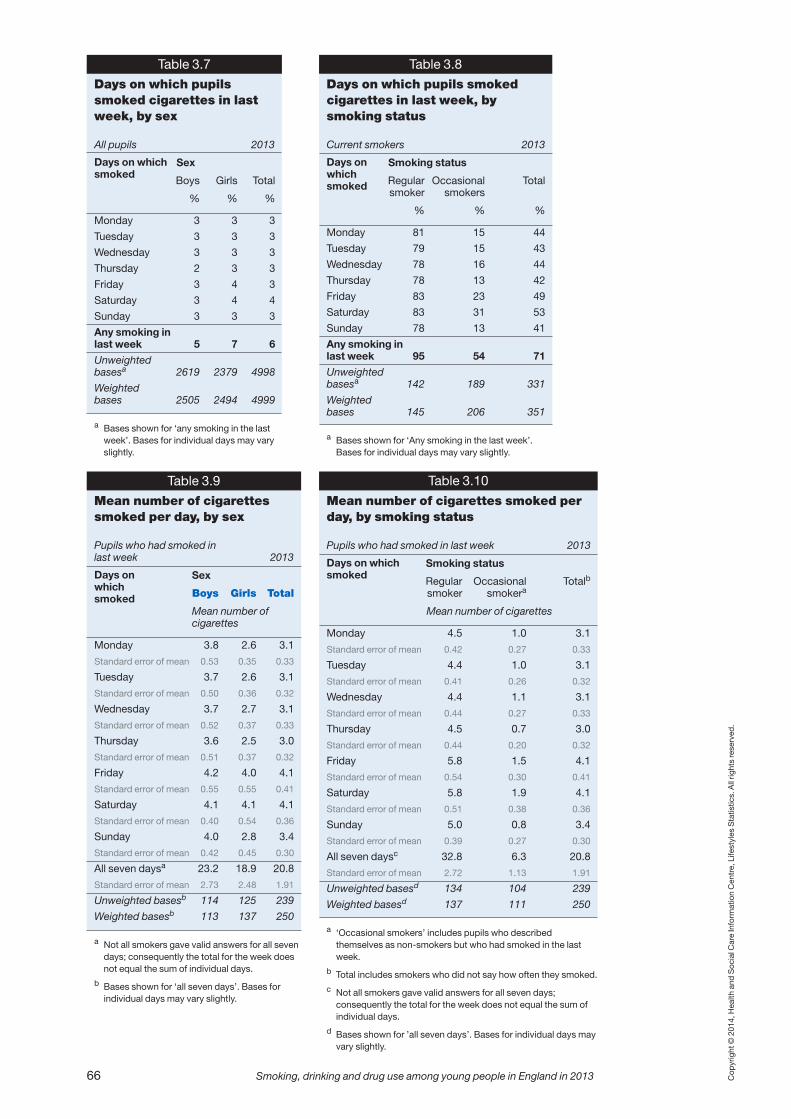
Copyright © 2014, Health and Social Care Information Centre, Lifestyles Statistics. All rights reserved.
66 Smoking, drinking and drug use among young people in England in 2013
Table 3.7
Days on which pupilssmoked cigarettes in lastweek, by sex
All pupils 2013
Sex
Boys Girls Total
% % %
Monday 3 3 3
Tuesday 3 3 3
Wednesday 3 3 3
Thursday 2 3 3
Friday 3 4 3
Saturday 3 4 4
Sunday 3 3 3
Any smoking in last week 5 7 6
Unweighted basesa 2619 2379 4998
Weighted bases 2505 2494 4999
a Bases shown for ‘any smoking in the lastweek’. Bases for individual days may varyslightly.
Days on whichsmoked
Table 3.8
Days on which pupils smokedcigarettes in last week, bysmoking status
Current smokers 2013
Smoking status
Regular Occasional Totalsmoker smokers
% % %
Monday 81 15 44
Tuesday 79 15 43
Wednesday 78 16 44
Thursday 78 13 42
Friday 83 23 49
Saturday 83 31 53
Sunday 78 13 41
Any smoking in last week 95 54 71
Unweighted basesa 142 189 331
Weighted bases 145 206 351
a Bases shown for ‘Any smoking in the last week’.Bases for individual days may vary slightly.
Days onwhichsmoked
Table 3.10
Mean number of cigarettes smoked perday, by smoking status
Pupils who had smoked in last week 2013
Smoking status
Regular Occasional Totalb
smoker smokera
Mean number of cigarettes
Monday 4.5 1.0 3.1
Standard error of mean 0.42 0.27 0.33
Tuesday 4.4 1.0 3.1
Standard error of mean 0.41 0.26 0.32
Wednesday 4.4 1.1 3.1
Standard error of mean 0.44 0.27 0.33
Thursday 4.5 0.7 3.0
Standard error of mean 0.44 0.20 0.32
Friday 5.8 1.5 4.1
Standard error of mean 0.54 0.30 0.41
Saturday 5.8 1.9 4.1
Standard error of mean 0.51 0.38 0.36
Sunday 5.0 0.8 3.4
Standard error of mean 0.39 0.27 0.30
All seven daysc 32.8 6.3 20.8
Standard error of mean 2.72 1.13 1.91
Unweighted basesd 134 104 239
Weighted basesd 137 111 250
a ‘Occasional smokers’ includes pupils who describedthemselves as non-smokers but who had smoked in the lastweek.
b Total includes smokers who did not say how often they smoked.
c Not all smokers gave valid answers for all seven days;consequently the total for the week does not equal the sum ofindividual days.
d Bases shown for ’all seven days’. Bases for individual days mayvary slightly.
Days on whichsmoked
Table 3.9
Mean number of cigarettessmoked per day, by sex
Pupils who had smoked in last week 2013
Sex
Boys Girls Total
Mean number of cigarettes
Monday 3.8 2.6 3.1
Standard error of mean 0.53 0.35 0.33
Tuesday 3.7 2.6 3.1
Standard error of mean 0.50 0.36 0.32
Wednesday 3.7 2.7 3.1
Standard error of mean 0.52 0.37 0.33
Thursday 3.6 2.5 3.0
Standard error of mean 0.51 0.37 0.32
Friday 4.2 4.0 4.1
Standard error of mean 0.55 0.55 0.41
Saturday 4.1 4.1 4.1
Standard error of mean 0.40 0.54 0.36
Sunday 4.0 2.8 3.4
Standard error of mean 0.42 0.45 0.30
All seven daysa 23.2 18.9 20.8
Standard error of mean 2.73 2.48 1.91
Unweighted basesb 114 125 239
Weighted basesb 113 137 250
a Not all smokers gave valid answers for all sevendays; consequently the total for the week doesnot equal the sum of individual days.
b Bases shown for ‘all seven days’. Bases forindividual days may vary slightly.
Days onwhichsmoked
Cop
yright © 201
4, Health
and
Soc
ial C
are Inform
ation Cen
tre. All rig
hts reserved
.
Smoking, drinking and drug use among young people in England in 2013 67
4 Drinking alcohol
Key findings for 2013
� 39% of pupils said that they had drunk alcohol at least once. This continues thedownward trend since 2003, when 61% of pupils had drunk alcohol, and is lowerthan at any time since 1988, when the survey first measured the prevalence ofdrinking in this age group.
� Boys and girls were equally likely to have drunk alcohol. The proportion of pupils whohad drunk alcohol increased with age from 6% of 11 year olds to 72% of 15 yearolds.
� 9% of pupils had drunk alcohol in the last week. This proportion has also declinedsince 2003, when it was 25%.
� The proportions of pupils who drank alcohol in the last week increased from 1% of 11year olds to 22% of 15 year olds.
� Around three quarters (74%) of pupils who drank alcohol in the last week did so onone day only.
� Pupils who drank alcohol in the last week drank a mean of 8.2 units of alcohol, thelowest average amount since 2007, when the current method of calculating units wasintroduced. Boys and girls drank similar amounts.
� Most pupils who drank alcohol in the last week consumed more than one type ofalcoholic drink.
� Boys drank 63% of their intake of alcohol in the form of beer, lager or cider. Of theremainder, most was drunk in the form of spirits (16%) or alcopops (13%). Girls’intake was more diverse, being divided more evenly between beer, lager and cider(30%), wine (25%), spirits (22%) and alcopops (20%).

4.1 Introduction
4.1.1 Background
Alcohol consumption among adults and young people is a key area of concern for thegovernment. This was most recently articulated in the 2012 Alcohol Strategy1 which had aparticular focus on binge and problem drinking but also included the stated aim of achieving ‘asustained reduction in both the numbers of 11 to 15 year olds drinking alcohol and theamounts consumed’. This strategy document included a number of proposals for tacklingproblem drinking, to be applied either at national or local level. National level initiatives focusedon tackling the availability of cheap alcohol, and reviewing the rules and practices around theadvertising of alcohol, with particular reference to the influence this can have on children. Atthe local level, councils are to be given greater powers of enforcement, and also control overpublic health budgets to tackle problems in a way that is appropriate for each area.
Alongside this, The public health responsibility deal, published in 2011, and its allied alcoholnetwork, led by the Department of Health and representatives from industry, local authoritiesand the public health community, also aims to ‘foster a culture of responsible drinking, whichwill help people to drink within guidelines’.2 Included within the pledges are ones that relatespecifically to young people, including the enforcement of existing Challenge 213 andChallenge 254 initiatives, and ensuring that alcohol advertising is not targeted at children oryoung people.
In recent years, there has been increasing evidence in support of using alcohol pricing,specifically a minimum price per unit of alcohol, to reduce alcohol-related harm.5 The 2012Alcohol Strategy1 included a commitment to minimum pricing in England, but in 2013, it wasannounced that there were no immediate plans to introduce legislation to implement this. In2014, the government announced that, from April 2014, it would ban the sale of alcohol atbelow cost price, that is, the level of alcohol duty plus VAT.6
In 2009, the Chief Medical Officer of England published the first official guidance on alcoholaimed specifically at young people.7 This guidance recommended that the healthiest andsafest option was for children to remain alcohol free up to the age of 15, and that olderteenagers who did drink alcohol should do so in a supervised environment. The guidancesuggested that young people should drink on no more than one day per week and conform tothe limits recommended for adults.
The guidance was based on a body of evidence that drinking at a young age, and particularlyheavy or regular drinking, can result in physical or mental health problems, impair braindevelopment, and put children at risk of alcohol-related accident or injury. More broadly it isalso associated with missing or falling behind at school, violent and antisocial behaviour, andunsafe sexual behaviour.8,9
Historically, children in England have been more likely to drink alcohol than children in manyother European countries.10 Although the proportion of young people in England who drink issteadily reducing, it remains well above the European average.11 Furthermore, the UKcontinues to rank amongst countries with the highest levels of alcohol consumption by thosewho do drink, and British children are more likely to have ‘binge drunk’ or been drunkcompared to children in most other European countries.11
A range of research has been carried out on what influences drinking behaviour amongchildren and young people. For younger children it is generally thought that parents and otherfamily members play the key role in forming their initial understanding of alcohol,12 but aschildren grow older and begin to socialise more, peers start to have an increasing impact ontheir attitudes, choices and behaviour.13 There has also been an increase in the attention paidto the impact of commercial advertising and social networking on drinking behaviour.14,15
4.1.2 Measuring alcohol consumption
Consumption in units
Pupils who had drunk in the last seven days were asked how much they had drunk in thatperiod. Their answers were used to calculate their consumption in units (one unit of alcohol is
Cop
yrig
ht ©
201
4, H
ealth
and
Soc
ial C
are
Info
rmat
ion
Cen
tre.
All
right
s re
serv
ed.
68 Smoking, drinking and drug use among young people in England in 2013
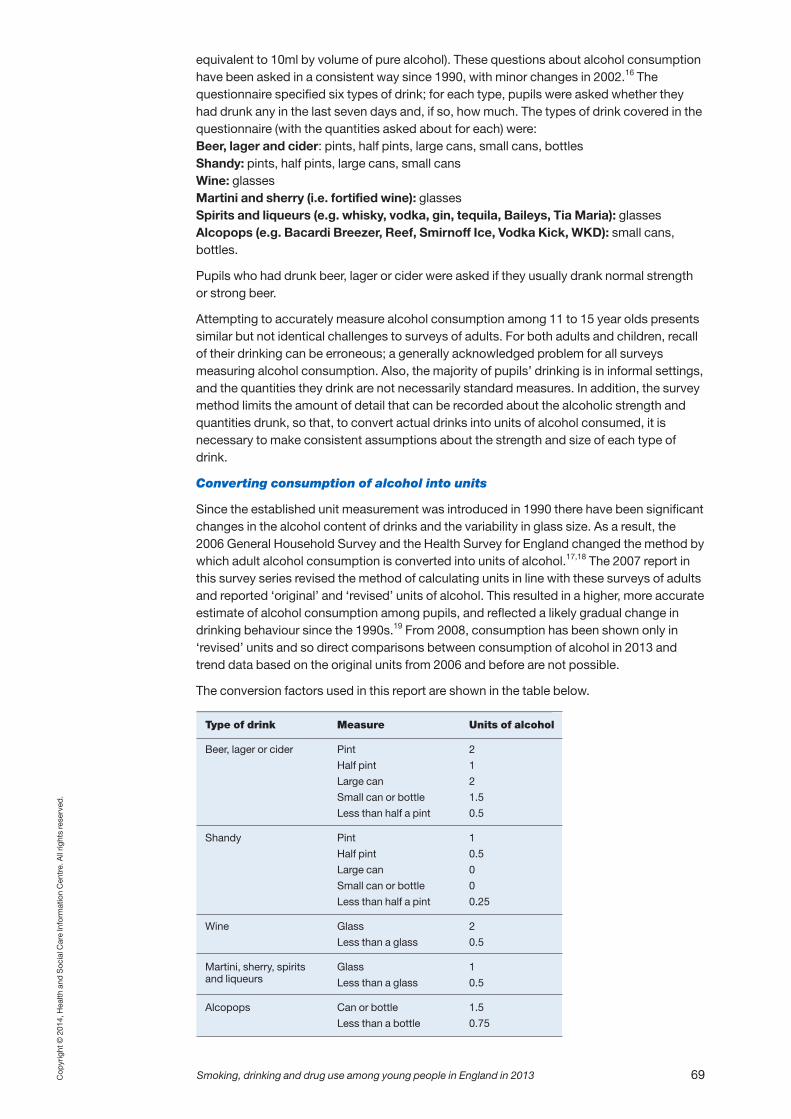
equivalent to 10ml by volume of pure alcohol). These questions about alcohol consumptionhave been asked in a consistent way since 1990, with minor changes in 2002.16 Thequestionnaire specified six types of drink; for each type, pupils were asked whether theyhad drunk any in the last seven days and, if so, how much. The types of drink covered in thequestionnaire (with the quantities asked about for each) were:Beer, lager and cider: pints, half pints, large cans, small cans, bottlesShandy: pints, half pints, large cans, small cansWine: glassesMartini and sherry (i.e. fortified wine): glassesSpirits and liqueurs (e.g. whisky, vodka, gin, tequila, Baileys, Tia Maria): glassesAlcopops (e.g. Bacardi Breezer, Reef, Smirnoff Ice, Vodka Kick, WKD): small cans,bottles.
Pupils who had drunk beer, lager or cider were asked if they usually drank normal strengthor strong beer.
Attempting to accurately measure alcohol consumption among 11 to 15 year olds presentssimilar but not identical challenges to surveys of adults. For both adults and children, recallof their drinking can be erroneous; a generally acknowledged problem for all surveysmeasuring alcohol consumption. Also, the majority of pupils’ drinking is in informal settings,and the quantities they drink are not necessarily standard measures. In addition, the surveymethod limits the amount of detail that can be recorded about the alcoholic strength andquantities drunk, so that, to convert actual drinks into units of alcohol consumed, it isnecessary to make consistent assumptions about the strength and size of each type ofdrink.
Converting consumption of alcohol into units
Since the established unit measurement was introduced in 1990 there have been significantchanges in the alcohol content of drinks and the variability in glass size. As a result, the2006 General Household Survey and the Health Survey for England changed the method bywhich adult alcohol consumption is converted into units of alcohol.17,18 The 2007 report inthis survey series revised the method of calculating units in line with these surveys of adultsand reported ‘original’ and ‘revised’ units of alcohol. This resulted in a higher, more accurateestimate of alcohol consumption among pupils, and reflected a likely gradual change indrinking behaviour since the 1990s.19 From 2008, consumption has been shown only in‘revised’ units and so direct comparisons between consumption of alcohol in 2013 andtrend data based on the original units from 2006 and before are not possible.
The conversion factors used in this report are shown in the table below.
Cop
yrig
ht ©
201
4, H
ealth
and
Soc
ial C
are
Info
rmat
ion
Cen
tre.
All
right
s re
serv
ed.
Smoking, drinking and drug use among young people in England in 2013 69
Type of drink Measure Units of alcohol
Beer, lager or cider Pint 2
Half pint 1
Large can 2
Small can or bottle 1.5
Less than half a pint 0.5
Shandy Pint 1
Half pint 0.5
Large can 0
Small can or bottle 0
Less than half a pint 0.25
Wine Glass 2
Less than a glass 0.5
Martini, sherry, spirits Glass 1and liqueurs Less than a glass 0.5
Alcopops Can or bottle 1.5
Less than a bottle 0.75

Where pupils have indicated that they normally drink strong rather than normal strengthbeer, lager or cider, the number of units has been multiplied by 1.5.
4.1.3 Outline of content
This chapter covers drinking prevalence and drinking patterns, including the days on whichpupils drink, and the amounts and types of alcoholic drinks they consume.
4.2 Prevalence of drinking alcohol
4.2.1 Whether pupils have ever drunk alcohol
Between 1988 and 2003, the proportions of pupils who reported that they had drunkalcohol remained broadly constant, between 59% and 64%. In 2003, 61% of pupils saidthat they had drunk alcohol. Since then, there has been a steady decline in the proportionsof pupils who have drunk alcohol at least once, and this was continued in 2013. In answerto the question ‘Have you ever had a proper alcoholic drink – a whole drink, not just a sip?’39% of pupils in 2013 answered that they had. This is a smaller proportion than in 2012(43%). (Tables 4.1a, 4.1b, Figure 4.1)
Boys and girls were equally likely to report that they had had at least one alcoholic drink intheir lifetimes. The proportions increased with age, from 6% of 11 year olds to 72% of 15year olds. (Table 4.2, Figure 4.2)
4.2.2 Drinking in the last week
In 2013, 9% of pupils reported that they had drunk alcohol in the last week. This continuesthe overall downward trend since 2003, when 25% of pupils reported drinking in the lastweek, and is at a similar level to the proportion in 2012 (10%). (Tables 4.3a, 4.3b)
Similar proportions of boys and girls had drunk alcohol in the last week. The proportion ofpupils who had drunk in the last week was relatively low among 11 to 13 year olds (from 1%of 11 year olds to 4% of 13 year olds), but increased sharply thereafter. 11% of 14 year oldsand 22% of 15 year olds reported drinking alcohol in the last week.
The decline over the last decade in the proportions of pupils drinking in an average week isseen in all age groups. For example, 6% of 11 year olds said they had drunk alcohol in2003, compared with 1% in 2013. Among older pupils, 49% of 15 year olds had drunk in thelast week in 2003, compared with 22% in 2013. (Tables 4.4-4.5b, Figure 4.3)
Cop
yrig
ht ©
201
4, H
ealth
and
Soc
ial C
are
Info
rmat
ion
Cen
tre.
All
right
s re
serv
ed.
70 Smoking, drinking and drug use among young people in England in 2013
Prevalence of ever drinking alcohol, by sex: 1988-2013All pupils
Figure 4.1
Per
cent
0
10
20
30
40
50
60
70
GirlsBoys
Year
93 00 01 02 03 04 05 08 09 10 11 12 1306 0790 9188 89 92 94 95 9796 98 99

4.2.3 Usual frequency of drinking alcohol
The steady fall in the prevalence of drinking among pupils aged between 11 and 15 isreflected in the proportions who said that they drank alcohol at least once a week, from19% in 2003 to 5% in 2013. An increasing proportion of this age group report that theydon’t drink at all: from 42% in 2003 to 65% in 2013. (This latter group includes pupils whohave never drunk alcohol and those who have tried it but say that they never drink alcoholnow.) (Tables 4.6a to 4.7)
4.3 Patterns of drinking alcohol in the last week
4.3.1 When pupils drink
Pupils who said they had drunk alcohol in the last week were asked when and what theyhad drunk. It is important to bear in mind that the data that refer to patterns of drinking arebased on the 9% of pupils who had drunk alcohol in the last week. Because older pupilswere more likely to have drunk alcohol in the last week than younger pupils, the age profile
Cop
yrig
ht ©
201
4, H
ealth
and
Soc
ial C
are
Info
rmat
ion
Cen
tre.
All
right
s re
serv
ed.
Smoking, drinking and drug use among young people in England in 2013 71
Ever had an alcoholic drink, by sex and ageAll pupils
11 years 12 years 13 years 14 years 15 years
BoysGirls
Figure 4.2
Per
cent
0
10
20
30
40
50
60
70
80
Age
0
10
20
30
40
50
60
Figure 4.3
Prevalence of drinking alcohol in the last week, by age: 2003-2013All pupils
12 years13 years14 years15 years
11 years
2006 2008 2009 2011 2012 201320102003 2003 2004 2005
Year
Per
cent

of this group is skewed towards older pupils; it includes 2% of 11 to 13 year olds, 11% of 14year olds and 22% of 15 year olds (data not shown).
Around three quarters of pupils who drank in the last week (74%) had done so on only oneday. The mean number of drinking days in the last week was 1.4 days for both boys andgirls, and has remained at a similar level in recent years. (Tables 4.8, 4.9)
Pupils are more likely to drink at weekends. 60% of pupils who had drunk alcohol in the lastweek had done so on Saturday, compared with 33% who drank on Friday, 22% who drankon Sunday and between 4% and 6% who reported drinking on other days. (Tables 4.10, 4.11)
4.3.2 Trends in alcohol consumption
The method for calculating alcohol consumption based on actual drinks is described inSection 4.1.2. This method was revised in 2007, and in reporting that year’s survey both theoriginal and revised unit calculations were shown and commented on. From 2008 onwardsonly the revised calculation has been used. The adjustment in the unit calculation has asignificant impact on the trend data in this section. Consequently, estimates of the numbersof units of alcohol consumed by 11 to 15 year olds in 2013 are not comparable with thosereported from surveys in this series before 2007. (Tables 4.12a, 4.12b)
In 2013, the average (mean) alcohol consumption by pupils who had drunk in the last weekwas 8.2 units. This is below the mean consumption levels recorded between 2007 and2012, which varied between 10.4 units and 14.6 units since 2007, with no clear trend.
(Table 4.12b)
4.3.3 How much do pupils drink?
Boys and girls who had drunk alcohol in the last week consumed similar amounts. Onaverage pupils aged between 11 and 13 drank less than those aged 14 or 15 (4.3 units,compared with 8.8 units and 8.7 units respectively). This pattern is broadly similar to thatseen in previous years. (Tables 4.12b, Figure 4.4)
Median consumption gives a more representative indication of what pupils drink, as meanconsumption measures are based on data whose distribution is skewed. Even if themajority of pupils drink well below the mean value, the latter may be increased by relativelysmall numbers of pupils who record very high consumption.
As in previous years the median consumption of alcohol over the previous week was lower
Cop
yrig
ht ©
201
4, H
ealth
and
Soc
ial C
are
Info
rmat
ion
Cen
tre.
All
right
s re
serv
ed.
72 Smoking, drinking and drug use among young people in England in 2013
Mean alcohol consumption in the last week by pupils who had drunk, by sex and agePupils who drank alcohol in the last week
15 years14 years
Note: 11 to 13 year olds not shown because of small base sizes.
BoysGirls
Figure 4.4
Uni
ts
Age
0
5
10
15
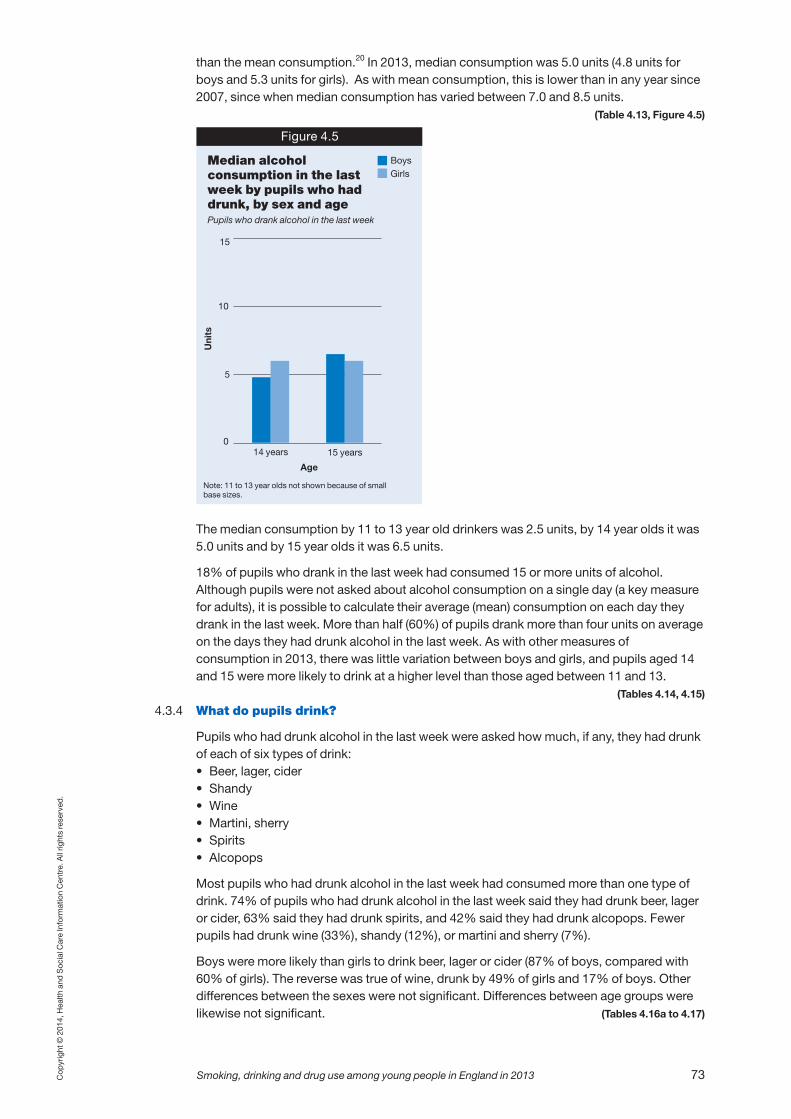
than the mean consumption.20 In 2013, median consumption was 5.0 units (4.8 units forboys and 5.3 units for girls). As with mean consumption, this is lower than in any year since2007, since when median consumption has varied between 7.0 and 8.5 units.
(Table 4.13, Figure 4.5)
The median consumption by 11 to 13 year old drinkers was 2.5 units, by 14 year olds it was5.0 units and by 15 year olds it was 6.5 units.
18% of pupils who drank in the last week had consumed 15 or more units of alcohol.Although pupils were not asked about alcohol consumption on a single day (a key measurefor adults), it is possible to calculate their average (mean) consumption on each day theydrank in the last week. More than half (60%) of pupils drank more than four units on averageon the days they had drunk alcohol in the last week. As with other measures ofconsumption in 2013, there was little variation between boys and girls, and pupils aged 14and 15 were more likely to drink at a higher level than those aged between 11 and 13.
(Tables 4.14, 4.15)
4.3.4 What do pupils drink?
Pupils who had drunk alcohol in the last week were asked how much, if any, they had drunkof each of six types of drink:• Beer, lager, cider• Shandy• Wine• Martini, sherry• Spirits• Alcopops
Most pupils who had drunk alcohol in the last week had consumed more than one type ofdrink. 74% of pupils who had drunk alcohol in the last week said they had drunk beer, lageror cider, 63% said they had drunk spirits, and 42% said they had drunk alcopops. Fewerpupils had drunk wine (33%), shandy (12%), or martini and sherry (7%).
Boys were more likely than girls to drink beer, lager or cider (87% of boys, compared with60% of girls). The reverse was true of wine, drunk by 49% of girls and 17% of boys. Otherdifferences between the sexes were not significant. Differences between age groups werelikewise not significant. (Tables 4.16a to 4.17)
Cop
yrig
ht ©
201
4, H
ealth
and
Soc
ial C
are
Info
rmat
ion
Cen
tre.
All
right
s re
serv
ed.
Smoking, drinking and drug use among young people in England in 2013 73
Median alcohol consumption in the last week by pupils who had drunk, by sex and agePupils who drank alcohol in the last week
15 years14 years
Note: 11 to 13 year olds not shown because of small base sizes.
BoysGirls
Figure 4.5
Uni
ts
Age
0
5
10
15

Half of pupils’ alcohol consumption in the last week was accounted for by beer, lager orcider (on average 3.9 units). On average, pupils drank between 1 and 2 units each of spirits,alcopops and wine. Very little shandy or martini and sherry was drunk (0.1 units of each).This pattern was similar to that seen in previous years. (Tables 4.18a, 4.18b)
The majority of boys’ alcohol consumption was in the form of beer, lager or cider (5.3 units,equivalent to 63% of the total). Spirits (16%) and alcopops (13%) made up most of theremainder. Girls’ alcohol intake was more diverse. Like boys, they drank more in the form ofbeer, lager or cider (2.4 units, 30% of the total) than other drinks. But around two thirds oftheir consumption was also accounted for by wine (25%), spirits (22%) or alcopops (20%).
(Tables 4.19, 4.20, Figure 4.6)
Notes and references
1 https://www.gov.uk/government/publications/alcohol-strategy
2 https://responsibilitydeal.dh.gov.uk/alcohol-pledges/
3 http://www.challenge21.co.uk/
4 http://www.challenge25.org
5 Meng Y et al. Modelled income group-specific impacts of alcohol minimum unit pricing in England2014/15: policy appraisals using new developments to the Sheffield Alcohol Policy Model. School ofHealth and Related Research (ScHARR), Sheffield, 2013.http://www.shef.ac.uk/scharr/sections/ph/research/alpol/publications
6 http://www.parliament.uk/business/publications/research/briefing-papers/SN05021/alcohol-minimum-pricing
7 Donaldson L (2009) Guidance on the consumption of alcohol by children and young people, Departmentof Health.
8 See also: Alcohol Concern (2011) Factsheet: Young people and alcohol.http://www.alcoholconcern.org.uk/publications/factsheets/factsheet-young-people
9 See also: Viner R, and Taylor B, (2007) Adult outcomes of binge drinking in adolescence: findings from aUK national birth cohort. Journal of Epidemiology and Community Health, 61: 902-907.
10 Hibell B, Guttormson U, Ahlstrom S, et al (2009) The 2007 ESPAD report: substance use among studentsin 35 European countries. The Swedish Council for Information on Alcohol and Other Drugs, Stockholm.
11 Hibell B, Guttormson U, Ahlstrom S, et al (2012) The 2011 ESPAD report: substance use among studentsin 36 European countries. The Swedish Council for Information on Alcohol and Other Drugs, Stockholm.
12 Williams B, Davies L, Wright V (2010) Children, young people and alcohol, GfK NOP Social Research,London. Available athttp://www.alcohollearningcentre.org.uk/Topics/Browse/Children/?parent=4977&child=6080
Cop
yrig
ht ©
201
4, H
ealth
and
Soc
ial C
are
Info
rmat
ion
Cen
tre.
All
right
s re
serv
ed.
74 Smoking, drinking and drug use among young people in England in 2013
Proportion of alcohol consumed as each type of drink, by sexPupils who drank alcohol in the last week
Boys Girls
Wine, martini, sherry AlcopopsSpiritsBeer, lager, cider, shandy
Figure 4.6
Per
cent
0
10
20
30
40
50
60
70
80
90
100
Sex
13 Seaman P, Ikegwuonu T (2010) Understanding young adults’ alcohol use within social networks. JosephRowntree Foundation, York.http://www.gcph.co.uk/assets/0000/0897/Findings_2551_SeamanFINAL_DEC.pdf
14 Department for Education, (2011), available athttp://www.education.gov.uk/childrenandyoungpeople/healthandwellbeing/substancemisuse/a0070043/alcohol
15 Gordon R, MacKintosh AM, Moodie C (2010) The impact of alcohol marketing on youth drinkingbehaviour: a two-stage cohort study. Alcohol, 45(5): 470-480.
16 The questionnaire development for the 2002 survey included cognitive testing of questions about alcoholconsumption in the last week, focusing on children’s comprehension of the categories of drink askedabout in the survey and the language used in the questionnaire. It found that:• ‘alcopops’ was a widely used and commonly understood term among young people, but ‘pre-mixed
alcoholic drinks’ was not;• there was some confusion about how strong shandy should be before it counted as a proper alcoholic
drink; and• there were some brands and types of drink, such as champagne, that young people have difficulty
classifying.As a result of these findings a number of changes were made in 2002 to the questions asking aboutalcohol consumption in the last week. First, references to ‘alcopops and pre-mixed alcoholic drinks’were replaced with just ‘alcopops’. Second, a question asking about the composition of shandy usuallydrunk was added to the end of the set of questions asking about drinking shandy in the last week. Finally,an additional set of questions was added, asking whether any types of alcohol had been drunk, otherthan the categories already asked about (i.e. alcopops; beer, lager and cider; Martini and sherry; shandy;spirits and liqueurs; and wine). The examples of spirits and liqueurs and alcopops given were updated toreflect those young people were most likely to have drunk or be least likely to be able to classify.These changes are likely to have only a very minor effect on comparability and estimates of alcoholconsumption in the last week for the following reasons.• Where new questions were introduced, these were placed at the end of a section to minimise any effect
on how preceding questions were answered.• Analysis of the quantities of other alcoholic drinks that were reported suggested that the ‘other types of
alcohol’ questions were not completed very reliably. Therefore answers from this additional set ofquestions have not been included in survey estimates of amount of alcohol drunk, and comparabilitywith how these estimates were derived in surveys before 2002 has been retained.
• The questions measuring drinking in the last week are regularly updated to reflect changes in the drinksmarket: ‘alcopops’ was introduced as a new category of drink in 1996 and the list of example brands isupdated annually. Therefore estimates have not been strictly comparable year-on-year.
17 Data from the General Household Survey are reported in Goddard E (2008) Smoking and drinking amongadults, 2006, ONS.
18 Fuller E (2008) Alcohol consumption in Craig R, Mindell J (eds) Health Survey for England 2006. Volume1: Cardiovascular disease and risk factors in adults. The NHS Information Centre, Leeds.http://www.hscic.gov.uk/pubs/HSE06CVDandriskfactors
19 The main changes were as follows:Beer, cider and lager: a large can increased from 1.5 to 2 units, a small can or bottle increased from 1unit to 1.5 units, other measures unchanged. Where pupils report that they usually drink strong ratherthan normal strength beer, the total units drunk as beer, cider or lager is multiplied by 1.5.Shandy: bottle and cans removed from the total, since they are not counted by the GHS or HSE. Wine: a glass increased from 1 unit to 2 units.Martini, sherry: unchanged.Spirits and liqueurs: unchanged.Alcopops: a bottle or can increased from 1 unit to 1.5 units, in line with the GHS.The revised analysis resulted in a higher, probably more accurate, estimate of alcohol consumptionamongst pupils. This did not reflect a sudden change in actual consumption by pupils between 2006 and2007, but it is probable that there have been real but gradual changes in what adults and children drinksince the early 1990s. For further details, see Lynch S (2008) Drinking alcohol in Fuller E (ed) Drug use,smoking and drinking among young people in England in 2007. The NHS Information Centre, Leeds.http://www.hscic.gov.uk/pubs/sdd07fullreport
20 The mean is equivalent to the total amount of alcohol drunk, divided by the number of pupils who drank.The median is the mid point in the range of consumption; half of pupils who drank consumed less than orequal to the median, half consumed equal to or more than the median.
Cop
yrig
ht ©
201
4, H
ealth
and
Soc
ial C
are
Info
rmat
ion
Cen
tre.
All
right
s re
serv
ed.
Smoking, drinking and drug use among young people in England in 2013 75

Copyright © 2014, Health and Social Care Information Centre, Lifestyles Statistics. All rights reserved.
76 Smoking, drinking and drug use among young people in England in 2012
Table 4.1a
Proportion of pupils who had ever had an alcoholic drink, by sex: 1988-2002a
All pupils 1988-2002
Year
1988 1990 1992 1994 1996 1998 1999 2000 2001 2002
% % % % % % % % % %
Boys 65 65 63 62 63 62 62 59 62 62
Girls 59 63 56 60 61 58 59 59 60 60
Total 62 64 60 61 62 60 61 59 61 61
Unweighted bases
Boys 1472 1622 1650 1508 1431 2245 4823 3540 4620 5026
Girls 1523 1466 1608 1510 1387 2356 4568 3313 4622 4711
Total 3021 3088 3263 3018 2818 4607 9391 6853 9242 9737
a Table 4.1b shows trends in drinking prevalence from 2003 to 2013.
Ever had analcoholic drink
Data from 1988 to 2002 re-used with permission of the
Department of Health
Table 4.1b
Proportion of pupils who had ever had an alcoholic drink, by sex: 2003-2013a
All pupils 2003-2013
Year
2003 2004 2005 2006 2007 2008 2009 2010b 2011b 2012b 2013b
% % % % % % % % % % %
Boys 62 59 57 56 54 53 53 46 46 44 39
Girls 61 59 60 55 54 52 50 45 44 42 39
Total 61 59 58 55 54 52 51 45 45 43 39
Unweighted basesb
Boys 5221 4981 4629 3976 4032 3924 3828 3628 3166 3735 2702
Girls 5098 4635 4478 4128 3730 3795 3790 3576 3295 3743 2409
Total 10319 9616 9107 8104 7762 7719 7618 7204 6461 7478 5111
a Table 4.1a shows trends in drinking prevalence from 1988 to 2002.
b Estimates since 2010 are based on weighted data (see Section 1.3.3). 2013 weighted bases are shown in Table4.2.
Ever had analcoholic drink
Data from 2003 re-used with permission of the
Department of Health

Copyright © 2014, Health and Social Care Information Centre, Lifestyles Statistics. All rights reserved.
Smoking, drinking and drug use among young people in England in 2013 77
Table 4.3a
When pupils last drank alcohol, by sex: 1988-2002a
All pupils 1988-2002
Year
1988 1990 1992 1994 1996 1998 1999 2000 2001 2002
% % % % % % % % % %
Boys
During the last week 24 22 24 26 27 23 22 25 28 25
One to four weeks ago 19 15 12 14 15 15 16 13 14 14
One to six months ago 12 13 13 11 12 12 12 11 11 12
More than six months ago 11 15 14 10 9 12 11 11 9 11
Never had a drinkb 35 35 37 39 37 38 38 40 38 38
Girls
During the last week 17 20 17 22 26 18 20 23 25 23
One to four weeks ago 17 14 12 16 13 15 17 15 17 15
One to six months ago 13 13 14 12 13 13 12 11 11 12
More than six months ago 11 15 12 10 10 11 10 10 8 9
Never had a drinkb 41 38 44 40 38 42 41 41 40 40
Total
During the last week 20 21 21 24 27 21 21 24 26 24
One to four weeks ago 18 15 12 15 14 15 16 14 15 14
One to six months ago 12 13 13 11 12 13 12 11 11 12
More than six months ago 11 15 13 10 9 11 11 10 8 10
Never had a drinkb 38 36 41 39 38 40 40 40 39 39
Unweighted bases
Boys 1427 1619 1646 1503 1432 2249 4816 3656 4611 4961
Girls 1518 1456 1606 1506 1391 2362 4558 3409 4621 4669
Total 3015 3082 3252 3009 2823 4609 9374 7065 9232 9630
a Table 4.3b shows trends in drinking prevalence from 2003 to 2013.
b Bases exclude pupils who said they had ever drunk alcohol, but who did not answer the question about whenthey last did so. These bases are different from those used to measure how many pupils have ever drunkalcohol, and so estimates shown in this table for the proportions of pupils who had never drunk alcohol are notdefinitive. (Definitive estimates are given in Tables 4.1a and 4.1b.)
When last drankalcohol
Table 4.2
Ever had an alcoholic drink, by age and sex
All pupils 2013
Age
11 12 13 14 15 Totalyears years years years years
% % % % % %
Boys
Yes 8 18 32 45 72 39
No 92 82 68 55 28 61
Girls
Yes 5 14 30 55 71 39
No 95 86 70 45 29 61
Total
Yes 6 16 31 50 72 39
No 94 84 69 50 28 61
Unweighted bases
Boys 414 535 544 549 660 2702
Girls 394 489 477 471 578 2409
Total 808 1024 1021 1020 1238 5111
Weighted bases
Boys 392 501 506 534 655 2587
Girls 379 493 497 491 662 2522
Total 771 994 1002 1025 1317 5109
Ever had analcoholic drink
Data from 1988 to 2002 re-used with permission of the Department of Health

Copyright © 2014, Health and Social Care Information Centre, Lifestyles Statistics. All rights reserved.
78 Smoking, drinking and drug use among young people in England in 2012
Table 4.3b
When pupils last drank alcohol, by sex: 2003-2013a
All pupils 2003-2013
Year
2003 2004 2005 2006 2007 2008 2009 2010b 2011b 2012b 2013b
% % % % % % % % % % %
Boys
During the last week 26 23 22 21 20 18 19 13 12 11 9
One to four weeks ago 14 14 13 13 12 14 13 12 11 12 10
One to six months ago 12 12 11 11 10 10 11 11 12 11 9
More than six months ago 10 10 10 10 11 9 11 9 10 9 10
Never had a drinkc 38 41 43 46 46 49 47 55 54 58 62
Girls
During the last week 24 23 23 20 20 17 17 13 12 10 9
One to four weeks ago 16 16 15 15 14 14 13 13 12 12 10
One to six months ago 12 11 12 10 11 11 11 10 11 10 12
More than six months ago 9 10 11 9 9 8 9 7 9 8 8
Never had a drinkc 39 41 40 46 47 50 50 57 56 59 61
Total
During the last week 25 23 22 21 20 18 18 13 12 10 9
One to four weeks ago 15 15 14 14 13 14 13 12 11 12 10
One to six months ago 12 11 11 10 10 10 11 10 12 11 11
More than six months ago 10 10 10 9 10 8 10 8 10 9 9
Never had a drinkc 39 41 42 46 47 49 49 56 55 58 61
Unweighted basesb
Boys 5204 4947 4609 3857 4015 3798 3812 3531 3155 3639 2694
Girls 5086 4625 4459 4036 3717 3680 3783 3486 3280 3672 2406
Total 10290 9572 9068 7893 7732 7478 7595 7017 6435 7311 5100
a Table 4.3a shows trends in drinking prevalence from 1988 to 2002.
b Estimates since 2010 are based on weighted data (see Section 1.3.3). 2013 weighted bases are shown in Table 4.4.
c Bases exclude pupils who said they had ever drunk alcohol, but who did not answer the question about when they lastdid so. These bases are different from those used to measure how many pupils have ever drunk alcohol, and soestimates shown in this table for the proportions of pupils who had never drunk alcohol are not definitive. (Definitiveestimates are given in Tables 4.1a and 4.1b.)
When last drankalcohol
Data from 2003 re-used with permission of the Department of Health
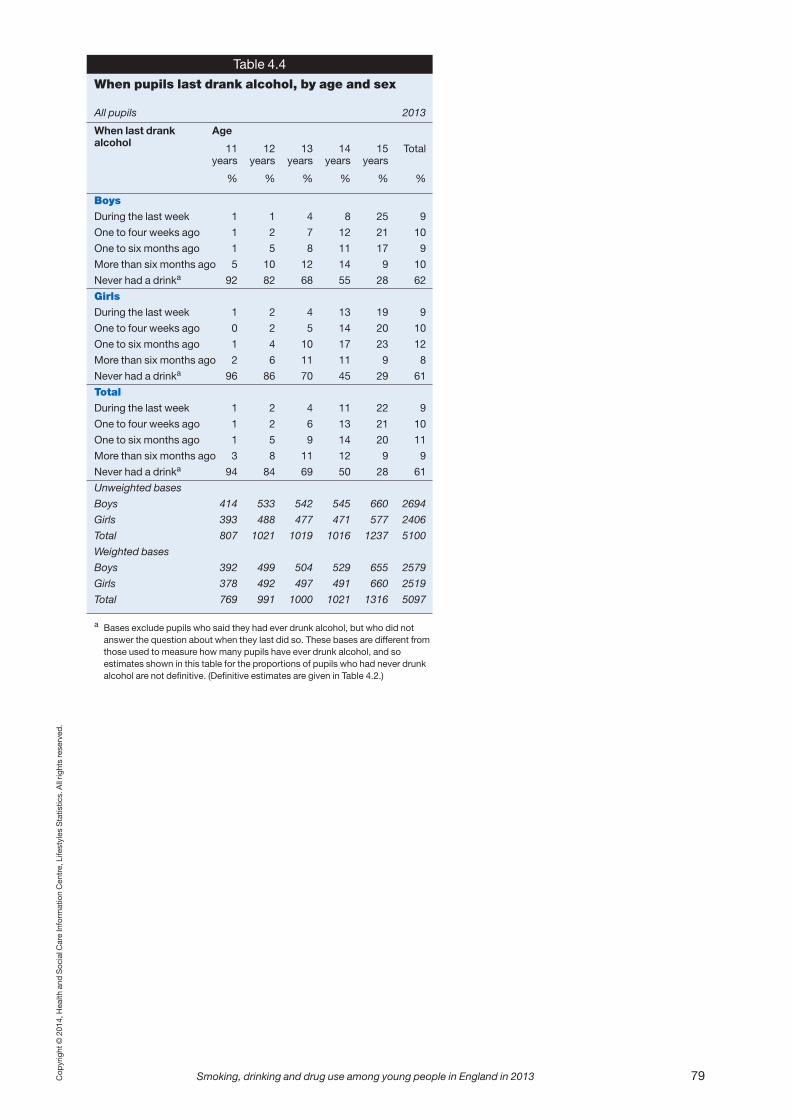
Copyright © 2014, Health and Social Care Information Centre, Lifestyles Statistics. All rights reserved.
Smoking, drinking and drug use among young people in England in 2013 79
Table 4.4
When pupils last drank alcohol, by age and sex
All pupils 2013
Age
11 12 13 14 15 Totalyears years years years years
% % % % % %
Boys
During the last week 1 1 4 8 25 9
One to four weeks ago 1 2 7 12 21 10
One to six months ago 1 5 8 11 17 9
More than six months ago 5 10 12 14 9 10
Never had a drinka 92 82 68 55 28 62
Girls
During the last week 1 2 4 13 19 9
One to four weeks ago 0 2 5 14 20 10
One to six months ago 1 4 10 17 23 12
More than six months ago 2 6 11 11 9 8
Never had a drinka 96 86 70 45 29 61
Total
During the last week 1 2 4 11 22 9
One to four weeks ago 1 2 6 13 21 10
One to six months ago 1 5 9 14 20 11
More than six months ago 3 8 11 12 9 9
Never had a drinka 94 84 69 50 28 61
Unweighted bases
Boys 414 533 542 545 660 2694
Girls 393 488 477 471 577 2406
Total 807 1021 1019 1016 1237 5100
Weighted bases
Boys 392 499 504 529 655 2579
Girls 378 492 497 491 660 2519
Total 769 991 1000 1021 1316 5097
a Bases exclude pupils who said they had ever drunk alcohol, but who did notanswer the question about when they last did so. These bases are different fromthose used to measure how many pupils have ever drunk alcohol, and soestimates shown in this table for the proportions of pupils who had never drunkalcohol are not definitive. (Definitive estimates are given in Table 4.2.)
When last drankalcohol

Copyright © 2014, Health and Social Care Information Centre, Lifestyles Statistics. All rights reserved.
80 Smoking, drinking and drug use among young people in England in 2012
Table 4.5a
Proportion of pupils who drank alcohol in the last week, by sex and age: 1988-2002a
All pupils 1988-2002
Year
1988 1990 1992 1994 1996 1998 1999 2000 2001 2002
% % % % % % % % % %
Boys
11 years 7 8 8 8 7 4 7 5 8 7
12 years 12 9 13 10 12 14 10 11 14 12
13 years 20 17 15 22 27 16 16 18 22 20
14 years 25 32 32 34 37 28 28 34 35 34
15 years 45 42 49 52 50 48 48 51 54 49
Total 24 22 24 26 27 23 22 25 28 25
Girls
11 years 4 4 5 4 6 2 4 5 4 4
12 years 7 6 7 9 9 6 8 9 11 9
13 years 11 19 11 16 22 14 17 19 22 21
14 years 19 32 25 26 35 29 28 31 35 34
15 years 36 39 40 48 55 40 41 45 50 45
Total 17 20 17 22 26 18 20 23 25 23
Total
11 years 5 6 6 6 7 3 6 5 6 5
12 years 9 8 10 9 11 10 9 10 12 11
13 years 16 18 13 19 24 15 16 19 22 20
14 years 22 32 29 30 36 29 28 32 35 34
15 years 40 40 45 50 53 44 45 48 52 47
Total 20 21 21 24 27 21 21 24 26 24
Unweighted bases
Boys
11 years 227 309 284 266 269 285 882 612 814 866
12 years 279 340 335 307 296 336 1017 740 930 1003
13 years 312 312 351 304 275 293 947 737 937 1035
14 years 306 300 310 306 297 597 921 750 898 950
15 years 348 358 366 326 295 745 1049 796 1032 1107
Total 1473 1623 1652 1509 1432 2256 4816 3635 4611 4961
Girls
11 years 225 289 304 231 266 291 881 564 800 798
12 years 312 277 354 304 272 365 896 681 967 978
13 years 296 290 333 326 277 383 925 696 956 935
14 years 311 298 298 309 285 657 933 691 942 946
15 years 374 302 317 341 291 666 923 764 956 1012
Total 1518 1459 1614 1511 1391 2362 4558 3396 4621 4669
Total
11 years 458 598 588 497 535 577 1763 1176 1614 1664
12 years 598 617 690 611 568 702 1913 1421 1897 1981
13 years 613 602 685 630 552 675 1872 1433 1893 1970
14 years 621 598 608 615 582 1254 1854 1441 1840 1896
15 years 725 660 683 667 586 1409 1972 1560 1988 2119
Total 3018 3082 3271 3020 2823 4617 9374 7031 9232 9630
a Table 4.5b shows trends in the proportions of pupils who drank alcohol in the last week from2003 to 2013.
Drankalcohol inlast week
Data from 1988 to 2002 re-used with permission of the Department of Health

Copyright © 2014, Health and Social Care Information Centre, Lifestyles Statistics. All rights reserved.
Smoking, drinking and drug use among young people in England in 2013 81
Table 4.5b
Proportion of pupils who drank alcohol in the last week, by sex and age: 2003-2013a
All pupils 2003-2013
Year
2003 2004 2005 2006 2007 2008 2009 2010b 2011b 2012b 2013b
% % % % % % % % % % %
Boys
11 years 8 5 4 5 4 3 3 2 2 1 1
12 years 12 11 7 8 7 6 7 3 3 3 1
13 years 22 17 18 16 17 15 12 9 7 6 4
14 years 32 32 31 29 26 24 25 15 15 12 8
15 years 49 44 46 40 42 38 39 29 29 25 25
Total 26 23 22 21 20 18 19 13 12 11 9
Girls
11 years 5 3 2 2 2 2 2 1 0 1 1
12 years 9 9 9 7 7 4 4 3 2 1 2
13 years 19 19 18 15 16 13 12 9 7 7 4
14 years 34 33 33 30 30 25 24 16 15 11 13
15 years 48 46 45 41 40 37 37 30 27 26 19
Total 24 23 23 20 20 17 17 13 12 10 9
Total
11 years 6 4 3 3 3 3 3 1 1 1 1
12 years 11 10 8 8 7 5 6 3 2 2 2
13 years 21 18 18 16 17 14 12 9 7 6 4
14 years 33 33 32 29 28 24 25 15 15 12 11
15 years 49 45 46 41 41 38 38 30 28 25 22
Total 25 23 22 21 20 18 18 13 12 10 9
Unweighted basesb
Boys
11 years 894 861 735 600 599 621 598 549 502 552 414
12 years 1052 1024 957 818 873 769 790 743 667 703 533
13 years 1084 1007 977 765 821 756 801 718 605 743 542
14 years 1017 977 938 805 798 756 716 686 620 751 545
15 years 1157 1078 1002 869 924 896 907 835 761 890 660
Total 5204 4947 4609 3857 4015 3798 3812 3531 3155 3639 2694
Girls
11 years 856 820 728 636 589 612 612 564 528 572 393
12 years 1076 923 887 829 739 759 773 703 647 754 488
13 years 1057 941 919 826 790 718 767 713 693 769 477
14 years 983 917 953 767 710 746 758 721 632 732 471
15 years 1114 1024 972 978 889 845 873 785 780 845 577
Total 5086 4625 4459 4036 3717 3680 3783 3486 3280 3672 2406
Total
11 years 1750 1681 1463 1236 1188 1233 1210 1113 1030 1124 807
12 years 2128 1947 1844 1647 1612 1528 1563 1446 1314 1457 1021
13 years 2141 1948 1896 1591 1611 1474 1568 1431 1298 1512 1019
14 years 2000 1894 1891 1572 1508 1502 1474 1407 1252 1483 1016
15 years 2271 2102 1974 1847 1813 1741 1780 1620 1541 1735 1237
Total 10290 9572 9068 7893 7732 7478 7595 7017 6435 7311 5100
a Table 4.5a shows trends in the proportions of pupils who drank alcohol in the last week from 1988 to2002.
b Estimates since 2010 are based on weighted data (see Section 1.3.3). 2013 weighted bases are shownin Table 4.4.
Drankalcohol inlast week
Data from 2003 re-used with permission of the Department of Health

Copyright © 2014, Health and Social Care Information Centre, Lifestyles Statistics. All rights reserved.
82 Smoking, drinking and drug use among young people in England in 2012
Table 4.6a
Usual frequency of drinking alcohol, by sex: 1988-2002a
All pupils 1988-2002
Year
1988 1990 1992 1994 1996 1998 1999 2000 2001 2002
% % % % % % % % % %
Boys
Almost every day 1 1 1 2 2 2 2 2 2 2
About twice a week 7 5 7 7 8 8 7 8 10 8
About once a week 8 8 8 10 12 8 10 9 11 9
At least once a weekb 15 14 16 19 21 18 19 19 22 19
About once a fortnight 10 8 8 7 8 8 8 8 9 8
About once a month 11 10 9 8 8 8 8 8 8 9
Only a few times a year 24 30 28 25 22 24 23 22 22 22
Doesn’t drink nowc 40 39 40 41 41 42 42 44 42 41
Girls
Almost every day 1 1 0 1 2 1 1 1 1 1
About twice a week 3 4 3 5 7 6 6 7 7 6
About once a week 6 7 7 9 10 8 9 9 10 9
At least once a weekb 10 12 10 15 18 14 15 17 18 16
About once a fortnight 9 8 7 10 10 7 9 8 10 9
About once a month 9 10 8 9 9 9 9 9 9 10
Only a few times a year 26 30 27 25 21 23 22 22 20 22
Doesn’t drink nowc 45 40 47 40 42 46 44 45 42 43
Total
Almost every day 1 1 1 1 2 2 1 1 1 1
About twice a week 5 5 5 6 7 7 7 8 8 7
About once a week 7 7 7 10 11 8 9 9 10 9
At least once a weekb 13 13 13 17 20 16 17 18 20 18
About once a fortnight 9 8 7 9 9 7 9 8 9 9
About once a month 10 10 8 9 9 9 8 9 8 9
Only a few times a year 25 30 28 25 21 23 23 22 21 22
Doesn’t drink nowc 43 39 43 41 42 44 43 44 41 42
Unweighted bases
Boys 1472 1622 1650 1509 1431 2245 4823 3540 4620 4988
Girls 1523 1466 1608 1511 1387 2356 4568 3313 4622 4690
Total 3021 3088 3263 3020 2818 4607 9391 6853 9242 9678
a Table 4.6b shows trends in how often pupils usually drink alcohol from 2003 to 2013.
b ‘At least once a week’ is the sum of ‘Almost every day, ‘About twice a week’ and ‘About once a week’.Individual categories may not add to this total due to rounding.
c 'Doesn't drink now' includes pupils who say they don't drink now and those who have never drunk alcohol.
Usual frequency ofdrinking alcohol
Data from 1988 to 2002 re-used with permission of the Department of Health

Copyright © 2014, Health and Social Care Information Centre, Lifestyles Statistics. All rights reserved.
Smoking, drinking and drug use among young people in England in 2013 83
Table 4.6b
Usual frequency of drinking alcohol, by sex: 2003-2013a
All pupils 2003-2013
Year
2003 2004 2005 2006 2007 2008 2009 2010b 2011b 2012b 2013b
% % % % % % % % % % %
Boys
Almost every day 1 2 1 1 1 1 1 1 1 0 0
About twice a week 8 7 7 7 6 5 5 3 2 3 2
About once a week 10 9 9 8 8 7 8 4 5 4 4
At least once a weekc 20 17 17 16 15 14 14 8 8 7 5
About once a fortnight 8 8 8 6 8 7 7 7 6 5 4
About once a month 9 8 8 8 6 8 7 8 6 8 7
Only a few times a year 21 21 20 21 21 20 21 19 22 20 18
Doesn’t drink nowd 45 47 49 50 50 51 51 58 57 61 65
Girls
Almost every day 1 1 1 1 1 1 0 0 0 0 0
About twice a week 7 7 6 6 6 5 4 3 2 3 1
About once a week 10 8 9 8 8 7 6 5 4 4 3
At least once a weekc 17 16 16 15 14 13 10 8 6 6 4
About once a fortnight 10 9 9 8 9 7 8 7 7 7 5
About once a month 9 9 9 8 7 8 9 8 8 7 6
Only a few times a year 22 21 22 20 20 19 20 18 19 18 20
Doesn’t drink nowd 42 45 43 49 50 52 53 59 60 62 65
Total
Almost every day 1 1 1 1 1 1 1 0 0 0 0
About twice a week 8 7 7 6 6 5 5 3 2 2 1
About once a week 10 9 9 8 8 7 7 5 4 4 3
At least once a weekc 19 17 17 15 15 13 12 8 7 6 5
About once a fortnight 9 8 8 7 8 7 8 7 7 6 5
About once a month 9 9 9 8 7 8 8 8 7 8 7
Only a few times a year 22 21 21 20 20 19 20 18 21 19 19
Doesn’t drink nowd 42 45 45 49 50 52 52 59 59 61 65
Unweighted bases
Boys 5198 4950 4612 3845 4005 3811 3814 3539 3157 3655 2690
Girls 5085 4612 4461 4028 3709 3687 3778 3493 3270 3659 2402
Total 10283 9562 9073 7873 7714 7498 7592 7032 6427 7314 5092
a Table 4.6a shows trends in how often pupils usually drink alcohol from 1988 to 2002.
b Estimates since 2010 are based on weighted data (see Section 1.3.3). 2013 weighted bases are shown in Table 4.7.
c ‘At least once a week’ is the sum of ‘Almost every day, ‘About twice a week’ and ‘About once a week’. Individualcategories may not add to this total due to rounding.
d 'Doesn't drink now' includes pupils who say they don't drink now and those who have never drunk alcohol.
Usual frequency ofdrinking alcohol
Data from 2003 re-used with permission of the Department of Health

Copyright © 2014, Health and Social Care Information Centre, Lifestyles Statistics. All rights reserved.
84 Smoking, drinking and drug use among young people in England in 2012
Table 4.7
Usual frequency of drinking alcohol, by age and sex
All pupils 2013
Age
11 12 13 14 15 Totalyears years years years years
% % % % % %
Boys
Almost every day 0 - - 0 0 0
About twice a week - - 0 1 5 2
About once a week 1 1 1 2 10 4
At least once a weeka 1 1 2 4 16 5
About once a fortnight - 0 3 5 11 4
About once a month 0 2 4 7 16 7
Only a few times a year 4 12 21 25 26 18
Doesn’t drink nowb 95 85 71 60 32 65
Girls
Almost every day - - - 0 - 0
About twice a week - 0 0 2 2 1
About once a week 0 0 1 3 8 3
At least once a weeka 0 1 1 6 10 4
About once a fortnight - 1 3 8 11 5
About once a month - 0 3 8 16 6
Only a few times a year 2 9 20 30 30 20
Doesn’t drink nowb 98 89 74 49 33 65
Total
Almost every day 0 - - 0 0 0
About twice a week - 0 0 2 4 1
About once a week 1 0 1 3 9 3
At least once a weeka 1 1 2 5 13 5
About once a fortnight - 1 3 6 11 5
About once a month 0 1 3 7 16 7
Only a few times a year 3 10 20 27 28 19
Doesn’t drink nowb 96 87 72 55 32 65
Unweighted bases
Boys 414 534 542 546 654 2690
Girls 393 488 477 470 574 2402
Total 807 1022 1019 1016 1228 5092
Weighted bases
Boys 392 499 504 531 650 2576
Girls 379 492 497 491 657 2514
Total 770 991 1001 1021 1307 5090
a ‘At least once a week’ is the sum of ‘Almost every day, ‘About twice a week’ and‘About once a week’. Individual categories may not add to this total due torounding.
b ‘Doesn’t drink now’ includes pupils who say they don’t drink now and those whohave never drunk alcohol.
Usual frequencyof drinkingalcohol

Copyright © 2014, Health and Social Care Information Centre, Lifestyles Statistics. All rights reserved.
Smoking, drinking and drug use among young people in England in 2013 85
Table 4.8
Number of drinking days in last week, by sex: 1998-2013
Pupils who drank alcohol in the last week 1998-2013
Year
1998 2000 2002 2004 2006 2008 2009 2010a 2011a 2012a 2013a
% % % % % % % % % % %
Boys
One day 57 69 66 68 57 52 67 57 70 60 74
Two days 21 17 19 17 25 30 21 28 20 24 21
Three days 10 8 8 7 10 10 6 8 6 10 2
Four days 6 3 4 4 3 3 2 3 1 3 1
Five days 2 2 1 2 2 1 1 1 1 1 -
Six days 1 0 1 0 1 0 1 1 - 0 1
Seven days 3 1 1 2 3 3 1 1 2 1 0
Mean number of drinking days 1.9 1.6 1.6 1.6 1.8 1.8 1.6 1.7 1.5 1.7 1.4
Standard error of mean 0.07 0.04 0.03 0.03 0.05 0.05 0.04 0.06 0.07 0.06 0.07
Girls
One day 64 67 65 63 53 58 65 55 68 55 74
Two days 20 22 21 23 30 27 26 29 24 32 17
Three days 10 6 9 8 11 10 6 12 6 8 8
Four days 4 3 3 4 3 3 2 2 1 3 1
Five days 0 1 1 1 1 1 0 0 0 1 0
Six days 1 1 0 1 0 1 - - - 0 -
Seven days 1 0 1 1 1 1 0 1 1 1 -
Mean number of drinking days 1.6 1.5 1.6 1.6 1.7 1.7 1.5 1.7 1.4 1.7 1.4
Standard error of mean 0.05 0.05 0.03 0.03 0.04 0.04 0.03 0.05 0.05 0.07 0.05
Total
One day 60 68 65 65 55 55 66 56 69 58 74
Two days 21 19 20 20 28 29 23 29 22 28 19
Three days 10 7 9 8 11 10 6 10 6 9 5
Four days 5 3 4 4 3 3 2 3 1 3 1
Five days 1 2 1 2 2 1 1 1 1 1 0
Six days 1 0 0 1 0 1 0 0 - 0 0
Seven days 2 1 1 1 2 2 1 1 2 1 0
Mean number of drinking days 1.8 1.5 1.6 1.6 1.8 1.8 1.5 1.7 1.5 1.7 1.4
Standard error of mean 0.05 0.03 0.02 0.03 0.03 0.03 0.03 0.04 0.04 0.05 0.04
Unweighted basesa
Boys 528 905 1243 1110 799 692 704 474 391 386 246
Girls 444 789 1088 1060 825 638 634 462 383 359 200
Total 968 1694 2331 2170 1624 1330 1338 936 774 745 446
a Estimates since 2010 are based on weighted data (see Section 1.3.3). 2013 weighted bases are as follows: (boys)n=237; (girls) n=223; (total) n=460.
Number ofdrinking days
Data from 1998 to 2002 re-used with permission of the Department of Health
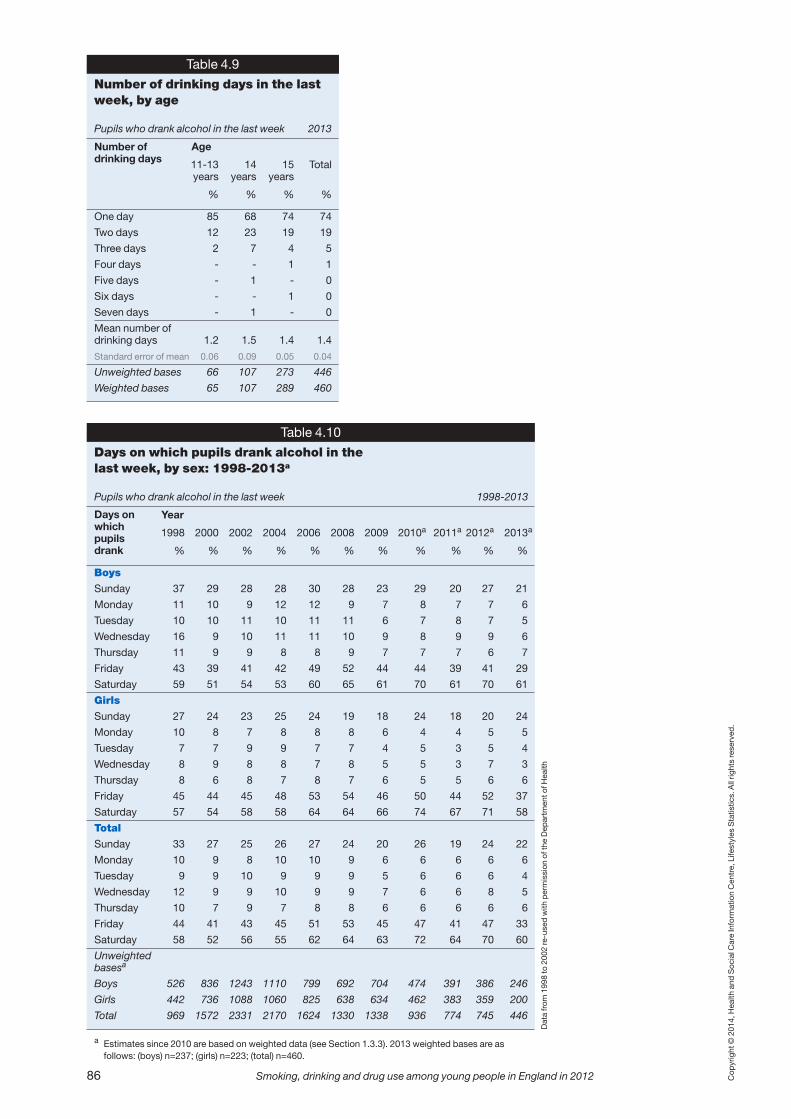
Copyright © 2014, Health and Social Care Information Centre, Lifestyles Statistics. All rights reserved.
86 Smoking, drinking and drug use among young people in England in 2012
Table 4.10
Days on which pupils drank alcohol in the last week, by sex: 1998-2013a
Pupils who drank alcohol in the last week 1998-2013
Year
1998 2000 2002 2004 2006 2008 2009 2010a 2011a 2012a 2013a
% % % % % % % % % % %
Boys
Sunday 37 29 28 28 30 28 23 29 20 27 21
Monday 11 10 9 12 12 9 7 8 7 7 6
Tuesday 10 10 11 10 11 11 6 7 8 7 5
Wednesday 16 9 10 11 11 10 9 8 9 9 6
Thursday 11 9 9 8 8 9 7 7 7 6 7
Friday 43 39 41 42 49 52 44 44 39 41 29
Saturday 59 51 54 53 60 65 61 70 61 70 61
Girls
Sunday 27 24 23 25 24 19 18 24 18 20 24
Monday 10 8 7 8 8 8 6 4 4 5 5
Tuesday 7 7 9 9 7 7 4 5 3 5 4
Wednesday 8 9 8 8 7 8 5 5 3 7 3
Thursday 8 6 8 7 8 7 6 5 5 6 6
Friday 45 44 45 48 53 54 46 50 44 52 37
Saturday 57 54 58 58 64 64 66 74 67 71 58
Total
Sunday 33 27 25 26 27 24 20 26 19 24 22
Monday 10 9 8 10 10 9 6 6 6 6 6
Tuesday 9 9 10 9 9 9 5 6 6 6 4
Wednesday 12 9 9 10 9 9 7 6 6 8 5
Thursday 10 7 9 7 8 8 6 6 6 6 6
Friday 44 41 43 45 51 53 45 47 41 47 33
Saturday 58 52 56 55 62 64 63 72 64 70 60
Unweighted basesa
Boys 526 836 1243 1110 799 692 704 474 391 386 246
Girls 442 736 1088 1060 825 638 634 462 383 359 200
Total 969 1572 2331 2170 1624 1330 1338 936 774 745 446
a Estimates since 2010 are based on weighted data (see Section 1.3.3). 2013 weighted bases are asfollows: (boys) n=237; (girls) n=223; (total) n=460.
Days onwhichpupilsdrank
Table 4.9
Number of drinking days in the lastweek, by age
Pupils who drank alcohol in the last week 2013
Age
11-13 14 15 Totalyears years years
% % % %
One day 85 68 74 74
Two days 12 23 19 19
Three days 2 7 4 5
Four days - - 1 1
Five days - 1 - 0
Six days - - 1 0
Seven days - 1 - 0
Mean number of drinking days 1.2 1.5 1.4 1.4
Standard error of mean 0.06 0.09 0.05 0.04
Unweighted bases 66 107 273 446
Weighted bases 65 107 289 460
Number ofdrinking days
Data from 1998 to 2002 re-used with permission of the Department of Health

Copyright © 2014, Health and Social Care Information Centre, Lifestyles Statistics. All rights reserved.
Smoking, drinking and drug use among young people in England in 2013 87
Table 4.11
Days on which pupils drankalcohol in the last week, by age
Pupils who drank alcohol in the last week 2013
Year
11-13 14 15 Totalyears years years
% % % %
Sunday 18 24 23 22
Monday 7 8 4 6
Tuesday 2 6 4 4
Wednesday 5 7 4 5
Thursday 5 8 6 6
Friday 24 31 36 33
Saturday 56 63 59 60
Unweighted bases 66 107 273 446
Weighted bases 65 107 289 460
Days onwhichpupilsdrankalcohol
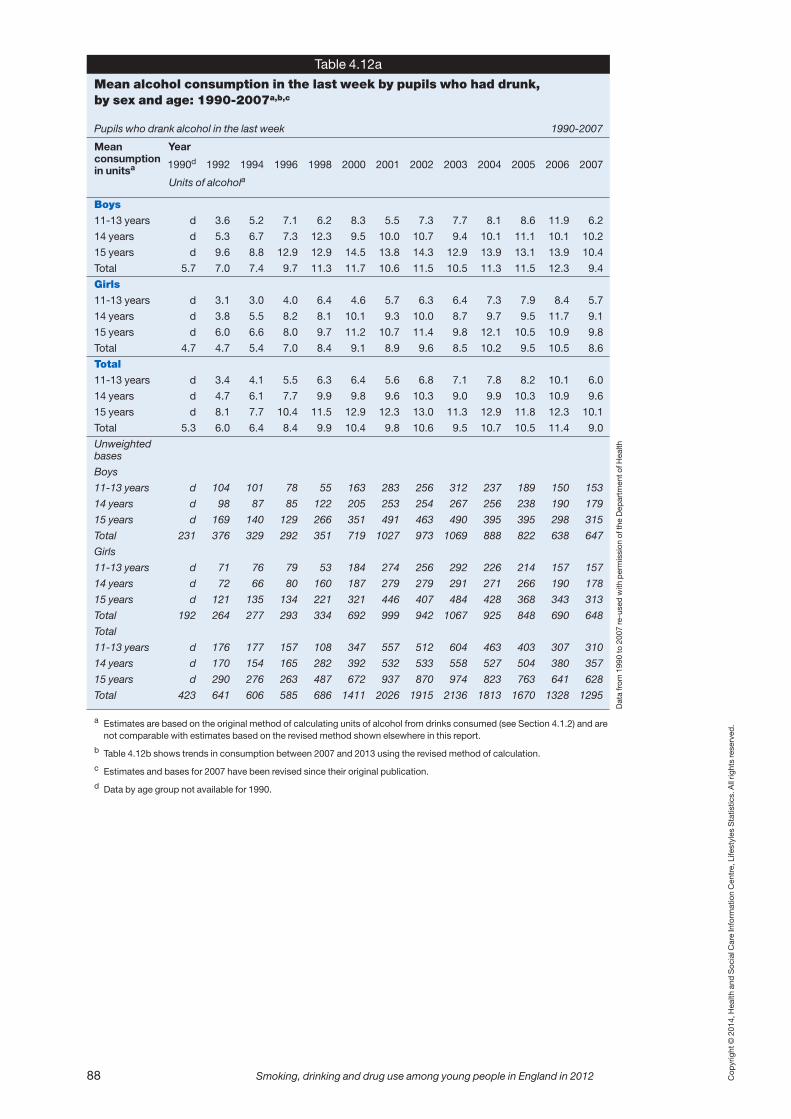
Copyright © 2014, Health and Social Care Information Centre, Lifestyles Statistics. All rights reserved.
88 Smoking, drinking and drug use among young people in England in 2012
Table 4.12a
Mean alcohol consumption in the last week by pupils who had drunk, by sex and age: 1990-2007a,b,c
Pupils who drank alcohol in the last week 1990-2007
Year
1990d 1992 1994 1996 1998 2000 2001 2002 2003 2004 2005 2006 2007
Units of alcohola
Boys
11-13 years d 3.6 5.2 7.1 6.2 8.3 5.5 7.3 7.7 8.1 8.6 11.9 6.2
14 years d 5.3 6.7 7.3 12.3 9.5 10.0 10.7 9.4 10.1 11.1 10.1 10.2
15 years d 9.6 8.8 12.9 12.9 14.5 13.8 14.3 12.9 13.9 13.1 13.9 10.4
Total 5.7 7.0 7.4 9.7 11.3 11.7 10.6 11.5 10.5 11.3 11.5 12.3 9.4
Girls
11-13 years d 3.1 3.0 4.0 6.4 4.6 5.7 6.3 6.4 7.3 7.9 8.4 5.7
14 years d 3.8 5.5 8.2 8.1 10.1 9.3 10.0 8.7 9.7 9.5 11.7 9.1
15 years d 6.0 6.6 8.0 9.7 11.2 10.7 11.4 9.8 12.1 10.5 10.9 9.8
Total 4.7 4.7 5.4 7.0 8.4 9.1 8.9 9.6 8.5 10.2 9.5 10.5 8.6
Total
11-13 years d 3.4 4.1 5.5 6.3 6.4 5.6 6.8 7.1 7.8 8.2 10.1 6.0
14 years d 4.7 6.1 7.7 9.9 9.8 9.6 10.3 9.0 9.9 10.3 10.9 9.6
15 years d 8.1 7.7 10.4 11.5 12.9 12.3 13.0 11.3 12.9 11.8 12.3 10.1
Total 5.3 6.0 6.4 8.4 9.9 10.4 9.8 10.6 9.5 10.7 10.5 11.4 9.0
Unweighted bases
Boys
11-13 years d 104 101 78 55 163 283 256 312 237 189 150 153
14 years d 98 87 85 122 205 253 254 267 256 238 190 179
15 years d 169 140 129 266 351 491 463 490 395 395 298 315
Total 231 376 329 292 351 719 1027 973 1069 888 822 638 647
Girls
11-13 years d 71 76 79 53 184 274 256 292 226 214 157 157
14 years d 72 66 80 160 187 279 279 291 271 266 190 178
15 years d 121 135 134 221 321 446 407 484 428 368 343 313
Total 192 264 277 293 334 692 999 942 1067 925 848 690 648
Total
11-13 years d 176 177 157 108 347 557 512 604 463 403 307 310
14 years d 170 154 165 282 392 532 533 558 527 504 380 357
15 years d 290 276 263 487 672 937 870 974 823 763 641 628
Total 423 641 606 585 686 1411 2026 1915 2136 1813 1670 1328 1295
a Estimates are based on the original method of calculating units of alcohol from drinks consumed (see Section 4.1.2) and arenot comparable with estimates based on the revised method shown elsewhere in this report.
b Table 4.12b shows trends in consumption between 2007 and 2013 using the revised method of calculation.
c Estimates and bases for 2007 have been revised since their original publication.
d Data by age group not available for 1990.
Meanconsumptionin unitsa
Data from 1990 to 2007 re-used with permission of the Department of Health

Copyright © 2014, Health and Social Care Information Centre, Lifestyles Statistics. All rights reserved.
Smoking, drinking and drug use among young people in England in 2013 89
Table 4.12b
Mean alcohol consumption in the last week by pupilswho had drunk, by sex and age (revised method):2007-2013a,b,c,d
Pupils who drank alcohol in the last week 2007-2013
Year
2007 2008 2009 2010d 2011d 2012d 2013d
Units of alcohola
Boys
11-13 years 8.3 10.9 8.2 11.0 7.3 7.6 e
Standard error of mean 0.94 1.48 1.08 2.03 1.72 1.35 e
14 years 13.7 18.0 10.8 11.3 10.8 17.2 [8.7]
Standard error of mean 1.13 1.72 1.1 1.52 1.82 3.08 [2.38]
15 years 14.5 17.4 13.5 13.7 12.5 13.2 9.2
Standard error of mean 0.91 1.11 0.87 0.92 1.21 0.93 1.13
Total 12.8 16.0 11.6 12.6 11.3 13.3 8.4
Standard error of mean 0.59 0.82 0.59 0.84 0.73 0.90 0.95
Girls
11-13 years 8.1 13.4 9.2 13.2 6.2 7.7 e
Standard error of mean 0.94 1.91 1.02 2.18 0.89 1.45 e
14 years 12.8 12.3 10.0 10.8 8.2 15.5 [8.9]
Standard error of mean 0.99 1.15 0.86 1.07 1.04 2.68 [1.33]
15 years 13.9 13.5 12.9 14.2 10.7 11.5 8.1
Standard error of mean 0.72 0.90 0.89 1.13 0.89 1.08 0.89
Total 12.2 13.1 11.3 13.2 9.4 11.7 7.9
Standard error of mean 0.52 1.14 0.57 0.87 0.62 1.11 0.66
Total
11-13 years 8.2 12.0 8.7 12.1 6.8 7.7 [4.3]
Standard error of mean 0.69 1.2 0.73 1.47 1.02 1.01 [0.91]
14 years 13.2 15.1 10.4 11.0 9.4 16.5 8.8
Standard error of mean 0.77 1.02 0.73 0.94 1.08 2.05 1.26
15 years 14.2 15.5 13.2 13.9 11.7 12.3 8.7
Standard error of mean 0.60 0.74 0.61 0.76 0.63 0.72 0.70
Total 12.5 14.6 11.5 12.9 10.4 12.5 8.2
Standard error of mean 0.42 0.57 0.41 0.63 0.48 0.72 0.54
Unweighted basesd
Boys
11-13 years 153 136 125 84 50 51 25
14 years 179 146 136 85 68 80 36
15 years 315 288 283 220 190 182 133
Total 647 570 544 389 308 313 194
Girls
11-13 years 157 111 110 82 47 52 21
14 years 178 157 144 102 73 62 40
15 years 313 279 270 216 176 187 94
Total 648 547 524 400 296 301 155
Total
11-13 years 310 247 235 166 97 103 46
14 years 357 303 280 187 141 142 76
15 years 628 567 553 436 366 369 227
Total 1295 1117 1068 789 604 614 349
a Estimates are based on the revised method of calculating units of alcohol fromdrinks consumed (see Section 4.1.2) and are not comparable with estimatesbased on the original method shown in Table 4.12a.
b Table 4.12a shows trends in alcohol consumption from 1990 to 2007, using theoriginal method of calculation.
c Estimates and bases for 2007 and 2009 have been revised since their originalpublication.
d Estimates since 2010 are based on weighted data (see Section 1.3.3). 2013weighted bases are shown in Table 4.14.
e Estimates for boys and girls aged 11 to 13 not shown because of the very smallbase sizes.
Meanconsumptionin unitsa

Copyright © 2014, Health and Social Care Information Centre, Lifestyles Statistics. All rights reserved.
90 Smoking, drinking and drug use among young people in England in 2012
Table 4.14
Units of alcohol drunk in the last week, by age and sexa
Pupils who drank alcohol in the last week 2013
Age
11-13 14 15 Totalyears years years
% % % %
Boys
Less than 1 unit b [10] 9 11
1 unit, less than 2 units b [16] 11 12
2 units, less than 4 units b [11] 17 18
4 units, less than 6 units b [23] 10 13
6 units, less than 10 units b [15] 17 16
10 units, less than 15 units b [7] 14 11
15 or more units b [17] 22 19
Girls
Less than 1 unit b [7] 8 9
1 unit, less than 2 units b [11] 13 13
2 units, less than 4 units b [21] 15 18
4 units, less than 6 units b [10] 12 11
6 units, less than 10 units b [17] 26 22
10 units, less than 15 units b [10] 10 10
15 or more units b [25] 16 17
Total
Less than 1 unit [21] 8 8 10
1 unit, less than 2 units [13] 13 12 12
2 units, less than 4 units [32] 17 16 18
4 units, less than 6 units [9] 15 11 12
6 units, less than 10 units [15] 16 21 19
10 units, less than 15 units [5] 8 12 11
15 or more units [4] 22 19 18
Unweighted bases
Boys 25 36 133 194
Girls 21 40 94 155
Total 46 76 227 349
Weighted bases
Boys 24 32 131 186
Girls 23 44 108 175
Total 47 76 238 361
a Estimates are based on the revised method of calculating units ofalcohol from drinks consumed (see Section 4.1.2).
b Estimates for boys and girls aged 11 to 13 not shown because ofthe very small base sizes.
Units of alcohol drunkin the last weeka
Table 4.13
Median alcohol consumption in the last week bypupils who had drunk, by sex and age (revisedmethod): 2007-2013a,b,c,d
Pupils who drank alcohol in the last week 2007-2013
Year
2007 2008 2009 2010c 2011c 2012c 2013c
Units of alcohola
Boys
11-13 years 3.5 5.1 4.3 5.5 4.0 5.3 d
14 years 9.0 10.0 5.8 7.7 7.0 8.5 [4.8]
15 years 10.0 12.0 9.0 10.7 8.7 9.0 6.5
Total 7.8 9.8 6.8 8.8 7.5 8.0 4.8
Girls
11-13 years 4.0 6.5 5.8 7.0 4.0 5.5 d
14 years 8.0 7.5 6.5 7.5 6.0 8.0 [6.0]
15 years 9.8 8.0 8.0 9.0 7.3 8.0 6.0
Total 7.9 8.0 7.0 8.0 6.4 7.5 5.3
Total
11-13 years 3.9 5.8 5.0 6.0 4.0 5.3 [2.5]
14 years 8.5 8.5 6.3 7.5 6.0 8.5 5.0
15 years 9.8 10.5 8.5 10.0 8.0 8.0 6.5
Total 7.8 8.5 7.0 8.5 7.0 8.0 5.0
Unweighted basesb,c
Boys
11-13 years 153 136 125 84 50 51 25
14 years 179 146 136 85 68 80 36
15 years 315 288 283 220 190 182 133
Total 647 570 544 389 308 313 194
Girls
11-13 years 157 111 110 82 47 52 21
14 years 178 157 144 102 73 62 40
15 years 313 279 270 216 176 187 94
Total 648 547 524 400 296 301 155
Total
11-13 years 310 247 235 166 97 103 46
14 years 357 303 280 187 141 142 76
15 years 628 567 553 436 366 369 227
Total 1295 1117 1068 789 604 614 349
a Estimates are based on the revised method of calculating units of alcoholfrom drinks consumed.
b Estimates and bases for 2007 and 2009 have been revised since theiroriginal publication.
c Estimates since 2010 are based on weighted data (see Section 1.3.3).2013 weighted bases are shown in Table 4.14.
d Estimates for boys and girls aged 11 to 13 not shown because of the verysmall base sizes.
Medianconsumptionin unitsa
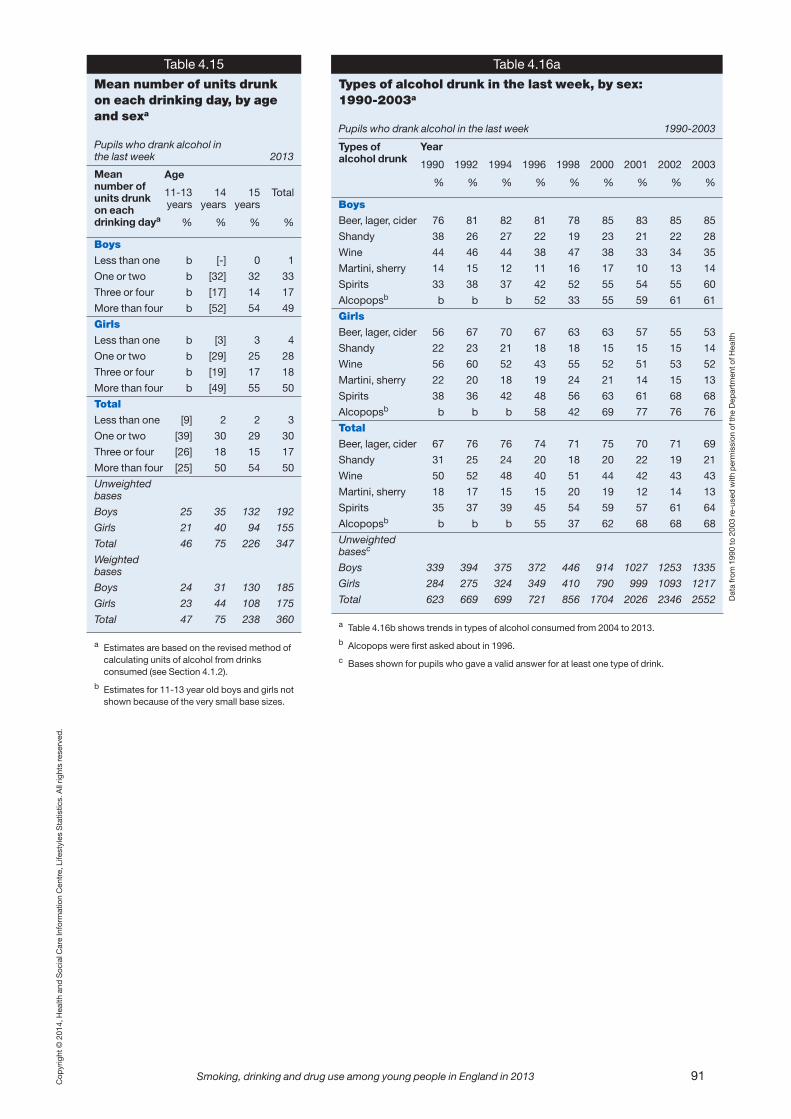
Copyright © 2014, Health and Social Care Information Centre, Lifestyles Statistics. All rights reserved.
Smoking, drinking and drug use among young people in England in 2013 91
Table 4.15
Mean number of units drunk on each drinking day, by ageand sexa
Pupils who drank alcohol in the last week 2013
Age
11-13 14 15 Totalyears years years
% % % %
Boys
Less than one b [-] 0 1
One or two b [32] 32 33
Three or four b [17] 14 17
More than four b [52] 54 49
Girls
Less than one b [3] 3 4
One or two b [29] 25 28
Three or four b [19] 17 18
More than four b [49] 55 50
Total
Less than one [9] 2 2 3
One or two [39] 30 29 30
Three or four [26] 18 15 17
More than four [25] 50 54 50
Unweighted bases
Boys 25 35 132 192
Girls 21 40 94 155
Total 46 75 226 347
Weighted bases
Boys 24 31 130 185
Girls 23 44 108 175
Total 47 75 238 360
a Estimates are based on the revised method ofcalculating units of alcohol from drinksconsumed (see Section 4.1.2).
b Estimates for 11-13 year old boys and girls notshown because of the very small base sizes.
Meannumber ofunits drunkon eachdrinking daya
Table 4.16a
Types of alcohol drunk in the last week, by sex: 1990-2003a
Pupils who drank alcohol in the last week 1990-2003
Year
1990 1992 1994 1996 1998 2000 2001 2002 2003
% % % % % % % % %
Boys
Beer, lager, cider 76 81 82 81 78 85 83 85 85
Shandy 38 26 27 22 19 23 21 22 28
Wine 44 46 44 38 47 38 33 34 35
Martini, sherry 14 15 12 11 16 17 10 13 14
Spirits 33 38 37 42 52 55 54 55 60
Alcopopsb b b b 52 33 55 59 61 61
Girls
Beer, lager, cider 56 67 70 67 63 63 57 55 53
Shandy 22 23 21 18 18 15 15 15 14
Wine 56 60 52 43 55 52 51 53 52
Martini, sherry 22 20 18 19 24 21 14 15 13
Spirits 38 36 42 48 56 63 61 68 68
Alcopopsb b b b 58 42 69 77 76 76
Total
Beer, lager, cider 67 76 76 74 71 75 70 71 69
Shandy 31 25 24 20 18 20 22 19 21
Wine 50 52 48 40 51 44 42 43 43
Martini, sherry 18 17 15 15 20 19 12 14 13
Spirits 35 37 39 45 54 59 57 61 64
Alcopopsb b b b 55 37 62 68 68 68
Unweighted basesc
Boys 339 394 375 372 446 914 1027 1253 1335
Girls 284 275 324 349 410 790 999 1093 1217
Total 623 669 699 721 856 1704 2026 2346 2552
a Table 4.16b shows trends in types of alcohol consumed from 2004 to 2013.
b Alcopops were first asked about in 1996.
c Bases shown for pupils who gave a valid answer for at least one type of drink.
Types ofalcohol drunk
Data from 1990 to 2003 re-used with permission of the Department of Health

Copyright © 2014, Health and Social Care Information Centre, Lifestyles Statistics. All rights reserved.
92 Smoking, drinking and drug use among young people in England in 2012
Table 4.16b
Types of alcohol drunk in the last week, by sex: 2004-2013a
Pupils who drank alcohol in the last week 2004-2013
Year
2004 2005 2006 2007 2008 2009 2010b 2011b 2012b 2013b
% % % % % % % % % %
Boys
Beer, lager, cider 86 89 87 86 88 91 88 91 91 87
Shandy 24 23 22 22 23 25 22 21 21 13
Wine 33 33 30 30 32 25 25 23 24 17
Martini, sherry 14 9 12 9 15 12 9 9 11 6
Spirits 60 59 59 54 60 56 60 58 57 59
Alcopops 57 52 50 49 53 48 46 34 38 37
Girls
Beer, lager, cider 56 56 59 60 55 59 58 61 59 60
Shandy 15 15 13 19 16 16 14 12 13 12
Wine 49 54 47 50 49 46 48 47 46 49
Martini, sherry 12 13 12 11 13 10 12 10 13 8
Spirits 67 71 67 69 73 67 74 73 76 67
Alcopops 73 73 69 70 69 66 63 63 61 47
Total
Beer, lager, cider 71 73 72 74 72 76 73 77 75 74
Shandy 20 19 17 21 19 20 18 17 18 12
Wine 41 43 39 40 40 35 37 34 35 33
Martini, sherry 13 11 12 10 14 11 11 10 12 7
Spirits 63 65 63 61 66 61 67 65 66 63
Alcopops 65 63 60 59 61 56 54 48 49 42
Unweighted basesb,c
Boys 1118 1026 809 823 698 709 476 394 385 248
Girls 1064 1006 827 761 641 639 463 383 356 199
Total 2182 2032 1636 1584 1339 1348 939 777 741 447
a Table 4.16a shows trends in types of alcohol consumed from 1990 to 2003.
b Estimates since 2010 are based on weighted data (see Section 1.3.3). 2013 weighted bases areshown in Table 4.17.
c Bases shown for pupils who gave a valid answer for at least one type of drink.
Types ofalcohol drunk
Table 4.17
Types of alcohol drunk in the lastweek, by age
Pupils who drank alcohol in the last week 2013
Age
11-13 14 15 Totalyears years years
% % % %
Beer, lager, cider 63 68 78 74
Shandy 15 17 10 12
Wine 35 40 30 33
Martini, sherry 11 9 5 7
Spirits 54 66 64 63
Alcopops 39 55 38 42
Unweighted basesa 66 107 274 447
Weighted basesa 65 107 289 461
a Bases shown for pupils who gave a valid answer forat least one type of drink.
Types ofalcoholdrunk

Copyright © 2014, Health and Social Care Information Centre, Lifestyles Statistics. All rights reserved.
Smoking, drinking and drug use among young people in England in 2013 93
Table 4.18a
Mean alcohol consumption of different types of drink in the last week(original method): 1992-2007a,b,c
Pupils who drank alcohol in the last week 1992-2007
Year
1992 1994 1996 1998 2000 2001 2002 2003 2004 2005 2006 2007
Units of alcohola
Beer, lager, cider 3.7 4.0 4.7 5.7 4.7 4.8 4.7 4.0 4.9 4.8 5.4 4.3
Shandy 0.2 0.2 0.2 0.3 0.2 0.2 0.2 0.3 0.3 0.3 0.3 0.3
Wine 1.0 0.9 0.7 1.2 1.0 0.9 1.0 0.9 1.0 1.0 0.9 0.9
Martini, sherry 0.3 0.2 0.2 0.4 0.3 0.2 0.2 0.2 0.2 0.2 0.2 0.1
Spirits 0.8 1.0 1.2 1.4 1.9 1.5 2.1 1.9 2.0 2.2 2.3 1.8
Alcopopsd d d 1.4 1.0 2.3 2.2 2.4 2.3 2.3 2.1 2.2 1.7
Total 6.0 6.4 8.4 9.9 10.4 9.8 10.6 9.5 10.7 10.5 11.4 9.0
Unweighted bases 544 569 585 686 1704 2026 1915 2136 1813 1670 1328 1295
a Estimates are based on the original method of calculating units of alcohol from drinks consumed (see Section 4.1.2)and are not comparable with estimates based on the revised method shown elsewhere in this report.
b Table 4.18b shows shows trends in consumption from 2007 to 2013, using the revised method of calculation.
c Estimates and the base for 2007 have been revised since their original publication.
d Alcopops were first asked about in 1996.
Types ofalcohol
Data from 1992 to 2003 re-used with permission of the Department of Health
Table 4.18b
Mean alcohol consumption of different types of drink in the last week (revised method): 2007-2013a,b,c
Pupils who drank alcohol in the last week 2007-2013
Year
2007 2008 2009 2010d 2011d 2012d 2013d
Units of alcohola
Beer, lager, cider 6.2 7.6 6.1 7.0 5.2 6.9 4.1
Standard error of mean 0.29 0.4 0.31 0.44 0.33 0.51 0.38
Shandy 0.2 0.2 0.1 0.2 0.2 0.1 0.1
Standard error of mean 0.02 0.03 0.02 0.02 0.05 0.02 0.02
Wine 1.7 1.8 1.4 1.4 1.4 1.2 1.2
Standard error of mean 0.12 0.12 0.11 0.12 0.15 0.12 0.13
Martini, sherry 0.1 0.2 0.1 0.1 0.1 0.1 0.1
Standard error of mean 0.02 0.03 0.01 0.03 0.02 0.03 0.05
Spirits 1.8 2.1 1.6 2.1 1.9 2.3 1.6
Standard error of mean 0.08 0.1 0.07 0.12 0.02 0.15 0.12
Alcopops 2.5 2.8 2.2 2.1 1.6 1.8 1.3
Standard error of mean 0.11 0.14 0.12 0.15 0.14 0.17 0.16
Total 12.5 14.6 11.5 12.9 10.4 12.5 8.2
Standard error of mean 0.42 0.57 0.41 0.63 0.48 0.72 0.54
Unweighted basesd 1295 1117 1068 789 604 614 421
a Estimates are based on the revised method of calculating units of alcohol fromdrinks consumed (see Section 4.1.2).
b Table 4.18a shows trends in consumption from 1992 to 2007, using the originalmethod of calculation.
c Estimates and bases for 2007 and 2009 have been revised since their originalpublication.
d Estimates since 2010 are based on weighted data (see Section 1.3.3). 2013weighted bases are shown in Table 4.19.
Types of alcohol

Copyright © 2014, Health and Social Care Information Centre, Lifestyles Statistics. All rights reserved.
94 Smoking, drinking and drug use among young people in England in 2013
Table 4.19
Mean alcohol consumption ofdifferent types of drink in thelast week, by sexa
Pupils who drank alcohol in the last week 2013
Sex
Boys Girls Total
% % %
Beer, lager, cider 5.3 2.4 3.9
Standard error of mean 0.62 0.42 0.38
Shandy 0.1 0.0 0.1
Standard error of mean 0.05 0.01 0.03
Wine 0.5 2.0 1.2
Standard error of mean 0.13 0.27 0.15
Martini, sherry 0.1 0.2 0.1
Standard error of mean 0.04 0.10 0.05
Spirits 1.3 1.7 1.5
Standard error of mean 0.15 0.21 0.13
Alcopops 1.1 1.6 1.3
Standard error of mean 0.27 0.22 0.18
Total 8.4 7.9 8.2
Standard error of mean 0.95 0.66 0.54
Unweighted bases 233 188 421
Weighted bases 224 210 434
a Estimates are based on the revised method ofcalculating units of alcohol from drinks consumed(see Section 4.1.2).
Types of alcohol
Table 4.20
Consumption of different typesof drinks as a percentage of thetotal in the last week, by sexa
Pupils who drank alcohol in the last week 2013
Sex
Boys Girls Total
Percentage of total unitsa
Beer, lager, cider 63 30 47
Shandy 1 1 1
Wine 6 25 15
Martini, sherry 1 3 2
Spirits 16 22 19
Alcopops 13 20 16
Unweighted bases 233 188 421
Weighted bases 224 210 434
a Estimates are based on the revised method ofcalculating units of alcohol from drinks consumed(see Section 4.1.2).
Types of alcohol
Copyright © 2014, Health and Social Care Information Centre. All rights reserved.
Smoking, drinking and drug use among young people in England in 2013 95
5 Smoking, drinking and drug use
Key findings for 2013
� In England in 2013 around 100,000 pupils aged between 11 and 15 were regularsmokers, around 280,000 had drunk alcohol in the past week, around 190,000 hadtaken drugs in the last month, and around 350,000 had taken drugs in the last year.
� 48% of pupils aged between 11 and 15 said that they had tried smoking, drunkalcohol or taken drugs at least once in their lives. 16% had done one or more of theserecently (smoked or drunk alcohol within the last week, or taken drugs within the lastmonth).
� Pupils were more likely to have drunk alcohol in the last week (9%) than to havesmoked in the last week (6%) or to have taken drugs in the last month (also 6%).
� More than half (53%) of pupils thought it was OK for someone of their age to trydrinking alcohol, and about a third (31%) thought that it was OK to try smoking.Pupils were much less likely to approve of drug use: 9% thought it was OK forsomeone to try cannabis, 7% sniffing glue, and just 2% thought that it was OK forsomeone their age to try cocaine.
� Around three in five pupils said that they had received lessons about smoking (61%),drinking alcohol (61%) or drug use (62%) in the last year.
� The majority of pupils think that their school has given them enough informationabout smoking (73%), drinking (70%) and drug use (66%).
� All schools said that they provided pupils with lessons about alcohol and legal andillegal drugs, and almost all (99%) provided lessons about smoking. Between 82%and 98% of schools taught at least one lesson a year to all pupils about each ofthese, although this varied with school year and topic.
5.1 Introduction
In previous chapters of this report, smoking, drinking and different types of drug use havebeen examined independently of one another. This chapter looks at the relationshipsbetween these behaviours by comparing prevalence rates and examining overlaps inpupils’ behaviours. This chapter also examines attitudes towards smoking, drinking anddrug use, and uses data from pupils and teachers to explore how schools teach pupilsabout smoking, drinking alcohol and illicit drug use.
5.2 How many young people smoke, drink or take drugs?
Findings from the survey series describe the behaviour of young people aged 11 to 15 inEngland. The most recent official estimate of the total number of boys and girls in this agegroup in England, for 2012, was just under 3.1 million.1,2 Key survey measures, usuallypresented as percentages, can be used to estimate the numbers of young people whosmoked, drank alcohol or took drugs.
Any population estimates based on survey data should be interpreted with caution; like thepercentages they are based on, they are subject to sampling error. For this reason, they areshown rounded to the nearest 10,000 with 95% confidence intervals, showing the widermargin of error. In practice, the true value is likely to lie within the confidence interval (CI).3
In 2013, the key survey estimates for 11 to 15 year olds in England included the following:• 3% of pupils were regular smokers, equivalent to around 100,000 young people(CI=80,000-120,000)
• 9% had drunk alcohol in the last week, equivalent to around 280,000 young people(CI=250,000-310,000)
• 6% had taken drugs in the last month, equivalent to around 190,000 young people(CI=160,000-210,000).
• 11% had taken drugs (including volatile substances) in the last year, equivalent to around350,000 young people (CI=310,000-380,000)
5.3 The prevalence of smoking, drinking and drug use
5.3.1 Experience of smoking, drinking and drug use
Just under half (48%) of pupils said that they had smoked, drunk alcohol or tried drugs on atleast one occasion. This continues the decline observed since 2005, when two thirds (66%)had smoked, drunk alcohol or taken drugs. (Table 5.1, Figure 5.1)
As in previous years, the proportion of pupils who had ever smoked, drunk alcohol or takendrugs increased with age, from 13% of 11 year olds to 78% of 15 year olds. Pupils weremore likely to report drinking alcohol at least once (39%) than smoking cigarettes (22%) ortaking drugs (16%). Similar proportions of pupils said that they had ever tried cannabis(8%) and volatile substances (also 8%).
The prevalence of any smoking, drinking alcohol and drug use all increased with age. Thesame was true for the use of specific drugs, with the exception of volatile substances,where there was little variation with age. Between the ages of 11 and 13, pupils were morelikely to say that they had sniffed volatile substances than taken cannabis. Similarproportions of 14 year olds reported having tried each drug, but the proportion of 15 yearolds who reported taking cannabis was much higher than the proportion who reportedhaving ever sniffed volatile substances (22% and 9% respectively). (Table 5.2, Figure 5.1)
5.3.2 Recent smoking, drinking and drug use
Around one in six pupils (16%) reported that they had recently smoked cigarettes (in the lastweek), drunk alcohol (in the last week) or taken drugs (in the last month). This confirms thedecline since 2009, when more than a quarter (26%) of pupils had done at least one ofthese. In 2013, as in previous years, the proportions of young people who said that they had
Copyright © 2014, Health and Social Care Information Centre. All rights reserved.
96 Smoking, drinking and drug use among young people in England in 2013

recently smoked, drunk alcohol or taken any drugs increased with age, from 2% of 11 yearolds to 33% of 15 year olds. (Tables 5.3, 5.4, Figure 1)
Pupils were most likely to have reported recent alcohol consumption than recent use ofcigarettes or drugs; 9% said that they had drunk alcohol in the last week, compared with6% who said they had smoked cigarettes in the last week and 6% who said they had useddrugs in the last month. As with overall experience of smoking cigarettes, drinking alcoholand taking drugs, recent experience of each of these increased with age. However, reportedrecent use of volatile substances was similar across all age groups.
5.3.3 Overlaps between behaviours
Smoking cigarettes, drinking alcohol and taking drugs separately pose significant individualhealth risks to young people. Consequently young people who engage in more than one ofthese expose themselves to an increased level of risk overall.4 Findings from previoussurveys in this series suggest that there are strong correlations between smoking, drinkingalcohol and drug use.5
As in previous years, in 2013 there were strong overlaps in smoking, drinking and drugtaking behaviour. Of the 6% of pupils who reported smoking in the last week, most (4% ofall pupils) had also drunk alcohol or taken drugs recently, or had done both. Similarly, 6% ofpupils reported taking drugs in the last month and most of those (4% of all pupils) hadsmoked or drunk alcohol in the last week, or had done both.
The pattern amongst those who had drunk alcohol in the last week was slightly different. Ofthe 9% of pupils who reported drinking alcohol in the last week, less than half (4% of allpupils) had recently smoked cigarettes or taken drugs, or done both. (Table 5.5)
5.4 Attitudes
All pupils were asked whether they thought it was OK for someone of their age to trysmoking, drinking and taking different types of drugs to see what it was like. Pupils werealso asked whether it was OK for someone of their age to do each of these things once aweek.
Attitudes followed a similar pattern to behaviour. Drinking alcohol was seen by pupils asmost acceptable, with just over half (53%) saying it was OK to try drinking alcohol to seewhat it’s like and just over a quarter (26%) saying it was OK to drink alcohol once a week.
Copyright © 2014, Health and Social Care Information Centre. All rights reserved.
Smoking, drinking and drug use among young people in England in 2013 97
Whether pupils had smoked, drunk alcohol or taken drugsAll pupils
Smokedcigarettes
Note: the category 'Took any drugs' includes use of volatile substances, cannabis and Class A drugs.
Drankalcohol
Took anydrugs
Tookcannabis
Sniffed volatilesubstances
Took anyClass A drugs
EverRecently
Figure 5.1
Per
cent
0
10
20
30
40
50
Behaviour

Pupils drew a distinction between drinking and getting drunk. The latter was seen asacceptable as a one-off behaviour by 21% and as a regular behaviour by 8%.
About a third (31%) of pupils thought that it was OK to try smoking to see what it’s like, but amuch smaller proportion (12%) thought it was OK to try smoking once a week. Drug takingwas seen by pupils as the least acceptable behaviour: less than one in ten thought it wasOK for someone to try cannabis (9%), sniffing glue (7%) or taking cocaine (2%) and evensmaller proportions said it was OK to take any of these drugs once a week (cannabis 5%,sniffing glue 3%, cocaine 1%). (Table 5.6, Figure 5.2)
5.5 School teaching about smoking, drinking alcohol and drug use
5.5.1 Pupils’ recall of school lessons and other teaching
All pupils were asked whether they had had any lessons, videos or discussions in class onthe topics of smoking, alcohol and drugs. Around three in five pupils said that they recalledany teaching about each of these topics during the last year: 61% for lessons on smoking,61% for lessons on alcohol, and 62% for lessons about drugs. These proportions weresimilar in previous years. Levels of recall may be influenced not just by whether pupils weregiven such lessons, but also whether they made sufficient impact. The schools thatresponded to the survey reported that most pupils received lessons about tobacco, alcoholand legal and illegal drugs at least once a year (see Section 5.5.3). (Table 5.7)
Less than half of Year 7 pupils recalled lessons about any of these topics. (For most Year 7pupils, the last year included most of their last year at primary school.) Among older pupils,the proportion who recalled lessons or other teaching about smoking varied was lowestamong pupils in Year 8: 57% recalled lessons on smoking, 54% lessons on alcohol and55% lessons on drugs. Recall of lessons on smoking was highest among pupils in Year 9(69%). Recall of teaching about alcohol and drugs was highest in Year 10 (70% and 72%respectively). (Table 5.8)
5.5.2 Do schools give pupils enough information?
Pupils were more likely to think that their schools gave them enough information aboutsmoking (73%), when compared with alcohol (70%) or drugs (66%), though the majority ofpupils thought that their schools gave them enough information about all of these topics.
The proportion of pupils who felt their school gave them enough information about each ofthese increased broadly in line with age. (Table 5.9, Figure 5.3)
Copyright © 2014, Health and Social Care Information Centre. All rights reserved.
98 Smoking, drinking and drug use among young people in England in 2013
Whether pupils think it is OK for someone of their age to smoke, drink alcohol, get drunk or use drugs All pupils
Drink alcoholSmoke Get drunk Take cannabis Sniff glue Take cocaine
OK to try onceOK to do once a week
Figure 5.2
Per
cent
0
10
20
30
40
50
60
Behaviour

5.5.3 What schools teach about tobacco, alcohol and legal and illegal drugs
In each participating school, a teacher or other staff member was asked about lessons andother education and advice provided to pupils about tobacco, alcohol and legal and illegaldrugs. Responses were received from 161 schools, a response rate of 93%. Theconfidence intervals3 associated with a sample of this size are too broad for detailedanalysis.
Almost all schools reported that they provided pupils with lessons about tobacco (99%),and all participating schools said that they provided lessons about alcohol and legal andillegal drugs. (Table 5.10)
There were broadly similar patterns of teaching about each topic across school years: inmost schools pupils were likely to be given lessons about each of these topics in everyschool year at least once (between 82% and 98% depending on the school year and topic).
Around a quarter of schools said that pupils were given lessons about each of these topicsevery term. In Year 7, 25% of pupils had lessons once a term or more often about tobacco,and fewer were taught about alcohol and drugs at least once a term (20% each). In otheryears, the proportion of schools that gave their pupils lessons on each of these topics everyterm varied between 21% (lessons about smoking for Year 11) and 28% (lessons aboutdrugs for Year 10 pupils). (Tables 5.11 to 5.13)
Notes and references
1 http://www.ons.gov.uk/ons/publications/re-reference-tables.html?edition=tcm%3A77-310118
2 This includes young people not in formal education, and therefore not included in the populationsampled by the survey; for example, those being educated at home, as well as pupils in special schools,hospital schools and pupil referral units. The population sample was also based on school year (Years 7to 11) rather than age and included a few pupils younger than 11 or older than 15. For the sake ofsimplicity, in the analysis these pupils have been grouped with pupils aged 11 and 15 respectively.
3 A confidence interval can be calculated around each survey estimate, indicating the range within whichthe true value for the population is likely to fall for a given level of confidence. The 95% confidenceintervals shown here can be defined as the range which has a 95% chance of containing the truepopulation value.
4 British Medical Association (2003) Adolescent Health. BMA, London. http://bma.org.uk/about-the-bma/how-we-work/professional-activities-and-special-interest/board-of-science/board-of-science-publications
5 This survey series has recorded consistently high correlations between smoking cigarettes and cannabis
Copyright © 2014, Health and Social Care Information Centre. All rights reserved.
Smoking, drinking and drug use among young people in England in 2013 99
Whether pupils think their school has given them enough information on smoking, drinking alcohol and drug use, by school year All pupils
Year 7 Year 8 Year 9 Year 10 Year 11
SmokingDrinking alcoholDrug use
Figure 5.3
Per
cent
0
10
20
30
40
50
60
70
80
90
100
School year
use, and the correlation between smoking cigarettes and drinking alcohol and taking cannabis and theuse of Class A drugs were also relatively strong. See for example, Hills A (2007) Smoking, drinking anddrug use in Fuller E (ed) Smoking, drinking and drug use among young people in England 2006. TheInformation Centre, Leeds, available at http://www.hscic.gov.uk/pubs/sdd06fullreport, and Blenkinsop S(2006) Relationships and risks in Fuller E (ed) Drug use, smoking and drinking among young people inEngland in 2005. The Information Centre, Leeds, available athttp://www.hscic.gov.uk/pubs/sdd05fullreport.
Copyright © 2014, Health and Social Care Information Centre. All rights reserved.
100 Smoking, drinking and drug use among young people in England in 2013
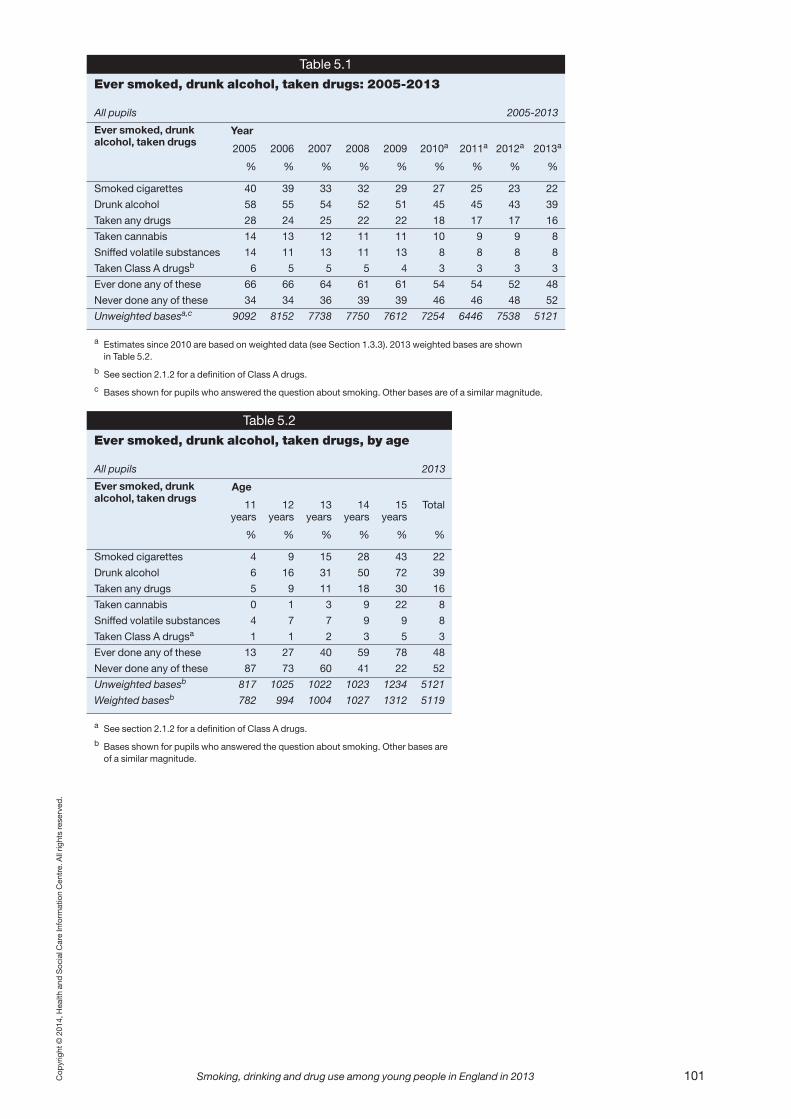
Copyright © 2014, Health and Social Care Information Centre. All rights reserved.
Smoking, drinking and drug use among young people in England in 2013 101
Table 5.1
Ever smoked, drunk alcohol, taken drugs: 2005-2013
All pupils 2005-2013
Year
2005 2006 2007 2008 2009 2010a 2011a 2012a 2013a
% % % % % % % % %
Smoked cigarettes 40 39 33 32 29 27 25 23 22
Drunk alcohol 58 55 54 52 51 45 45 43 39
Taken any drugs 28 24 25 22 22 18 17 17 16
Taken cannabis 14 13 12 11 11 10 9 9 8
Sniffed volatile substances 14 11 13 11 13 8 8 8 8
Taken Class A drugsb 6 5 5 5 4 3 3 3 3
Ever done any of these 66 66 64 61 61 54 54 52 48
Never done any of these 34 34 36 39 39 46 46 48 52
Unweighted basesa,c 9092 8152 7738 7750 7612 7254 6446 7538 5121
a Estimates since 2010 are based on weighted data (see Section 1.3.3). 2013 weighted bases are shown in Table 5.2.
b See section 2.1.2 for a definition of Class A drugs.
c Bases shown for pupils who answered the question about smoking. Other bases are of a similar magnitude.
Ever smoked, drunkalcohol, taken drugs
Table 5.2
Ever smoked, drunk alcohol, taken drugs, by age
All pupils 2013
Age
11 12 13 14 15 Totalyears years years years years
% % % % % %
Smoked cigarettes 4 9 15 28 43 22
Drunk alcohol 6 16 31 50 72 39
Taken any drugs 5 9 11 18 30 16
Taken cannabis 0 1 3 9 22 8
Sniffed volatile substances 4 7 7 9 9 8
Taken Class A drugsa 1 1 2 3 5 3
Ever done any of these 13 27 40 59 78 48
Never done any of these 87 73 60 41 22 52
Unweighted basesb 817 1025 1022 1023 1234 5121
Weighted basesb 782 994 1004 1027 1312 5119
a See section 2.1.2 for a definition of Class A drugs.
b Bases shown for pupils who answered the question about smoking. Other bases areof a similar magnitude.
Ever smoked, drunkalcohol, taken drugs
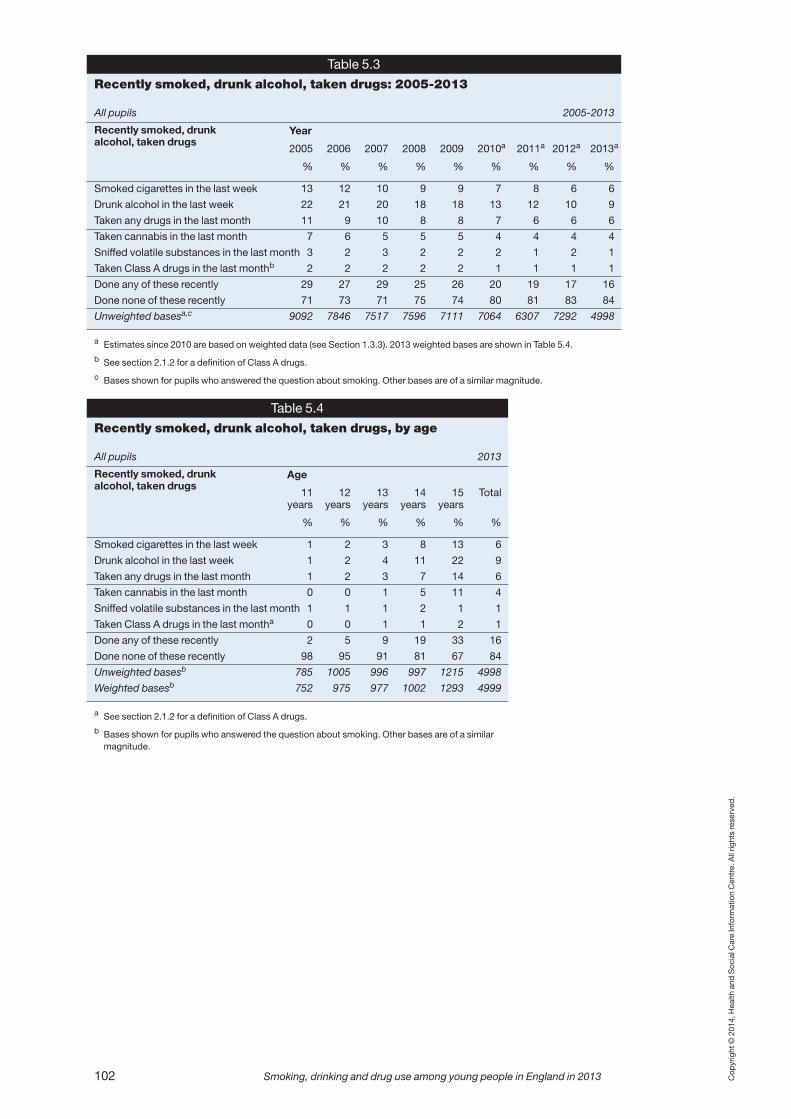
102 Smoking, drinking and drug use among young people in England in 2013 Copyright © 2014, Health and Social Care Information Centre. All rights reserved.
Table 5.4
Recently smoked, drunk alcohol, taken drugs, by age
All pupils 2013
Age
11 12 13 14 15 Totalyears years years years years
% % % % % %
Smoked cigarettes in the last week 1 2 3 8 13 6
Drunk alcohol in the last week 1 2 4 11 22 9
Taken any drugs in the last month 1 2 3 7 14 6
Taken cannabis in the last month 0 0 1 5 11 4
Sniffed volatile substances in the last month 1 1 1 2 1 1
Taken Class A drugs in the last montha 0 0 1 1 2 1
Done any of these recently 2 5 9 19 33 16
Done none of these recently 98 95 91 81 67 84
Unweighted basesb 785 1005 996 997 1215 4998
Weighted basesb 752 975 977 1002 1293 4999
a See section 2.1.2 for a definition of Class A drugs.
b Bases shown for pupils who answered the question about smoking. Other bases are of a similarmagnitude.
Recently smoked, drunkalcohol, taken drugs
Table 5.3
Recently smoked, drunk alcohol, taken drugs: 2005-2013
All pupils 2005-2013
Year
2005 2006 2007 2008 2009 2010a 2011a 2012a 2013a
% % % % % % % % %
Smoked cigarettes in the last week 13 12 10 9 9 7 8 6 6
Drunk alcohol in the last week 22 21 20 18 18 13 12 10 9
Taken any drugs in the last month 11 9 10 8 8 7 6 6 6
Taken cannabis in the last month 7 6 5 5 5 4 4 4 4
Sniffed volatile substances in the last month 3 2 3 2 2 2 1 2 1
Taken Class A drugs in the last monthb 2 2 2 2 2 1 1 1 1
Done any of these recently 29 27 29 25 26 20 19 17 16
Done none of these recently 71 73 71 75 74 80 81 83 84
Unweighted basesa,c 9092 7846 7517 7596 7111 7064 6307 7292 4998
a Estimates since 2010 are based on weighted data (see Section 1.3.3). 2013 weighted bases are shown in Table 5.4.
b See section 2.1.2 for a definition of Class A drugs.
c Bases shown for pupils who answered the question about smoking. Other bases are of a similar magnitude.
Recently smoked, drunkalcohol, taken drugs
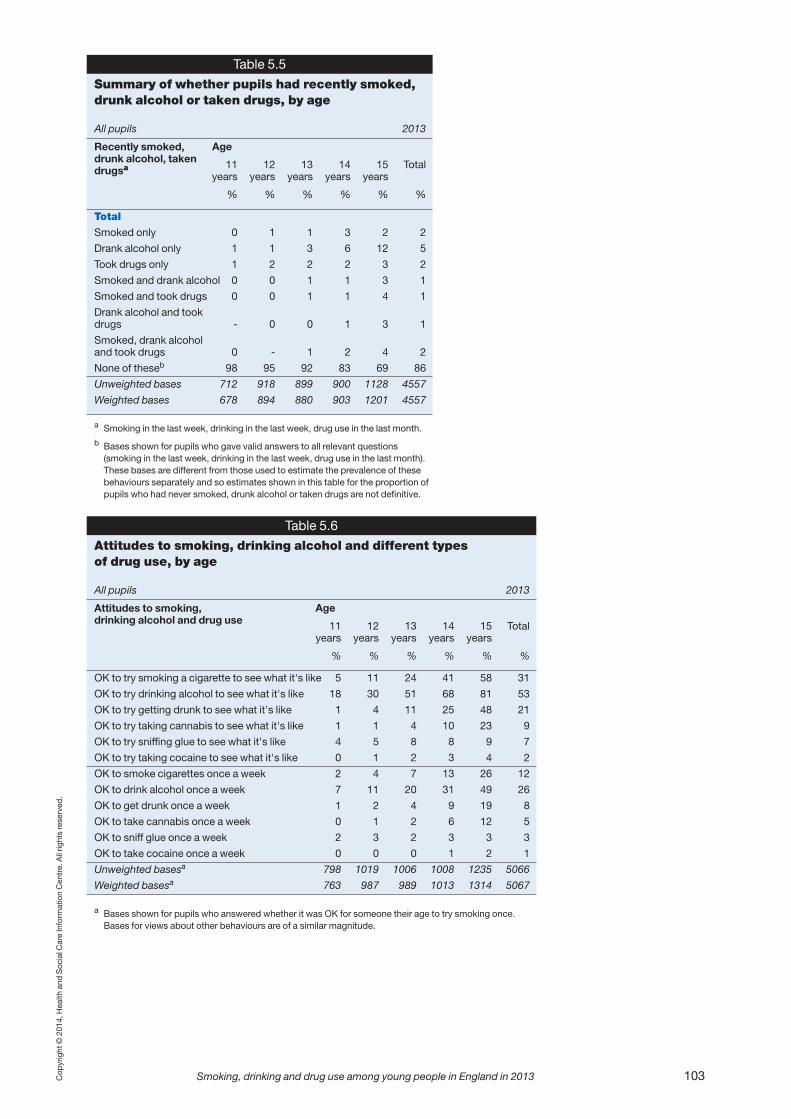
Copyright © 2014, Health and Social Care Information Centre. All rights reserved.
Smoking, drinking and drug use among young people in England in 2013 103
Table 5.5
Summary of whether pupils had recently smoked,drunk alcohol or taken drugs, by age
All pupils 2013
Age
11 12 13 14 15 Totalyears years years years years
% % % % % %
Total
Smoked only 0 1 1 3 2 2
Drank alcohol only 1 1 3 6 12 5
Took drugs only 1 2 2 2 3 2
Smoked and drank alcohol 0 0 1 1 3 1
Smoked and took drugs 0 0 1 1 4 1
Drank alcohol and took drugs - 0 0 1 3 1
Smoked, drank alcohol and took drugs 0 - 1 2 4 2
None of theseb 98 95 92 83 69 86
Unweighted bases 712 918 899 900 1128 4557
Weighted bases 678 894 880 903 1201 4557
a Smoking in the last week, drinking in the last week, drug use in the last month.
b Bases shown for pupils who gave valid answers to all relevant questions(smoking in the last week, drinking in the last week, drug use in the last month).These bases are different from those used to estimate the prevalence of thesebehaviours separately and so estimates shown in this table for the proportion ofpupils who had never smoked, drunk alcohol or taken drugs are not definitive.
Recently smoked,drunk alcohol, takendrugsa
Table 5.6
Attitudes to smoking, drinking alcohol and different types of drug use, by age
All pupils 2013
Age
11 12 13 14 15 Totalyears years years years years
% % % % % %
OK to try smoking a cigarette to see what it's like 5 11 24 41 58 31
OK to try drinking alcohol to see what it's like 18 30 51 68 81 53
OK to try getting drunk to see what it's like 1 4 11 25 48 21
OK to try taking cannabis to see what it's like 1 1 4 10 23 9
OK to try sniffing glue to see what it's like 4 5 8 8 9 7
OK to try taking cocaine to see what it's like 0 1 2 3 4 2
OK to smoke cigarettes once a week 2 4 7 13 26 12
OK to drink alcohol once a week 7 11 20 31 49 26
OK to get drunk once a week 1 2 4 9 19 8
OK to take cannabis once a week 0 1 2 6 12 5
OK to sniff glue once a week 2 3 2 3 3 3
OK to take cocaine once a week 0 0 0 1 2 1
Unweighted basesa 798 1019 1006 1008 1235 5066
Weighted basesa 763 987 989 1013 1314 5067
a Bases shown for pupils who answered whether it was OK for someone their age to try smoking once.Bases for views about other behaviours are of a similar magnitude.
Attitudes to smoking,drinking alcohol and drug use

104 Smoking, drinking and drug use among young people in England in 2013 Copyright © 2014, Health and Social Care Information Centre. All rights reserved.
Table 5.7
Proportion of pupils who recalled receiving lessons about smoking, alcohol or drugs inthe last year: 2003-2013a,b,c
All pupils 2003-2013
Year
2003 2004 2005 2006 2007 2008 2009 2010b 2011b 2012b 2013b
% % % % % % % % % % %
Recalled lessons on smoking 63 65 61 58 59 58 60 61 60 61 61
Recalled lessons on alcoholc 56 52 54 54 58 59 57 60 59 59 61
Recalled lessons on drugsc 61 59 59 58 61 60 59 61 60 60 62
Unweighted basesb,d,e 10097 9437 8810 7833 7542 7566 7383 7006 6276 7252 4912
a Estimates from survey years between 1986 and 2000 can be found in Fuller E and Sanchez M (ed) Smoking, drinking and drug useamong young people in England in 2008, published by the NHS Information Centre.
b Estimates since 2010 are based on weighted data (see Section 1.3.3). 2013 weighted bases are shown in Table 5.8.
c Some estimates and bases between 2000 and 2006 have been revised since their original publication.
d Bases shown for recall of lessons about drugs. Other bases are of a similar magnitude.
Recalled lessons
Table 5.8
Proportion of pupils who recalled receiving lessons aboutsmoking, alcohol or drugs in the last year, by school year
All pupils 2013
School year
Year 7 Year 8 Year 9 Year 10 Year 11 Total
% % % % % %
Recalled lessons about smoking 48 57 69 66 64 61
Recalled lessons about alcohol 44 54 68 70 65 61
Recalled lessons about drugs 42 55 69 72 68 62
Unweighted basesa 949 987 1014 989 973 4912
Weighted basesa 905 956 1002 1010 1039 4912
a Bases shown for recall of lessons about drugs. Other bases are of a similar magnitude.
Recalled lessons
Table 5.9
Proportion of pupils who think that their school has given themenough information about smoking, alcohol or drugs, by schoolyear and sex
All pupils 2013
School year
Year 7 Year 8 Year 9 Year 10 Year 11 Total
% % % % % %
Enough information about smoking 69 70 74 72 76 73
Enough information about alcohol 63 64 71 72 75 70
Enough information about drugs in general 55 62 68 70 73 66
Unweighted basesa 750 852 916 906 907 4331
Weighted basesa 711 818 905 924 969 4327
a Bases shown for the question about smoking. Other bases are of a similar magnitude.
School has given enoughinformation

Copyright © 2014, Health and Social Care Information Centre. All rights reserved.
Smoking, drinking and drug use among young people in England in 2013 105
Table 5.10
Whether school provideslessons about tobacco, alcohol,or legal and illegal drugs
All schools 2013
%
Lessons on tobacco 99
Lessons on alcohol 100
Lessons on legal and illegal drugs 100
Base 159
School provides lessons
Table 5.11
Frequency of lessons about tobacco in eachschool year
All schools 2013
Frequency of lessons
More Once At Never Basesa
than a term leastonce a once aterm year
Year 7 % 9 16 68 7 153
Year 8 % 8 16 69 6 153
Year 9 % 11 14 65 11 150
Year 10 % 9 15 65 11 150
Year 11 % 7 15 61 18 150
a Bases exclude schools with no pupils in that year.
School year
Table 5.12
Frequency of lessons about alcohol in eachschool year
All schools 2013
Frequency of lessons
More Once At Never Basesa
than a term leastonce a once aterm year
Year 7 % 7 13 68 12 152
Year 8 % 11 14 72 2 152
Year 9 % 12 15 67 7 151
Year 10 % 11 15 68 6 151
Year 11 % 8 17 62 13 151
a Bases exclude schools with no pupils in that year.
School year
Table 5.13
Frequency of lessons about legal and illegaldrugs in each school year
All schools 2013
Frequency of lessons
More Once At Never Basesa
than a term leastonce a once aterm year
Year 7 % 7 13 66 14 152
Year 8 % 9 13 74 5 152
Year 9 % 13 15 68 5 151
Year 10 % 11 18 66 6 151
Year 11 % 8 17 63 12 152
a Bases exclude schools with no pupils in that year.
School year

BLANK PAGE
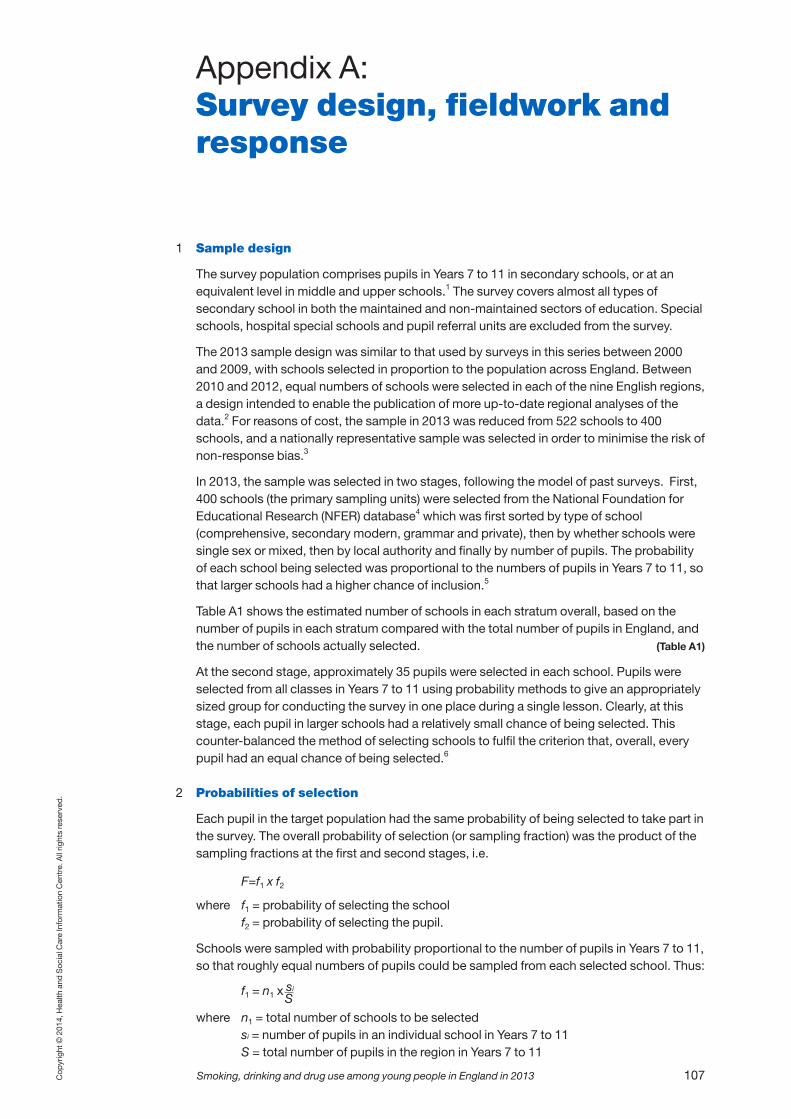
Copyright © 2014, Health and Social Care Information Centre. All rights reserved.
Smoking, drinking and drug use among young people in England in 2013 107
Appendix A:Survey design, fieldwork andresponse
1 Sample design
The survey population comprises pupils in Years 7 to 11 in secondary schools, or at anequivalent level in middle and upper schools.1 The survey covers almost all types ofsecondary school in both the maintained and non-maintained sectors of education. Specialschools, hospital special schools and pupil referral units are excluded from the survey.
The 2013 sample design was similar to that used by surveys in this series between 2000and 2009, with schools selected in proportion to the population across England. Between2010 and 2012, equal numbers of schools were selected in each of the nine English regions,a design intended to enable the publication of more up-to-date regional analyses of thedata.2 For reasons of cost, the sample in 2013 was reduced from 522 schools to 400schools, and a nationally representative sample was selected in order to minimise the risk ofnon-response bias.3
In 2013, the sample was selected in two stages, following the model of past surveys. First,400 schools (the primary sampling units) were selected from the National Foundation forEducational Research (NFER) database4 which was first sorted by type of school(comprehensive, secondary modern, grammar and private), then by whether schools weresingle sex or mixed, then by local authority and finally by number of pupils. The probabilityof each school being selected was proportional to the numbers of pupils in Years 7 to 11, sothat larger schools had a higher chance of inclusion.5
Table A1 shows the estimated number of schools in each stratum overall, based on thenumber of pupils in each stratum compared with the total number of pupils in England, andthe number of schools actually selected. (Table A1)
At the second stage, approximately 35 pupils were selected in each school. Pupils wereselected from all classes in Years 7 to 11 using probability methods to give an appropriatelysized group for conducting the survey in one place during a single lesson. Clearly, at thisstage, each pupil in larger schools had a relatively small chance of being selected. Thiscounter-balanced the method of selecting schools to fulfil the criterion that, overall, everypupil had an equal chance of being selected.6
2 Probabilities of selection
Each pupil in the target population had the same probability of being selected to take part inthe survey. The overall probability of selection (or sampling fraction) was the product of thesampling fractions at the first and second stages, i.e.
where f1 = probability of selecting the schoolf2 = probability of selecting the pupil.
Schools were sampled with probability proportional to the number of pupils in Years 7 to 11,so that roughly equal numbers of pupils could be sampled from each selected school. Thus:
where n1 = total number of schools to be selectedsi = number of pupils in an individual school in Years 7 to 11S = total number of pupils in the region in Years 7 to 11
F=f1 x f2
f1 = n1 x si
S

where n2 = number of pupils to be selected from each school.
Overall, therefore, the sampling fraction for each pupil was:
and thus all pupils had an equal probability of selection.
3 Sampling within selected schools
Within schools, pupils were sampled from school registers. For each school, a samplingfraction was calculated using the information about the school’s population from theJanuary 2012 school census4 to provide a sample of 35 pupils per school. A random start(an integer between 1 and the sampling fraction) was also generated for each school.
Sampling was done in the following way. Registers including all pupils from Years 7 to 11were sorted systematically (pupils alphabetically within class or tutor groups, classes orgroups within school years and school years in order from 7 to 11). The random startidentified the first pupil to be selected, and then every nth pupil was selected, where n wasthe sampling interval. As the pupils were sampled from a different academic year (2013-2014) from the sample of schools (2011-2012), the number of pupils selected varied to theextent to which the size of the school had changed in the interim.
4 Fieldwork procedures
400 schools were approached and invited to take part.7 Schools were sent an initial letterduring the summer term of 2013, explaining that they had been selected to take part in thesurvey and that they would be contacted by NFER or NatCen Social Research at the start ofthe autumn term. This letter also included a form which schools could return indicating theirwillingness to take part. 31 schools returned these forms. In these cases, NFER wrote tothem at the start of the autumn term and the schools’ details were passed directly toNatCen interviewers.
Otherwise, NFER contacted all schools in writing and by telephone from the beginning ofthe autumn term. Schools were invited to take part, and, if they agreed, were asked toprovide an electronic copy of their registers. NFER contacted schools over four weeks inSeptember and all information was passed to NatCen’s interviewers. Schools wereclassified into six types and the following procedures were followed.8
108 Smoking, drinking and drug use among young people in England in 2013 Copyright © 2014, Health and Social Care Information Centre. All rights reserved.
F = (n1 x si) x ( n2 ) = n1 x n2S si S
Type G
Type A
Type B
Type C
Type D
Type E
School returned early assentform
School participating, andelectronic register supplied
School participating andregister supplied but too lateto sample
School participating, but noregister supplied
School notcontacted/decision aboutparticipation not made
School refused
NFER wrote to school at start of term. Interviewers contactedschools and arranged an initial visit to take a manual sampleof pupils
Systematic sample of pupils taken by NFER and details of theselected pupils were passed back to the school and ontointerviewers
Registers sent to interviewers who took manual sample ofpupils
Interviewers contacted schools and arranged an initial visit totake a manual sample of pupils
Interviewers were passed details of any contact with schoolsso that they could contact schools and persuade them to takepart, then interviewers took a manual sample of pupils
Refusals were reissued to interviewers (with reasons forrefusal) for them to contact and persuade schools to changetheir minds and participate, then interviewers took a manualsample of pupils
and f2 = n2si
In all participating schools, once a sample of pupils had been selected, interviewersprovided letters about the survey for pupils to take home and give to their parents orguardians. Parents were asked to reply only if they did not want their child to take part in thesurvey.
Interviewers arranged with schools a convenient time to conduct the survey. The selectedpupils were gathered together in a room for one school period to complete thequestionnaire under the interviewer’s supervision. The interviewer gave a brief introductionexplaining why the survey was being carried out, and explained how the questionnaireshould be filled in. The questionnaire used is reproduced in Appendix C.
Questionnaires were completed in ‘exam conditions’; pupils were not allowed to discussthe questions with each other or look at others’ answers. Pupils could request and receivehelp if they did not understand questions. If possible, teachers were not present during thecompletion of questionnaires in order to encourage pupils to give honest answers. Whereschools insisted on a teacher being present in the room, he or she was not allowed to seepupils’ questionnaires at any stage of the survey. Interviewers stressed that pupils’ answerswould be completely confidential and that their answers would not reflect on them or theirschool. Questionnaires were serial numbered for administrative purposes, but serialnumbers were not linked to pupils’ names.
In participating schools, interviewers also asked a staff member a series of questions abouthow the school taught pupils about smoking, drinking alcohol and illicit drugs (the school-level questionnaire).
5 Achieved response rate and sample size
In total, 174 schools agreed to take part in the survey out of the 399 eligible schools,7 aresponse rate of 44%. The response from selected pupils in participating schools was 88%,yielding a total of 5,187 completed usable questionnaires. The product of the school andpupil rates gave an overall response of 38%.9 (Table A2)
As in previous years, the main reasons given by schools for refusing to participate in thesurvey included:• no available time for pupils to complete the survey; • the burden of participation on staff or pupils; and • a reaction to the large number of school surveys currently being conducted.
At all stages of the recruitment process, NFER and NatCen interviewers reported that it wasmore difficult than in previous years to make contact with an appropriate person;consequently, by the time survey participation had been agreed in principle, there was nosuitable time available to carry the survey out with the selected pupils within the fieldworkperiod (September to December 2013).
Interviewers conducted the survey where possible in a single visit to each school. Allselected pupils completed a questionnaire in exam conditions within one school periodunder the supervision of an interviewer. To maximise pupil response, a second visit to theschool was undertaken if four or more pupils were absent. Follow-up visits were carried outin 42% of schools, and pupils included in this way accounted for 8% of the sample.
Response rates were lower among pupils in higher school years, declining from 90% ofpupils in Years 7 to 9 to 83% in Year 11. This pattern of variation by school year has beenseen in previous surveys in the series. (Tables A4, A5)
161 schools from the 174 productive schools responded to the school-level questionnaire,a response rate of 93%.
Smoking, drinking and drug use among young people in England in 2013 109Copyright © 2014, Health and Social Care Information Centre. All rights reserved.
6 Data cleaning
Questionnaires were sent to an external keying agency to enter the data. The data from eachquestionnaire were scanned. The data thus captured was verified by visual checks of originalquestionnaires.
Within NatCen the data were then subjected to an additional edit check which included thefollowing:• checking that filters were correctly followed• checking ranges on consumption variables and age of first use variables• checking whether answers given as ‘other’ answers could be back-coded into existingcodes
• resolving inconsistencies between answers.
An SPSS dataset was created for analysis purposes.
Notes and references
1 At the time of sampling, almost all these pupils are aged between 11 and 15.
2 In 2010, equal samples were selected from ten Strategic Health Authorities. In 2011 and 2012, the samplewas based on regions that were equivalent to the nine Government Office Regions (GORs). The changewas made in anticipation of the proposed abolition of Strategic Health Authorities (SHAs) outlined in theHealth and Social Care Bill 2011, subsequently enacted in the Health and Social Care Act 2012.http://www.legislation.gov.uk/ukpga/2012/7/contents/enacted/data.htm For the purposes of these surveys, the boundaries of SHAs and GORs were effectively the same, exceptthat the South East region was split into South Central and South East Coast SHAs.
3 A sample of 400 schools divided equally between regions would have included around 44 schools perregion. This sample would have been vulnerable to variation in response between regions, with thepossibility of fewer than 20 productive schools (equivalent to fewer than 600 pupils) in some regions.
4 NFER maintains a database containing records for all schools in England, Northern Ireland, Scotland andWales. It also contains schools in the Isle of Man, the Channel Islands, Service Children’s EducationAuthority (armed forces) schools and British schools around the world. In addition, details are held for allcolleges in the further and higher education sectors and for all universities.
5 Information on school size was based on the Department for Education (DfE) school census data collectedin January 2012.
6 Very small schools, with fewer than 40 eligible pupils, were excluded at this stage.
7 One school was found to be ineligible during fieldwork.
8 In 2005, some schools were issued directly to NatCen interviewers, bypassing any contact by NFER.These schools were designated Type F. The experiment was not a success, and the category Type F hasnot been used since.
9 The school response rate has declined since the 1990s; it fell every year between 2004 and 2010. In 2011,it was at the same level as in 2010, and increased modestly in 2012. In 2013, it fell by 5 percentage points.Falling response appears to be a common problem for school-based surveys. Although each school hasits own reasons for participating or not, the increasing difficulty of persuading schools to take part hasbeen ascribed to increasing curriculum demands on staff and pupils and also the large number of surveys,from a variety of sources, that schools are invited to participate in each year.
110 Smoking, drinking and drug use among young people in England in 2013 Copyright © 2014, Health and Social Care Information Centre. All rights reserved.

Copyright © 2014, Health and Social Care Information Centre, Lifestyles Statistics. All rights reserved.
Smoking, drinking and drug use among young people in England in 2013 111
Table A1
Allocation of primary sampling units(PSUs)a to strata
2013
Type of school Pupil Estimated Actualpopulationb PSUs PSUsc
Comprehensive
Boys 63,176 10.3 10
Girls 102,637 17.4 18
Mixed 1,823,139 320.8 320
Grammar
Boys 33,165 5.5 6
Girls 35,998 5.7 6
Mixed 25,970 4.0 4
Secondary Modern
Boys 2,662 0.4 0
Girls 3,144 0.5 1
Mixed 36,560 5.6 5
Private
Boys 25,637 3.8 4
Girls 46,769 7.1 7
Mixed 125,145 18.7 19
Total 2,324,000 400 400
a The primary sampling units for this survey were individualschools.
b Pupils in Years 7 to 11, based on the Department for Education’spopulation estimates for 2012.
c Small strata have been combined in order to improve theefficiency of the sampling, so estimated and actual PSUs maydiffer.
Table A2i
School and pupil response: 1982-2001
All eligiblea schools and pupils 1982-2001
Survey year
1982 1984 1986 1988 1990 1992 1993 1994 1996 1998 1999 2000 2001
% % % % % % % % % % % % %
School 90 88 84 96 91 97 89 85 87 74 85 72 69
Pupil 94 93 93 91 90 92 90 92 89 90 90 87 89
Overall 87 82 77 87 83 89 80 77 78 70 76 63 61
a Each year, some sampled schools are found to be ineligible during fieldwork; in 2013 one sampled schoolwas ineligible.
Response
Table A2ii
School and pupil response: 2002-2013
All eligiblea schools and pupils 2002-2013
Survey year
2002 2003 2004 2005 2006 2007 2008 2009 2010 2011 2012 2013
% % % % % % % % % % % %
School 72 74 70 68 65 61 58 54 48 48 49 44
Pupil 88 87 89 89 85 87 88 87 87 88 88 88
Overall 63 65 62 60 55 53 51 47 41 42 43 38
a Each year, some sampled schools are found to be ineligible during fieldwork; in 2013 one sampledschool was ineligible.
Response
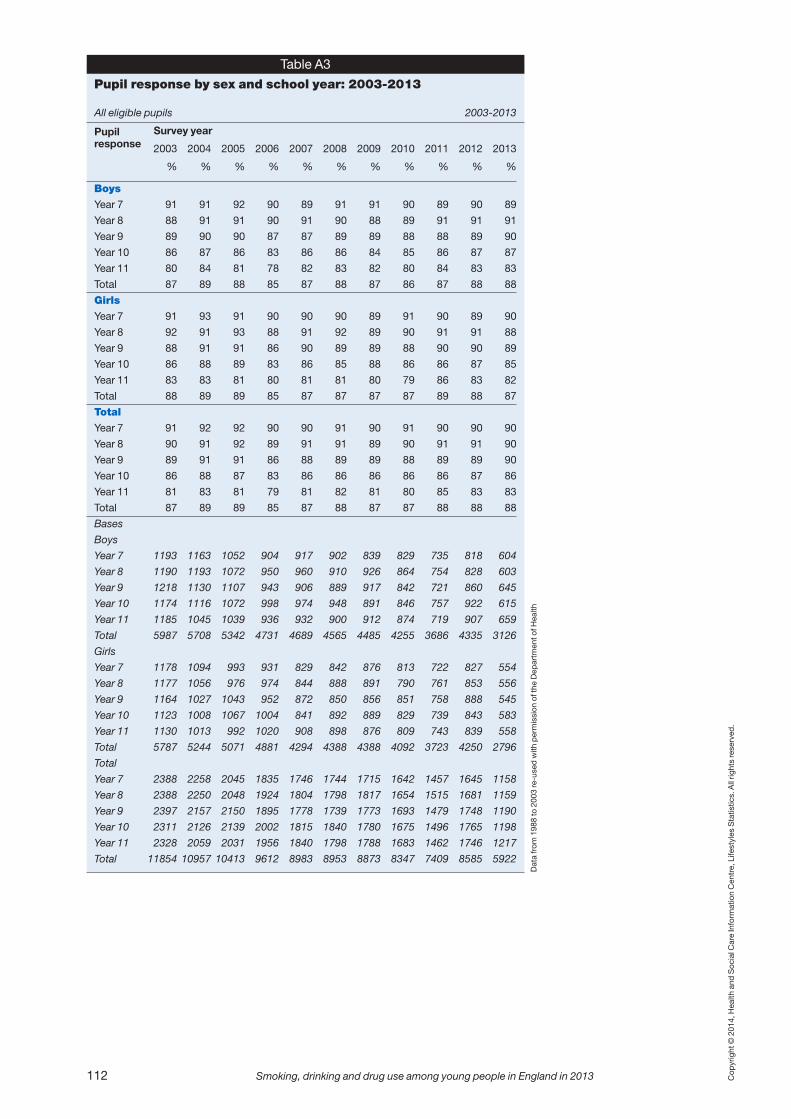
Copyright © 2014, Health and Social Care Information Centre, Lifestyles Statistics. All rights reserved.
112 Smoking, drinking and drug use among young people in England in 2013
Table A3
Pupil response by sex and school year: 2003-2013
All eligible pupils 2003-2013
Survey year
2003 2004 2005 2006 2007 2008 2009 2010 2011 2012 2013
% % % % % % % % % % %
Boys
Year 7 91 91 92 90 89 91 91 90 89 90 89
Year 8 88 91 91 90 91 90 88 89 91 91 91
Year 9 89 90 90 87 87 89 89 88 88 89 90
Year 10 86 87 86 83 86 86 84 85 86 87 87
Year 11 80 84 81 78 82 83 82 80 84 83 83
Total 87 89 88 85 87 88 87 86 87 88 88
Girls
Year 7 91 93 91 90 90 90 89 91 90 89 90
Year 8 92 91 93 88 91 92 89 90 91 91 88
Year 9 88 91 91 86 90 89 89 88 90 90 89
Year 10 86 88 89 83 86 85 88 86 86 87 85
Year 11 83 83 81 80 81 81 80 79 86 83 82
Total 88 89 89 85 87 87 87 87 89 88 87
Total
Year 7 91 92 92 90 90 91 90 91 90 90 90
Year 8 90 91 92 89 91 91 89 90 91 91 90
Year 9 89 91 91 86 88 89 89 88 89 89 90
Year 10 86 88 87 83 86 86 86 86 86 87 86
Year 11 81 83 81 79 81 82 81 80 85 83 83
Total 87 89 89 85 87 88 87 87 88 88 88
Bases
Boys
Year 7 1193 1163 1052 904 917 902 839 829 735 818 604
Year 8 1190 1193 1072 950 960 910 926 864 754 828 603
Year 9 1218 1130 1107 943 906 889 917 842 721 860 645
Year 10 1174 1116 1072 998 974 948 891 846 757 922 615
Year 11 1185 1045 1039 936 932 900 912 874 719 907 659
Total 5987 5708 5342 4731 4689 4565 4485 4255 3686 4335 3126
Girls
Year 7 1178 1094 993 931 829 842 876 813 722 827 554
Year 8 1177 1056 976 974 844 888 891 790 761 853 556
Year 9 1164 1027 1043 952 872 850 856 851 758 888 545
Year 10 1123 1008 1067 1004 841 892 889 829 739 843 583
Year 11 1130 1013 992 1020 908 898 876 809 743 839 558
Total 5787 5244 5071 4881 4294 4388 4388 4092 3723 4250 2796
Total
Year 7 2388 2258 2045 1835 1746 1744 1715 1642 1457 1645 1158
Year 8 2388 2250 2048 1924 1804 1798 1817 1654 1515 1681 1159
Year 9 2397 2157 2150 1895 1778 1739 1773 1693 1479 1748 1190
Year 10 2311 2126 2139 2002 1815 1840 1780 1675 1496 1765 1198
Year 11 2328 2059 2031 1956 1840 1798 1788 1683 1462 1746 1217
Total 11854 10957 10413 9612 8983 8953 8873 8347 7409 8585 5922
Pupilresponse
Data from
1988 to 2003 re-used with permission of the Department of Health
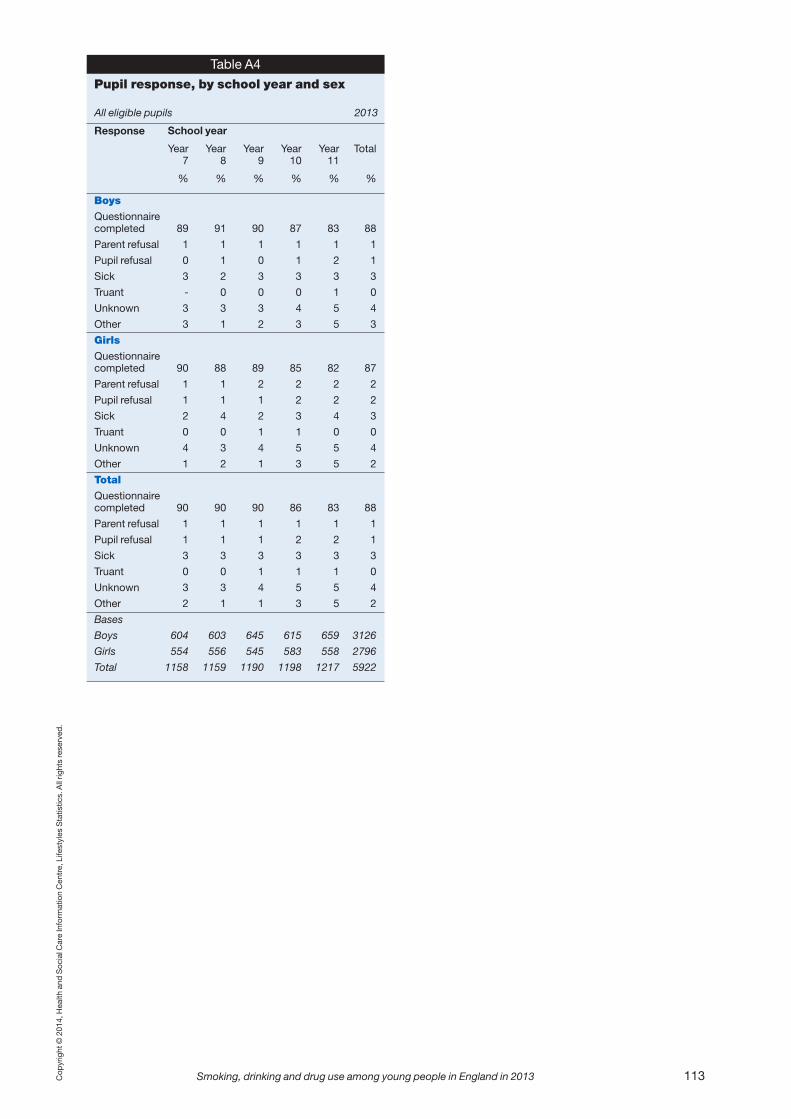
Copyright © 2014, Health and Social Care Information Centre, Lifestyles Statistics. All rights reserved.
Smoking, drinking and drug use among young people in England in 2013 113
Table A4
Pupil response, by school year and sex
All eligible pupils 2013
School year
Year Year Year Year Year Total7 8 9 10 11
% % % % % %
Boys
Questionnaire completed 89 91 90 87 83 88
Parent refusal 1 1 1 1 1 1
Pupil refusal 0 1 0 1 2 1
Sick 3 2 3 3 3 3
Truant - 0 0 0 1 0
Unknown 3 3 3 4 5 4
Other 3 1 2 3 5 3
Girls
Questionnaire completed 90 88 89 85 82 87
Parent refusal 1 1 2 2 2 2
Pupil refusal 1 1 1 2 2 2
Sick 2 4 2 3 4 3
Truant 0 0 1 1 0 0
Unknown 4 3 4 5 5 4
Other 1 2 1 3 5 2
Total
Questionnaire completed 90 90 90 86 83 88
Parent refusal 1 1 1 1 1 1
Pupil refusal 1 1 1 2 2 1
Sick 3 3 3 3 3 3
Truant 0 0 1 1 1 0
Unknown 3 3 4 5 5 4
Other 2 1 1 3 5 2
Bases
Boys 604 603 645 615 659 3126
Girls 554 556 545 583 558 2796
Total 1158 1159 1190 1198 1217 5922
Response

BLANK PAGE

Copyright © 2014, Health and Social Care Information Centre. All rights reserved.
Smoking, drinking and drug use among young people in England in 2013 115
Appendix B:Weighting, analysis methodsand design effects
1 Weighting
In 2013, the sample of schools was selected in proportion to the distribution of populationacross England, so that all pupils across England had equal chances of selection (seeAppendix A). To account for non-response, weights were calculated to ensure that themarginal distribution of pupils’ sex, school year and region matched the school population,based on the 2013 school census.1
Both unweighted and weighted bases are shown in the tables. The unweighted basesrepresent the number of pupils who responded. The absolute size of the weighted baseshas no particular significance, since the weights have been scaled to the achieved samplesize.
2 Population estimates
This report includes estimates of the numbers of young people in England who smokedregularly, drank alcohol in the last week, took drugs in the last year or took drugs in the lastmonth (see Section 5.2). These were based on mid-year estimates of the 2012 populationfor England.2 The estimated population of young people aged between 11 and 15 inEngland in June 2012 was 3,081,900.3
Percentage estimates of prevalence were calculated to one decimal place, and thenmultiplied by the population estimates. 95% confidence intervals were calculated as plus orminus 1.96 times the true standard errors of the estimates, once the effects of clusteringand stratification had been taken into account (see Section 4 of this appendix). Estimates ofthe numbers of young people who smoked, drank or took drugs were rounded to thenearest 10,000.
3 Precision of results
Since the data in this report were obtained from a sample of the population, they are subjectto sampling error. Any sample is only one of an almost infinite number that might have beenselected, all producing slightly different estimates. Sampling error stems from theprobability that any selected sample is not completely representative of the population fromwhich it is drawn.
Sampling error shows the amount by which the value of a sample estimate of a variable canbe expected to differ from the true value of that variable in the population. With a simplerandom sample, the formula for calculating the sampling error for a percentage p, is:
where n is the sample size.
The formula for calculating sampling errors of differences in percentages p1 and p2 betweensurveys (assuming simple random samples) is:
√p(100 – p)n
√p1 (100 – p1) + p2 (100 – p2)n1 n1

In general, attention is drawn to differences between estimates only when they aresignificant at the 95% confidence level. This indicates that there is less than 5% probabilitythat the observed difference is due to random sampling variation rather than a differenceoccurring in the population.
The survey used a multi-stage sample design which involved both clustering within schoolsand stratification (see Appendix A). Consequently, sampling errors are not the same as theywould have been for a simple random sample of the same size, and this needs to be takeninto account when calculating standard errors. Tables B1 to B5 give true standard errorsand 95% confidence intervals for this complex sample design for five key variables.Standard errors and design effects (defts) were calculated using a Taylor Series expansionmethod. (Tables B1-B5)
It is important to recognise that sampling error is only one of the sources of error whichaffect the accuracy of any survey results. Other sources of inaccuracy include non-response bias, as well as over- and under-reporting, both of which are difficult to quantify.Since the results compared in this report are from surveys in the SDD series conducted in asimilar way and using the same methods of collecting information, other types of errorshould be similar on each survey and so will not affect comparisons. However, it is alsopossible that social desirability of these behaviours may affect whether pupils over-report orunder-report, and as social desirability may change over time this may affect comparability.
4 Changes to the survey design and the impact on estimates
As described in Section 1.3.1 and Appendix A, there have been small changes to thesample design of this survey. In 2010, the sample changed from a distribution acrossEngland proportionate to the distribution of the survey population to a sample of equalnumbers of schools in each Strategic Health Authority (SHA). Within each SHA, schoolswere stratified by type of school and sex of intake and 52 schools were selected with aprobability proportionate to size (see Appendix A, Section 1). This sample design was usedfor the 2011 and 2012 surveys. In 2013, in light of the reduced sample size, the sample wasselected proportionate to the distribution of the pupil population across England, as in 2009and previous years.
Before 2010, the survey data were not weighted. From 2010, the data were weighted tocorrect for unequal selection probabilities and the weights were calibrated to match thedistribution of the school population. In 2013, selection weights were not necessary, butcalibration weights were applied to ensure the survey data matched the populationdistribution once non-response had been taken into account (see Section 1).
In 2010, some key survey estimates, while continuing established trends, showed greaterthan expected change from 2009 (for example, estimates of the prevalence of drinkingalcohol and the use of some types of drug).4 Further analysis was undertaken to assesswhether these were due in part or whole to the change in sampling methodology, theapplication of weights to the data or to the fall in the school response rate, which was 48%in 2010, compared with 54% in 2009 (see Appendix A, Section 5). This was described in fullin the 2010 report.5
None of these 2010 analyses indicated any reason to suggest that the changes in theestimates were due to the change in sample design, the consequent weighting or thedifference in response rates. Findings from subsequent years have reinforced thisconclusion.
Similarly there is no evidence to suggest that the change in sampling approach in 2013 hashad any effect on estimates.
116 Smoking, drinking and drug use among young people in England in 2013 Copyright © 2014, Health and Social Care Information Centre. All rights reserved.

Notes and references
1 https://www.gov.uk/government/publications/schools-pupils-and-their-characteristics-january-2013
2 http://www.ons.gov.uk/ons/publications/re-reference-tables.html?edition=tcm%3A77-319259
3 This includes young people not in formal education, and therefore not included in the populationsampled by the survey; for example, those being educated at home, as well as pupils in special schools,hospital schools and pupil referral units. The population sample was also based on school year (Years 7to 11) rather than age and included a few pupils younger than 11 or older than 15. For the sake ofsimplicity, in the analysis these pupils have been grouped with pupils aged 11 and 15 respectively.
4 See Fuller E (ed) (2011) Smoking, drinking and drug use among young people in England in 2010. NHSInformation Centre, Leeds. http://www.hscic.gov.uk/pubs/sdd10fullreport . Of particular concern werechanges to estimates for the prevalence of having drunk alcohol ever and in the last week. Changes inthe prevalence of sniffing volatile substances and taking Class A drugs were also relatively large.
5 See Appendix B of Fuller E (ed) (2011) . Checks included the following:• Evaluation of sample sizes and response rates by school type (schools and pupils)• Evaluation of sample sizes and response rates by SHA (schools and pupils)• Evaluation of the range and variance of weights• Comparison of 2010 key estimates, with no weights applied, with selection weights only and with finalweights.
• Comparison of 2009 and 2010 real standard errors and confidence intervals for key estimates,including subgroups by age and sex
• Comparison of 2009 and 2010 key estimates with and without London SHA/GOR (to explore any‘London effect’)
• Comparison of key estimates using multivariate logistic regression analysis models, including surveyyear and key pupil, school and geographical indicators (sex, age, ethnicity, school type, sex of entry,GOR, index of multiple deprivation and urban/rural area indicator)
• Comparison of 12-15 age group in 2010 with 11-14 age group in 2009; or in alternative termscomparison of n in 2009 and n+1 in 2010 (where 11>n>14).
Smoking, drinking and drug use among young people in England in 2013 117Copyright © 2014, Health and Social Care Information Centre. All rights reserved.
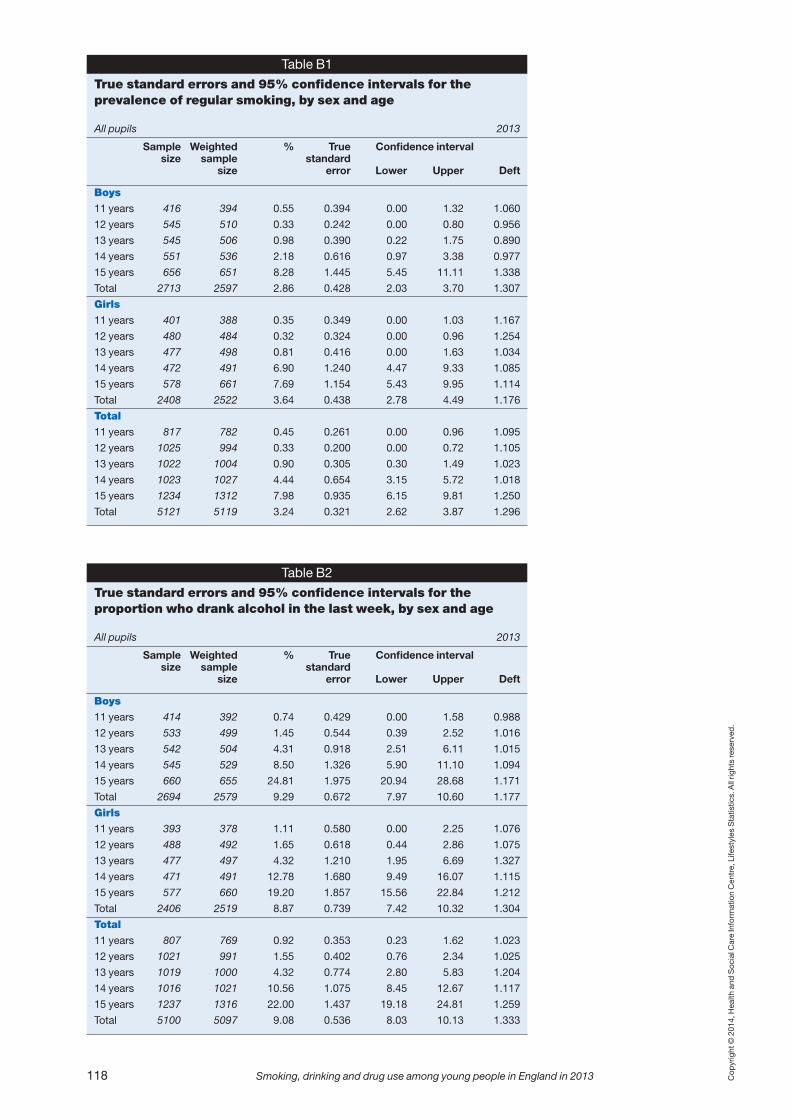
Cop
yright © 2014, Health and
Social C
are Inform
ation Centre, Lifestyles Statistics. All rig
hts reserved
.
118 Smoking, drinking and drug use among young people in England in 2013
Table B1
True standard errors and 95% confidence intervals for theprevalence of regular smoking, by sex and age
All pupils 2013
Sample Weighted % True Confidence intervalsize sample standard
size error Lower Upper Deft
Boys
11 years 416 394 0.55 0.394 0.00 1.32 1.060
12 years 545 510 0.33 0.242 0.00 0.80 0.956
13 years 545 506 0.98 0.390 0.22 1.75 0.890
14 years 551 536 2.18 0.616 0.97 3.38 0.977
15 years 656 651 8.28 1.445 5.45 11.11 1.338
Total 2713 2597 2.86 0.428 2.03 3.70 1.307
Girls
11 years 401 388 0.35 0.349 0.00 1.03 1.167
12 years 480 484 0.32 0.324 0.00 0.96 1.254
13 years 477 498 0.81 0.416 0.00 1.63 1.034
14 years 472 491 6.90 1.240 4.47 9.33 1.085
15 years 578 661 7.69 1.154 5.43 9.95 1.114
Total 2408 2522 3.64 0.438 2.78 4.49 1.176
Total
11 years 817 782 0.45 0.261 0.00 0.96 1.095
12 years 1025 994 0.33 0.200 0.00 0.72 1.105
13 years 1022 1004 0.90 0.305 0.30 1.49 1.023
14 years 1023 1027 4.44 0.654 3.15 5.72 1.018
15 years 1234 1312 7.98 0.935 6.15 9.81 1.250
Total 5121 5119 3.24 0.321 2.62 3.87 1.296
Table B2
True standard errors and 95% confidence intervals for theproportion who drank alcohol in the last week, by sex and age
All pupils 2013
Sample Weighted % True Confidence intervalsize sample standard
size error Lower Upper Deft
Boys
11 years 414 392 0.74 0.429 0.00 1.58 0.988
12 years 533 499 1.45 0.544 0.39 2.52 1.016
13 years 542 504 4.31 0.918 2.51 6.11 1.015
14 years 545 529 8.50 1.326 5.90 11.10 1.094
15 years 660 655 24.81 1.975 20.94 28.68 1.171
Total 2694 2579 9.29 0.672 7.97 10.60 1.177
Girls
11 years 393 378 1.11 0.580 0.00 2.25 1.076
12 years 488 492 1.65 0.618 0.44 2.86 1.075
13 years 477 497 4.32 1.210 1.95 6.69 1.327
14 years 471 491 12.78 1.680 9.49 16.07 1.115
15 years 577 660 19.20 1.857 15.56 22.84 1.212
Total 2406 2519 8.87 0.739 7.42 10.32 1.304
Total
11 years 807 769 0.92 0.353 0.23 1.62 1.023
12 years 1021 991 1.55 0.402 0.76 2.34 1.025
13 years 1019 1000 4.32 0.774 2.80 5.83 1.204
14 years 1016 1021 10.56 1.075 8.45 12.67 1.117
15 years 1237 1316 22.00 1.437 19.18 24.81 1.259
Total 5100 5097 9.08 0.536 8.03 10.13 1.333
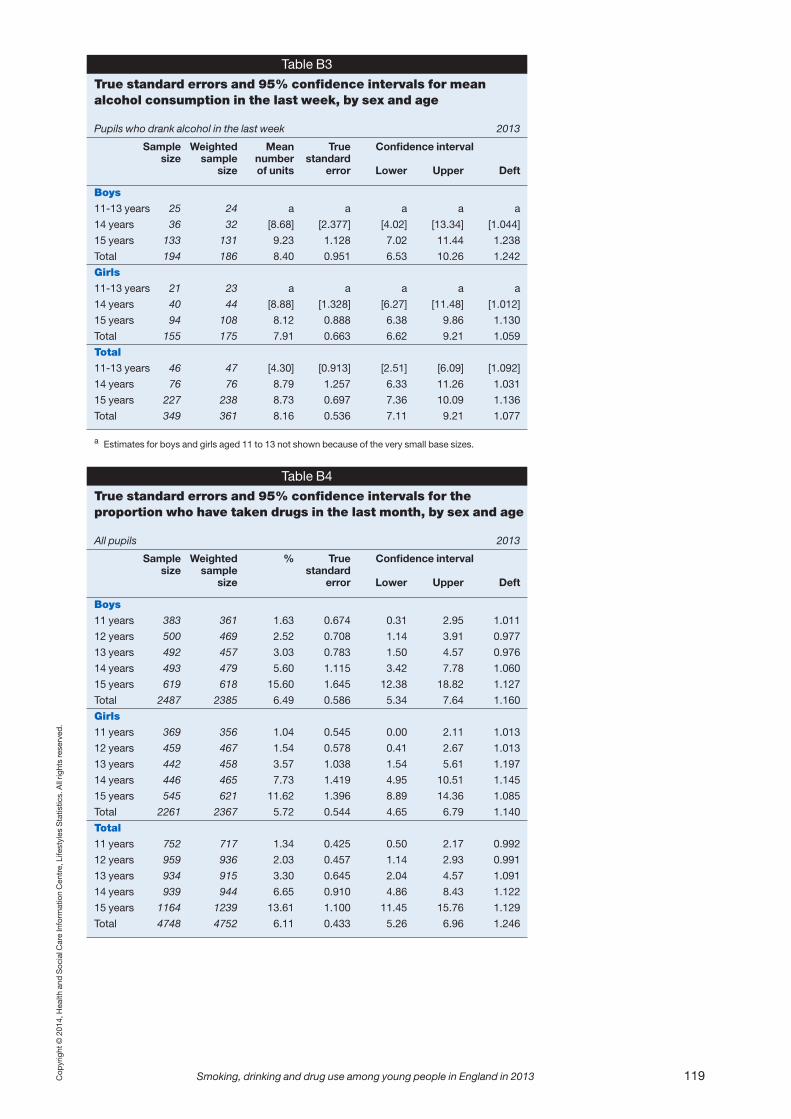
Cop
yright © 2014, Health and
Social C
are Inform
ation Centre, Lifestyles Statistics. All rig
hts reserved
.
Smoking, drinking and drug use among young people in England in 2013 119
Table B3
True standard errors and 95% confidence intervals for meanalcohol consumption in the last week, by sex and age
Pupils who drank alcohol in the last week 2013
Sample Weighted Mean True Confidence intervalsize sample number standard
size of units error Lower Upper Deft
Boys
11-13 years 25 24 a a a a a
14 years 36 32 [8.68] [2.377] [4.02] [13.34] [1.044]
15 years 133 131 9.23 1.128 7.02 11.44 1.238
Total 194 186 8.40 0.951 6.53 10.26 1.242
Girls
11-13 years 21 23 a a a a a
14 years 40 44 [8.88] [1.328] [6.27] [11.48] [1.012]
15 years 94 108 8.12 0.888 6.38 9.86 1.130
Total 155 175 7.91 0.663 6.62 9.21 1.059
Total
11-13 years 46 47 [4.30] [0.913] [2.51] [6.09] [1.092]
14 years 76 76 8.79 1.257 6.33 11.26 1.031
15 years 227 238 8.73 0.697 7.36 10.09 1.136
Total 349 361 8.16 0.536 7.11 9.21 1.077
a Estimates for boys and girls aged 11 to 13 not shown because of the very small base sizes.
Table B4
True standard errors and 95% confidence intervals for theproportion who have taken drugs in the last month, by sex and age
All pupils 2013
Sample Weighted % True Confidence intervalsize sample standard
size error Lower Upper Deft
Boys
11 years 383 361 1.63 0.674 0.31 2.95 1.011
12 years 500 469 2.52 0.708 1.14 3.91 0.977
13 years 492 457 3.03 0.783 1.50 4.57 0.976
14 years 493 479 5.60 1.115 3.42 7.78 1.060
15 years 619 618 15.60 1.645 12.38 18.82 1.127
Total 2487 2385 6.49 0.586 5.34 7.64 1.160
Girls
11 years 369 356 1.04 0.545 0.00 2.11 1.013
12 years 459 467 1.54 0.578 0.41 2.67 1.013
13 years 442 458 3.57 1.038 1.54 5.61 1.197
14 years 446 465 7.73 1.419 4.95 10.51 1.145
15 years 545 621 11.62 1.396 8.89 14.36 1.085
Total 2261 2367 5.72 0.544 4.65 6.79 1.140
Total
11 years 752 717 1.34 0.425 0.50 2.17 0.992
12 years 959 936 2.03 0.457 1.14 2.93 0.991
13 years 934 915 3.30 0.645 2.04 4.57 1.091
14 years 939 944 6.65 0.910 4.86 8.43 1.122
15 years 1164 1239 13.61 1.100 11.45 15.76 1.129
Total 4748 4752 6.11 0.433 5.26 6.96 1.246

Cop
yright © 2014, Health and
Social C
are Inform
ation Centre, Lifestyles Statistics. All rig
hts reserved
.
120 Smoking, drinking and drug use among young people in England in 2013
Table B5
True standard errors and 95% confidence intervals for theproportion who have taken drugs in the last year, by sex and age
All pupils 2013
Sample Weighted % True Confidence intervalsize sample standard
size error Lower Upper Deft
Boys
11 years 383 361 3.56 0.978 1.64 5.47 1.003
12 years 501 470 5.26 0.951 3.39 7.12 0.924
13 years 494 459 6.62 1.220 4.23 9.01 1.050
14 years 497 482 10.69 1.499 7.76 13.63 1.065
15 years 623 622 25.61 1.912 21.86 29.36 1.092
Total 2498 2394 11.64 0.757 10.16 13.13 1.154
Girls
11 years 369 356 2.39 0.779 0.86 3.92 0.961
12 years 462 470 3.59 1.037 1.55 5.62 1.208
13 years 442 458 7.05 1.331 4.44 9.66 1.112
14 years 448 467 14.09 1.758 10.64 17.53 1.092
15 years 550 627 21.87 1.781 18.38 25.36 1.079
Total 2271 2378 10.96 0.715 9.56 12.36 1.116
Total
11 years 752 717 2.98 0.648 1.71 4.25 1.020
12 years 963 940 4.42 0.687 3.07 5.77 1.024
13 years 936 916 6.84 0.874 5.13 8.55 1.048
14 years 945 950 12.36 1.148 10.11 14.61 1.075
15 years 1173 1249 23.73 1.333 21.12 26.34 1.107
Total 4769 4772 11.30 0.558 10.21 12.40 1.216

Cop
yright © 2014, Health and
Social C
are Inform
ation Centre. All rig
hts reserved
.
Smoking, drinking and drug use among young people in England in 2013 121
SN 1
001-
06, C
ard
1007
-08,
Batc
h 10
09-1
3 P1
0500
1014
-15
1018
10
19
Day
(da
te)
of
inte
rvie
w
AM
in
terv
iew
1
1st
visi
t 1
10
16-1
7
Mon
th o
f in
terv
iew
PM
inte
rvie
w2
2nd
vi
sit
2
LA
BEL
SUR
VEY
OF
SMO
KIN
G, D
RIN
KIN
G A
ND
DR
UG
U
SE A
MO
NG
SC
HO
OLC
HIL
DR
EN I
N E
NG
LAN
D
IN 2
01
3
We
prom
ise
that
you
r an
swer
s ar
e co
nfi
den
tial
. Th
ey w
ill n
ot
be s
how
n t
o an
yone
th
at y
ou k
now
Exam
ple
ques
tion
s M
ost
of t
he q
uest
ions
can
be
answ
ered
by
putt
ing
a tic
k in
the
box
nex
t to
the
ans
wer
tha
t ap
plie
s to
yo
u. Y
ou a
re s
omet
imes
tol
d to
ski
p ov
er s
ome
ques
tions
in t
his
surv
ey. W
hen
this
hap
pens
, yo
u w
ill s
ee
an a
rrow
with
a n
ote
that
tel
ls y
ou w
hat
ques
tion
to a
nsw
er n
ext,
like
thi
s:
1
Q
4 Ye
s
2
Q
5 N
o
Or
som
etim
es y
ou h
ave
to w
rite
a nu
mbe
r in
the
box
, for
exa
mpl
e:
14
D
ays
Or
som
etim
es y
ou h
ave
to t
ick
a bo
x an
d w
rite
in a
n an
swer
, for
exa
mpl
e:
So
met
hing
els
e (T
ick
and
writ
e in
)
Chocolate
Appendix C: Questionnaire

122 Smoking, drinking and drug use among young people in England in 2013
Q
1
Are
you
a bo
y or
a g
irl?
10
20
1
Boy
2
Girl
Q2
W
hich
yea
r ar
e yo
u in
at
scho
ol?
10
21
1
Year
7
2
Year
8
3
Year
9
4
Year
10
5
Year
11
Q3
H
ow o
ld a
re y
ou n
ow?
10
22-2
3
01
10
yea
rs o
ld
02
11
yea
rs o
ld
03
12
yea
rs o
ld
04
13
yea
rs o
ld
05
14
yea
rs o
ld
06
15
yea
rs o
ld
07
16
yea
rs o
ld
08
17
yea
rs o
ld
Q4
W
hich
yea
r w
ere
you
born
in?
(Ple
ase
wri
te in
fu
ll, e
g 19
97)
10
24-2
7
Q5
W
hich
mon
th w
ere
you
born
in?
(P
leas
e w
rite
in f
ull,
eg
Janu
ary)
1028
-102
9
Cop
yright © 2014, Health and
Social C
are Inform
ation Centre. All rig
hts reserved
.

Smoking, drinking and drug use among young people in England in 2013 123
Q7
Th
e ne
xt q
uest
ions
are
abo
ut c
igar
ette
s. R
emem
ber
that
you
r na
me
is n
ot o
n th
e qu
estio
nnai
re, s
o no
-one
who
kno
ws
you
will
fin
d ou
t yo
ur a
nsw
ers.
Q8
D
o yo
u sm
oke
ciga
rett
es a
t al
l now
aday
s?
10
32
1
Yes
2
No
Q9
N
ow r
ead
the
follo
win
g st
atem
ents
car
eful
ly a
nd t
ick
the
box
next
to
the
one
whi
ch b
est
desc
ribes
you
.
10
33
1
Q1
0
I
have
nev
er s
mok
ed
2
Q1
1
I
have
onl
y ev
er t
ried
smok
ing
once
3
Q1
1
I
used
to
smok
e so
met
imes
but
I n
ever
sm
oke
a ci
gare
tte
now
4
Q1
1
I
som
etim
es s
mok
e ci
gare
ttes
now
but
I d
on’t
smok
e as
man
y as
on
e a
wee
k
5
Q1
1
I
usua
lly s
mok
e be
twee
n on
e an
d si
x ci
gare
ttes
a w
eek
6
Q1
1
I
usua
lly s
mok
e m
ore
than
six
cig
aret
tes
a w
eek
Q1
0
Just
to
chec
k, r
ead
the
stat
emen
ts b
elow
car
eful
ly a
nd t
ick
the
box
next
to
the
one
whi
ch b
est
desc
ribes
you
.
10
34
1
Q12
on
pag
e 6
I
have
nev
er t
ried
smok
ing
a ci
gare
tte,
not
eve
n a
puff
or
two
2
Q1
1
I
did
once
hav
e a
puff
or
two
of a
cig
aret
te, b
ut I
nev
er s
mok
e no
w
3
Q1
1
I
do s
omet
imes
sm
oke
ciga
rett
es
Q1
1
How
old
wer
e yo
u w
hen
you
first
trie
d sm
okin
g a
ciga
rett
e, e
ven
if it
was
onl
y a
puff
or
two?
W
rite
in t
he
box
your
age
th
en, i
n nu
mbe
rs n
ot w
ords
.
10
35-3
6
ye
ars
old
I
was
Q6
Wha
t is
your
eth
nic
grou
p?
10
30-3
1
01
W
hite
Brit
ish
02
W
hite
Iris
h
03
An
y ot
her W
hite
bac
kgro
und
(ple
ase
wri
te in
)
04
W
hite
and
Bla
ck C
arib
bean
05
W
hite
and
Bla
ck A
fric
an
06
W
hite
and
Asia
n
07
An
y ot
her M
ixed
bac
kgro
und
(ple
ase
wri
te in
)
08
In
dian
09
Pa
kist
ani
10
Ba
ngla
desh
i
11
An
y ot
her A
sian
back
grou
nd (
plea
se w
rite
in)
12
Ca
ribbe
an
13
Af
rican
14
An
y ot
her B
lack
bac
kgro
und
(ple
ase
wri
te in
)
15
Ch
ines
e
16
An
y ot
her e
thni
c gr
oup
(ple
ase
wri
te in
)
Cop
yright © 2014, Health and
Social C
are Inform
ation Centre. All rig
hts reserved
.

124 Smoking, drinking and drug use among young people in England in 2013
Q1
7
On
whi
ch o
f th
ese
days
dur
ing
the
last
sev
en d
ays
did
you
have
an
alco
holic
drin
k?
Tick
all
that
app
ly
10
42-5
5
01
Su
nday
02
M
onda
y
03
Tu
esda
y
04
W
edne
sday
05
Th
ursd
ay
06
Fr
iday
07
Sa
turd
ay
Q1
8
Dur
ing
the
last
7 d
ays,
how
muc
h BE
ER, L
AGER
AN
D C
IDER
ha
ve y
ou d
runk
? Pl
ease
don
’t in
clud
e dr
inks
labe
lled
low
alc
ohol
.
10
56
1
Q1
9
H
alf
a pi
nt o
r m
ore
2
Q21
on
pag
e 8
Le
ss t
han
half
a pi
nt
3
Q21
on
pag
e 8
H
ave
not
drun
k be
er, l
ager
or
cide
r in
the
last
7 d
ays
Q1
9
Writ
e in
the
box
es b
elow
the
num
ber
of p
ints
, hal
f pi
nts,
la
rge
cans
, sm
all c
ans
and
bott
les
of B
EER, L
AGER
AN
D
CID
ER d
runk
in t
he la
st 7
day
s.
1057
-58
pint
s
1059
-60
half
pint
s
1061
-62
la
rge
cans
1063
-64
smal
l can
s
1065
-66
bo
ttle
s
Q1
2
The
next
que
stio
ns a
re a
bout
alc
ohol
. Rem
embe
r th
at y
our
nam
e is
not
on
the
ques
tionn
aire
, so
no-o
ne w
ho k
now
s yo
u w
ill
find
out
your
ans
wer
s.
Q1
3
Hav
e yo
u ev
er h
ad a
pro
per
alco
holic
drin
k –
a w
hole
drin
k, n
ot
just
a s
ip?
Ple
ase
don
’t c
oun
t dr
inks
labe
lled
low
alc
ohol
.
10
37
1
Q1
4
Ye
s
2
Q37
on
pag
e 12
No
Q1
4
How
old
wer
e yo
u w
hen
you
had
your
firs
t pr
oper
alc
ohol
ic d
rink?
W
rite
in t
he b
ox
your
age
th
en, i
n nu
mbe
rs n
ot w
ords
.
10
38-3
9
ye
ars
old
I
was
Q1
5
How
oft
en d
o yo
u u
sual
ly h
ave
an a
lcoh
olic
drin
k?
10
40
1
Ever
y da
y or
alm
ost
ever
y da
y
2
Abou
t tw
ice
a w
eek
3
Abou
t on
ce a
wee
k
4
Abou
t on
ce a
for
tnig
ht
5
Abou
t on
ce a
mon
th
6
Onl
y a
few
tim
es a
yea
r
7
I ne
ver
drin
k al
coho
l now
Q1
6
Whe
n di
d yo
u la
st h
ave
an a
lcoh
olic
drin
k?
1041
1
Q17
on
pag
e 7
To
day
2
Q17
on
pag
e 7
Ye
ster
day
3
Q17
on
pag
e 7
So
me
othe
r tim
e du
ring
the
last
7 d
ays
4
Q35
on
pag
e 11
1 w
eek,
but
less
tha
n 2
wee
ks a
go
5
Q35
on
pag
e 11
2 w
eeks
, but
less
tha
n 4
wee
ks a
go
6
Q37
on
pag
e 12
1 m
onth
, but
less
tha
n 6
mon
ths
ago
7
Q37
on
pag
e 12
6 m
onth
s ag
o or
mor
e
Cop
yright © 2014, Health and
Social C
are Inform
ation Centre. All rig
hts reserved
.

Smoking, drinking and drug use among young people in England in 2013 125
Q2
5
Writ
e in
the
box
bel
ow t
he n
umbe
r of
gla
sses
of W
INE
drun
k in
the
last
7 d
ays.
1079
-80
glas
ses
Q2
6
Dur
ing
the
last
7 d
ays,
how
muc
h M
ARTI
NI
AND
SH
ERRY
hav
e yo
u dr
unk?
10
81
1
Q2
7
O
ne g
lass
or
mor
e
2
Q2
8
Le
ss t
han
a gl
ass
3
Q2
8
H
ave
not
drun
k m
artin
i or
sher
ry in
the
last
7 d
ays
Q2
7
Writ
e in
the
box
bel
ow t
he n
umbe
r of
gla
sses
of M
ARTI
NI
AND
SH
ERRY
drun
k in
the
last
7 d
ays.
1082
-83
glas
ses
Q2
8
Dur
ing
the
last
7 d
ays,
how
muc
h SP
IRIT
S an
d LI
QU
EURS
(eg
whi
sky,
vod
ka, g
in, t
equi
la, B
aile
ys, T
ia M
aria
) ha
ve y
ou d
runk
? B
y a
glas
s w
e m
ean
a s
ingl
e pu
b m
easu
re.
10
84
1
Q
29
One
gla
ss o
r m
ore
2
Q
30
Less
tha
n a
glas
s
3
Q
30
Hav
e no
t dr
unk
spiri
ts o
r liq
ueur
s in
the
last
7 d
ays
Q2
9
Writ
e in
the
box
bel
ow t
he n
umbe
r of
gla
sses
of
SPIR
ITS
and
LIQ
UEU
RS (
eg w
hisk
y, v
odka
, gin
, teq
uila
, Bai
leys
, Ti
a M
aria
) dr
unk
in t
he la
st 7
day
s.
1085
-86
glas
ses
Q3
0
Dur
ing
the
last
7 d
ays,
how
man
y AL
COPO
PS (
eg B
acar
di
Bree
zer,
Red
Squ
are,
Ree
f, Sm
irnof
f Ice
, WKD
, Arc
hers
) ha
ve
you
drun
k?
10
87
1
Q31
on
pag
e 10
One
bot
tle o
r m
ore
2
Q32
on
pag
e 10
Less
tha
n a
bott
le
3
Q32
on
pag
e 10
Hav
e no
t dr
unk
alco
pops
in t
he la
st 7
day
s
Q20
D
o yo
u us
ually
drin
k no
rmal
str
engt
h or
str
ong
beer
? If
you
us
ually
drin
k bo
th n
orm
al a
nd s
tron
g be
er, p
leas
e tic
k th
e ty
pe
you
dran
k m
ost r
ecen
tly.
10
67
1
Norm
al s
tren
gth
beer
2
Stro
ng b
eer
Q21
D
urin
g th
e la
st 7
day
s, h
ow m
uch
SHAN
DY
have
you
dru
nk?
1068
1
Q22
Half
a pi
nt o
r mor
e
2
Q24
Less
than
hal
f a p
int
3
Q24
Have
not
dru
nk s
hand
y in
the
last
7 d
ays
Q22
W
rite
in th
e bo
xes
belo
w th
e nu
mbe
r of p
ints
, hal
f pin
ts,
larg
e ca
ns a
nd s
mal
l can
s of
SHA
NDY
drun
k in
the
last
7
days
.
1069
-70
pint
s
1071
-72
half
pint
s
1073
-74
la
rge
cans
1075
-76
smal
l can
s
Q23
W
as th
e SH
AND
Y yo
u dr
ank
in th
e la
st 7
day
s m
ostly
lem
onad
e,
mos
tly la
ger o
r bee
r, or
abo
ut h
alf a
nd h
alf o
f eac
h?
10
77
1
Mos
tly le
mon
ade
2
Mos
tly la
ger o
r bee
r
3
Abou
t hal
f and
hal
f of e
ach
Q24
D
urin
g th
e la
st 7
day
s, h
ow m
uch
WIN
E ha
ve y
ou d
runk
?
10
78
1
Q25
on
page
9
O
ne g
lass
or m
ore
2
Q26
on
page
9
Le
ss th
an a
gla
ss
3
Q26
on
page
9
Ha
ve n
ot d
runk
win
e in
the
last
7 d
ays
Cop
yright © 2014, Health and
Social C
are Inform
ation Centre. All rig
hts reserved
.

126 Smoking, drinking and drug use among young people in England in 2013
Page
11
Q3
5
Hav
e yo
u be
en d
runk
in t
he
last
4 w
eeks
?
11
23
1
Q3
6
Ye
s
2
Q37
on
pag
e 12
No
Q3
6
How
man
y tim
es h
ave
you
been
dru
nk in
th
e la
st 4
w
eeks
? W
rite
the
num
ber
in t
he b
ox.
1124
-125
tim
es
I ha
ve b
een
drun
k
Q3
1
Writ
e in
the
box
es b
elow
the
num
ber
of c
ans
and
bott
les
of A
LCO
POPS
(eg
Bac
ardi
Bre
ezer
, Red
Squ
are,
Ree
f, Sm
irnof
f Ice
, WKD
, Arc
hers
) dr
unk
in t
he la
st 7
day
s.
1088
-89
smal
l can
s
1090
-91
bo
ttle
s
Q3
2
Hav
e yo
u dr
unk
any
othe
r ty
pes
of a
lcoh
olic
drin
k in
the
last
7
days
?
10
92
1
Q3
3
Ye
s
2
Q35
on
pag
e 11
No
Q3
3
Wha
t ot
her
alco
holic
drin
k(s)
hav
e yo
u dr
unk?
Ple
ase
writ
e in
th
e na
me(
s) b
elow
.
10
93-
1110
Q3
4
Writ
e in
the
box
es b
elow
the
num
ber
of p
ints
, hal
f pi
nts,
la
rge
cans
, sm
all c
ans,
bot
tles
and
glas
ses
of t
his
othe
r al
coho
lic d
rink
that
you
hav
e dr
unk
in t
he la
st 7
day
s.
1111
-112
pint
s
1113
-114
half
pint
s
1115
-116
la
rge
cans
1117
-118
smal
l can
s
1119
-120
bo
ttle
s
1121
-122
glas
ses
Cop
yright © 2014, Health and
Social C
are Inform
ation Centre. All rig
hts reserved
.
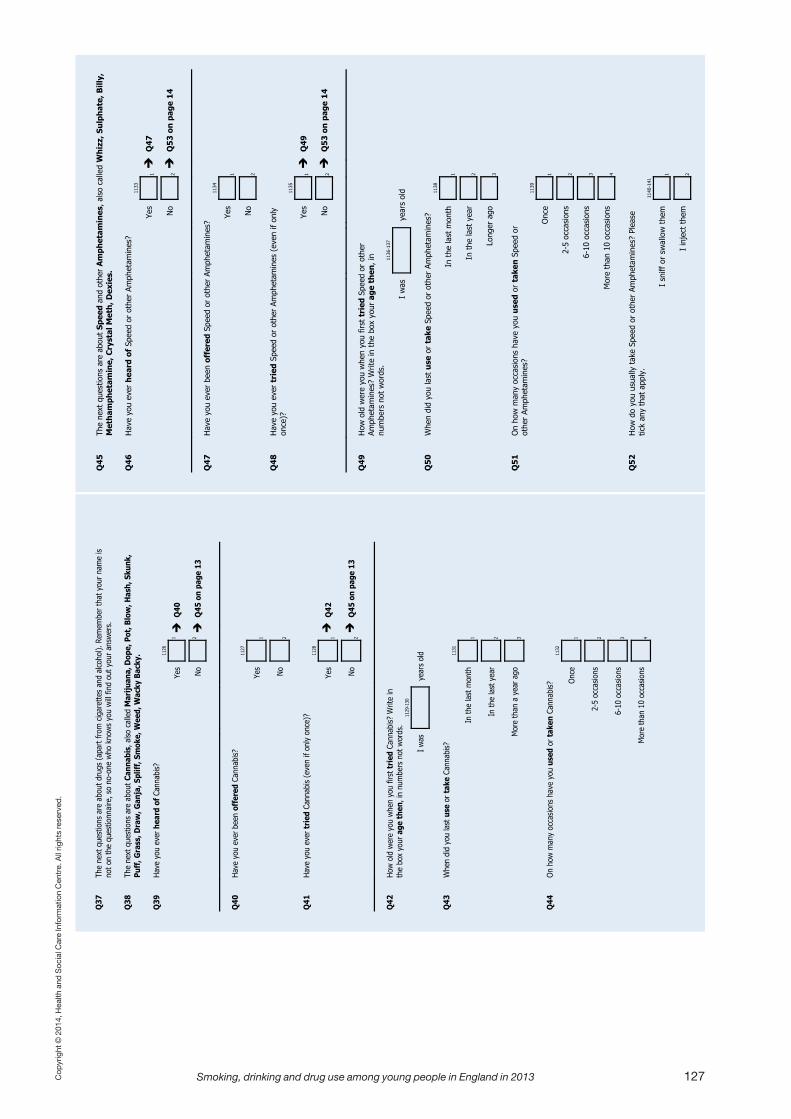
Smoking, drinking and drug use among young people in England in 2013 127
Q4
5
The
next
que
stio
ns a
re a
bout
Spe
ed a
nd o
ther
Am
phet
amin
es, a
lso
calle
d W
hiz
z, S
ulp
hat
e, B
illy,
M
eth
amph
etam
ine,
Cry
stal
Met
h, D
exie
s.
Q4
6
Hav
e yo
u ev
er h
eard
of
Spee
d or
oth
er A
mph
etam
ines
?
11
33
1 Q
47
Yes
2 Q
53 o
n p
age
14
N
o
Q4
7
Hav
e yo
u ev
er b
een
offe
red
Spee
d or
oth
er A
mph
etam
ines
?
1134
1
Ye
s
2
N
o
Q4
8
Hav
e yo
u ev
er t
ried
Spe
ed o
r ot
her
Amph
etam
ines
(ev
en if
onl
y on
ce)?
11
35
1 Q
49
Yes
2 Q
53 o
n p
age
14
N
o
Q4
9
How
old
wer
e yo
u w
hen
you
first
tri
ed S
peed
or
othe
r Am
phet
amin
es?
Writ
e in
the
box
you
r ag
e th
en, i
n nu
mbe
rs n
ot w
ords
.
11
36-1
37
ye
ars
old
I
was
Q5
0
Whe
n di
d yo
u la
st u
se o
r ta
ke S
peed
or
othe
r Am
phet
amin
es?
11
38
1
In
the
last
mon
th
2
In
the
last
yea
r
3
Lo
nger
ago
Q5
1
On
how
man
y oc
casi
ons
have
you
use
d or
tak
en S
peed
or
othe
r Am
phet
amin
es?
11
39
1
O
nce
2
2-
5 oc
casi
ons
3
6-
10 o
ccas
ions
4
M
ore
than
10
occa
sion
s
Q5
2
How
do
you
usua
lly t
ake
Spee
d or
oth
er A
mph
etam
ines
? Pl
ease
tic
k an
y th
at a
pply
.
11
40-1
41
1
I
sniff
or
swal
low
the
m
2
I
inje
ct t
hem
Q37
Th
e ne
xt q
uest
ions
are
abo
ut d
rugs
(ap
art f
rom
cig
aret
tes
and
alco
hol).
Rem
embe
r tha
t you
r nam
e is
not o
n th
e qu
estio
nnai
re, s
o no
-one
who
kno
ws
you
will
find
out
you
r ans
wer
s.
Q38
Th
e ne
xt q
uest
ions
are
abo
ut C
anna
bis,
also
cal
led
Mar
ijuan
a, D
ope,
Pot
, Blo
w, H
ash,
Sku
nk,
Puff
, Gra
ss, D
raw
, Gan
ja, S
pliff
, Sm
oke,
Wee
d, W
acky
Bac
ky.
Q39
Ha
ve y
ou e
ver h
eard
of
Cann
abis?
11
26
1
Q40
Yes
2
Q45
on
page
13
No
Q40
Ha
ve y
ou e
ver b
een
offe
red
Cann
abis?
1127
1
Yes
2
No
Q41
Ha
ve y
ou e
ver t
ried
Can
nabi
s (e
ven
if on
ly o
nce)
?
11
28
1
Q42
Yes
2
Q45
on
page
13
No
Q42
Ho
w o
ld w
ere
you
whe
n yo
u fir
st t
ried
Cann
abis?
Writ
e in
th
e bo
x yo
ur a
ge t
hen,
in n
umbe
rs n
ot w
ords
.
11
29-1
30
ye
ars
old
I
was
Q43
W
hen
did
you
last
use
or t
ake
Cann
abis?
1131
1
In th
e la
st m
onth
2
In th
e la
st y
ear
3
Mor
e th
an a
yea
r ago
Q44
O
n ho
w m
any
occa
sions
hav
e yo
u us
ed o
r tak
en C
anna
bis?
1132
1
Onc
e
2
2-5
occa
sions
3
6-10
occ
asio
ns
4
Mor
e th
an 1
0 oc
casio
ns
Cop
yright © 2014, Health and
Social C
are Inform
ation Centre. All rig
hts reserved
.
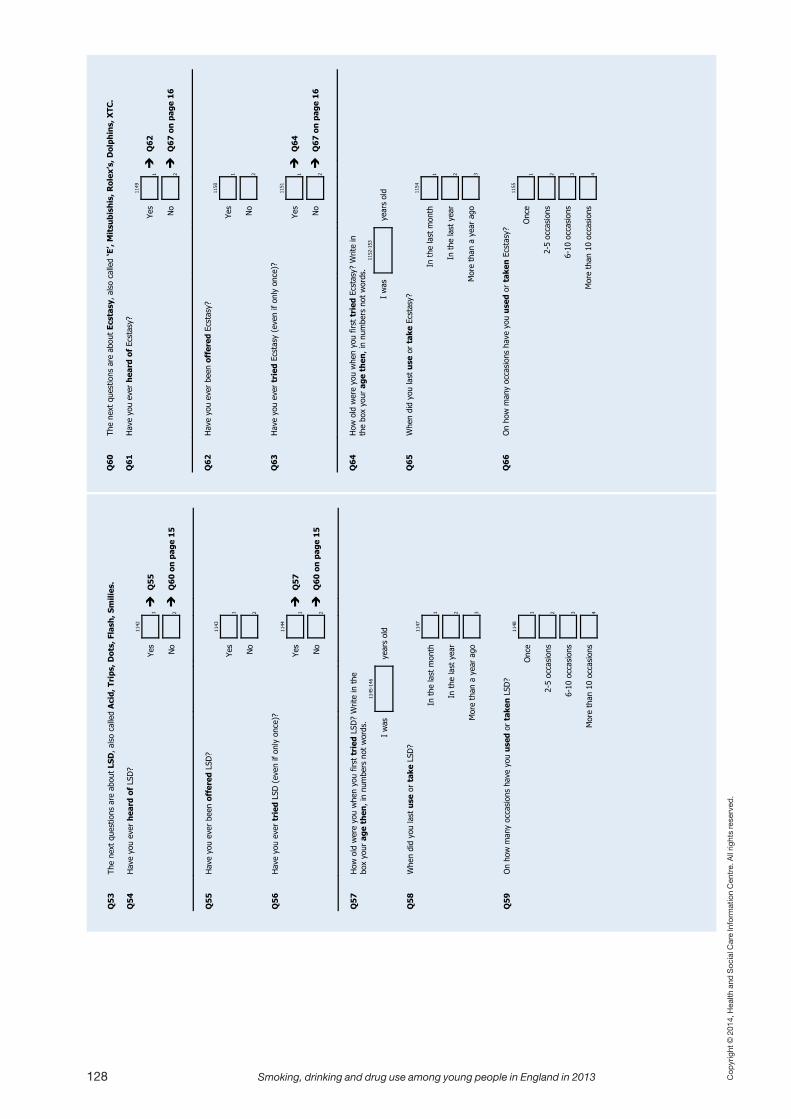
128 Smoking, drinking and drug use among young people in England in 2013
Q6
0
The
next
que
stio
ns a
re a
bout
Ecs
tasy
, als
o ca
lled
‘E’,
Mit
subi
shis
, Rol
ex’s
, Dol
phin
s, X
TC.
Q6
1
Hav
e yo
u ev
er h
eard
of
Ecst
asy?
11
49
1 Q
62
Yes
2 Q
67 o
n p
age
16
N
o
Q6
2
Hav
e yo
u ev
er b
een
offe
red
Ecst
asy?
1150
1
Ye
s
2
N
o
Q6
3
Hav
e yo
u ev
er t
ried
Ecs
tasy
(ev
en if
onl
y on
ce)?
11
51
1 Q
64
Yes
2 Q
67 o
n p
age
16
N
o
Q6
4
How
old
wer
e yo
u w
hen
you
first
tri
ed E
csta
sy?
Writ
e in
th
e bo
x yo
ur a
ge t
hen
, in
num
bers
not
wor
ds.
11
52-1
53
ye
ars
old
I
was
Q6
5
Whe
n di
d yo
u la
st u
se o
r ta
ke E
csta
sy?
11
54
1
In
the
last
mon
th
2
In
the
last
yea
r
3
M
ore
than
a y
ear
ago
Q6
6
On
how
man
y oc
casi
ons
have
you
use
d or
tak
en E
csta
sy?
11
55
1
O
nce
2
2-
5 oc
casi
ons
3
6-
10 o
ccas
ions
4
M
ore
than
10
occa
sion
s
Q5
3
The
next
que
stio
ns a
re a
bout
LSD
, als
o ca
lled
Aci
d, T
rips
, Dot
s, F
lash
, Sm
ilies
. Q
54
H
ave
you
ever
hea
rd o
f LS
D?
1142
1 Q
55
Yes
2 Q
60 o
n p
age
15
N
o
Q5
5
Hav
e yo
u ev
er b
een
offe
red
LSD
?
1143
1
Ye
s
2
N
o
Q5
6
Hav
e yo
u ev
er t
ried
LSD
(ev
en if
onl
y on
ce)?
11
44
1 Q
57
Yes
2 Q
60 o
n p
age
15
N
o
Q5
7
How
old
wer
e yo
u w
hen
you
first
tri
ed L
SD?
Writ
e in
the
bo
x yo
ur a
ge t
hen
, in
num
bers
not
wor
ds.
11
45-1
46
ye
ars
old
I
was
Q5
8
Whe
n di
d yo
u la
st u
se o
r ta
ke L
SD?
11
47
1
In
the
last
mon
th
2
In
the
last
yea
r
3
M
ore
than
a y
ear
ago
Q5
9
On
how
man
y oc
casi
ons
have
you
use
d or
tak
en L
SD?
11
48
1
O
nce
2
2-
5 oc
casi
ons
3
6-
10 o
ccas
ions
4
M
ore
than
10
occa
sion
s
Cop
yright © 2014, Health and
Social C
are Inform
ation Centre. All rig
hts reserved
.

Smoking, drinking and drug use among young people in England in 2013 129
Q7
4
The
next
que
stio
ns a
re a
bout
Pop
pers
, als
o ca
lled
Am
yl n
itri
te, L
iqu
id G
old,
Ram
. Q
75
H
ave
you
ever
hea
rd o
f Po
pper
s?
1163
1 Q
76
Yes
2 Q
81 o
n p
age
18
N
o
Q7
6
Hav
e yo
u ev
er b
een
offe
red
Popp
ers?
1164
1
Ye
s
2
N
o
Q7
7
Hav
e yo
u ev
er t
ried
sn
iffi
ng
Popp
ers
(eve
n if
only
onc
e)?
1165
1 Q
78
Yes
2 Q
81 o
n p
age
18
N
o
Q7
8
How
old
wer
e yo
u w
hen
you
first
tri
ed s
nif
fin
g Po
pper
s?
Writ
e in
the
box
you
r ag
e th
en, i
n nu
mbe
rs n
ot w
ords
.
11
66-1
167
44
ye
ars
old
I
was
Q7
9
Whe
n di
d yo
u la
st s
nif
f Po
pper
s?
11
68
1
In
the
last
mon
th
2
In
the
last
yea
r
3
M
ore
than
a y
ear
ago
Q8
0
On
how
man
y oc
casi
ons
have
you
sn
iffe
d Po
pper
s?
11
69
1
O
nce
2
2-
5 oc
casi
ons
3
6-
10 o
ccas
ions
4
M
ore
than
10
occa
sion
s
Q67
Th
e ne
xt q
uest
ions
are
abo
ut S
emer
on, a
lso c
alle
d Se
m.
Q68
Ha
ve y
ou e
ver h
eard
of S
emer
on?
1156
1 Q
69
Ye
s
2 Q
74 o
n pa
ge 1
7
No
Q69
Ha
ve y
ou e
ver b
een
offe
red
Sem
eron
?
1157
1
Ye
s
2
No
Q70
Ha
ve y
ou e
ver t
ried
Sem
eron
(ev
en if
onl
y on
ce)?
11
58
1 Q
71
Ye
s
2 Q
74 o
n pa
ge 1
7
No
Q71
Ho
w o
ld w
ere
you
whe
n yo
u fir
st t
ried
Sem
eron
? W
rite
in
the
box
your
age
the
n, in
num
bers
not
wor
ds.
11
59-1
60
ye
ars
old
I
was
Q72
W
hen
did
you
last
use
or t
ake
Sem
eron
?
1161
1
In
the
last
mon
th
2
In
the
last
yea
r
3
M
ore
than
a y
ear a
go
Q73
O
n ho
w m
any
occa
sions
hav
e yo
u us
ed o
r tak
en S
emer
on?
11
62
1
O
nce
2
2-
5 oc
casio
ns
3
6-
10 o
ccas
ions
4
M
ore
than
10
occa
sions
Cop
yright © 2014, Health and
Social C
are Inform
ation Centre. All rig
hts reserved
.

130 Smoking, drinking and drug use among young people in England in 2013
Q8
8
The
next
que
stio
ns a
re a
bout
Her
oin,
als
o ca
lled
Bro
wn
, Sm
ack,
Ska
g, H
orse
, Gea
r, ‘H
’. Q
89
H
ave
you
ever
hea
rd o
f H
eroi
n?
1177
1 Q
90
Yes
2 Q
95 o
n p
age
20
N
o
Q9
0
Hav
e yo
u ev
er b
een
offe
red
Her
oin?
1178
1
Ye
s
2
N
o
Q9
1
Hav
e yo
u ev
er t
ried
Her
oin
(eve
n if
only
onc
e)?
1179
1 Q
92
Yes
2 Q
95 o
n p
age
20
N
o
Q9
2
How
old
wer
e yo
u w
hen
you
first
tri
ed H
eroi
n? W
rite
in
the
box
your
age
th
en, i
n nu
mbe
rs n
ot w
ords
.
11
80-1
181
ye
ars
old
I
was
Q9
3
Whe
n di
d yo
u la
st u
se o
r ta
ke H
eroi
n?
11
82
1
In
the
last
mon
th
2
In
the
last
yea
r
3
M
ore
than
a y
ear
ago
Q9
4
On
how
man
y oc
casi
ons
have
you
use
d or
tak
en H
eroi
n?
11
83
1
O
nce
2
2-
5 oc
casi
ons
3
6-
10 o
ccas
ions
4
M
ore
than
10
occa
sion
s
Q8
1
The
next
que
stio
ns a
re a
bout
Tra
nqu
ilise
rs, a
lso
calle
d D
own
ers,
Mog
gies
, Jel
lies,
Roo
fies
, B
enzo
s.
Q8
2
Hav
e yo
u ev
er h
eard
of
Tran
quili
sers
?
11
70
1 Q
83
Yes
2 Q
88 o
n p
age
19
N
o
Q8
3
Hav
e yo
u ev
er b
een
offe
red
Tran
quili
sers
?
1171
1
Ye
s
2
N
o
Q8
4
Hav
e yo
u ev
er t
ried
Tra
nqui
liser
s (e
ven
if on
ly o
nce)
?
11
72
1 Q
85
Yes
2 Q
88 o
n p
age
19
N
o
Q8
5
How
old
wer
e yo
u w
hen
you
first
tri
ed T
ranq
uilis
ers?
W
rite
in t
he b
ox y
our
age
then
, in
num
bers
not
wor
ds.
11
73-1
174
ye
ars
old
I
was
Q8
6
Whe
n di
d yo
u la
st u
se o
r ta
ke T
ranq
uilis
ers?
1175
1
In
the
last
mon
th
2
In
the
last
yea
r
3
M
ore
than
a y
ear
ago
Q8
7
On
how
man
y oc
casi
ons
have
you
use
d or
tak
en T
ranq
uilis
ers?
11
76
1
O
nce
2
2-
5 oc
casi
ons
3
6-
10 o
ccas
ions
4
M
ore
than
10
occa
sion
s
Cop
yright © 2014, Health and
Social C
are Inform
ation Centre. All rig
hts reserved
.

Smoking, drinking and drug use among young people in England in 2013 131
Q10
2 Th
e ne
xt q
uest
ions
are
abo
ut M
eth
adon
e, a
lso
calle
d Li
nct
us,
Ph
ysep
ton
e, M
eth
. Q
103
Hav
e yo
u ev
er h
eard
of
Met
hado
ne?
1191
1 Q
104
Ye
s
2 Q
109
on p
age
22
N
o
Q10
4 H
ave
you
ever
bee
n of
fere
d M
etha
done
?
1192
1
Ye
s
2
N
o
Q10
5 H
ave
you
ever
tri
ed M
etha
done
(ev
en if
onl
y on
ce)?
11
93
1 Q
106
Ye
s
2 Q
109
on p
age
22
N
o
Q10
6 H
ow o
ld w
ere
you
whe
n yo
u fir
st t
ried
Met
hado
ne?
Writ
e in
the
box
you
r ag
e th
en, i
n nu
mbe
rs n
ot w
ords
.
11
94-1
95
ye
ars
old
I
was
Q10
7 W
hen
did
you
last
use
or
take
Met
hado
ne?
11
96
1
In
the
last
mon
th
2
In
the
last
yea
r
3
M
ore
than
a y
ear
ago
Q10
8 O
n ho
w m
any
occa
sion
s ha
ve y
ou u
sed
or t
aken
Met
hado
ne?
11
97
1
O
nce
2
2-
5 oc
casi
ons
3
6-
10 o
ccas
ions
4
M
ore
than
10
occa
sion
s
Q95
Th
e ne
xt q
uest
ions
are
abo
ut M
agic
Mus
hroo
ms,
also
cal
led
Shro
oms,
Mag
ics,
Lib
erti
es.
Q96
Ha
ve y
ou e
ver h
eard
of
Mag
ic M
ushr
oom
s?
1184
1 Q
97
Ye
s
2 Q
102
on p
age
21
No
Q97
Ha
ve y
ou e
ver b
een
offe
red
Mag
ic M
ushr
oom
s?
11
85
1
Ye
s
2
No
Q98
Ha
ve y
ou e
ver t
ried
Mag
ic M
ushr
oom
s (e
ven
if on
ly o
nce)
?
11
86
1 Q
99
Ye
s
2 Q
102
on p
age
21
No
Q99
Ho
w o
ld w
ere
you
whe
n yo
u fir
st t
ried
Mag
ic
Mus
hroo
ms?
Writ
e in
the
box
your
age
the
n, in
num
bers
no
t wor
ds.
11
87-1
88
ye
ars
old
I
was
Q10
0 W
hen
did
you
last
use
or t
ake
Mag
ic M
ushr
oom
s?
11
89
1
In
the
last
mon
th
2
In
the
last
yea
r
3
M
ore
than
a y
ear a
go
Q10
1 O
n ho
w m
any
occa
sions
hav
e yo
u us
ed o
r tak
en M
agic
M
ushr
oom
s?
11
90
1
O
nce
2
2-
5 oc
casio
ns
3
6-
10 o
ccas
ions
4
M
ore
than
10
occa
sions
Cop
yright © 2014, Health and
Social C
are Inform
ation Centre. All rig
hts reserved
.
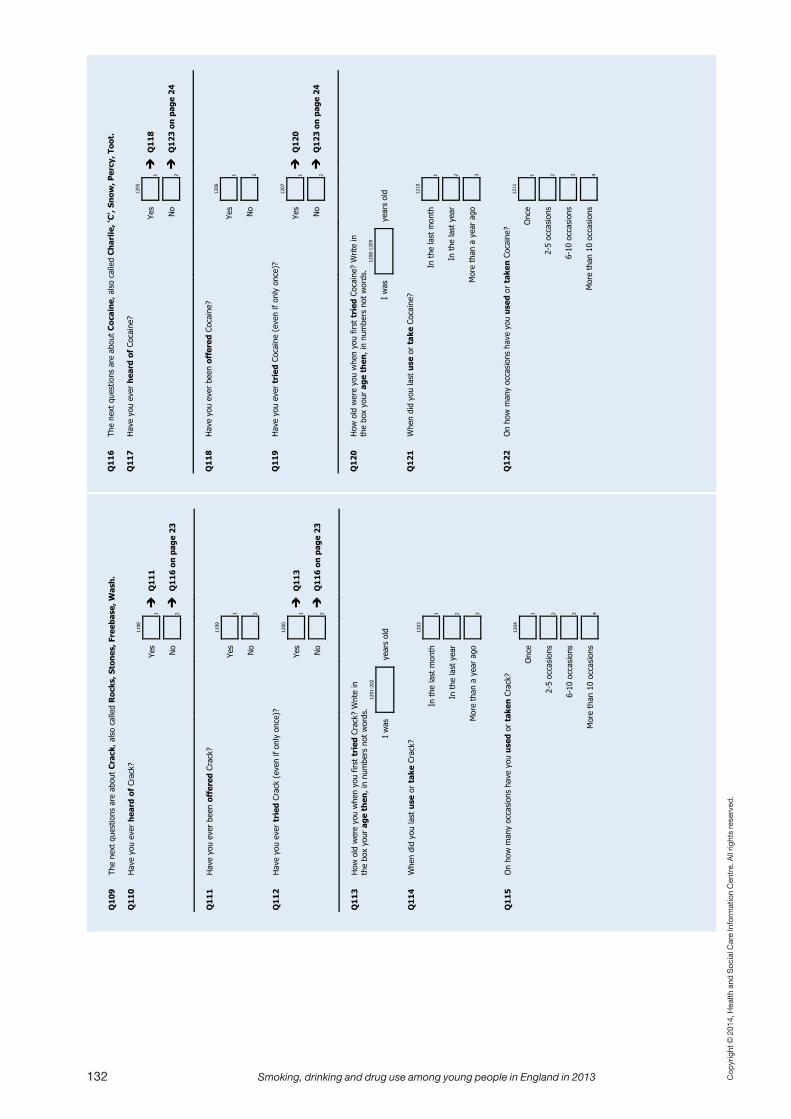
132 Smoking, drinking and drug use among young people in England in 2013
Q11
6 Th
e ne
xt q
uest
ions
are
abo
ut C
ocai
ne,
als
o ca
lled
Ch
arlie
, ‘C
’, Sn
ow, P
ercy
, Too
t.
Q11
7 H
ave
you
ever
hea
rd o
f Co
cain
e?
1205
1 Q
118
Ye
s
2 Q
123
on p
age
24
N
o
Q11
8 H
ave
you
ever
bee
n of
fere
d Co
cain
e?
12
06
1
Ye
s
2
N
o
Q11
9 H
ave
you
ever
tri
ed C
ocai
ne (
even
if o
nly
once
)?
1207
1 Q
120
Ye
s
2 Q
123
on p
age
24
N
o
Q12
0 H
ow o
ld w
ere
you
whe
n yo
u fir
st t
ried
Coc
aine
? W
rite
in
the
box
your
age
th
en, i
n nu
mbe
rs n
ot w
ords
.
12
08-1
209
ye
ars
old
I
was
Q12
1 W
hen
did
you
last
use
or
take
Coc
aine
?
1210
1
In
the
last
mon
th
2
In
the
last
yea
r
3
M
ore
than
a y
ear
ago
Q12
2 O
n ho
w m
any
occa
sion
s ha
ve y
ou u
sed
or t
aken
Coc
aine
?
1211
1
O
nce
2
2-
5 oc
casi
ons
3
6-
10 o
ccas
ions
4
M
ore
than
10
occa
sion
s
Q10
9 Th
e ne
xt q
uest
ions
are
abo
ut C
rack
, als
o ca
lled
Roc
ks, S
ton
es, F
reeb
ase,
Was
h.
Q11
0 H
ave
you
ever
hea
rd o
f Cr
ack?
11
98
1 Q
111
Ye
s
2 Q
116
on p
age
23
N
o
Q11
1 H
ave
you
ever
bee
n of
fere
d Cr
ack?
1199
1
Ye
s
2
N
o
Q11
2 H
ave
you
ever
tri
ed C
rack
(ev
en if
onl
y on
ce)?
12
00
1 Q
113
Ye
s
2 Q
116
on p
age
23
N
o
Q11
3 H
ow o
ld w
ere
you
whe
n yo
u fir
st t
ried
Cra
ck?
Writ
e in
th
e bo
x yo
ur a
ge t
hen
, in
num
bers
not
wor
ds.
12
01-2
02
ye
ars
old
I
was
Q11
4 W
hen
did
you
last
use
or
take
Cra
ck?
12
03
1
In
the
last
mon
th
2
In
the
last
yea
r
3
M
ore
than
a y
ear
ago
Q11
5 O
n ho
w m
any
occa
sion
s ha
ve y
ou u
sed
or t
aken
Cra
ck?
12
04
1
O
nce
2
2-
5 oc
casi
ons
3
6-
10 o
ccas
ions
4
M
ore
than
10
occa
sion
s
Cop
yright © 2014, Health and
Social C
are Inform
ation Centre. All rig
hts reserved
.

Smoking, drinking and drug use among young people in England in 2013 133
Q13
0 Th
e ne
xt q
uest
ions
are
abo
ut M
eph
edro
ne,
als
o ca
lled
M-C
at, M
eow
Meo
w, B
ubb
le, C
har
ge,
Dro
ne,
4M
MC
. Q
131
Hav
e yo
u ev
er h
eard
of
Mep
hedr
one?
12
19
1 Q
132
Ye
s
2 Q
137
on p
age
26
N
o
Q13
2 H
ave
you
ever
bee
n of
fere
d M
ephe
dron
e?
12
20
1
Ye
s
2
N
o
Q13
3 H
ave
you
ever
tri
ed M
ephe
dron
e (e
ven
if on
ly o
nce)
?
12
21
1 Q
134
Ye
s
2 Q
137
on p
age
26
N
o
Q13
4 H
ow o
ld w
ere
you
whe
n yo
u fir
st t
ried
Mep
hedr
one?
W
rite
in t
he b
ox y
our
age
then
, in
num
bers
not
wor
ds.
12
22-1
223
ye
ars
old
I
was
Q13
5 W
hen
did
you
last
use
or
take
Mep
hedr
one?
1224
1
In
the
last
mon
th
2
In
the
last
yea
r
3
M
ore
than
a y
ear
ago
Q13
6 O
n ho
w m
any
occa
sion
s ha
ve y
ou u
sed
or t
aken
Mep
hedr
one?
1225
1
O
nce
2
2-
5 oc
casi
ons
3
6-
10 o
ccas
ions
4
M
ore
than
10
occa
sion
s
Q12
3 Th
e ne
xt q
uest
ions
are
abo
ut K
etam
ine,
also
cal
led
Gre
en, ‘
K’,
supe
r K
. Q
124
Have
you
eve
r hea
rd o
f Ke
tam
ine?
12
12
1 Q
125
Ye
s
2 Q
130
on p
age
25
No
Q12
5 Ha
ve y
ou e
ver b
een
offe
red
Keta
min
e?
12
13
1
Ye
s
2
No
Q12
6 Ha
ve y
ou e
ver t
ried
Ket
amin
e (e
ven
if on
ly o
nce)
?
12
14
1 Q
127
Ye
s
2 Q
130
on p
age
25
No
Q12
7 Ho
w o
ld w
ere
you
whe
n yo
u fir
st t
ried
Ket
amin
e? W
rite
in th
e bo
x yo
ur a
ge t
hen,
in n
umbe
rs n
ot w
ords
.
12
15-1
216
ye
ars
old
I
was
Q12
8 W
hen
did
you
last
use
or t
ake
Keta
min
e?
12
17
1
In
the
last
mon
th
2
In
the
last
yea
r
3
M
ore
than
a y
ear a
go
Q12
9 O
n ho
w m
any
occa
sions
hav
e yo
u us
ed o
r tak
en K
etam
ine?
1218
1
O
nce
2
2-
5 oc
casio
ns
3
6-
10 o
ccas
ions
4
M
ore
than
10
occa
sions
Cop
yright © 2014, Health and
Social C
are Inform
ation Centre. All rig
hts reserved
.

134 Smoking, drinking and drug use among young people in England in 2013
Q14
4 Th
e ne
xt q
uest
ions
are
abo
ut o
ther
dru
gs (
othe
r th
an t
hose
tha
t yo
u co
uld
get
from
a d
octo
r or
ch
emis
t).
Q14
5 H
ave
you
ever
hea
rd o
f an
y ot
her
drug
s th
at w
ould
not
be
give
n to
you
by
a do
ctor
or
chem
ist?
12
33
1 Q
146
Ye
s
2 Q
153
on p
age
28
N
o
Q14
6 W
hat
othe
r dr
ugs
have
you
hea
rd o
f? P
leas
e w
rite
in t
he n
ames
be
low
.
1234
-283
Q14
7 H
ave
you
ever
bee
n of
fere
d th
ese
othe
r dr
ugs?
1284
1
Ye
s
2
N
o
Q14
8 H
ave
you
ever
tri
ed t
hese
oth
er d
rugs
(ev
en if
onl
y on
ce)?
12
85
1 Q
149
on p
age
28
Ye
s
2 Q
153
on p
age
28
N
o
Q13
7 Th
e ne
xt q
uest
ions
are
abo
ut G
lue,
gas
(bu
tan
e, li
ghte
r re
fills
), a
eros
ols
or s
olve
nts
(to
inh
ale
or s
nif
f).
Q13
8 H
ave
you
ever
hea
rd o
f G
lue,
gas
, aer
osol
s or
sol
vent
s?
1226
1 Q
139
Ye
s
2 Q
144
on p
age
27
N
o
Q13
9 H
ave
you
ever
bee
n of
fere
d G
lue,
gas
, aer
osol
s or
sol
vent
s to
in
hale
or
sniff
?
12
27
1
Ye
s
2
N
o
Q14
0 H
ave
you
ever
tri
ed s
nif
fin
g G
lue,
gas
, aer
osol
s or
sol
vent
s (e
ven
if on
ly o
nce)
?
12
28
1 Q
141
Ye
s
2 Q
144
on p
age
27
N
o
Q14
1 H
ow o
ld w
ere
you
whe
n yo
u fir
st t
ried
sn
iffi
ng
Glu
e,
gas,
aer
osol
s or
sol
vent
s? W
rite
in t
he b
ox y
our
age
then
, in
num
bers
not
wor
ds.
12
29-1
230
ye
ars
old
I
was
Q14
2 W
hen
did
you
last
sn
iff
Glu
e, g
as, a
eros
ols
or s
olve
nts?
1231
1
In
the
last
mon
th
2
In
the
last
yea
r
3
M
ore
than
a y
ear
ago
Q14
3 O
n ho
w m
any
occa
sion
s ha
ve y
ou s
nif
fed
Glu
e, g
as, a
eros
ols
or
solv
ents
?
12
32
1
O
nce
2
2-
5 oc
casi
ons
3
6-
10 o
ccas
ions
4
M
ore
than
10
occa
sion
s
Cop
yright © 2014, Health and
Social C
are Inform
ation Centre. All rig
hts reserved
.

Smoking, drinking and drug use among young people in England in 2013 135
Q15
4 Th
inki
ng a
bout
the
fir
st t
ime
you
trie
d an
y dr
ugs
(incl
udin
g sn
iffin
g gl
ue o
r so
lven
ts b
ut n
ot c
igar
ette
s or
alc
ohol
), w
hich
of
the
follo
win
g di
d yo
u ta
ke?
Plea
se t
ick
all t
hat
you
trie
d.
1
300-
1331
01
C
ann
abis
, als
o ca
lled
Mar
ijuan
a, D
ope,
Pot
, Blo
w, H
ash,
Sku
nk,
Puff
, Gra
ss, D
raw
, Gan
ja, S
pliff
, Sm
oke,
Wee
d, W
acky
Bac
ky
02
Spee
d an
d ot
her
Am
phet
amin
es, a
lso
calle
d W
hizz
, Sul
phat
e,
Billy
, Met
ham
phet
amin
e, C
ryst
al M
eth,
Dex
ies.
03
LSD
, als
o ca
lled
Acid
, Trip
s, D
ots,
Fla
sh, S
mili
es
04
Ecst
asy,
als
o ca
lled
‘E’,
Mits
ubis
his,
Rol
ex’s
, Dol
phin
s, X
TC
05
Sem
eron
, als
o ca
lled
Sem
06
Pop
pers
, als
o ca
lled
Amyl
nitr
ite, L
iqui
d G
old,
Ram
07
Tran
quili
sers
, als
o ca
lled
Dow
ners
, Mog
gies
, Jel
lies,
Roo
fies,
Be
nzos
08
Her
oin
, als
o ca
lled
Brow
n, S
mac
k, S
kag,
Hor
se, G
ear,
‘H’
09
Mag
ic M
ush
room
s, a
lso
calle
d Sh
room
s, M
agic
s, L
iber
ties
10
Met
had
one,
als
o ca
lled
Linc
tus,
Phy
sept
one,
Met
h
11
Cra
ck, a
lso
calle
d Roc
ks, S
tone
s, F
reeb
ase,
Was
h
12
Coc
ain
e, a
lso
calle
d Ch
arlie
, ‘C’
, Sno
w, P
ercy
,Too
t
K
etam
ine,
als
o ca
lled
Gre
en, ‘
K’, s
uper
K
13
14
Mep
hed
ron
e, a
lso
calle
d M
-Cat
, Meo
w M
eow
, Bub
ble,
Cha
rge,
D
rone
, 4M
MC
15
Glu
e, g
as (
buta
ne,
ligh
ter
refi
lls),
aer
osol
s or
solv
ents
(t
o in
hale
or
sniff
)
16
Oth
er d
rugs
tha
t w
ould
not
be
give
n to
you
by
a do
ctor
or
chem
ist
(Ple
ase
tick
box
writ
e be
low
the
nam
e of
the
dru
gs)
Q14
9 Ho
w o
ld w
ere
you
whe
n yo
u fir
st t
ried
thes
e ot
her d
rugs
? W
rite
in th
e bo
x yo
ur a
ge t
hen,
in n
umbe
rs n
ot w
ords
.
12
86-1
287
ye
ars
old
I
was
Q15
0 W
hen
did
you
last
use
or t
ake
thes
e ot
her d
rugs
?
1288
1
In
the
last
mon
th
2
In
the
last
yea
r
3
M
ore
than
a y
ear a
go
Q15
1 O
n ho
w m
any
occa
sions
hav
e yo
u us
ed o
r tak
en th
ese
othe
r dr
ugs?
12
89
1
O
nce
2
2-
5 oc
casio
ns
3
6-
10 o
ccas
ions
4
M
ore
than
10
occa
sions
Q15
2 D
o yo
u th
ink
that
thes
e ot
her d
rugs
that
you
hav
e us
ed o
r ta
ken
wer
e le
gal t
o bu
y? P
leas
e ch
oose
one
onl
y
12
90
1
Al
l of t
he d
rugs
wer
e le
gal
2
So
me
of th
e dr
ugs
wer
e le
gal
3
No
ne o
f the
dru
gs w
ere
lega
l
4
D
on’t
know
Q15
3 Ju
st to
che
ck, h
ave
you
ever
use
d or
tak
en a
ny d
rugs
, in
clud
ing
sniff
ing
glue
or s
olve
nts
(eve
n if
only
onc
e)?
12
91
1 Q
154
on p
age
29
Ye
s
2 Q
177
on p
age
37
No
Spar
e 12
92-1
299
Cop
yright © 2014, Health and
Social C
are Inform
ation Centre. All rig
hts reserved
.

136 Smoking, drinking and drug use among young people in England in 2013
Q15
7 Th
e fi
rst
time
you
used
or
took
dru
gs, h
ow d
id t
hey
mak
e yo
u fe
el?
You
may
tic
k m
ore
than
on
e bo
x.
1356
-371
01
I fe
lt sa
d
02
I fe
lt fa
ntas
tic
03
I fe
lt si
ck
04
I fe
lt co
nfid
ent
05
I fe
lt gu
ilty
06
I fe
lt re
laxe
d
07
I fe
lt ou
t of
con
trol
08
Non
e of
the
se
Q15
8 Th
e fir
st t
ime
you
took
dru
gs, o
vera
ll ho
w d
id y
ou f
eel?
1372
1
I
felt
good
2
I
felt
bad
3
I
felt
no d
iffer
ent
Q15
9 W
hen
did
you
last
tak
e dr
ugs
(incl
udin
g sn
iffin
g gl
ue o
r so
lven
ts)?
13
73
1 Q
160
In t
he la
st f
our
wee
ks
2 Q
161
on p
age
32
In
the
last
yea
r
3 Q
177
on p
age
37
M
ore
than
a y
ear
ago
Q1
60
In
th
e la
st f
our
wee
ks, h
ow m
any
times
hav
e yo
u ta
ken
drug
s (in
clud
ing
sniff
ing
glue
or
solv
ents
)?
1374
-375
01
Non
e
02
Onc
e
03
Twic
e
04
Thre
e tim
es
05
Four
tim
es o
r m
ore
Q15
5 Th
e fi
rst
time
you
trie
d th
e dr
ugs,
who
did
you
get
the
m f
rom
?
1332
-133
3
01
My
brot
her
or s
iste
r
02
A fr
iend
of
my
own
age
03
A fr
iend
old
er t
han
me
04
A fr
iend
you
nger
tha
n m
e
05
My
boyf
riend
or
girlf
riend
06
My
mot
her,
fat
her
or s
tep-
pare
nt
07
Som
eone
I k
new
of,
but
didn
’t kn
ow p
erso
nally
08
A st
rang
er
09
Som
eone
els
e (p
leas
e tic
k th
e bo
x an
d w
rite
belo
w h
ow y
ou
knew
the
per
son)
Q15
6 W
hy d
id y
ou t
ry t
he d
rugs
, the
fir
st t
ime?
You
may
tic
k m
ore
than
on
e bo
x.
13
34-1
355
01
I w
ante
d to
get
hig
h or
fee
l goo
d
02
Beca
use
my
frie
nds
wer
e do
ing
it
03
Beca
use
it’s
cool
04
It w
as a
dar
e
05
I ha
d no
thin
g be
tter
to
do
06
I w
ante
d to
see
wha
t it
was
like
07
I w
ante
d to
for
get
my
prob
lem
s
08
Just
bec
ause
I w
as o
ffer
ed it
09
Oth
er r
easo
ns (
plea
se t
ick
the
box
and
writ
e in
bel
ow)
10
I do
n’t
rem
embe
r
11
I do
n’t
kno
w
Cop
yright © 2014, Health and
Social C
are Inform
ation Centre. All rig
hts reserved
.

Smoking, drinking and drug use among young people in England in 2013 137
Q16
3 Th
e la
st t
ime
you
used
or
took
dru
gs, w
ho d
id y
ou g
et t
hem
fr
om?
14
09-4
10
01
My
brot
her
or s
iste
r
02
A fr
iend
of
my
own
age
03
A fr
iend
old
er t
han
me
04
A fr
iend
you
nger
tha
n m
e
05
My
boyf
riend
or
girlf
riend
06
My
mot
her,
fat
her
or s
tep-
pare
nt
07
Som
eone
I k
new
of,
but
didn
’t kn
ow p
erso
nally
08
A st
rang
er
09
Som
eone
els
e (p
leas
e tic
k th
e bo
x an
d w
rite
belo
w h
ow y
ou
knew
the
per
son)
Q16
4 W
here
wer
e yo
u w
hen
you
boug
ht o
r w
ere
give
n th
e dr
ugs
the
last
tim
e?
14
11
1
At
hom
e
2
In
som
eone
els
e’s
hom
e
3
At
a p
arty
, clu
b, d
isco
or
rave
4
At
sch
ool
5
O
ut o
n th
e st
reet
, in
a pa
rk o
r ot
her
outd
oor
area
6
O
ther
pla
ce (
plea
se t
ick
the
box
and
writ
e in
whe
re y
ou w
ere)
Q16
1 La
st t
ime
you
used
or t
ook
drug
s, w
hich
of t
he fo
llow
ing
drug
s di
d yo
u us
e or
take
? If
you
use
d or
took
mor
e th
an o
ne d
rug
at
the
sam
e tim
e, p
leas
e tic
k al
l tho
se y
ou u
sed
or to
ok.
13
76-1
407
01
Ca
nnab
is, a
lso c
alle
d M
ariju
ana,
Dop
e, P
ot, B
low
, Has
h, S
kunk
, Pu
ff, G
rass
, Dra
w, G
anja
, Spl
iff, S
mok
e, W
eed,
Wac
ky B
acky
02
Spee
d an
d ot
her A
mph
etam
ines
, also
cal
led
Whi
zz, S
ulph
ate,
Bi
lly, M
etha
mph
etam
ine,
Cry
stal
Met
h, D
exie
s
03
LSD
, also
cal
led
Acid
, Trip
s, D
ots,
Fla
sh, S
mili
es
04
Ecst
asy,
also
cal
led
‘E’,
Mits
ubish
is, R
olex
’s, D
olph
ins,
XTC
05
Sem
eron
, also
cal
led
Sem
06
Popp
ers,
also
cal
led
Amyl
nitr
ite, L
iqui
d Go
ld, R
am
07
Tran
quili
sers
, also
cal
led
Dow
ners
, Mo g
gies
, Jel
lies,
Roo
fies,
Be
nzos
08
Her
oin,
also
cal
led
Brow
n, S
mac
k, S
kag,
Hor
se, G
ear,
‘H’
09
Mag
ic M
ushr
oom
s, a
lso c
alle
d Sh
room
s, M
agic
s, L
iber
ties
10
Met
hado
ne, a
lso c
alle
d Li
nctu
s, P
hyse
pton
e, M
eth
11
Crac
k, a
lso c
alle
d Ro
cks,
Sto
nes,
Fre
ebas
e, W
ash
12
Coca
ine,
also
cal
led
Char
lie, ‘
C’, S
now
, Per
cy, T
oot
K
etam
ine,
also
cal
led
Gree
n, ‘K
’, su
per K
13
14
Mep
hedr
one,
also
cal
led
M-C
at, M
eow
Meo
w, B
ubbl
e, C
har g
e,
Dro
ne, 4
MM
C
15
Glu
e, g
as (
buta
ne, l
ight
er r
efill
s), a
eros
ols
orso
lven
ts
(to
inha
le o
r sni
ff)
16
Oth
er d
rugs
that
wou
ld n
ot b
e gi
ven
to y
ou b
y a
doct
or o
r ch
emist
(Ple
ase
tick
box
writ
e be
low
the
nam
e of
the
drug
s)
Q16
2 Th
e la
st ti
me
you
used
or t
ook
drug
s, w
ere
you
also
drin
king
al
coho
l?
14
08
1
Ye
s
2
No
Cop
yright © 2014, Health and
Social C
are Inform
ation Centre. All rig
hts reserved
.
138 Smoking, drinking and drug use among young people in England in 2013
Q16
6 Th
e la
st ti
me
you
used
or
took
dru
gs, w
ere
you
with
oth
er
peop
le o
r w
ere
you
on y
our
own?
14
34
1 Q
167
I
was
with
oth
er p
eopl
e
2 Q
168
I
was
on
my
own
Spar
e 14
35-1
451
Q16
7 W
hich
of
the
follo
win
g pe
ople
wer
e yo
u w
ith t
he la
st t
ime
you
used
or
took
dru
gs.
Y
ou m
ay t
ick
mor
e th
an o
ne
box.
1452
-465
01
My
girlf
riend
or
boyf
riend
02
Frie
nds
of t
he s
ame
sex
as m
e
03
Frie
nds
of t
he o
ppos
ite s
ex
04
A gr
oup
of f
riend
s of
bot
h se
xes
05
My
pare
nts
(or
step
-par
ents
)
06
My
brot
her,
sis
ter
or o
ther
rel
ativ
es
07
Som
eone
els
e (t
ick
the
box
and
writ
e be
low
how
you
kne
w t
he
pers
on)
Q16
8 Th
e la
st t
ime
you
used
or
took
dru
gs, h
ow d
id t
hey
mak
e yo
u fe
el?
You
may
tic
k m
ore
than
on
e bo
x.
1466
-481
01
I fe
lt sa
d
02
I fe
lt fa
ntas
tic
03
I fe
lt si
ck
04
I fe
lt co
nfid
ent
05
I fe
lt gu
ilty
06
I fe
lt re
laxe
d
07
I fe
lt ou
t of
con
trol
08
Non
e of
the
se
Q16
5 W
hy d
id y
ou u
se o
r ta
ke d
rugs
tha
t da
y?
You
may
tic
k m
ore
than
on
e bo
x.
14
12-4
33
01
I w
ante
d to
get
hig
h or
fee
l goo
d
02
Beca
use
my
frie
nds
wer
e do
ing
it
03
Beca
use
it’s
cool
04
It
was
a d
are
05
I ha
d no
thin
g be
tter
to
do
06
I w
ante
d to
see
wha
t it
was
like
07
I w
ante
d to
for
get
my
prob
lem
s
08
Just
bec
ause
I w
as o
ffer
ed it
09
Oth
er r
easo
ns (
plea
se tic
k th
e bo
x an
d w
rite
in b
elow
)
10
I do
n’t
rem
embe
r
11
I do
n’t
know
Cop
yright © 2014, Health and
Social C
are Inform
ation Centre. All rig
hts reserved
.

Smoking, drinking and drug use among young people in England in 2013 139
Q17
5 H
ow d
oes
your
fam
ily f
eel a
bout
you
tak
ing
drug
s (in
clud
ing
sniff
ing
glue
or
solv
ents
but
not
cig
aret
tes
or a
lcoh
ol)?
14
87
1 Q
178
on p
age
38
Th
ey t
ry t
o st
op m
e
2 Q
178
on p
age
38
Th
ey t
ry t
o pe
rsua
de m
e no
t to
tak
e dr
ugs
3 Q
178
on p
age
38
Th
ey d
o no
thin
g
4 Q
178
on p
age
38
Th
ey e
ncou
rage
me
to t
ake
drug
s
5 Q
176
Th
ey d
on’t
know
I t
ake
drug
s
6 Q
178
on p
age
38
D
on’t
know
Q17
6 H
ow d
o yo
u th
ink
your
fam
ily w
ould
fee
l if
they
kne
w t
hat
you
took
dru
gs (
incl
udin
g sn
iffin
g gl
ue o
r so
lven
ts b
ut n
ot c
igar
ette
s or
alc
ohol
)?
14
88
1 Q
178
on p
age
38
Th
ey w
ould
try
to
stop
me
2 Q
178
on p
age
38
Th
ey w
ould
try
to
pers
uade
me
not
to t
ake
drug
s
3 Q
178
on p
age
38
Th
ey w
ould
do
noth
ing
4 Q
178
on p
age
38
Th
ey w
ould
enc
oura
ge m
e to
tak
e dr
ugs
5 Q
178
on p
age
38
D
on’t
know
Q17
7 H
ow d
o yo
u th
ink
your
fam
ily w
ould
fee
l if
you
star
ted
taki
ng
drug
s?
14
89
1
Th
ey w
ould
try
to
stop
me
2
Th
ey w
ould
try
to
pers
uade
me
not
to t
ake
drug
s
3
Th
ey w
ould
do
noth
ing
4
Th
ey w
ould
enc
oura
ge m
e to
tak
e dr
ugs
5
D
on’t
know
Q16
9 Th
e la
st ti
me
you
took
dru
gs, o
vera
ll ho
w d
id y
ou fe
el?
1482
1
I
felt
good
2
I
felt
bad
3
I
felt
no d
iffer
ent
Q17
0 W
ould
you
like
to s
top
usin
g or
taki
ng d
rugs
alto
geth
er?
14
83
1
Ye
s, I
wou
ld li
ke to
giv
e up
now
2
Ye
s, I
wou
ld li
ke to
giv
e up
in th
e fu
ture
3
No
4
No
t sur
e
Q17
1 Ha
ve y
ou e
ver f
elt t
hat y
ou n
eede
d to
get
hel
p or
trea
tmen
t be
caus
e yo
u w
ere
usin
g or
taki
ng d
rugs
?
14
84
1
Ye
s
2
No
Q17
2 Fo
r the
nex
t set
of q
uest
ions
, you
sho
uld
incl
ude
sniff
ing
glue
or
othe
r sol
vent
s bu
t not
sm
okin
g ci
gare
ttes
or a
lcoh
ol. R
emem
ber
that
you
r nam
e is
not o
n th
e qu
estio
nnai
re, s
o no
-one
who
kn
ows
you
will
find
out
you
r ans
wer
s.
Q17
3 O
n ho
w m
any
occa
sions
hav
e yo
u ta
ken
drug
s (in
clud
ing
sniff
ing
glue
or o
ther
sol
vent
s bu
t not
incl
udin
g ci
gare
ttes
or a
lcoh
ol)?
14
85
1 Q
177
on p
age
37
O
nce
2 Q
174
2-
5 oc
casio
ns
3 Q
174
6-
10 o
ccas
ions
4 Q
174
M
ore
than
10
occa
sions
Q17
4 Ho
w o
ften
do y
ou u
sual
ly ta
ke d
rugs
(in
clud
ing
sniff
ing
glue
or
othe
r sol
vent
s bu
t not
incl
udin
g ci
gare
ttes
or a
lcoh
ol)?
14
86
1
I
take
dru
gs m
ost d
ays
2
I
take
dru
gs a
t lea
st o
nce
a w
eek
3
I
take
dru
gs o
nce
or tw
ice
a m
onth
4
I
take
dru
gs a
few
tim
es a
yea
r
5
I
take
dru
gs a
bout
onc
e a
year
or l
ess
ofte
n
Cop
yright © 2014, Health and
Social C
are Inform
ation Centre. All rig
hts reserved
.

140 Smoking, drinking and drug use among young people in England in 2013
Q18
1 H
ow e
asy
wou
ld it
be
for
you
to
get
illeg
al d
rugs
if y
ou w
ante
d to
?
15
07
1
Ve
ry e
asy
2
Fa
irly
easy
3
Fa
irly
diff
icul
t
4
Ve
ry d
iffic
ult
5
D
on’t
know
Q18
2 H
ave
you
ever
bou
ght
drug
s (in
clud
ing
glue
and
oth
er s
olve
nts
but
not
incl
udin
g al
coho
l) ov
er t
he
inte
rnet
, eve
n if
you
wer
en’t
goin
g to
use
the
m y
ours
elf?
15
08
1
Ye
s
2
N
o
Q18
3 H
ave
you
ever
bou
ght
drug
s (in
clud
ing
glue
and
oth
er s
olve
nts
but
not
incl
udin
g al
coho
l) fr
om a
sh
op, e
ven
if yo
u w
eren
’t go
ing
to u
se t
hem
you
rsel
f?
15
09
1
Ye
s
2
N
o
Q17
8 Th
e ne
xt q
uest
ions
sho
uld
be a
nsw
ered
by
ALL
pupi
ls. Y
ou
shou
ld in
clud
e sn
iffin
g gl
ue o
r ot
her
solv
ents
but
not
sm
okin
g ci
gare
ttes
or
drin
king
alc
ohol
. Rem
embe
r th
at y
our
nam
e is
not
on
the
que
stio
nnai
re, s
o no
-one
who
kno
ws
you
will
fin
d ou
t yo
ur a
nsw
ers.
Q17
9 H
ave
you
ever
ref
used
a d
rug
that
was
off
ered
to
you
(incl
udin
g sn
iffin
g gl
ue o
r ot
her
solv
ents
but
not
incl
udin
g ci
gare
ttes
or
alco
hol)?
14
90
1 Q
180
Ye
s
2 Q
181
on p
age
39
N
o
3 Q
181
on p
age
39
N
ever
bee
n of
fere
d dr
ugs
Q18
0 W
hich
of
the
follo
win
g ar
e re
ason
s w
hy y
ou h
ave
refu
sed
to t
ake
drug
s?
You
may
tic
k m
ore
than
on
e bo
x.
14
91-1
506
01
They
are
too
exp
ensi
ve
02
I w
as f
right
ened
of
taki
ng t
hem
03
I th
ough
t th
ey w
ere
dang
erou
s
04
I di
dn’t
wan
t to
get
add
icte
d
05
I di
dn’t
know
eno
ugh
abou
t th
e dr
ugs
06
I th
ough
t I
wou
ld g
et in
to t
roub
le if
I t
ook
drug
s
07
I th
ink
taki
ng d
rugs
is w
rong
08
I ju
st d
idn’
t w
ant
to t
ake
them
Cop
yright © 2014, Health and
Social C
are Inform
ation Centre. All rig
hts reserved
.
Smoking, drinking and drug use among young people in England in 2013 141
Q18
8 D
o yo
u th
ink
it is
OK
for
som
eone
you
r ag
e to
do
the
follo
win
g?
Tick
on
e bo
x pe
r ro
w.
It’s
OK
It
’s n
ot
OK
D
on’t
kn
ow
15
17
1
2
3
Try
smok
ing
a ci
gare
tte
to s
ee w
hat
it’s
like
1518
1
2
3
Try
drin
king
alc
ohol
to
see
wha
t it’
s lik
e
1519
1
2
3
Try
gett
ing
drun
k to
see
wha
t it’
s lik
e
1520
1
2
3
Try
sniff
ing
glue
to
see
wha
t it’
s lik
e
1521
1
2
3
Try
taki
ng c
anna
bis
to s
ee w
hat
it’s
like
1522
1
2
3
Try
taki
ng c
ocai
ne t
o se
e w
hat
it’s
like
Q18
9 D
o yo
u th
ink
it is
OK
for
som
eone
you
r ag
e to
do
the
follo
win
g?
Tick
on
e bo
x pe
r ro
w.
It’s
OK
It
’s n
ot
OK
D
on’t
kn
ow
15
23
1
2
3
Smok
e ci
gare
ttes
onc
e a
wee
k
1524
1
2
3
Drin
k al
coho
l onc
e a
wee
k
1525
1
2
3
Get
dru
nk o
nce
a w
eek
1526
1
2
3
Sniff
glu
e on
ce a
wee
k
1527
1
2
3
Take
can
nabi
s on
ce a
wee
k
1528
1
2
3
Take
coc
aine
onc
e a
wee
k
Q18
4 Th
e ne
xt q
uest
ions
are
abo
ut p
eopl
e yo
ur o
wn
age,
suc
h as
pe
ople
at y
our s
choo
l and
oth
er s
choo
ls. R
emem
ber t
hat n
o-on
e w
ho k
now
s yo
u w
ill fi
nd o
ut y
our a
nsw
ers.
Q18
5 Th
inki
ng a
bout
peo
ple
your
ow
n ag
e, h
ow m
any
of th
em d
o yo
u th
ink
smok
e ci
gare
ttes?
15
10
1
Al
l of t
hem
2
M
ost,
but n
ot a
ll
3
Ab
out h
alf
4
O
nly
a fe
w
5
No
ne o
f the
m
Q18
6 Ho
w m
any
peop
le y
our o
wn
age
do y
ou th
ink
drin
k al
coho
l?
15
11
1
Al
l of t
hem
2
M
ost,
but n
ot a
ll
3
Ab
out h
alf
4
O
nly
a fe
w
5
No
ne o
f the
m
Q18
7 Ho
w m
any
peop
le y
our o
wn
age
do y
ou th
ink
take
dru
gs
(incl
udin
g sn
iffin
g gl
ue o
r oth
er s
olve
nts)
?
15
12
1
Al
l of t
hem
2
M
ost,
but n
ot a
ll
3
Ab
out h
alf
4
O
nly
a fe
w
5
No
ne o
f the
m
Spar
e 15
13-1
516
Cop
yright © 2014, Health and
Social C
are Inform
ation Centre. All rig
hts reserved
.
142 Smoking, drinking and drug use among young people in England in 2013
Q19
2 H
ave
you
got
help
ful i
nfor
mat
ion
abou
t ta
kin
g dr
ugs
from
any
of
the
se p
eopl
e?
Tick
on
e bo
x on
eac
h r
ow.
Yes
N
o
1547
1
2
Pa
rent
s or
gua
rdia
ns
1548
1
2
Br
othe
rs o
r si
ster
s
1549
1
2
O
ther
rel
ativ
es
1550
1
2
Fr
iend
s
1551
1
2
Fa
mily
doc
tor
or G
P
1552
1
2
Te
ache
rs
1553
1
2
O
ther
adu
lts a
t sc
hool
(e.
g. s
choo
l nur
se, C
onne
xion
s ad
viso
rs,
coun
selli
ng s
ervi
ce)
1554
1
2
Po
lice
in s
choo
ls
1555
1
2
Yo
uth
wor
kers
Q19
3 H
ave
you
got
help
ful i
nfor
mat
ion
abou
t sm
okin
g ci
gare
ttes
, fr
om a
ny o
f th
ese
plac
es?
Ti
ck o
ne
box
on e
ach
row
.
Yes
N
o
1556
1
2
TV
1557
1
2
Rad
io
1558
1
2
N
ewsp
aper
s or
mag
azin
es
1559
1
2
Th
e in
tern
et
1560
1
2
FR
ANK
1561
1
2
H
elpl
ines
Q19
0 H
ave
you
got
help
ful i
nfor
mat
ion
abou
t sm
okin
g ci
gare
ttes
, fr
om a
ny o
f th
ese
peop
le?
Ti
ck o
ne
box
on e
ach
row
.
Yes
N
o
1529
1
2
Pa
rent
s or
gua
rdia
ns
1530
1
2
Br
othe
rs o
r si
ster
s
1531
1
2
O
ther
rel
ativ
es
1532
1
2
Fr
iend
s
1533
1
2
Fa
mily
doc
tor
or G
P
1534
1
2
Te
ache
rs
1535
1
2
O
ther
adu
lts a
t sc
hool
(e.
g. s
choo
l nur
se, C
onne
xion
s ad
viso
rs,
coun
selli
ng s
ervi
ce)
1536
1
2
Po
lice
in s
choo
ls
1537
1
2
Yo
uth
wor
kers
Q19
1 H
ave
you
got
help
ful i
nfor
mat
ion
abou
t dr
inki
ng
alco
hol
fro
m
any
of t
hese
peo
ple?
Ti
ck o
ne
box
on e
ach
row
.
Yes
N
o
1538
1
2
Pa
rent
s or
gua
rdia
ns
1539
1
2
Br
othe
rs o
r si
ster
s
1540
1
2
O
ther
rel
ativ
es
1541
1
2
Fr
iend
s
1542
1
2
Fa
mily
doc
tor
or G
P
1543
1
2
Te
ache
rs
1544
1
2
O
ther
adu
lts a
t sc
hool
(e.
g. s
choo
l nur
se, C
onne
xion
s ad
viso
rs,
coun
selli
ng s
ervi
ce)
1545
1
2
Po
lice
in s
choo
ls
1546
1
2
Yo
uth
wor
kers
Cop
yright © 2014, Health and
Social C
are Inform
ation Centre. All rig
hts reserved
.

Smoking, drinking and drug use among young people in England in 2013 143
Q19
7 D
o yo
u th
ink
your
sch
ool h
as g
iven
you
eno
ugh
info
rmat
ion
on
the
follo
win
g to
pics
:
Tick
on
e bo
x on
eac
h r
ow
Yes
N
o D
on’t
kn
ow
15
77
1
2
3
Smok
ing?
1578
1
2
3
Alco
hol?
1579
1
2
3
Dru
gs in
gen
eral
?
Q19
8 Ju
st t
o ch
eck,
in t
he la
st t
wel
ve m
onth
s ha
ve y
ou h
ad a
ny
less
ons
abou
t dr
ugs
(incl
udin
g sn
iffin
g gl
ue o
r ot
her
solv
ents
, bu
t no
t in
clud
ing
ciga
rett
es o
r al
coho
l) in
you
r sc
hool
?
15
80
1 Q
199
Ye
s
2 Q
200
on p
age
46
N
o
Q19
9 D
id t
he s
choo
l les
sons
abo
ut d
rugs
(in
clud
ing
sniff
ing
glue
or
othe
r so
lven
ts, b
ut n
ot in
clud
ing
ciga
rett
es o
r al
coho
l) he
lp y
ou
do a
ny o
f th
ese
thin
gs?
Tick
on
e bo
x on
eac
h r
ow.
Yes
N
o
1581
1
2
Th
ey h
elpe
d m
e fin
d ou
t m
ore
abou
t dr
ugs
1582
1
2
Th
ey h
elpe
d m
e th
ink
abou
t th
e ris
ks o
f ta
king
dru
gs
1583
1
2
Th
ey h
elpe
d m
e re
alis
e th
at t
akin
g so
me
drug
s is
aga
inst
the
la
w
1584
1
2
Th
ey h
elpe
d m
e th
ink
abou
t w
hat
I w
ould
do
if so
meo
ne o
ffer
ed
me
drug
s
1585
1
2
Th
ey h
elpe
d m
e se
e th
at n
ot a
s m
any
youn
g pe
ople
tak
e dr
ugs
as I
tho
ught
1586
1
2
Th
ey h
elpe
d m
e fin
d ou
t w
here
to
go t
o ge
t in
form
atio
n or
hel
p ab
out
drug
s
1587
1
2
Th
ey h
elpe
d m
e un
ders
tand
why
peo
ple
take
dru
gs
1588
1
2
Th
ey h
elpe
d m
e to
avo
id d
rugs
Q19
4 Ha
ve y
ou g
ot h
elpf
ul in
form
atio
n ab
out d
rink
ing
alco
hol f
rom
an
y of
thes
e pl
aces
?
Tick
one
box
on
each
row
.
Yes
No
15
62
1
2
TV
1563
1
2
Ra
dio
1564
1
2
Ne
wsp
aper
s or
mag
azin
es
1565
1
2
Th
e in
tern
et
1566
1
2
FR
ANK
1567
1
2
He
lplin
es
Q19
5 Ha
ve y
ou g
ot h
elpf
ul in
form
atio
n ab
out t
akin
g dr
ugs
from
any
of
thes
e pl
aces
?
Tick
one
box
on
each
row
.
Yes
No
15
68
1
2
TV
1569
1
2
Ra
dio
1570
1
2
Ne
wsp
aper
s or
mag
azin
es
1571
1
2
Th
e in
tern
et
1572
1
2
FR
ANK
1573
1
2
He
lplin
es
Q19
6 In
the
last
twel
ve m
onth
s ha
ve y
ou h
ad a
ny le
sson
s, v
ideo
s or
di
scus
sions
in c
lass
on
the
follo
win
g to
pics
: Ti
ck o
ne b
ox o
n ea
ch r
ow.
Yes
No
Don
’t kn
ow
15
74
1
2
3
Smok
ing?
1575
1
2
3
Alco
hol?
1576
1
2
3
Dru
gs in
gen
eral
?
Cop
yright © 2014, Health and
Social C
are Inform
ation Centre. All rig
hts reserved
.

144 Smoking, drinking and drug use among young people in England in 2013
Q20
4 H
ave
you
ever
bee
n ex
clud
ed f
rom
sch
ool?
15
92
1 Q
205
Ye
s
2 Q
206
N
o
Q20
5 H
ow o
ften
hav
e yo
u be
en e
xclu
ded
from
sch
ool i
n th
e la
st 1
2 m
onth
s?
15
93
1
N
ot b
een
excl
uded
in t
he la
st 1
2 m
onth
s
2
O
nce
or t
wic
e
3
3
or 4
tim
es
4
5-
10 t
imes
5
M
ore
than
10
times
Q20
6 H
ow m
any
book
s ar
e th
ere
in y
our
hom
e? (
Do
not
coun
t ne
wsp
aper
s, m
agaz
ines
or
your
sch
ool b
ooks
)
15
94
1
N
one
2
Ve
ry f
ew (
1-10
boo
ks)
3
En
ough
to
fill o
ne s
helf
(11-
50 b
ooks
)
4
En
ough
to
fill o
ne b
ookc
ase
(51-
100)
5
En
ough
to
fill t
wo
book
case
s (1
01-2
00)
6
En
ough
to
fill t
hree
or
mor
e bo
okca
ses
(mor
e th
an 2
00 b
ooks
)
Q20
0 Th
e la
st s
et o
f qu
estio
ns a
re m
ore
gene
ral q
uest
ions
. Rem
embe
r th
at y
our
nam
e is
not
on
the
ques
tionn
aire
, so
no-o
ne w
ho
know
s yo
u w
ill f
ind
out
your
ans
wer
s.
Q20
1 D
o yo
u ge
t fr
ee s
choo
l mea
ls o
r vo
uche
rs f
or f
ree
scho
ol m
eals
?
1589
1
Ye
s
2
N
o
Q20
2 H
ave
you
ever
sta
yed
away
fro
m s
choo
l with
out
perm
issi
on
(tru
ante
d/bu
nked
off
)?
15
90
1 Q
203
Ye
s
2 Q
204
on p
age
47
N
o
Q20
3 H
ow o
ften
hav
e yo
u pl
ayed
tru
ant
(bun
ked
off)
in t
he la
st 1
2 m
onth
s?
15
91
1
N
ot p
laye
d tr
uant
in t
he la
st 1
2 m
onth
s
2
O
nce
or t
wic
e
3
3
or 4
tim
es
4
5-
10 t
imes
5
M
ore
than
10
times
Cop
yright © 2014, Health and
Social C
are Inform
ation Centre. All rig
hts reserved
.
Smoking, drinking and drug use among young people in England in 2013 145
Q20
9 Fi
nally
, jus
t to
che
ck, h
ave
you
smok
ed a
ny c
igar
ette
s in
the
last
se
ven
days
end
ing
yest
erda
y?
16
00
1 Q
210
Ye
s
2 Q
211
N
o
Q21
0 H
ow m
any
ciga
rett
es d
id y
ou s
mok
e on
ea
ch d
ay in
the
last
sev
en d
ays
endi
ng
yest
erda
y. I
f yo
u di
d n
ot s
mok
e on
a d
ay
writ
e 0.
16
01-6
02
ci
gare
ttes
Last
Mon
day
I sm
oked
16
03-6
04
ci
gare
ttes
Last
Tu
esda
y I
smok
ed
16
05-6
06
ci
gare
ttes
Last
Wed
nes
day
I sm
oked
16
07-6
08
ci
gare
ttes
Last
Th
urs
day
I sm
oked
16
09-6
10
ci
gare
ttes
Last
Fri
day
I sm
oked
16
11-6
12
ci
gare
ttes
Last
Sat
urd
ay I
sm
oked
16
13-6
14
ci
gare
ttes
Last
Su
nday
I s
mok
ed
Q21
1 W
ere
ther
e an
y qu
estio
ns y
ou m
eant
to
go b
ack
and
com
plet
e?
Plea
se c
heck
.
Th
ank
you
ver
y m
uch
for
you
r h
elp.
Q20
7 Th
e ne
xt q
uest
ions
ask
abo
ut h
ow y
ou h
ave
been
feel
ing
over
th
e la
st fe
w w
eeks
. Ple
ase
thin
k ab
out h
ow y
ou h
ave
been
fe
elin
g m
ost o
f the
tim
e.
Q20
8 Pl
ease
say
how
muc
h yo
u ag
ree
or d
isagr
ee w
ith th
e fo
llow
ing
sent
ence
s.
Stro
ngly
ag
ree
Tend
to
agre
e
Nei
ther
ag
ree
nor
disa
gree
Te
nd t
o di
sagr
ee
Stro
ngly
di
sagr
ee
Don
’t kn
ow
M
y lif
e is
goin
g w
ell
1595
1
2
3
4
5
6
M
y lif
e is
just
righ
t
1596
1
2
3
4
5
6
I
wish
I h
ad a
diff
eren
t kin
d of
life
1597
1
2
3
4
5
6
I
have
a g
ood
life
1598
1
2
3
4
5
6
I
have
wha
t I w
ant i
n lif
e 15
99
1
2
3
4
5
6
Cop
yright © 2014, Health and
Social C
are Inform
ation Centre. All rig
hts reserved
.

146 Smoking, drinking and drug use among young people in England in 2013 Cop
yright © 2014, Health and
Social C
are Inform
ation Centre. All rig
hts reserved
.

Smoking, drinking and drug use among young people in England in 2013 147
If y
ou s
till
have
som
e ti
me
left
you
mig
ht w
ant
to t
ry t
his
puzz
le
‘At T
he B
each
’ wor
d se
arch
W
ords
can
go
in a
ll di
rect
ions
and
may
ove
rlap.
C O
Y
K R
E C
Z H
S L
G Y
M
K N
B P
V V
L R
S A
S U
R F
I N
G F
S P
A P
H Q
D
W
E
B T
R H
W
R L
F W
K
A W
T
N C
I R
S I
D
F L
F M
G
N S
I Z
U Y
P Z
A A
W
A E
J F
E O
U
L Z
Z O
R
T O
M
K
W
O
M
D
O
V X
B N
C I
R B
H A
L I
I M
M
Z
S B
L E
I A
R E
T A
W
S B
X A
E I
Q
I K
N F
M
U J
S E
W
N P
S U
S J
D
K Q
T
T W
J
V D
Y
P G
I X
Z O
K
P L
R Z
K T
A R
F W
L
S W
G
A J
B U
T M
H
W
Y L
C I
Y N
B L
C A
S L
S L
W
U Y
F W
P
O
K K
S D
J
W
M
N F
N L
I U
A N
I I
E J
G E
N L
D
J T
P L
G V
I S
P F
Z C
G W
A
C P
I H
V K
J J
G R
I W
B
O
U H
U Q
R
J V
E E
U E
L F
Q
S N
M
E U
K C
S G
A P
I N
B E
K E
F T
Z X
E S
L K
A X
P D
K
G H
I D
P
Q
S U
J V
B I
M
E V
J E
P O
D
E
R T
S C
L S
N T
D
H C
T Z
P L
T N
D
L A
V A
P A
S A
H L
A O
B
R L
I K
S E
S S
A L
G N
U S
L O
S
N S
U N
S C
R E
E N
E O
O
I
Q
Y S
Z O
X
B B
L D
H
G F
V J
P Q
D
T
E T
U G
X Y
F C
K T
E F
F C
A A
J S
F A
A W
A
D
H G
N I
M
M
I W
S
L R
R A
S E
B E
E M
D
M
O
P
T N
F Z
L E
D
U L
W
U E
S E
S K
Q
H A
S T
B Z
S I
P K
C Y
A L
E G
S Q
T
W
O
N N
F U
C G
I C
S Y
C P
Y B
K V
V Z
H Q
L
I A
O
S X
H A
K A
D
X C
B I
V Q
W
U
E T
G P
E Z
C U
Q
T R
D
P L
N E
S A
N D
A
T V
A P
H W
G
H H
R U
D
L K
E N
C M
G
P B
H W
E
BE
ACH
BALL
BO
AT
BUCK
ET
FLIP
FLO
PS
KITE
LI
FEGU
ARD
SAIL
ING
SAND
SAND
CAS
TLE
SEA
SEAG
ULL
SEAS
HELL
SPAD
E ST
ARFI
SH
SUNG
LASS
ES
SUNS
CREE
N
SUNS
HINE
SU
RFBO
ARD
SURF
ING
SWIM
MIN
G
SWIM
SUIT
TO
WEL
WAT
ER
WAV
ES
Cop
yright © 2014, Health and
Social C
are Inform
ation Centre. All rig
hts reserved
.

BLANK PAGE
Cop
yright ©
201
4, Hea
lth and
Soc
ial C
are Inform
ation Cen
tre. All rig
hts rese
rved
.
Smoking, drinking and drug use among young people in England in 2013 149
P1
0500
/ P
1569
Sc
hool
Ser
ial N
umbe
r
SUR
VEY
OF
SMO
KIN
G, D
RIN
KIN
G A
ND
DR
UG
USE
AM
ON
G S
ECO
ND
AR
Y
SCH
OO
L C
HIL
DR
EN I
N E
NG
LAN
D 2
01
3:
TEA
CH
ER S
UR
VEY
Q
1
Doe
s yo
ur s
choo
l pro
vide
pup
ils w
ith le
sson
s ab
out
the
follo
win
g to
pics
?
Tick
on
e bo
x on
eac
h r
ow.
Yes
N
o
Toba
cco
Alco
hol
Dru
gs (
both
lega
l and
ille
gal)
IF N
O T
O A
LL,
GO
TO
Q1
1
The
next
set
of
ques
tions
are
abo
ut h
ow o
ften
pup
ils r
ecei
ve le
sson
s on
the
se t
opic
s. E
ach
year
w
ill b
e as
ked
abou
t se
para
tely
. Q
2
Thin
king
firs
tly a
bout
pup
ils in
yea
r 7
only
, how
of
ten
do t
hey
rece
ive
less
ons
on e
ach
topi
c?
Tick
on
e bo
x on
eac
h r
ow
Mor
e th
an
once
a
term
O
nce
a
term
Less
tha
n
once
a
term
, bu
t at
leas
t on
ce a
yea
rN
ever
No
Yea
r 7
pu
pils
at
this
sch
ool
Toba
cco
Alco
hol
Dru
gs (
both
lega
l and
ille
gal)
Appendix D: School questionnaire

150 Smoking, drinking and drug use among young people in England in 2013
Page
3
Q 6
Th
inki
ng a
bout
pup
ils in
yea
r 11
on
ly, h
ow o
ften
do
the
y re
ceiv
e le
sson
s on
eac
h of
the
fol
low
ing
topi
cs?
Tick
on
e bo
x on
eac
h r
ow
Mor
e th
an
once
a
term
O
nce
a
term
Less
tha
n
once
a
term
, bu
t at
leas
t on
ce a
yea
rN
ever
No
Yea
r 1
1
pupi
ls a
t th
is s
choo
l
Toba
cco
Alco
hol
Dru
gs (
both
lega
l and
ille
gal)
Q 7
W
ho c
ontr
ibut
es t
o th
e le
sson
s th
at p
upils
with
in y
our
scho
ol
rece
ive
on t
obac
co, a
lcoh
ol a
nd d
rugs
?
Ple
ase
tick
all
that
app
ly
A te
ache
r (o
f an
y su
bjec
t)
Scho
ol n
urse
Oth
er s
choo
l sta
ff m
embe
r
Loca
l dru
gs a
dvis
or
Polic
e
Yo
uth
wor
ker
So
meo
ne e
lse
(ple
ase
writ
e in
who
bel
ow)
Q 3
N
ow t
hink
ing
abou
t pu
pils
in y
ear
8 o
nly
, how
of
ten
do t
hey
rece
ive
less
ons
on e
ach
of t
he
follo
win
g to
pics
? Ti
ck o
ne
box
on e
ach
row
Mor
e th
an
once
a
term
O
nce
a
term
Less
tha
n
once
a
term
, bu
t at
leas
t on
ce a
yea
rN
ever
No
Yea
r 8
pu
pils
at
this
sch
ool
Toba
cco
Alco
hol
Dru
gs (
both
lega
l and
ille
gal)
Q 4
Th
inki
ng a
bout
pup
ils in
yea
r 9
only
, how
oft
en d
o th
ey r
ecei
ve le
sson
s on
eac
h of
the
fol
low
ing
topi
cs?
Tick
on
e bo
x on
eac
h r
ow
Mor
e th
an
once
a
term
O
nce
a
term
Less
tha
n
once
a
term
, bu
t at
leas
t on
ce a
yea
rN
ever
No
Yea
r 9
pu
pils
at
this
sch
ool
Toba
cco
Alco
hol
Dru
gs (
both
lega
l and
ille
gal)
Q 5
Th
inki
ng a
bout
pup
ils in
yea
r 10
on
ly, h
ow o
ften
do
the
y re
ceiv
e le
sson
s on
eac
h of
the
fol
low
ing
topi
cs?
Tick
on
e bo
x on
eac
h r
ow
Mor
e th
an
once
a
term
O
nce
a
term
Less
tha
n
once
a
term
, bu
t at
leas
t on
ce a
yea
rN
ever
No
Yea
r 1
0
pupi
ls a
t th
is s
choo
l
Toba
cco
Alco
hol
Dru
gs (
both
lega
l and
ille
gal)
Cop
yright ©
201
4, Hea
lth and
Soc
ial C
are Inform
ation Cen
tre. All rig
hts rese
rved
.

Smoking, drinking and drug use among young people in England in 2013 151
Page
5
Q 1
0
Wha
t dr
ug e
duca
tion
or a
dvic
e on
tob
acco
, alc
ohol
or
drug
s do
es y
our
scho
ol o
ffer
out
side
of
form
al le
sson
s?
Ple
ase
tick
all
that
app
ly
Scho
ol a
ssem
blie
s
One
to
one
advi
ce
Leaf
lets
Post
ers
Spea
kers
fro
m o
utsi
de
So
met
hing
els
e (p
leas
e w
rite
in b
elow
)
Q 1
1
That
is t
he
end
of t
he
ques
tion
nai
re. T
han
k yo
u v
ery
mu
ch f
or y
our
tim
e.
Q 9
D
oes
your
sch
ool o
ffer
any
dru
g ed
ucat
ion
or a
dvic
e on
tob
acco
, al
coho
l or
drug
s ou
tsid
e of
for
mal
less
ons?
Q
10
Yes
Q
11
No
Q 8
W
hat s
ourc
es, i
f any
, do
you
use
whe
n pr
epar
ing
less
ons
on
toba
cco,
alc
ohol
and
dru
gs?
Pl
ease
tic
k al
l tha
t ap
ply
FRAN
K w
ebsit
e
W
eb s
earc
h en
gine
s (e
.g. G
oogl
e)
Dru
g Ed
ucat
ion
Foru
m
TES
(Tim
es E
duca
tion
Supp
lem
ent)
Con
nect
PSHE
Ass
ocia
tion
Oth
er te
ache
rs
So
meo
ne/s
omet
hing
else
(pl
ease
writ
e in
bel
ow)
D
o no
t use
any
sou
rces
Cop
yright ©
201
4, Hea
lth and
Soc
ial C
are Inform
ation Cen
tre. All rig
hts rese
rved
.

About NatCen Social ResearchNatCen Social Research is an independent institute specialising in social survey andqualitative research for the development of public policy. Research is in areas such ashealth, housing, employment, crime, education and political and social attitudes. Projectsinclude ad hoc, continuous and longitudinal surveys, using face to face, telephone andpostal methods; many use advanced applications of computer assisted interviewing.
About the National Foundation for Educational ResearchThe National Foundation for Educational Research has been engaged in educationalresearch since 1946 and is an independent foundation with charitable status. TheFoundation undertakes research and evaluation for local and national agencies, in thegovernment, commercial and charitable sectors. The research programme is concernedwith all aspects of education and training, a major part being concerned with the publiceducation system.