smoke and gases produced by burning aircraft interior ... · pdf...
TRANSCRIPT

~Reference book not to
BUILDING SCIENCE SERIES loAUG 6 1971
A111D3 7M7D7
Smoke and Gases
Produced by Burning Aircraft
Interior Materials
U.S. DEPARTMENT OF COMMERCENational Bureau of Standards

Announcing—The Building Science Series
The "Building Science Series" disseminates technical information developed at the
Bureau on building materials, components, systems, and whole structures. The series
presents research results, test methods, and performance criteria related to the structural
and environmental functions and the durability and safety characteristics of building
elements and systems.
These publications, similar in style and content to the NBS Building Materials and
Structure Reports (1938-59), are directed toward the manufacturing, design, and con-
struction segments of the building industry, standards organizations, officials responsible
for building codes, and scientists and engineers concerned with the properties of building
materials.
The material for this series originates principally in the Building Research Division
of the NBS Institute for Applied Technology. Published or in preparation are:
BSSl. Building Research at the National Bureau of Standards. (In preparation.)
BSS2. Interrelations Between Cement and Concrete Properties: Part 1, Materials
and Techniques, Water Requirements and Trace Elements. 35 cents
BSS3. Doors as Barriers to Fire and Smoke. 15 cents
BSS4. Weather Resistance of Porcelain Enamels: Effect of Exposure Site and other
Variables After Seven Years. 20 cents
BSS5. Interrelations Between Cement and Concrete Properties: Part 2, Sulfate
Expansion, Heat of Hydration, and Autoclave Expansion. 35 cents
BSS6. Some Properties of the Calcium Aluminoferrite Hydrates. 20 cents
BSS7. Organic Coatings. Properties, Selection, and Use. $2.50
BSS8. Interrelations Between Cement and Concrete Properties: Part 3, Compressive
Strengths of Portland Cement Test Mortars and Steam-Cured Mortars.
55 cents
BSS9. Thermal-Shock Resistance for Built-Up Membranes. 20 cents
BSSIO. Field Burnout Tests of Apartment Dwelling Units. 25 cents
BSSll. Fire Resistance of Steel Deck Floor Assemblies. 25 cents
BSS12. Performance of Square-Edged Orifices and Orifice-Target Combinations as
Air Mixers. 15 cents
BSS13. Shrinkage and Creep in Prestressed Concrete. 15 cents
BSS14. Experimental Determination of Eccentricity of Floor Loads Applied to a
Bearing Wall. 15 cents
BSS15. Interrelations Between Cement and Concrete Properties: Part 4, Shrinkage of
Hardened Portland Cement Pastes. (In press.)
BSS16. Techniques for the Survey and Evaluation of Live Floor Loads and Fire Loadsin Modern Office Buildings. (40 cents)
BSS17. Causes of Variation in Chemical Analyses and Physical Tests of Portland
Cement. (In press.)
Send orders with remittance to: Superintendent of Documents, U.S. GovernmentPrinting Office, Washington, D.C. 20402. Remittances from foreign countries
should include an additional one-fourth of the purchase price for postage.
[See mailing list announcement on last page.]
UNITED STATES DEPARTMENT OF COMMERCE • Maurice H. Stans, Secretary
NATIONAL BUREAU OF STANDARDS • A. V. Astin, Director
Smoke and Gases Produced by
Burning Aircraft Interior Materials
D. Gross, J. J. Loftus, T. G. Lee, and V. E. Gray
Building Research Division
Institute for Applied Technology
National Bureau of Standards
Washington, D.C.
Building Science Series 18
Issued February 1969
For sale by the Superintendent of Documents, U.S. Government Printing Office
Washington, D.C. 20402—Price 35 cents

Contents
Page
1. Introduction 1
2. Test methods 1
2.1. Material identification 1
2.2. Smoke measurements 2
2.3. Gas analysis 3
3. Test results and analysis 3
3.1. Material identification 3
3.2. Smoke measurements 4
3.3. Gas analysis 8
4. Discussion 9
5. Conclusions 11
6. References 11
7. Appendix 1. Gas analysis 12
7.1. Colorimetric indicator tubes 12
7.2. Specific ion electrode 13
8. Appendix 2. Materials description 16
9. Appendix 3. Summary of test results—smoke and gas concentration 21
10. Appendix 4. Typical smoke accumulation curves for selected ma-
terials 26
II

Smoke and Gases Produced by Burning
Aircraft Interior Materials*
D. Gross, J.J. Loftus, T. G. Lee, and V. E. Gray
Measurements are reported of the smoke produced during both flaming and smolderingexposures on 141 aircraft interior materials. Smoke is reported in terms of specific opticaldensity, a dimensionless attenuation coefficient which defines the photometric obscurationproduced by a quantity of smoke accumulated from a specimen of given thickness and unitsurface area within a chamber of unit volume. A very wide range in the maximum specific
optical density was observed. For the majority of materials, more smoke was produced duringthe flaming exposure test. However, certain materials produced significantly more smoke inthe absence of open flaming.
During the smoke chamber tests, indications of the maximum concentrations of CO, HCl,HCN, and other selected potentially toxic combustion products were obtained using com-mercial colorimetric detector tubes. A study was made of the operation, accuracy, and limi-
tations of the detector tubes used. Measurements of the concentrations of HCl were also madeusing specific ion electrode techniques.
Qualitative identification of the major components of the original test materials wasaccomplished primarily by infrared absorption spectrophotometry.
Key Words: Aircraft materials; combustion products; fire tests; interior finish; smoke;toxic gases.
1. Introduction
\ Regulatory safeguards for reducing the fire
ij
hazard of transport aircraft interior materials are' contained in the Federal Aviation RegulationsJ (FAR-Part 25, amended October 24, 1967) of the|i Federal Aviation Administration (FAA), whichJ specify the use of flame-resistant materials. How-jever, no requirements exist relating to the pro-
||duction of smoke and potentially toxic products,
ji Recent accidents involving fire, and the de-
'! velopment of new materials and test methods,suggested that additional technical information
,i should be assembled. Accordingly, the FAA stud-
j2. Test
I2.1. Material Identification
Qualitative identification of the major com-
I
ponents of the materials prior to test was ac-
j|
complished primarily by infrared absorption
I
spectrophotometry. This involved preparing a
;
specimen in either film or solid pellet form, withor without potassium bromide, suitable for ob-
(
taining an infrared absorption spectrum. In somecases, solvent extraction and separation were nec-essary in order to obtain a suitable film. Except
ji* The work reported in this paper was sponsored by the Federal Aviation
I Administration, Washington, D.C. under Contract No. FA66NF-AP-7,' Project No. 510-001-1 IX.
led the flammability and smoke characteristics of
over 100 representative interior materials [1]', andperformed full-scale fire tests within an airplanefuselage with complete cabin furnishings and in-
terior decor under conditions simulating normaloperation [2]. The present laboratory studies area part of FAA Project No. 510-001-llX, Haz-ardous Combustible Characteristics of Cabin Ma-terials, and were undertaken with the primaryobjective of providing measurements on the gener-ation of smoke and decomposition products usinga recently developed smoke test chamber [3].
Methods
for wools, which were identified by nitration tests,
and other spot tests which were employed for
cellulosic materials, most materials were identified
by comparison of their infrared absorption spectrawith reference spectra of known compositions.When some estimate of the percentage compositionof blends or mixtures was possible, this was in-
cluded and listed in order of major to minor com-ponents. For fabric blends, valid quantitativeestimates are usually very difficult to make. Poly(vinyl chloride) (PVC) and poly (vinylidene chlo-
ride) polymers are difficult to detect specifically
' Figures in brackets indicate the literature references on page 11.
1

Figure 1. Smoke test chamber.
by infrared techniques because they have weakabsorption bands and because pigments, fillers
and polymer components with which they aremixed generally have overlapping spectral bands.As much as 20 to 40 percent of PVC or poly(vinylidene chloride) could go undetected.
Generic names are given in all cases, eventhough the spectra for some materials were so
similar to reference spectra identified by tradename from the literature that very little doubtexisted as to source.
2.2. Smoke Measurements
The smoke level was determined by measuringthe progressive attenuation of a light beam passedthrough the smoke aerosol within an enclosedsmoke chamber (see figs. 1 and 2). Smoke is
reported in terms of specific optical density, adimensionless attenuation coefficient which defines
the amount of smoke accumulated from a speci-
men of unit surface area in terms of its photo-metric obscuration over unit path length within achamber of unit volume. For the typical appli-
cation in which the material is to be used as aninterior finish (e.g. on walls, ceilings, floors), thefire-exposed surface area of the specimen governsits smoke-production behavior. Specimen thick-
ness (unit weight) correspond to the materials assupplied and used. The basis and limitation of themethod were described in detail in a recent paper
[3], which also discussed the general relationshipbetween the measured specific optical density andthe level of smoke through which a light (oi!!
lighted exit sign) may be seen.The tests involved a thermal irradiation ex-i
posure of 2.5 W/cm^ (2.2 Btu/ft^-s)^ normal tothe exterior surface of a 3 X 3 in specimen and,were performed under both flaming and non-flaming (smoldering) exposure. To induce openflaming in the former small pilot (0.30SCFH natural gas diffusion flame in a in i.difl
tube) was applied at the base of the specimen.: j""
These conditions were selected to provide a widcjrange of smoke levels for different types of ma-terials. The size of the specimen and the volumffflof the chamber were such that complete oxidationsof practically all materials could occur withoutappreciable decrease in oxygen content. Materialswere furnished by FAA and were tested using s'
typical section in the thickness suppHed.
Optical density, defined as D = log1̂ -
(where T = percent light transmission), is th^single most characteristic measure of the obscuringquality of a smoke. Specific optical density, Dis a property of a specimen of given thickness-
tor
A-ChamberB-ExhausC blowerC-PhoCometer light sourceD-Blowout panelE-Hinged door with windowF-Air pressure tjage
G-Gas flowmeter:i-Blower and damper leverI-PhotometerJ-Pilot burner lever
K-Service openingsL-Support frameM-Temperature controllerN-Main power switch0-lnternal light switchP-Au to transformer
3
Q-Gas, air shut-off valvesR-Electric ignitor switchS-Gas , air control valvesT-Gas sampling port
Figure 2. Smoke chamber assembly.
2 1 British thermal unit (Btu) =1055 watt second (W"s).
2

and represents the optical density measured over' unit path length (L), within a chamber of unit^ volume (V), produced from a specimen of unit
J V V]surface area (A). Thus, D, = D =
1 , 100log -jT .
< For the test chamber, V = 18 ft^ (0.510 m^),
\ A = 0.0456 ft^ (0.00424 m=), and L = 3 ft (0.914
]|m). Ideally, the change in Ds with time during
i' the smoke accumulation process will depend only
!jupon the thickness of the specimen, its chemical
s|and physical properties, and the exposure con-
£;ditions. The results are reported in terms of (a)
(jmaximum (total) smoke accumulation. Dm, (b)
i[maximum rate of smoke accumulation (over a
[|2-min period), Rm, and (c) the time period, tc, to
j!reach a "critical" specific optical density of 16,
' under the test conditions.
I
However, there are definite limitations to the
use of specific optical density for extrapolation
,jj
and comparison with other box volumes, specimenareas and photometric systems, and for extension
to human visibility. The degree to which such
Ijextensions are valid depend upon a number of
j
major assumptions: the smoke generated is uni-
j
formly distributed and is independent of theamount of excess air available and of any specimen
I
edge effects; coagulation and deposition of smoke
j
is similar regardless of the specimen size, or the' size and shape of the chamber; for any given
ij smoke the optical density is linearly related to
I
concentration ; and human and photometric vision
]
through light-scattering smoke aerosols, expressed
j
in terms of optical density, are similar.
2.3. Gas Analysis
j
Indications of the concentrations of gaseous
I
products were obtained by drawing a sample of
,the gas mixture in the smoke test chamber through
' commercial colorimetric gas detector tubes and
I
3. Test Results
3.1. Material Identification
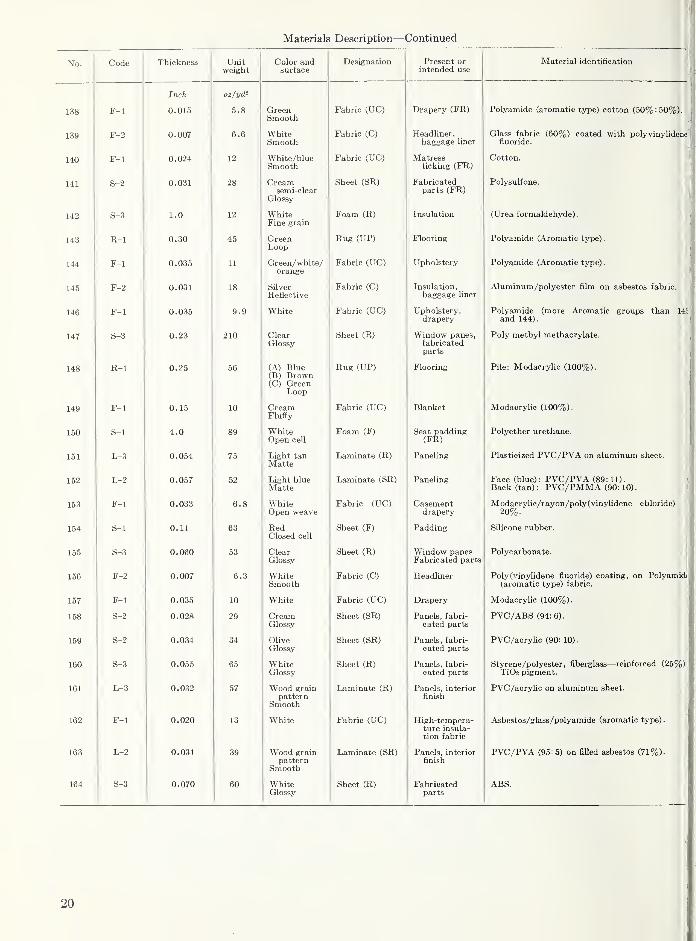
i Appendix 2 is a list of materials, showing nu-merical designation, thickness, unit weight, type,
use, and approximate chemical composition of themajor components. Of the 141 materials studied,
! these may be divided into the following groups:
Sheet materials 46Laminates 21Fabrics 38Rugs 10Pads, Insulation, and Assemblies 24Films 2
Of the 38 fabrics composed of woven fibers,
fi only a few were essentially natural fibers (cotton
reporting results on the basis of the manufacturerscahbrations for the selected gases [4]. Essentially,
a colorimetric tube is a small-bore glass tube con-taining a chemical packing which changes colorwhen exposed to a specific component of a gasmixture, and the length of color stain is relatedto the concentration of that component for agiven quantity and rate of flow of gas. Layers of
precleaning granules and a plug to absorb inter-
fering gases and to control the sample flow rateare generally provided. Sampling was done severaltimes during each smoke test using a small syringeor bellows pump designed to aspirate a measuredvolume of gas each stroke. The gas detector tubewas inserted into the smoke chamber from thetop, and was situated 3 in below the top surfaceof the chamber (approximately 25 in above thelevel of the specimen). In some instances an at-
tempt was made to extend the range of theseindicators by drawing less than the recommendedgas volume through them and reporting results
on the basis of individual laboratory calibrations,
as reported in a later section. More detailed dis-
cussion of product gas analysis by colorimetricdetector tubes and by specific ion electrode arepresented in appendix 1.
Indicator tubes were used to detect CO, HCN,HCl, HF, SO2, NO + NO2, NH3, CI2 and COCI2,since these gases have generally been consideredtoxicologically hazardous compared with otherpossible components. However, these are not nec-essarily the only potentially toxic componentsreleased. No attempts were made to determinehigh concentrations of CO2 or low concentrationsof O2, or to consider the type, size, or concen-tration of smoke particles in toxicological terms.Information on the analytical limits for the tubesused, and references to the toxic hazard limits of
these gases are discussed in appendix 1. WhereHCl was one of the products, in many cases thegas was also absorbed in water and analyzed by achlorine ion electrode to provide a more accurateindication at high concentrations.
and Analysis
and wool), a few were composed of a mixture of
natural and artificial fibers, but the bulk of thefabrics were made from 100 percent artificial
fibers, including acrylics, modacrylics, polyesters,
polyamides (nylon-type), vinyl, and glass.
Of the sheet and laminate materials, approxi-mately one-half were composed entirely or pre-
dominantly of poly vinyl chloride (PVC), and theremaining sheet and laminate materials were com-posed of acrylonitrile-butadiene-styrene (ABS),methyl methacrylate, and other copolymers,blends, and varieties of polymers. The rugs tested
included wool, modacrylics, polyamide (nylon andaromatic types), and polypropylene. Of the padsused for seats, there were several urethane foammaterials and one rubber (chloroprene). The ma-terials used as ceiling or bulkhead insulation in-
3

200 300 ItOO
Mpximum Snoke D^-
Figure 3. Frequency distribution of maximum smoke values.
Flaming exposure—11^0 materials.
eluded mainly glass fiber materials or a paperhoneycomb sandwich.
3.2. Smoke Measurements
Smoke measurements are summarized in ap-pendix 3 in terms of the maximum smoke accumu-lation {Dm), the maximum rate of smoke accumu-lation {Rm) and the time {tc) to reach a specific
optical density of 16 for both flaming and smolder-ing exposure. These results represent averages of
duplicate tests (with few exceptions). For Dmvalues up to 200, the standard deviation was11.8 for flaming and 9.2 for nonflaming tests.
Smoke buildup curves for typical flaming andsmoldering tests on selected types of materials
are shown in appendix 4.
A wide range of Dm values was measured.Slightly more than 15 percent of the materials
produced smoke corresponding to a = 16 or
less, for both flaming and smoldering exposures.
These included materials composed of glass, as-
bestos, aromatic polyamide, polyimide plus others,
but many of these materials were very thin (light-
weight). Dm values in excess of 200 were recordedfor flaming and smoldering exposures on approxi-mately 20 percent of the materials.
For flaming exposure of 140 materials, fre-
quency distribution histograms of the maximumsmoke values are shown in figure 3 for all materials,
and in figure 4 within the classification groups:(a) fabrics, (b) rugs, (c) sheets, films, and lami-
nates, and (d) pads, insulations, and assemblies.
Of the materials in the Dm < 16 category, 16were fabrics, 6 were sheets or films, and 4 wereglass or asbestos fiber insulations.
With one exception, all materials in the Dm <. 16
category under flaming conditions were also Dm <16 under nonflaming conditions.
Figures 5, 6, and 7 comprise a complete histo-gram showing smoke and toxic gas concentrationsfor flaming and nonflaming exposures on eachmaterial based on the data in appendix 3. Ma-terials have been arranged according to classifi-
cation by groups, by composition, and by gener-ally increasing weight within each subgroup.
It should be noted that only the "front" sideof a material was exposed, and that specimensexhibited a very wide range in their physical andthermal behavior during flaming and nonflamingexposure. Materials which melted at fairly lowtemperatures, including nylon, polysulfone, andpolyethylene, flowed to the bottom or drippedoff the sample holder in varying degrees, resultingin less smoke. Some materials evaporated fairly
rapidly before extensive decomposition or com-bustion took place. All urethane foam materialsproduced more smoke under smoldering exposurethan with flaming exposure, except in one in-
stance where the material was noted to shrinkinto a corner of the holder and was, therefore,
subjected to less radiation. Rubber (chloroprene),
ABS, methacrylate, and PVC materials nearlyalways produced more smoke under flaming ex-
posure. Under thermal radiation exposure alone,
elastomers generally formed a bell-shaped pro-
trusion at their center through which gaseousproducts streamed out rapidly. The maximumsmoke level depends upon the thickness (anddensity) of the specimen, and for some materials
Dm may be expected to increase with thickness
but not always in direct proportion [3].
FABRICS (38)
12200 I4.OO 600
Maximum Smoke D„
SHEETS, FILMS,
LAMINATES (68)
200 I4-OO 600
Maxlmujn Smoke Df„
PADS, INSULATION
ASSEMBLIES (2)4.)
JZL0 200 ItOO 600
Maximum Smoke D„
200 I4.OO 600
T.'axlmum Smoke Drn
Figure 4. Frequency distribution of maximum smoke values
by groups. Flaming exposure—J^O materials.
4

pffl py^ rrmn nj^^Ti
-1—I—r-T—1~
km
m
5

JX.
Ft]
•a
33
2-5
illto o o
<D to O
CO
6

7
I 3*52
Indicated Gas Concentration,HCl HOI HCH
3 mln k mln 6 mln 6
50 6070 6085 60
180160170180?00
TIME, min
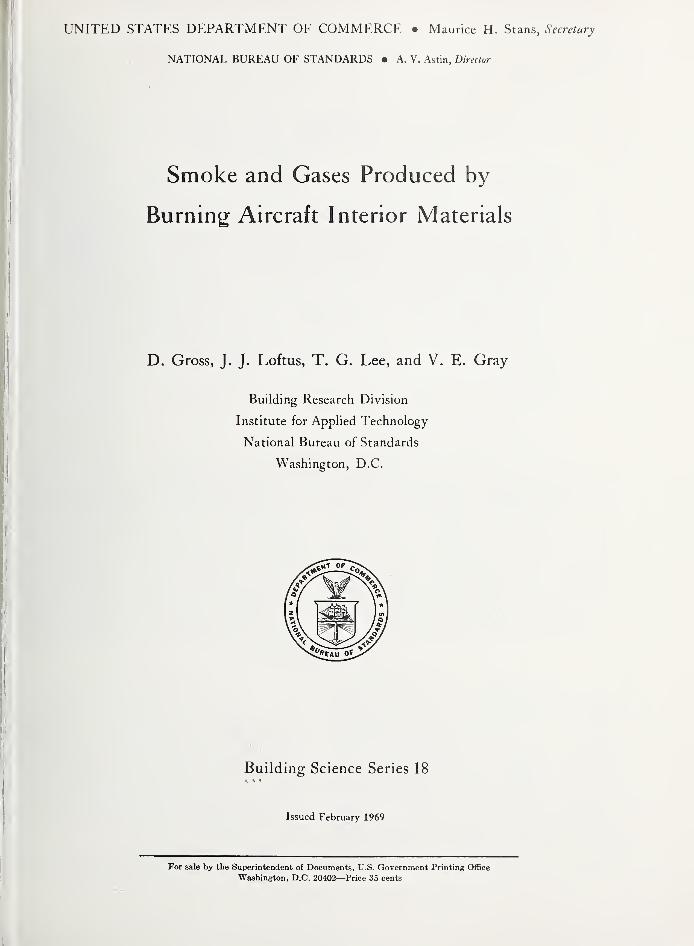
Figure 8. Reproducibility of smoke and gas concen-
tration indications. Sample No. U (PVC/PVA/ABS)nonflammg exposure.
3.3. Gas Analysis
"Maximum" indicated concentrations of gases
are listed in appendix 3 along with the smokedata. These values are based on the average of
two separate determinations, except that addi-
tional tests were made where large discrepancies
(greater than a factor of 2) between duplicate
values were obtained. Unlike the measurement of
optical density of smoke, which is recorded con-
tinuously to obtain a maximum, the concentra-
tions of selected components was measured peri-
odically. Particularly for components which changerapidly, therefore, the indicated concentrationvalues may not necessarily be the true maximumvalues. For the materials tested, the highest indi-
cated concentrations were 2200 ppm CO, 2500ppm HCl, and 90 ppm HCN. These concentrations
refer to the same exposed area of specimen andchamber volume used, but to a wide range of
specimen weights.
Since the primary objective of this study was to
ascertain approximate values, no extensive efforts
were made to improve reproducibility. As a test
of reproducibility for a PVC material (specimenNo. 44), 5 separate smoldering exposure tests wereconducted with the results shown in figure 8. Thisfigure shows the five replicate smoke curves and atabulation of indicated gas concentrations at spe-
,1
cific times during each test. The measurementranges were on the order of d=20 percent for COand HCN and ±30 percent for HCl, and suchvariations may be considered typical of the maximum indicated concentration values under the' ["
test conditions. ^
Because the plastic materials studied were frommany manufacturers and generally contained plaS'
ticizers, fillers, and other additives, it is difficult^
to relate quantitatively gaseous product concen-'trations with polymer composition. In general,'
HCl was produced by polyvinyl chloride and;modacrylic materials, HF from polyvinyl fluoride'HCN from wool, urethane, ABS, and modacrylicsand SOo from polysulfone and rubber materialsCO was produced by almost all the samples ir^
varying amounts depending on the type of material.
It has been shown [5] that the amount of ^given gas produced during pyrolysis and its rat^'
of generation are strongly temperature dependent^Thus, any materials or processes which affect th('
temperature profile across the specimen (e.g. fillerf
and plasticizers which produce surface crustingintumescence, etc.), could readily influence th(
concentration of gaseous products. For certaii
materials, higher concentrations of some gase:
may be produced under conditions of insufficien
air, e.g. 10 percent oxygen [6].
TIME, mln
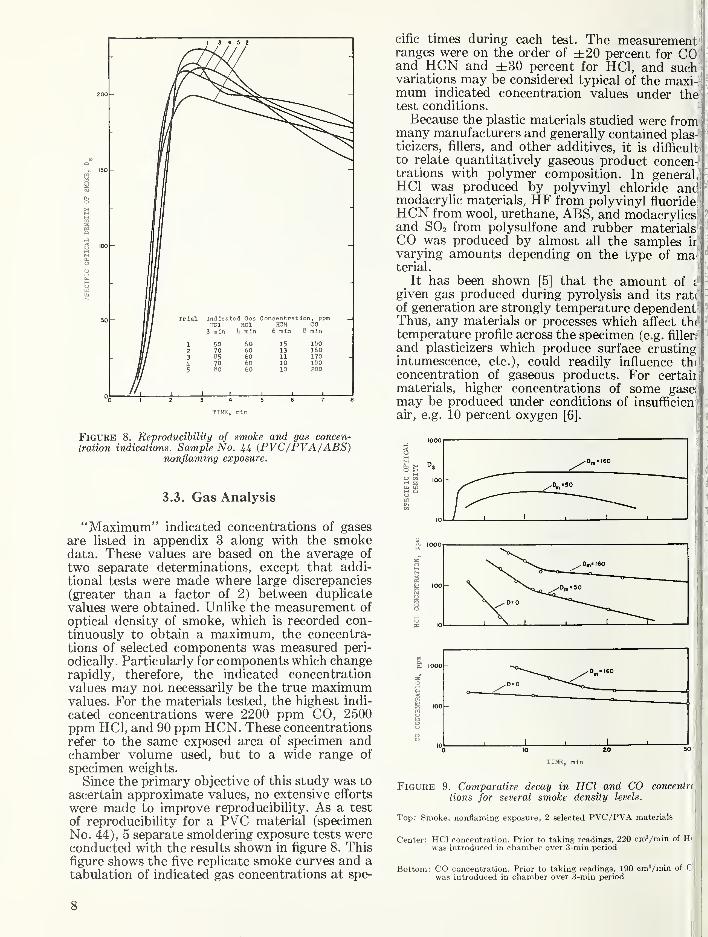
Figure 9. Comparative decay in HCl and CO conceninHons for several smoke density levels.
Top: Smoke, nonflaming exposure, 2 selected PVC/PVA materials
Center: HCl concentration. Prior to taking readings, 220 cm'/min of Hiwas introduced in chamber over 3-min period
Bottom: CO concentration. Prior to taking readings, 190 cm'/min of dwas introduced in chamber over 3-min period

Sampling was performed sequentially, proceed-
ing generally from HCl and HF to HCN to CO,jand was initiated when optical density of the
jsmoke approached its peak. This procedure was
lij ij
followed because of the fairly rapid decay in
halogen acid concentration resulting from adsorp-
tion on (and reaction with) moisture, smoke parti-
cles, and chamber surfaces. To facilitate subse-
quent data comparison, sampling for HCl and HFwas generally initiated at the beginning of the
minute close to the maximum smoke level, andat 2-min intervals thereafter for other gases.
Gas temperature at the sampling tube inlet
generally ranged from 46 to 52 °C (115 to 126 °F),
the higher temperatures occurring during flaming
tests on heavier materials. Due to the cooling
effect of the precleaning layers of the indicator
tubes, the temperature of the gases passing the
indicating layers were within the prescribed maxi-
mum temperature limits. The sampling rate wasgenerally unaffected by either the elevated temper-
ature of gases or by heavy smoke particle concen-
trations.
Hydrogen chloride is generally released rapidlyduring combustion or pyrolysis of polyvinyl chlo-ride, modified acrylics and other retardant-treatedmaterials [7, 8]. Maximum levels were generallyhigher under flaming compared to smoldering ex-
posure conditions presumably due to the highertemperature involved and the resultant greaterrate of release. The HCl concentration changedrapidly as a result of its high reactivity, solubility
in water, and adsorption on smoke particles andwall surfaces. The type of surface as well as thetotal area of the interior walls have a pronouncedinfluence on the adsorption and settling (or decay)rate of HCl and smoke. To illustrate the decayof both HCl and CO, a suitable concentration of
the pure component was metered into the bottomof the chamber under both smoke-free {D = 0) andsmoke-filled conditions. Figure 9 shows the indi-
cated concentrations of HCl and CO. In thesetests involving smoldering specimens only, thegas concentration levels are obviously higher be-cause a portion of the gas is introduced by com-bustion. The decay rates are also higher.
4. Discussion
In the work described in this report, it waspresumed that the test specimens were repre-
sentative in thickness and density of the materials
intended for actual use as interior finishes. For afew materials supplied in thicknesses greater than1 in, the test specimen was trimmed to a thickness
of 1 in to fit the size of the specimen holder. It
should be evident that the density of smoke, the
concentration of gaseous products, and the heatrelease characteristics are properties of the speci-
men as tested and will be different for other thick-
nesses and densities.
Limitations were previously noted to the use of
specific optical density for extrapolating the smokedensity measured in the laboratory test to otherenclosure volumes and surface areas. Within theselimitations, the relationship between the measured
yvalue of and the geometrical factor for
various values of light transmission (or optical
density) is shown in figure 10. The optical densitylevel through which a lighted exit sign may beseen can vary over wide limits depending on the
GEOMETRICAL FACTOR.V
AL
50 100
COMPARTMENT VOLUMESPECIMEN SURFACE AREA X OPTICAL PATH LENGTH
Figure 10. Specific optical density versus geometrical factor for five selected light
transmission values.
9

general illumination level, on the contrast thresh-
old and the extent to which the observer's eyeshave been dark-adapted, as well as on the irri-
tating nature of the smoke. In figure 10, five lines
are shown for transmission values ranging from80 to 2.5 percent (optical density 0.1 to 1.6) corre-
sponding to a wide range of visual limits [3].
Using this figure, sample computations havebeen made in Table 1 for 3 selected values of D^.
If it is assumed that a lighted exit sign can beseen when the transmission is down to 40 percent(optical density 0.4), and an aircraft cabin has avolume of 10,000 ft^ within which smoke is uni-
formly dispersed, then Table 1 shows the estimatedarea A of material, the smoke from which mayjust begin to limit seeing the exit sign at various
distances L.
Up to this point, only geometrical factors havebeen considered, but time is certainly important,and the choice of a critical specific optical densityfor each material can presumably also be basedon a prescribed time period which is sufficiently
long to permit escape or defensive action. Fromappendix 3, it may be noted that the time periods
to attain a critical specific optical density of 16ranged from 0.2 to over 20 min. It was previouslynoted [3] that a specific optical density of 16could represent a possible critical limit.
Although the three factors, total smoke accumu-lation {Dm), maximum rate of smoke accumulation(Rm), and the time period to reach a "critical"
optical density {tc), are directly related to thesmoke obscuration hazard, their relative weightingis not entirely obvious. One suggestion for a single
overall hazard index based on the results of this
test was made in the appendix of reference 3.
However, it should be emphasized that additionalexperimental verification would be desirable prior
to establishing rigorous smoke hazard limits for
interior materials.
This study was concerned with the limited
problem of measuring the optical density of smokeas it relates to the obscuration of human vision.
No attempt was made to evaluate complicationsdue to eye irritations, to respiratory effects from
Table 1. Critical (projected) surface area of material burnedin 10,000 ft^ volume(for optical density = 0.4)
VSpecific Light Specimenoptical AL distance area
density Ds (for CD = 0.4) L A
10 25 3 ft 133 ft2
10 25 10 4010 25 30 13.310 25 100 4
50 125 3 26.750 125 10 850 125 30 2.6750 125 100 0.8
100 250 3 13.3100 250 10 4.0100 250 30 1.3100 250 100 0.4
S 10 20 90 100 200 900 1000
INDICATED CONCEMTRATION, SMOKE TEST CHAMBER, ppm
Figure 11. Gas concentration in 10,000 ft^ cabin based onindicated concentration in smoke test chamber.
inhaled smoke particles, or to hysteria or associ-
ated physiological or psychological factors.
The indicated concentrations of gaseous prod-ucts listed in appendix 3 represent values measuredat the sampling location and are associated withthe prescribed exposure conditions on a specimen
i
of given exposed area (2^6 in square) within atotally enclosed chamber of 18 ft^ volume. Speci-
mens were tested in the thickness and weightsupplied, which varied over a wide range. Con-centration measurements were made periodically
from the time when the optical density of thesmoke approached its peak. Any realistic evalu-
ation of the gas concentrations likely to be en-
countered in a real fire situation must take into
account actual areas and thicknesses of the ma-terials exposed and the volumes in which the '
gases are dispersed. Also of importance are therate of fire growth, the effects of adsorption and
,
reaction, the extent of ventilation, dilution, and/or 1
application of extinguishing agents, and otheri
factors outside the scope of this study. Wherespecimen area and chamber volume are the onlyvariables and uniform mixing is assumed, an ap-proximate relationship between the gas concen-tration measured in the smoke chamber and theprojected concentration within a much larger
chamber, such as an aircraft cabin, is given by
V-/ cabin — Otest ~T~
10

?his simply scales concentration (C) in direct
iroportion to the area A of specimen involved
,nd in inverse proportion to the chamber volume^. As an example, the gas concentration in a
0,000 ft^ cabin is shown in figure 11 for a series
f lines corresponding to surface areas of 10, 100,
,nd 1,000 ft2.
It should be noted that such scaled estimates
.ssume similar (or uniform) distribution of the
aseous components, and large differences mayesult in the case of active gases and vapors/hich tend to be adsorbed on surfaces, e.g. HF
and HCl, and gases and vapors which tend tostratify in layers.
Finally, it should be noted that relationshipsbetween the indicated concentrations measured in
the smoke chamber and physiological or toxico-logical effects are also outside the scope of this
study. The table of toxicological data, assembledfrom open literature sources has been included for
reference purposes only. Information on the com-bined, or synergistic, effects of several noxiouscomponents (including smoke j articles) is ap-parently very limited.
5. Conclusions
Based upon the tests performed and an evalu-
tion of the results, the following conclusions have(teen reached:
1. Materials currently used as interior furnish-
ings for aircraft cabins, and those being con-
sidered for future use, vary considerably in
their production of smoke and potentially
toxic products under simulated fire con-
ditions.
2. The laboratory test method for generating
smoke and measuring its optical density ap-
pears to be a useful tool for the quantitative
classification of materials, and for the possible
establishment of revised fire safety standardsand criteria for controlling smoke production.
Optical density is the single most character-
istic measure of the visual obscuring quality
of a smoke.
3. For evaluating smoke production, bothsmoldering and active flaming conditions
should be considered. For the majority of
materials, more smoke was produced duringthe flaming exposure test. However, certain
materials produced significantly more smokein the absence of open flaming.
4. Within the limitations and assumptions cited,
the specific optical density of smoke measured
in the laboratory may be extrapolated tocabin volumes and surface areas of com-bustible furnishings in order to provide guide-lines for cabin area limitations, or to estimatetime periods available for escape or defensiveaction.
Indications of the concentrations of poten-tially toxic combustion products can be con-veniently and inexpensively obtained duringthe smoke production test using calibratedcommercial colorimetric tubes; however,these are suitable only where interferences
by other gases are absent, and where pre-cision is not of primary importance. Thespecific ion electrode is also a convenientmethod of measuring the concentrations of
halogen acid gases. Furthermore, if an at-
tempt is made to relate the indicated concen-trations measured in the smoke chamber in
terms of toxicological limits, caution must beexcercised. It is essential that proper con-sideration be given to (a) scaling of the areasand volumes in the proposed situation, (b)
the integrated dosage where concentrationvaries with time, (c) the synergistic effects
of several components (and smoke particles),
and (d) the effects of relative humidity, ele-
vated temperature, stratification, adsorptionon surfaces, and physiological factors notconsidered in this study.
6. References
[1]
M2]
[3]
[4]
[5]
Marcy, J. F., Nicholas, E. B., and Demaree, J. E.,
Flammability and Smoke Characteristics of Aircraft
Interior Materials. Federal Aviation Agency Techni-cal Report ADS-3, Jan. 1964.
Marcy, J. F., A Study of Air Transport PassengerCabin Fires and Materials, Federal Aviation AgencyTechnical Report ADS-44, Dec. 1965.
Gross, D., Loftus, J. J., and Robertson, A. F., A Methodfor Measuring Smoke from Burning Materials, Ameri-can Society for Testing Materials Special TechnicalPublication 422, 1967.
a. Scott Draeger Multi-Gas Detector, distributed byScott Aviation Corporation, Lancaster, N.Y.
b. MSA Colorimetric Gas Detector Tubes, Mine SafetyAppliances Co., Pittsburgh, Pa.
c. Kitagawa Precision Gas Detector, Unico Model No.400, Union Industrial Equipment Corp., PortChester, N.Y.
Madorsky, S. L., Thermal Degradation of OrganicPolymers, 315 pp. (Interscience (Wiley) 1964).
[6] Ausobsky, S., Evaluation of the combustion gases of
plastics, (in German), VFDB Zeitschrift 16. 58-66,
1967.
[7] Coleman, E. H. and Thomas, C. H., The products of
combustion of chlorinated plastics, J. Appl. Chem.4, 379-383, 1954.
[8] Fish, A., FrankHn, N. H., and Pollard. R. T., Analysisof toxic gaseous combustion products, J. Appl. Chem.13, 506-9, 1963.
[9] Kusnetz, H. L., Saltzman, B. E., and Lanier, M. E.,
Calibration and evaluation of gas detector tubes,Am. Ind. Hyg. Assoc. J. 21, 361-373, 1960.
[10] Saltzman, B. E., Preparation and analysis of calibratedlow concentrations of sixteen toxic gases. Anal. Chem.33, 1100-1112, 1961.
[11] Saltzman, B. E. and Gilbert, N., Am. Ind. Hyg.Assoc. J. 20, 379-386, 1959.
[12] Rechnitz, G. A. and Kresz, M. R., Anal. Chem. 38,1786, 1966.
11

7. Appendix 1. Gas Analysis
7.1. Colorimetric Indicator Tubes
The manufacturer provided general information
on the detector tubes regarding their measuringrange, interfering reactions, reuse and the effects
of temperature and relative humidity. The upperand lower limits of the measuring ranges of these
tubes and some references to the toxicological
limits of these gases are summarized in table 2.
With good quality control during manufactureand frequent calibration, specific tubes can give
meaningful results. However, certain shortcomingsmay be noted. These include:
1. Variation of packing density within the tubeand nonuniformity of indicator gel among the
tubes. Since the adsorption rate of a sample gasby the gel depends primarily on the reacting
surface area available per length of tube, a
variable packing density would affect repro-
ducibility.
2. Certain gases and vapors are not adsorbedby the precleaning layer but react similarly
with the indicator as the gas of interest to
produce an unexpected interference.
3. The transition zone of the discolored stain
front makes it difficult to judge the exact de-
marcation line and thus introduces errors.
These shortcomings can be minimized, for ex-
ample, by frequent calibration to establish prob-
able sources of errors, by knowing the specific
interfering gases in the sample not absorbed bythe precleaning layer and the sensitivity of the
tube to these gases, and by determining the con-
centration of the interference gas, if any, foundin the sample. With cumulative experience onusing the tubes both during calibration and sam-pling, the error in judging the line of demarcationof the discolored section by an operator can beminimized. The merit of the colorimetric tubesas in any other analytical method should be judgedby performance on a specific gas. Sensitivity,
accuracy, and interference effects depend on the
chemical system used in the tube and they are
obviously different for different gases. An extensivereview of some of the techniques and problemsassociated with these tubes is given by Kusnetz,et al. [9].
The advantages of the indicator tubes are con-venience and simplicity, yielding immediate re-
sults with the avoidance of transfer vessels andother sampling problems. In the hands of anexperienced operator, reasonable accuracy can beattained.
Of the colorimetric tubes used, tubes for fourcompounds have been calibrated and examinedfor interferences and temperature effect. For cali-
bration purposes low concentrations of HCl orHCN were prepared from a flow dilution systemsuggested by Saltzman [10]. The system consistsof an asbestos plug which serves as a flow-limitingdevice [11], and a mixing chamber as shown in
figure 12. Tubing to the asbestos flowmeter is
1 mm i.d. polytetrafluoroethylene tubing to mini-mize dead volume. The pressure regulating cyl-
inder was filled with concentrated H2SO4. Flowswere calibrated by attaching a graduated 0.1 mlpipet to the meter outlet and timing with a stop-watch the movement of a drop of mercury pastthe graduations. Flow rates as low as 0.01 cmVmincan be achieved with good long term stability.
The degree of dilution of pure HCl from thetank was controlled by the asbestos plug and thediluting gas metered by a rotameter. Mixtureconcentration could be varied from 10 to 1000ppm. A needle valve controlled the flow rate tothe indicator tube. The pressure drop across thecolorimetric indicator during calibration was bal-
anced by applying an appropriate vacuum at theother end of the tube. This arrangement avoidscreating any disturbance to the diluting systemwhen the tube is inserted to start a calibration.
Low concentrations of HCN were generated byaeration of a 4.6 molar solution of KCN in amidget impinger. A thermostated water bath sur-
rounding the bubbler and air supply condensermaintained a temperature of 30 °C (86 °F). Thesystem produced an output of 100 ppm andfurther dilution was necessary for lower concen-
Table 2. Measuring range of colorimetric indicator tubes and toxicological data for selected gases
CO CO2 HCl HCN NO2 NO -I-NO2 NH3 CI2 COCI2 HF SOj
Indicator tube data Type TypeA B
Nominal range, lower ppm 10 2 2 2 0.5 0.5 25 0.2 0.25 0.5 5upper ppm 3,000 30 500 150 50 10 700 30 75 15 150
Recommended upper temp.Limit (tube and test gas) °C 90 40 45 30 40 40 40 50 35 40 40
Toxicological data*M.A.C.** ppm 50 5,000 5 10 5 50 1 0.1 3 5Irritation on brief exposure ppm 35 25 500 30 5 30 20-50Immediate danger to life
(2 to 5 min) ppm 10,000 70,000 1000 -2000 200-300 200 >2000 1000 50 50-250 500
* Based on the following references:Henderson, Y., Haggard, H. W.: Noxious Gases. (Reinhold Publishing Corp., New York 1943),Elkins, H. B.: The Chemistry of Industrial Toixiology (John Wiley & Sons, Inc., New York 1959).American Conference of Governmental Industrial Hygienists, Document of Threshold Values, Cincinnati, Ohio 45202 (1966 edition).** Maximum average atmospheric concentration for 8-hr daily exposure adopted by American Conference of Governmental Industrial Hygienists, 1966.
12

Figure 12. Flow dilution andcalibration arrangement.
1. Gas of Interest2. Pressure Regulator
trations. Both HCl and HCN systems were verystable and consistent.
A static method using an FEP polytetrafluoro-
ethylene 5-mil-thick collapsible bag was used to
generate low concentrations of nonreacting gases.
Under this arrangement, the sample gas was de-
posited by a gas-tight microsyringe and diluted
with air or other gases from a 1-liter syringe. Thismethod is not applicable to HCl or HCN becauseof losses resulting from adsorption, but gave satis-
factory results with CO from 10 to 1000 ppm.
7.2. Specific Ion Electrode
A permeable membrane electrode for chloride
ions (after Pungor) described recently [12] was
I:Asbestos PlugRotameter
5. Diluting Gas6. Mixture Waste
7. Colorlmetrlc Tube8. Vacuum Source
used in a system to determine the HCl concen-tration in a gas sample potentiometrically. Thismethod has higher accuracy, range, and reliability
than that of colorimetric indicator tubes. Its
working range is between 20 and 20,000 ppm for a100 cm^ gas sample. For lower concentrations, alarger sample must be used.
In practice, the highly water-soluble HCl gasand vapor in the 100 cm^ sample was totally
absorbed when the sample flowed at a rate of
100 cmVmin through polytetrafluoroethylene tub-ing (5.3 mm i.d.) containing about 40 mg of
loosely packed glass wool wetted with 0.1 cm^water. The exposed glass wool was carefully trans-
ferred to a polytetrafluoroethylene cup of small
10^ 10*
CONCENTRATION OF GAS PHASE HCl, ppm
Figure 13. Measured emf as a function of HCl concentration in gas phase based on HCl in 100 cm?sample absorbed by 1 cm^ of water.
13

9
soS5,
C 03 773 1^ >a; <u >" ^ be ho
p7 _- M C C
oO xoo g
ooolOOOOOAAAOOO
8 M
&-ooo-y S
AA'^A §
KIZKccO
C3
o6t- CO
-C o
^ g
o0-P
Oil
d g.
o oK I 2
o
oj w ca
C C 3
O OJ P
ow
o
.2 M
Isc g
cS.S
ll
14

internal volume. Water v/as added to make a
total solution of 1 cm^ before insertion of the
specific ion electrode, and a low-leakage, small-
diameter-tip, conventional calomel-KCl reference
electrode. A high impedance differential voltmeter
or an expanded scale pH meter may be used to
measure the emf between the electrodes. Thespecific electrode has a sensitivity limit of 10-^
mole per liter for chloride ion in solution and anequilibrium response time of about 1 min. It
consists essentially of a polymeric silicone rubbermembrane impregnated with particles of silver
chloride precipitate. The membrane covers the tip
of a small diameter glass tube filled with a chloride
solution. Figure 13 shows the calibration curve of
emf in mV and HCl concentration in ppm calcu-
lated on the basis of a 100 cm^ gas sample absorbedin a 1 cm^ solution. The curves were based onmeasurements made with solutions of known HClconcentrations.
Known interferences of bromide or iodide ions
may be considered negligible if their concentra-
tions are less than one-tenth of the chloride ion
concentration [12]. In most fire gas or smokechamber analyses no interference would be ex-
pected. In cases where the concentration of bro-
mide ions is likely to be the same order as that of
chloride, a bromide specific electrode can be used.
This electrode is not affected by chloride ion
concentrations as high as 50 times that of bromide.Table 3 shows the type of indicator reagents
used in the detector tubes. It also lists the knowncomponents and concentrations which would cause
sufficient interference to give erroneous readings.
The precleaning layer serves to remove the inter-fering components and the table shows the maxi-mum concentrations that can be tolerated. Thedata are based on information furnished by thetube manufacturer as well as NBS data showingthe lack of mutual interference among the majorcomponents of HCl, HCN and CO. Except forH2S which apparently poisons the reactive surfaceiri the HCl tube, other interferences did not sig-
nificantly alter the usefulness of those color imetrictubes in the present smoke chamber study.
Table 4 shows some of the basic and calibrationdata for the colorimetric indicator tubes used.Included are the concentration ranges for whichthe tubes are rated and the sample volume andmeasured sampling rate for which the predeter-mined scale calibration holds. The length of indi-
cating layer compared with the maximum of theconcentration range indicates the resolution of thetube. The transition zone is a subjective estimateof the length between complete color change to nochange which affects the reading error. The cali-
bration ratios were based on the average of threeseparate runs for each of the stated concentra-tions. The method of preparation of an actualconcentration of a single component in an atmos-pheric air mixture was given in the previous sec-
tion. Unlike a previous study where several dis-
interested observers were asked to judge thedemarcation front of the color change [9], thepresent results were based on the observation of
one individual only. With the exception of thetype B HCl tube which was -f90 percent in error,
all other errors fell within a ±20 percent range.
Table 4. Colorimetric indicator tubes
Basic data (supplied by Mfr.) Calibration data (NBS)
Tube ConcentrationRange
Samplevolume
Samplingrate
Packing length Transition zone Concentration
Precleaning Indicating Length Error Actual Indicated'' Error
ppm cm^ seconds mm mm mm % ppm ppm %per stroke
HCl 2-30 1000 11 30 60 4 ±7 5Type A 25 30 +20
86 95 +10" 10-300 100 200 180 -10
HCl 2-100 500 30 0 65 2 ±3Type B 20-500 100 300 570 +90
CO 10-300 1000 27 40 50 2 ±4 50100-3000 100 100 120 +20
200 220 +10500 500 01000 1000 0
HCN 2-30 500 10 30 50 6 + 8 510-150 100 30 35 +20
75
HF 1-15 1000 5 0 60 3 + 5 16 14 -13" 5-150 100
NO +N02 0.5-10 500 9 30 60 5 + 8«5-50 100
SO2 5-150 1000 12 0 65 4 + 650-1500 100
NH3 25-700 1000 9 0 75 3 ±4
' Concentration range extended by use of individual calibration (not furnished by the manufacturer).° Average readings of three separate tubes.
15

8. Appendix 2. Material Description
Abbreviations
Code
F1,F2—Fabric (uncoated, coated)
R1,R2—Rug (unpadded, padded)S1,S2,S3—Sheet (flexible, semi-rigid,
rigid)
L1,L2,L3—Laminate (flexible,
semi-rigid, rigid)
Designation
C Coated ABSUC Uncoated PETPF Flexible PMMASR Semi-rigid PVAR Rigid PVCP PaddedUP UnpaddedFR Fire-retardant treated
Composition
Acrylonitrile/butadiene/styrenePolyethylene terephthalate polyesterPoly methyl methacrylatePoly \inyl acetatePoly \'inyl chloride
No. Code Thickness Unit*weight
Color andsurface
Designation Present orintended use
Material identification
Inch oz/yd^
1 F-1 0.035 11 Light-blue fabric (LC) Drapery Wool/cotton (75:25).
2 F-1 0.030 9.6 Light-blue Fabric a^C) Draperj- Modacrj'Uc.
3 F-1 0.055 14 Blue (multi-colorpattern)
Fabric (L"C) Drapery ModacryHc/nylon/cotton.
4 F-1 0.050 13 TanCorduroy
Fabric (UC) Upholstery Polyamide (nylon tjT>e).
5 F-2 0.030 12 BlueMatte
Fabric (C) Upholsters' Polj-i'inylchloride/methyl methacrylate/esterplasticizer on cotton.
6 F-2 0.045 26 GoldMatte
Fabric (C) Upholstery Polj'ester plasticizer (phthalate-type), possible
PVC, on cotton.
7 R-2 0.33 62 Blue/grayLoop
Rug (P) Flooring Pile: ModacryUc/acryhc.Backing: Polyester fiber.
Pad; Polyester urethane foam.
8 R-1 0.18 31 Blue/greenLoop
Rug (UP) Flooring Pile: Copolymerpoly(propylene-butylene)
.
Center: Cellillosic.
Backing: Polyethylene.
9 S-1 0.046 46 TanMatte
Sheet (F) Panel and doorcovering
PVA/ABS. china clay pigmented possible PVC.
10 S-2 0.045 38 Dark grayMatte
Sheet (SR) Food trays,windowframes
ABS (~25%: 10%: 65%).
11 S-3 0.080 67 GreenPolished
Sheet (R) Food trays,windowframes
ABS (~25:10:65).
12 S-3 0.080 81 Tan:Matte
Sheet (R) Ceilings, seatpanels
Copolymer: P^'C/poly methvl methacrj'late(~95:5).
13 S-2 0.030 26 GoldShiny
Sheet (SR) Trim PVC and poly\-inyl acetate base with some ABSplastic added.
Film: Polyethylene terephthalate (PETP) poly-ester.
14 S-2 0.020 20 White/greenSmooth
Sheet (SR) Sides, ceiling,
seat panelsPoljTinyl chloride/vinyl acetate (~89: 11).
15 S-1 4.0 110 "SVhite
Open cell
Foam (F) Seat cushionpadding
Polyether urethane.
16 R-1 0.22 44 BlueLoop
Rug (UP) Flooring Wool.
17 R-2 0.43 83 Multi-colorLoop
Rug (P) Flooring Pile: Wool.Back: Polyester.Pad : Urethane foam.
18 R-1 0.22 59 Black/grayLoop
Rug (UP) Flooring Modacryhc/acrylic.
19
20
S-1
L-3
0.21
0.042
9.2
68
GreenOpen cell
GoldEmbossed
Pad (F)
Laminate (R)
Carpet underlay
Panels—Over-head andsides
Polj'ester urethane foam.
Face: Pol}'%'inyl acetate with trace of ABScovered with PETP polyester.
Back; Aluminum sheet.
21 0.044 79 TanDuU, brushed
Laminate (R) Panels—Over-head andsides
Face: Vinyl chloride/acrylate copolymer (80: 20).Back: Aluminum sheet.
22 L-1 0.009 8.1 AluminumMatte, shiny
Laminate (F) Window shades Face: PETP Polyester.Back: Vinyl acetate, PVC copolymer.
* 1 oz/yd2 =3.39xl0~» g/cm2.
16

Materials Description—Continued
No. Code Thickness Unitweight
Color andsurface
Designation Present orintended use
Material identification
Inch oz/yd^
23 A Irregular WhiteSmooth
Assembly(molded)
Assisthandles
Polyamide (nylon type).
24 A Irregular GreenSmooth
Assembly(molded)
Seat trackcovers
Polyvinyl chloride, ABS terpolymer (94:6).
25 L-3 0.035 39 GrayGlossy
Laminate (R) Galley area Face; Melamine formaldehyde.Back: Urea formaldehyde.
26 L-3 0 032 35 BlueGlossy
Face: M^elamine formaldehyde.Back: Urea formaldehyde.
27 S-2 Irrcgul&r White Ps-ssGOi^Gr SGrv~ice units
Avigiu pdit. rtoo y^ij . 'tKj . } possiDie irVl^.Flex part: Plasticized PVC possible some vinyl
acetate.
28 F-l 0.028 8.0 Tan/goldtrace
Fabric (UC) Drapery Modacrylic.
29 F-1 0.030 9.3 Turquoise,gold trace
Fabric (UC) Drapery Modacrylic.
30 A 0.41 62 TanMn + tp
Assembly Ceilings,t) U.1 ll63ds
Face: Coated glass fabric (Polyester or cross-linked Acrylic).
Core: Paper honeycomb.Back: Plastic-impregnated glass fabric
31 S-1 0.010 9.6 WhiteMatte
Sheet (F) Loweredceilings
Vinyl chloride/acrylate, possible Polyvinylacetate.
32 L-3 0.045 75 Light blueMatte
Laminate (R) Loweredceilings
Vinyl chloride/acrylate copolymer film onaluminum sheet.
33 S-3 0.093 91 WhiteMatte
Sheet (R) Hatrack ABS (40:40:20), possible PVC.
34 F-2 0.010 10 TanSmooth
Fabric (C) Underside hat-rack buUnose
Vinyl ehloride/Acrylate copolymer on glassfabric (28%) plus pigment (13%).
35 S-3 0.095 90 GrayDull
Sheet (R) Toilet floor
pansABS (40:40: 20), possible PVC.
36 A 0.063 TanSmooth
Assembly(molded)
Ceiling paneljoint
Plasticized PVC.Plasticized di-(2 ethyl-hexyl) phthalate.
37 S-3 0.097 92 WhiteMatte
Sheet (R) Magazine rack ABS (40: 40: 20)/PVC.
38 S-3 0.063 53 ClearPolished
Sheet (R) Window pane Methyl methacrylate/Methyl acrylate copolymer(90: 10).
39 S-3 0.064 62 TanMatte
Sheet (R) Control panel ABS (40%: 40%: 20%), possible PVC.
40 S-1 0.002 1.3 CJearSmooth
Film (F) Protectivecoating
Polyvinyl fluoride.
41 A 0.35 95 Tan Assembly(molded)
BuUnose Face: ABS.Back: Polyether urethane foam.
42 A 1.3 35 YellowFibrous
Pad Insulation Glass fiber (plus organic binder).
43 A 2.5 150 YellowFibrous
Assembly Insulation Glass fiber with lead sheet.
44 S-1 0.046 44 TanMatte
Sheet (F) Seat panels PVA/ABS, china clay pigmented, possible PVC.
45 S-3 0.063 60 TanMatte
Sheet (R) Seat panels PVC/ABS.
46 S-3 0.057 55 WhiteMatte
Sheet (R) Seat panels PVC/PMMA (90: 10).
47 F-l 0.012 4.0 WhiteMatte
Fabric (UC) Lining for seatpads
Cotton.
48 A 0.57 82 TanMatte
Assembly Seat panels Face: PVC/ABS.Back: Polyurethane.
49 A 0.52 120 WhiteMatte
Assembly Seat panels Face: PVC/PMMA (90: 10).Back: Urethane foam—polyether type.
50 S-3 0.60 35 WhiteOpen cell
Sheet (R) Seatconstruction
Urethane foam—polyether type.
51 S-2 1.0 88 WhiteClosed cell
Foam (SR) Seatconstruction
Plasticized foam containing PVC/PVA andnitrile groups.
52 S-1 4.0 90 WhiteOpen cell
Pad (F) Seatconstruction
Urethane foam—polyether type (FR).
53 A 3.0 44 TanSmooth
Assembly Insulation Face: Filled rubber on Nylon 6-6 fabric.Back: Glass fiber batt.
17

Materials Description—Continued
No. Code Thickness Unitweight
Color andsurface
Designation Present orintended use
Material identification
Inch oz/yd^
54 A 1.3 28 BlueSmooth
Assembly Insulation Face: Organic-filled nylon fabric.
Back: Glass fiber batt.
55 F-2 0.004 4.2 TanSmooth
Fabric (C) Cover for insu-lation batt
Polyethylene film over nylon fabric (filled
rubber).
56 F-2 0.004 2.9 Light blueSmooth
Fabric (C) Cover for insu-lation batt
Organic-fiUed nylon 6-6 fabric.
57 F-2 0.006 6.1 GreenSmooth
Fabric (C) Bulkhead as-sembly lining
Plasticized PVC on Glass fabric.
58 F-1 0.054 14 Bluish multi-coloredweave
Fabric (UC) Drapery Modacrylic/nylon/cotton.
59 S-1 0.020 16 White/colorpattern
Sheet (F) Partitions PVC/PVA (89:11).
60 S-3 0.060 64 GoldGlossy
Sheet (R) Side panels Plasticized PVC/PVA with ABS.
61 S-3 0.060 62 BlueGlossy
Sheet (R) Side panel PVC/PVA (Small amount of ABS).
62 S-3 0.069 70 White withpattern
Sheet (R) Window panel Polyvinyl butyral film on PVC/PVA (90: 10).
63 F-1 0.030 9.5 Yellow/goldtrace
Fabric (UC) Drapery Modacrylic/polyester.
64 R-1 0.33 64 Blue/greenLoop
Rug (UP) Flooring Modacrylic/acrylic.
65 R-1 0.23 41 Brown/white/black loop
Rug (UP) Flooring Modacrylic/acrylic.
66 S-1 0.032 25 Tan/yellowBurlap
Sheet (F) Sidewall Plasticized PVC.
67 L-2 0.022 24 WhiteBurlap
Laminate (SR) Baggage Uner Polyester plastic fiUed glass fiber fabric.
68 L-2 0.038 34 Blue/white/yeUow
Simulatedfabric
Laminate (SR) Sidewall, parti-tion liner
Face: PVC/PVA (89: 11).
Back: Cotton fabric and paper
69 L-2 0.026 24 Blue/whiteSimulated
fabric
Laminate (SR) Sidewall, parti-tion liner
PVC/PVA.
70 L-2 0.031 28 GrayGlossy
Laminate (SR) Sidewall, parti-tion liner
Face: Acrylate.Back: PVC/PVA.
71 L-2 0.033 31 Tan /whiteEmbossed
Laminate (SR) Sidewall. parti-tion liner
PVC/PVA (93:7).
72 L-3 0.075 71 Redivi aT^ic
Laminate (R) Door liners Face: PVC/PVA.xiaCK . iiUO/ IT V K^.
73 S-3 0.11 UO GrayGlossy
Sheet (R) Cockpit liner ABS/PVC.
74 S-3 0.50 440 ClearGlossy
Sheet (R) Window panes Methyl methacrylate.
75 F-1 0.060 19 TurquoiseCorrugated
Fabric (UC) Upholstery Cotton/nylon (small amount of polyester).
76 A 0.38 76 WhiteSmooth
Assembly(honeycomb)
Ceiling panel Face: Acrylic/vinyl coating over plywood(paper)
.
Core: Paper with cresolformaldehyde resinadhesive.
100 S-3 0.18 180 ClearPolished
Sheet (R) Window panes Methyl methacrylate.
101 F-1 0.015 4.4 White Fabric (UC) Drapery Polyamide (aromatic-type).
102 F-1 0.015 6.1 Green Fabric (UC) Drapery Polyamide (aromatic-type)
.
103 S-3 1.0 28 WhitePorous
Foam (R) Foaminsulation
Chlorinated PVC.
104 A 1.0 42 WhiteEmbossed
Assembly WaUInsulation
Glass fabric (100%).Bonded to glass-fiber batt.
105 F—
2
0.033 26 AluminumGlossy
Fabric (C) High tempera-ture liner
Aluminum on asbestos.
106 S-3 0.13 120 ClearGlossy
Sheet (R) Window panesfabricatedparts
Poly (diphenylol propane) carbonate.
18

Materials Description—Continued
No. Code Thickness Unitweight
Color andsurface
Designation Present orintended use
Material identification
Inch oz/yd^
107 F-1 0.013 5.8 White Fabric (UC) Drapery Modacrylic (100%),
i 108 F-1 0.013 5.9 Orange Fabric (UC) Drapery Modacrylic (100%).
109 S-3 0.080 62 YellowGlossj'
Sheet (R) Paneling Poly (phenylene oxide).
' 110 S-3 0.13 110 Dark grayMatte
Sheet (R) Paneling PVC/PMMA plus ABb.
' 111 S-3 0.060 57 GreenMatte
oneet t-tt; Paneling Jr V U/r MiVlA plus Ado.
112A,
BS-2 0.060
0.0205418
ClearGlossy
Sheet (SR) Fabricatedparts
Polysulfone.
113 S-1 0.30 11 WhiteFluffy
Pad Seat padding,wallinsulation
Glass fiber (100%).
,
114 F-2 0.010 7.8 WhiteMatte
rabnc (O) Headliner Glass fabric coated with acrylic (aromaticplasticizer).
115 S-1 0.0015 2.2 ClearSmooth
Film (F) Protective cover Poly (difluorochloroethylene).
I 116 S-2 0.020 17 TanSmooth
oneet (,oi\) Panel sub-strate Polyamide (aromatic type).
117 S-3 0.045 50 WhiteGlossy
Sheet (R) Paneling PVC/poly(vinylidene chloride).
USA' B1
cD
S-1 0.0020.0050.0030.005
2.15.43.55.9
AmberClear
Glossy
Sheet (F) High tempera-ture insula-tion
Polytetrafluoroethylene films over polyimide.
!
119 F-2 0.007 5.0 Blue Fabric (C) Headliner Glass fabric (97%) with organic finish.
120 S-2 0.23 20 GrayFibrous
Pad Insulation Asbestos fiber.
: 121 S-3 0.063 64 TanSmooth
&neet tttj Panelsubstrate
Polyamide (aromatic type)
.
I
122 S-3 0.11 130 GrayGlossy
Sheet (R) Paneling Polyvinyldichloride.
li 123l|
S-1 4.0 380 BlackOpen cell
r oam ) Seat padding Chloroprene.
124 F-1 0.012 9.2 MaroonGlossy
raoric tLCj Wall covering Plasticized poly(vinylidene chloride).
125 F-2 0.005 4.0 Light greenGlossy
rabnc (C) Headliner Glass fabric (97%) with organic finish.
126 F-2 0.006 4.2 Light grayGlossy
rabnc (U) Headliner Glass fabric (83%) with organic finish.
127 S-2 0.034 29 BlueMatte
Sheet (SR) Paneling Face: Plasticized PVC/PVA (90:10).Back: Polyamide (Aromatic type).
li
128A
' B
S-1 4.0
4.0
89
67
WhiteOpen cell
WhiteOpen cell
Foam (F) Seat padding Polyether urethane (FR)
.
Polyether urethane.
129 S-1 0.071 99 BlackSmooth
Sheet (F) Elastomer,seals
Copolymer of tetrafluoro-ethylene/vinylidenefluoride.
;
130 S-1 0.067 83 TanSmooth
Sheet (F) Elastomer,gaskets
Chlorosulfonated polyethylene.
' 131 s-1 0.065 82 BlackSmooth
Sheet (F) Elastomer,hoses
Chloroprene.
132 F-1 0.028 8.7 Green Fabric (UC) Drapery Modacrylic and metallized fiber (94: 6).
133 L-1 0.040 36 CopperGlossy
Laminate (F) Dado paneling race, rlasticizea r^VLy/r^ VA.Back: Polyamide (aromatic type) paper.
134 L-1 0.032 27 Light tanGlossy
Laminate (F) Hatrack Face: Plasticized PVC/PVA and cotton fiber.
Back: Polyamide (aromatic type) paper.
1^2 0.029 26 Blue/whitepattern
Smooth
Laminate (SR) PaneUng,Bulkhead
dividers
Face: PVC/PVA (90: 10).Back: Polyamide (aromatic type) paper.
136 1^3 0.099 84 Lt. gray/goldpattern
Rough
Laminate (R) Flooring Plasticized PVC/PVA.Top coating—mostly plasticized.
137 L-3 0.074 72 Clear/white/blue
Smooth
Laminate (R) Window reveals,
dadoSeat backs
Plasticized PVC/PVA (90: 10) over pigmentedABS, asbestos-filled.
19
Materials Description—Continued
No. Code Thickness Unitweight
Color andsurface
Designation Present orintended use
Material identification
Inch oz/yd^
138 F-1 0.015 5.8 GreenSmooth
Fabric (UC) Drapery (FR) Polyamide (aromatic type) cotton (50%: 50%).
139 F-2 0.007 6.6 WhiteSmooth
Fabric (C) Headliner,baggage liner
Glass fabric (60%) coated with polyvinylidenefluoride.
140 F-1 ft f\OA 12 vv iiiLe/ uiucSmooth
Fnhrio fTTCI IVXatjl Coo
ticking (FR)Cotton.
141 S—
2
0.031 Creamsemi-clear
Glossy
X cLUl ly^d tCLl
parts (FR)Polysu Ifone
142 S-3 1.0 12 WhiteFine grain
Foam (R) Insulation (Urea formaldehyde).
143 R-1 0.30 45 GreenLoop
Rug (UP) Flooring Polyamide (Aromatic type).
144 F-1 0.035 11 Green/white/orange
Fabric (UC) Upholstery Polyamide (Aromatic type).
145 F-2 0.031 18 SilverReflective
Fabric (C) Insulation,baggage liner
Aluminum/polyester film on asbestos fabric.
146 F-1 0.035 9 .
9
w niie J? aone yyj'^i Upholstery
,
draperyPolyamide (more Aromatic groups than 14(
and 144).
147 S-3 0.23 210 ClearGlossy
Sheet (R) Window panes,fabricatedparts
Poly methyl methacrylate.
148 R-1 0.25 56 (A) Blue\D ) £JL UW 11
(C) GreenLoop
Rug (UP) Flooring Pile: Modacrylic (100%).
149 F-1 0.15 10 CreamFluffy
Fabric (UC) Blanket Modacrylic (100%).
150 S-1 4.0 89 WhiteOpen cell
Foam (F) Seat padding(FR)
Polyether urethane.
151 L-3 0.054 75 Light tanMatte
Laminate (R) Paneling Plasticized PVC/PVA on aluminum sheet.
152 L-2 0.057 52 Light blueMatte
Laminate (SR) Paneling Face (blue): PVC/PVA (89:11).Back (tan): PVC/PMMA (90: 10).
153 F-1 0.033 6.8 WhiteOpen weave
Fabric (UC) Casementdrapery
Modacrylic/rayon/poly(vinyUdene chloride)
20%.
154 S-1 0.11 63 RedClosed cell
Sheet (F) Padding Silicone rubber.
155 S-3 0.060 53 ClearGlossy
Sheet (R) Window panesFabricated parts
Polycarbonate.
156 F-2 0.007 6.3 WhiteSmooth
Fabric (C) Headliner Poly(vinyUdene fluoride) coating, on Polyamidi(aromatic type) fabric.
157 F-1 0.035 10 White Fabric (UC) Drapery Modacrylic (100%).
158 S-2 0.028 29 CreamGlossy
Sheet (SR) Panels, fabri-cated parts
PVC/ABS (94:6).
159 S-2 0.034 34 OliveGlossy
Sheet (SR) Panels, fabri-
cated partsPVC/acryUc (90: 10).
160 G 1O—
O
0.055 65 w niveGlossy
oneet \ix) Panels, fabri-
cated partsStyrene/polyester, fiberglass—reinforced (25%)
TiOs pigment.
161 L-3 0.032 57 Wood grainpattern
Smooth
Laminate (R) Panels, interiorfinish
PVC/acrylic on aluminum sheet.
162 F-1 0.020 13 White Fabric (UC) High-tempera-ture insula-tion fabric
Asbestos/glass/polyamide (aromatic type).
163 L-2 0.031 39 Wood grainpattern
Smooth
Laminate (SR) Panels, interiorfinish
PVC/PVA (95:5) on filled asbestos (71%).
164 S-3 0.070 60 WhiteGlossy
Sheet (R) Fabricatedparts
ABS.
i.
20

Appendix 3.
Summary of Test Results; Smoke and Gas Concentration
Smoke Gas concentration
Samplenumber
Specimenweight
TestExposure
Maximumspecific optical Maximum Time to
Maximum indication, Colorimetric tube
F = Flaming= Nonflaming
density
Dmraie
'c
ID
CO HCl HCN Others
1
g2.2 F
N14
60
min '
219
mmNR
1.2
ppm50
30
ppm0
0
ppm6
5
ppm
2 1.8 FN
7250
2924
0.50.7
20045
200 S150 S
4535
3 2.8 FN
6089
2035
1.00.9
8020
4025
1510
4 "2.6 FN
166
4< 1
15.0NR
3070
00
00
5 4.4 FN
193191
18530
0.31.4
27080
150 S150 S
00
6 5.0 FN
204272
16328
0.31 .5
350400
200 S300 S
32
7 12.2 FN
439375
200140
0.81.2
500125
9030
2030
8 7.0 FN
96418
5060
1.82.0
140800
00
22
9 9.1 FN
380276
17867
0.51.2
500180
300 S80 S
2012
10 7.1 FN
>66076
3406
0.64.3
26025
00
108
NO+NO2:30
11 11.8 FN
>660167
2808
0.73.5
36040
00
109
12 15.1 FN
229107
6117
1.03.0
550600
1200 S800 S
00
13 5.4 FN
28955
1204
0.66.5
20060
300 S250 S
32
14 4.0 FN
13920
964
0.63.8
12060
300 S250 S
00
15 ''2.6 FN
35156
69
1.40.5
5050
00
22
16 9.4 FN
12387
236
1.62.1
19090
00
1520
17 15.2 FN
129206
5040
2.22.0
320300
00
1560
NO+N02;25
18 11.6 FN
350312
17059
1.22.1
270240
306
850
19 1.7 FN
5877
1013
1 .90.6
15045
00
2
0
20 13.0 FN
7622
142
5.221.6
21020
10080
2
0
21 14.9 FN
8182
2617
2.15.0
23030
200100
00
22 1.3 FN
2824
44
1.55.7
9010
7030
00
23 ^ 50.0 FN
162105
113
5.613.6
50030
00
652
NO +NO2;50
24 11.4 FN
454167
16040
0.71.8
OOK)
601300 S
1000 S^
1
25 7.2 FN
9444
96
3.54.5
32080
00
104
26 6.7 FN
5043
46
3.73.6
300130
00
87
27 4.6 FN
>660126
2605
0.85.3
70050
5020
258
28 1.5 FN
7648
2320
0.40.8
17060
150150
6050
29 1.6 FN
6652
2317
0.50.9
20040
150200
6040
See footnote at the end of table.
21

Summary of Test Results; Smoke and Gas Concentration—Continued
Smoke Gas concentration
Sample SpecimenTest
ExposureMaximum
specific optical Maximum Time toMaximum indication, Colorimetric tube
number weight f = FlamingA' =Nonflaming
densityDm
raie
RmUs = ID
'cCO HCI HCN Others
g min ppm ppm ppm ppm
30 12.3 FN
6345
1114
0.61.9
28075
458
71
31 1.8 FN
7268
214
0.23.6
11050
11090
1
1
32 14.7 FN
7458
156
3.57.7
15050
200200
00
33 17.6 FN
458207
19048
0.72.4
65030
15030
205
34 2.0 FN
7468
1611
0.41.3
18055
8060
1
1
35 17.4 FN
446277
20074
0.62.1
75035
10030
2012
36 " 17.7 FN
>660390
24040
0.52.6
85030
1300 S1000 S
00
37 18.2 FN
641156
22037
0.72.9
70040
15020
505
38 10.7 FN
5012
162
1.6NR
16030
00
00
39 12.2 FN
460146
19026
0.62.3
50060
11025
206
40 0.2 FN
41
< 1
< 1
NRNR
6020
00
00
HF- 7hf!o
41 15.3 FN
448181
17038
0.41.5
45045
150100
205
42 « 4.8 FN
108
2< 1
NRNR
150130
00
1314
43 " 21.3 FN
g4
< 1
< 1
NRNR
180160
00
1815
44 10.3 FN
466240
230120
0.41.1
700180
300 S80 S
2012
45 12.2 FN
>660276
26065
0.41.7
1000150
30040
406
46 12.2 FN
303172
12035
0.82.0
700350
1300 S900 S
1
0
47 0.7 FN
g8
1
< 1
NRNR
15080
00
1
0
48 16.9 FN
>660280
180130
0.51.4
1200400
300250
4015
49 21.2 FN
518414
220100
0.71.4
1200250
1600 S1200 S
152
50 "6.2 FN
229164
11059
0.20.4
700200
1500
303
51 17.0 FN
>660302
25050
0.20.6
1100400
400400
3830
52 '4.6 FN
30318
g46
2.50.5
250250
00
32
53 5.9 FN
6087
2334
0.20.6
23090
158
105
54 4.1 FN
2456
726
0.80.4
14080
81
67
55 0.9 FN
3035
65
2.93.1
16080
5035
21
56 0.6 FN
1840
33
5.27.8
12050
95
31
57 1.0 FN
2740
74
1.33.9
10060
4012
1
1
58 2.6 FN
5889
2235
1.01.0
8020
4025
1510
59 3.0 FN
11528
648
0.41.8
250100
600400
00
I
22

Summary of Test Results; Smoke and Gas Concentration—Continued
Smoke Gas concentration
Sample SpecimenTest
{ExposureMaximum
specific opticalMaximum Time to
Maximum indication, Colorimetric tube
number weight ^' = FlamingN =Nonflaming
densityDm
rave
Hm h CO HCl HCN Others
0 min ' min ppm ppm ppm ppm
60 12.8 FN
609290
26047
0 51.2
1100150
1500 S800 S
154
61 12.7 FN
600267
25077
0 51.4
1000130
1400 S850 S
258
62 13.2 FN
436216
18033
0 51.6
800320
700 S450 S
205
63 2.0 FN
6078
2022
0 50.7
28080
150100
4540
64 12.1 FN
295254
14092
0 61.3
380160
300
2555 d
65 8.3 FN
355327
31086
0 72.0
300170
00
17110 d
66 5.0 FN
199180
18044
0 41.4
420500
450450
01
67 4.7 FN
6960
286
0 44.2
23030
208
00
68 6.7 FN
311246
16019
0 62.4
500200
800 S200
00
69 5.3 FN
234178
20033
0 41.2
500190
800 S500
00
70 5.5 FN
295178
25026
0 41.2
450150
700 S300
1
1
71 6.0 FN
300104
23025
0 41.0
450280
1100 S350
1
1
72 14.1 FN
>660286
—DU45
0 CD1.6 130 400
177
73 20.8 FN
574442
18058
0 62.0
1300200 200
4020
74 86.9 FN 328 5 9.0 140 0 0
75 3.9 FN
39175
1329
0 91.2
180120
Q0
55
76 16.0 FN
151200
3570
1 21.4
220100
805
73
100 32.9 FN
383203
12012
1 96.0
2200400
1008
00
101 0.9 FN
100
< 1
0NR
NR70
100
01
1
102 1.0 FN
85
1
< 1
NRNR
9510
00
20
103 5.7 FN
3020
62
1 56.8
330110
1600 S1300 S
21
104 9.4 FN
2525
45
2 83.0
13070
1512
54
105 5.2 FN
1110
21
NRNR
11075
3513
1
0
106 18.4 FN
21012
701
2 .8NR
40050
00
00
107 1.2 FN
3941
1510
0.40.8
16090
120100
3530
108 1.2 FN
3941
1113
0.60.6
22060
110100
3030
109 12.4 FN
183168
665
0.918.2
270120
00
1
0
110 23.2 FN
>660498
22068
0 .62.3
1000280
1000 S700
2010
111 11.0 FN
566248
31042
0.51.8
1100180
600 S600 S
198
112A 11.2 FN
404
12
< 1
2 .6
NR220
300
00
0SO2: 150SO2:0
23

Summary of Test Results; Smoke and Gas Concentration—Continued
Smoke
—\
Gas concentration
Samplenumber
Specimenweight
TestExposure
Maximumspecific optical Maximum Time to
Maximum indication, Colorimetric tube i
F = FlamingA' =Nonflaming
densityDm
rate lb
CO HCl HCN Others^
min ' min ppm ppm ppm ppm
113 1.9 FN
44
< 1
< 1
NRNR
605
00
00
)
114 1.6 FN
911
32
NRNR
7020
2517
00
i
;
115 0.5 FN
00
00
NRNR
605
00
00
HF;0 ,i
KF:0
116 2.3 FN
63
< 1
< 1
NRNR
7015
00
00
117 9.5 FN
321173
10025
0.61.6
650750
2000 S1100 s
52
\
USD 1.1 FN
150
<C 1
0 NR280
< 50
01
0HF:11 i
HF:0
119 1.0 FN
1
21
< 1
NT T)
NR80
100
1
00
120 3.0 FN
1
1
< 1
< 1 NR90
101
1
100
0
121 12.2 FN
147
< 1
< 1
"NTT?
NR170
10015
135
1
122 23.0 FN
12566 13
1 . 1
3.2800
7002500 S
2000 S1
1
123 = 20.0 F
N
>660
508 120 0.3
1000
500
1 100
1500 S
8
6
/S02:45\H2S:40SO2; 40
124 1.9 FN
2634
84
3.93.9
15020
700300
00
125 0.9 FN
21
< 1
< 1
NRNR
6010
00
00
126 0.9 FN
1
1
< 1
< 1
NRNR
6010
00
00
127 5.5 FN
309162
25045
0.41.0
380100
700 S1000 S
21
128A "4.2 FN
262286
12062
0.20.7
320160
15025
252
128B ' 3.5 FN
41300
1554
0.60.7
150190
22
22
129 20.1 FN
10975
4028
1.22.5
48020
00
20
HF:80HF:90
130 16.7 FN
230196
9270
0.81.1
75060
400 S200 S
00
SO2:50SO2: 40
131 18.8 FN
233161
13042
0.71.6
550100
200200 S
52
132 1.8 FN
6762
2528
0.40.6
21090
150 S100 S
4637
133 7.5 FN
503218
30057
0.41.3
50080
800 S900 S
1
0
134 5.6 FN
368150
34029
0.41.5
47070
600 S350 S
00
135 5.3 FN
17094
8330
0.41.0
20070
600 S400 S
1
1
136 18.3 FN
342169
16047
0.61.2
800250
900 S500 S
31
137 14.8 FN
440154
14041
0.51.7
620120
1700 S800 S
101
138 1.0 FN
109
2
< 1
NRNR
10040
00
42
139 1.5 FN
1
1
< 1
< 1
NRNR
45<5
00
00
HF:26HF: 10
140 2.4 FN
5051
1614
0.80.9
270210
1714
85
NO+N02:8
141 5.4 FN
281
4
< 1
5.9NR
180<5
00
00
SO2:30SO2:0
24

Summary of Test Results; Smoke and Gas Concentration—Continued
Smoke Gas concentration
Sample SpecimenTest
ExposureMaximum
specific optical Maximam Time toMaximum indication, Colorimetric tube
weight F = Flaming= Nonflaming
densityDm
rate UaCO HCl HCN others
m in ppm ppm ppm ppm
143 8.6 F
N
51
65
10
7
3.2
4.8
700
880
0
0
48
40
/NO+NO2; 101nH3:60
144 2 .4 FN
3230
88
2.43.4
13020
Q0
3
0NO+NO2; 12
145 3.6 FN
1
1
142
2NR
NR80
2025
151
0
1 Ad 2 .3 FN
86
< 1
< 1
NRNR
14010
Q0
52
NO+N02:8
42 .
4
FN
>660304
8815
1 .44.5
2000200
12020
50
11.4 FN
410314
13066
0.51.5
400120
1000 S300 S
7090
148C 11.5 FN
464324
190150
0.51.5
500100
1000 S250 S
9090
1 AO 2 .
3
FN
5066
2030
1 .2
1.280
50300 S
200 S50
60
1 RniOU ^4.8 FN
101205
4342
0.40.4
27040
400
122
NO+N02:12
1 111101 15 .
2
FN
202148
9145
0.92.9
35040
900 S500 S
1
0
10.
5
fN
22388
7620
0.61.7
500180
1200 S300 S
1
1
loo 1 .
5
FN
1925
610
1.11.1
8080
15090
1520
12 5 FN
15144
5010
0.92.8
6010
Q0
00
too FN
lOD 1 3 FN
32
< 1
< 1
NRNR
10040
00
00
HF:35HF:24
10/a 2 , Q F
N90
18130
40.6
4.6130
20200
8025
20
158 5 .
1
FN
19559
17025
0.51.2
30035
150 S150 S
51
159 FN
15463
7420
0.71.5
,
24050
200 S100 S
00
160 13.1 FN
190106
7018
0.73.3
500125
200150
00
161 11.5 pN
4324
188
2.04.4
11025
13070
00
161x 1 .
5
FN
5229
2011
0.31.0
12025
15080
00
162 2 5 FN
1
0< 1
0NR
NR30
<50
00
0
163 7 ^i .O FN
111
< 1
< 1
NRNR
8060
150150
00
163x 6.3 FN
40
< 1
0NR
NR100
9080
400
0
164 11.8 FN
>660152
26054
0.41.7
50040
20050
2010
* Material not fully exposed because of melting, shrinking, etc. NR Not reached.Tested in 5^-in. thickness. S Measured with chloride ion electrode.
" Tested in 1-in. thickness.Probably acrylonitrile vapor indication.
25

Appendix 4. Typical Smoke Accumulation Curves for Selected Materials
Ds Specific optical density = log
F Flaming exposure
NF Nonflaming (smoldering) exposure
Figure 14. Typical smoke curves—fabrics. Figure 15. Typical smoke curves—ru^s.
26

10 ABS0. 01+5 Inch Sheet OltJ Inch Sheet
37 ABS/PVC0.097 Inch Sheet
TIME, min
_ 106 POLYCARBONATE0.13 Inch Sheet
POLYSUIFONE0.031iiich Sheet
38 METHYL METHACRYUTE0.063 Sheet —
1280 POLYURETHANE1.0 Inch Pad
D,
lOOw-.f ,NF
76 PAINTED PAPER HONEYCOMB (FR)0.38 Inch Assembly
h2 GLASS FIBER1.3 Inch Insulation
±TIME.min
30 GLASS FABRIC PAPER HONEYCOMB0,hl Inch Assembly
Figure 16. Typical smoke curves—sheets. Figure 18. Typical smoke curves—pads, insulaJlion,
assemblies.
131 CHLOROPRENE
F0.065 inch Sheet
200
0.
129 TETRAFLUOROETHYLENE/VINYLIDENE FLUORIDE0.071 Inch Sheet
TIME, min
130 CHLOROSniFONATEDPOLYETHYLENE0.067 inch Sheet
PVC/PVA0-033tnch Laminate
ZOO
100
26 MELAMINE/UREA FORMALDEHYDEO-O32 inch Laminate
TIME.min TIME.min
Figure 17. Typical smoke curves—sheets, laminates. ^ U.S. GOVERNMENT PRINTING OFFICE; I9e9 C
27


Announcement of New Publications inBuilding Science Series
Superintendent of Documents,
Government Printing Office,
Washington, D.C., 20402
Dear Sir:
Please add my name to the announcement hst of new publications to be
issued in the series: National Bureau of Standards Building Science Series.
Name
Company
Address
City State Zip Code
(Notification key N-339)


NATIONAL BUREAU OF STANDARDS
The National Bureau of Standards^ was established by an act of Congress March 3,
1901. Today, in addition to serving as the Nation's central measurement laboratory,
the Bureau is a principal focal point in the Federal Government for assuring maxi-
mum application of the physical and engineering sciences to the advancement of tech-
nology in industry and commerce. To this end the Bureau conducts research andprovides central national services in three broad program areas and provides cen-
tral national services in a fourth. These are: (1) basic measurements and standards,
(2) materials measurements and standards, (3) technological measurements andstandards, and (4) transfer of technology.
The Bureau comprises the Institute for Basic Standards, the Institute for Materials
Research, the Institute for Applied Technology, and the Center for Radiation Research.
THE INSTITUTE FOR BASIC STANDARDS provides the central basis within the
United States of a complete and consistent system of physical measurement, coor-
dinates that system with the measurement systems of other nations, and furnishes
essential services leading to accurate and uniform physical measurements throughout
the Nation's scientific community, industry, and commerce. The Institute consists
of an Office of Standard Reference Data and a group of divisions organized by the
following areas of science and engineering
:
Applied Mathematics—Electricity—Metrology—Mechanics—Heat—Atomic Phys-
ics—Cryogenics^—Radio Physics^—Radio Engineering^—Astrophysics^—Time
and Frequency.
-
THE INSTITUTE FOR MATERIALS RESEARCH conducts materials research lead-
ing to methods, standards of measurement, and data needed by industry, commerce,
educational institutions, and government. The Institute also provides advisory andresearch services to other government agencies. The Institute consists of an Office of
Standard Reference Materials and a group of divisions organized by the following
areas of materials research:
Analytical Chemistry—Polymers—Metallurgy— Inorganic Materials— Physical
Chemistry.
THE INSTITUTE FOR APPLIED TECHNOLOGY provides for the creation of appro-
priate opportunities for the use and application of technology within the Federal Gov-
ernment and within the civilian sector of American industry. The primary functions
of the Institute may be broadly classified as programs relating to technological meas-
urements and standards and techniques for the transfer of technology. The Institute
consists of a Clearinghouse for Scientific and Technical Information,^ a Center for
Computer Sciences and Technology, and a group of technical divisions and offices
organized by the following fields of technology:
Building Research—Electronic Instrumentation— Technical Analysis— Product
Evaluation—Invention and Innovation— Weights and Measures— Engineering
Standards—Vehicle Systems Research.
THE CENTER FOR RADIATION RESEARCH engages in research, measurement,and application of radiation to the solution of Bureau mission problems and the
problems of other agencies and institutions. The Center for Radiation Research con-
sists of the following divisions:
Reactor Radiation—Linac Radiation—Applied Radiation—Nuclear Radiation.
' Headquarters and Laboratories at Gaithersburg. Maryland, unless otherwise noted : mailing address Washington. D. C. 20234." Located at Boulder, Colorado 80302.
^ Located at 5285 Port Royal Road, Springfield. Virginia 22151.

U.S. DEPARTMENT OF COMMERCE POSTAGE AND FEES PAID
WASHINGTON, D.C. 20230 u.s. department of commerce
OFFICIAL BUSINESS