smmmhmhmhhu momhohmhhheee- smamiemhei-ehe …
TRANSCRIPT
ID-R143 277 EXPERIMENTS ON INTERFICTION OF KEY PARTICLE BEAMS WI1TH 1/2THE IGNOSPNERE(U) PHOTONETRICS INC WOBUiRN MAI L KOFSCY ET AL. 31 RUG 63 PN-TR-3-01
UNCLSSIFIED IFL-TR-3-316 F19%2-9-C-S133 F/0G 4/1 M
smmmhmhmhhumomhohmhhhEEE-smamiEmhEI-EhEEEEEE-EEmommoEEE
p
• I .
11111-= ll, ' -EM US 120111131 140 21.18
MICROCOPY RESOLUTION TEST CHARTNATIONAL BUREAU OF STANDARDS-1963-A
AFGL-TR-83-0316
EXPERIMENTS ON INTERACTION OF keV PARTICLE BEAMSWITH THE IONOSPHERE
I.L. KofskyN D.P. Villanucci
J.L. BarrettM.T. Chamberlain
q u R.B. Sluder
S PhotoMetrics, Inc.4 Arrow Drive
I Woburn, MA 01801
31 August 1983
Final ReportI August 1980 - 31 July 1983
C)uO
_j Approved for public release; distribution unlimitedLa..
Prepared for DTICAIR FORCE GEOPHYSICS LABORATORY
ELECTEAIR FORCE SYSTEMS COMMAND JULE20UNITED STATES AIR FORCE S U 2 4
HANSCOM AFB, MASSACHUSETTS 01731 DD
.8 0% A^
This report has been reviewed by the ESO Public Affairs Office (PA) and isrelea~sable to the National Technical Information Service (NTIS).
This technical report has been reviewed and is approved for puhlication.
,I
HERBERT A. COHEN IVING MICq , Acting hiefContract Manaqer Space Plasdras and Fields Branch
FOR THE COMMANDER
RITA C. SArAL7rirorSpace Physics Division
Qualified requestors may obtain additional copies from the Defense TechnicalInformation Center. All others should apply to the National Technical Infor-mation Service.
If your address has changed, or if you wish your name to be removed from themailing list, or if the addressee is no lonqer employed by your orqanization,please notify AFGL/DAA, Hanscom AFB, MA 01731. This will assist us in main-taininq a current mailing list.
Do not return copies of this report unless contractual ohliqation or noticeson a specific document requires that it be returned.

UnclassifiedSECURITY CLASSIFICATION Or TIS PAGE (BWh.n Date. P,,-,.)
REPORT OCUMENTATION PAGE BEFORE__COMPLETINGFORM
IREFOPT NUMBER 2. GOT ACCESSION NO. I. RECIPIENT'S CATALOG NUMBfER
AFGL-TR-83-0316 Ti_ _____
4. TTLE9 (And S.bri iI.) S. ~E Of RPORT PE4CO COVERED
EXPERIMENTS ON INTERACTION OF key FinalPARTICLE BEAMS WITH THE IONOSPHERE _1 Aug 80 - 31 July 83
6. PERFORMING C.RG. REPORT NUMBER
PhM-TR-83-O 1T. AUTMDR(A) B CONTRACT ()R GRANT NUMUI-R(*.I
I.L. Kof sky M.T. Chamberlain F19628-80-C-0133D.P. Villanucci R.B. SluderJ.L. Barrett
*PERFORMING OfGANIZ'AT ION NAME AND ADDRESS 10 PROGRAM EL*EMENT. PROJECT, TASKI
Phto etriCS. Inc. A REA A BORK UNIT NUMBERIS
4 Arrow Drive 62101FWoburn. MA 01801 760114AC
It. CONTROLLING OFFICE NAME ANO ADDRESS 12. REPORT DATE
Air Forc9,,~eoflhysicp Labor~ 31 August 1983Hanscom mSD 'assachusetts 875Il 1 NUMBER OF PAGES
itt. William K. Kaneshiro/PHG/Monitor 14414. MONITORING AGENCY NAME & ADDRESSQII diffr,...I f-n~ C.IoltoII1n Oil) I5. SECURITY CLASS. (*I this report)
Unclassifiedis.. DE CLASSIFiCATION'D)OUNGRADIFOG
SC HEDULE N/AIS. DISTRIBUTION STATEMENT (of this Report)
Approved for public release; distribution unlimited
17, DISTRIBUTION STATEMENT (of th. abstract ntred in RI-,o 20. it different Ir-n Roper')
19 SUPPLEMENTARY NOTES
19 Wj ORDS (Conlit n - ... m ... od. f -n...-1, -dm , I. , 0bil, k nn5
EIectron Deams in space Air fluorescenceIon beams in space Upper atmosphereBeam plasma interactionsRocket photometry
20 ABTAT( In.o n.. I.I .~., andI i-o.olfy h, b?.,A n-.".)
Design and construction of photometric instruments for theSCEX and BERT-i upper-atmospheric energetic particle injectionexperiments is described, and results of a preliminary analysisof N 2Second Positive band irradiances measured at SCEX are pre-
DD A7 1473 EDITION DP I NOY SS I OBSOLETE UnclassifiedSECURITY CI AIrI1A?'," P~ 7111 P IA1,I.S, 1.1. I --

UnclassifiedSECURITY CLASSIFICATION OF THIS PAGE(Vhw Do. XneeN.d
20. Abstract (continued)
lie in the wide fields of radiometrically-calibrated low-light
level video cameras and photometers, and a narrow-field photo-
meter will measure air fluorescence in the space plasmasurrounding the vehicle. The SCEX (Several Compatible [beam
interaction] Experiments) rocket data show the volume excitationby 1-100 milliampere beams of 2-8 keV electrons to be virtuallyindependent of ambient atmospheric density above "'180 kmaltitude (in agreement with results from previous experiments),and also of the electrons' kinetic energy (a new finding);both observations are inconsistent with independent, linearpropagation of the beam particles. The complete set of
irradiances measured by SCEX's 3805A-band photometer has beenput on computer tape in a form suitable for determining theirdependence on single and multiple experiment variables, fordetailed analysis of the collective interactions of the beamwith the ionospheric and induced plasma.
1S
Accession PqV
NTIS GRA&IDTIC TAB 0Unmnounced 0Justification
By_
Distribution/
CIi. Availability Codes SC 6 Avai and/or
_ Dst Special
Unclassified
SECURITY CLASSIrICATION OF ?.41S PAGE(Wheo Dt& Frf.feed)
*
I_FOREWORD
This is the Final Report on a program of optical diagnosis
of the interaction with the ionosphere of beams of keV charged
particles ejected from AFGL and NASA rockets. A preliminary
analysis of photometer data on fluorescence excited by electrons
injected between 170 and 250 km (in the SCEX experiment) is
reported, and design and construction of an optical remote-
sensing system for Air Force Geophysics Laboratory's BERT-i
program is described and the individual instruments documented.
The SCEX data have been put in a form suitable for detailed
computer-assisted analysis of the information they contain about
beam interactions and propagation, and three instruments have
been calibrated and delivered for further environmental testing
and installation on the BERT-i sounding rocket.
The SCEX and BERT-i projects are described in Sections
II and III, and further theoretical contributions to AFGL's
particle beam- and vehicle-interactions program made during
the course of the work appear in Appendixes 1-IX. Earlier
work for AFGL by PhotoMetrics on rocket photometry of injected
particle beams is reported in Ref's 2,20, and AFGL-TR-78-0082,
AD A058469 ("Photographic Measurements of Electrical Discharges,"
(1978) by R.B. Sluder), and AFGL-TR-79-0195, AD A092705 ("Data
Analysis of Films from AFGL Rocket A32.603," (1979) by M.T.
Chamberlain).
The authors were assisted by J.J. Costa, who was re-
sponsible for much of the mechanical design of the instruments,
and Mrs. C.C. Rice, who typed the manuscript. The support and
encouragement of H.A. Cohen and his colleagues of AFGL/PHG
Branch is gratefully acknowledged.
3
TABLE OF CONTENTS
SECTION PAGE
FOREWORD......................................... 3
I. INTRODUCTION AND SUMMARY......................... 7PURPOSE....................................... 7PROJECTS...................................... 7RESULTS....................................... 8
II. THE SCEX PROGRAM................................. 10CONTEXT...................................... 10ROCKET VEHICLE, ELECTRON INJECTION............11PROGRAM TIMETABLE AND PARTICIPATION...........13VIDEO CAMERA ................................ 17PHOTOMETER PROPERTIES, OPTICAL AND
ELECTRONIC............................... 20THE SPECTROSCOPIC-RATIOS METHOD ............... 24PHOTOMETER DATA ANALYSIS..................... 27PRIMARY AND SECONDARY EXCITATION,
COLLECTIVE INTERACTIONS................. 39PHOTOMETER LEAKAGE........................... 43DATA INTERPRETATION, CURRENT PROGRAM
STATUS................................... 45CONCLUSIONS, RECOMMENDATIONS................ 54
III. BERT-l INSTRUMENTATION........................... 57BACKGROUND................................... 57PROGRAM TIMETABLE............................ 59DESIGN EVALUATION REPORT.................... 60OVERVIEW..................................... 60WIDE FIELD PHOTOMETERS....................... 65PLASMA SHEATH PHOTOMETER.................... 73VIDEO CAMERA SPECIFICATION AND
PROCUREMENT.............................. 83VIDEO CAMERA SYSTEM.......................... 90VIDEO CAMERA CALIBRATION.................... 98SUMM~ARY...................................... 105
REFERENCES................................................ 108
APPEN~DIXES I-IX........................................... 111
4
LIST OF ILLUSTRATIONS
FIGURE PAGE
1. Altitude and pitch angle of SCEX electron beam 12
2. Excitation cross-sections of N2 and energyspectra of thermal and Echo III electrons.........25
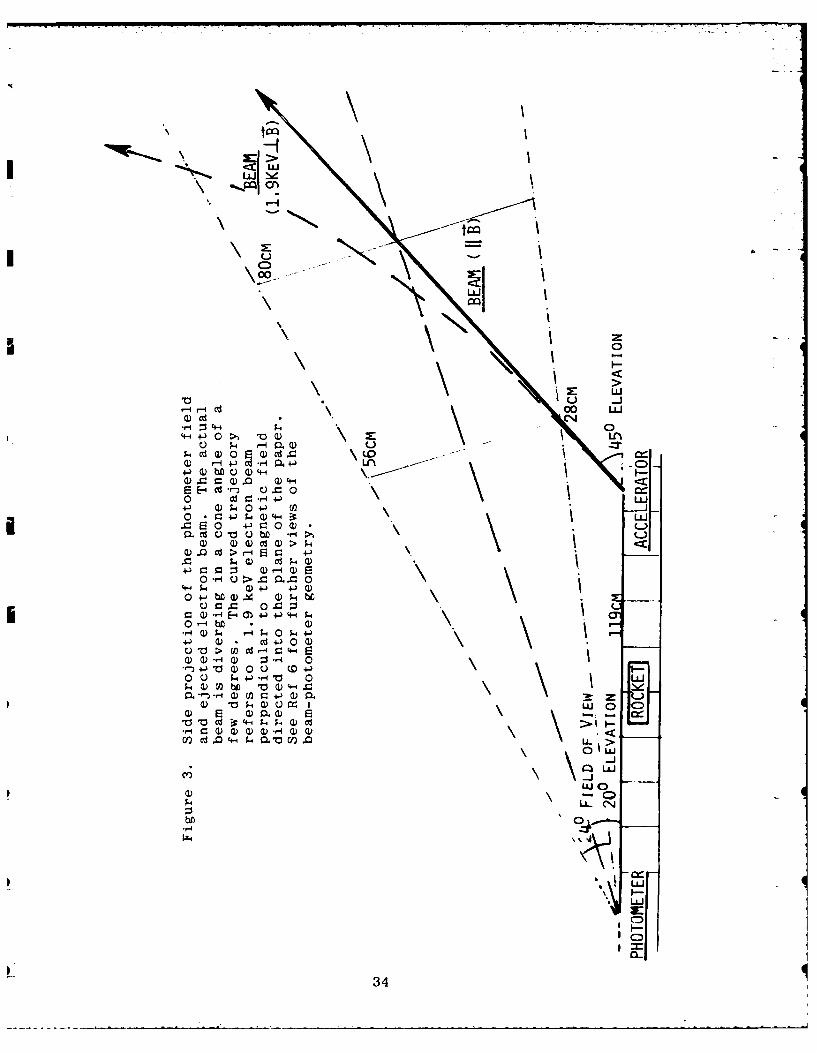
3. Side projection view of SCEX photometerfield and ejected electron beam................... 34
4. Dependence of X and X * [N2 1 on [N2]............ 50
5. Dependence of X and X * [M] on [M].............. 51
6. Dependence of X on V............................. 52
7. BERT-i optical instruments and mechanical mounts 66
8. Wide field photometers (photographs).............. 69
9. Electrical interface for the photometers..........70
10. Electrical interconnections for the photometers. 71
11. Circuit diagram of the photometer amplifiers .. 72
12. Calibration of the wide field photometers.........74,75
13. Plasma sheath photometer (photographs)............77
14. Plasma sheath photometer (mechanical drawing) 78
15. Plasma sheath photometer (outline drawing) ... 79
16. Mounting diagram for the beam-folding mirror .. 80
17. Circuit diagram of the plasma sheath photometer. 81
18 Electrical interface for the photometer...........82
19. Calibration of the plasma sheath photometer ... 84
20. Video camera and controller (photographs).........86
21. Video camera with mechanical mount (photographs) 87
22. Video camera head (outline drawing)............... 91
23. Video camera controller (outline drawing).........92-
5
LIST OF ILLUSTRATIONS (concluded)
PAGEFIGUIRE
24. Electrical interface for the video camera ...... 93
25. Circuit diagram of the gain control monitor .... 94
26. Calibrations of the video camera lens .......... 99
27. Video camera resolution photographs ............ 101
28. Visual resolution of the video camera .......... 102
29. Video gain monitor voltage dependence .......... 104
30. Calibration of the video camera at maximum gain. 106
31. Calibration of the video camera at lessthan maximum gain ................................ 107
LIST OF TABLES
TABLE PAGE
1. SCEX photometers (characteristics) .............. 21
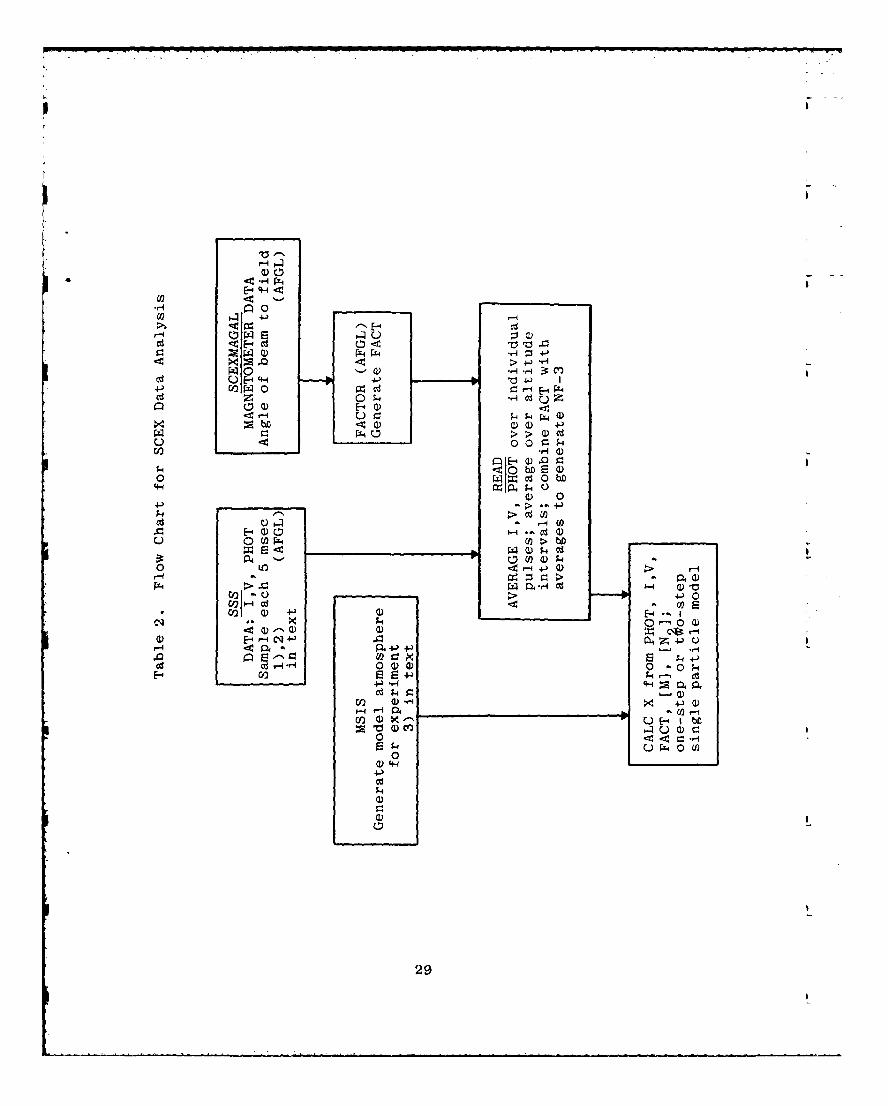
2. Flow chart for SCEX data analysis ............... 31
3. MSIS Model atmosphere for SCEX .................. 29
4. Listing of the SCEXC program ................... 36-38
5. BERT-I experiment parameters ..................... 57
6. Table of Contents and List of Illustrations andTables in PhotoMetrics' Design Evaluation Report 61-63
7. IBERT-1 video camera and photometers ............ 67
S. Video camera specificatons ........................ 89
6
SECTION I
INTRODUCTION AND SUMMARY
PURPOSE
- >The purpose of the program reported here is to study
the interaction of beams of energetic (several keV's) electrons
and ions with the upper atmosphere by optical sensing from
onboard the rocket from which they are injected. Particle
trajectories, return current paths, development of plasma
sheaths, and other collective (beam-plasma) interactions that
result in instabilities and discharge phenomena in the vehicle's
vicinity are considered. The photometric and imaging instru-
ments complement those making direct in situ measurements of
particle densities and energy distributions, rocket potential,
and spectrums of electromagnetic radiation in the charge-injection experiments.
PROJECTS
The work consisted of operating and analyzing the data
from air fluorescence photometers and a video camera on an
electron-injection rocket that was flown in January 1982,
and specifying and constructing a system of photometers and
low light level video camera for a more sophisticated follow-on
experiment to be performed by Air Force Geophysics Laboratory
in Faill 1984. These efforts are described in Sections II and
IlI respectively. Supporting theoretical work on excitation
of the thermosphere by charged-particle beams (and related
technical issues), which has been submitted to AFGL during
the course of the program, is included as a series of
appendixes to this report.
74
RESULTS
The SCEX rocket, flown to an apogee of 241 km on the
night of 26 Jan 1982 at Churchill Research Range, MB (Canada),
returned irradLance data from a photometer sensitive to a
Second Positive fluorescence band of N 2 that was pointed to S
intercept the air volumes excited by narrow beams of 1-100
milliampere, 2-8 kilovolt electrons ejected from the rocket.
We analyzed the signal intensities at the higher altitudes of
the trajectory (above 168 km on upleg) with the aid of a S
computer program that quantitatively takes into account the
effects of ambient N2 density, beam current and voltage (which
determine the volume rates of ionization and excitation), and
paths of the geomagnetLcally-guided primary particles through
the instrument's field of view. The measured radiant intensities
are found to be not consistent with a model of independently-
acting electrons dissipating their kinetic energy in the un-
disturbed ambient atmosphere. (Similar nonlinear effects with
virtual independence of the radiation on local air density have
been observed in other charge-injection experiments.) Further
interpretation of the SCEX photometer data, with inclusion
OC results from the lower downleg altitudes, is expected to S
i.ndicate the role of collective interactions of the beam with
the ionospheric and induced plasma and the (related) effect
of outgassing from the rocket body.
An optical remote sensing system consisting of an ISIT
(ultrasensitive, essentially photon noise limited) video
camera, two wide-field fast response air fluorescence photo-
meters, and a photometer pointed to measure the radiance
of plasma sheaths developing near the rocket body has been
specified, constructed, and calibrated. The instruments are
desi.gne,1 ,or integration into AFGL's BERT-I vehicle, which
will inject beams of 1/2 - 2 keV electrons and 0.1 - 5 keV
8
mow

positive monatomic ions at altitudes to 250 km (and from which
various other probes will measure beam interaction properties).
The optical system is intended (principally) to determine the
onset of air breakdown associated with neutralization of the
charged beam and rocket, from its measurements of the spatial
distribution and total intensity of N2 fluorescence at wave-
lengths below -5500A. This hardware, which is documented
in this report, is now undergoing vibration, vacuum, and other
rocket environment qualification tests at AFGL.
9- q

SECTION II
THE SCEX PROGRAM
CONTEXT
SCEX (Several Compatible Experiments Using a Rocketborne
Electron Accelerator) was sponsored jointly by the National
Aeronautics and Space Administration and Canada's National
Research Council, with Prof. Paul J. Kellogg of the University
of MIinnesota's School of Physics and Astronomy as Principal
Investigator. Its objectives included study of the beam-plasma
discharge (Ref's 1,2,3,4) in the near space environment, vehicle 5
neutralization, and radiofrequency wave emission stimulated in
the ionosphere by the injected beam (and also magnetospheric
and auroral-ionospheric phenomena to whose understanding optical
measurements make no substantive contribution). Six individual
scientific groups, including AFGL, provided instrumentation for
the rocket experiment, with a separate engineering group
responsible for telemetry of the data and other teams operating
groundbased equipment to characterize auroral conditions and 0
monitor RF emissions.
PhotoMetrics, under Air Force Geophysics Laboratory
contract and technical direction, integrated and operated two
filter photometers and a low light level video camera. Other
diagnostic instrumentation, much of which was on platforms
separated from the electron ejection ("mother") rocket, included
eners,etic-particle spectrometers, a low energy electron spec-
trometer (retarding potential analyzer), Langmuir probe, vehicle
potential monitor, electric field probes, and radiofrequency
receivers. This rocket experiment (for which an experimenters'
data package has been prepared by the Minnesota group, but
10

which has not been referenced in the journal literature at
the time of this report) was one of a NASA/NRC beam injection
series that included launches on 08 Apr 78 (27.010AE) and 03
Dec 79 (results from which are analyzed in Ref 5).
ROCKET VEHICLE, ELECTRON INJECTION
Launch of the Black Brant VC rocket (27.045UE) took place
at 0352:20.8 UT on 27 January 1982, at Churchill Research Range.
A moderately strong auroral arc system was reported south of
the station (that is, in the direction of the trajectory), and
was seen as a modulation of the photometer's signal as the
instrument's field of view slowly swept in elevation and
azimuth. The trajectory plane was at 140 0 T (southeastward),
mean horizontal velocity was 0.6 km/sec, and apogee of 241 km
was reached at 255 sec after launch. Data were taken between
168 km altitude on upleg (127 sec) and 82 km on downleg (416 sec).
The 900-lb payload rocket consisted of an aft section
that carried the accelerator and the optical and some of the
other instruments, a forward section which was separated about
2 min after launch, and four so-called throw-away detector
packages. Instrumentation on these outlying platforms, meas-
ured the spatial distribution of induced-plasma properties
(at distances that increase with time after their separation).
The pitch, roll, and yaw motion of the aft section caused the
pitch angle of the electron beam relative to the geomagnetic
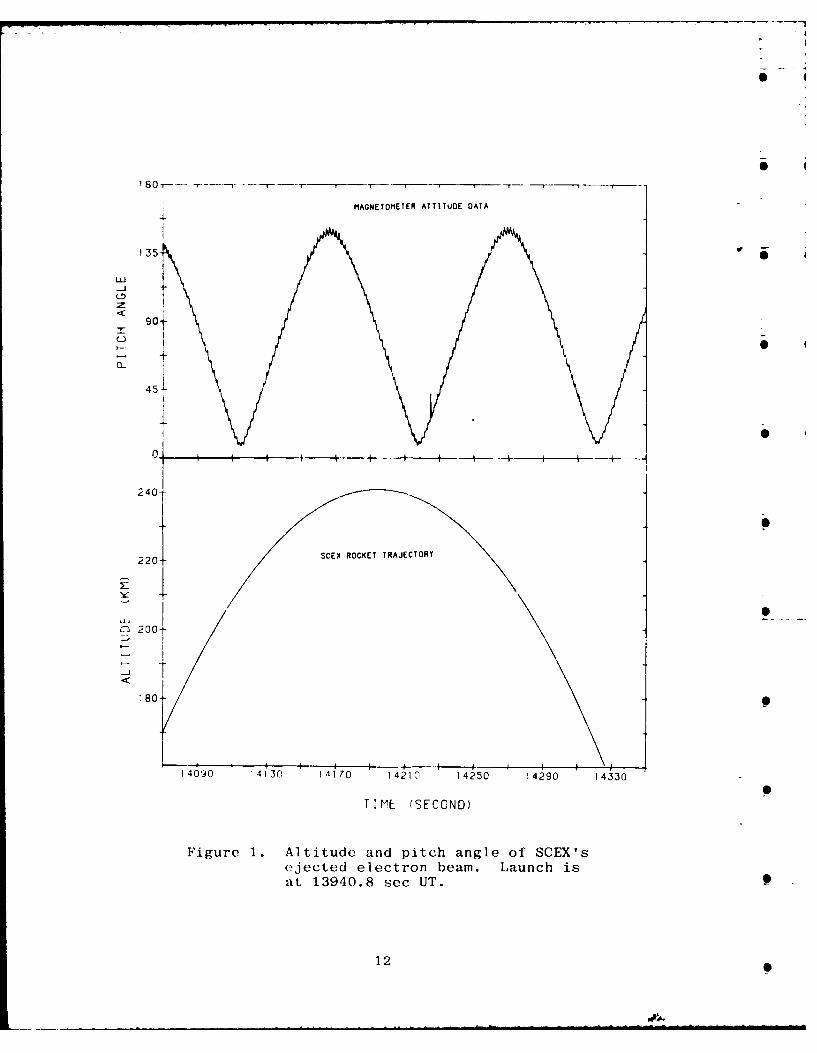
field to cycle between 80 and 140', as shown in Figure 1.
The electron beam was ejected at 450 from the rocket's
long axis (in the direction away from the optical instruments)
in the plane defined by this axis and the optic axes of the
photometers. Its initial total divergence is estimated at
less than 100 full angle. The accelerator sequences three
currents at 1.9 kV, 4 kV, and 8 kV anode cathode potential
di[e[ rence , in tilic foll(owing ipro)train :
11
MAGNETOMETER ATTITUDE DATA
4-
135- -
LJ
0< 90+
451
-+---+------$- - + -- 4 - -- + I -+
2401
220 SCEX ROCKET TRAJECTORY
2 "
M 2000-
I-
14090 '4130 1,1170 14210 14250 14290 14330
TIME (SECOND)
Figure 1. Altitude and pitch angle of SCEX'sejected electron beam. Launch isat 13940.8 sec UT.
12

100 millisec off (after the voltage is turned on)
50 msec 1 milliampere
100 msec off
50 msec 10 ma
100 msec off
50 msec maximum achievable current
(repeat at next accelerating voltage).
Thus beam electrons with the same kinetic energy are ejected
over 0.45 sec, with a full voltage cycle repeated each 1.35
sec. Maximum current from the electron accelerator varied
between 43 and 87 milliamps during flight, which provides
further opportunity for determining the dependence of the
optical signal on injected current. The accelerator currents
and voltages were monitored and telemetered as part of the
experiment.
PROGRAM TIMETABLE AND PARTICIPATION
PhotoMetrics' work on SCEX began 01 August 1980. At that
time payload integration was scheduled to start on 01 December
at Goddard Space Flight Center, with launch planned for early 0
1981. Two recently-built photometers with 300 nominal field
of view were GFE'd to PhotoMetrics by AFGL in November 1980,
and PhotoMetrics placed on order a ITT (Fort Wayne, IN) F4546
low light-level video camera just after the program started. 0
As delivery of this camera was promised for February 1981, a
similar but low-sensitivity dummy camera (GE TN2500, uninten-
sified) was obtained to assist mechanical and electrical inter-
facing of the on-order camera to the rocket. 0
At this phase of the program the optic axes of the photo-
meters had been scheduled to point at 200 and 700 elevation
from the payload's forward (long) axis, in the plane formed
13
by this axis and that of the ejected electron beam, with the
photometers' objective lenses 1-1/4 m from the accelerator
anode. Both instruments were to be sensitive to the (0,0)
band of the N12 +First Negative (B+X) system, which extends415 A~ below its P branch head at 3914 A. The rate of exci-
tation of this band, as is well known, remains very closely
proportional to the rate of ionizations from N2 by electrons
of energy greater than 28 eV. The rationale for using two
essentially-identical photometers, only one of whose fields
would intercept the initial (undeflected) beam axis was, that
the ratio of signals would in some way indicate the onset of a
collective interaction of the beam with the ambient atmosphere,
which is known (Ref 4) to spread the beam laterally. That is,
the photometers would serve as a "camera" having two relatively
wide-angle and non-touching picture elements.
Insofar as the primary electron beam is guided through
their fields of view by the earth's magnetic field, the ratio
of photometer signals is by no means an unambiguous measure of
interaction/energy dissipation nonlinearities. Further, the
video camera is available to measure the spatial distribution
of atmospheric excitation, which is one of the characteristic
signatures of beam-plasma discharge. Hence we suggested that
the two photometers be applied to measure a spectroscopic
signature of the discharge, the magnitudes and (in particular)
ratio of intensities in two air fluorescence features. Serving
as a "1spectrometer"~ with two sensitivity bands, the instruments
would determine an effective temperature of the beam from the
relative rates of emission of nitrogen molecule bands having
known (energy-dependent) impact excitation cross-sections; the
absolute intensities are a further indication of discharge
initiation (as in the experiments reported in Ref 1).
The second fluorescence band selected was the 0,2 trans-
sition of the N12 Second Positive (G+B) system below 3805A.
14

We specified an interference filter isolating this band, and
installed it in one of the photometers. The photometers were
coaligned to point at 200 elevation, mounted at a point 119
cm from the accelerator and so that the optical and ejected-
beam axes intercept some 75 cm from the electron accelerator
(refer to Figure 3, shown later). This change required some
mechanical reconfiguration of the rocket. The expected 3805A/
3914A intensity ratios are discussed in a later subsection of
Section I1.
A change in the pointing direction of the video camera
was suggested by Prof. Kellogg on the basis of computer-assisted
calculations of the trajectories the 2,4, and 8 keV electrons
through its field of view as a function of their injection
pitch angle. With the assistance of Dr. Charles K. Crawford
of Kimball Physics (Wilton, NH) we repeated these calculations
and submitted to AFGL the program developed for plotting model
beam images. The video's optic axis was lowered to 300 eleva-
tion from its original 350, with its field extending 470 in
elevation and 370 in azimuth from the initial beam direction.
For mechanical reasons its axis was placed 90 clockwise in
rocket azimuth from the initial beam direction (when viewed
along the payload's forward axis).
We took the photometers and F4546 video camera to NASA-
Goddard Space Flight Center, MD, for preliminary integration
into the SCEX payload 5-11 Mar 1981. (Dummy photometer units
had been earlier provided for mechanical integration.) Between
26 Mar and 9 Apr we tested the instruments, installed as for
the actual flight, in the 30-meter vacuum tank (Chamber A) at
NASA-Johnson Space Center, TX. We found that the camera
provided images having adequate signal/noise of fluorescence
excited by a 2 ma beam of 1-1/2 key electrons at a tank
pressure equivalent to that at 130 km atmospheric altitude
15
7i
(with no evidence from other instrumentation of discharge
effects). The equipment's telemetrylines were also checked
out in the JSC chamber tests. Persistent difficulties with
performance of the photometers, which had been delivered to
AFGL in Fall 1980, were encountered during these test periods
and later recalibrations at PhotoMetrics' laboratory.
Following a hiatus due to lack of funds between August
and October, we performed a post-vibration test checkout at
NASA/Goddard 17-18 Nov 1981. Problems with sensitivity and 5
noise of the photometers remained; and noise that developed
in the video camera's automatic gain control monitor installed
by PhotoMetrics was removed by RC-filtering. We then recali-
brated the equipment. It was then shipped by AFGL to Churchill,
under ground transport conditions where it was exposed to
temperatures of -450 C. PhotoMetrics participated in the rocket
buildup and launch 4-28 Jan 1982. After the video was re-
installed on the rocket alternate picture elements were found
to be dropping out between turnon and 15-20 min warmup time,
which resulted in images having half the specified resolution
during that period. The fault was identified as originating in
the camera head, which was not accessible for field repair.
The problem was avoided by cycling the camera on and off each
10-15 min during the prelaunch hold periods.
During flight the N2 Second Positive band photometer
operated as planned, showing signal on each accelerator pulse
and the about-expected modulation from the aurora. (Quantitative
comparison of the auroral emission intensities measured by the
rocket photometer and groundbased photometers and cameras is
not practical because of the greatly different projections of
these instruments' field of view.) The 3914A photometer,
however, returned no data, with the telemetry trace flat
throughout the flight. The failure mode of the instrument,
16
which had performed poorly throughout the test and buildup
period, has not been identified. The video images failed to
show any aurora or fluorescence excited by the ejected electron
beam even though the raster scan lines were present on the
groundbased monitors during the experiment. As the signal
strength of the video telemetry was much less than predicted
(-15 dB), this data loss is currently ascribed to inadequate
signal/noise in the downlink, most probably due to loss of the
rocket transmitter's final stage. The SCEX instrument payload
was not recovered for post-flight examination.
Following a further four-month hiatus in early 1982 due
to lack of contract funding, we started analysis of the Second
Positive band data. AFGL reduced the telemetry voltages to
average radiance within the instrument's field of view, using
PhotoMetrics' calibration. AFGL also developed a program for
calculating the relative irradiance at the photometer that would
result from the trajectory of the geomagnetically-deflected
electron beam through its field of view (Ref 6), expanding on
the (unpublished) beam-image calculations previously performed
by Minnesota and PhotoMetrics/Kimball Physics. Ile review the
status of this preliminary analysis after the documentation
below of the video camera and photometer.
VIDEO CAMERA
The ITT F-4546 system (S/N 9445212) consists of a General
Electric Company (Syracuse, NY) TN2500 CID (charge injection
device) solid state digital camera modified by the addition of
a proximity focussed microchannel-plate image intensifier (ITT
Model F-4111). It has S-20 (extended red) spectral sensitivity,
and used without a filter (as in the experiment) nominal thres-
hold sensitivity of 10-6 ft candles (we discuss the actual
calibration later). The camera was fitted with a 13 mm focal
17
17

length, f/1.5 objective lens (Canon VF 1315) to provide an
angular field of view of 370 x 470.
On its receipt we ruggedized the camera's electronics
by conformal potting (with Emerson-Gumming coating), strength-
ening the mechanical monitoring of the circuit cards with
nylon spacers, and fastening loose wires with Super-glue. In
addition we tapped into the video amplifiers to monitor the
voltage applied to the camera's automatic gain control and
automatic light control circuits as the irradiance at its
faceplate changes. Adding a similar monitor to the automatic
brightness control of the image intensifier proved impractical.
The completed arrangement allowed monitoring of the system's
self-adjusting sensitivity at the high end of the intensifier's
dynamic range (that is, for the expected weak light levels).
These gain signals were telemetered from the rocket along
with the image data flow.
The TN2500 camera outputs the video voltages in a TTL-
compatible 8 bit parallel format at 4.5 MHz word rate. Its
RS170 composite analog video signal is suitable for display
on standard closed circuit TV monitors. The camera was used
at 244 vertical lines across the field, 248 pixels per line.
The TN2500 consists of a 28 x 21 x 6.7 cm control box weighing
900 g, and a 5.5 x 7.9 x 7.9 cm head weighing 340 g without
lens, connected by a 50 cm cable. The intensifier section
(ITT F-4111) and its high voltage power supply were potted in
Gonothane EN-il by the manufacturer to prevent sparking and
outgassing at rocket altitudes.
The lens for the camera was selected to provide a field
of view comparable to the expected diameter of beam-associated
discharges, which would be a few primary electron gyroradii,
that is, several meters [at the mean range of the beam]. A
Canon 13 mm focal length lens was selected on the basis of its
18
having higher aperture ratio than similar Nikon or Tamron
lenses. This lens, which weighs 240 g, fits the camera's C
mount and extends 6.4 cm from its front plate. The camera was
mounted on the payload with its lens 185 cm from the accelerator,
offset 90 in payload azimuth from the port (viewing forward
along the rocket's long axis). Its optic axis was pointed at300 elevation, 00 azimuth from this axis, with the long dimension
of its angular field in the beam direction. When the electron
beam is injected parallel or antiparallel to a geomagnetic
field line, it passes near the center of the camera field at a
range of 5 m from the camera (4-1/2 m from the accelerator
anode), making an angle of about 150 with the camera axis.
We vacuum tested the camera in an AFGL bell jar at
pressures to 10-6 torr, finding its sensitivity to be the
same within measurement accuracy before and after the exposure.
This threshold sensitivity was measured using a uniform-bright-
ness area 15 cm square (AFGL Low-Brightness Source) filtered
to 70A FWHM at 4280A. Scene brightnesses as low as 5 x 10⁻⁴
erg/(cm 2 sec ster) produced adequate output voltage signal over
noise in single frames at full system gain. The camera's
response was radiometrically calibrated against this light
source, with the automatic gain control and automatic light
control voltages recorded.
As noted, the video camera was operated in Johnson Space
Center's Chamber A against several-milliampere beams of 1-4 keV
electrons at ambient N2 molecule densities down to those at
130 km altitude (the chamber's limit), and found to produce
useful images. Scene radiances in these images were of the
order of a few kilorayleighs. As noted the telemetry link for
the video faceplate signal and the gain controllers (provided
by another group) was also checked out during this test period.
This video telemetry downlink used a 10-watt S-band (2215.5 MHz)
19 q

FM transmitter and two redundant wideband Microdyne 100 LS
receivers driving two Panasonic WV 5400 monitors and MV-9200
video cassette recorders. A parallel BCD time code was fed
into one of the two monitors and recorders to identify time-
after-launch of each image. These recorders have 3/4 inch
cassettes with 1 hr recording capability.
The radiofrequency signal intensity from this video
image telemetry system was expected to be 20 dB above noise,
but was observed to be only 5 dB above noise during actual
rocket flight. No image contrast was detectable in the video
playback, although the raster was visible. An attempt made to
enhance with low pass filters the signal expected from the
periodically-pulsing beam also failed to provide any useful
information. As mentioned above the loss of data from the
video camera has been provisionally ascribed to failure of the
telemetry transmitter' s final amplification stage.
PHOTOMETER PROPERTIES, OPTICAL AND ELECTRONIC
The optical and other characteristics of the two photo-
meters are listed in Table 1. Further documentation and
identification of mechanical interface, electrical interface,
and schematic drawings is provided by their manufacturer in
Ref 7.
As a critical rather than Koehler illumination system is
employed, sensitivity in the photometer's field of view varies
with the local conversion efficiency of the photocathode (the
solid angle element at each el, az being imaged onto a patch
on the cathode). Vignetting by the lens barrel reduces the
effective angular field (from that otherwise defined by the
photocathode area and the lens focal length) to approximately
240 full conical angle, as we will show presently. The currentoutput from the electron multiplier is fed through a through a
20
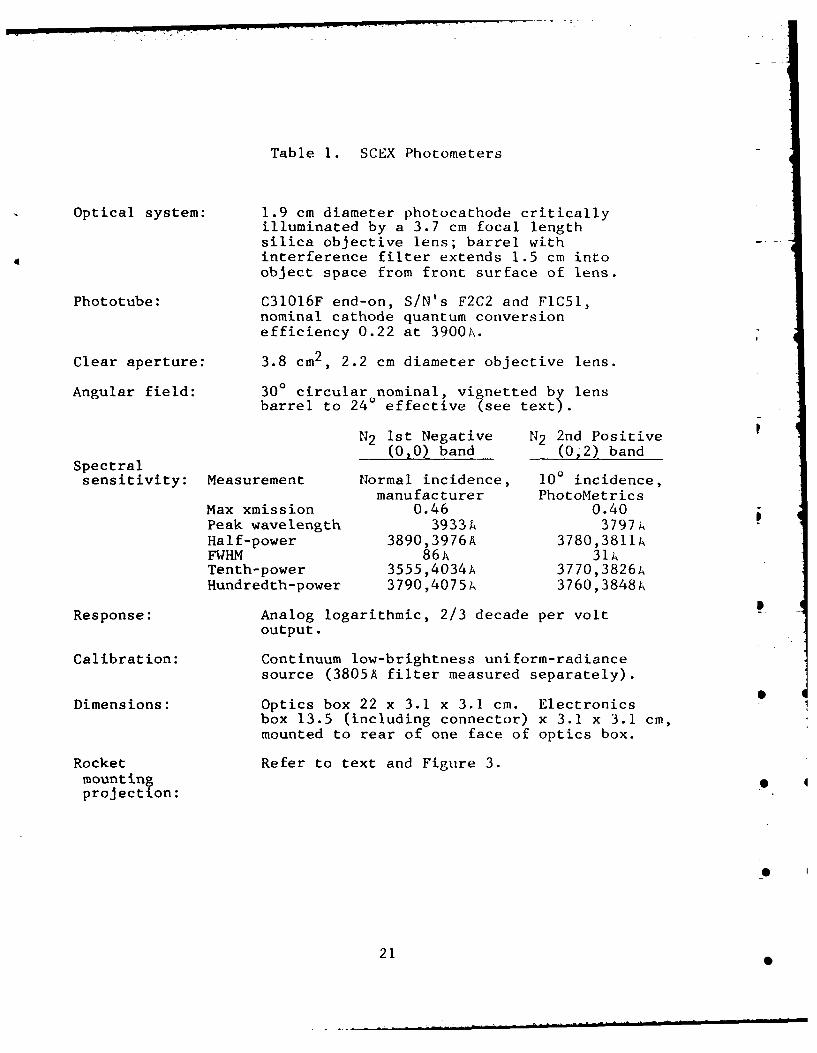
Table 1. SCEX Photometers
Optical system: 1.9 cm diameter photocathode criticallyilluminated by a 3.7 cm focal lengthsilica objective lens; barrel withinterference filter extends 1.5 cm intoobject space from front surface of lens.
Phototube: C31016F end-on, S/N's F2C2 and FIC51,nominal cathode quantum conversionefficiency 0.22 at 3900.
Clear aperture: 3.8 cm 2, 2.2 cm diameter objective lens.
Angular field: 300 circular nominal, vignetted by lensbarrel to 240 effective (see text).
N2 Ist Negative N2 2nd Positive(0,0) band (0;2) band
Spectral
sensitivity: Measurement Normal incidence, 10 incidence,manufacturer PhotoMetrics
Max xmission 0.46 0.40Peak wavelength 3933A 3797AHalf-power 3890,3976A 3780,3811AFWHM 86A 31ATenth-power 3555,4034A 3770,3826AHundredth-power 3790,4075A 3760,3848A
SResponse: Analog logarithmic, 2/3 decade per volt
output.
Calibration: Continuum low-brightness uniform-radiancesource (3805A filter measured separately).
Dimensions: Optics box 22 x 3.1 x 3.1 cm. Electronicsbox 13.5 (including connector) x 3.1 x 3.1 cm,mounted to rear of one face of optics box.
Rocket Refer to text and Figure 3.mounting 4projection:
21
logarithmetic amplifier to compress the planned wide dynamic
range of scene brightnesses to the 0-5 volt range of the rocket's
data telemetry system. High voltage applied to the photomulti-
plier tube was held constant at about 1100 V by a regulator
circuit, and monitored during flight. 7
PhotoMetrics replaced the 3914A-band interference
filter initially in one photometer with a filter for the 0,2
transition of the N 2 Second Positive system. We specified that
the filter be manufactured to transmit optimally the 3805A-
band's profile in the expected 150 half-angle illumination
cone. We measured the as-received filter's transmission at
230 C temperature to a parallel light beam incident at 100 from
its surface normal, which accurately simulates the passband-
shifting and -broadening effect of a uniform light source
filling the photometer's field of view (Ref 8). The spectral
response of the 3914A filter had been measured by its manu-
facturer, in normal-incident light. In practice this latter
filter's wide wavelength response, 86 A FWHM at normal
incidence, obviates the need for detailed calculation of its
mean tranmission of the band's P and R branches even when its
effective spectral shift due to incidence of off-axis rays is -
considered. (Half of the photons are in the 4A-wide P branch,
and the R branch extends -10A further toward the violet.)
Such a calculation was, however, necessary for the 3805A band,
which we assumed to originate from N 2 molecules at 300 K uni-
formly radiating within the photometer instrument's field of
view. This assumption of a constant local N2 rotational temp-
erature over the rocket's trajectory has the effect of under-
estimating slightly the band radiances at the higher altitudes,
where broader rotational development resulting from the higher
ambient temperatures moves some of the radiation further into
the wings of the interference filter's transmission profile.
22

We calibrated the continuum response of the photometers
with a spatially-uniform light source (originally of AFGL
design and construction, unit D5) whose spectral radiance
calibration is traceable to the National Bureau of Standards
and whose brightness is adjustable over three decades. In
practice a continuum scene brightness of 100 rayleighs within
the passband resulted in a signal of 1/2 volt (",elow the dark
reading of 5.0 volts) from the 3805 A photometer. It should
be noted that the measured radiance response can be converted
to a a SCEX incident-irradiance calibration, as discussed
later.
We estimated the effect of vignetting of the photometer's
field by its lens support ring by tracing rays on its assembly
diagram. The instrument's response falls to 80% of its paraxial
value at 70 off axis, 50% at 120, and zero at 140. The depend-
ence expected from geometric-optics considerations is [cos
(off-axis angle)] 4 x [physical vignetting factor], the first
term being the usual thin-simple-lens vignetting factor and
the second term of course also decreasing with the light bundle's
angle from the optical axis (in a complex way; some increases
due to internal reflections in the unbaffled photometer could
also be expected). As mentioned above, the photometer fields
are therefore much better represented by a 120 half-angle
cone than the original design goal of 150.
Construction of the photometers had been completed about
three months into PhotoMetrics' program, and substantial de-
bugging and repair of the two units turned out to be required.
Although the difficulties (principally broken electrical connec
tions, marginally operative amplifiers, and incorrectly-trimmed
applied voltages) identified in the course of PhotoMetrics'
calibration and payload integration were corrected in a timely
23
way by the instrument's supplier, they nevertheless resulted
in program delays.
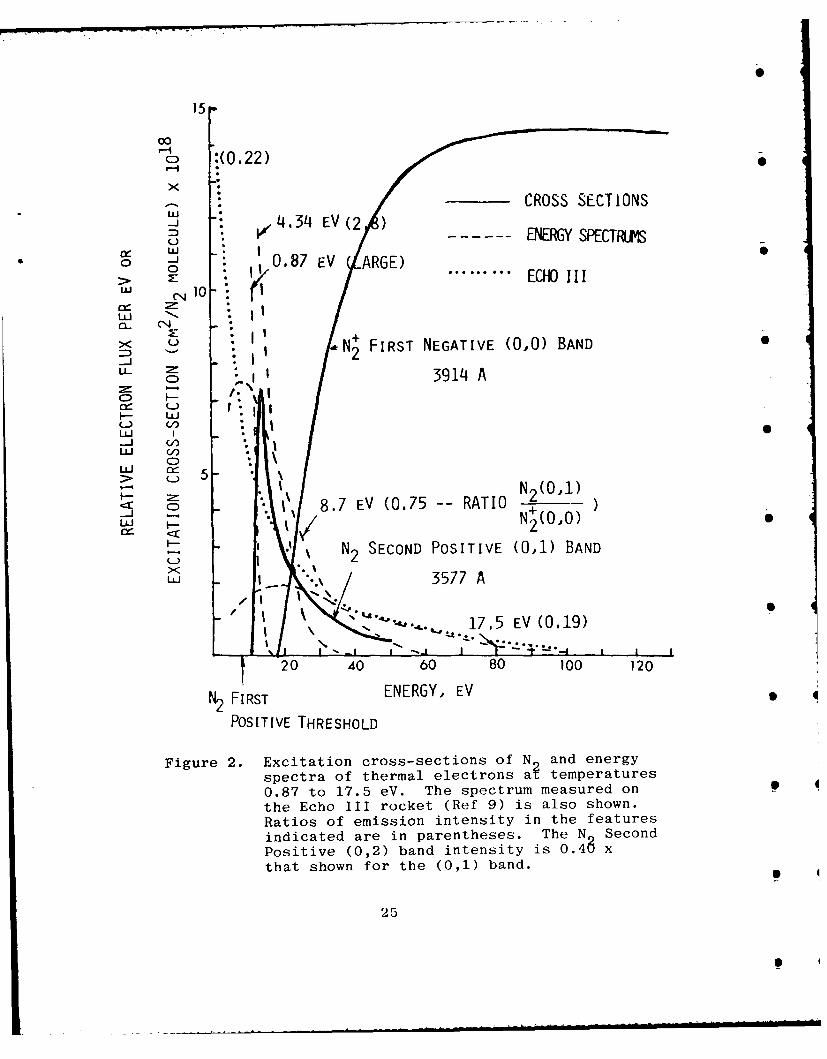
THE SPECTROSCOPIC-RATIOS METHOD
I The method for determining an effective temperature
of the electrons in the beam region applies the well-known
principle that the triplet states of N2 are most efficiently
excited by -10-30 eV electrons (by electron-exchange collisions)
while the electronic states of the N42 +ion are efficiently
directly collisionally excited by electrons with energies
>-19 eV. Thus the ratios of column intensities in emission
bands provide a measure of the energy distribution of the plasma
electrons. This physical situation is illustrated in Figure 2,
which shows the energy dependence of the excitation cross-
sections of the upper states of two major features in each
system, the N2 Second Positive (C3irU B3 19 ) 0,1 and N2 +First Negative (B2 ZU + X2 +) 0,0 bands. Superposed
on the cross-sections are the energy distributions of the
electrons at four temperatures and those measured in the
Echo III upper-atmospheric electron-injection experiment
(Ref 9), with the resulting band intensity ratios calculated
as described below. Oscillating electric fields associated
with collective interactions of charged beams with plasmas
heat the plasma electrons (Ref's 1,4), so that their energy
distribution becomes different from that of the secondaries
that are produced in impact ionizations by the primary injected
electrons. (The latter are given in Ref 10 in the context of
excitation by auroral particles having similar keV's energy.)
S In particular substantial fluxes of electrons near the 16 eV
ionization threshold Of t12 would be present, enhancing the
relative excitation of the Second Positive bands (and other N42triplet systems, not shown in Fig 2 for clarity).
24
15
00C) :(0.22)0
MJ ENERGY SPECTRIMSU
:87 ECHO III
W (
X N + FIRST NEGATIVE (0,0) BAND
U- 39114 AC-,
ULj Cn
- N,)(0,1)C- 8.7 EV (0.75 RATIO -
U N2 (010)
N 2 SECOND POSITIVE (0,1) BAND
Ui 3571 A
17.5 EV (0.19)
N 20 40 60 80 100 120
N2 FIRST ENERGY, EV E
POSITIVE THRESHOLD
Figure 2. Excitation cross-sections of N and energyspectra of thermal electrons ai temperatures0.87 to 17.5 eV. The spectrum measured onthe Echo III rocket (Ref 9) is also shown.Ratios of emission intensity in the featuresindicated are in parentheses. The N SecondPositive (0,2) band intensity is 0 .4 xthat shown for the (0,1) band.
25

As interference filters for the 0,1 Second Positive
band's wavelengths extending below 3577A are difficult
and expensive to fabricate, we chose to measure instead the
intensity of the 0,2 band with head at 3805A, whose emission
probability is 0.40x that in the 0,1 band (as is known from
the state's Franck-Condon branching factors). Like the 3914A
band, this band is well spectrally isolated from other upper-air
fluorescence features (more on this later) and thus its intensity
lends itself to measurement with interference-filter photometers
of the design on hand. The 3805A/3914A band column inten-
sities are therefore 0.4 times those listed in Figure 2, varying
from 1.12 at 4.34 eV electron temperature (and very much higher
at lower temperatures, as the electron energy distribution for
0.87 eV clearly shows) to 0.31 at 17.5 eV.
In contrast the calculated ratio at 120 km altitude from
an electron energy spectrum that results from single particle
energy dissipation is 0.13 (Ref 10, with the input from Ref 11
that 6.6% of the N2 C + B system photons are in the 0,2
band); and the measured ratio viewing the -100-150 km-altitude
auroral excitation column from ground stations is also 0.13
(Ref 11). We applied our calculational model to the auroral
energy distribution Ref 12, again getting a ratio of 0.13.
Hence the emission ratio appears to be a sensitive function of
the onset of discharges, with the proviso that account is taken
of direct excitation of the two features by the primary beam
electrons and that the instrument field of view encompasses the
region outside the beam path excited by the laterally-scattered
secondaries as well as the heated-plasma electrons (the discharge
is confined principally within the injected beam's gyroradius).
Ile selected a band originating from the C state of N2because this state is known to be populated almost exclusively
by direct electron impact on ground-state N2 molecules. The
26
lower-lying B( 7g) state, from which originate the even
stronger B +A( 3 u +) First Positive bands, is to a large
extent populated by cascade from the C, A and higher states
(and perhaps also by atomic collisions), and the still lower-
lying A state is metastable with a lifetime (--2 sec) much longer
than the dwell time of the onboard photometers on the volume
excited by the rocket's electron beams (as well as being in
large part populated by cascade).
We derived the ratios shown in Fig 2 using a specially-
developed digital computer program (SPECRAT) that calculates
the electron energy spectrum at given temperatures (some of
which are plotted in Fig 2) and folds this distribution into
tabulated excitation cross-sections. For the N2 X + C cross-
sections, about which there had been earlier measurement dis-
agreements, we used the recent results of Cartwright et al.
(Ref 13). The N2(X) + N2 +(B) cross-sections, measurements
of which are currently in good agreement, were taken from
Ref's 14 and 15.
PHOTOMETER DATA ANALYSIS
The fact that the electron beam current and energy were
independently varied, with injection at a series of altitudes
and pitch angles to the geomagnetic field, provides an oppor-
tunity to investigate the dependence of the beam's interaction
with the atmosphere on these parameters. The basic data, which
are on the telemetry record as a function of time during flight,
are
la. Beam current I
lb. Accelerator anode-cathode potential
difference V
2. 3805A photometer signal, herein-
after labeled PHOT when calibrated and
27

corrected for the sky background due
to aurora.
Further information needed for the analysis is
3. An ambient atmospheric species con-
centration profile.
4. Model irradiance at the photometer
produced by the beam particles,
which varies with the the beam's tra-
jectory through the photometer's
field of view (determined by the
angles between the beam's axis and
the geomagnetic field) as well as
items 1) and 3).
PHlOT could also depend directly on the pitch angle to the
field, as well as through the trajectory calculation 4); on
whether the beam was injected into the upper or lower hemis-
phere, that is, on the fraction of the primary electrons that
escape the atmosphere (large when injection is upward from above
130 kin); and/or time after launch, on which the rate of out-
gassing (principally of water vapor) would depend.
A flow chart of the data reduction and analysis is shown
in Table 2. VI, and the photometer's output voltage were
sampled each 5 msec, or 9-10 times per current pulse, in a data
file labeled SSS. tie arithmetically averaged I,V, and PHOT (in
program READ) to produce a single mean reading within individual
beam pulses. The standard deviation of the individual voltage
samplings is <1%, but the current fluctuations were substan-
tially higher (20-50% standard deviation). The photometer
signal varies by 30-90% within the pulses, without correlation
with these current fluctuations. (This noise may be associated
with instabilities in the interaction of the beam with the
atmosphere.)
28
EcH
W- 4-)
pq z0 COE~Z
Cd~Wa Q P -Cd ~ ~~ z Wcd- c
Co Q)- E- ar-q~~ u.. 0 - 44bJ)~*~ bf4c (1 )
U 0~ 0 b
E4 a) o 0!: b 00 c 0d
4'-4* 0 a
od C.) Pr -q
E-i W 0 d Q
0 (D2W~ PL, u____.__
=4 E -:44~ w*)*4P4 (02 ) $0~~ 4-)Q)
co Q4- > 0
C4 CId w
x 0 00) C.)Fz CO
Cd H 0 ~~) a -
4-)a0dQ
29 q -
F
AFGL removed the slowly-varying photometer background
due to aurora by spline fitting with a cubic polynomial func-
tion, in SSS. That this automatic subtraction procedure can
lead to large errors, particularly when only 1 ma was injected,
is evidenced by the occasional negative values of PHOT, which
we omitted from the data reduction. (PhotoMetrics provided
the telemetry voltage level to radiance transfer calibration
for SSS.) The error in PHOT is relatively large because PHOT's
value is the difference between two logarithmically recorded
radiances. Irradiances within the photometer's -140 -full cone
field can be found from its radiance sensitivity (which was
measured with the field uniformly filled) integrated over its
aforementioned angular sensitivity. A manual summation shows
this irradiance to be 0.105 times the as-calibrated radiance,
in units photons/cm 2 sec when the radiance is in photons/cm2
sec ster (= (106 /4a) x number of rayleighs).
For the atmosphere into which the beam was injected
(Item 3 above), PhotoMetrics applied the MSIS model (Ref 16)
appropriate to the conditions of the SCEX experiment, which are
Year/Day 82/027
Local standard time 21.64 hrs _
Latitude/Longitude 58.80N, 265.8 0 E
10.7 cm flux average 196.1
10.7 cm flux local 182.7
Ap 7.
The solar flux and magnetic activity index for the launch
period were taken from Ref 17. Results, shown in Table 3,
were put in program MSIS.
We calculated the irradiances that would result from
impact excitation of ambient N2 by the primary beam particles
only (Item 4) using the beam geometry factors derived with
AFGL's program FACTOR (described in Ref 6), taking initial
30 p

qr In Ull m U3 U") n -c 0c -O -4 0 o -O -o -o - 0 '0 0 c 0 '0 -O r- f. -.. Ir-- - - - - ----- --- -- - -- - - --
+ 4. +4. . 44 +++ +444 +.
CD N wN w w 4-)
ol cm COPG - N- _0S
0 40 'mC .g
.- !I.J ~ a boll m m %- - - - -- - - - - -; &q C
LaJ~i&% La L
q- - o n --- CD--Q .9 ;10.. .4H~~(V (3. 0, (rt. iC . 4)4 Q
W)q "-,W .)mmm 4- - ------Co ++++
09 094r S. In ':~ O C! 0!J ~ ca
1-1 -r 4Tl " q C . I "
+ 4 4 4 CIL C 0-
-- ~ - ---4 -4 - -- - --4 -4 4--4-4----4-4-4 -4-4-4 ;-
+~ + -- 44 -+ I-+4- +-4- +4----4-+ -d=9
rn La L" W L- t k" N
H. ecW mc PO
-W W- *
Ao~ 1% ococ 4
31
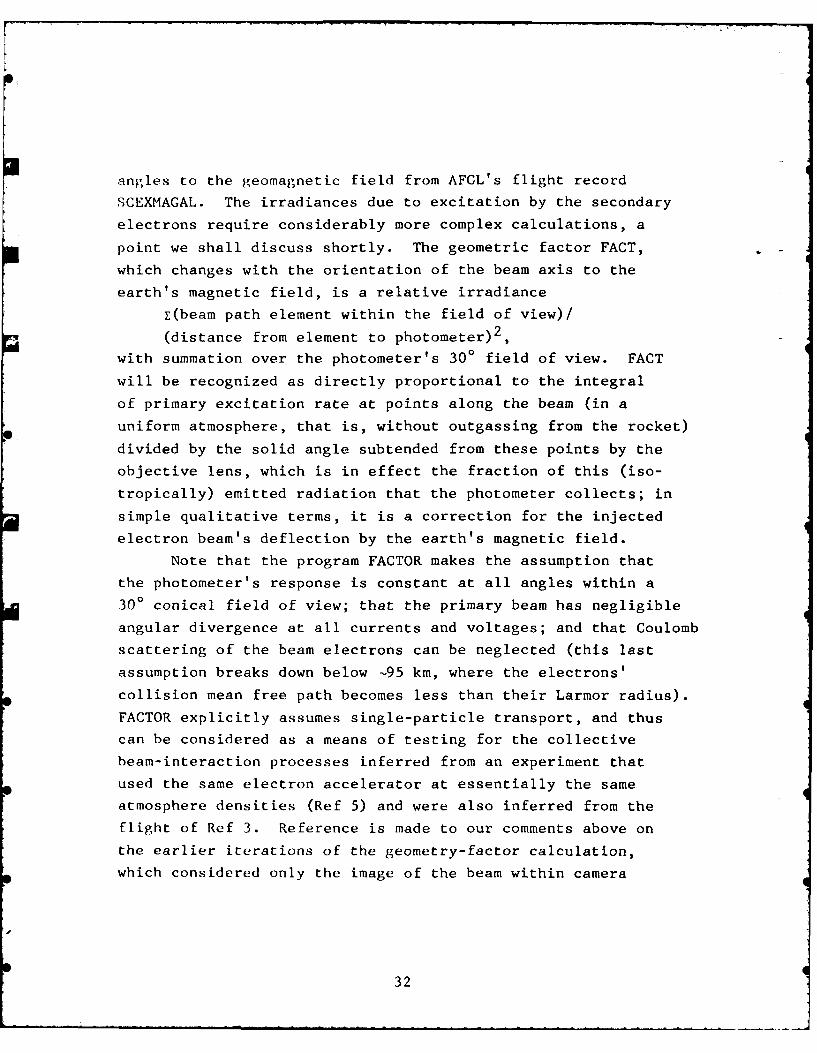
angles to the geomagnetic field from AFGL's flight record
SCEXMAGAL. The irradiances due to excitation by the secondary
electrons require considerably more complex calculations, a
point we shall discuss shortly. The geometric factor FACT,
which changes with the orientation of the beam axis to the
earth's magnetic field, is a relative irradiance
z(beam path element within the field of view)/
(distance from element to photometer)2 ,
with summation over the photometer's 300 field of view. FACT
will be recognized as directly proportional to the integral
of primary excitation rate at points along the beam (in a
uniform atmosphere, that is, without outgassing from the rocket)
divided by the solid angle subtended from these points by the
objective lens, which is in effect the fraction of this (iso-
tropically) emitted radiation that the photometer collects; in
simple qualitative terms, it is a correction for the injected
electron beam's deflection by the earth's magnetic field.
Note that the program FACTOR makes the assumption that
the photometer' s response is constant at all angles within a
300 conical field of view; that the primary beam has negligible
angular divergence at all currents and voltages; and that Coulomb
scattering of the beam electrons can be neglected (this last
assumption breaks down below -95 kin, where the electrons'
collision mean free path becomes less than their Larmor radius).
FACTOR explicitly assumes single-particle transport, and thus
can be considered as a means of testing for the collective
beam-interaction processes inferred from an experiment that
used the same electron accelerator at essentially the same
atmosphere densities (Ref 5) and were also inferred from the
flight of Ref 3. Reference is made to our comments above on
the earlier iterations of the geometry-factor calculation,
which considered only the image of the beam within camera
32

fields; the present calculation figures also in the distance
from the instrument to line elements along the beam path, to
determine irradiances (as was suggested by PhotoMetrics).
In practice FACT varies only over a range of about 2
for all the injection pitch angles encountered in flight.
The reason is, that the primary electrons' gyroradius is
typically a few times the transverse dimension of the angular
field at close range to the photometer, where the major
fraction of the irradiance sum originates because the
(distance)-2 term is large. This is illustrated in Figure 3
(further projections of the beam-field geometry are shown in
Ref 6). The separation of the photometer and accelerator is
1.19 m, while the gyroradius of electrons injected perpen-
dicular to the 0.52-gauss field (an average over the tra-
jectory altitudes at Churchill) is 2.85 m at 1.9 keV and
5.8 m at 8 keV. Figure 3 shows a worst case deflection, at
the lowest electron momentum perpendicular to the earth's
field. Thus the beam close to the photometer is not deflected"out" of the instrument's field of view, and when the beam is
fortuitously bent to spiral within the field those path
elements beyond about 3 m range contribute little to the total
irradiance (refer again to Fig 3).
We calculated (in program SCEXC) the irradiances at the
photometer that result from the primary beam only by multiply-
ing the FACT outputs by [N2] (from Table 2) x (beam current I) x
([energy-dependent] impact excitation cross-section o). To
do this we first generated a new data tape NFS-3 by merging the
averaged-over-pulses I,V, and PHOT with FACT. The cross-sec-
tions for direct excitation of 3805A radiation were taken
from Ref 18 (earlier laboratory data had been contaminated by
the much greater excitation by secondary electrons), and are
5.2 x 10⁻²² cm2 /N2 molecule at keV electron energy, 1.55 x 10²
cm 2 at 4 key, and 0.68 x 10⁻²² cm 2 at 8 keV.
33 p q
00 X0
LLI-
cnw
0- 4- '
w E0 ~0 wJ
C) Q)
.0 $d . - 4-~) Lo*P -0 $ ..o 0 j (
0 r. 4)-) $-~4) W~ C4 4 BI L* E 0 4-) r 0 0) -)
a ).C.) 0 O -- -00 -0 0'm 0 a
a) *- .0 C 12 >) o.l ra) &4 0) W O a
4-) r. r. 0 ) -. e-0 -4 0 >s- r.i a4 0
-'-I - Q ) a )) 4 )
0) -asr-I LLC;4NI q0 4 -
4.) () cd ) 00u 10 > . 4-4W (1) ) -4
-) 34 ) C
The resulting irradiance
FACT x [N2] x G(V) x I
refers of course to direct excitations by the primary electron
beam. It neglects the contribution of excitation by the second-
ary electrons produced in collisions of these beam electrons
with air, radiation due to enhanced local molecule density
from rocket outgassing, and radiation excited by collective
interactions of the beam with the ionospheric plasma.
As noted above the FACTOR concept provides a test for
the large number of backscattered -keV electrons within the
photometer's field of view that was reported in Ref 5 under
what were interpreted as strong collective interaction condi-
tions. Where outgassing and collective effects are negligible,
and the irradiance component resulting from collisions of the
secondaries within the photometer field remains strictly
proportional to that from the primaries, these model irradiances
would be proportional to the absolute photometer signals measured
(equal to them if secondaries can be neglected), within the
error due to the assumptions about the photometer's angular
response. We return to this important issue shortly.
The final program SCEXC, a copy of which is included as
Table 4, reads the READ tape until it reaches a pulse, uses
the time of this pulse and the rocket trajectory parameters
to generate the ejection altitude, and interpolates number
densities of N2 and other species at this altitude from MSIS.
It then calculates a normalized photometer signal
X = PHOT/o • [N 2 ] • FACT • I
and otherwise manipulates the input parameters (including
time after launch, on which all other parameters depend)
to explore the dependence of this normalized output signal.
We have so far reduced the data for the upleg segment
of the SCEX flight. As X appeared to be varying within very
35

Table 4. Listing of the SCEXC merge/X-calculation program
1, 0:= P"ROGRAM "ICEX (TAPE 1It TAPE2 , OU*TPUIT , TAPE':"1. J DIMENS:EON A(3) , 31:0G(3), [1(29) ,DN2(29) , D002(29), 1)0(29),
DHE (29)I~u::2 LIMENSI:ON HEAD(S), RI(4) , YY(:L11), NR(N3, 11)
1. 0u= DIMENSION XX (3,11l), XXV(3,1.1), RN2 (11). 4f 0::: DATA sic /5AEf--22,1.5:'-22-.,6.SF-23/150= DATA RNZA/1.*37E16,1.04E16,7.88E1L5,5.99E:.15,4.55E15,160= l 3.46E15,'2.62E115,1.99E 15,1.51E15,1.15E15,B,73E14/1 '0=:: DATA A /'.59945.*35E-.3, 2,32q5382, -52.B96149/
:1.9 0DATA FZI /1.0, 1.3, 0.49, 0.37/I DR=1 .
"0.- 1. =13940.81)f DO ) 9 99 KKF':=l , '3i :. r DO 999 LL:1,10
0 K .1 NNI..tLL-0
7''I * '999 X XV ( K<F1%, L-L. )= 0b. ~R E WIN D 1
7u REWIND 2-R E' RWI ND 39 R EA D 22) HE AD,uO.z FORMAT ( /,A10)
0I F" FOM AT (:1O(/), (8(A10) )3 FORMAT (2'X, F6.0, 16X, 3(2X, E*1O.0), 14X, F10.0)-4 FORMA'(I 6(2X, IPG-11,4), 2X, 1.3, LX, 1.PG11.i)
0:;~ 9 FORMAT (2AX, F6.1., 16X, 3(2X, 1PG1O.3), 1'IX, 1P010.3)0= DUO) 10 JI :: 1 , 2 904 RE AD1 (2. t3)1- I*(.) , N2(I) , D)02(I), DOM1, DHE(1
/0' 10 CO0NTI NUEF* DO) 190 K=-.t,300
1( R~) (1:I) T1I , T2, tIR C, Vt G.qdG 5:1 FOR~kMAT(1.IX,-"DATA IN",3X,4q(E1O *3,2X))
ZI ~IF (EOCF:(1)) 200, :19'I2.0: 19 V:-V/ 100 0'3 0= R1TE (3 t' 4 IT, 1. ,A R , , V , G
"I)TA : (T]. 1 2DE , 0 5I'V A*
36
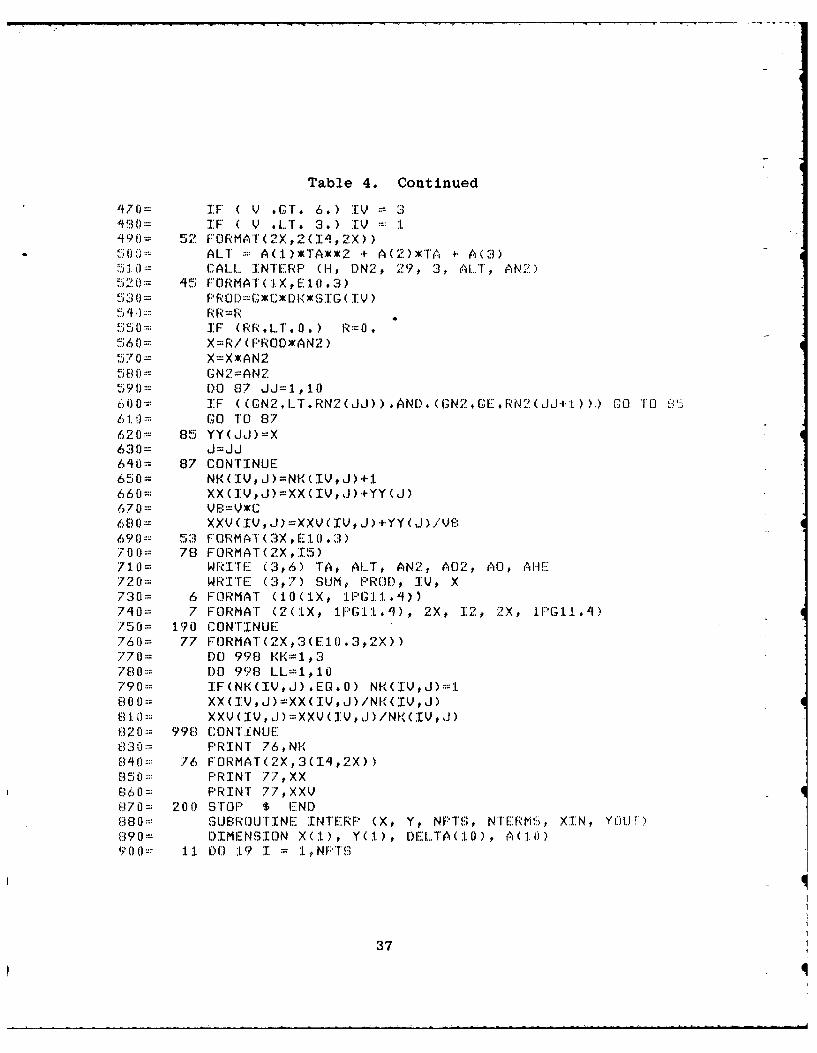
Table 4. Continued
1470= IF' ( V * 01. 6) IV 3:'430= I F: ( V .*LT.1 3. IV ::
,q90= 52 FO0R M A(2 X2 (12 X)0 1 A LT A ( IETAZE 2 + A (2) )KT*A+ A (3)
510.:0 CALL JITERF 0.4, ON?, 29, 3, ALT'I, A N?'-)527% q5 F0R M AT (.iX , Ei)0 .3)0]0 P R0D1)C '.KD 11*S:3IG:C V
.55 0=: IF (RR.LT, J0.) R=O5 60= X=-R/ (P:RODxKAN2)
57= X=XEAN25830:.- CN2::AN2590-=. DO 87 J.J=1 ,10
6 1 00 O 3 7620= 85 YY(JJ))=X630= J=JJ6410= 87 CON'TINUE650= NKC(IV, J)=NKCIVJ)+1660= XX(IVJ)=XXCIV,J)+YY(J)670= VEI=VEC(6 130: XXV(EV, J) 2-XXVC(IV, J) 4fl C J) /V690-- 53 FORMAT C(3X , EC 10 . '3)7 00O= 78 F--ORMA'T( 2X,15)710= WR%'I*TE: (3,6) T*A, ALT, AN2, A02, AO, Af7 2 0= WRI*TE: (39,7) SUJM, POI'V, X7:30n= 6 FORMA'T ClO(iX, 1F0G111'))7410 z: 7 FOR M AT (2C(IX , I1P01'G , L 2 X, I2, 2.X,lPiJ75 0= 190 CON'TINUE760= 77 f70RMA1T(2X,3(EiO.3,2X))-7 70= DO 998 KK:=1,37 80::.- DO 998 LL.:z1.,10790::= IF (NR(IVtJ) .EO#0 ) NRC% IV ,J)::it8 00=: XX (IV, J)=XX( IVJ)/NI<'(IV,J)
G 1.0 - XXVC(IV,,J)z:XXVC(IV,#J) /NR(IV#,J)0820= 998 CO 0NTI.fN U E
8, 3 0 PRINTl '76, NI<B -q0: 76 F-ORMA'TC2X,.3(I4,2X)8)5 0:::: PRINT 77, XXE)6 0=- PRINT 77,XXV870= 200 STO *1 7 * END
88 ~ SUEHUUNE INTERP*: CX, Y , NPTS 3, NTE':RMS , XIN , YOIJV.(1.9 0 DIMENSION XC(: 1), YC 1, DELITAC 1:0, AC 10)9 00: 1:1 D00 19 1 = 1N PTS":
37
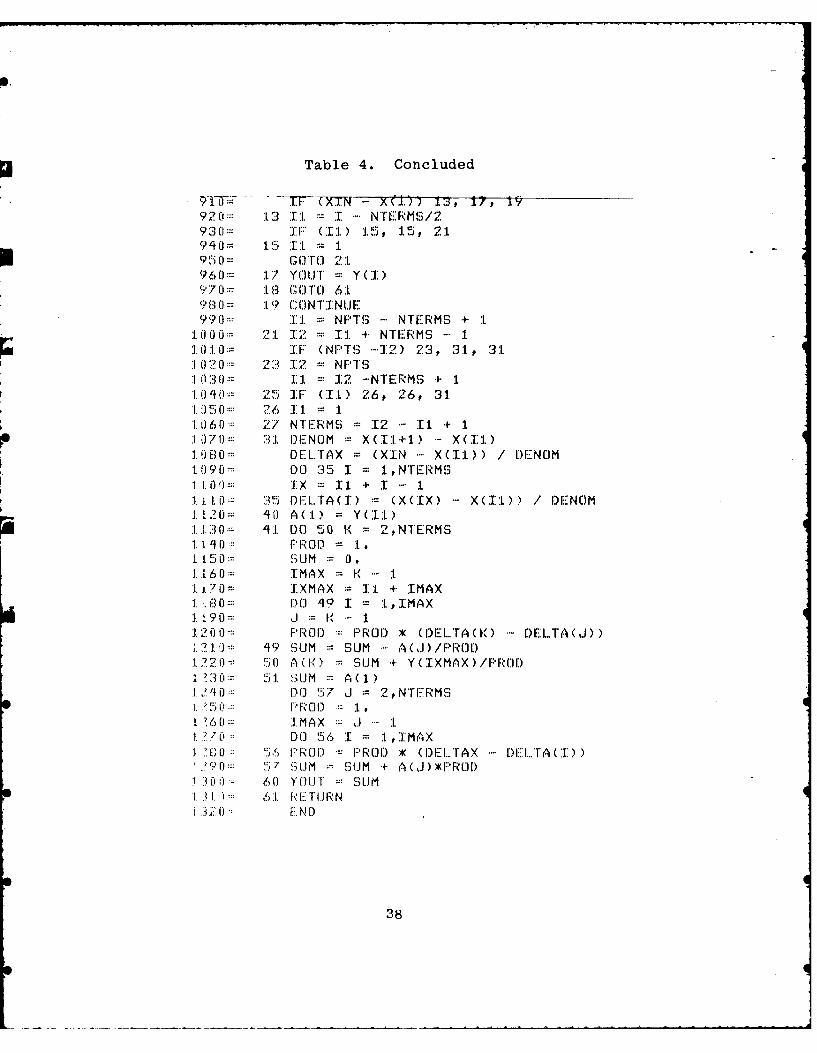
Table 4. Concluded
9 -f- -- rT---TrxN - X(!.)) 1i, iJ, 19920:::: 13 i 1 I " NTERMS/2930= I'F (II) 15, 15, 219'+0= 15 -11 1950= GOTO 21960 17 YOUT = Y(I)970= 13 GOTO 61980:= 19 CONTI N1E99= 1= NPT S - NTERMS + 1
:100= 21 12 = II 4 NTERMS 11010= IF (NPTS -12) 23, 31, 311020:!: 23 ..2 = NPTS:1 f30= Il : 1 22 -NTERMS + 1'1. ( 1 25 1F (1l) 26, 26, 311.150:-: 2T6 II = 11 060: 27 NTE.RMS I- - II + 110:0: 31 IDENOM : X(1+1) - X(II)10 B 0= DELTAX = (XIN X(II)) / DENOM1 090=:: DO 35 1 = 1,*NTERMS
.100:: IX = Ii + I - 111I:. 35 )ELTACI) (X(IX) - X(I1)) / DENOM1 1 0= 40 A(1) I Y )II1.130 411 DC) 50 K = 2,NTERMS:1. :11 - PROD I.1150::: SLUM 0 .I,-)0:= I MA X :=K I-
:1. 14 0 - 1MAX ]:= 4 1.130 = IXMAX = I + IMAXI...a= DO 49 I = ,1MAX1190 J = 0. - 12 ) f3 =ROD PROD * (DELTA(K)- DELTA(J))1'10 19 SUM :: SUM A (J )PROI)
:I Z20 ' 50 A(C.l) 3= SUM + Y(IXMAX)/FROD1 :30:= 51 SUM A A(I):I. 40 D)0 57 Ji 2, NTITRMS
1 6d [.MAX J i IL.. . .. .; : D0 56 I = I,*MAX1 :0 56 PROD : PROD r (DELTAX DEI..TA (I))'90:: 7 )SUM : SUM * A(+ ) EPROD
:1 3 :G0- 60 YOU SUMI .1 : 6:1 F, ETU R N
3 .0 A.. ND
38

narrow ranges of I,V, and [N2 ] we averaged X at fixed I and V,
applying ten logarithmically-decreasing atmospheric density
intervals over the 168 to 241 km (apogee) altitude range (in
SCEXC). The data partially evaluated to date do not include
those lower injection altitudes where 1) the upward-directed
electron beam is almost totally contained by the atmosphere,
with only a small fraction of the primaries and energetic secon-
daries escaping to the conjugate hemisphere (below -130 km),
and 2) no nonlinear beam-plasma interactions are expected in
SCEX's current-voltage range (below -120, km, Ref 1).
PRIMARY AND SECONDARY EXCITATION, COLLECTIVE INTERACTIONS
As noted, if secondaries, plasma interactions resulting
in avalanche or heating of the ambient plasma, and outgassing
can be neglected X would be both quantitatively predictable
and constant throughout the experiment. If the irradiance
from the secondaries is strictly proportional to (and at least
comparable to) that from the primary electrons, X would be
constant but larger than predicted by FACT • o[N 2]I. As
Figure 2 shows, the cross-sections os for excitation of the
0,2 N2 Second Positive band by secondary electrons with energy
>11 eV (the C state's threshold) are a few x 10-18 cm2 which
is a factor 104 higher than those we quoted above for the
-hundredtimes more energetic primary beam electrons. More-
over, the cross-sections of N2 , 0, and 02 for emission of
secondary electrons with energy >11 eV under impact of the
2-8 keV primaries are _105 those for direct excitation of
0,2 band radiation (Ref's 15,18). Thus these secondary elec-
trons could be expected to contribute to the 3805A signal,as
we discuss further here.
The volume rate of direct, single-step excitation of
the 0,2 band is
39
where is the beam current density or flux (I per unit
beam area). This direct excitation of course takes place
only in those air volumes traversed by the beam, which is
a small fraction of the total photometer field of view. (It
is somewhat larger than Fig 3 shows, as the injected beam
has a small, albeit not quantitatively measured, angular
divergence).
In the two-step process secondaries are first produced
(in this restricted volume) at a rate
d [ il i
where [Mil is the concentration of the ith atmosphere species
(including NO) and ai the species cross-section for impact
ionizations leading to secondary electrons with energy >11 eV.
These secondaries are ejected largely at angles about 600 from
the primary beam direction (Ref 19), with most having energies
below 50 eV (Ref 19). (Refer also to the plots in Appendix II.)
They spiral within a gyroradius of their initial magnetic field
line, which is <-1/2 m. between momentum transfer collisions
with neutral and charged species that scatter them onto new
field lines about one gyroradius away. Because of their their -
initial transverse velocity these secondaries excite N2 Second
Positive band (and other triplet state) radiation outside the
magnetically-confined beam volume (as was seen, for example,
in the EXCEDE: Spectral color photographs, Ref 20). It should --
he pointed out that secondaries (and tertiaries,..., which we
have neglected here) originating at reasonably large fractions
of the primaries' end-point range may contribute to the exci-
tation of air near the accelerator, as is shown by detailed
calculations of electron transport and energy dissipation (for
example Ref 21). We point out also that the number of ions
produced in the initial impact of these secondaries on N2 , 0,
40

and 02 increases extremely rapidly above 13 eV, and for im-
pacting electrons with kinetic energy 16 eV exceeds the rate
of excitation of 3805A radiation by an order of magnitude.
The omnidirectional flux of secondaries through individual
volumes, unlike that of the primary (directed) beam electrons,
can not be readily calculated because it depends on contribu-
tions from neighboring volumes. We can approximate the average
flux of these secondaries by defining a characteristic length
L of the volume in which most of the irradiance originates.
(Were it filled by the primary beam, L would be closely
(this volume)/surface area through which the electrons escape).)
L would appear to be of the order of 1 meter (refer to Fig 3)
if only secondaries produced within a few times the separation
between the photometer and accelerator anode contribute to the
irradiance signal. In describing the secondary excitation-
ionization it becomes necessary to refer to this total "effective"
photometer field rather than the volume within the primary
beam' s trajectory, as the secondaries occupy a large number of
-1 i-diameter tubes tubes extending along the geomagnetic
field with their axes on points along the initial beam.
This omnidirectional flux is then
L - 'I E[Mjji 1,i
and the mean-value 3805 A excitation rate by the secondaries
is
Here as is the excitation cross-section averaged over the
secondaries' energy distribution, which from Figure 2 and the
distribution measured in Ref 19 (shown in Appendix II) is about
3 x 10-18 CM2/112 molecule. Rearranging terms and for convenience
expressing the sum as an average [Mloi' (justified in view
of the fact that the ionization cross-sections of the principal
ambient species differ only by about a factor two, and a mean
41

ai can be readily calculated for each altitude from the
concentrations on Table 3), we find that the secondary exci-
tation rate is
d[M]oi' - os[N2]t
The two terms of this expression will be recognized as the
rate of production of secondary electrons and their probability
(<1) of colliding with an N 2 molecule to excite 0,2 band
emission.
Unlike calculation of the excitation by the primary beam
(when it is assumed not to be substantially broadened by Coulomb
scattering), calculation of the secondary ionization rates
involves solving radiation transport equations with a summation
over the secondary electrons' energy and angular distributions.
The ratio of the two excitation rates is(as/a) • a'i[M]L - 10 4 a Ii[MIt.
For example at 180 km altitude where [M] = 1-1/2 x 101 0 /cm 3 ,
and 4 keV injection at which the species-averaged ionization
cross-section ai ' - 2 x 10-17 cm 2, this secondary/primary
ratio is about 3 x 10 - 3 • L in cm. Thus if secondary elec-
trons are to contribute significantly to the optical signals
the characteristic length parameter that we have defined must
be a few meters (more above 180 km because [M] is decreasing).
It is instructive to calculate the absolute magnitude of
PHOT due to the primary electrons only (as it is defined). We
select as typical experiment conditions I = 10 ma, V = 4 keV
(a = 2 x 10-22 cm 2/N 2 molecule), altitude = 180 km ([N 2] =
6 x 10⁹ /cm 3 ). We adopt also an average figure for FACT,
(200 cm beam path)/4w(300 cm range to photometer)2 - 3 x 10⁻⁴ /cm
(refer again to Fig 3 to verify these dimensions). Applying
the radiance/irradiance ratio of 0.10 that we referred to
earlier, these inputs result in a radiance of 1/500 rayleigh
42
averaged over the photometer field. This figure is much smaller
than the tens of rayleighs that was actually measured under
* these conditions. Thus (at least for these sample conditions)
the photometer signal cannot be due principally to direct
* excitation by the primary beam electrons. Rather than continue
with such episodic calculations, we have prepared the data for
systematic computer analysis to determine the dependence of
PHOT on the input variables 1, V,[M] and [N2], the others
mentioned above, and still others that may be identified in
the course of the data analysis.
PHOTOMETER LEAFAGE
W. In view of this finding that the direct excitation of
3805A radiation by the primary beam is extremely small,
we investigated the possibility that contamination by a
permitted transition from a Coulomb collision-excited state
of some atmospheric species is responsible for the high irrad-
iance. Several emission features partially overlapping the
photometer's 31A FWHM bandpass were identified, but all
had either low excitation cross-sections at 2-8 keV incident
electron energy, long radiative lifetime (so that few photons
would be emitted during the -millisecs traverse of the
rocketborne photometer's field), and/or low transmission by
the filter.
Among the molecular bands that we found and rejected as
contributing less than an estimated 10% of the directly-excited
N2 C-+B 0,2 band signal (in most cases, substantially less) were,
in crude order of perceived importance,
N2 + First Negative 2,2 with head at 3858Aand shaded to the UV -- : intensity 2 x 10⁻⁴
that of the 0,0 3914A band, and mean
filter transmission 1%; thus its contribution
43
if; I0- 2 tlitt From the 3805 A band.
The still weaker 3,3 and 4,4 N2+ bands with
heads at 3835 and 3818A, for which the
filter's transmission is -10% and 2%,
result in comparable low-level contaminant
signal.
02 + Second Negative 0,7 band at 3830A
weak excitation, low atmospheric 02 /N2
ratio (see Table 2), 5% filter transmission.
02 afterglow 2,7 band at 3829A -- : weak
excitation, forbidden transition with
long radiative lifetime.
N2 Vegard-Kaplan 3,13 band at 3854A
intercombination transition with low
excitation cross-section, long lifetime,
low filter transmission.
(No 01, O11, NI, or NIl lines were identified). We conclude
that barring some pinhole or severe off-axis, off-passband
leakage of the photometer (which were not found in its calibra-
tion and testing) negligible photocurrent from air fluorescence
other than the N2 Second Positive 0,2 band would result directly
from impacts of the primary beam electrons.
Reference is again made to previous observations with a
similarly programmed electron accelerator of the same design
(Ref 5), which were interpreted as showing collective inter-
actions for all 100 ma injections and for 10 ma at 1.9 and
4 kV (not at 8 kV, and not for 1 ma at any voltage). The large
return fluxes of electrons with energy between 100 eV (the
detector's limit in that experiment) and the beam-ejection
energy that were measured may be the source of the excess 3805A
radiation that is observed in SCEX. Since the volume in which
these energetic electrons was confined was found to depend on
44
the angle between the injected beam's axis and the geomagnetic
field, the column intensity of radiation would also be expected
to depend on pitch angle [under discharge conditions].
DATA INTERPRETATION, CURRENT PROGRAM STATUS
The reduced data file and procedures in SCEXC permit
direct systematic determination of the dependence of the
normalized 3805A-band irradiance factor X on individual
experiment factors over selected ranges (for example, altitude
above 130 km), as well as its joint dependence on two or more
parameters (for example, V and I as in Ref 5; a threshold for
beam-plasma discharge varying with V312/1 was found in Ref l's
JSC Chamber A measurements). As noted above the absolute magni-
tudes of X as well as its relative values provide information
about the nature of interactions of the injected beam with the
atmosphere. Some of the critical ideas in interpretation of
the single-parameter dependences are as follows.
If X varies with
-- I: Nonlinear beam interaction. Note,
however, that when I is several times
the threshold current for exciting a
beam-plasma discharge PHOT again becomes
about proportional to I, and thus under
this condition X would appear to be
constant.
We note also that the solid angle into
which the electron beam is injected --
or more strictly speaking, its angular
distribution of brightness per unit 4
curient -- may depend on the total
current I from the accelerator. (This
experiment issue was apparently not
45
considered in detail in the preflight
testing). A variable beam-spread would
introduce some error into FACT and so
make X appear to change slowly with I
(The onset of discharges depends on the
beam current density rather than the
total current I only.)
-- V: Nonlinear beam interaction, if a large
relative change in X takes place over
one of the two intervals in which V
decreases by a factor 2.
The beamwidth might also be a function
of the accelerator's anode potential V,
which again would impact FACT. More
importantly, the rate of excitation of
secondary electrons changes with V
because the number of secondaries ejected
from the atmosphere's atoms relative to
the number of direct impact excitations of
3805A photons is a function of the
primary electrons' energy. This ratio
of secondaries to 3805A photons increases
by a factor 2.7 between 2 and 8 keV, while
the average cross-section for C-state
excitation by these secondaries decreases
somewhat over this energy range because of
the secondaries' increased mean energy. The
result is an about doubled ratio of C-state
excitations by secondaries relative to
primaries over these injection voltages.
Thus if the photometer signal is due prin-
cipally to secondaries, X would increase
46
about as Vl/2 between 2 and 8 keV. Further,
the initial angular distributions of secondary
electrons could be varying with primary
energy in a way that impacts measurably the
total 3805A irradiance. These two impact-
ionization effects would be evidenced by
continuous rather than abrupt change in X
with V, and further would indicate that the
signal is due principally to linear (with
current and voltage) secondary processes.
--[N12]: X inversely proportional to ambient [N2]
means that either the number density of N2
molecules within the effective measurement
volume is being maintained constant by out-
gassing, or some discharge process that
produces essentially-constant irradiance is
taking place.
-- [M]: X inversely proportional to [M] is further
evidence that single-step impact excitation
does not explain the 3805A irradiances.
Such a finding becomes consistent with the
signal being due principally to secondary
electron excitations if the magnitude of L
needed to explain the magnitude of X/[M] is
physically reasonable (refer to our earlier
discussion); otherwise either outgassing
that leads to enhanced C-state excitation by
greater-than-expected fluxes of secondaries,
or collective processes, is the controlling
process. Noise in the data in part obscures
the difference between X • [N] and X • [M],
as [M]/[N 2 ] increases by less than a factor
47
2 over the al titucle range of the upleg
data. (Z[Mi]oi/[N2] x (crossection
for impact ionization of N2 ) changes even
less because the crosssection of 0 is less
than that of N2 .)
-- Time after launch: A monotonic decrease of
X with time after apogee suggests that
outgassing results in the enhanced
production of secondary electrons by the
beam that leads to domination of the
total excitation by these secondaries'
impacts on ambient N2 molecules. Before
apogee, the effect could be masked by
the increase in X with decreasing [N2],
which is discussed below. If the time
constant for outgassing from the vehicle
is large compared to the experiment time,
the released gas might still be playing a
role in initiating nonlinear interactions
and enhancing the optical signal through
secondary impact excitations despite the
lack of any measurable time dependence.
(Current-voltage thresholds for initia-
tion of beam-plasma discharges are known
to decrease with increasing neutral density
at densities somewhat greater than those at
-130 km altitude (Ref 1).)
X can of course be determined for narrow ranges of the
individual input parameters, with the disadvantage of increased
data noise because of the smaller number of samples (an example
is in Figure 6). Arguments similar to those above can also be
developed for the the beam's pitch angle to the geomagnetic
48
-j
field and to the vertical (as noted beam energy absorption
differs between injection into the nadir and zenith hemispheres).
We have investigated the dependence of X averaged over
upleg altitude intervals on [NI2], [M], V, and I, with the
results for the first three variables shown in Figures 4,5,
and 6. The so far unaddressed downieg data extend to greatly
increased values of [N2] and [M], where nonlinear beam
interactions are known not to take place, and thus will
provide an improved perspective on these preliminary results
from the upleg data.
As Fig's 4 and 5 show, X clearly decreases with decreas-
ing air density or increasing altitude. The product X . IN2]
or X . [M] appears to be essentially constant -- although
noisy -- when [N2] < 5 x 10⁹ /cm3 (180 km altitude), with
X . [M] showing less variability. This result is similar
to that reported in Ref 3 (the Polar V experiment), where the+N2 First Negative 3914A photometer signal remained essen-
tially constant, although also very noisy, above 140 km rocket
altitude. It has also been observed (for 3914A radiation)
in laboratory tank tank experiments in which beam-plasma inter-
action has been unequivocally identified (Ref 22).
As Fig 6 shows, X averaged over 10 km altitude intervals
increases with V, and is proportional to V2 -- or V3/2 within
experimental error -- at each range of [N2]. This is a
stronger dependence than the V1/2 that we showed would be ex-
pected from the change in relative number density (and possibly
angular distribution) of secondary electrons. Although this
observed behavior is suggestive of the familiar Child's-law
limiting of current flow by space charge, its physical signi-
ficance in the electron-injection experiment is not immediately
clear. We note also that the 8 kV, 10 ma data points lie
above and fair smoothly into the 4 kV, 10 ma points; this
49

10 10 1/cm3
8
6
0 0
4
0 0
0
2
0
[N 21
0 0
109 /cm 3 0
8_ • X [N 2 1 0
Relative X or X[N 2]
Figure 4. Dependence of X and X • [N2 ] on [N2 ]at upleg altitudes.
50

2
0 04
1 - 1010 cm -
8 0 0 +
6 0 0
0 0 4 X[M]/2.5
4 [M] 0X +
+ * XI[N 2] 0
Relative X or X[N 2] or X[M]/2.5
Figure 5. Dependence of X and X[M] on [M]at upleg altitudes.
51

0 X 2SX/V 3 2 225 kmI e X/V3/
[] X + 5 km
m X/V 32 205 kmX/V J /
;x2X/2 185 km
rw X/V 3 1 2
o 8
C
4,--)
a)
000
S me0
01M I I I2 4 6 8
V( keV)
Figure 6. Dependence of X on V at upleg altitudes.
52
appears to be in disagreement with Ref 5's finding of quali-
tatively different interaction modes at the two injection
voltages.
Since a(V) iti our expression for X varies asV-/
PHOT at fixed altitude turns out to be virtually independent
of V. (The ionization cross-section oi', on the other hand,
varies with V-~3/4.) The threshold for initiation of beam-
plasma discharge increases with increasing V; this leads to
the preliminary conclusion that over the experiment's range of
injection voltages there is no evidence of turnon or turnoff
of such discharges at the three altitudes so far considered.
(We have not investigated the effect of noise in PHOT when
I = 1 ma, where the results of Ref 5 indicate that discharge
may not be occurring.) Laboratory experiments to date have
not explicitly addressed the issue of how the volume excitation
rates depend on particle energy while a beam-plasma discharge
avalanche is sustained. Theory (Ref 23) predicts a weak
dependence on V, as we observe; the change can be in either
direction, depending on experiment conditions. Theory also
predicts an increasingly noisy photometer signal near threshold
where the discharge is not fully stable (Ref 23); this phen-
omenon can be readily investigated by analysis of PHOT's
variability within individual 50-msec data pulses and between
averages over pulses.
The dependence of X on I is not yet determined, as the
photometer data have not been treated to minimize the effects
of noise introduced by subtraction of auroral background
(particularly troublesome at 1 ma) or the loss in statistical
precision due to the spread of points where the accelerator
was operated at its maximum achievable current. At the present
stage of data analysis X appears to decrease between 1 and
10 ma and then increase to the 40-90 ma data set. Under beam-
53

plasma discharge conditions PHOT would increase with I (as -
shown by Ref 1 and other laboratory experiments), and become
about proportional to I when I is several times threshold;
thus if X is found to be constant over the range of maximum
injected currents its magnitude becomes the measure of whether
a discharge is taking place.
CONCLUSIONS, RECOMMENDATIONS
This preliminary analysis of the SCEX 3805A photo-
meter data indicates that the ejected electron beam is inter-
acting nonlinearly with the atmosphere (at least at currents
>1 ma); it has not, however, been carried to the point of
providing quantitative information about the dependence of
this interaction on the several experiment variables. The
major finding is that the irradiance is virtually independent
of both ambient density above about 180 km (as has been
observed in other experiments) and energy of the injected
electrons (not hitherto observed, albeit consistent with beam-
plasma interaction models). The important issue of dependence
of normalized irradiance on electron beam current has not yet
been adequately addressed. The calculational machinery (SCEXC,
Table 4) is fully in place, and precise interpretation of the
experiment will become possible when the improved statistics
and -- particularly -- wider dynamic range of [M] and [N2] in
the trajectory's downleg data segment are included in the
analysis.
The work to date leads to ideas for improving the effec-
tiveness of optical and in situ diagnostics in future particle
beam injection experiments (including of course BERT-l).
Primarily, it underscores the importance of imaging instru-
ments -- cameras -for measuring the spatial distribution of
the primary and secondary (and discharge-induced) radiations.
54
Further recommendations are
1) The injected current should be varied
in arithmetically rather than geo-
metrically increasing steps, better to
identify nonlinear changes in radiant
intensity. Additionally, the dependence
of optical emissions on current would be
more precisely quantified by use of more
than the present three values.
2) Beam voltage should also be varied in
at least four arithmetic increments to
establish its effect on the plasma
conditions.
3) The photometer's throughput should be
increased to improve signal/noise at low
injected currents (<10 ma), and the
beam-on time lengthened.
4) If continuous rocket spin is not needed
to measure the pitch angle distribution of
the secondary electrons, the electron beam
should be injected at a) a limited number
of discrete angles to the geomagnetic field
(parallel, perpendicular,...) and b) at 0
and 1800 zenith angle only (that is, along
the atmosphere's density gradient). Addi-
tionally, the detailed analysis of the
SCEX data may suggest more frequent sampling
and even higher photometer throughput better
to characterize noise in the irradiance
(i.e., instability in the plasma conditions),
and higher rocket apogee to increase the
dynamic range of [M]/[N42].
55
5) Concentrations in the viewed beam volume
of the principal outgassed species, water
vapor, should be measured optically as
described in Appendix I (or alterna-
tively by the return flux to the rocket
measured by mass spectroscopy).
56
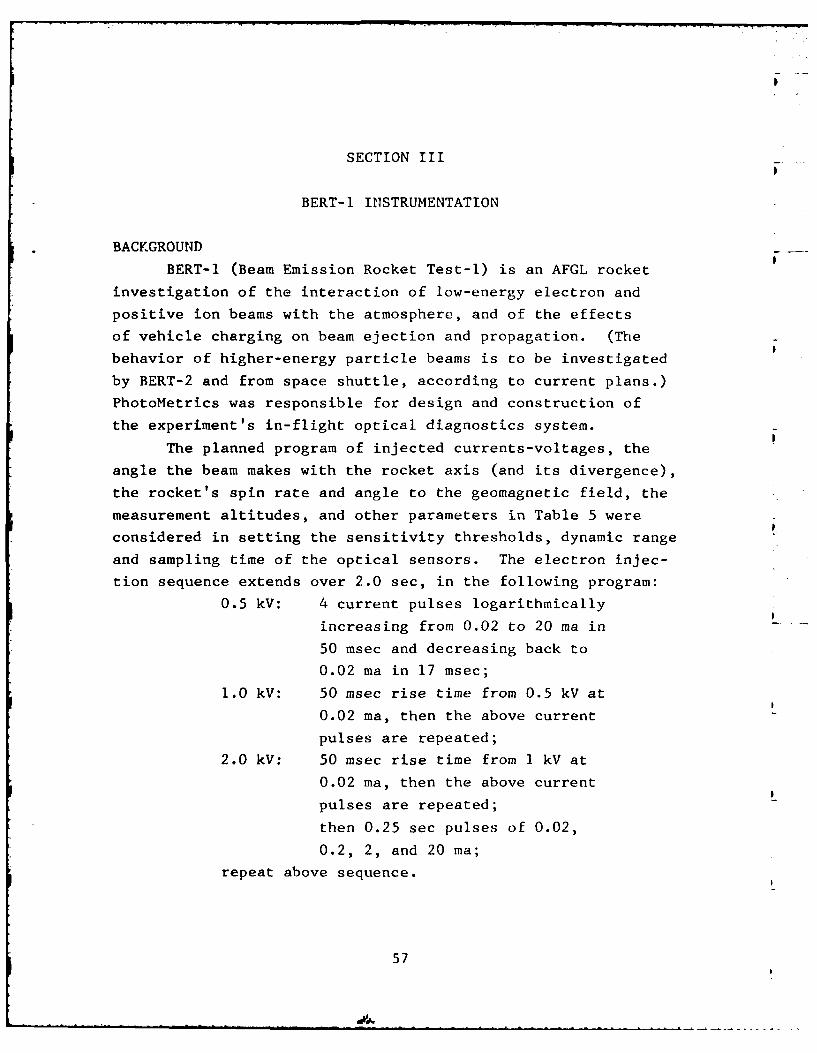
SECTION IIII
BERT-I INSTRUMENTATION
BACKGROUND
BERT-I (Beam Emission Rocket Test-i) is an AFGL rocket
investigation of the interaction of low-energy electron and
positive ion beams with the atmosphere, and of the effects
of vehicle charging on beam ejection and propagation. (The
behavior of higher-energy particle beams is to be investigated
by BERT-2 and from space shuttle, according to current plans.)
PhotoMetrics was responsible for design and construction of
the experiment's in-flight optical diagnostics system.
The planned program of injected currents-voltages, the
angle the beam makes with the rocket axis (and its divergence),
the rocket's spin rate and angle to the geomagnetic field, the
measurement altitudes, and other parameters in Table 5 were
considered in setting the sensitivity thresholds, dynamic range
and sampling time of the optical sensors. The electron injec-
tion sequence extends over 2.0 sec, in the following program:
0.5 kV: 4 current pulses logarithmically
increasing from 0.02 to 20 ma in
50 msec and decreasing back to
0.02 ma in 17 msec;
1.0 kV: 50 msec rise time from 0.5 kV at
0.02 ma, then the above current
pulses are repeated;
2.0 kV: 50 msec rise time from 1 kV at
0.02 ma, then the above current
pulses are repeated;
then 0.25 sec pulses of 0.02,
0.2, 2, and 20 ma;
repeat above sequence.
57
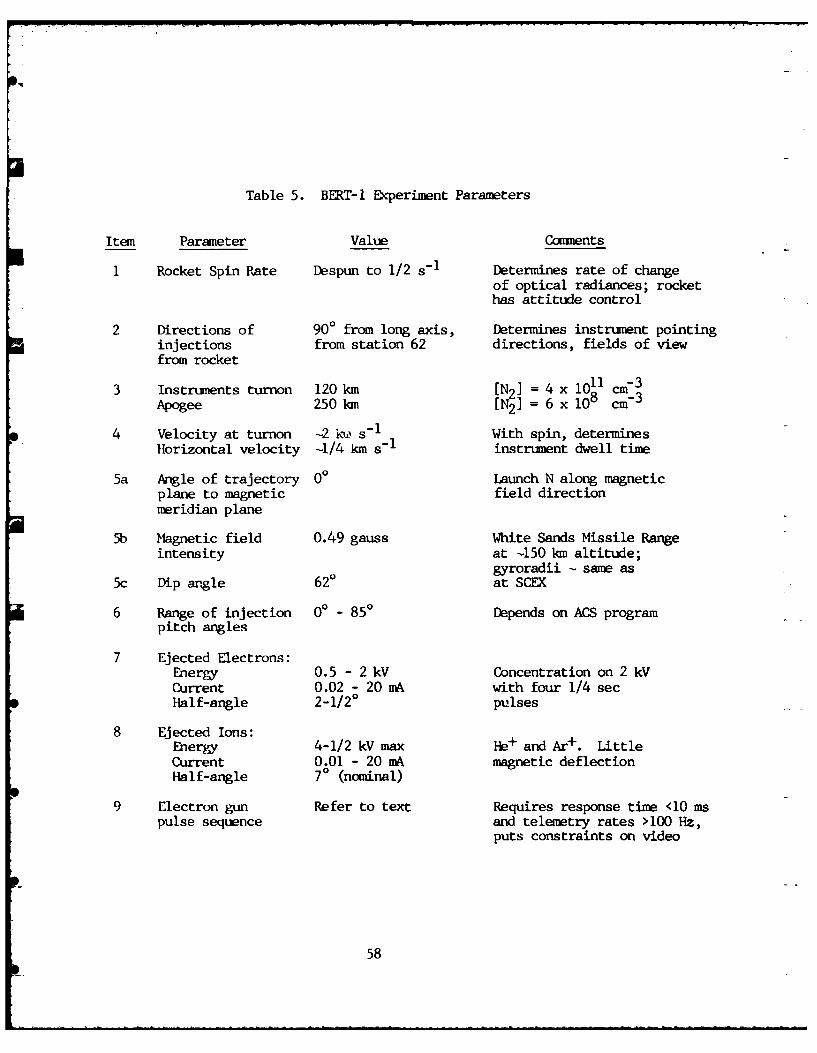
Table 5. BERT-1 Experiment Parameters
Item Parameter Value Comments
1 Rocket Spin Rate Despun to 1/2 s-1 Determines rate of changeof optical radiances; rockethas attitude control
2 Directions of 900 from long axis, Determines instrument pointinginjections from station 62 directions, fields of viewfrom rocket
3 Instruments turnon 120 km [N2 ] = 4 x l0l cm- 3
Apogee 250 km [N2 = 6 x 108 cm 3
4 Velocity at turnon -2 ', s-1 With spin, determinesHorizontal velocity -1/4 km s-1 instrument dwell time
5a Angle of trajectory 0' Launch N along magneticplane to magnetic field directionmeridian plane
5b Magnetic field 0.49 gauss White Sands Missile Rangeintensity at -150 km altitude;
gyroradii - same as5c Dip angle 620 at SCEX
6 Range of injection 0* - 850 Depends on ACS programpitch angles
7 Ejected Electrons:Energy 0.5 - 2 kV Concentration on 2 kVCurrent 0.02 - 20 mA with four 1/4 secHalf-angle 2-1/20 pulses
8 Ejected Ions:Energy 4-1/2 kV max He+ and Ar+. LittleCurrent 0.01 - 20 mA magnetic deflectionHalf-angle 70 (nominal)
9 Electron gun Refer to text Requires response time <10 mspulse sequence and telemetry rates >100 Hz,
puts constraints on video
58
Currents (up to 20 ma is planned) and timing of the 0.1-5 keV
positive ion injections have not yet been established. The
particle beams will be ejected normal to the rocket's long
axis from near its forward end; the optical sensors are
located toward its tail end to achieve the desired projections
to the excited air volumes. As with the SCEX rocket, apogee is
250 km, but with the data period starting at a substantially
lower altitude. The factor-500 range in ambient air density,
-1000 in injected current, and --4 in primary electron
impact cross-section (between 1/2 and 2 keV) results in a
dynamic range of primary excitation rates of about 2 x 10⁶
over the experiment.
PROGRAM TIMETABLE
Planning for BERT-I's optical sensors began in February
1981 (before the results from SCEX became available). We
prepared and submitted on 15 July a 48-page Design Evaluation
Report "Design of an Optical Measurement System for Diagnosis
of Beam and Plasma Conditions Near a Charge-Ejection Rocket,"
AFGL-TR-81-0000, which was approved by AFGL on 23 July 1981.
The actual instrument buildup began in June 1982, when funding
for purchase of the low light level video camera's components
and construction of the photometers was received.
The video camera body, delivery of which had been promised
by its vendor (Edo Western, Salt Lake City, UT) for 16 Feb 83,
was not received until 29 April. PhotoMetrics completed
construction and calibration, and delivered the completed
camera system, two wide-field ("total light") photometers,
and a plasma sheath photometer on 05 Aug 1983.
Numerous conferences with AFGL staff and other BERT-l
program contractors were held in the period May 1982-July 1983
on the mechanical and electrical interfacing of these instru-
5
59

ments, and on their ruggedization for the rocket environment.
In June 1983 AFGL specified a major change in the mounting of
the video camera, which as delivered by PhotoMetrics is designed
to view a relatively narrow angular field from inside the
rocket body envelope rather than the initially-planned "all-
sky" field from a platform erected to extend 30 cm outboard
from the skin. (The latter arrangement would have permitted
viewing the beam at the accelerator anode as well as the back-
scattered-electron component; the spatial distribution of air
fluorescence in these close-in regions is an indicator of
discharge processes.)
DESIGN EVALUATION REPORT
The rationale and performance specifications for the
optical instruments system is presented in detail in the
Design Evaluation Report. For reference we have reproduced
in Table 6 its Table of Contents, List of Illustrations, and
List of Tables.
The report in particular considers the impact of the
experiment parameters in Table 5 on design of the optical
instruments. It reviews corona (Ref 24) and beam-plasma dis-
charges (Ref's 25, 26) excited by electron beams, optical
emission by/from ion beams, and performance specifications
for the instruments selected to diagnose these phenomena. The
Design Evaluation Report serves as background for the engineer-
ing documention in this Section.
OVERVIEW
The optical sensor system consists of a low light level
(Intensified Silicon Intensifier Target, ISIT) video camera;
two wide-field photometers for viewing the beam and back-
scattered-secondaries volumes; and a narrow-field photometer
for investigating the plasma sheaths ("corona") surrounding
60

Table 6. Table of Contents and Lists of Illustrationsand Tables in PhotoMetrics' Design EvaluationReport "Design of an Optical MeasurementSystem for Diagnosis of Beam and PlasmaConditions Near a Charge-Ejection Rocket"(15 Jul 81).
TABLE OF CONTENTS
SECT ION PAGE
1. INTRODUCTION ------------------------------------------------ 4
1.1 Statement of the Problem ------------------------------------ 41.2 Beam and Vehicle Interaction, Return Current,1.3 Discharges ----------------------------------------------- 51.14 Space Charge Effects in Ion Beams ---------------------------91.5 Optical Experiment Objectives: Review --------------------- 111.6 Optical Emissions ------------------------------------------12
1.7 "Stand-off"' Instrument Platforms ----------------------------14
2. EXPERIMENT CONDITIONS-----------------------------------------17
2.1 Flight Parameters -------------------------------------------172.2 Expected Observables ----------------------------------------18
2.2.1 Larmor Radius for Injected Particles ------------------182.2.2 Anticipated Radiance of Fluorescence
Induced by Electrons-------------------------------- 19
2.3 Impact of other Experimental Parameters onOptical Observables ------------------------------------20
3. INSTRUMENT PACKAGE: OVERALL DESIGN ----------------------------23
3.1 Review of Instrument Requirements and Constraints ---------- 23
a. Temporal Response ----------------------------------------23b. Sensitivity ----------------------------------------------23c. Spatial Resolution and Coverage --------------------------23d. Wavelength Isolation -------------------------------------25e. Summary of Objectives ------------------------------------2
3.2 Design of Components ----------------------------------------26
3.2.1 Video Camera ------------------------------------------263.2.2 Total Light Photometer -------------------------------- 273.2.3 Plasma Sheath Photometer ------------------------------283.2.4 Beam Temperature Photometer ---------------------------29
3.3 Summary--------------------------------------------------------- 2
61

U Table 6. Continued
4. ELECTRICAL AND MECHANICAL SPECIFICATIONS ---------------------- 31
4.1 Video Camera ------------------------------------------------3i
4.1.1 Camera Type -------------------------------------------314.1.2 Deployment -------------------------------------------- 314.1.3 Telemetry ---------------------------------------------314.1.4 Specifications: Video Camera --------------------------32
Id4.2 Total Light Photometer-----------------------------------33
4.2.1 Optics------------------------------------------ 3
4.2.2 Electronics----------------------------------------334.2.3 Specifications: Total Light Photomete------------34
4.3 Plasma Sheath Photometer -------------------------------- 34
4.3.1 Optics------------------------------------------- 3
4.3.2 Electronics --------------------------------------- 354.3.3 Specifications: Plasma Sheath Photometer ----------- 35
4.4 Beam Temperature Photometer ------------------------------36
4.4.1 Optics -------------------------------------------- 364.4.2 Electronics ----------------------------------------374.4.3 Specifications: Beam Temperature Photometer-------37
REFERENCES ------------------------------------------------------------45
IAPPENDIX 1 ------------------------------------------------------------46
62
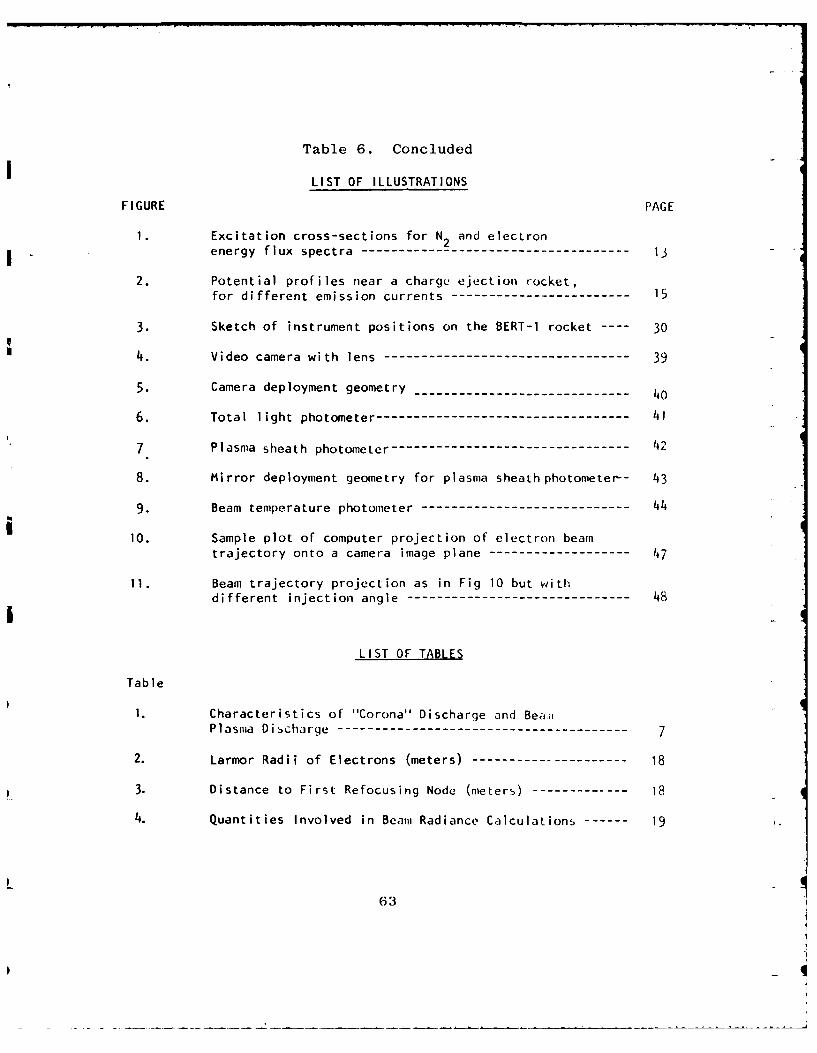
Table 6. Concluded
LIST OF ILLUSTRATIONS
FIGURE PAGE
1. Excitation cross-sections for N2 and electron
energy flux spectra --------------------------------------- 13
2. Potential profiles near a charge ejection rocket,for different emission currents----------------------------15
3. Sketch of instrument positions on the BERT-i rocket --- 30
U4. Video camera with lens ------------------------------------ 39
5. Camera deployment geometry--------------------------------40
6. Total light photomete-------------------------------------0
7 Plasma sheath photometer-----------------------------------142
8. Mirror deployment geometry for pl asma sheath photometer-- 43
9. Beam temperature photometer--------------------------------44
10. Sample plot of computer projection of electron beamtrajectory onto a camera image plane-------------------- 17
11. Beam trajectory projection as in Fig 10 but withdifferent inject ion angle---------------------------------48
LIST OF TABLES
Table
1. Characteristics of "Corona" Discharge and BeaniPlasma Discharge ------------------------------------------ 7
2. Larmor Radii of Electrons (meters)------------------------18
3. Distance to First Refocusing Node (meters)-------------- 18
4. Quantities Involved in Beami Radiance Calculations---------19
63

the vehicle. The beam temperature photometer described in
Section 4.4 of the Design Evaluation Report, which applies the
spectroscopic features ratios principle that we used in SCEX
(refer to Section II), was eliminated from the final instru-
fl ment package due to lack of funds.
The Design Evaluation Report originally specified the
video camera to have an extremely wide field from an outboard
viewing platform, so as to achieve a better projection of the
beam and glows enveloping the rocket body than had been avail-
able in previous experiments. As a result of the above-mentioned
mandated engineering change the camera as realized is fixed
Within the rocket, and views a relatively limited longitudinal
segment of the ejected beams from station 160 (inches from the
nose, 2-1/2 m from the accelerator). Its S-20 photocathode is
sensitive principally to the N2 First and Second Positive
and N2 First Negative fluorescence bands excited by the
j electron and (with substantially less efficiency) ion beams.
A principal function of the camera is identifying onset of
nonlinear electron beam interactions, whose spatial distribution
signatures include a "halo" of radiation excited by laterally-
j scattered secondaries surrounding and within the spiral made
by the primary beam along with increased backward scattering
(Ref's 1-5, 25, 26). A further function is monitoring the
angular spread and current of BERT-l's ion beams.
P The wide-angle photometers provide substantially lower
threshold sensitivity and higher frequency response than the
video cameras (at the expense, of course, of imaging capability).
Since this sensitivity is limited by the background of airglow,
stellar, and zodiacal light rather than photon noise in the
signal, the photometers use Si diode photodetectors rather
than electron multiplier tubes. These are filtered to respond
p 64
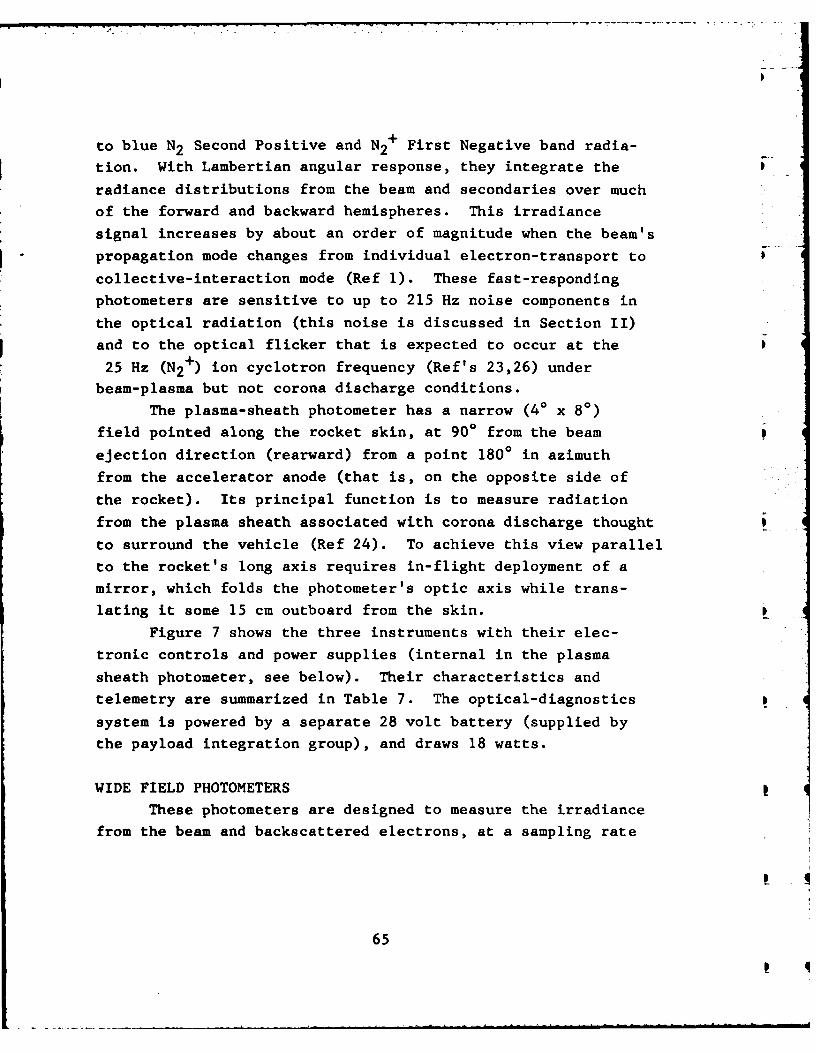
to blue N2 Second Positive and N2+ First Negative band radia-
tion. With Lambertian angular response, they integrate the
radiance distributions from the beam and secondaries over much
of the forward and backward hemispheres. This irradiance
signal increases by about an order of magnitude when the beam's
propagation mode changes from individual electron-transport to
collective-interaction mode (Ref 1). These fast-responding
photometers are sensitive to up to 215 Hz noise components in
the optical radiation (this noise is discussed in Section II)
and to the optical flicker that is expected to occur at the
25 Hz (N2+) ion cyclotron frequency (Ref's 23,26) under
beam-plasma but not corona discharge conditions.
The plasma-sheath photometer has a narrow (40 x 80)
field pointed along the rocket skin, at 900 from the beam
ejection direction (rearward) from a point 180 ° in azimuth
from the accelerator anode (that is, on the opposite side of
the rocket). Its principal function is to measure radiation
from the plasma sheath associated with corona discharge thought
to surround the vehicle (Ref 24). To achieve this view parallel
to the rocket's long axis requires in-flight deployment of a
mirror, which folds the photometer's optic axis while trans-
lating it some 15 cm outboard from the skin.
Figure 7 shows the three instruments with their elec-
tronic controls and power supplies (internal in the plasma
sheath photometer, see below). Their characteristics and
telemetry are summarized in Table 7. The optical-diagnostics
system is powered by a separate 28 volt battery (supplied by
the payload integration group), and draws 18 watts.
WIDE FIELD PHOTOMETERS
These photometers are designed to measure the irradiance
from the beam and backscattered electrons, at a sampling rate
65

II
Figure 7. BERT-i optical instruments and mechanicalmounts. The plasma sheath photometer(black anodized) is at left. The low lightlevel video camera (white) with its controlelectronics and connecting cable is in thecenter. At right front is the electronicsbox, cables, and sensor heads of the twowide-field photometers. Dimensions may be
estimated from the 171 mm (6-3/4 in) widthof the black video electronics box.
66

I0 r-40, >u 0
14-1'4 PQ '-4 _X to 04-J1. Cu %C I - r- %
Cuw) Q r4 ,-4U r= *-4 cUd. 1'-w)41 -4.-)e a w I1 0
w) 9,0 $4 CrC-4 $4 CU C) -W6~ 0 0 9- PL4 -,4
0 r- F 2 4 b *r- $4 1) 0>~ r.C0
E20 -4 c 0O 44 0-t r4co 00 U)WCr- L *4-0 w 0-.. C'4 0jC0 a. ) 0
C ~ 1i- P64 41 4cn o tk 0C %Do' m 41 0)0 u r 00) w- o cU r_ 0ON -4 -- cd 0) CD 000
04 e- cn -- a0) e - c 0 1 4 I i cc a2- *-eC00.C W c,4 4 C co C14 X- *L . 00D0 C c 4 -. 0)> 4- -'--4) V0 0) r4 2-i00 u 00 00a n 01 0 U0 u 00 Cu
(1) 0-.-4 -4 C3C'4 Lf) m 0)'- t 14 0 - "' N -44 44 44 Z.4t 4 ~ Cf CY)4 CN-'
0
0)wc 0 3 OCww
0)c ~ -It 4 0
*0 w v c o =C -e . C0 Mu.r 0-0PL4~~U0 0) 0C$4 )C 4 w r N 4 Q U 4
co13-i- Cu - 414C w l -1pw ri 0) .1 -
w 00 0 4 )0 Q Zc i W- -- 0.4 -0oQ) 1041 4-) .) c04)A 4 V 0CD Q) 0- C r 40 V
E - 0 ) 0 41 2 0 j C4 $4 r 0 0 r- -4 0 .- ' -f
Cd .e.-4 0 r.l a)-00 r-Ln 0
Cu 2 t 0caJ.J$- 0 . - *c4 m -J =))). 0)a%
o 4 0 04 0 4~1) 4 00 0 C1 -Li C 0~.- ~ *-ot0) 04- co4-) Ow~ 0%04- efDO w -I& .0 wJU2 4 4 rz4Js- 4-1 0 %*IsD- r 0 w*. 0u 0 C0
A ol r=eP3i~- X 0 W-'- Ic~- 1 0 4 4 tz
C0)
134 U,0u2
C4 --4 e~0
W 0) -.4~u 0 to r- ) 0 r.
0u 0)r- 4 0W0 $0%O- J- . 0C 4 4-0
(d 0) :31 W- 0i (A 0 0 m)- Ccor0 w W- 000 Wc4 ~ a -.4 0LD U C ~ -x*o.=-4 U -
-=--0*-.COor-..4 000.- 1 4 CLr- *.o'0u00
p > ~4 4>0 4()C~>~ U467
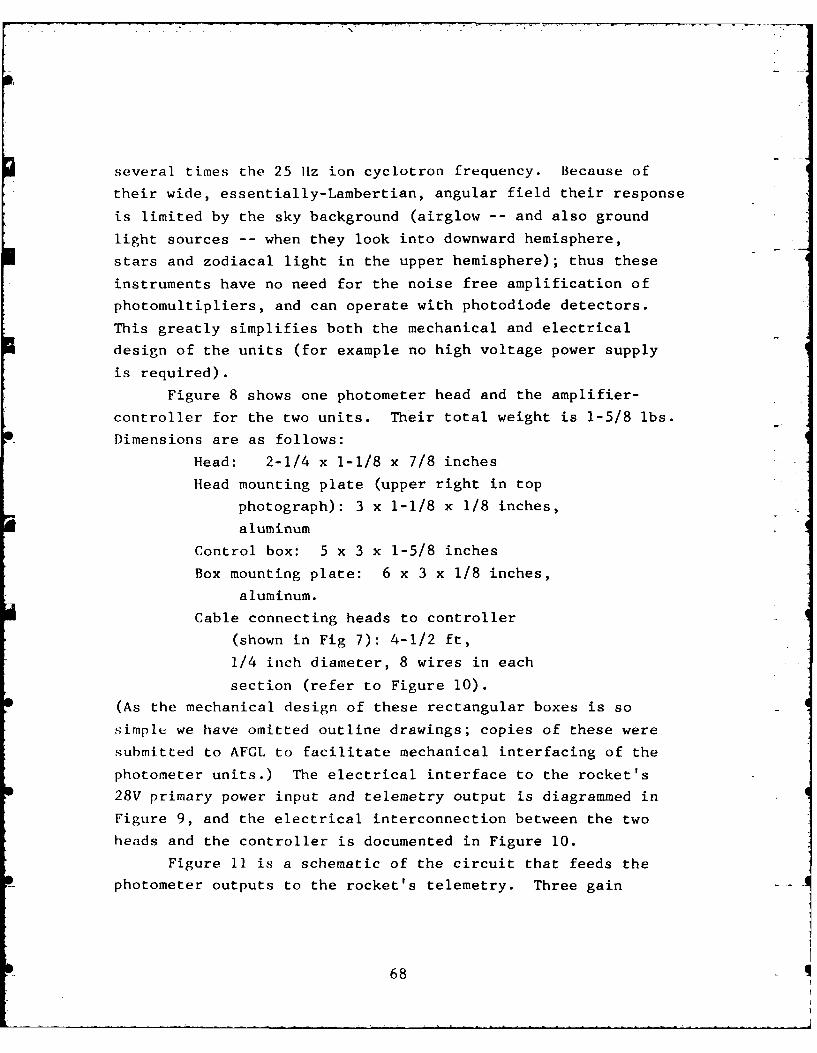
several times the 25 1iz ion cyclotron frequency. Because of
their wide, essentially-Lambertian, angular field their response
is limited by the sky background (airglow -- and also ground
light sources -- when they look into downward hemisphere,
stars and zodiacal light in the upper hemisphere); thus these
instruments have no need for the noise free amplification of
photomultipliers, and can operate with photodiode detectors.
This greatly simplifies both the mechanical and electrical
design of the units (for example no high voltage power supply
is required).
Figure 8 shows one photometer head and the amplifier-
controller for the two units. Their total weight is 1-5/8 lbs.
Dimensions are as follows:
Head: 2-1/4 x 1-1/8 x 7/8 inches
Head mounting plate (upper right in top
photograph): 3 x 1-1/8 x 1/8 inches,
aluminum
Control box: 5 x 3 x 1-5/8 inches
Box mounting plate: 6 x 3 x 1/8 inches,
aluminum.
Cable connecting heads to controller
(shown in Fig 7): 4-1/2 ft,
1/4 inch diameter, 8 wires in each
section (refer to Figure 10).
(As the mechanical design of these rectangular boxes is so
simple we have omitted outline drawings; copies of these were
submitted to AFGL to facilitate mechanical interfacing of the
photometer units.) The electrical interface to the rocket's
28V primary power input and telemetry output is diagrammed in
Figure 9, and the electrical interconnection between the two
heads and the controller is documented in Figure 10.
Figure 11 is a schematic of the circuit that feeds the
photometer outputs to the rocket's telemetry. Three gain
68
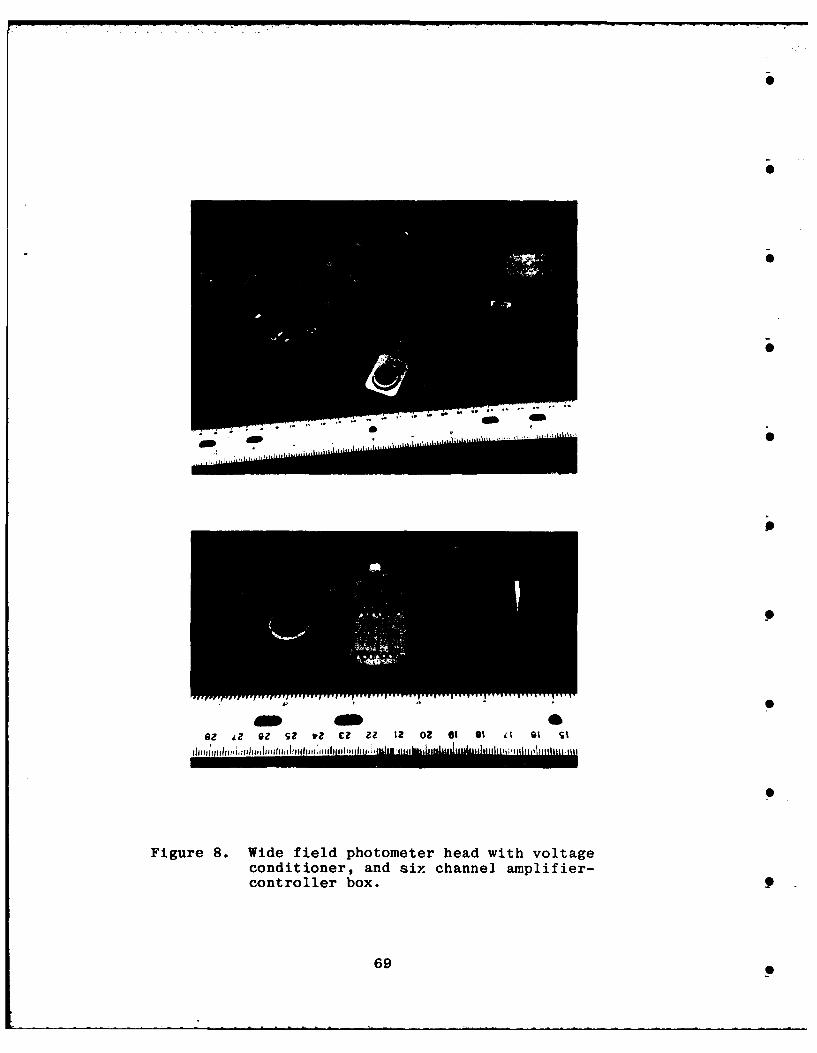
di 0
... .. ... .. . . .. .... .. . .
dw
!Z Z i S? Z ? O tZ 02 61 91 01 1
Figure 8. Wide field photometer head with voltageconditioner, and six channel amplifier-controller box.
69

LLIa n -ILnL
ILA
z z LI LLI W* rL
a Law u (A I~~3 IrW
o OW Inn wZ z w z zCL - IL -
0.L 00 4.. U&v:-) 4 OC x-
LUL
or Li-
. X I- I
LALA 4 LI
CAt m a IgLU -.-
-k = - -
z~~~~G L) L) > -X z z zC.4~~ ~ ~ ~ 00. 0-4 0 ,- - - ,
C.) +C4 4 4A (n ) C44.z I *, N$4 (L ) M )4-).r a 0
r- . 4)
11 r.
70y

=D r > :z c U
V) w0- x)0 cc4-) 14
P- U)
0: 0- o
z -
OUv -0 < C).L OL ) < < flCJ+ I <I l)
I I<
WU4~. ~-~ ) 0
0 0 -4
0 0-- I CdU
II Ua) 0
+4JS
000.
In -4 a)A a)
0~~ CD--c!~ W C
04 Lr% =3 'dO
71

z
+ 4-) LO
* 02 Ew +14.ot0- ,- 0 4-
CL K4 0WCD - -1 C
UNd0 0 4- r. D:
o ~bio -H~~
4) .r4 Q) 4-) ~Io;-- .H H44.H -, -j 0 0-'
0 I-r4 r- 0 ;". -
-) 0-i 0-CZ
0f -0
I +
++
00 000
L)I- 0--. -
Ln0 CD>
4-% 0 %=
e*J Ln 0 -0-fN I 1 -
.10 < - C0
0..4- -- 0.
>- 0
C 72
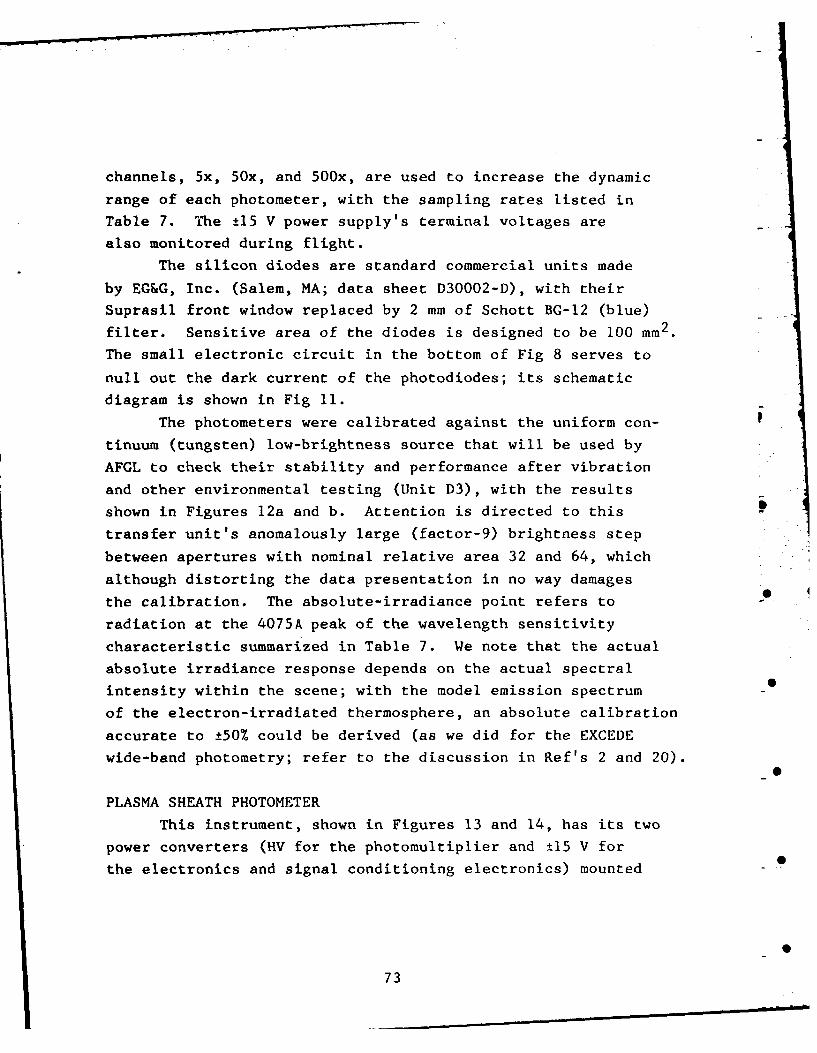
channels, 5x, 50x, and 500x, are used to increase the dynamic
range of each photometer, with the sampling rates listed in
Table 7. The ±15 V power supply's terminal voltages are
also monitored during flight.
The silicon diodes are standard commercial units made
by EG&G, Inc. (Salem, MA; data sheet D30002-D), with their
Suprasil front window replaced by 2 mm of Schott BG-12 (blue)
filter. Sensitive area of the diodes is designed to be 100 mm 2 .
The small electronic circuit in the bottom of Fig 8 serves to
null out the dark current of the photodiodes; its schematic
diagram is shown in Fig 11.
The photometers were calibrated against the uniform con-
tinuum (tungsten) low-brightness source that will be used by
AFGL to check their stability and performance after vibration
and other environmental testing (Unit D3), with the results
shown in Figures 12a and b. Attention is directed to this S
transfer unit's anomalously large (factor-9) brightness step
between apertures with nominal relative area 32 and 64, which
although distorting the data presentation in no way damages
the calibration. The absolute-irradiance point refers to
radiation at the 4075A peak of the wavelength sensitivity
characteristic summarized in Table 7. We note that the actual
absolute irradiance response depends on the actual spectral
intensity within the scene; with the model emission spectrum
of the electron-irradiated thermosphere, an absolute calibration
accurate to ±50% could be derived (as we did for the EXCEDE
wide-band photometry; refer to the discussion in Ref's 2 and 20).0
PLASMA SHEATH PHOTOMETER
This instrument, shown in Figures 13 and 14, has its two
power converters (HV for the photomultiplier and ±15 V for
0
the electronics and signal conditioning electronics) mounted
73
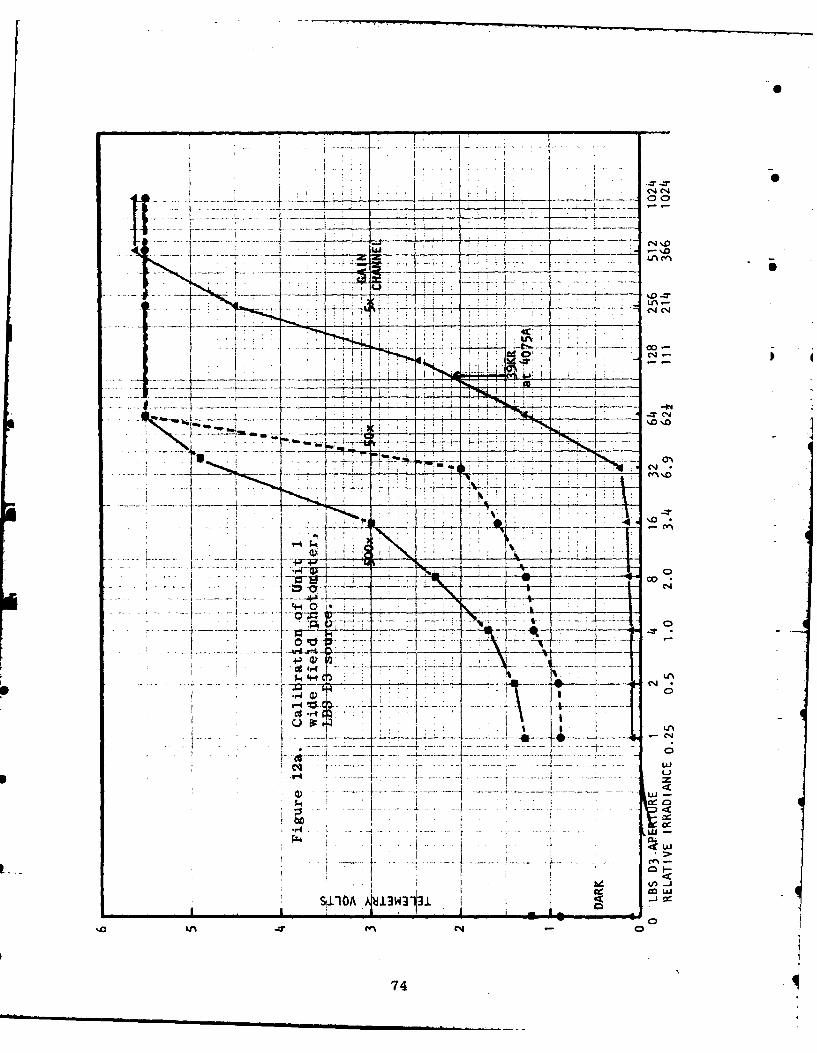
%0 -T
* , 0
1 : f7 _ _
4-I
__~~O %.0-iN~
-- - --- OD-- ~ 5
4-4 0
LA
. 1 4w
CAP 0-j
'.0LA -~C4,
74
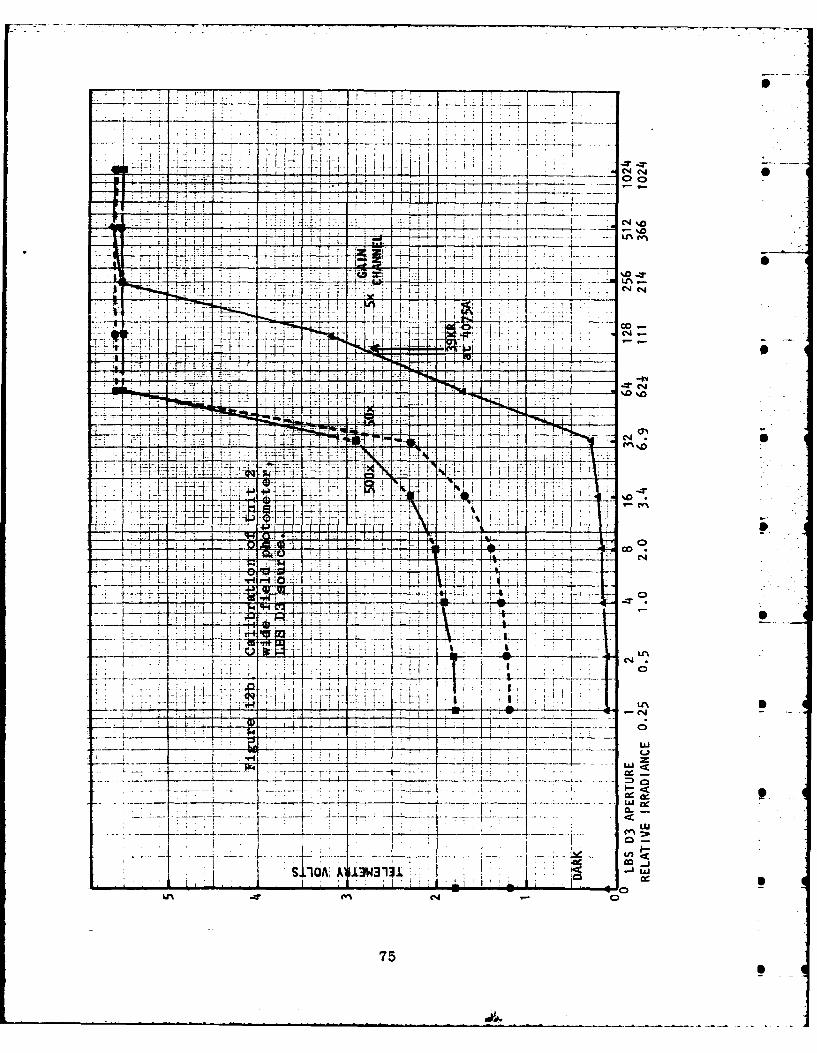
-7-
0 ;q! --i iO
t- -
------ 0
49-
-- 7--r,-4
+ -75C-4
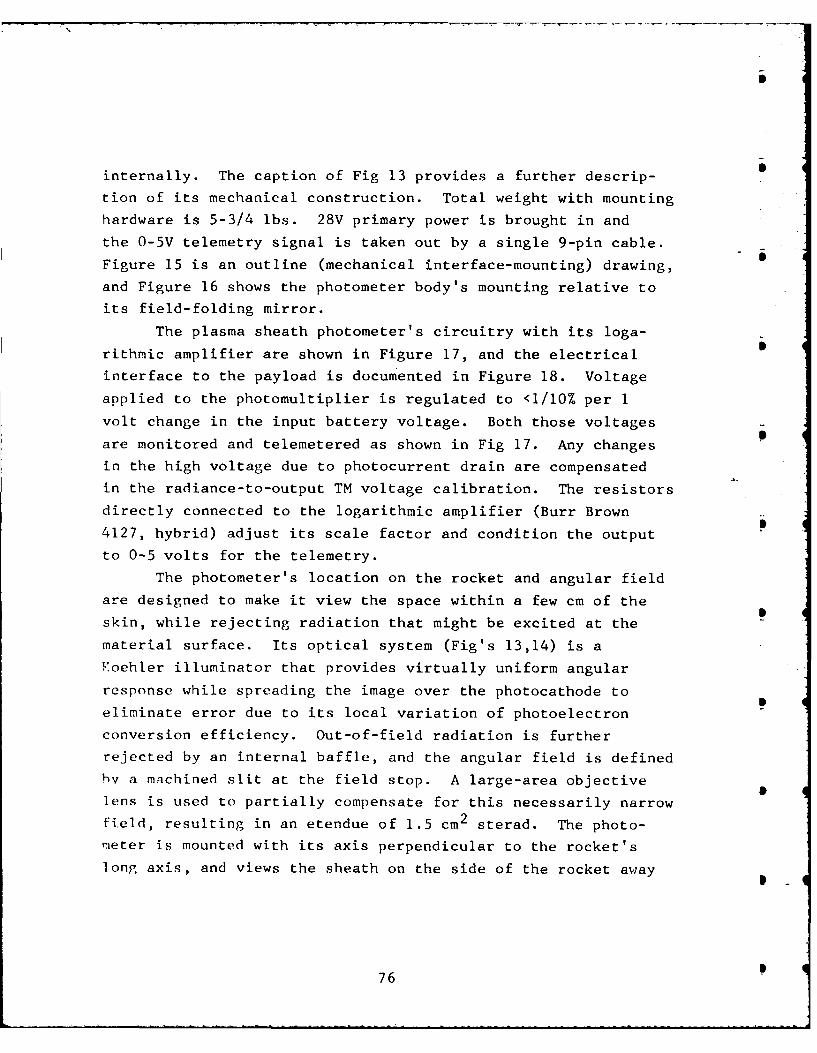
internally. The caption of Fig 13 provides a further descrip-
tion of its mechanical construction. Total weight with mounting
hardware is 5-3/4 lbs. 28V primary power is brought in and
the O-5V telemetry signal is taken out by a single 9-pin cable.
Figure 15 is an outline (mechanical interface-mounting) drawing,
and Figure 16 shows the photometer body's mounting relative to
its field-folding mirror.
The plasma sheath photometer's circuitry with its loga-
rithmic amplifier are shown in Figure 17, and the electrical
interface to the payload is documented in Figure 18. Voltage
applied to the photomultiplier is regulated to <1/10% per 1
volt change in the input battery voltage. Both those voltages
are monitored and telemetered as shown in Fig 17. Any changes
in the high voltage due to photocurrent drain are compensated
in the radiance-to-output TM voltage calibration. The resistors
directly connected to the logarithmic amplifier (Burr Brown
4127, hybrid) adjust its scale factor and condition the output
to 0-5 volts for the telemetry.
The photometer's location on the rocket and angular field
are designed to make it view the space within a few cm of the
skin, while rejecting radiation that might be excited at the
material surface. Its optical system (Fig's 13,14) is aKoehler illuminator that provides virtually uniform angular
response while spreading the image over the photocathode to
eliminate error due to its local variation of photoelectron
conversion efficiency. Out-of-field radiation is further
rejected by an internal baffle, and the angular field is defined
hy a machined slit at the field stop. A large-area objective
lens is used to partially compensate for this necessarily narrow
field, resulting in an etendue of 1.5 cm 2 sterad. The photo-
meter is mounted with its axis perpendicular to the rocket's
long axis, and views the sheath on the side of the rocket away
76
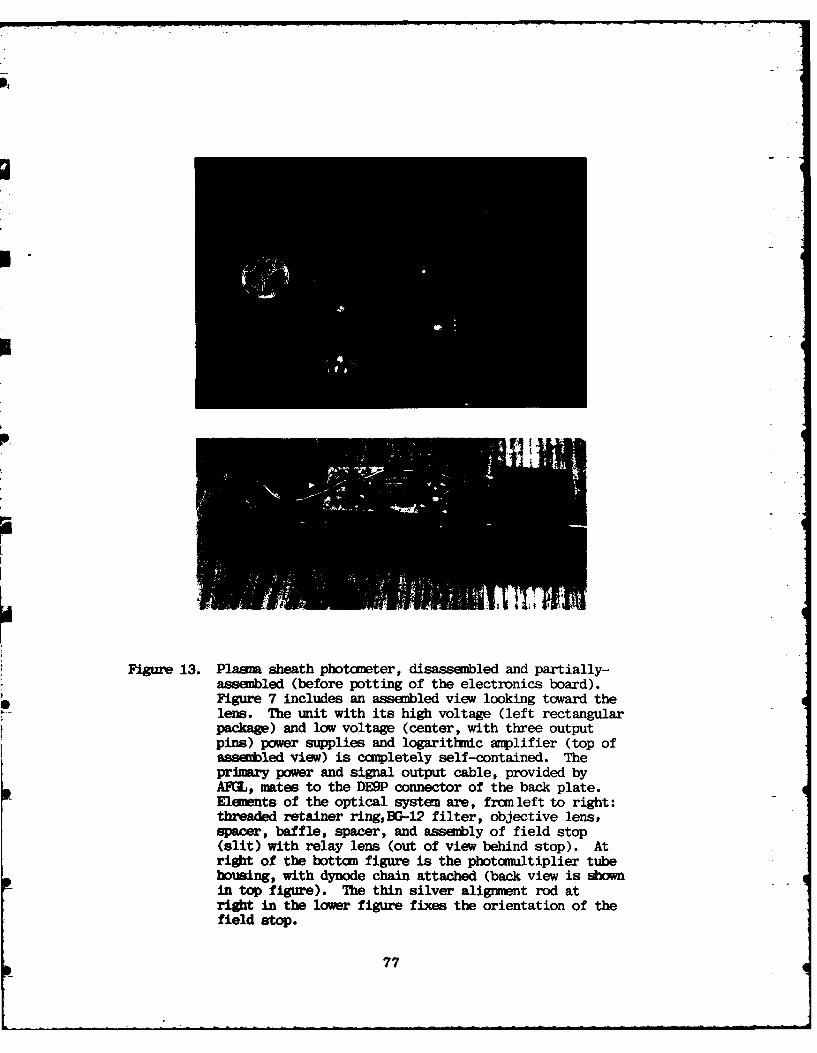
II
I
Figure 13. Plasma sheath photometer, disassembled and partially-assembled (before potting of the electronics board).Figure 7 includes an assembled view looking toward thelens. The unit with its high voltage (left rectangularpackage) and low voltage (center, with three outputpins) power supplies and logarithmic amplifier (top ofassembled view) is ccmpletely self-contained. Theprimary power and signal output cable, provided byAFGL, mates to the DE9P connector of the back plate.Elements of the optical system are, from left to right:threaded retainer ringBG-12 filter, objective lens,spacer, baffle, spacer, and assembly of field stop(slit) with relay lens (out of view behind stop). Atright of the bottom figure is the photomultiplier tubehousing, with dynode chain attached (back view is shownin top figure). The thin silver aligment rod atright in the lower figure fixes the orientation of thefield stop.
77
W. a.
co
*'*4 a)
-r4 Wd.041
a.) 4,-)-~ (1)O4~
W-"oA a I
iz
'-a78

u
LLI
F-I
4-44
2:' 0y ~ .4
LL - S
I- I J.
-T 0 ii
f4z
L~LO
79
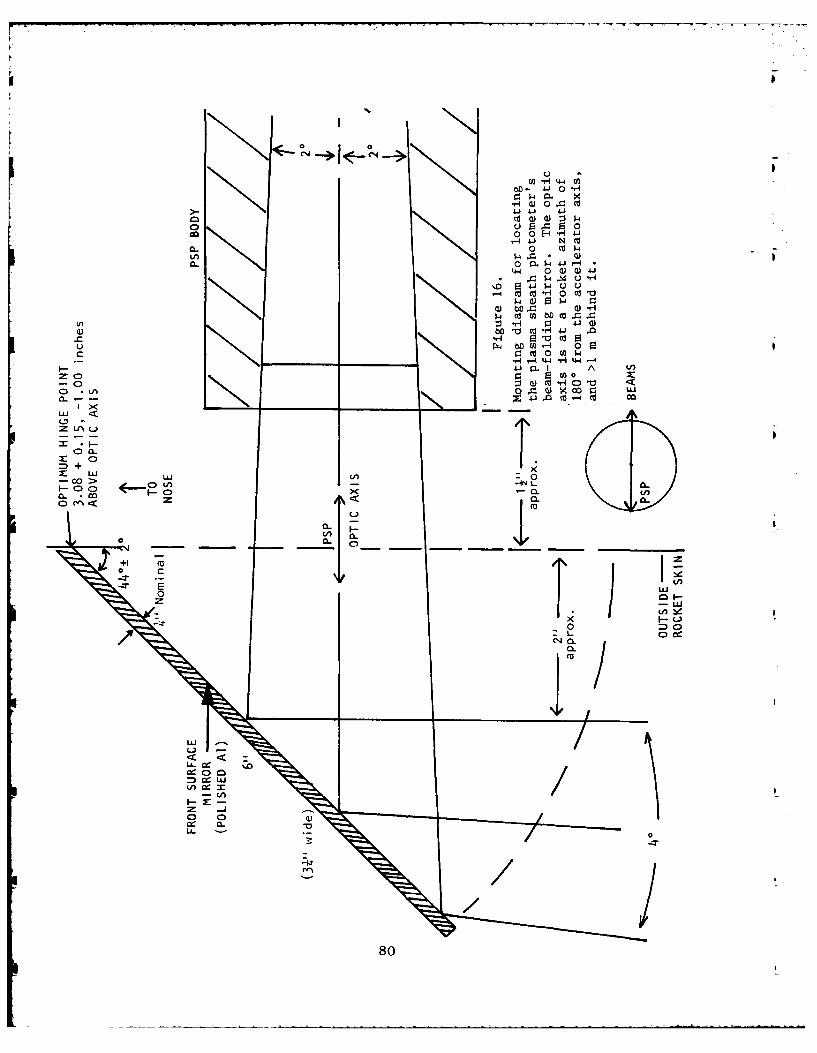
00
- W - 0 C CO
CO 0)J 0 :3 $0 0 E-44- 4.J
0 co~4I-
0-4 CL$44Jr-440 w 0 4
$ )4 U Uw- o c
u Fx4 OW(n-4 0~
-H r-4 44 * L4.4 -" P I A V)
C) 0z co 0 x-0 0 "o,-0 <
o n o~i 0) X 00 LU
0.
0: LUC- Co> zo
0c~ a..
-~~~ E0 Lo- -_ _ _ _
+1 UA.I
0IZ I wI
-it) 4
LLU
w 0=3 LU
w CL -
80
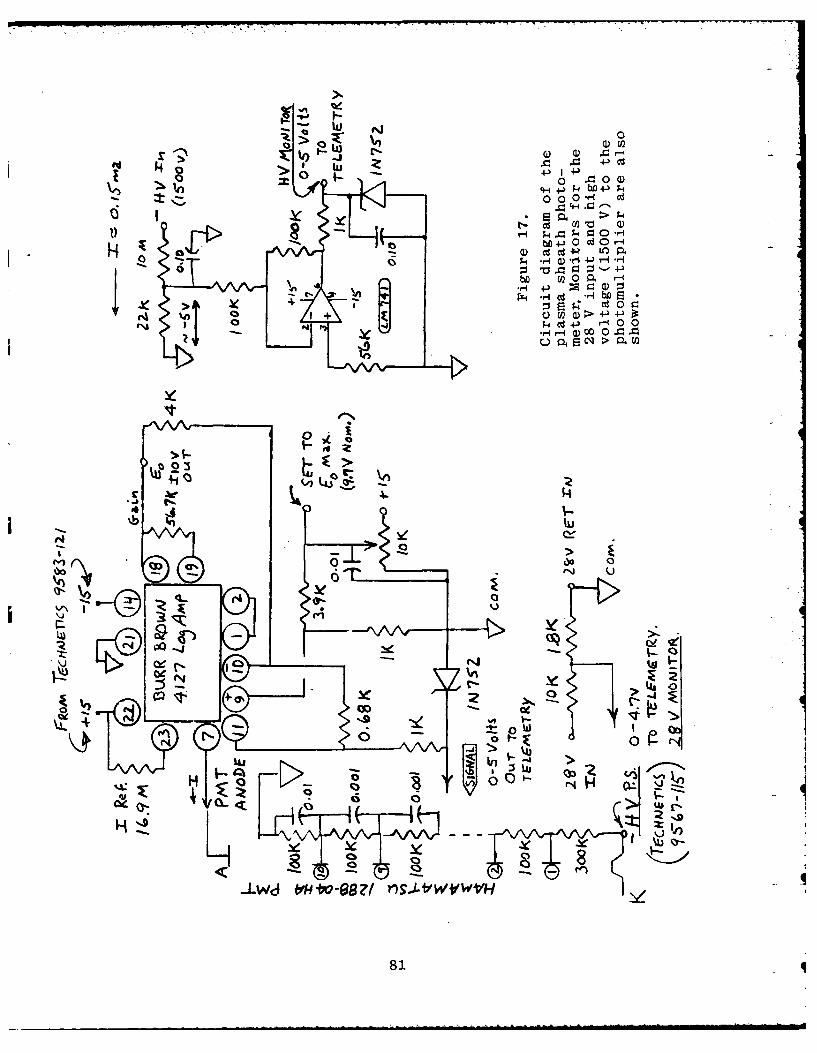
1- .J 0W
o o ) 0 Cd
.0 CHG
b 4 0 c-C )0) cdc - LOP
r4 4 *Hri-I -H
U 0CC~--
s Cd 0 z~.
Q ~ P4 M
zIi FI
-A a
-010 0
090
-'-to
Uz 1
>
810 W

w
0
U z
zz
M CL CL LJJ
C) Q0 LIJX
: le ,. LLI L
c- 0LfJ UZ (
>w CL'. cc.
WA 0Ix
< LU -u
z i = =-LUw : O
IAn 0F - v-0u i- Lu <
0 O CL LU -j <
'1c 00-0
jU +CN 0=A( WAI (A :
CL =) -U L) F- cc
z~~~f :z.Co0-1:
W F- F < 0 Lc W LL
> - -= X: w "_00 z= ) 1 8<2
L1 c___ C). __ __ _ _0_0 0
from the particle ejection direction by means of the flat 450
mirror shown in Fig 16 (provided by the payload integration
group). It is positioned as far as practical from the electron
and ion accelerators (>1 electron gyroradius) to minimize the
contamination from radiation excited by backscattered (rather
than plasma sheath) electrons.
Figure 19 shows the sensitivity calibration of the
photometer against PhotoMetrics' uniform-radiance continuum
light source. Also shown is the response t- the similar source
available to AFGL (LBS D3), for checking the unit's performance
after environmental testing and in the field. Note that a
4-decade dynamic range of scene radiance is achieved.
A blue broadband filter (Schott BG-12) restricts the
photometer's wavelength sensitivity to the N2 Second Positive
and N2+ First Negative fluorescence bands, and discriminates
against background radiations and metastable radiators; a blue-
sensitive (bialkali) photocathode minimizes dark current.
The absolute sensitivity point in Fig 19 again refers to
monochromatic spectral radiance, at the 3900A peak of the
photometer's wavelength response. As with the comparably
wavelength-sensitive wide field photometer, this absolute
calibration can be improved by calculating the instrument's
response to a model emission spectrum of the plasma sheath
glow; this spectral distribution can be estimated from the
energy spectrum of the electrons in the sheath, using the
procedure outlined in Section II (refer especially to Fig 2).
VIDEO CAMERA SPECIFICATION AND PROCUREMENT
The specification and procurement of an ultrasensitive
rocket flight-survivable video camera (eventual purchase price
$26K less lens) represented a major element of the program.
83
L8

0.~ a._ a,
L- 4
Il __I____Jr
viz~j .. _
_ _ _ 7P.
t -M.i -
I--.
00I C'J
r~~r 1-441W i
ir-) L4 - L 5.
__ ~SIIOA XMIMGMII I
LI) ~-
834
Initially the basically-unruggedized ITT 4546 camera
flown on SCEX was considered. In view of the risk of mechnical
failure of this camera, it was decided to fly a system that
had been specially designed to withstand the environment of
rockets, balloons, and research aircraft, with state-of-the-
art threshold sensitivity to record the low radiances expected
on the basis of SCEX results. An investigation showed one such
video camera to be commercially available, ten units of which
had been flown successfully. Negotiations with the manufacturer
(Edo Western, Salt Lake City, UT) were initiated just after
funds became available in July 1982, and the purchase order
was placed on 03 August.
The camera as purchased (Figure 20) consists of a
hermetically sealed cylindrical head containing a premium-
grade (selected for low blemish count and high sensitivity)
RCA 4849/AH Intensified Silicon Intensifier Target [vidicon]
tube (Item CH-1434/36369-2); a vacuum-tight electronic control
box containing 5 circuit boards (Item CCU-1430/24133); and a
6 ft x 5/8 inch diameter cable interconnecting the two elements
(Item 3Q576). The order as accepted by the vendor called for
him to reduce the weight of the control units from 11 to 6 lbs
by milling out mechanical strengthening material; the actual
final weight, however, was 7-1/4 lbs. The head weighs 4-1/2
lbs, and with its mechanical mount to the payload, lens, and
lens strengthening cylinder (shown in Figure 21) the total
weight of this instrument is 10 lbs.
Delivery of the camera was promised for 16 February 1983,
6-1/2 months after receipt and acceptance of PhotoMetrics'
order. Our staff maintained contact with the vendor, and
as late as 28 January 1983 we were assured it would be shipped
on-time. Actual delivery, however, was delayed until 29 April,
which left only three months for PhotoMetrics to complete the
85
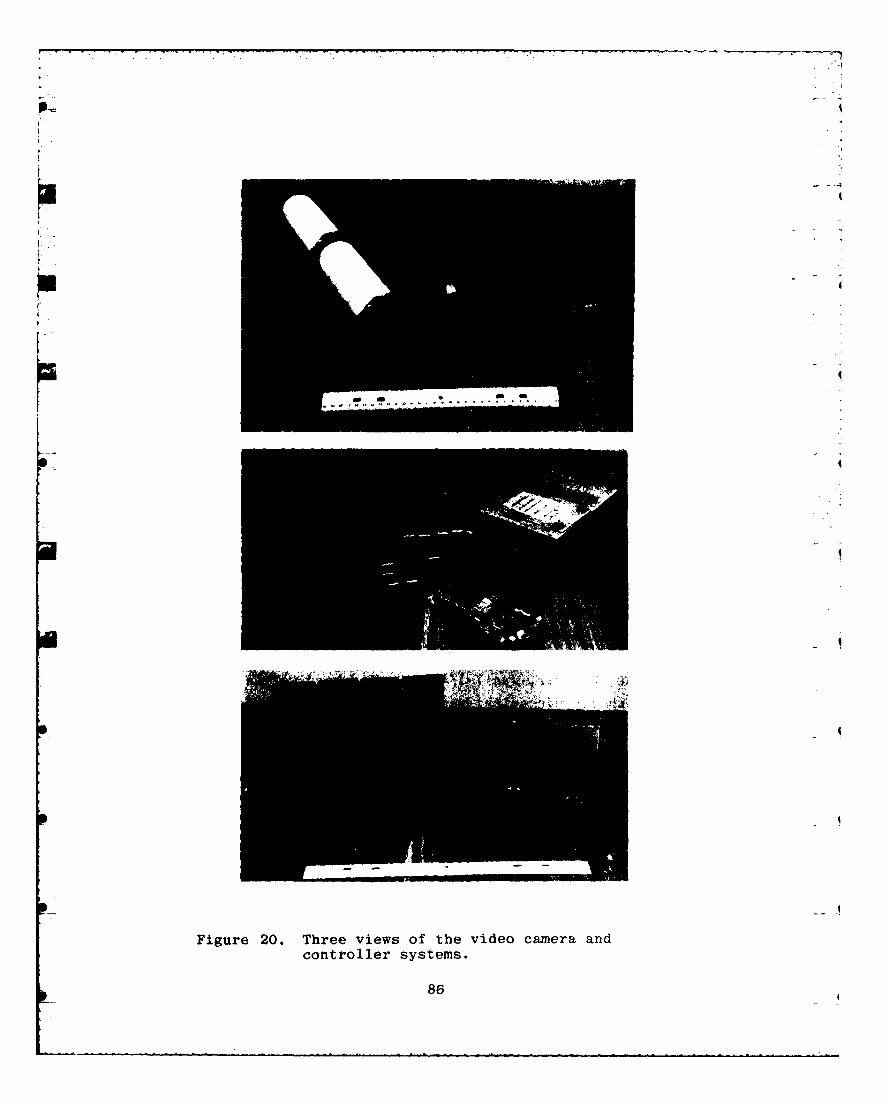
p,41,
pi
I
-
I
Figure 20. Three views of the video camera andcontroller systems.
86
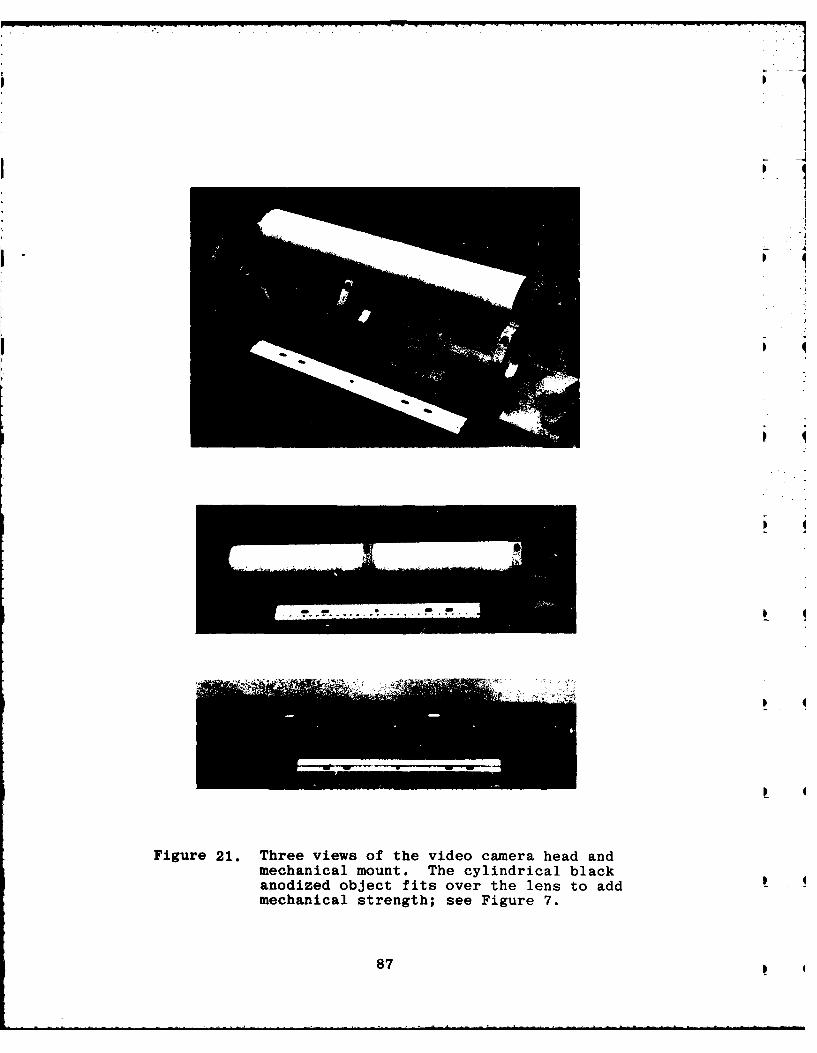
I
p 4
I
I 4
Figure 21. Three views of the video camera head andmechanical mount. The cylindrical blackanodized object fits over the lens to addmechanical strength; see Figure 7.
87 4

mechanical and electrical interfaces to the rocket, make the
necessary performance tests, and radiometrically calibrate
the unit with the lens selected. The camera manufacturer
claimed that his 2-1/2 month delay was due to "need to test
the instrument to meet specifications."
These specifications and other pertinent performance
data are summarized in Table 8. Of principal concern are
vibration and shock resistance, and stability of the elec-
tronics (principally the high-voltage circuitry) under the
near-vacuum conditions at rocket altitude. PhotoMetrics'
modifications to the camera, which were designed to maintain
these performance standards while completing the video system,
were as follows.
1. Installation of a short-focus lens
for wide-angle imaging (refer to
Table 7);
2. Construction of mechanical mounts
for the camera head and for this lens
(which would otherwise be held in by
only 3 threads of a standard 16 mm
C-mount);
3. Construction of a mounting plate for
the control box (shown at the bottom
of Fig 20);
4. Installation into the control box of
a monitor for the camera's automatic
gain control voltage, to allow end-to-
end radiometric calibration (input
radiance to output signal voltages).
Insofar as the camera system is highly complex, Photo-
Metrics has provided AFGL with a copy of its 200-page instruct-
ion and operating manual and of the 25-page factory acceptance
88
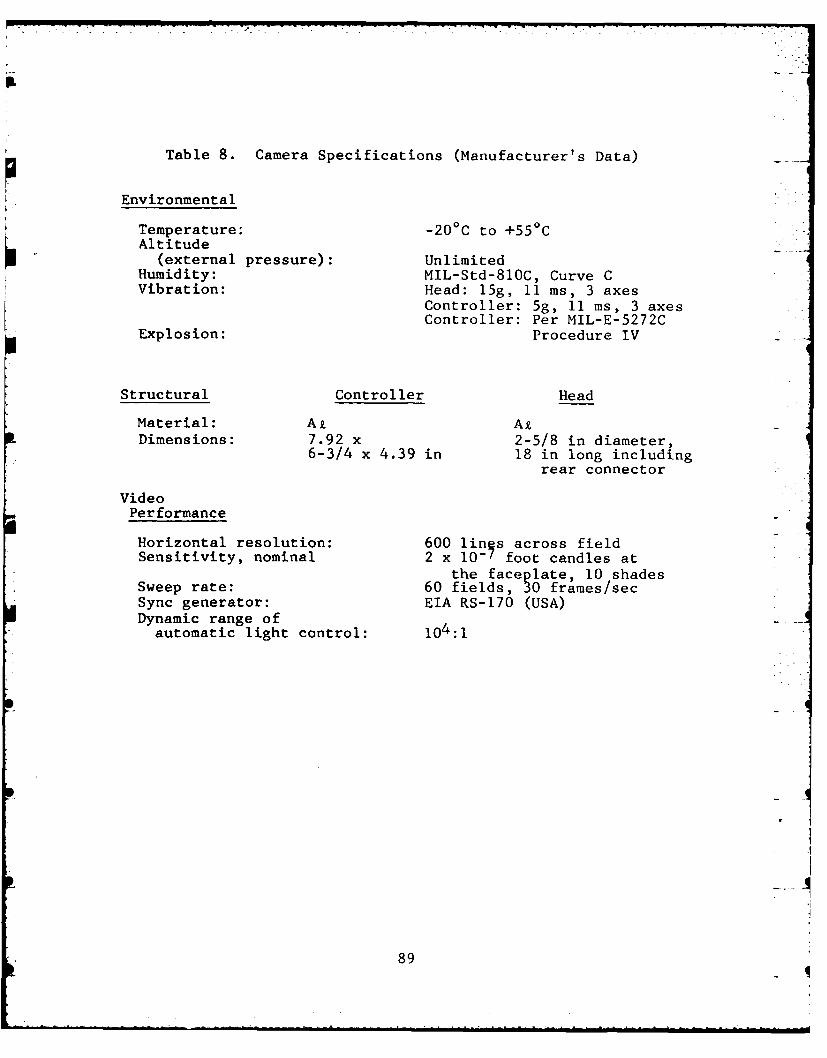
II
Table 8. Camera Specifications (Manufacturer's Data)
Environmental
Temperature: -200 C to +55 0 C
Altitude(external pressure): Unlimited
Humidity: MIL-Std-810C, Curve C
Vibration: Head: 15g, 11 ms, 3 axesController: 5g, 11 ms, 3 axesController: Per MIL-E-5272C
Explosion: Procedure IV
Structural Controller Head
Material: AR AxDimensions: 7.92 x 2-5/8 in diameter,
6-3/4 x 4.39 in 18 in long includingrear connector
VideoPerformance
Horizontal resolution: 600 lin s across fieldSensitivity, nominal 2 x 10 -7 foot candles at
the faceplate, 10 shadesSweep rate: 60 fields, 30 frames/secSync generator: EIA RS-170 (USA)Dynamic range ofautomatic light control: 104:1
89

test procedures (of temperature and vibration sensitivity,
resolution, low light level response, and other parameters
in Table 8) performed by its manufacturer. This manual
contains schematics and theory of all the electrical circuits
with detailed instructions for their maintenance and trouble-
shooting, as well as mechanical and optical documentation of
the head and controller. The material in the following sub-
section, which documents PhotoMetrics' completion and
integration (and calibration) of the video camera system, is
intended to complete the information needed by AFGL to install
and operate the system in the BERT-I experiment.
VIDEO CAMERA SYSTEM
Figures 22 and 23 are outline drawings of the video camera
head with its mounting hardware and control box (for mechanical
interfacing), and Figure 24 documents the system's electrical
interface to the rocket payload. The schematic diagram of the
gain control monitor is shown in Figure 25.
To expand the dynamic range of scene brightnesses that
it can record the camera automatically adjusts the high voltage
(3-20 kV) applied to its intensifier segment, under control of
circuitry that senses the mean amplitude of the vidicon's
output signal. We tapped into this circuit at a point in the
feedback amplifier at which the voltage (0-10V, which we
convert to 0-5V for telemetry) is a quantitative measure of
the voltage applied to the intensifier. The combination of
this system gain-measuring voltage and the video output voltage
(Standard RS-170 1.4V peak-to-peak range) establishes a series
of calibration curves that allow scene radiance levels in the
field to be directly related to scene radiances applied in the
laboratory. We return to this issue in our description of the
calibration procedure.
90
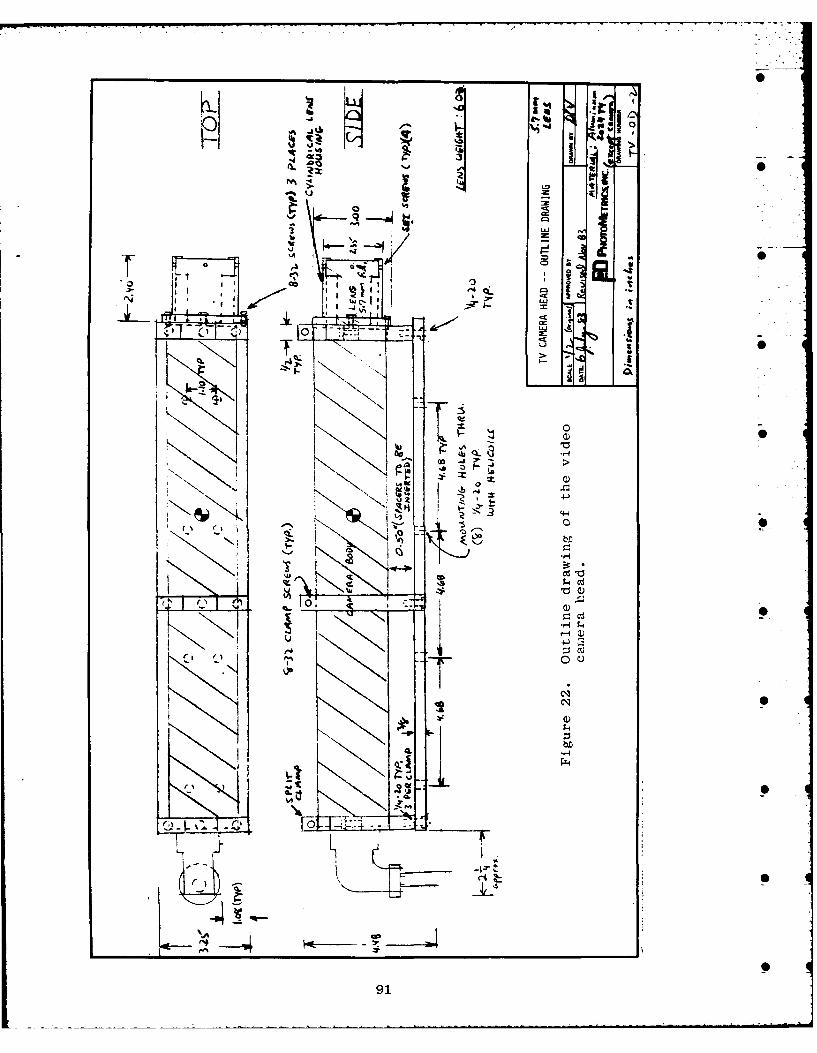
qt'
-5z
UL
Psi c .
AL i* f I k '
10 0f
on0
q1- $ 4 p
NJ I Tw cc
919
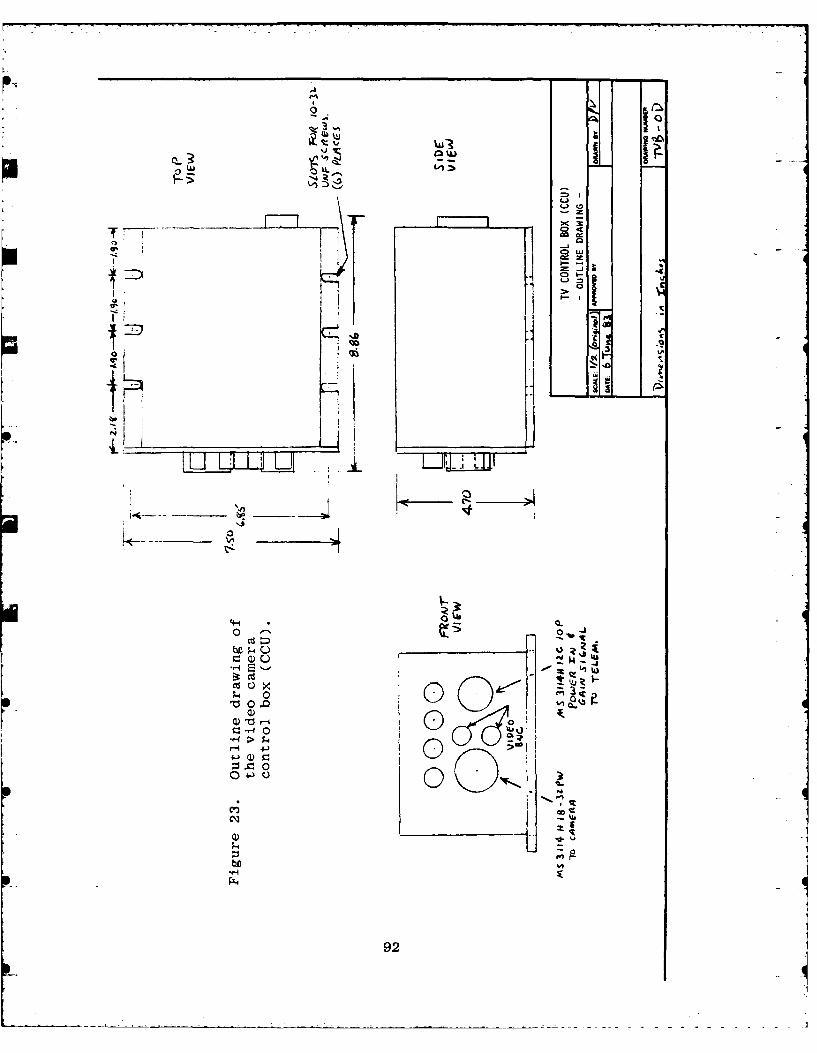
a IL
owo
Li ~ ~ ~ * L.LI1-iL
VA1
ii -
Od 01
zi Ci0 4-)
'3
~.H
V 0.092

z
z
a--
C/)
LL 0
LL) I Z
4''
Vi 4 0 a)
it C-D->
Fl ----
m)- 0wi u Q)
Z\) z0
0l
1
-m
bP0Um
93I
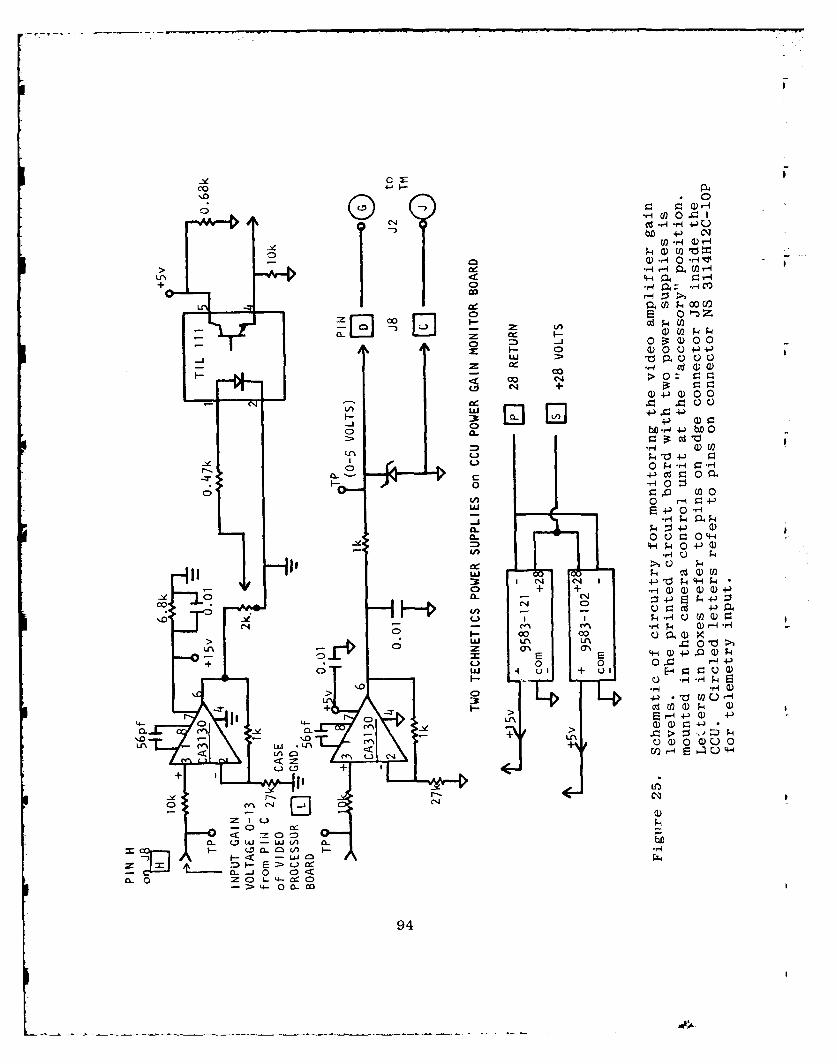
co
(D 0
-d C-H +-)
+) Co
-I-
0 z-
C)0 - 0 00oL "o a0 Co0
wwc .1 4 a a
o 1 + +(1) CN 0 0
V~~~- r. ~ H~o0 P4 -,- 0 -
r-' Cl -0 P -r c
0 0
-~ 's0 o0 O )O
4A Ir- 0oc >,0 -
h- J ;, C ()(
- 0 C J a
0~~0 0-L0-Jf 0
> >L C-..) Lr
UN a% . 01094
7ADft43 7?EXPERIMENTS ON INTEROCTION OF KEY PRRTICLE BENS ITH 2'2
I I L ICOFSKY ET AL. 31 AUG 63 PN-TR-63-01I NCLASSIFIED RFOL-TR-83-0316 F19629-99-C-0133 F/fl 4/1 ML
EmhhhhmhhhE[hEh-hE 1h
Li,UM3 I M2
Q6F
LL L46 102M
11 ,-'.
11111 g ~ 111=6.
MIROOP SLUTO E- HRNAINLBUEUO SADRS 18-A
Mounting of the aiready-ruggedized control box repre-
sented no problem, a simple flat plate bolted to its rear
(Fig 23) being all that was needed. The circuit boards were
conformal-coated with Dow Corning 3140 RTV for vibration damping
and to prevent any components that might fall off from short-
circuiting critical elements. The boards not secured by dual
rails are bolted in place, following standard practice for
harsh environments.
The camera head and lens, however required construction
of the mechanical clamping system shown in Fig 22. (The simple
pair of straps provided by the camera manufacturer was judged
inadequate, and in any case does not provide strengthening for
the lens.) Its cylindrical body is held by three 1/2-inch
thick split rings, and in addition pressed against the bottom
mounting plate as shown in Fig 21. This clamping is firm enough
to meet the rocket's vibration and acceleration specifications,
without exerting sufficient force to damage the thin-walled
cylinder. Both the front and rear rings are ridged to overlap
the ends of the housing, effectively preventing it from moving
along its long axis. Particular care was needed to fit the
rear clamp to the bead of a weld holding on the camera head's
back plate. The lens also required mechanical strengthening,
by the black-anodized holder shown, which is screwed into the
front split ring. The bottom plate is the mechanical interface
to the payload, with eight 1/4-20 Helicoil inserts spaced as
shown in Fig 22.
As noted, the initial concept had been to mount an all-
sky lens on an outbound camera so as to view a large area of
the beam and backscattering volume. As little or no spatial
radiance structure is expected (Ref 20), there is little
impetus to increase angular resolution by decreasing the field
of view. Ile performed extensive measurements of the limiting
95
useful fields of three very wide-angle lenses, to make optimum
use of the camera's image plane area and to determine whether the
electron beam's first refocusing node could be included in the
field. (Distances of the node from the accelerator are given
in the Design Evaluation Report.) In practice the acute angle
of view to the beam even at the 1/2 keV electrons' close-in
node (about 130), coupled with the low image resolution near
the edge of the camera field, results in low quality information
about refocusing of the primary electron beam.
After the decision was made that the camera head itself
would not be erected outward, we considered various mechanical
arrangements to achieve a projection to a lens outside the
rocket body (so that the rocket itself would not obscure the
camera' s field). We investigated the practicality of extending
outboard only a lens, connected to the camera with a coherent
(imaging) fiber-optic cable. The drawbacks were the cost of
the necessary cable ($6,700 for the 6-ft length available),
its at least one stop loss of optical throughput, and its
reduction of spatial resolution; further, the mechanical
difficulty of erecting the all-sky lens and cable (which
weighs 15 lbs and has a minimum bend radius of 6 inches) was
judged not much less than that of moving the complete camera
head.
The idea of swinging outward one end of the camera (like
the mirror in Fig 16) with the lens mounted perpendicular to
the cylinder axis was also abandoned when it was recognized
that two further relay lenses would be needed in an optical
system to turn the extremely short-focus all-sky lens's optic
axis through -900. (The clearance between the rear of this
lens and the front glass plate of the sealed camera is only
about 1 mm.) It will be noted that the area of a flat mirror
96
that would accommodate the all-sky field would be impractically
large, and the cost of designing a special curved outboard
mirror to achieve wide angular coverage was judged well beyond
the budget of the program (particularly since less than two
months of the performance period remained when PhotoMetrics was
informed that the camera head would not be translated outward
when the rocket had reached experiment altitude).
The restrictions that the 22-1/2 inch long cylindrical
head (with lens and rear electrical connector) must fit within
a rocket body of inner diameter 16-3/4 inches with 1/2-inch
buffer clearance at each end, and view through an opening that
could be no larger than 12 inches in the direction of the
rocket axi? and 6 inches (chord) azimuthally, sharply reduced
the achievable angular field. They led to selection of a lens
that with an unobstructed view would provide a 800 x 600 field
(100' diagonal), and a maximum angle between the cylinder and
rocket long axis of only 340. The camera is mounted at this
angle with its optic axis intercepting the outer surface of
the rocket at 3.6 inches from the rear edge of the opening cut
into the skin (8.4 inches from the front edge), and with the
800 field direction aligned with the rocket's long axis so as
to maximize the length of beam in the image. Its objective
lens is unobscured in a 400 x 600-wide field, and partially
obscured by the rocket at the front edge of the opening over
an adjoining about 230 x 400 -wide field. The camera can "see"l
the ejected beams, with reduced effective aperture ratio due
to this vignetting by the viewing port, to within 1/3 m of the
accelerator anode; when the electron beam is injected along
the geomagnetic field direction, 7 m of its length is in the
camera field. (Note: under the beam-plasma discharge condi-
tions of EXCEDE: Spectral the volume emission rate increased
extremely sharply toward the accelerator within the first few
meters (Ref 20).)
97
In summary: the camera's optic axis points at an
elevation angle of 340 from the rocket's long axis in the
plane defined by this axis and the centerline of the ejected
beam. Its principal point is 2-1/2 m behind the accelerator,
1-7/8 inches inside rocket's outside skin, and 5/8 inch in
front of the rear edge of the 12 inch long (by 6 inch wide)
opening in the skin. The optic axis intercepts the axis of
the magnetically-undeflected beam at 3 m from the camera's
objective lens.
VIDEO CAMERA CALIBRATION
The full S-20 wavelength response of the camera's
photocathode is used, both to increase response to air fluor-
escence excited by the electron beams and to provide sensitivity
to the various radiations from/by the ejected ion beams. This
standard spectral response is given in the Manual (and of course
elsewhere), and is summarized in Table 7.
The photometric and photogrammetric calibration of the
5.7mm lens (which we performed in connection with the work
reported in Ref 2) are shown in Figure 26. The data below
refer to the region within - 250 of the camera axis;
radiometric calibrations for points further off-axis can be
directly determined from the irradiance-transfer curve in Fig
26, which also gives the scene angle-to-video image (geometric)
factor.
The video camera's contrast sensitivity and photometric
response characteristic were determined using the uniform low-
brightness (LBS-2) standard source transilluminating a bar
target and a step tablet. Reference is made to the fact that
the spectral radiance of this tungsten source increases by a
factor 100 between the 3750A and 7660A tenth-power
photon sensitivity points of the camera (the short-wavelength
limit is set by the transmission of its objective lens);
98
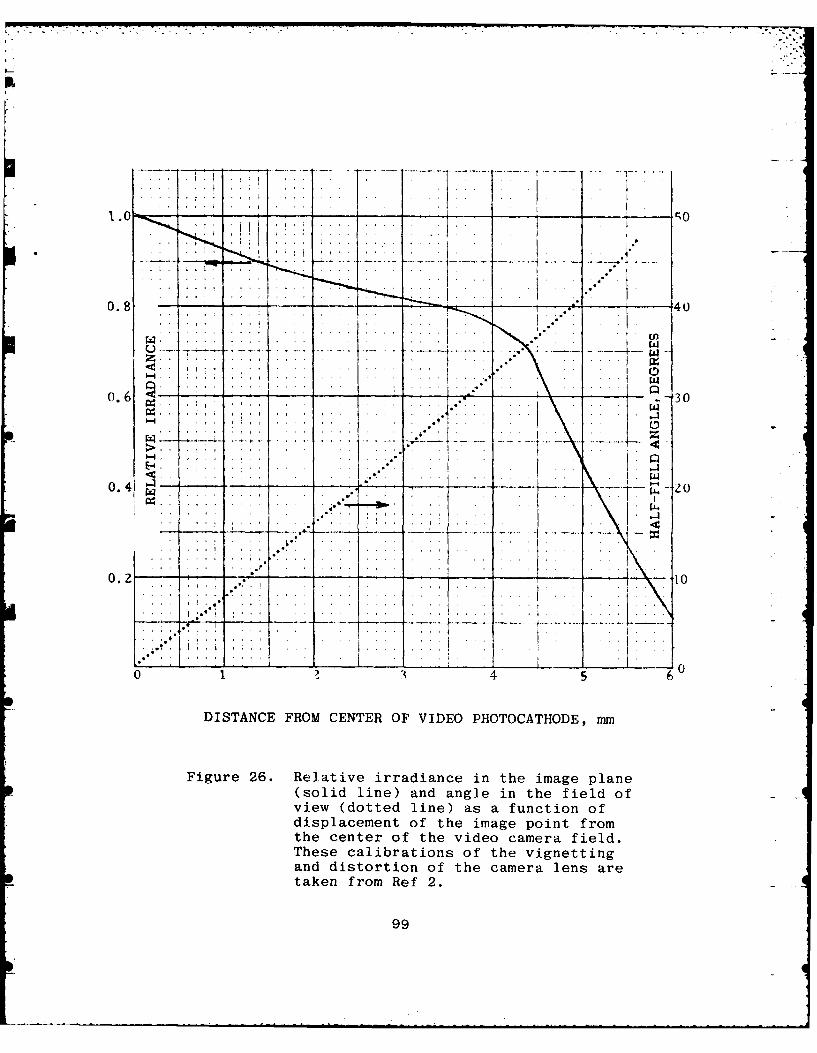
1.4.
...i l ..... .. ..
I-•'
0.4
* -20
O .... .. ... . .. . . ..
0 3 . 4 560
DISTANCE FROM CENTER OF VIDEO PHOTOCATHODE, mm
Figure 26. Relative irradiance in the image plane(solid line) and angle in the field ofview (dotted line) as a function ofdisplacement of the image point fromthe center of the video camera field.These calibrations of the vignettingand distortion of the camera lens aretaken from Ref 2.
99
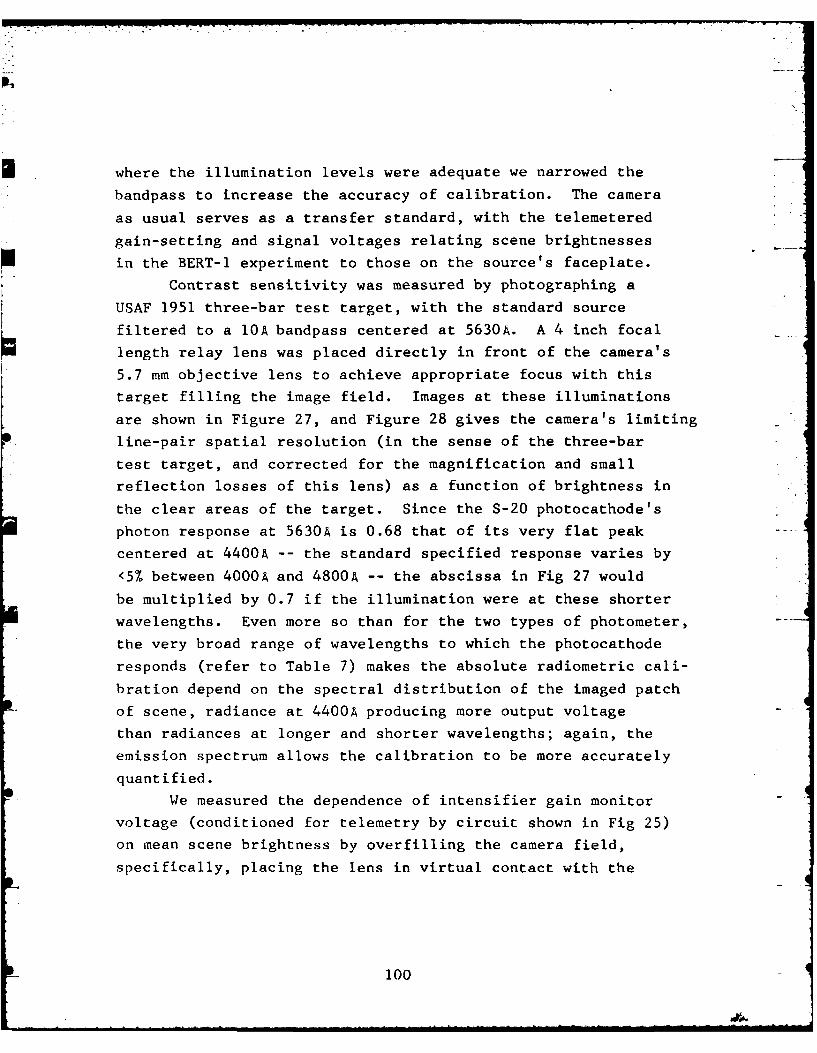
where the illumination levels were adequate we narrowed the
bandpass to increase the accuracy of calibration. The camera
as usual serves as a transfer standard, with the telemetered
gain-setting and signal voltages relating scene brightnesses
in the BERT-i experiment to those on the source's faceplate.
Contrast sensitivity was measured by photographing a
USAF 1951 three-bar test target, with the standard source
filtered to a 10A bandpass centered at 5630A. A 4 inch focal
length relay lens was placed directly in front of the camera's
5.7 mm objective lens to achieve appropriate focus with this
target filling the image field. Images at these illuminations
are shown in Figure 27, and Figure 28 gives the camera's limiting
line-pair spatial resolution (in the sense of the three-bar
test target, and corrected for the magnification and small
reflection losses of this lens) as a function of brightness in
the clear areas of the target. Since the S-20 photocathode 's
photon response at 5630A is 0.68 that of its very flat peak
centered at 4400 A -- the standard specified response varies by
<5% between 4000A and 4800A -- the abscissa in Fig 27 would
be multiplied by 0.7 if the illumination were at these shorter
wavelengths. Even more so than for the two types of photometer,
the very broad range of wavelengths to which the photocathode
responds (refer to Table 7) makes the absolute radiometric cali-
bration depend on the spectral distribution of the imaged patch
of scene, radiance at 4400A producing more output voltage
than radiances at longer and shorter wavelengths; again, the
emission spectrum allows the calibration to be more accurately
quantified.
Ile measured the dependence of intensifier gain monitor
voltage (conditioned for telemetry by circuit shown in Fig 25)
on mean scene brightness by overfilling the camera field,
specifically, placing the lens in virtual contact with the
100
Figure 27. Resolution of the video camera at relative meanilluminations 16.7:4.2:1, in 5630 ± 5A light.In the original 1/10 sec photographs of the _video monitor the line pairs in Group 2, Element4 can be resolved at the lowest illumination inthis series. Note the decrease of video con-trast with average scene brightness.
101
5-
, , , , , " dl i id - -| . . -- m ina l d . ... . . . . " . .. . ... . . . . - - . . . . . .

30-Limit -31 TV Lines/mm
320
10
I I I
9 18 27 36
INTEGRATED BRIGHTNESS, kR-SEC
Figure 28. Visual resolution of the videocamera determined from 1/10 secexposures of the USAF bar chart(from Figure 27), 5630A illumina-tion.
102
uniform source's surface. To achieve sufficient brightness it
was necessary to maintain the source unfiltered; we calculated
the equivalent monochromatic radiance at 4400A from its
spectral radiance and the S-20 photocathode's response (the
effect of decreasing lens transmission below 3900A is
negligible in this calibration). The results, graphed in
Figure 29, show that the automatic control circuitry adjusts
the video system to full gain when the mean scene radiance is
less than about 100 kilorayleighs. Thus the intensifier video
gain would be expected to be fixed at its maximum over much
if not most of the BERT-I experiment. We also found that the
camera system produced video output signal readily detectable
over noise, -0.05 volts, at a mean scene illumination of 2/3
kilorayleigh (4400A; near the center of the field).
The response time of the video feedback loop was 0.1 to
0.2 sec for factor-2 changes in scene brightness at most
mean brightnesses. However the complex circuitry was found to
operate nonlinearly near the onset of maximum intensifier gain,
with the hysteresis effect shown in Fig 29. For example in
that range a factor-lO step increase in brightness resulted
in a 3-sec gain undershoot followed by damped noise, while a
similar decrease also required 3 sec to stabilize.
We calibrated the video output voltage signal by trans-
illuminating a 21-step Eastman Kodak photographic tablet.
With the standard source filtered to 5630 ± 5A (to maximize
photometric accuracy) and the remainder of the field masked
off, the video control circuitry provided maximum gain; other
gain voltages were produced by uncovering this source area
and/or operating the source with the wider-band Wratten 55 and
BG-18 (green) filters. The 4-inch lens was again placed in
front of the operational 5.7-mm focal length lens to produce
acceptable-size video images of the individual steps, and
103
. . . . . . . . . . . . . . .. . ... i h i . . . . . . . . i I I i l | H i ... .. . .. . . .4
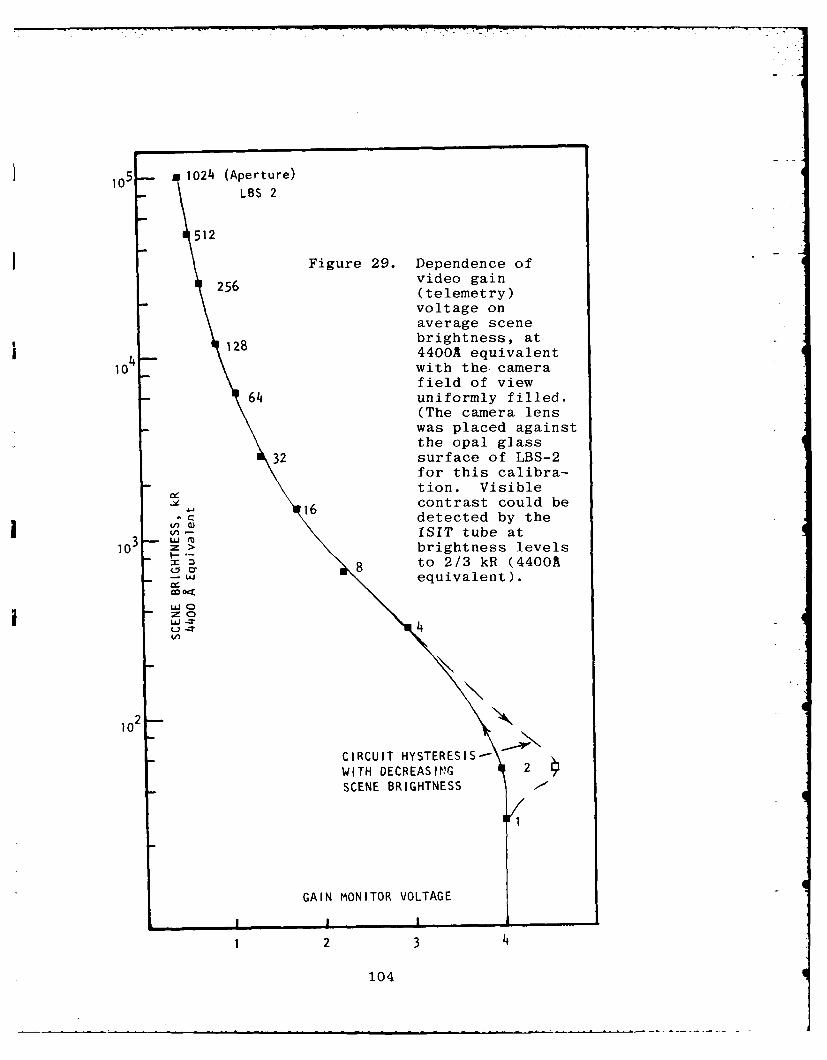
105 _ 1024 (Aperture)LBS 2
512
Figure 29. Dependence of25 video gainS256 (telemetry)
voltage onaverage scene
18 _brightness, at128 4400A equivalent
1 0 with the. camerafield of view
64 uniformly filled.(The camera lens
was placed againstthe opal glass
32 surface of LBS-2for this calibra-tion. Visiblecontrast could be16l detected by the
ISIT tube at10 . brightness levels
x8 to 2/3 kR (4400Ac LI equivalent).
wo 0= 0
1 o2 \4 ,
CIRCUIT HYSTERESIS- 2WITH DECREASING 2
SCENE BRIGHTNESS
1
GAIN MONITOR VOLTAGE
I I I ____
1 2 3
104

its small transmission loss was considered in the calibration.
With appropriate triggering of an oscilloscope trace the
video output voltages as a function of position on the tablet --
a ledge each time the radiance changes, by factors a2 --
were displayed on the screen and photographed.
Absolut- paraxial calibration for the camera at full
gain is shown in Figure 30, and relative calibration for other
gain monitor voltages in Figure 31. The absolute calibration
at these latter gain settings follows from normalizing to the
data in Fig 30. For points in the scene at angles >250 to the
optic axis, the response is reduced by the factor graphed in
Fig 26. It was necessary to use the BG18-W55 combination to
realize sufficient source radiance to reach the higher output
voltage in the full-gain calibration; with the radiance normal-
ized to the narrow-band measurement, this introduces only a
small error in the resulting scene brightness-to-output voltagetransfer function.
SUMMARY
This Section documents the optical, mechanical, and
electrical design of the sensors built by PhotoMetrics forBERT-i, and the information needed for installing and maintain-
ing the instruments in the rocket. It provides the appropriate
radiometric calibrations with descriptions of methods for
checking calibration and other performance parameters with
equipment available to AFGL's payload integration staff. A
background on the selection and design of the optical sensors
is in the Design Evaluation Report (see Table 6); particulars
of the purchased parts of the video camera system are in its
operating manual and report of factory acceptance tests; and
further details of the instruments and their calibration are
maintained in PhotoMetrics' laboratory notebooks.
105105_

(Field of view not uniformly filled)
-500
c/
Ln0
LA -
z >
SUi
300 ca7
wO0
z C)7Lii _:r
Un
-100
"v2/3kR Minimum Detectable Scene BrightnessI I I I I I I II 1 -
0.5 1.0 1.5
VIDEO VOLTAGE LEVEL
Figure 30. Dependence of video output voltage level(at maximum amplifier gain) on averagescene brightness at 4400A. A set ofbrightnesses was generated by trans-illuminating a standard step tabletpressed against the opal glass ofLBS-2. This source was imaged onto theISIT faceplate using the camera's 5.7 mmlens and an intermediate (relay) 102 mmlens.
106
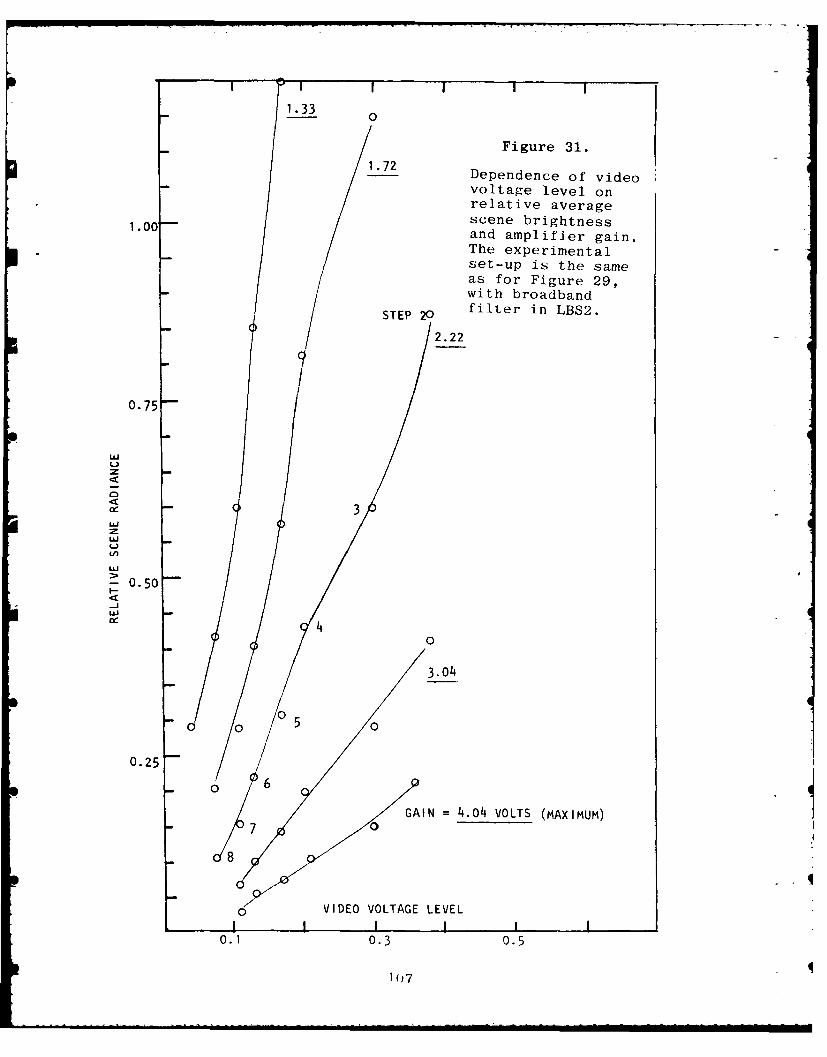
1.33
Figure 31./ 1.72 .1.72 Dependence of video
voltage level onrelative average
10 scene brightness1.00 /and amplifier gain.The experimentalset-up is the sameas for Figure 29,with broadband
STEP 20 filter in LBS2.
2.22
0.75 -
z
0.50
6 .04
00
3.o
zz
0 0 VIE 5OTG 0EE
0 0.5~11
0 6
GAIN 4.04 VOLTS (MAXIMUM)
8
0 VIDEO VOLTAGE LEVEL
0.1 0.3 0.5
10~74

REFERENCES
1. W. Bernstein, H. Leinbach, P.J. Kellogg, S.J. Monson,and T. Hallinan, Further laboratory measurements ofthe beam-plasma discharge, J. Geophy- Res 84, 7271(1979).
2. I.L. Kofsky, D.P. Villanucci, and R.B. Sluder,Evaluation of Infrared Simulation Data, DNA 5521F(26 Nov 80).
3. B.N. Maehlum, K. Maseide, K. Aarsnes, A. Egeland,B. Grandal, J. Holtet, T.A. Jacobsen, N.C. Maynard,F. Soeraas, J. Stadsnes, E.V. Thrane, and J. Troeim,Polar 5 -- An electron accelerator experiment withinan aurora, Papers 1-4, Planet. Space. Sci. 28,259-319 (1979).
4. R.J. Jost, H.R. Anderson, and J.0. McGarity, Electronenergy distributions measured during electron beam-plasma interactions, Geophys. Res. Lett. 7, 509 (1980).
5. G.R.J. Duprat, B.A. Whalen, A.G. McNamara, and W.Bernstein, Measurements of the stability of energeticelectron beams in the ionosphere, J. Geophys. Res 88,3095 (1983).
6. S.T. Lai and H.A. Cohen, Electron Beam Trajectory ina Photometer Field of View, AFGL-TR-83-0045, 1983,AD A131949.
7. Instruction Manual for Photometer Model VI-06, Visidyne(Burlington, MA) Report VI-572, November 1980.
8. R. H. Eather and D.J. Reasoner, Spectrophotometry offaint light sources with a tilting filter photometer,Appl. Opt. 8, 227 (1969).
9. J.R. Winckler, Electron beams for magnetosphericresearch, Rev's Geophys. Space Phys. 18, 659 (1980).
10. P.M. Banks, C.R. Chappell, and A.F. Nagy, A new modelfor interaction of auroral electrons with the atmo-sphere: Spectral degradation, backscatter, opticalemission, and ionization, J. Geophys. Res. 79, 1459(1974).
11. A. Vallance Jones, Auroral spectroscopy, Space Sci.Rev's 11, 776 (1971).
108

12. T.L. Stephens and A.L. Klein, Electron Energy Deposi-tion in the Atmosphere, (General Electric TEMPO, SantaBarbara, CA) GE-75-TMP-7, 1975.
13. D.C. Cartwright, S. Trajmar, A. C. Chutjian, and W.Williams, Electron impact excitation of N2 , Phys.Rev A16, 1041 (1977).
14. W.L. Borst and C. Zipf, Cross-sections for electronimpact excitation of the 0,0 First Negative band of N2from threshold to 3 keV, Phys. Rev. Al, 834 (1970).
15. J.W. McConkey and I.D. Latimer, Absolute cross-sections for simultaneous ionization and excitationof N2 by electron impact, Proc. Phys. Soc. 86, 463(1965).
16. A.E. Hedin, C.A. Reber, N.W. Spencer, H.C. Brinton,and D.C. Kayser, Global model of longitude/UT varia-tions in thermospheric composition and temperature pbased on mass spectrometer data, J. Geophys. Res.84, 1 (1979).
17. H.E. Coffey, Geomagnetic and solar data, J. Geophys.Res. 87, 3628 (1982).
18. M. Imami and W.L. Borst, Electron excitation of the0,0 Second Positive band of nitrogen from thresholdto 1000 eV, J. Chem. Phys. 61, 1115 (1974).
19. C.B. Opal, W.K. Peterson, and E.C. Beaty, Measure-ments of secondary-electron spectra produced by pelectron impact ionization of a number of simple gases,J. Chem. Phys. 55, 4100 (1971).
20. I.L. Kofsky, R.B. Sluder, and D.P. Villanucci, Onboardradiometric photography of Excede Spectral's ejectedelectron beam, in Artificial Particle Beams in Space pPlasma Studies (ed. B. Grandal), Plenum, New York,1982, pp 2 1 7 -2 2 8 .
21. P.W. Tarr, Arctic Code Electron Deposition Theorywith Application to Project Excede, DNA 3636T, 18 Jun 75.
22. A. Konradi, W. Bernstein, D. Bulgher, J.L. Winkler, Jr.,and J.0. McGarity, Laboratory studies of the beam-plasma discharge, abstract of paper at the (ESA)International Symposium on Active Experiments in Space,Alpbach, 24-28 May 1983.
23. K. Papadopoulos, private communication (1983).
109
24. R.E. Leadon, A.J. Woods, E.P. Wenaas, and H.H. Klein,An Analytical Investigation of Emitting Probes in anIonized Plasma, Jaycor (San Diego, CA) Report J200-250A/2172, 1981.
25. J.R. Winckler, The application of artificial electronbeams to magnetospheric research, Rev's Geophys. SpacePhys. 18, 659 (1980).
26. L.M. Linson and K. Papadopoulos, Review of the Statusof Theory and Experiment for Injection of EnergeticElectron Beams in Space, Science Applications, Inc.(La Jolla, CA) Report LAPS 65, 1980.
110 p

II
APPENDIXES
BACKGROUND
In the course of the program PhotoMetrics participated
in formal and informal conferences at AFGL on issues related
to those addressed in the the SCEX and BERT-i experiments, in
connection with which we prepared and submitted the technical
memorandums reproduced here. Some of this effort was in
support of concepts for validating the performance of future
spaceborne particle-beam weapons systems under the real con-
ditions of low altitude orbits, which are being advanced in
view of the expectation that the effects of vehicle charging,
beam neutralization and return currents, outgassing, and 0
collective interactions with the atmosphere will degrade
alignment and integrity of ejected neutral and charged
particle beams. (Reference is made to the fact that neutral-
particle beams are accompanied by comparably intense fluxes of p
charged particles.)
Not reproduced here are reports on brightness and
transport of MeV neutral beams, atmospheric beam applications,
suggested laboratory measurements of arcing along surfaces of
injection structures, and on a site visit to Johnson Space
Center's Chamber A and Rice University's Department of Space
Physics and Astronomy's electron beam interactions group
(Houston, TX; air fare for these conferences was paid by Photo-
Metrics). In support of the program's particle beam validation
aspect, a PhotoMetrics staff member attended the DARPA Technical
Interchange Meeting on Exoatmospheric Neutral Particle Beam
Technology (17-18 Nov 1981, at Huntsville, AL), all expenses
for which were paid by the company rather than contract funds.
PhotoMetrics also participated in various beam-injection
program planning and review exercises held by AFGL, in
111
-- --- - v--- - .- -
particular those of 28-30 Oct 1981, 23 Jun 81 (at which we made
a presentation reviewing optical diagnostics and monitoring
in megavolt particle beam ejection experiments), and 10 Mar 82
(AFGL's Definition Study of High Energy Accelerators for Space
Applications).
TOPICS
The specific topics covered in the attached Appendixes
I-IX are as follows.I. Optical sensing of water vapor outgassed
from charge-ejection rockets. It is shown
that the concentration of water vapor within
the beam interaction volume can be measured
from the radiance in spectroscopic emission
features of H and OH excited by impact of
electrons on H2 0 molecules. This outgassing,
which is almost invariably observed from
sounding rockets, is expected to play an
important part in ignition of discharges by
injected particle beams and (through its
serving as a source of secondary electrons,
as described in Section II) in excitation of
nitrogen molecule features.
II. Optical measurement of ambient N2 densities,
shown to be insensitive to the ratio of
intensities of molecular bands.
111. Heating of the atmosphere by neutral particle
beams from space vehicles, reviewed and
shown to be small under all realistically-
achievable injection conditions. (The
concept had been suggested by an AFGL staff
member.)
112
IV. Potential damage to spacecraft components
from the charging-up of vehicle surfaces
by impact of neutral particles.
VII. Status and application of the GEODSS satellite-
tracking cameras (White Sands Missile Range,
NM) in diagnostics of electron and ion beams
injected into the atmosphere.
VIII. Review of interactions of charged-particle
beams with the earth's atmosphere.
IX. Calculation of the magnitude of artificial
enhancement of the ionosphere's electron
density. The increase is shown to be small
under achievable particle-beam conditions,
with no clearly identifiable application to
defensive systems.
113
APPENDIX I
NOTES ON OPTICAL EXCITATION OF WATER VAPORBY ENERGETIC-ELECTRON IMPACT
Laboratory
Most of the emissions below lpm are from dissociation ofH20 into OH (3064A, 2810A A-X electronic bands), H (Lyman VUV-EUV and Balmer visible series), and 0 (8446 and 7774A permittedmultiplets, 1304A resonance and 1356A lines). The H20 moleculeitself does not have strong bands in this region, but does radiatein the infrared as discussed below. A general reference is J.J.Olivero, R.W. Stagat, and A.E.S. Green, J. Geophys. Res. 77, 4997(1972). The cross-sections for exciting the vl, v2, and v3 bandsof H20 at 2.74, 6.27, and
2 .6 6 pm in Fig 3 of that reference areincorrect and have been superseded in work reported by F. Linderand G. Seng, J. Phys. B9, 2539 (1976).
Electron impact on H 20 results in excitation of only thefirst, second and perhaps third vibrational state of the groundstate of 011 (Fujita et al., J. Phys. Chem. 86, 1427 (1982)).(Some of the H atom's Brackett and Paschen series lines arealso seen in the NIR spectrum.) Thus only the Meinel bandsoriginating from these low-lying vibrational states, ratherthan those from states up to 9 present in the chemiluminousairglow, appear in the electron-excited emission spectrum.
Atmosphere
Polar 5's photometer measured a 11 /N2+ 4278A ratio ofabout 1/10 (K. Maseide, abstract of 1981 NATO Advanced ResearchInstitute on Artificial Particle Beams in Space Plasma Physics,(Geilo); this paper did not appear in the published Proceedings).This translates to a local relative concentration of about 11120 per 4 N 2 molecules.
At EXCEDE: Spectral (7A, 3 kV; maximum altitude 128 km)the following features were seen/not seen:
Lyman series (<1216,1): No spectral coverage
OH 1,0 2810A: Yes; 011 0,0 3064: No coverage
Balmer , Yes
01 8446, 7774i,: No coverage (these lines are alsodirectly excited from 02 and 0)
2.7pm ul, v3: Yes; 6.3pm v2: Yes
>~17wm rotational: Yes.
114
Profiles of altitude intensities in these features have not beenquantified because the data are not yet adequately reduced.The Ho/4278A ratio from a spectrum in the visible at 118 kmupleg also indicates 1 H20/4 N2 molecules.
No other spectroscopic measurements have been made on electronbeam excited water vapor in the upper atmosphere. The presenceof substantial vapor pressures near rockets and satellites iswell substantiated by mass spectrometer measurements on ShuttleOrbiter (G. Carignan, R. Narcisi) and other vehicles such asEXCEDE SWIR (Narcisi).
Selection of a Feature for Measurement
Most Lyman series lines of H are at wavelengths that cannotbe isolated from 0 and N2 fluorescence features by filterphotometry. Spectrometers, whose lower throughput is notmatched to the rapid changes in injected current and voltageplanned for BERT-i, would not provide adequate signal/noise.
OH 3064A is at least a factor 20 more intense than any of theother OH electronic bands. The feature lies between the N2 SecondPositive's &v = -2 and 6v = -1 sequences, where the fluorescencebackground from other band systems is fortunately also extremelylow. Plate 3 of Gaydon and Pearse's The Identification ofMolecular Spectra (Chapman and Hall, London, 1965) shows thisband as a contaminant in a laboratory discharge through N2. Onlymodest effort is needed to make focusing optical systems atthis wavelength. 3064A is the prime candidate for onboardoptical measurement of H2 concentrations near sounding rockets.
Ha at 6563A is overlaid by v 3 N2 First Positive bands,and Hy at 4340A by the 0,4 N2 Second Positive band at 4344A.Ha at 4861A is reasonably clear and is in fact used by ground-based photometers to assess the proton aurora. Its intensity ismost likely 1/6 that of OH 3064A. In fact, the H./3064A ratiois an excellent measure of the flux of soft (-<40 eV) electrons --that is, of discharge phenomena -- , perhaps even better than the3914A/3805A measurement that we attempted at SCEX.
The 0 lines are also excited by electron impact on 02 and 0,and thus do not serve well to measure H20 concentrations.
OH fundamental bands near 2 .7 pm are weak and require cooledradiometers, as do H20's
6 .3 pm and longer wavelength features.All these infrared vibrational bands have radiative lifetimes->20 millisec, which weakens the emission within the fast-moving fields of rocketborne spectroradiometers.
In sum: OH 3064A is the most effective choice for onboardoptical remote sensing of H20, and 110 at 4861f second choice.
115
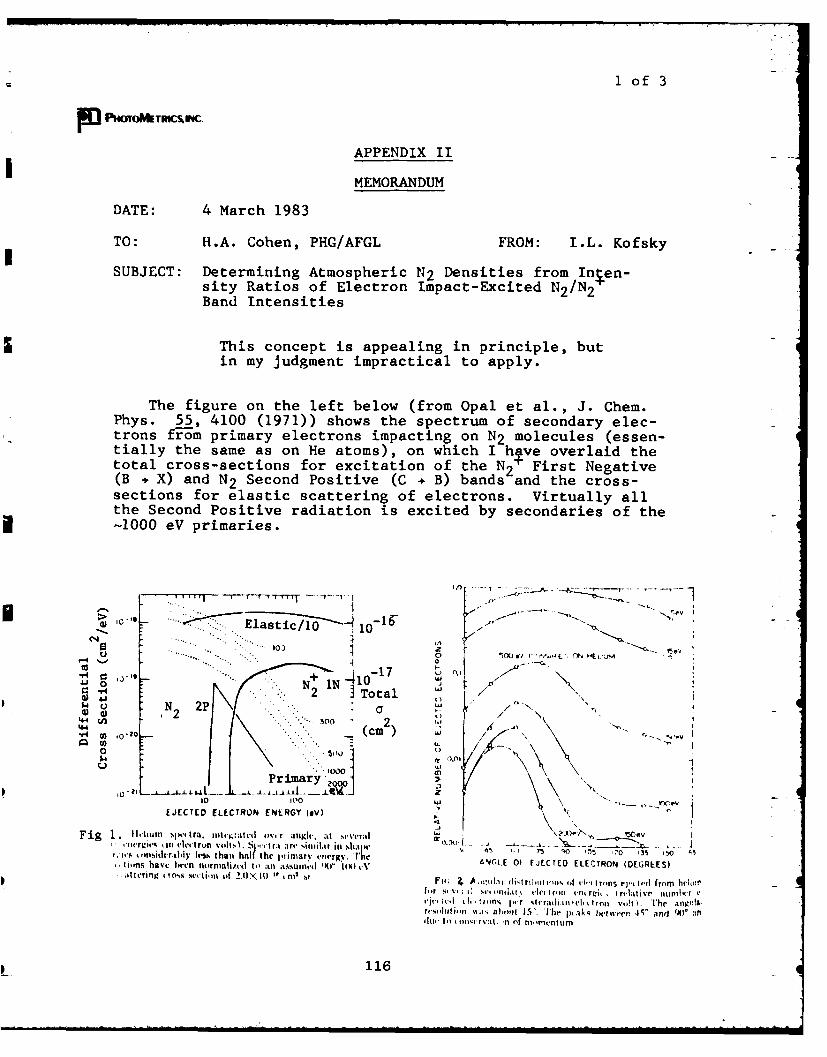
1 of 3
~3P10TOWMRCS*4C.
APPENDIX II
MEMORANDUM
DATE: 4 March 1983
TO: H.A. Cohen, PHG/AFGL FROM: I.L. Kofsky
SUBJECT: Determining Atmospheric N 2 Densities from Inen-sity Ratios of Electron Impact-Excited N2 /N2Band Intensities
This concept is appealing in principle, butin my judgment impractical to apply.
The figure on the left below (from Opal et al., J. Chem.Phys. 55, 4100 (1971)) shows the spectrum of secondary elec-trons from primary electrons impacting on N2 molecules (essen-tially the same as on He atoms), on which I hIve overlaid thetotal cross-sections for excitation of the N2 First Negative(B + X) and N 2 Second Positive (C + B) bands and the cross-sections for elastic scattering of electrons. Virtually allthe Second Positive radiation is excited by secondaries of the-1000 eV primaries.
1 -t --0 _6
0 l10
" ..... . 0 +auc 1 - .- ,
0 -0N N11i2 Total$ U N 2P • '
; ~cm2) \4 .,e 4 / ....W \2
200
. . . .._ r..v .
EJECTED ELtCTRON ENERGY leVI 2Fig 1 IIthunt k . ira, uahot l. , ',l :r ligh', at srverrnl \ i.)e'A 150ev
It,,,trgitr tI ed r u lf i s)l.- . l,., t r; fire .siil.il in .slutla. "~i1 - -
, .ie'. ,.I id¢rtll)' le-ss thanl half the i~tritarv elterlg. "/'he 4 75L Of a TE ELCT O (DEGRE So ",iins hive Itt.en normalizvtl I' an .usunie.d 'X litIA ANEO JCE EEVO DGES-i lering ro.a .erti~n of !.Ox It) '' ,nil .r ri,;~ A :.dlti-i ditrri,.,iis ,of ti- .rns ej. 'd' from hdriu
t..r v '; i i i e~i r '( oin t.h r'!il reII4ltive nlr.ri' 'e'l I!,.n- l..tr srritiillt'lv,'tlon s'. "Ihe- alDIW'?&
Z'' o n ..! a.ttiti 3'. 1 lie I. a l.coeeo 45 and 1i4
116
2 of 3
Secondaries with kinetic energy >19 eV can also excite N +First Negative radiation, and since there are substantialnumbers of the latter (as the graph shows, the probability-2fexciting a secondary with energy ES decreases only with ES )in practice between one-third and one-half of the total FirstNegative radiation is due to impact on Nq of secondary electrons.
The rate of production of all secondary electrons is pro-portional to [M], the local concentration of all atmosphericspecies. (More strictly speaking, it is about proportional tothe total number of orbital electrons per unit volume, whichin turn is about proportional to [M]). Consider only theexcitation within a restricted volume, whose characteristicdimension is small compared to the collisional mean free pathof either primaries or secondaries. This is the physicalsituation that applies to onboard-rocket measurements ofirradiance from the glow, in which the effective viewed volumeis a few meters on a side and the particle mean free pathI areof the order of kilometes ( olecular cross-sections _10- 5 cm2 xmolecular densities -10 U/cm )
The optical "signals" from the two band systems for afixed primary current i are then
Signal (N2 2P) - ai[M] x [N2] (all secondaries)Signal (N2+ 1N) - bi[M] x [N2 1 + ci [N2] (two sources),
where a, b, and c are constants. Were it possible to keep allthe First Negative emission within an instrument's filled fieldof view, b[M [11 2 ]/c[N 2 ] would turn out to be between 1/2 and 1;the uncertainties in cross-sections of competing collisionprocesses (e + 0 for example) preclude improving the accuracyof this ratio of relative excitations.
Next let's look more closely at the actual trajectories ofthe secondary electrons and the excitation that lies within tilefields of real photometers. The right-hand figure (also fromthe above reference) shows the angular distribution of thesecondary electrons as they are ejected from air atoms. Notethat the low-energy secondaries are ejected more or less iso-tropically from the track of the initial electron beam, andthe higher-energy secondaries go more tcward the beam direction.Clearly, the two band systems are not being excited in the samevolumes of space: the First Negative clusters principally nearthe initial beam, while the Second Positive (and also theFirst Positive, B + A N2 bands) comes from a wider volume.This effect shows clearly in color photographs of electronbeams in air or N2 : a blue core is surrounded by a purple(blue 2P + red 1P) halo.
117

3of 3
How can the irradiances produced at the photometer by thisdiffuse spray of poly-energetic electrons be calculated? Recallthat the secondaries spiral around the magnetic field, withthese in the 10 - 70 eV energy range that excites Second Positivehaving maximum radius of curvature of a few 10's of cm; theyalso elastically scatter off all molecules and atoms beforeexciting N2 (see figure), and excite 0 and 02 as well. (Atthe typically 200 km altitude at which the electron beam isejected, [N2]/[M] is about 1/2.)
Clearly the problem calls for computer solution, mostlikely by a Monte Carlo procedure. Even with a detailed andcareful calculation, however, errors in cross-sections (whichlead to errors in the parameters b[M] and c above) and impre-cision of the geometry and [N2 ]/[M] ratio would be likely toresult in substantial uncertainty in the calculated relativeirradiances from the two band systems. As a result, the [N2 ]profile information extracted from the ratios of in-band irrad-iances (or of radiances, if small field, imaging-detectors(cameras) are employed) is unlikely to be more accurate thanextrapolations aided by theoretical modeling.
In summary, while the ratio of irradiances in SecondPositive and First Negative bands is useful for assessingdepartures of the secondary-electron spectrum from the impact-excited distribution shown in the left-hand figure, quantitative[N2] profiles cannot be effectively extracted because of theinherent imprecision of the necessary supporting calculations.
L
11m
Page 1 of 2
~PNWOT TR'C. APPENDIX III
MEMORANDUM S
DATE: 18 January 1982
TO: Lt. R. Davis, AFCL/PIG
FROM: I.L. Kofsky, PhotoMetrics, Inc.
SUBJECT: Heating of the Atmosphere by Neutral Beams ("Snowball")
I have made some simple and approximate calculations of theamount of atmospheric plasma production and heating that could beexpected from neutral particle beams of the intensities currentlyplanned from spaceborne accelerators. The conclusion is, that tneirradiated air's fractional ionization and temperature riseare insufficient to produce any collective "snowball" effectsuch as mentioned in your memo of 04 Jan 82.
The detailed calculation is reasonably complex and looksto be an interesting exercise -- you may want to try it, todevelop scaling rules. In any case, I'd appreciate some checkon my method.
I started with the canonical threat, as follows. S
1 amper of H, 100 MeV/particle-- 4000 cmi area natural spread after
propagating -1000 km (this areaturns out to be uncritigal)
-- 1 sec pulse length (6 x 10particles/pulse, 2.5 x 10
- 5
kilotons total energy).
In addition I neglected any effect of lateral movement of thebeam due to the spacecraft's motion in its 1 sec duration,which of course would have the effect of lowering the dosedeposited in a unit volume and thus reducing the plasma density.
I considered two segments of the particle trajectories,when they make their first atmospheric ionizations and nearthe end of their range. Near their first ionizations horizontaldiffusion of the target air during the 1-sec pulse spreads outthe energy input, and near the end of the particles' rangetheir lateral spreading due to multiple Coulomb scatteringlowers the flux densities. Curiously in each case the spreadis about 200 meters laterally. The rate of ionizng -exci~rngenergy loss by 100 MeV 11 atoms is 6 MeV per sm/cm z (3xl0i ° ev cm2 /target particle) and A peak rate of 1000 MeV per gm/cm2 isreached at 0.32 MeV (at which energy a nadir-directed beam haspenetrated to 40 km altitude in the atmosphere).
119

Page 2 of 2
100 MeV atoms. The aforementioned rate of energy lossindicates that the first ionizations take place near 100 km.At this altitude the diffusion coefficient D in the undistur-bed atmosphere is about 100 9r 2/sec; thus the rms lateraltransport of molecules (4Dt)i12 is 20000 cm in 1 sec. Theeffect hve Irea in which the beam deposits energy is therefore4 x 100 cm , so the specific energy deposit is
(3 x I0-16 eV cm2 /target par~icle) x(6 x 101 8 H gtoms/4 x 108 cm ) =
4 x 10- eV/target particle.
This is very small indeed, resulting in a temperature rise ofless than 1/10 degree K and a fractional ionization 10 - 7 .
1 MeV protons. The incoming beam then 1) multiply Coulombscatters to spread over a much larger area and 2) having becomecharged, is bent in the earth's magnetic field. For therecord, the Larmor radius of a 100 MeV proton directed perpend-icular to the field is 16,700 meters, and when the energy fallsto 1 Mev it is 1670 meters. The beam is thus bent many km fromits initial path before stopping.
The mean spreading of protons in the atmosphere during slow-down is undoubtedly calculated somewhere, but I couldn't find anyreference. I made an approximate calculation with Moliere's formula
2 /E2
Orad = 0.157 x Z2 /A x tgm/cm /EMeV)
where Z2 /A (= 7/2 for N2 ) are the atomic number and weight of thescattering species and t the thickness traversed. The result isagain a spread of some 200 meters. (This is much larger than thediffusion length at 40 km altitude.) Since specific ionizationincreases by a factor 169 between 100 MeV and - 1/2 MeV, theenergy deposit is - 10- eV/target particle. I would expectthis small figure would be further reduced somewhat by rangestraggling of the protons.
Wrapup: The spread of either 1) the irradiated air or2) the initial now-ionized hydrogen atom beam reduces the en-ergy deposited per molecule of atmosphere to well be iw thatrequired for collective stopping effects, for 6 x 10¹⁰-particle 100 MeV beams. Note that the result doesn't dependon the area of the beam from the accelerator before it stri~esthe a mosphere, provided that area is less than about (00)meter5.
120
I of 2
APPENDIX IV
Memo to: H. A. Cohen, AFGL/PHG 17 December 1981
From: I. L. Kofsky, PhotoMetrics
Subject: a) Chargeup of Spacecraft Irradiated by NeutralParticle Beams
b) Implications for Future Research of the"Charging" Damage or Kill Mechanism
It doesn't seem to be generally appreciated thatirradiation by neutral particle beams produces a net surfacecharge on target spacecraft, and that the magnitude of thischargeup depends on the energy of the incident beam. Ifchargeup can be qualified as a mechanism for kill or damageof complex military targets, it will probably turn out possibleto use much lower energy neutral particle beams -- 1 MeV oreven less -- than presently in DARPA's current concept forweaponization. Thus the whole direction of the NPBthrust would be changed.
However, until we have some firm ideas about how thechargeup phenomena affect spacecraft systems we won't havemuch credibility with the missile/satellite defense community.While charge ejection may have done serious damage at Scatha,you don't have any reliable scaling to what will happen tohardened electronics. I would suggest some tests in spacechambers to get some further ideas about the mechanisms bywhich surface charging can impair performance of militarycircuitry.
Here are the principal mechanisms by which an initiallyneutral energetic particle beam charges surface:,.
1) Sputtering. Both positive and negative ions aresputtered off (as well as neutral atoms). Absolute yieldsdepend in a non-simple way on the ionization potential andelectron affinity of the target atom, and at keV incidentenergies of the incident atom; this means that differentialchargeup (with potential lateral sparking) can result whenadjacent different materials are irradiated.
Since H atoms mass-mismatch most atoms present in thefirst few atom layers of spacecraft surfaces, the sputteryields of atoms are low at 10's keV incident energy -- of theorder of 10-9. For Li the mean yields would be an order ofmagnitude higher, with negative ions where electron affinitiesare positive because alkalis are good electron donors. Imade a brief search for sputter yields at multi-Mev incidence,but so far I haven't turned up anything on the energy scaling;you may want to assign Davis to sort out this issue.
121
2 of 2
FPIOTO~kTRK-%INC.
2) Secondary electron emission. The yield depends onmaterial properties, so again some differential chargeupwould result. This topic also merits investigation/quantitationby your staff.
3) Forward knock-ons. This looks to be rather difficultto calculate, and I doubt that there exists much experimentaldata about it. In any case, the target will have protuberancesof thickness less than the range of the incident parti-le,and as the particle passes out not only will it be (perhapsmultiply) charged but it will be accompanied by a spray ofions and atoms and "secondary" electrons. All this is overand above the meson and electron-positron and proton showerthat Prof. Olbert reminded us of, which sets in at about 200MeV. Stating this somewhat differently, those particlesthat pass through the target are likely to produce ratherunpredictable surface-spacecraft charging effects. The secon-daries come out with generally high energies, so they aren'tlikely to return to discharge the vehicle.
I should point out that these knock-on phenomena takeplace at surfaces in the interior of the vehicle also, forexample on electronic chips, when the incoming beam particlespenetrate that far. This might be a more effective damagemechanism than the bulk energy deposition being consideredin the millions - $ programs that we heard about at therecent meeting. In this regard, it is also worth pointingout that some surface charging of electronics takes placeunder bombardment by other ionizing radiations, so it ishighly possible that the effect may already be included inexisting lumped-parameter TREES measurements/data.
It is instructive to estimate what the magnitude of thecharging might be. The canonical threat is something like1014 H atoms per cm2 sec. Taking the net y~eld of chargedparticles emitted f om the surface as 10- , e get 100nanocoulombs per cm each second. Over a 1 m area, it'sas if the object is emitting one milliamp.
I believe it would be useful to learn how this exteriorcharging scales with the energy of a neutral H or D or Libeam. I expect that a little library investigation wouldshow that there is a maximum at hundreds of kilovolts, whichchanges completely the kind of accelerator technology neededto make space weapons (provided, of course, that chargeup ofsurfaces represents a real threat to ICBM's and other putativetargets).
122
1 of 3
PHT[ kRC0C APPENDIX VIIa
MEMORANDUM
DATE: 26 January 1981
TO: H.A. Cohen, AFGL/PHG FROM: I.L. Kofsky
SUBJECT: Long-Focus, Fast Cameras Available at Stallion Site,White Sands Missile Range
I have investigated the "GEODSS" optical satellite trackingcapabilities at WSMR for potential application to imaging the particlebeams from BERT-2. The array of cameras, which are normallyapplied in military satellite surveillance, would appear to be un-matched by those at other potential rocket launch sites. Some ofthese video cameras were used to image PRECEDE, and R. Sluderarranged for their operation at SCSR-I. Individuals in charge of thetwo independent facilities are listed after the technical data.
Available Cameras - Specifications
A. Lincoln Lab Experimental Test Site - largely developmental.
2 each 31 inch diameter' f/5 165 in , I ° field or
f/2.5 83 in fl, 20 field
14 in diameter, coaligned w/31 inch unitf/1. 7 70 field.
Image plane has 700 lines across fieldNoise equivalgnt radiance ,- 2 kR at f/2. 5Scan rate 0. 5 /sec maximumTracking under computer control, no
current real-time connection to ainy radarcapable of tracking a WSMR rocket.However an automatic mage analysis-based)tracker is due to go on line shortly
Astronomical mount for telescopesLow Light Level video imageryElaborate computer control and image processing.
B. GEODSS Site - to be operational April 1981 (Provisional data)
3 each Same dual system, except the largertelescope has a 40 inch aperture.Also no radar connection.Photometric calibration somewhatquestionable.
TOTAL: 5 dual telescope/cameras.
123

2of 3
PuRnoIzkmcs.VW_
Technical
The angular velocity of A3I. 003's (SCSl-i trajfectoryfr,)mStallion isshown in the attached graph. The rate of change of angle is always afactor > 2 less than the maximum allowable for manual or automatictracking. If DERT-2 has a similar trajectory it would be rea-lilyfollowed by these narrow-field cameras.
Taking 700 lines across the 10 field for a high contrast target(Lincoln data), we find a spatial"resolution" of -6 meters when therocket is at 200 km from the camera. While 6 meters is worse thanthe resolution we'd want, and on the edge for checking Strickland-Jasperse's ideas, I doubt that faster telescopes will be identified nearany practical rocket launch site. The nominal seeing limit at thatrange due to atmospheric turbulence is 2 meters.
Brightness limitations of the glows may force the use of thef/. 5, 2 field option. In this case lateral spatial resolution becomes12 meters at 200 km rocket range. Berger-.Tasperse-Stricklandsingle-particle theory indicates a narrow-5 keV electron beam growsto - 50 m In diameter in the E (and F) region.
The 10 field does not encompass the full electron beams depositionat any altitude above --120 km. Multiple small-field cameras would,illow in-n ging oif the rocket region at several positions along the beam.Multiple images of the si.,ie area permit coadding to improve signal/noise. In sum, good use can always bemade of eachf othe 5cameras.
Cost of achieving real-time tracking of the camers by WSMR rocket-tracking radars is not yet determined.
124

3 of 3
70
50!
ELEVATION, Degrees
10 .. ....
APOGEE 260 km
H SUMES Vh 0.196 km/sec
FROM STALLION SITE
. .. .. . .. .. . .. .... . ...
.
ELEVATION RATE,,.1..F
de/e g 9 *I fe i TM FE ANH e
0121
1of I
PHOMEkTWCINC. APPENDIX VIIb
MEMORANDUM
DATE: 23 February 1981
TO: H.A. Cohen, AFGL/PHG FROM: I.L. Kofsky
SUBJECT: Visit to GEODSS Stallion Site, NM, 6 Feb 81 (night)
Please refer to memorandum of 26 Jan 81 for backgroundon the application of the Lincoln Laboratory experimentaland USAF operational cameras for imaging BERT-2 electronand ion beam excited glows.
Contacts: Richard Ramsey, LLDavid Beatty, who tracked one camera-
telescope for PRECEDE-II, 23 Dec 77Howard M. Rathjen, Site Manager for TRW.
As the TRW site was not yet in operation, I was unableto arrange an evening tour. TRW is making a big marketingissue of their running GEODSS astrometrical cameras, haveprinted up a slick six page brochure promoting new business.I judge it will be necessary to go through Air Forcechannels to get useful cooperation from them.
The TRW cameras (there are 2 40 inchers, rather than the3 1 statedin my previous memo) have much higher trackingrates (3-6*/sec) than Lincoln's, and can follow the rocketeasily. Lincoln (]0/seq)can also follow if the trajectoryis similar to SCSR-I. The TRW cameras have about 1/10the exposure "speed" of Lincoln's, as they have aweaker and less noisy image amplifier for compatibility withautomatic moving-image tracking computers. They scan at1.8 Hz (not 30).
The two Lincoln cameras have a 2:1 electronic zoom thathas the effect of increasing (worsening) the effectivef/number by a factor 2 to gain a factor 2 in magnification.Its automatic image follower is still "in preparation"(contact: Dr. Andrew Wandrop Jr, x7843).
Important: LL's current video receiver has considerableimage ooming, which is a benefit in tracking stars andsatellites (image dimension providing a direct measure ofstellar magnitude) but a severe drawback if the lateraldimensions of the air-fluorescence streak is to be deter-mined to test Strickland-Jasperse's beam energy depositionmodel. Fortunately the camera is to be replaced soon by aCCD array. I will follow up with Lincoln.
126
1 of 8
J P4oMTRIMCSINc APPENDIX VIII
MEMORANDUM
DATE: 30 December 1980
TO: H.A. Cohen FROM: I.L. Kofsky
SUBJECT: Interactions between Charged-Particle Beams andthe Earth's Atmosphere -- Technical Issuesand Requiired Measurements
Scenario. A capability to eject from space vehicleshigh-currentsof -3 - 3000 keV electrons, ions ofvarious masses, and also neutral atoms will bedeveloped in the next decade. Questions exist aboutthe propagation and stability of these particle beamsas they interact with the atmosphere and magneto-sphere, as outlined here. Our discussion will focuson the issues of longitudinal and transverse transportof the initial beam energy, with a view toward militaryapplications, rather than on use of charge ejection forgeophysical characterization per se (as exemplifiedby electron echo, E-parallel-to-B, "anomalousresistivity" and RF wave generation experiments).Recommendations for optical and other diagnosticmeasurements on ejected beams follow an outlineof currently identified technical problems.
1. Issues
1. 1 Potential DoD Applications
The major currently-perceived DoD applications of ejectedparticle beams, other than direct spacecraft-system damage, are
- mapping of the geomagnetic field, by measure-ments in conjugate areas
- simulating the excitation of the atmosphereby energetic charged particles emitted fromnuclear explosions, which produces radiationat various infrared wavelengths that presentsincreased background and clutter to IRsurveillance systems (the "Excede" concept)
serving as antennas for VLF-ELF radiation,potentially for communication with submarines(the conducting path substituting for a longmetallic wire)
- producing directly ionospheric "blackout, "electromagnetic wave-reflecting layers, and als ofalse infrared targets
127

2 of 8
I R - triggering aurora, which has the effect ofproducing the aforementioned blackout andredout phenomena.
The first two applications relate to mitigation and production of effects onmilitary systems of strategic high-altitude nuclear explosions.For example, a knowledge of the geomagnetic field configurationand the boundary of closed field lines would be needed to plan locationof explosions that would result in excess ionospheric electron densitiesnear the conjugate region, to produce radiofrequency communicationsand radar blackout. The Excede conceptwhich is funded by theDefense Nuclear Agency, is relatively straightforward; spectrometersand radiometers onboard the charge-eiection rocket measure thespectral yield in wavelength bands of detection-discrimination systems.
The antenna application is still in the concept stage, and toour knowledge has not received official support from DoD. It wastried, with indifferent results, on NASA rocket 27.010 AE (08 Apr 78),by frequency-modulating a 4 kV, 60 ma beam. Direct production ofradiocommunications or radar blackout requires -megawatts ofdeposited energy, and so appears impractical (please refer to theaccompanying memo dated 23 Dec 80). On the other hand, theconcept of producing a short-lived reflecting or refracting iono-spheric layer for over-the-horizon communication or radar probing,or a false infrared-emitting target that might impair performance ofan IR launch or satellite detection system, may prove to be of futureinterest. The idea of "spoofing" or "decoying" infrared surveillanceor tracking systems with moving patches of radiating atmosphere hasparticular initial appeal.
Triggering of aurora (precipitation into the atmosphere of5 keV electrons) by introducing instabilities and turbulence in the
magnetosphere is also an experimentally untried concept, althoughmuch theoretical work has been done. Further attempts to introduceinstabilities by releases of plasma clouds - in particular, withbarium ions - are scheduled (Firewheel is an example).
We note that further findings about the properties of theparticle beam-atmosphere interaction may elicit other applicationsof this technology. The applications listed above are merely thosethat have so far surfaced.
1. 2. Technical Issues
At present no accurate prediction can be made of theenergy and spatial distribution of beams traversing the magnetosphereor ionosphere. Additionally there is only rudimentary understandingof the disturbances they produce in the ionosphere-magnetosphere,for example by exciting return currents. In brief, reliable descrip-tions of where the beam energy will go, how much infrared-radiation
128
3 of 8
IW-WHOTOETRcM
and radiofrequency power it (and the disturbed ionosphere) willgenerate, and how much it will be accelerated or decelerated byelectric fields, cannot now be made.
1. 2.1 Beam Origin
In many cases an ejected beam of particles of asingle charge is not monochromatic before "interacting" with theatmosphere or magnetosphere, for the following reasons. Adischarge of some kind usually develops to assist the back flow ofambient plasma in maintaining the vehicle at the typical ~- 100 Vpotential (unless the spacecraft is artificially neutralized,as notedbelow); thus excess slow electrons are injected into the flux tubealong with the beam. I, as postulated for moderate- to high -currentconditions, there develops a beam-plasma discharge of the typeclearly identified in laboratory low-pressure tanks, the beam willbe "heated"; that is, it will contain not only secondary electrons ofenergy comparable to the ionization potential of N ,OV, and 0, butalso be spread about the initial accelerator potenta toward bothhigher and lower energies. The effect of the two heating phenomenais shown in the figure attached.
In short, neutralization and secondary-productionprocesses in the vicinity of the ejection vehicle degrade the "initial"beam. This degradation can be minimized by ejecting charge of theopposite sign, or better still plasma, from the spacecraft. None-theless it is necessary that the input energy spectrum be known toremove confusion between "source" - and "interaction" -generatedprocesses.
1. 2. 2 Linear Processes
There exist at least six theoretical models ofindividual- particle transport in the atmosphere, which considermultiple Coulomb scattering by atomic nuclei, production of secondaryelectrons (ionization) by direct impact, and magnetic confinement.Most recently, one of these models, developed under support ofAFGL, has predicted a factor 3 less lateral spreading than thevarious others (paper SA 56, EQS 61, 1060 (1980)). There appearsto be sufficient uncertainty in some of the basic interaction cross-sections, and in the computational methods and approximations, toresult in this large a discrepancy.
The occasional delay of electron echoes frommagnetic mirroring at the conjugate hemisphere (seen in the ARAKSprogram) represents a second type of uncertainty, which is perhapsdue to deceleration by magnetos pheric electric fields.
129)
4 of 8
3POOMTRCS~C.
1.2.3 Nonlinear Processes
As noted in Section 1.2. 1, nonlinearities in theneighborhood of the particle accelerator have the effect of spreadingthe distribution of energies of the beam particles. By "nonlinearities,"we mean physical phenomena that impact the beam's energv andspatial distribution not proportionately to the current andprimary acceleration voltage, or to atmosphert-ionosphere para-meters such as neutral species and ion density and local magneticfield strength and gradients. Discharges, space charge limiting,and ionosphere depletions are all examples of nonlinear phenomena.
At issue is the extent to which nonlinear processesaffect the trajectory of the beam at distances from the spacecraftlarge compared to some characteristic "origin" dimension: thevolume of ionosphere from which the neutralizing charge originates,the range to the first focusing node (- 35 m in the ionosphere for10 keV electrons) or perhaps the spacecraft's length.
Transverse and longitudinal spreading due tomutual repulsion represent one type of nonlinearity. Ab initiocalculations are inexact because of the shielding provided by theambient and beam-induced ionosphere. In near-relativistic beams -for example, of '. 1 MeV electrons - the magnetic force between
charged particles in large part compensates the lateral electrostaticrepulsion.
Beams of sufficiently high current and energydeposition rate heat the local atmosphere to "blowout, " to make ashort-lived low-pressure channel for propagation of later-arrivingparticles. This principle is applied in beam-weapon systems.While it would appear improbable that the power levels needed toachieve this extreme condition would be soon reached by space-borne accelerators, heating begins to deplete or even (by convection)enhance the eposition path when the fractional ionization densityreaches 10 ". Th~charge passing a unit a~ea neededit' achieve thiscongition is 2 x 10 100 keV electrons/cm or 2 x 10 3 keV electrons/cm . I at is, about 1 microcoulomb - 14A for I sec - passing througha 1 cm area of air deposits sufficient energy to heat and so expandthe volume, changing the ambient air density encountered by thelater-arriving particles.
2. Measurements
2.1. Onboard
A characterization of the particle beam's energy spectrumand angular and spatial distribution before it begins to interact withthe atmosphere is needed in order to clarify and quantify the interaction
130
5 of 8
processes. That is to say, the "input" function must be measuredor otherwise known if the interaction phenomena are to be sorted outfrom the phenomena that accompany beam production and ejectionfrom the spacecraft.
What this means is, that measurements on the beam shouldbe made from the spacecraft as well as from remote stations.Specifically, the usual measurements of backscattered electron andion energy spectra, vehicle potential, return current distributions,plasma densities and temperatures, and RF spectra, along withextensive optical diagnr sis (more on this momentarily) would be madefrom the spacecraft. if practical these in situ and remote-sensingmeasurements would also be made from daughter vehicles, tethers,or long booms, to map out conditions near the accelerator.
For example, the energy spectrum in the beam could besampled by probes of dimensions much smaller than the Larmorradius placed, say, 20 meters from the ejection spacecraft proper.A measurement that provides somewhat similar but definitely lessprecise data is the spectrum of continuous and discrete x-rays excitedin small (again compared to the Larmor radius) high-Z targets by thebeam particles. The bremsstrahlung and line radiation intensity,appropriately unfolded, provides a measure of the beam's spectraldistribution (as in the recent tank experiments by Jost 2
Electron beams are not self-luminous, and thus not observableoptically until they impact ambient (or spacecraft-generated) atoms.Geometries can be envisaged in which the atmosphere below an orbitingspacecraft or sounding rocket, where the beam impacts, could beviewed from onboard - in particular. Space Shuttle could readilyachieve this capability.
Some ions, on the other hand, would be self-luminous byvirtue of their emission from metastable states excited in the dischargeof the* source. The velocity distribution in the ejected ion beamcoul d determined by Fabry-Perot interferometry of these emissionlines. This measurement, which is also within the capability ofShuttle (optical Fabry-Perot interferometers are planned for iono-spheric wind measurements, for example), would determine thedistribution in speeds of ejected ions, which are expected to be"spread" because of space charge repulsion.
Several of the remote measurements on the beam notedin th t subsection following could be made from onboard, or fromdaughter vehicles or shuttle "free fliers," as will become apparentfrom the discussion. Additionally, there is a possibility forobservations from vehicles guided to intercept the beam path tomeasure in situ the free electron density distribution produced bythe energiic- charged particles; as this type of operation is expensiveand chancy, we do not consider it further here.
131

6 of 8
2. 2 Remote Measurements
2.2.1 Imaging
As the critical measurement type is images of theair fluorescence excited by the beam, we discuss this topic first. - _
To date, the cameras deployed for this purpose have been with oneor two exceptions (principally, the GEODSS units) less than optimumin sensitivity and angular resolution. What is needed is an angularresolution that will permit measurement of the beam's "diameter"and (more strictly applicable) transverse radiance distribution each- 5 meters. More than one camera (or time-sharing of one largecamera) might be needed to accommodate the full length of the energy- 0deposition streak, which is typically 20, 000 meters. In a sense, thespacecraft or sounding rocket should be moved to the location of suchtelescope-cameras, rather than attempting to procure the camera(s)for the beam- interaction experiments.
Specifying the camera further, we would require1) radar tracking to maintain the beam in the narrow field needed toachieve this order of resolution; 2) image intensification in the imageplane; 3) a focal length of at least 1 meter to spread the imagesufficiently across this plane; 4) radiometric calibration. Alsoneeded is thorough calibration of the spread function of the camerasystem, and of its hysteresis (image-sticking) properties. Fromthe measured spread function as a function of irradiance or fluenceat the image planeand the initial data, the "width" of the beam canbe deconvolved.
We note also that the camera(s) should have sufficientsensitivity to record the end-point range of the beam. This isimportant because the aforementioned "hot" primary electronshave increased penetration. Radiometric calibration permits thebrightness distribution in the streak's long direction to be determined.From this brightness distribution the initial energy distribution inthe beam can be deconvolved (in principle, at least).
To summarize, the prime measurement is gualitimager . The beam should be located where precision opticalmeasurements can be made by $1- lOM-class telescope-cameras.The camera is not an adjunct of the experiment,but rather is theheart of it.
2. 2. 2 Other Optical Diagnostics
The spectral distribution of the air excited by the beamrovides another measure of its energy distribution. A second primestrument would be a slitless wavelength-dispersing spectrograph,
oriented so that the beam itself forms the slit (much like was
132
-
7 of 8
done with chemical release trails). This instrument would also beradar tracked to hold the beam in a single position and so buildup signal/noise. The spectral range should extenf from 0. 35 to0.45gp, to encompass the main features of the N First Negativeand N 2 Second Positive band sequences. The ratlo in these featuresis a measure of the "temperature" of the beam. (This is the issuecurrently being worked on by M. Chamberlain of PhotoMetrics, forpotential application to SCEX.)
This measurement could also be made with telescopefilter photometers, as has to some extent been done in the Excedeseries. The higher throughput of these instruments is in part com-pensated by their limited number of spectral features resolved(two, or three).
The spectrograph should also have low scatteredlight, to permit measurement of any "plasma" continuum radiationsfrom the beam volume. Further, the spectrometer or telescopedphotometers would view serially along sections of beam, to isolatedifferences in spectrum as a function of penetration altitude.
We note that various other spectral features alsotransfer information about particle energy distributions. Most ofthese, however, either lie in wavelength regions attenuated by theatmosphere (the UV features of the N triplet mainfold) or are notsufficiently spectrally isolated for abiolute radiometry (most NFirst Positive bands). This issue of selecting bands merits futherconsideration, particularly in light of the improving sensitivity ofinstruments that respond to infrared wavelengths transmitted bythe atmosphere.
Additionally, many beam instabilities are accompaniedor even manifested by brightness or irradiance "flicker"at frequenciesunder -100 Hs. Ground photometry should have sufficient light-collecting area to resolve these temporal variations, preferably byviewing at individual positions along the beam (in N2 First Negativeband light).
2. 2. 3 Other Instruments
Instruments for diagnosis of backscatter from theatmosphere below the spacecraft or from the conjugate hemispherehave been applied in the Araks and Electron Echo experiments, andneed little further description. As an example, electron spectro-meters onboard the ejection spacecraft would be set up to measurethe "echo" from downward-directed pulses of electrons or ions, soas to determine the backscatter intensity and velocity distribution.Daughter vehicles carrying similar spectrometers and plasma density/
133
• . - " i I I I I I I I I I . . . . . . . . .. . III I . . . . . . I - --lll . . . . - -.. . . . . . .-I- - -

8 of 8
~JPMTO~kTcSIPNc.
temperature probes would determine the lateral distribution of thebackscatter, that is, the drift or diffusion across the magnetic fieldlines. Another important measurement that should be made onboard(and where possible on daughter vehicles) is the angular distributionof the backscattered particles, to determine pitch angle degradation.
As is well known, the radiofrequency spectrum of thebeam is a further critical diagnostic measure. Because of absorption(filtering) by the ionosphere, the RF data to date are at presentsomewhat ambiguous. More and better receivers are needed toachieve proper diagnosis.
Radar reflection is a further measure of ion-cloudparameters. However, since the data are usually so difficult tointerpret, further planning would be needed to consider the effective-ness of this technology.
2.2.4 Laboratory Tank Experiments
A coherent program of measurements on beam-atmosphere interactions would entail a series of simulations andscaled- experiments in a large vacuum tank. This principle, which iscertainly self-evident, has been adopted by NASA for its Shuttlebeam-ejection programs.
3. Sumn-ary
We have outlined the perceived DoD applications of intenseparticle beams interacting with the atmosphere and magnetosphere,identified the principal propagation issues, and reviewed briefly thetypes of measurement needed to clarify the physical processes.Characterization of the "input" beam is needed to quantify the inter-action. The principal diagnostic remains optical imaging (andspectroscopy, which also involves imaging), which for full effectivenessrequires telescope -cameras of throughput considerably higher thangenerally applied in the past. Measurements from onboard the space-craft and/or daughter vehicles complement those made from groundstations.
Attachment
134
8 of 8
~3PHMoWkTmm
......... .... ...
~-DUE TO SLOW-f
0 -. PLASMA ELECTRNS .
- BERGER-SELTZER
JATP 32, 1015 (1970)
I- P->-i--- 4- DUE To
____ E - 1 .. LECTRONS
DISTANCE ALONG STREAK, gm/cm2
135

1 of 1
APPENDIX IX
F PHOTMTRWAM. MEMORANDUMl
DATE: 23 December 1980
TO: H.A. Cohen FROM: I.L. Kofsky
SUBJECT: Artificial Ionosphere Enhancements Produced byDeposited Electron or Ion Beam Energy
1. Plasma density increases and their effects on communicationat all frequencies -- HF in particular -- was a major issue innuclear explosion effects up to perhaps 5 years ago. Graduallyit was recognized that the path and link redundancy of the DoDcommunications network made "strategic" nuclear bursts designedfor this purpose ineffective. The matter is not now underactive consideration, the only element of it still thoughtimportant being F-region plasma irregularities, which impactUHF-VHF satellite communications(hence barium releases by DoD).I doubt that interest could be developed for the small-scaleenhancement of the E or F region that, practically speaking,could be produced (see 3), below).
2. On the other hand there might be interest in a short-livedartificial ionosphere off which over-the-horizon communicationsor radar waves could be bounced. AFGL is actively working inOTH radar detection.
3. The energy needed is beyond that achi vable in prctice.To cover even so small an area as (31 km) - 2000 km to thenecessary D-region density of 10 electrons/cm in a 20 kmaltitude layer takes I megawatt. Specifically
ein pair production ratea) electrondensity = / effective recombination coefficient 0
= 10 6 cm 3/sec in the D region; therefore
production rate z (105 ) x 10 = 10 4 pairs/cm3 sec.
b) Power input into the 20 x 10 5 x 10 x 1010 cd volume
1 i 34 eV x1.6x 10-1 9 W sec3cm sec pair eV
19 3=16X 2X 109 cm = 10 watts.
The enhancement is largely recombined about 20 sec after thebeam has been turned off; it also takes about this time tobuild up, so that 10 6 watts must be input for at least 20 sec.
136

.44,
4 .4.
i4L,
3 ;
* 441
WWI \
06
X4 ' 4- *
*V) ev 7,
x .