smip13 seminar proceedings recent developments and …...smip13 seminar proceedings 101 recent...
TRANSCRIPT

SMIP13 Seminar Proceedings
101
RECENT DEVELOPMENTS AND STATUS OF THE CALIFORNIA STRONG MOTION INSTRUMENTATION PROGRAM
Anthony Shakal and Moh Huang
California Strong Motion Instrumentation Program California Geological Survey, Sacramento, California
Abstract
This paper reviews the recent accomplishments and current status of the California Strong Motion Instrumental Program. With the completion of the instrumentation of the new San Francisco Oakland Bay Bridge, all major bridges in California will have been instrumented, as well as the BART tube, two tunnels and a new series of hospitals and new geotechnical arrays. New approaches to instrumentation in recent years are discussed. The current state of instrumentation accomplished by the program is summarized.
Introduction
The California Strong Motion Instrumentation Program was started after the 1971 San Fernando earthquake, in which there was significant amount of structural damage and relatively few recordings of strong shaking. In the 40 years since, CSMIP has instrumented many sites and structures and important strong motion records have been obtained. Accelerographic instruments have significantly improved during this period, and the last of the original instruments installed are now being replaced. The Strong Motion Instrumentation Advisory Committee (SMIAC) has provided important ongoing input and advice to the program. This paper summarizes CSMIP status and recent developments in the instrumentation of bridges, buildings, geotechnical arrays and free field sites.
Instrumentation of Transportation Structures
Many bridges have been instrumented since CSMIP began to instrument bridges with Caltrans support after the 1989 Loma Prieta earthquake. There are currently 65 regular bridges instrumented, and all 10 of the major/toll bridges in California have been instrumented with extensive instrumentation. Fig. 1 shows the location of the eight toll bridges in the San Francisco Bay area, most being Caltrans structures (Golden Gate Bridge the exception).
SMIP13 Seminar Proceedings
102
Fig. 1. The eight major / toll bridges in the San Francisco Bay area. With the completion of the East Span of the San Francisco - Oakland Bay Bridge, all will have extensive strong motion instrumentation (map from http://bata.mtc.ca.gov/bridges/)
San-Francisco-Oakland Bay Bridge
A bridge with high current interest, opened to traffic on September 3, 2013, is the San Francisco – Oakland Bay Bridge (SFOBB), the east span of the San Francisco to Oakland bridge system of Interstate 80. Chief Bridge Engineer Brian Maroney of Caltrans described the construction challenges at the SMIP12 Seminar (Maroney, 2012). The bridge includes a self-anchored suspension section (SAS), an unusual structure and the signature architectural element of the bridge. The bridge can be considered as four separate structures, including the SAS, the Yerba Buena Island and Oakland landfall sections, and the Skyway, a long concrete structure over the Bay. Fig. 2 shows the sensor locations on the SAS section, which has 83 sensors, including 75 accelerometers, 6 tiltmeters and 2 relative displacement sensors. Since CSMIP worked with Caltrans early in the design process, sensor emplacements were included in the design plans. This allowed casings for the downhole sensors to be placed in several of the concrete piles when they were being poured during construction. Sensors are installed at the pile tip and key locations extending all the way to the tower top. (Since construction of the bridge is still being completed, some sensors are not yet installed, but should be by

SMIP13 Seminar Proceedings
103
early 2014.) The SAS also includes accelerometers on the main suspension cable to record its response. There will be a total of about 200 sensors on the new East Span.
In a project like this, a significant amount of the effort occurs in the detailed planning and blueprint development stage. This approach allows the sensor cabling and other components to be installed by electrical contractors along with the other systems, for lighting, corrosion control and communication, providing a more economical approach to achieve extensive instrumentation of a large structure.
Fig 2. Sensor layout for the Self Anchored Suspension (SAS) section of the new San Francisco - Oakland Bay Bridge. The instrumentation system was designed to capture important motions of the structure and includes sensors from the pile tip to the top of the tower, on the cables, the deck and other locations.
Bay Area Rapid Transit (BART) Transbay Tube
The BART Transbay tube, which carries subway traffic between Oakland and San Francisco, was completed in the early 1970s. It is an important transportation lifeline, carrying as many people during rush hour as the Bay Bridge.
SMIP13 Seminar Proceedings
104
A few accelerographs were installed when it was built, but in the end they were not maintained and were not operational, for example, during the 1989 Loma Prieta earthquake, the largest earthquake shaking at the structure since it was completed. The lack of what would have been critical information was noted in the Governors Board of Inquiry Report (Housner et al., 1990). In November 2004 a local bond measure was passed to fund the seismic upgrade of the tube, and strong motion instrumentation was included in the upgrade project. A special panel was convened by BART to plan a strong motion instrumentation system.
The BART tube is 3.6 miles (5.8 km) long, and is constructed of a series of 57 segments that were laid in a trench on the floor of the bay. The strong motion instrumentation was installed in the lower of the two rectangular passageways, or galleries, between the eastbound and westbound tubes. The strong motion system includes triaxial sensor sets at a series of locations along the length of the tube. A total of 40 sensors are installed, including 33 accelerometers, 4 extensometers and 3 relative displacement sensors. This system has the greatest linear extent of any system CSMIP has installed. To economize on cable lengths, and limit the maximum length, recorders were located at several locations along the length of the tube. They are linked together over the full length to achieve common triggering. Also, a GPS timing signal is provided to each recorder to synchronize the timing of the digital sampling in all recorders. The system came on line in late 2012, and no strong motion records have yet been obtained, although ambient motion records have been taken for analysis.
Instrumentation of Buildings
Understanding the response of a building requires that sensors be located near the perimeter of each of a series of floors along the building height, with all sensors recorded with a single time basis. This is in contrast with the three instruments required by some building codes, which provide very limited information. CSMIP began intensive instrumentation of buildings in the late 1970s, with central recording of accelerometers deployed on a number of floors. One of the first buildings instrumented, in 1978, was the Imperial County Services Building in El Centro. The M6.5 Imperial Valley earthquake occurred the following year, and the instrumentation system successfully measured the motion as the earthquake shaking damaged the building. This was a successful start to the building instrumentation effort. Since instrumentation of a building may cost as much as 10 freefield stations, there were reservations to commit to the expenditure. The success of the El Centro building recording reassured SMIP and the SMIAC advisory committee of the effectiveness of the overall plan. A long-term plan for the instrumentation of 400 buildings was laid out. A total of 235 buildings, including 60 hospitals with OSHPD support, have been instrumented to date.

SMIP13 Seminar Proceedings
105
San Francisco - 62-story Concrete Core Building
An unusual project completed last year was the instrumentation of a new 62-story residential building in San Francisco. It is of a new design, with a concrete central core. The interest in the building was such that after CGS developed an initial plan with 36 sensors distributed over the height of the building, the largest number to date, the USGS also became interested and proposed adding an additional 36 sensors. After a lengthy process to obtain permission from the condominium owners, and working out the details between CGS and the USGS for a joint instrumentation project, instrumentation was completed in late 2012, becoming the first building instrumented cooperatively by CGS and USGS (Huang et al., 2012). Sets of ambient motion data were recorded soon after the system was online, and Celebi et al. (2013) recently completed an effort analyzing the modes and modal periods of the building. Hospital Instrumentation
Soon after the 1989 Loma Prieta earthquake, SMIP began instrumenting hospitals with support of the Office of Statewide Planning and Development (OSHPD). Tokas and Lobo (2012) summarized key aspects of the OSHPD hospital seismic safety program and hospital instrumentation. During the OSHPD – CSMIP partnership, 60 hospital buildings have been instrumented. The instrumentation of hospital buildings according to a long term plan is being augmented by OSHPD with the instrumentation of existing hospital buildings being seismically strengthened and new hospitals incorporating specialized seismic provisions such as base isolation, dampers and the like.
CSMIP experience is that hospitals are generally difficult buildings to instrument well, because instrumentation work at key structural locations is often not compatible with the ongoing functions and patient services at the hospital. The ideal time to do effective instrumentation of a hospital is during construction, if possible, or at least before it opens to take patients. Location
Since the purpose of structural instrumentation is to record the motion of a structure during strong shaking, it is important that the structure be located where there is a reasonable likelihood that strong motion recordings will be obtained. The locations of the currently instrumented hospitals in California are shown on the map in Fig. 3. The map indicates a good correspondence between the locations of instrumented hospitals and the areas of higher likelihood of ground shaking over 20%g, according to current seismic hazard estimates (Petersen et al., 1996). This correspondence can only be accomplished if there is a step in the planning process to carefully consider shaking likelihood before the instrumentation decision is made, even if the structure is of a new type with receptive ownership.

SMIP13 Seminar Proceedings
106
Fig. 3. Map showing the locations of the hospital buildings instrumented under the CSMIP-OSHPD project and the probability of ground acceleration exceeding 20%g in 20 years.
Below-Building Instrumentation
A unique situation developed with a hospital now under construction in Ventura County. Soil-structure-interaction has been extensively studied in the past, but always with data from the free surface or basement. Measuring the motion in the third dimension, underneath the building, has been a longstanding goal. An

SMIP13 Seminar Proceedings
107
opportunity arose with a new building at the Port of Long Beach in 2010, and the necessary detailed planning was completed, but the construction of the building was unfortunately suspended as an economy measure.
The Ventura Memorial Hospital is being constructed in an area with liquefiable sediments. As a result, OSHPD required soil improvement by cement deep soil mixing (CDSM). As part of the overall project, it was decided to include downhole accelerometers in the deep soil improvement region beneath the building, complimented by measurement at depth in the unimproved parking lot area, away from the building. Work is now underway, and downhole instrument casings are in place under the building being built. The downhole casing for the subsurface instrument in the parking lot area is also completed. The downhole accelerometers will be installed during construction of the building, when the building itself will also be instrumented.
Instrumentation of Other Structures Dams
A significant number of dams were instrumented by CSMIP until the law was changed as discussed below. Recently the Division of Safety of Dam in the Department of Water Resources reinstituted support for the maintenance of instrumented dams. SMIP has 27 dams in the network at this time. All were initially instrumented with film instruments. Though the instrumentation at many dams has been upgraded, it has not been possible to upgrade some dams that have no available power on site, especially high in the Sierras. The interconnection cable meant to provide common starting often receives lightning damage, and some of the dams may be covered with 5 to 8 feet of snow in the winter. Work continues to address these challenges to upgrade the few remaining dams. Tunnels and Wharfs
The first tunnel instrumented in California was the Caldecott Tunnel Bore 3 near Oakland, in 1978. After 35 years, two more tunnels are being instrumented. The new Devils Slide Tunnels, constructed for the realignment of Highway 1 near Pacifica to avoid repeated landslides, were recently instrumented. Another tunnel still under construction is the Caldecott Bore 4, which will be instrumented prior to opening.
Other structures instrumented in recent years include wharf structures at the Ports of Oakland, Long Beach and Los Angeles. A second oil off-loading wharf is currently being instrumented near Richmond. Petroleum loading wharfs involve special challenges because of fire safety requirements, but their response is important to measure since they represent a critical lifeline.

SMIP13 Seminar Proceedings
108
Instrumentation of Geotechnical Arrays
Predicting the effects of the near surface geologic conditions on the motion occurring at the surface is an important problem. A key to progress is obtaining more data at a variety of site conditions. Toward that goal, SMIP has installed and maintains a significant number of geotechnical arrays. Each array consists of a vertically stacked series of triaxial accelerometer packages installed at depths chosen in consideration of the geologic conditions and soil profile. These downhole instruments are complemented by a triaxial package at the surface. The downhole instruments are locked in place in special casings surrounded by special grout targeted to be similar in seismic properties to the surrounding medium.
Array depth, the depth of the deepest accelerometer package, ranges from 77 feet to 825 feet (24 to 252 m). Fig. 4 shows typical array geometry. The example is
Fig 4. Layout of the Treasure Island Geotechnical Array sensors, from 400 ft (122 m) to the surface freefield. The P and S velocity profiles are also shown.
the Treasure Island array, near San Francisco, one of the first and deepest arrays, extending to 400 ft (122 m) depth. This array, like nearly all SMIP geotechnical

SMIP13 Seminar Proceedings
109
arrays, is a cooperative effort with another agency or agencies, in this case with NSF, EPRI and the USGS.
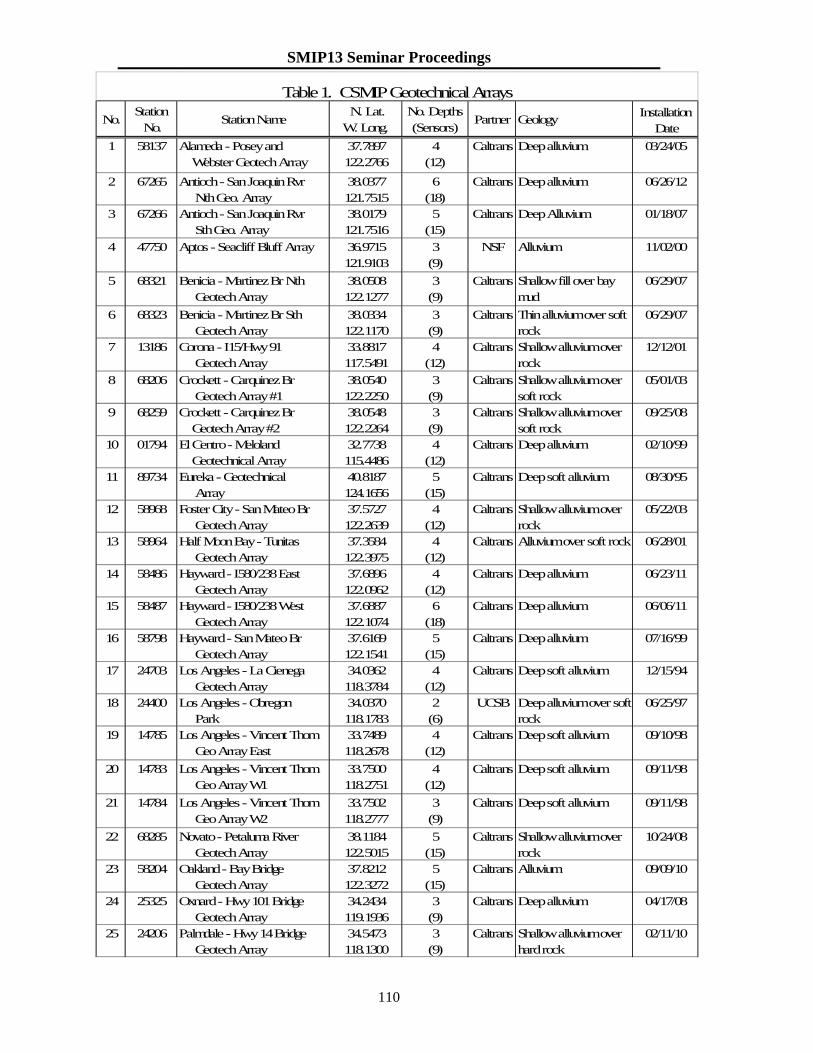
Table 1 lists the 38 geotechnical arrays installed and maintained by CSMIP as of fall 2013; four more are underway. The most frequent partner in the array projects is Caltrans, and many of the geotechnical arrays are on Caltrans rights-of-way near major bridges or transportation corridors.
Though not all arrays have recorded strong motion data yet, very interesting results have been obtained. Perhaps the most interesting set of data is from the Turkey Flat array near Parkfield, California for the 2004 Parkfield earthquake. A blind prediction experiment was conducted and unexpected results were obtained (e.g., Real et al., 2006; Shakal et al., 2006). The motion at the surface at the center of the alluvial valley, given the motion at an outcrop at the valley edge, was not successfully predicted, though many competent investigators, using the most modern methods, made predictions. Kramer (2009) and Kramer et al. (2011) summarized the lessons learned and implications for practice.
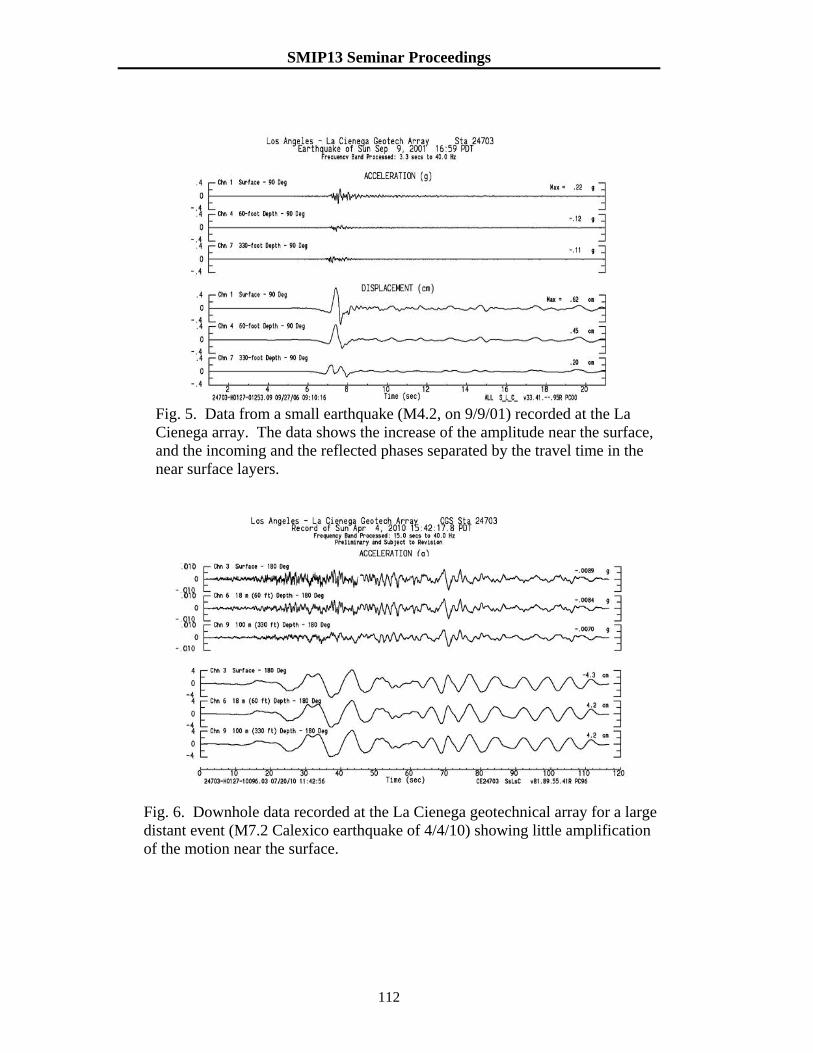
In general, it is well known that the amplitude of ground motion increases
near the surface. An example of the change of amplitude with depth is shown in Fig. 5. The motion with peak amplitude of 11%g at the 330 ft depth increased to 22% g at the surface. For recordings like this, from small magnitude simple events, the input and reflected motions, separated by travel time, can often be seen in the record. For larger, more complex events with more complex source time functions, this simple signature is not present, but the surface motion is still larger than at depth.
In contrast, the amplitude of the motion does not always increase near the surface, as shown in the records from a distant large earthquake (Fig. 6). In this case the dominant arriving waves are longer period surface waves, propagating horizontally, rather than body waves propagating vertically. For these long-period waves, there is no net increase near the surface. The near surface geology has little effect on the motion amplitude in this case.
SMIP13 Seminar Proceedings
110
No.Station No.
Station Name N. Lat.
W. Long.No. Depths(Sensors)
Partner GeologyInstallation
Date
1 58137 Alameda - Posey and Webster Geotech Array
37.7897 122.2766
4(12)
Caltrans Deep alluvium 03/24/05
2 67265 Antioch - San Joaquin Rvr Nth Geo. Array
38.0377 121.7515
6(18)
Caltrans Deep alluvium 06/26/12
3 67266 Antioch - San Joaquin Rvr Sth Geo. Array
38.0179 121.7516
5(15)
Caltrans Deep Alluvium 01/18/07
4 47750 Aptos - Seacliff Bluff Array 36.9715 121.9103
3(9)
NSF Alluvium 11/02/00
5 68321 Benicia - Martinez Br Nth Geotech Array
38.0508 122.1277
3(9)
Caltrans Shallow fill over bay mud
06/29/07
6 68323 Benicia - Martinez Br Sth Geotech Array
38.0334 122.1170
3(9)
Caltrans Thin alluvium over soft rock
06/29/07
7 13186 Corona - I15/Hwy 91 Geotech Array
33.8817 117.5491
4(12)
Caltrans Shallow alluvium over rock
12/12/01
8 68206 Crockett - Carquinez Br Geotech Array #1
38.0540 122.2250
3(9)
Caltrans Shallow alluvium over soft rock
05/01/03
9 68259 Crockett - Carquinez Br Geotech Array #2
38.0548 122.2264
3(9)
Caltrans Shallow alluvium over soft rock
09/25/08
10 01794 El Centro - Meloland Geotechnical Array
32.7738 115.4486
4(12)
Caltrans Deep alluvium 02/10/99
11 89734 Eureka - Geotechnical Array
40.8187 124.1656
5(15)
Caltrans Deep soft alluvium 08/30/95
12 58968 Foster City - San Mateo Br Geotech Array
37.5727 122.2639
4(12)
Caltrans Shallow alluvium over rock
05/22/03
13 58964 Half Moon Bay - Tunitas Geotech Array
37.3584 122.3975
4(12)
Caltrans Alluvium over soft rock 06/28/01
14 58486 Hayward - I580/238 East Geotech Array
37.6896 122.0962
4(12)
Caltrans Deep alluvium 06/23/11
15 58487 Hayward - I580/238 West Geotech Array
37.6887 122.1074
6(18)
Caltrans Deep alluvium 06/06/11
16 58798 Hayward - San Mateo Br Geotech Array
37.6169 122.1541
5(15)
Caltrans Deep alluvium 07/16/99
17 24703 Los Angeles - La Cienega Geotech Array
34.0362 118.3784
4(12)
Caltrans Deep soft alluvium 12/15/94
18 24400 Los Angeles - Obregon Park
34.0370 118.1783
2(6)
UCSB Deep alluvium over soft rock
06/25/97
19 14785 Los Angeles - Vincent Thom Geo Array East
33.7489 118.2678
4(12)
Caltrans Deep soft alluvium 09/10/98
20 14783 Los Angeles - Vincent Thom Geo Array W1
33.7500 118.2751
4(12)
Caltrans Deep soft alluvium 09/11/98
21 14784 Los Angeles - Vincent Thom Geo Array W2
33.7502 118.2777
3(9)
Caltrans Deep soft alluvium 09/11/98
22 68285 Novato - Petaluma River Geotech Array
38.1184 122.5015
5(15)
Caltrans Shallow alluvium over rock
10/24/08
23 58204 Oakland - Bay Bridge Geotech Array
37.8212 122.3272
5(15)
Caltrans Alluvium 09/09/10
24 25325 Oxnard - Hwy 101 Bridge Geotech Array
34.2434 119.1936
3(9)
Caltrans Deep alluvium 04/17/08
25 24206 Palmdale - Hwy 14 Bridge Geotech Array
34.5473 118.1300
3(9)
Caltrans Shallow alluvium over hard rock
02/11/10
Table 1. CSMIP Geotechnical Arrays

SMIP13 Seminar Proceedings
111
No.Station No.
Station Name N. Lat.
W. Long.No. Depths(Sensors)
Partner GeologyInstallation
Date
26 36529 Parkfield - Turkey Flat #1 35.8780 120.3587
2(6)
CGS Soft rock 03/03/87
27 36520 Parkfield - Turkey Flat #2 35.8822 120.3510
3(9)
CGS Shallow alluvium over soft rock
12/17/86
28 68797 Rohnert Park - Hwy 101 Geotech Array
38.3472 122.7134
3(9)
Caltrans Alluvium 05/20/03
29 23792 San Bernardino - I10/215 West Geotech Array
34.0637 117.2979
4(12)
Caltrans Deep alluvium 05/16/08
30 03192 San Diego - Coronado East Geotech Array
32.6983 117.1449
4(12)
Caltrans Deep alluvium 06/27/02
31 03193 San Diego - Coronado West Geotech Array
32.6881 117.1640
5(15)
Caltrans Deep alluvium 06/28/02
32 58961 San Francisco - Bay Bridge Geotech Array
37.7867 122.3892
3(9)
Caltrans Fill and alluvium over soft rock
08/05/03
33 58700 San Francisco - Golden Gate Bridge Nth Geo Array
37.83 122.48
2(6)
GGB Rock 01/28/94
34 58700b San Francisco - Golden Gate Bridge Sth Geo Array
37.8198 122.4788
2(6)
GGB Rock
35 58267 San Rafael - Richmond Bridge Geotech Array
37.9427 122.4808
2(6)
Caltrans Alluvium 08/18/05
36 24764 Tarzana - Cedar Hill B 34.1605 118.5353
2(6)
NSF Thin alluvium over soft rock
06/05/97
37 58642 Treasure Island - Geotechnical Array
37.8252 122.3741
7(21)
NSF Shallow fill over deep alluvium
10/30/92
38 68310 Vallejo - Hwy 37/Napa Rvr East Geotech. Array
38.1217 122.2751
3(9)
Caltrans Bay mud 01/24/06
39 23793 San Bernardino - I10/215 East Geotech Array
34.064 117.288
4(12)
Caltrans Deep alluvium n/a
40 24185 Moorpark - Hwy118/Arroyo Simi Geo. Array
34.2876 118.8646
3(9)
Caltrans Shallow alluvium over soft rock
n/a
41 58525 Newark - Dumbarton Br East Geotech Array
37.5127 122.1091
6(18)
Caltrans Deep alluvium n/a
42 58526 Palo Alto - Dumbarton Br West Geotech Array
37.4986 122.1289
6(18)
Caltrans Deep alluvium n/a
Underway
Table 1. CSMIP Geotechnical Arrays (Cont'd)
SMIP13 Seminar Proceedings
112
Fig. 5. Data from a small earthquake (M4.2, on 9/9/01) recorded at the La Cienega array. The data shows the increase of the amplitude near the surface, and the incoming and the reflected phases separated by the travel time in the near surface layers.
Fig. 6. Downhole data recorded at the La Cienega geotechnical array for a large distant event (M7.2 Calexico earthquake of 4/4/10) showing little amplification of the motion near the surface.

SMIP13 Seminar Proceedings
113
Overall Progress
It is useful to review the instrumentation accomplished in the 40+ years since CSMIP began strong motion instrumentation. The first stations, installed in the early 1970s, were all free field stations, because of their relatively low cost and rapidness of installation, important during a time the new program was under close scrutiny by the Legislature. The instrument state of the art at the time was film-recording, analog instruments, and the SMA-1 was the most reliable. Interestingly, CSMIP is just now replacing the last of these instruments, after 40 years of service, with QuakeRock instruments, discussed below. Very few instruments can meet the long-term reliability and low power requirement of the SMA.
The number of installations over time is shown in Fig. 7. The number of accelerometers in the network is plotted for a common base, since some structures may have many sensors, while freefield stations have three. The plot of the freefield instruments installed shows the initial effort in the 1970s. It also shows a small increase in the mid 1980s, when the Parkfield Array was completed. Finally, it shows a large increase associated with the TriNet Project in southern California after the 1994 Northridge earthquake, a joint effort with USGS and Caltech funded by FEMA. Nearly all the 400 stations installed in that effort are still online, and the TriNet project is still the basis for the more advanced state of seismic instrumentation in Southern California. The installation rate after TriNet is greater than that before partly because of the OES-funded CISN project which, while not as large as the TriNet project in the short term, continues year to year.
Fig 7. Total number of strong motion sensor installed in the CSMIP network from the early 1970s to the present, in structural (dams, bridges and hospitals) and freefield categories. The geotechnical array sensors are included in the free field count.
Total Number of Strong Motion Sensors in the CSMIP Network
0
1,000
2,000
3,000
4,000
5,000
6,000
7,000
8,000
9,000
1970 1975 1980 1985 1990 1995 2000 2005 2010
Dams+
Bridge
Hosp
Bldgs
FF
SMIP13 Seminar Proceedings
114
Building instrumentation shows instrumentation starting at low level in the
late 1970s, than increasing at a nearly steady rate. The 175 regular buildings instrumented have about 2300 channels.
There were few bridges or hospitals instrumented until the early 1990s, when two things happened. First, the law mandating the CSMIP program was changed to bar it from instrumenting structures for which building permit fees were not paid in the local jurisdiction. At that point SMIP could no longer instrument bridges, hospitals or dams using its permit-fee funding. Second, in view of the damage that occurred to bridges in the 1989 Loma Prieta earthquake, and the little recorded data to guide future design, the Governor’s Board of Inquiry report (Housner et al., 1990) called for Caltrans to actively support bridge instrumentation. An active partnership with CSMIP began at that time, and the resulting instrumentation accomplishments are clear in Fig. 7. Caltrans also began, especially after the 1994 Northridge earthquake, to call for a free field station at each instrumented structure, not routinely done at that point. In addition, in certain cases they called for downhole arrays to be installed in the vicinity of instrumented bridges. These arrays are expensive to prepare; Caltrans drillers were used to perform the drilling and logging to manage costs. The instrumentation of downhole arrays supported by Caltrans will benefit geotechnical engineering in general, leading to increased understanding of near surface motions.
Hospital instrumentation saw similar significant changes in the early 1990s. OSHPD developed an ongoing project with CSMIP after the Loma Prieta earthquake, as discussed above, supporting hospital instrumentation as well as establishing a formal basis for hospital selection. The subsequent, ongoing instrumentation work supported by OSHPD, including the special categories discussed above, has led to a significant increase in the rate of instrumentation in recent years
QuakeRock
As a result of the efforts of CGS and USGS, and the recordings obtained in other countries, a large number of strong motion records have been obtained in the last 20 years. As would be expected from a likelihood perspective, most are at intermediate distance from moderate events. There are relative few records from large earthquakes, and particularly few at close in distances, within 10-20 km from the fault. To address this paucity, since the location of future earthquakes is not known, would require a large number of instruments placed along many faults in areas where large earthquakes may occur. To address this need SMIP has begun a project to put out a significant number of economical, low-power, autonomous accelerographs along major faults in southern California. A normal stand-alone station, with the supporting infrastructure, usually costs $10,000 to $15,000 to install. The approach here uses an economical instrument with low power
SMIP13 Seminar Proceedings
115
requirements and a simple installation method so the total installation can be accomplished at perhaps a quarter of the regular cost. Fig. 8 shows a pilot installation, in which the installed, anchored instrument is covered by a faux, fiberglass rock to blend in with surroundings, dispensing with the usual instrument housing and the pouring of a concrete pad. This approach requires visiting the site to recover data, and yields data with the ~.003g resolution of the classic SMA, instead of the micro-g resolution of more expensive, high powered conventional instruments. Since addressing the near field paucity of data for improving design does not require immediate data, and much of the building code is currently based on records with SMA-type resolution, neither of these factors interferes with the goal. Replacement for SMA
The QuakeRock instrument is a good replacement for the classic SMA instrument, in general. Its low power requirement allows it to be a direct, economical replacement in cases where funding or adequate power are not available to allow installation of a conventional digital accelerograph. SMIP has installed over 50 of the QuakeRock instruments as direct SMA replacements, where AC power is not available, with good results. Considering the number of privately owned SMAs still located at lifeline structures and in code-type building instrumentation, this could be an effective approach to replace them. The cost of digitizing film accelerograms will continue to go up, while the expertise to do accurate digitization will continue to become more rare, meaning that obtaining the spectrum of the motion after a significant earthquake could be significantly delayed, and may have quality problems. The QuakeRock type of instrument would already have digitized the record, and the spectrum can be quickly calculated.

SMIP13 Seminar Proceedings
116
Fig. 8. Illustration of the installation of a QuakeRock accelerograph in a roadside environment. The instrument is shown at upper left (RefTek’s 148-01 accelerograph), attached to the mounting plate (upper right), which is attached to an anchoring rod driven into the ground. The finished deployment at bottom shows the faux rock cover over the instrument. The instrument operates autonomously on the included D-cell lithium batteries for up to two years.
Convenient Access to Data
A major evolution of the last several years is the increasingly convenient access to data, whether raw, processed or spectral, at the Center for Engineering Strong Motion Data (CESMD), at www.strongmotioncenter.org. The Center is a cooperative effort of the CGS and USGS, and strong motion records from many earthquakes and stations are now available there. The Virtual Data Center (VDC) developed at UC Santa Barbara is being integrated into the CESMD. Haddadi and Stephens (2013, this volume) describe the recent advances at the Center.

SMIP13 Seminar Proceedings
117
Summary
The California Strong Motion Instrumentation Program, started after the 1971 San Fernando earthquake, in which there was significant structural damage and few strong motion records, has instrumented many sites and structures and recorded important strong motion records. Instrumented structures include 235 buildings, including 60 hospitals, strategically chosen. Bridge instrumentation includes 65 regular bridges and all 10 toll/major bridges in the State. Ground response instrumentation includes 38 geotechnical arrays with downhole sensors and 800 regular freefield stations.
Acknowledgements
The work of the California Strong Motion Instrumentation Program has
benefited significantly from the input received from the Strong Motion Instrumentation Advisory Committee over the years. The careful work of the CSMIP technical staff, lead by Carl Petersen, is critical to successful instrumentation and to the recording of quality strong motion data; Stephen Fife led field staff instrumenting and maintaining many of the stations. Hamid Haddadi and his staff carefully review, quality control and post incoming data on the CESMD web site.
References
Celebi, M., M. Huang, A. Shakal, J. Hooper and R. Klemencic (2013). Ambient
response of a unique performance-based design tall building with dynamic response modification features, Structural Design of Tall and Special Buildings, doi: 10.1002/tal.1093.
Haddadi, H. and C. Stephens (2013). Update on data and features of the Center for Engineering Strong Motion Data, Proceedings of SMIP13 Seminar on Utilization of Strong-Motion Data.
Housner, G., J. Penzien, N. Agbabian, C. Arnold, L. Dickenson, E. Elsesser, I. Idriss, P. Jennings, W. Podolny, A. Scordelis and R. Wallace (1990). “Competing Against Time”, Report to Governor George Deukmejian from the Governor’s Board of Inquiry on the Loma Prieta Earthquake, Governors Office of Planning and Research, Sacramento, California.
Huang, M., P. Hipley and A. Shakal (2013). Seismic instrumentation of toll bridges in California, Sevnetgh National Seismic Conference on Brdiges and Highways, Oakland, Californa, Paper P10.
Huang, M., A. Shakal, C. Petersen, M. Celebi, J. Hooper and R. Klemencic (2012). Strong motion instrumentation of a 62-story concrete core residential building in San Francisco, Proceedings of SMIP12 Seminar on Utilization of Strong-Motion Data, p. 81-96.

SMIP13 Seminar Proceedings
118
Kramer, S. (2009). Analysis of Turkey Flat ground motion prediction experiment – lessons learned and implications for practice, Proceedings of SMIP09 Seminar on Utilization of Strong-Motion Data, p. 1 -22.
Kramer, S., A. Shakal, H. Haddadi, and C. Real (2011). Near surface geology and the Turkey Flat ground motion prediction experiment – lessons learned and implications for practice, 4th International Symposium on the Effects of Surface Geology on Seismic Motion, IASPEI / IAEE International Symposium, Santa Barbara, U.S.
Maroney, B. (2012). San Francisco - Oakland Bay Bridge New East Span: Construction Progress and Challenges, Proceedings of SMIP12 Seminar on Utilization of Strong Motion Data, p. 125.
Petersen, M. and others (CGS) and Frankel, A. and others (USGS) (1996). Probabilistic Seismic Hazard Assessment for the State of California, Open-File Report 96-08 (CGS) and 96-706 (USGS).
Real, C., A. Shakal and B. Tucker (2006). Overview of the Turkey Flat ground motion prediction experiment, Proceedings of SMIP06 Seminar on Utilization of Strong-Motion Data, p. 117 - 136.
Shakal, A., H. Haddadi and C. Real (2006). Recorded data and preliminary review of predictions in the Turkey Flat Blind Prediction Experiment for the September 28, 2004 Parkfield earthquake, Proceedings of SMIP06 Seminar on Utilization of Strong-Motion Data, p. 137 - 152.
Tokas, C. and R. Lobo (2012). Hospital Seismic Safety Program and strong motion instrumentation, Proceedings of SMIP12 Seminar on Utilization of Strong-Motion Data, p. 111 - 124.