smes: employment, innovation and growth the washington ... · innovation and growth the washington...
TRANSCRIPT

77
SMES: EMPLOYMENT,INNOVATION AND GROWTH
THE WASHINGTON WORKSHOP
© OECD, 1996
ORGANISATION FOR ECONOMIC CO-OPERATION AND DEVELOPMENT

88

99
FOREWORD
As a follow-up to the initial OECD Jobs Study published in 1994, and as acontribution to the related programme on “Technology, Productivity and JobCreation”, the Industry Committee’s Working Party on SMEs organised inWashington, DC, in June 1995, a high-level workshop to provide an assessmentof the role of SMEs in employment, innovation and growth, and an assessmentof the data required to improve the ability to identify, in future years, the role ofSMEs in these areas. The Workshop aimed at reaching policyrecommendations regarding appropriate government policies to enhance thepotential for SMEs to contribute to Member countries’ economic well-being.
This Workshop was organised by the OECD Working Party on SMEs inco-operation with the U.S. Small Business Administration (SBA), theMultilateral Investment Guarantee Agency (MIGA) of the World Bank Group,U.S. Sprint, the Russell Sage Foundation, the George Washington University,the German Marshall Fund of the United States, and the United Nations’Department for Development Support and Management Services. It gatheredover 60 policy makers, academic and private sector experts from more than26 countries.
This report provides a synthesis of the papers presented at the workshopand related discussions which took place during the various sessions, togetherwith the major conclusions of the meeting. The report was prepared byProfessor Paul Reynolds (Paul T. Babson Professor in Entrepreneurial Studies,Babson College, United States) in co-operation with Marie-Florence Estiméfrom the OECD Secretariat (Directorate for Science, Technology and Industry).
The Working Party on SMEs and the Industry Committee recommendedthat this report be made available to the general public. It is published on theresponsibility of the Secretary-General of the OECD.

1010

1111
TABLE OF CONTENTS
Executive Summary .....................................................................................7
I. Introduction ..........................................................................................9II. SMEs and Economic Growth and Change........................................10
Cross-national comparisons...............................................................11Cross-sector comparisons ..................................................................13Cross-regional comparisons...............................................................14Industrial districts and flexible specialisation ...................................15Policy implications ............................................................................16
III. Monitoring Job and Firm Dynamics...............................................18Sources of existing jobs .....................................................................18Sources of new jobs: analysis assumptions ......................................22Sources of new jobs: recent analyses................................................31Potential for cross-national analysis ..................................................36Policy implications ............................................................................42
IV. Innovation and New Firms .............................................................42Firm size and the production of innovation.......................................43Firm size and adopting innovation.....................................................46High growth new firms ......................................................................48Policy implications ............................................................................50
V. SMEs and Job Quality.......................................................................52Firm size and job quality ...................................................................52Evidence of convergence ...................................................................55Policy implications ............................................................................56
VI. Conclusions and Policy Implications ..............................................57The entrepreneurial engine ................................................................59
References..................................................................................................74
Annex A: Job creation rates and distribution of gross job flows ..............62Annex B: Workshop participants in the various sessions..........................66Annex C: Papers distributed at the workshop ...........................................72

1212
List of figures and tables
Figure 1. Sales growth in the EU-12: SMEs, large firms and GDP ................12
Figure 2. Alternative business organisational structures ..................................25
Table 1. Size distribution of firms and employment share: selectedOECD countries .........................................................................................19
Table 2. The role of SMEs in national economies............................................20
Table 3. Breakdown of employment by size of establishment.........................21
Table 4. Conceptions of the economy and data collection decisions ...............23
Table 5. Establishment changes over time: alternative inferences..................27
Table 6. Job gains and job losses by firm size: selected G7 countries ............39

1313
EXECUTIVE SUMMARY
OECD Member countries appear to be undergoing two basic changes – areduction in the average size of business firms and an increase in the turbulenceor volatility among firms and jobs. These changes have not been documented indepth and have raised a certain amount of controversy. More importantly, thereis only a limited understanding of the causal mechanisms and the role of SMEsin driving economic change.
With the objective of shedding light on these questions, the high-levelworkshop organised by the OECD Working Party on SMEs in Washington, DCin June 1995 focused on the following issues:
• the role of SMEs – and in particular new and small firms – in economicgrowth and change;
• the role of new entrepreneurial SMEs in dynamising the whole SMEsector;
• monitoring of firm and job dynamics, with attention given to thedevelopment of harmonised data sets on innovation and the creation ofnew technology (and new markets or sectors), as well as the adoption ofinnovations;
• the quality of the jobs provided by small and large, new and establishedfirms;
• the related policy implications.
The major conclusions of the workshop were that SMEs, in particular newand small firms: i) have a distinct role in economic growth; ii) provide adisproportionate share of gross and net new jobs, and, moreover, a smallproportion of high growth new firms provide the majority of new firm jobs;iii) firm and job turbulence are a necessary feature of economic growth; iv) newand small firms appear to play an important role in the development ofinnovation, but SMEs may be at a disadvantage in the access to newtechnology; v) large firms seem to provide better quality jobs, but there isevidence that the large-small firm gap in job quality is shrinking; vi) the current

1414
efforts in many OECD countries to develop more detailed and appropriate datasets for tracking the role of SMEs and to monitor firm and job turbulence willbe of substantial value for future analysis and policy development.
The major policy implications are:
• to maximise economic growth in OECD countries, governments shouldcontinue to explore ways to encourage entrepreneurial activity and ensurethat new firms are not at a competitive disadvantage;
• to encourage more innovative behaviour, governments should promotetraining and familiarisation with entrepreneurship and ensure that SMEshave easy access to information, new technology and innovations;
• further efforts to develop the appropriate data sets for tracking job andfirm dynamics should continue, with close collaboration between thosedeveloping data, analysts, and policy makers.

1515
I. Introduction
The economies of OECD Member countries appear to be undergoing twobasic changes: a reduction in the average size of business firms and an increasein the turbulence or volatility among jobs and firms. A reflection of the first, ashift in the size distribution among business firms, is now well documented formost OECD Member countries (Loveman and Sengenberger, 1991; EuropeanConservatory for SMEs, 1993, 1994; Davis, 1990). The general patternssuggest subtle increases in the share of employment provided by smaller firmsaccompanied by a reduction in the average size of firms and establishments.These patterns were most apparent in the 1980s; there may have been somerecent moderation (European Observatory, 1995; Parent, Workshop; Thurik,Workshop). There is less documentation for the second change, a potentialincrease in the turbulence or volatility among jobs and firms. An increase involatility would shift emphasis to new firms, most of which are small. Majorstructural shifts often involve the development of new economic sectors and arefrequently indicated by the appearance of large numbers of small firms.
Distinguishing between the impact of these two processes has beencomplicated by a tendency to organise and analyse data on job dynamics(creation and destruction) by firm size. As a result, the effects of changes dueto new small firms cannot be distinguished from shifts associated withestablished small firms. This has led to some controversy and confusion aboutthe precise nature of the changes occurring in OECD Member economies.Perhaps even more important, there is only a partial understanding regarding thecausal mechanisms, and the role of SMEs, in creating economic changes.
While considerable attention has been given to the relationship of firm sizeto gross and net job changes, such analysis focuses on job changes in a singletime period. It does not provide evidence of a temporal relationship betweenchanges that may lead to turbulence among firms or jobs. Without thisinformation, it is difficult to understand the causal mechanisms that affect jobdynamics. Perhaps more basic, it does not provide evidence of a relationshipbetween changes in firm or job dynamics and general measures of economicgrowth: total jobs, gross national product, income per capita, etc.
Current analysis regarding four issues related to this conception of thecurrent structure of OECD Member economies will be reviewed: i) the role ofSMEs – new and small firms in particular – in economic growth; ii) monitoringjob and firm dynamics, with attention to the development of harmonisednational data sets for cross-country comparisons; iii) the role of new and smallfirms in the creation of new technology (and new markets or sectors) as well as

1616
adoption of innovations; and iv) the quality of the jobs provided by small andlarge, new and established firms.
The final section summarises the major findings and policy implications.It includes a review of the implications of a shift in the nature of OECDMember economies away from the reliance upon a core of large firms. Ithighlights the “entrepreneurial engine” as a source of growth and job creation aswell as implications for changes in the conception of economic life and the needfor more appropriate data on business firms and jobs.*
II. SMEs and Economic Growth and Change
No issue regarding new and small firms is more significant than evidencethat they have a causal role in economic growth. This may be unrelated to theimpact of SMEs as a source of new jobs. Indeed, new firms may be a majorsource of new jobs in an economy in decline, where the total number of jobs isdecreasing. Evidence of a statistically significant relationship between new andsmall firm presence and subsequent economic growth would justify furtheranalysis to determine the causal mechanisms associated with such patterns.
There has not been, heretofore, much evidence available to test for thepresence of a small firm-economic growth relationship. This requires, at aminimum, information on new and small firm dynamics and independentmeasures of economic growth. If the measures of growth are for a later timeperiod, it increases confidence in a causal relationship. At least two data pointsare required for any interpretation and with enough data, it is possible to controlfor other factors that may affect economic growth, to preclude the possibilitythat a third factor is affecting both (Vo Van Qui, Workshop comment).
As one of the major factors affecting new firm births is economic growth(Reynolds and Storey, 1993), it is important to assemble data that will allow anassessment of the independent impact of new or small firms on subsequentgrowth. This will help to determine the extent to which new and small firmsreflect economic growth created by other changes or are, in themselves, anindependent source of economic growth.
* Over two dozen papers and technical commentaries were prepared for this workshop.These are listed separately at the end of this report (see “References”) and are referencedas “Workshop” in the text. Observations made by discussants during the workshop arereferred to by name and as “Workshop comment”. Participants in the workshopprogramme are listed in Annex B.
1717
Recent improvements in data sets have made it possible to completestudies with different units of analysis: cross-national comparisons withEuropean countries, comparisons across different economic sectors within agiven national economy, and comparisons of different labour market areaswithin a single country. In addition, there are numerous examples of individualregions or industrial districts, dominated by SMEs, that appear to have led tosubstantial economic growth for those districts. Each will be discussed and allprovide support for the conclusion that a vigorous new and small firm sectorpromotes, in today’s OECD economies, subsequent economic growth.
Cross-national comparisons
A substantial effort, sponsored by the European Union (EU), has developedstandardised data on firms, by size, across the EU member States. This wasoriginally 12 countries but has now been expanded to 15 plus Norway (Thurik,Workshop). The reports on this effort, referred to as the European Observatoryfor SMEs Reports (1993, 1994, 1995), provide cross-national comparisons onthe share of employment, value added, and sales in the EU States by firm size.SMEs increased their share on all measures of economic activity up to 1990, butin the early 1990s the share of value added and sales shifted to favour the largerfirms. There was, however, no major shift in employment shares by size.
It is now possible to consider the effect of changes in firm emphasis acrossthe EU member States on subsequent growth in Gross National Product (GNP).This is only possible because recent efforts to standardise measures of firm sizeand output related to firm size have been successful. The difference betweenthe total annual sales of small and large firms may be compared throughsubtraction. If small firm sales growth exceeds large firm sales growth thedifference is positive. This was computed for EU States for three two-yearperiods and used in a linear model to predict change in GNP for the followingperiods. The analysis was completed for the EU-12 (predictions to 1991, 1993and 1994) and for the EU-16 (predictions to 1993 and 1994). Despite the smallnumber of observations, the impact is statistically significant. A greaterincrease in the small firm sales, compared to large firm sales, leads to moregrowth in the national GNP in the following year.

1818
Figure 1. Sales growth in the EU-12: SMEs, large firms and GDP
6
5
4
12
3
0
0.5
1
1.5
2
2.5
-4 -3 -2 -1 0 1 2 3 4 5
(Annual % Change in SME Sales) minus (Annual % Change in Large Firm Sales)
Ann
ual C
hang
e in
GN
P
Correlation = .91
Note: EU-12 and year-pairs in each group were as follows. First year represents sales growth ofSMEs relative to large firms (SME sales growth minus large firm sales growth); second yearrepresents growth in GDP.Group 1: Denmark (1990/91, 1991/92), Ireland (1989/90), Italy (1991/92), Spain (1991/92) andtheUnited Kingdom (1989/90).Group 2: Belgium (1990/91), France (1990/91), Germany (1990/91), Luxembourg (1991/92),Netherlands (1991/92) and Spain (1990/91).Group 3: Belgium (1991/92), France (1991/92), Germany (1991/92), Italy (1990/91), Luxembourg(1990/91) and Spain (1990/91).Group 4: Greece (1990/91, 1991/92), Ireland (1991/92), Portugal (1990/91) and the UnitedKingdom (1991/92).Group 5: Greece (1989/90), Ireland (1990/91), Italy (1989/90), the Netherlands (1989/90/91) andPortugal (1991/92).Group 6: Belgium (1989/90), France (1989/90), Germany (1989/90), the Netherlands (1989/90)and Portugal (1989/90).Source: Thurik, 1995.

1919
The relationship is presented for the EU-12 analysis in Figure 1. Eachcountry was considered for three two-year periods (predictions from 1989 to1990, 1990 to 1991, 1991 to 1992). The 34 measures (Denmark and Spain weremissing for 1989-90) of small-large firm differences were broken down into sixgroups, and the average value of each group determined. The average small-large firm growth difference and the average country GNP growth for eachgroup is shown in Figure 1. While there are only six points, the correlation is0.91, reflecting a clear upward trend. When small firm sales grow faster thanlarge firm sales, growth in Gross National Product is enhanced in the followingyear. This suggests that SME growth may provide an independent source ofgeneral economic growth.
This would suggest that small firms are either a mechanism fortransmitting economic growth or an independent source of growth – a source ofeconomic growth not provided by large firms. It would also suggest that effortsto harmonise databases to facilitate future comparisons among a larger group ofOECD countries would be of considerable value.
Cross-sector comparisons
Another strategy is to compare changes in different economic sectors,using classification of jobs and employment for different types of economicactivity. A preliminary analysis comparing 33-34 manufacturing sectors wascompleted for seven OECD Member countries (Schreyer and Chavoix-Mannato,Workshop). In this case, the average establishment (not firm) size was utilisedin linear models predicting job growth within the same economic sector for the1985-90 period. Controls for growth in real output and a constant to capturetrends in employment were included in the linear models. Pooling data from allcountries leads to 234 observations. It was found that average establishmentsize explained about half the variation in employment growth. Economicsectors with a lower average establishment size had, even with controls forother factors, a greater level of overall job growth.
The authors extend the analysis to consider variation in the distribution ofestablishment sizes, for a small average size may reflect uniformly smallestablishments or a mass of micro establishments and a few very large firms.Concentration ratios (percentage of jobs in the largest firms) can be determinedto explore this possibility. Perhaps even more significant would be theintroduction of a time lag, for data related to both average firm size and jobgrowth were for the same time period. A further contribution would be to

2020
consider other economic sectors besides manufacturing; perhaps some that areexpanding, such as business services.
Despite the exploratory nature of this cross-sector analysis, it does suggeststhat the presence of smaller firms is associated with economic sector growth,even when the overall sector, manufacturing, may be in decline. Further, thesame patterns were found among all seven OECD Member states included inthe analysis.
Cross-regional comparisons
An alternative strategy makes use of standardised data sets within a singlecountry. This involves comparing different internal geographic areas,considering SME presence and firm dynamics as related to economic growth inlater periods. While many OECD countries have detailed data on SME sectorsand economic growth for their total economy, few have developed datadisaggregated on sub-national geographic areas over a period of time.
A programme of research on the role of new and small firms in Swedisheconomic growth has been underway for some years (Davidsson et al.,Workshop). Using 80 labour market (or journey-to-work) areas as the unit ofanalysis, it has explored two aspects of the impact of “simples” (single siteestablishments); “branches” (unit within a multi-establishment firm); and“tops” (headquarters establishments) on economic change, including: i) the roleof regional factors in establishment births and deaths; and ii) the role ofestablishment births and deaths on subsequent economic growth. In Sweden,99.99 per cent of all simples have less than 200 employees and 98.6 per centhave fewer than four. Analysis of the effects of business dynamics on regionaleconomic well-being has indicated that: i) greater turbulence (firm births,deaths, contractions, and expansions) tends to lead to enhanced economicwell-being; ii) there were low correlations among measures of businessdynamics, regions tended to be unique in this regard; iii) higher levels ofchange seemed to have a positive impact even when absolute levels of growthwere modest; iv) firm births and deaths tended to have a more positive impacton economic growth than measures of expansions and contractions; and v) thesingle most important factor affecting economic growth was simpleestablishment birth rates. This and other analysis suggested that:

2121
“... Neither a high dependence on small firms nor on largefirms solely appears to be optimal. The regions which haveexperienced the most favourable development of economicwell-being are those that had a good mix of industries andbusiness sizes, and whose business sector was characterisedby a relatively rapid pace of change.”
(Davidsson et al., Workshop)
This is, however, a complicated issue to analyse and the results are not wellestablished in all OECD Member countries. Similar findings were found in ananalysis of 382 labour market areas in the United States (Reynolds and Maki,1991; Reynolds, 1994). In this analysis, statistically significant impacts ofmeasures of business volatility (firm births and deaths) on economic growthwere found. Despite substantial and consistent positive correlations, linearmodels that controlled for other factors produced small, positive effects mostlyrelated to dynamics in manufacturing. Conflicting results have been found forWest Germany (Audretsch and Fritsch, 1992). In the US analysis, it appearedthat higher firm birth rates may be associated with an absence of economicgrowth, but regions with higher levels of growth almost always have higher firmbirth rates in previous years. Firm births may be a necessary but insufficientcondition for subsequent economic growth.
Industrial districts and flexible specialisation
Another source of evidence of the role of SMEs in producing economicgrowth has come from local productive systems. Arzeni (Workshop) points outthat with the decline of the mass production model of industrial production,researchers have increasingly come to the conclusion that there is no single bestway to organise an industry. The chain of conception, execution, marketing andcommercialisation of a specific finished product can be successfully organisedby firms in a variety of different ways. One way is through a local productivesystem (or “industrial district”) where there is: i) a dense relationship ofbusiness activity in a limited space; ii) a focus on one industrial activity; iii) aproduction process based on a mass of small firms specialising in differentphases of the process; iv) a mix of competitive and co-operative inter-firmrelationships; and v) a host community with a local culture that is a mix ofsupportive socio-cultural norms and values and an “industrial atmosphere”(widespread local understanding of the production process along with adiffusion of technical skills and innovation).

2222
While it is not clear what proportion of a national economic activity orgrowth is provided by these clusters of production excellence, it is clear thatsome regions are heavily dependent upon these industrial districts. They arevery common in Italy and Spain, particularly in the textiles, clothing orfootwear industries. Quasi-industrial districts can also be identified as animportant part of more heterogeneous regions, such as the cardiovascular deviceindustry in Southern California; art auctioneers in London; optic and imagingindustry in the Rochester/Finger Lakes region of New York State; McLarenVale wine-making in Australia; and the automobile supplier industry inBaden-Wurttemberg, Germany (Arzeni, Workshop).
One example of substantial regional differences is found in Italy (Pyke,Workshop), where regions of “new industrialisation” such as Emilia Romagna,with a heavy concentration of small firms, grew in prosperity, whilst regions of“old industrialisation”, such as Lombardia and Piemonte, with a strong presenceof large firms, declined. Between 1963 and 1984 Emilia Romagna real annualincome (adjusted for inflation) per inhabitant grew 14 per cent, while that inLombardia and Piemonte declined 6 and 7 per cent, respectively. High levels ofout-of-region exports seem to be associated with such growth.
These analyses suggest that, under some conditions and for certain types ofeconomic production, a vigorous new and small firm sector is not an aberration,but a necessity for a competitive regional economy. Collectively, the SMEs insome industrial districts have created a sustained competitive advantage – forthe district. Those regions dominated by large firms in some industries haveundergone considerable economic decline. Studies of the Italian woollentextiles sector suggest that productivity improvements in the smaller firmsoffset the higher wages providing them with lower labour costs. The largerfirms do not seem to be able to create these productivity improvements.
Policy implications
i) There is some evidence that a vigorous SME sector has a causal impact onsubsequent economic growth. This complements the important role of largefirms. There continues to be evidence of substantial geographical variationwithin countries regarding the vigour of SME activity and economic well-being.
The available evidence, then, seems to suggest that SME growth can leadto greater job growth, providing empirical support for the OECD Jobs Study(OECD, 1994a) recommendation that Member countries may enhance jobgrowth by improvements in the entrepreneurial climate. This may increase firmbirths and the size of the SME sector and, in turn, economic well-being. None

2323
of these analyses suggest that SMEs alone are a major source of subsequenteconomic well-being. In fact, several analysts are careful to point out that largefirms have a unique and important role, and that large and small firms aregenerally found in interdependent systems (Davidsson et al.; Thurik,Workshop).
ii) There continues to be evidence of substantial geographic variation withincountries regarding the vigour of SME activity and economic well-being.
The Swedish analysis (Davidsson et al., Workshop) and the analysisprovided on New Zealand (Nolan, Workshop) both indicat substantial variationacross internal regions (labour market areas in Sweden; Territorial LocalAuthorities in New Zealand) in terms of firm birth rates. One of the moststriking findings in an analysis of regional variation in firm birth rates in eightOECD Member countries was the uniformity in dispersion within each country;in every case the difference between the most and least fertile regions was afactor of two or three (Reynolds and Storey, 1993). In almost every countrythose regions with increases in demand (as measured by population growth) andother indicators of agglomeration or urbanisation were generally associated withhigher levels of firm births.
iii) There is evidence that under special circumstances a region dominated byan interdependent network of small firms may prosper, even in competitiveinternational markets, when the right combination of government policies, localinstitutions, and co-operative productive arrangements are in place. It is notclear how to create such districts. There are clearly special situations whereSMEs have a critical role in economic well being.
Arzeni (Workshop) reports on a wide range of cases where regionaleconomies have specialised in a given product or service. In these cases, adense population of interdependent SMEs seem to have created a sustainedcompetitive advantage for these regions in the global economy. This has, inturn, provided sustained economic well-being. New and small firms are acritical feature of this form of economic growth. The second example (Tarrago,Workshop) is of the dramatic restructuring occurring in Uruguay after thecreation of a free trade area in the southern cone of South America,MERCOSUR. As the smallest participant, Uruguay has undergone majorstructural changes in order to accommodate its new partners, yet unemploymenthas not increased. This is, in part, due to the creation of new firms and theexpansion of existing SMEs.

2424
A critical feature of the most successful industrial districts seems to be thedevelopment of a strong social norm that minimises opportunistic behaviour.Those firms with new innovations or new products that might be exploited forsubstantial personal gain appear to share the benefits within the industrialdistrict, thereby enhancing the competitive stature of the entire group. Howsuch norms may be developed or maintained is not clear.
iv) As the role of new and small firms in subsequent economic growth may besubtle and complicated, additional research on this topic – including evaluationof the impact of government programmes – will require relatively sophisticatedand detailed longitudinal data on business firms.
III. Monitoring Job and Firm Dynamics
No topic related to SMEs has received more attention than the relationshipbetween firm size and job creation. Two basic patterns have been emphasisedin analyses of OECD Member countries: i) that a large proportion, usually amajority, of business jobs are in micro, small and medium-sized firms; andii) that micro, small, and medium-sized firms are, as a sector, associated with asubstantial proportion of new jobs, both gross and net (job gains less job losses).Only under very unusual circumstances, to be discussed below, have differentpatterns been found with respect to sources of net job gains in OECD Membercountries in the past several decades.
Attention to these issues – “Where are the jobs?”, “Where do jobs comefrom?” – has led to a considerable amount of analysis and, finally, to thecreation of new data sets in many OECD Member countries. The following willconsider current discussions of sources of existing jobs, issues in the analysis ofdata to determine the sources of new jobs, some recent analyses of sources ofnew jobs, and efforts to develop a capacity for creating cross-national analysisof job dynamics. The section concludes with a review of the policyimplications.
Sources of existing jobs
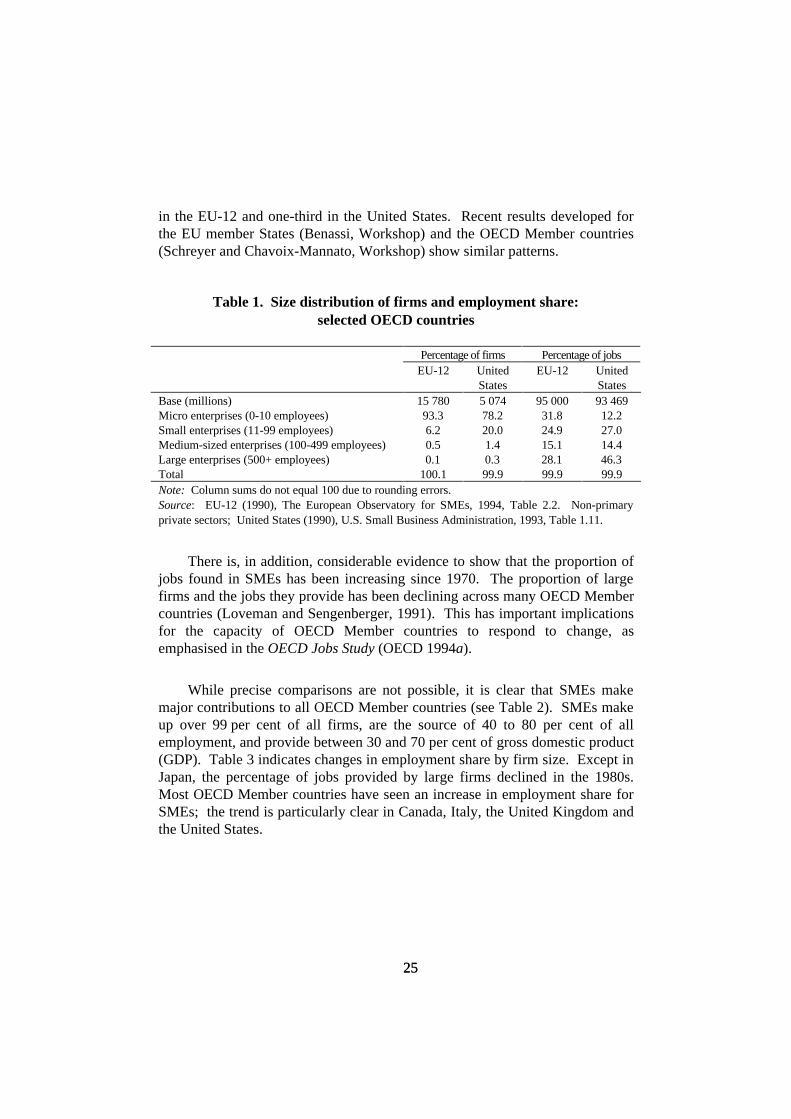
A typical analysis related to the first point, the distribution of firm size andthe jobs, is provided in Table 1. It is clear that large firms – a fraction of1 per cent of all firms in the EU and the United States – are major sources ofjobs, providing one-quarter to one-half of all jobs. SMEs with less than499 employees, in both cases, provide the largest proportion of jobs, from overtwo-thirds in the EU-12 to over one-half in the United States. The micro andsmall enterprises (less than 100 employees) are providing almost half of all jobs
2525
in the EU-12 and one-third in the United States. Recent results developed forthe EU member States (Benassi, Workshop) and the OECD Member countries(Schreyer and Chavoix-Mannato, Workshop) show similar patterns.
Table 1. Size distribution of firms and employment share:selected OECD countries
Percentage of firms Percentage of jobsEU-12 United
StatesEU-12 United
StatesBase (millions) 15 780 5 074 95 000 93 469Micro enterprises (0-10 employees) 93.3 78.2 31.8 12.2Small enterprises (11-99 employees) 6.2 20.0 24.9 27.0Medium-sized enterprises (100-499 employees) 0.5 1.4 15.1 14.4Large enterprises (500+ employees) 0.1 0.3 28.1 46.3Total 100.1 99.9 99.9 99.9Note: Column sums do not equal 100 due to rounding errors.Source: EU-12 (1990), The European Observatory for SMEs, 1994, Table 2.2. Non-primaryprivate sectors; United States (1990), U.S. Small Business Administration, 1993, Table 1.11.
There is, in addition, considerable evidence to show that the proportion ofjobs found in SMEs has been increasing since 1970. The proportion of largefirms and the jobs they provide has been declining across many OECD Membercountries (Loveman and Sengenberger, 1991). This has important implicationsfor the capacity of OECD Member countries to respond to change, asemphasised in the OECD Jobs Study (OECD 1994a).
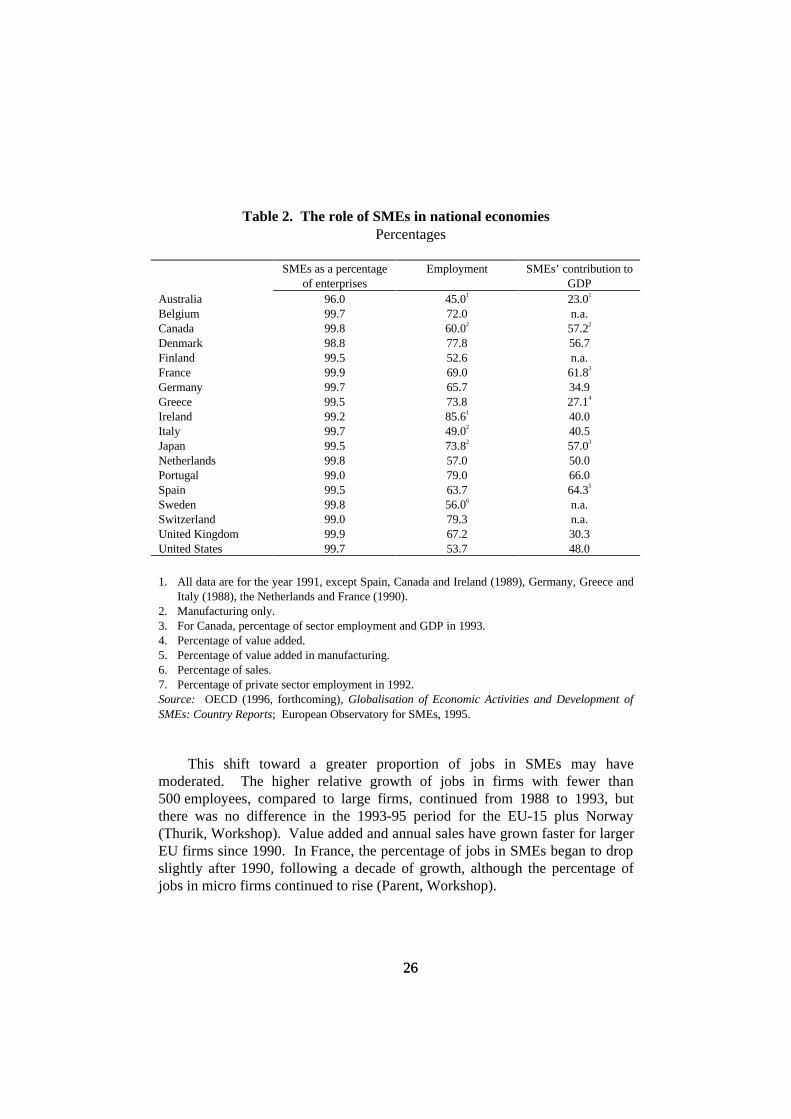
While precise comparisons are not possible, it is clear that SMEs makemajor contributions to all OECD Member countries (see Table 2). SMEs makeup over 99 per cent of all firms, are the source of 40 to 80 per cent of allemployment, and provide between 30 and 70 per cent of gross domestic product(GDP). Table 3 indicates changes in employment share by firm size. Except inJapan, the percentage of jobs provided by large firms declined in the 1980s.Most OECD Member countries have seen an increase in employment share forSMEs; the trend is particularly clear in Canada, Italy, the United Kingdom andthe United States.
2626
Table 2. The role of SMEs in national economiesPercentages
SMEs as a percentageof enterprises
Employment SMEs’ contribution toGDP
Australia 96.0 45.01 23.01
Belgium 99.7 72.0 n.a.Canada 99.8 60.02 57.22
Denmark 98.8 77.8 56.7Finland 99.5 52.6 n.a.France 99.9 69.0 61.83
Germany 99.7 65.7 34.9Greece 99.5 73.8 27.14
Ireland 99.2 85.61 40.0Italy 99.7 49.02 40.5Japan 99.5 73.82 57.03
Netherlands 99.8 57.0 50.0Portugal 99.0 79.0 66.0Spain 99.5 63.7 64.35
Sweden 99.8 56.06 n.a.Switzerland 99.0 79.3 n.a.United Kingdom 99.9 67.2 30.3United States 99.7 53.7 48.0
1. All data are for the year 1991, except Spain, Canada and Ireland (1989), Germany, Greece andItaly (1988), the Netherlands and France (1990).
2. Manufacturing only.3. For Canada, percentage of sector employment and GDP in 1993.4. Percentage of value added.5. Percentage of value added in manufacturing.6. Percentage of sales.7. Percentage of private sector employment in 1992.Source: OECD (1996, forthcoming), Globalisation of Economic Activities and Development ofSMEs: Country Reports; European Observatory for SMEs, 1995.
This shift toward a greater proportion of jobs in SMEs may havemoderated. The higher relative growth of jobs in firms with fewer than500 employees, compared to large firms, continued from 1988 to 1993, butthere was no difference in the 1993-95 period for the EU-15 plus Norway(Thurik, Workshop). Value added and annual sales have grown faster for largerEU firms since 1990. In France, the percentage of jobs in SMEs began to dropslightly after 1990, following a decade of growth, although the percentage ofjobs in micro firms continued to rise (Parent, Workshop).

2727
Table 3. Breakdown of employment by size of establishmentPercentages
Year Number of employees
1-19 20-99 100-499 >500G7 countries
Canada1 1984
19894.84.2
29.436.2
37.735.6
27.023.9
France2 1985
199025.828.8
20.420.4
18.316.4
35.334.4
Germany 19881990
16.718.8
27.526.8
17.316.9
38.437.5
Italy 19881990
47.551.1
23.622.4
10.310.0
18.516.5
Japan1 1988
199324.423.0
30.830.8
17.76
18.06
27.17
28.37
United Kingdom 19881991
32.133.0
15.016.1
17.717.2
35.233.8
United States3 19881991
17.720.3
19.918.6
14.914.2
45.546.9
Other OECD countries
Belgium4 1989
199118.019.0
31.032.0
21.021.0
30.028.0
Denmark 19881990
22.131.3
37.132.9
17.116.2
23.819.5
Greece 19841988
43.042.6
20.621.5
63.664.2
36.435.8
Ireland5 1986
19894.64.6
36.636.7
34.536.7
15.314.4
Portugal 19861990
15.517.0
33.936.4
22.722.0
27.924.4
Spain 19881990
35.943.2
30.426.6
16.912.4
16.817.8
Source: U.S. Small Business Association (1995), The State of Small Business: A Report for thePresident, Government Printing Office, Washington, DC; Small Business in Japan: White Paperon SMEs in Japan, 1995; The European Observatory for SMEs (1994), 2nd Annual Report.1. Manufacturing only.2. Employees only.3. By size of establishment (excluding agricultural establishments).4. Private sector only.5. Does not total to 100 per cent because between 7.6 and 8.9 per cent of establishments are not broken
down by year.6. These figures represent establishments employing 100-299 people.7. These figures represent establishments employing more than 300 people.

2828
It is clear that some jobs will always be in large firms and that the growthof the proportion of jobs in SMEs cannot continue indefinitely. On the otherhand, it is also clear that the majority of OECD business jobs are now in SMEsand that this phenomenon is likely to persist for the foreseeable future.
Sources of new jobs: analysis assumptions
What is not well understood, however, is that – up to now – not one dataset has been developed for the specific purpose of monitoring job flows amongdifferent sized business firms. Given the expense involved, this isunderstandable. Every analysis related to job creation by firm size has utilised adata set developed for other purposes. As a result, it has been necessary tomake assumptions about important features associated with these data sets.
Understanding the sources of these differences requires the examination ofa number of issues: the conception of a job-creating firm; identification of theappropriate decision-making entity in multi-establishment firms; identificationof firm births and deaths; and procedures for measuring firm size. For each ofthese issues, a range of alternatives is present which may affect the data patternsand conclusions. But a unique combination of assumptions may reflect ageneral assumption about the nature of the economic system and, in turn, pointto those issues worth serious attention.
Prior expectations and choice of definitions
The choices made in developing an analysis seem to reflect two differentconceptions of the economic system. One emphasizes a relatively stable systemdominated by large, slow-changing firms. Analysts starting from thisperspective may have a primary concern of ensuring that a system inequilibrium is accurately measured. The other conception is that of a morevolatile, turbulent system where change is considered the normal state of affairs.In this case, efforts may focus on attempting to provide a current, contemporarydescription of critical job creation processes. Definitions and assumptionsassociated with these different perspectives are presented in Table 4.

2929
Table 4. Conceptions of the economy and data collection decisions
Definitional feature Stable equilibriumLarge firm dominatedReduce measurement error
Volatile changeAll sizes contributeDevelop timely data
Business entity Ensure present employment(more than 5 or 20 employees)
All business entitiesAll firms with workers
Time between data collection 1 to 5 years acceptable Yearly, quarterly, or, ifpossible, monthly
Firm births Delay acceptance Include immediatelyFirm deaths Delay discontinuance Drop immediatelyMeasures of firm size Long-term averages to minimise
error of measurementCurrent period to capturepresent role in economy
Birth year size Wait several periods Measure earlyOwnership structure amongestablishments
Accept firms, establishments asequivalent
Preference for firm-levelanalysis
If it is assumed that OECD Member economies are in equilibrium, thenone would expect structural change to be slow, and the most significant firms tobe relatively enduring entities providing permanent jobs. The data collectionand measurement procedures would then be oriented toward providing accurateinformation about a cadre of large firms. Efforts to capture a “secondaryeconomy” of less significant, more volatile firms providing temporaryemployment would be seen as less important. These assumptions may, forsome sectors or time periods, be quite appropriate. For example, manufacturingfirms tend to take some time to implement and often change very slowly. Thismay have been an appropriate assumption for US manufacturing in theimmediate post-World War II period and other OECD Member countriesfollowing the post-World War II rebuilding periods.
This could lead, then, to analysing only firms above a certain size, say withmore than five or 20 employees. It may lead to collecting data on these firms atrather long intervals, say five years. It would lead to great care in accepting anew entry in the data set as a firm birth or death [one analysis treats firms as“born” when their employment grows to over 20; firms that drop below20 employees are considered “dead” (Parent, Workshop)]. Measures of firmsize may be developed to minimise “errors of measurement” by averaging sizereported over long periods of time, up to 15 years. Measures of “birth size”may be delayed to allow average size to be averaged over several periods. If, inaddition, it is assumed that critical staffing decisions are made in “productiveunits”, there may not be much concern as to whether establishments or firms aretaken as the unit of analysis.

3030
If, on the other hand, it is assumed that turbulence and change are anintegral part of the economic system and that firms and jobs are relativelyvolatile rather than permanent features of the economy, then quite differentdecisions will be made about the data required to accurately represent theeconomic system. All firms will be considered as significant and efforts will bemade to encompass all business activity in the data set. To capture changeswith precision, the lags between data collection periods will be shortened asmuch as possible, yearly at a minimum, ideally quarterly or even monthly.Firms will be incorporated into the data sets as quickly as possible, droppedimmediately they are no longer active. Measures of firm size will emphasizethe current role in the economy. Measures of the birth year size will attempt tocapture the firm as soon as it becomes an autonomous operating business.Finally, there may be a concerted effort to monitor decision-making businessentities rather than simply establishments, and some attention may be given towhether or not it is possible to monitor multi-establishment firms. This maylead to efforts to monitor shifts in ownership of establishments.
Conception of a business
A business entity can be considered as any independent activity thatparticipates in an economic system. An independent individual person may,conceptually, be responsible for one or more such entities. For example, ahousewife may provide childcare services during the daytime and typingservices during the evenings: two separate economic activities, two separateforms of self-employment. Many would not consider either activity a “realbusiness” unless other jobs are created. If this person hired an assistant to helpwith the childcare business, the activity would then be considered a job creatingfirm – particularly if the employer provided benefits and filed appropriate taxreturns for her childcare business employees.
For some analysts, a business activity may not be considered a firm unlessa certain number of “legally reported” jobs are created, five has been used inone analysis (Davis, Haltiwanger and Schuh; 1993) and 20 in another (Parent,Workshop). If a substantial proportion of new jobs are created by “microenterprises” with less than 10 employees, this criterion becomes an importantissue in identifying all sources of new jobs. A recent US analysis, for example,suggests that the 0-4 firm size is particularly important as a source of new jobs(US Small Business Administration, 1994b).

3131
Structure of multi-establishment firms
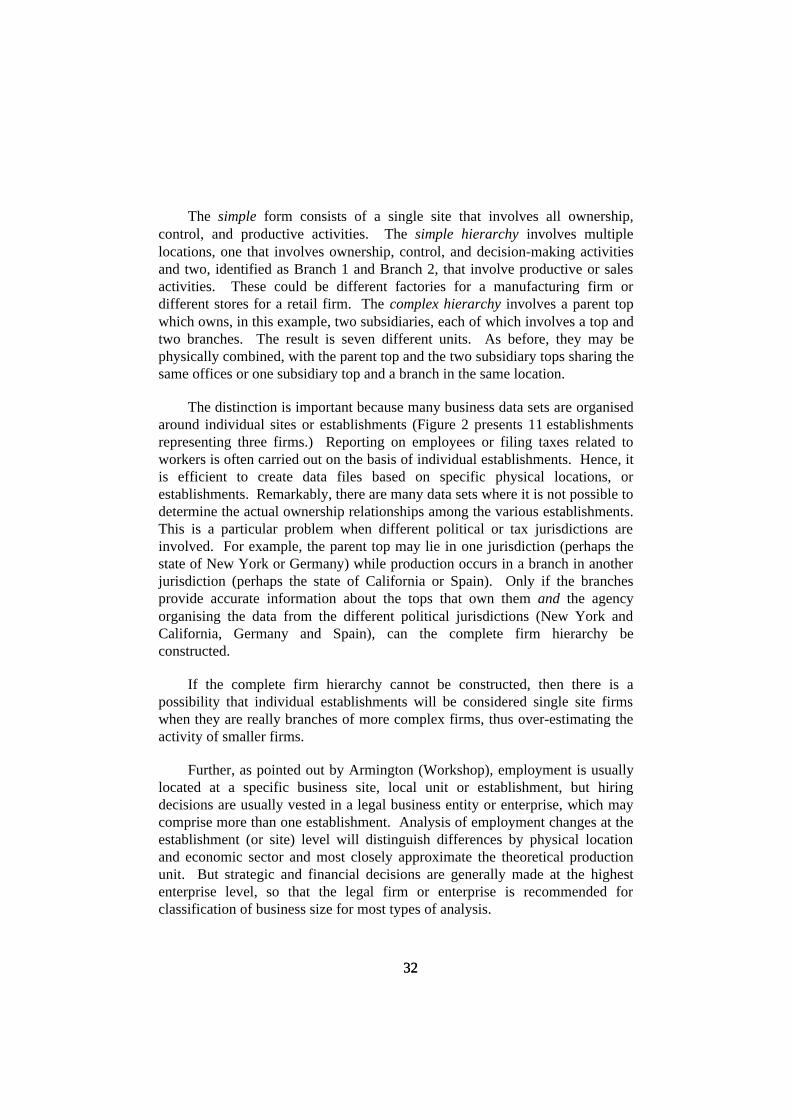
Most business activity occurs at a well defined physical site, plant orlocation, referred to as an “establishment” in the technical literature. However,many firms have several different sites. The work of all the units may beco-ordinated at a single location. Several forms are possible, as shown inFigure 2.
Figure 2. Alternative business organisational structures
Simple
Single Site
Branch 1
Simple Hierarchy
Top
Branch 2
Simple
Complex Hierarchy
Single Site
Parent Top
SubsidiaryTop A
SubsidiaryTop B
Branch 1
Branch A1 Branch A2 Branch B1 Branch B2
3232
The simple form consists of a single site that involves all ownership,control, and productive activities. The simple hierarchy involves multiplelocations, one that involves ownership, control, and decision-making activitiesand two, identified as Branch 1 and Branch 2, that involve productive or salesactivities. These could be different factories for a manufacturing firm ordifferent stores for a retail firm. The complex hierarchy involves a parent topwhich owns, in this example, two subsidiaries, each of which involves a top andtwo branches. The result is seven different units. As before, they may bephysically combined, with the parent top and the two subsidiary tops sharing thesame offices or one subsidiary top and a branch in the same location.
The distinction is important because many business data sets are organisedaround individual sites or establishments (Figure 2 presents 11 establishmentsrepresenting three firms.) Reporting on employees or filing taxes related toworkers is often carried out on the basis of individual establishments. Hence, itis efficient to create data files based on specific physical locations, orestablishments. Remarkably, there are many data sets where it is not possible todetermine the actual ownership relationships among the various establishments.This is a particular problem when different political or tax jurisdictions areinvolved. For example, the parent top may lie in one jurisdiction (perhaps thestate of New York or Germany) while production occurs in a branch in anotherjurisdiction (perhaps the state of California or Spain). Only if the branchesprovide accurate information about the tops that own them and the agencyorganising the data from the different political jurisdictions (New York andCalifornia, Germany and Spain), can the complete firm hierarchy beconstructed.
If the complete firm hierarchy cannot be constructed, then there is apossibility that individual establishments will be considered single site firmswhen they are really branches of more complex firms, thus over-estimating theactivity of smaller firms.
Further, as pointed out by Armington (Workshop), employment is usuallylocated at a specific business site, local unit or establishment, but hiringdecisions are usually vested in a legal business entity or enterprise, which maycomprise more than one establishment. Analysis of employment changes at theestablishment (or site) level will distinguish differences by physical locationand economic sector and most closely approximate the theoretical productionunit. But strategic and financial decisions are generally made at the highestenterprise level, so that the legal firm or enterprise is recommended forclassification of business size for most types of analysis.

3333
Identifying a firm birth and death
Most analysis using large-scale data sets is based on comparisons of thedata sets at two points in time. Five types of impact can be identified (none,birth job gain, expansion job gain, death job loss, contraction job loss). Theseare outlined in Table 5. The actual data set for a given country may, however,contain several million records (each line in Table 5 would be part of a record):a record for each single enterprise (site, plant or location) or for each single firm(with one or more sites).
Table 5. Establishment changes over time: alternative inferences
ID number Time 1 Time 2 Classification Effect on jobs1 10 jobs 10 jobs Stable None2 Not present 8 jobs Birth 8 created3 6 jobs Not present Deactivated 6 lost4 10 jobs 16 jobs Growth 6 created5 13 jobs 5 jobs Shrink 8 lost6 495 jobs 505 jobs Small to large firm 10 created7 505 jobs 495 jobs Large to small firm 10 lost
Several features of this procedure are important. The actual period thatelapses between Time 1 and Time 2 is of some consequence in makinginferences about firm and job turbulence. A period of several years, which isnot uncommon, may not include firms that are implemented, create jobs,operate, and disappear in a short period of time. Further, a typical analysisinvolves a count of total jobs. The total number of jobs may be the same, as forBusiness 1, but the jobs or occupants may have undergone substantial change.Such changes which are internal to businesses cannot be identified in this typeof analysis (this would require a more complex and detailed data set on bothfirms and employees).
If the procedures for monitoring individual businesses are “imperfect”,firms that are in continuing operation may be missed at Time 2 and erroneouslyclassified as deactivated, and firms that were in existence prior to Time 1 maybe classified as births. This type of problem is particularly acute where thereare changes in ownership – establishments are bought or sold – or where firmshave a temporary period of dormancy (some businesses, such as those in touristor vacation areas, are seasonal and only operate during portions of the year.)This is one reason that longitudinal studies of new firms based on high response

3434
rate surveys have higher survival rates than analysis based on administrativedata sets (Kirchhoff, 1994, Chapter 8).
Finally, it should be mentioned that the start-up process associated with theconception, gestation, and birth of new firms is substantially more complicatedand involved than registering the firm, completing a credit rating form,answering a government questionnaire, or filing a tax return. While it is notclear at what stage in the start-up process new firms are incorporated in theselarge-scale data sets, it is clear that it occurs relatively late in the process, aftermany other activities have occurred and much effort has been spent (Reynolds1995a, 1995b). Efforts to provide harmonised data bases within the EU areencouraging each EU State to establish business registries (Benassi, Workshop),however the basis for entering the registry is not standardised. Thismeasurement in variation could lead to some variation in patterns.
Procedures for measuring firm size
Measuring firm size is important to allow the percentage of jobs created bya firm to be calculated. Such calculations require that a “base size” beestablished. Given the types of data sets underlying the presentation in Table 5,there are several alternative methods for measuring firm size, based on thenumber of jobs (Armington, Workshop): firm size at Time 1; firm size atTime 2; or an average of measures from two or more data points. The choiceof method depends somewhat on assumptions about establishments and theirrole in the productive system.
If it is assumed that establishments (or plants) are designed to have an“optimal size”, one that will produce the lowest cost per unit of output, then thechoice of size measure should approximate this optimal size. If data areavailable for a number of points in time, rather than two, and cover a fairly longperiod, say five or ten years, then the use of an average figure to establish firmsize may be justified. Such a procedure assumes that short-term shifts innumber of employees, over one to two years, are temporary aberrations, ratherthan responses to changes in economic conditions – costs or market demand:
“A research programme analysing job dynamics has used theU.S. Bureau of the Census, Center for Economic StudiesLongitudinal Research Datafile (LRD). This file representsa sample of US manufacturing plants that involves annualdata on total plant employment from 1973 through 1988.The assumptions regarding measures of size are clearlystated: employment often fluctuates from year to year,

3535
because of demand variation and other factors, average plantsize provides a better indication of the production unit’sintended scale of operations. Hence, for most purposes,average size is preferred to current size. For similar reasons,current size is preferred to base year size.”
(Haltiwanger, Workshop)
Average plant size is the weighted mean number of employees over allobservations available during the 1973-88 period. Firm size equals theweighted mean number of manufacturing workers employed by a plant’s parentfirm computed over all observations of the firm in the six data points in theCensus of Manufacturers (completed every five years from 1963-87). In thisstudy, then, it is assumed that the optimal, or most profitable, size of a plant ormanufacturing firm in 1963 was the same as the optimal size in 1988 – twodecades later.
Assuming a firm has a “best size”, a temporary reduction in employmentmay cause a firm to be classified as small, and the correction – job gain – maybe classified as a small firm growth. A temporary increase may cause a firm tobe classified as large, and the correction – job loss – may be classified as a largefirm contraction (Picot and Dupuy, Workshop). Note that this requires a firm tobe on the borderline between two categories, and the change in jobs largeenough to be significant.
This is often referred to in technical discussions as the “regression to themean” phenomena, reflecting an assumption that there is a “true” or “right” sizeand that incorrect size data is simply “measurement error”. There is concernthat this “measurement error” – a temporary aberration in the base year size –will increase the proportion of new jobs allocated to smaller firms. Many of theprocedures to create a more stable measure of “base year size” are designed tominimise the “measurement error” and, in turn, the influence of the “regressionto the mean” problem. (Technically speaking, since regression analyses are notactually performed, this is a misuse of the term “regression to the mean”.)
On the other hand, if one assumes that managers, owners or entrepreneursare constantly adjusting employment to maximise short-term profits –increasing employment as demand increases and workers are available,decreasing employment as demand falls to reduce costs – then the mostdefensible measure of size may be that at the beginning of a given period. Thisis the size before employment is adjusted in response to changing cost factors ormarket opportunities. Some would consider this to be one of the major

3636
responsibilities of managers, owners or entrepreneurs; a responsibility that hasbecome more critical with increases in market turbulence and economicuncertainty and, in turn, risks to profits.
As pointed out by Armington (Workshop), a recent analysis of UKplant-level changes over ten years found no evidence of size convergence forany of five size categories (Konings, 1995). This suggests that there is notendency for long-term convergence to an optimal size and that, by default, thesecond assumption may be the more appropriate.
Birth year size
Table 5 illustrates one business, ID 2, which was not present in Time 1 butwhich was located at Time 2 with eight jobs. If the Time 1 size of zero is usedin the calculations, the percentage of job growth will be infinite for this period.To avoid this result, other procedures may be employed. For example, onecould use either the average size over the time period (i.e. four jobs for firmID 2), yielding a 100 per cent job growth rate over this period, or the size inTime 2, giving a 0 per cent job growth rate for the period. The mostconservative solution is to treat the birth job creation as including job growthfor the same period. Job growth would not be computed until after the firstperiod.
This could be more of a problem with the founding of branches. For thespeedy creation of a manufacturing facility, a major retail outlet may createhundreds of jobs within several months, falling between Time 1 and Time 2 formost data sets. These new entities would only be picked up in Time 2, asillustrated in Table 5. This illustrates the importance of knowing thehierarchical structure of the establishments analysed as such events shouldprobably be treated as the expansion of a multi-site firm, and not as anindependent firm birth. It would be very rare for an independent business start-up to create hundreds of jobs in a short time period.
Gross and net job changes
Net job change over a time period is simply the difference between jobscreated and jobs lost. The methodological breakthrough developed in the earlystudies (Birch, 1979; Armington and Odle, 1982) was simply the capacity toproduce comparisons similar to those of Table 5 for entire economic systems.Previous analysis focused on changes in the total number of jobs: the netchange. The righthand column of Table 5 indicates that for these sevenbusinesses, 24 jobs were created and 24 jobs lost with no net job change. There

3737
were, in addition, one firm birth and one firm death, with no net change in thenumber of firms.
This finding – that gross firm and job turbulence may be substantiallygreater than net changes – is almost universal. It provides a way to emphasizethe importance of a given size category of businesses. It is always possible toemphasize gross job creation rather than net job creation and arrive at a higherfigure. This can be done with firms in any size category, whether it be micro,small, medium or large. The effect may be particularly dramatic where a netjob loss occurs, for the increased job loss if a given size sector had not producedgross job creation can be emphasized.
Sources of new jobs: recent analyses
The first efforts to determine the dynamics of job flows, the second issue,produced unexpected findings. The initial analysis indicated that up to 80 percent of net job gains in the United States were provided by new firm births andsmall firm expansions – and not by established large firms (Birch, 1979).Further analysis suggested that this estimate varies with the economic cycle,with small firms providing a greater proportion of new jobs in recessions, and ashare equal to that of large firms during economic expansions (Armington andOlde, 1982; Kirchhoff, 1994). The most recent analyses in the United Statesindicate that new and small firms provide gross and net jobs in about the sameproportion as their role as sources of jobs at any given time. For example, firmswith less than 500 employees provided 51 per cent of the 86 million jobs in1984, and 51 per cent of the 97 million jobs in 1988. They also provided48.5 per cent of the net job gain over these four years. The slightly larger shareof net job gains among firms with over 500 employees was due to the expansionof large firms in the retail and communication, transportation, and utility sectors(U.S. Small Business Administration, 1994a, Tables 2.13, 2.15).
Similar findings were reported in a recent analysis based on a longitudinalsample of manufacturing plants (not firms) with five or more employees from1972 to 1988 (Davis, Haltiwanger and Schuh, 1993). Table 3 of this analysisindicates that manufacturing firms with 5 to 500 employees provide 35 per centof all jobs, 46 per cent of gross job gains, and 43 per cent of gross job losses fora net job gain of 3 per cent. In contrast, manufacturing firms with more than500 employees provide 65 per cent of jobs, 53 per cent of gross job gains, and56 per cent of gross job losses for a net loss of 3 per cent. The implications foreconomic growth are somewhat complicated by the fact that there was a net lossof manufacturing sector jobs over the entire period.

3838
There have been shifts in the proportion of jobs provided by small or largefirms, but there is substantial evidence to show that both large and small firmsare substantial sources of gross and net new jobs. The extent of SMEcontributions tends to vary by size definition, state of the economic cycle,emphasis by economic sector, and size distribution of firms within theeconomy. This latter finding, related to job creation and firm size, has been thesource of some misunderstanding and controversy. Several recent analyses (ofmanufacturing in the United States; all economic sectors and all firms inCanada; and all firms with over 20 employees in France) illustrate the impactof different combinations of measurement procedures and assumptions on theoutcomes.
United States: manufacturing
One analysis of sources of job changes in the US manufacturing sectoruses assumptions consistent with the notion that economies are relatively stableand slow to change (Haltiwanger, Workshop). Average establishment (plant)size was computed as the weighted mean number of employees over allobservations available during the 1973-88 period. Firm size equals theweighted mean number of manufacturing workers employed by a plant’s parentfirm computed over all observations in the six data points in the Census ofManufacturers (completed every five years from 1963-1987). In this study,then, it is assumed that the optimal, or most profitable, size of a plant (with thesame geographic location) or manufacturing firm in 1963 was the same as theoptimal size in 1988 – two decades later.
Using nine plant sizes (0-19 to 5 000+) and twelve firm sizes (0-19 to50 000+), the analysis indicates that the annual rates of job creation and jobdestruction decline substantially with size for the 1973-88 period (Haltiwanger,Workshop, Figure 1). For the smallest plants and firms both creation anddestruction exceed 16 per cent, and for the largest categories both are above6 per cent. This means that for the smallest size categories one-third of jobs arecreated or destroyed each year and, if there are no job changes internal to thebusiness, about one-in-eight for larger plants and firms. However, as this is asector in decline, the job destruction rate exceeds the job creation rate for allsize classes.
The effect of alternative plant size definitions on net job growth indicatesthat only if a base year plant size measure is used will any positive net jobgrowth be identified, and then only for plants with less than 50 employees(Haltiwanger, Workshop, Figure 2). All other size measures and size categoriesare associated with net annual jobs losses in US manufacturing from 1973-88.

3939
An analysis of the net contribution to job creation (or relative job losses for thisdeclining economic sector) by plant or firm size finds, as do most other studies,that the contribution is in proportion to the share of total jobs (Haltiwanger,Workshop, Figure 3). In other words, most manufacturing jobs are in largefirms, and large firms create and destroy more jobs than smaller firms.
The fact that new firms have higher growth rates leads to an analysis of netjob creation with controls introduced to eliminate the effect of plant(establishment) age. An additional control is introduced by considering growthin relationship to average total manufacturing net growth. As this “growth” hasbeen negative over the entire period, the comparison avoids presentationsdominated by negatives. Using two different measures of plant size, current andaverage, the results are quite similar. The use of age controls results in positiveresults for larger plants and negative results for smaller plants (Haltiwanger,Workshop, Figure 5). This is particularly dramatic when average plant size(computed over a period of several years) is considered, for then only smallfirms show a major deviation from the manufacturing growth average and it isstrongly negative only when age controls are introduced.
This analysis makes it possible to control for a central feature of smallfirms – this group will include almost all of the new firms. This reflects a staticconception of the economic order as composed of a fixed and stable set ofactivities with little change in the population of firms that make up the businesspopulation.
This is in contrast to a recent all-sector analysis of the United States usingdata developed by the Bureau of the Census for 1989-91. This analysisindicates that firms with 0-4 employees (included in the 0-19 job category in theanalysis above) created 95 per cent of all net new jobs; the remaining 5 per centwere provided by firms with more than 500 employees; and there were net joblosses in all other size categories (U.S. Small Business Administration, 1994b).Because of the short time period and the newness of this data set, it is notpossible to create an average firm size over a number of previous periods,leading to the emphasis on a base year indicator of firm size. It is also notpossible, given this data set, to control for firm age and separate the impact ofnew small firms from that of established small firms.
Canada: all sectors
The capacity to analyse the contributions of SMEs to Canada’s economicwell-being is substantially enhanced by the Longitudinal Employment AnalysisProgramme (LEAP) company-level data file (Picot and Dupuy, Workshop).

4040
This includes each Canadian business (925 000 in 1992) that issued a record ofemployment earnings for tax purposes. Only jobs in agriculture, health,education and government sectors are excluded. Establishment- and firm-leveldata are now available for 1978 through 1992, although there was a change inprocedures in 1989, requiring care in temporal comparisons. A second fileprovides data on manufacturing for the 1970-90 period.
In terms of the central issue – the relationship of firm size to job gains –this database allows the use of four different size measures: i) base year size;ii) current average size (over the period); iii) prior average size (for twoprevious periods); and iv) long-term average size (for multiple prior periods).Using the first three measures of firm size, the authors report two basic findings.First, the choice of the measure of firm size has a very large effect on theresults. Second, no matter which measure is employed, both gross job gain andgross job loss are concentrated in the small firm sector, and the rate of job gainand job loss decreases monotonically as size increases (Picot and Dupuy,Workshop, p. 5). It should be noted that different measures of firm size do notaffect the proportion of total employment provided by different sized firms.
Using only the longer data file on manufacturing firms, the same patternswere found as with analysis of Canadian firms in all economic sectors, smallerfirms provide more of the net job gain. When the Canadian data set is modifiedto emphasize establishments and match that used in the US analysis discussedabove (Haltiwanger, Workshop), the use of alternative measures of size has aneffect similar to that observed in the United States, but the conclusions are notchanged – smaller plants provide greater net job gain (Baldwin and Picot,1994). This suggests a fundamental difference between Canada and UnitedStates in terms of their manufacturing sectors, perhaps related to the greater roleof larger manufacturing firms in the United States.
Over the 1983-91 period the Canadian analysis finds that in all sectors,including manufacturing, small firms have increased both their share of jobs andpayroll, although the payroll share has not increased as much. Further effortswere undertaken to explore the contribution of continuing firms, excludingthose that were created or discontinued during this period. Again, it was foundthat among continuing firms, the major sources of jobs gains were the smallerfirms. Further, when firms within each size class were considered, most of thejob gains and job losses were provided by a minority of firms. The concept ofan “average” firm – small or large – was considered misleading. Finally, the1983-89 period was broken down into two three-year periods to determine theextent to which change patterns, growth or decline, continued over time.

4141
Change patterns in one period were not found to be related to change patterns insubsequent periods.
France: all sectors, micro-enterprises excluded
A panel of businesses based on tax returns and annual surveys has beenimplemented in France to create the SUSE (Système Unifié de Statistiquesd’Enterprises). It is based on a consolidation of data in the Register ofEnterprises and Establishments (the Siren code) and annual filings with theDirection Générale des Impôts (French tax administration). A separateadministrative identifier is used by the French state tax authority; for the1984-92 period, 3.5 million firms had a unique tax identifier.
For this analysis three size classifications were used: petite (or micro inEU terms) of 0-19 employees; small (20-499 employees), and large (or grande)of over 500 employees. A unique feature of this analysis was the fact that itconsidered only those establishments and firms with more than 20 employees;dynamic processes in micro firms (0-19 employees) were ignored. Firms thatgrew to more than 20 employees were considered births; those that shrankbelow the criteria of 20 employees were considered deaths. Further, theanalysis emphasized firms that may be composed of one or more establishmentsor sites, but ownership by a larger parent (or group) was not considered in theprimary analysis. Hence, a firm may be considered as independent even thoughit was the legal subsidiary of a larger economic organisation (Parent,Workshop).
The basic findings of this analysis, however, were quite similar to those forstudies of other OECD Member countries using different procedures anddefinitions. The proportion of jobs associated with small firms(20-499 employees) rose steadily from 1985-92, although most of this shiftoccurred between 1985-88. This was true for all economic sectors and wasaccompanied by a shift in jobs from manufacturing to market services.
Most distinctive was the attention to the structure of establishments amongsmall firms with 50-499 employees. Within this size group the size of thetypical establishment, even in multi-establishment firms, appeared to beshrinking. This may have reflected the shift away from manufacturing, whereestablishments tend to be larger. There was, however, more stability among theestablishment ownership of firms employing 20-499 people than among those inthe 500+ category. Small firms that disappeared as independent entities wereno different from those that continued in operation, perhaps because one-thirdwere taken over by a larger organisation. These groups were considered

4242
responsible for much of the turbulence among the SMEs they control assubsidiaries.
Not only is the proportion of SMEs owned by groups increasing, but asubstantial proportion of SMEs are creating new groups. This suggests thatmany French SMEs may not be the independent operations often characterisedin the discussions on small firms and entrepreneurship.
Potential for cross-national analysis
Efforts to develop a more comprehensive understanding of complexphenomena are enhanced when the range of situations or contexts available foranalysis can be expanded. As the number and diversity of settings in which apattern is observed grows, confidence in the universal nature of the patternincreases. In addition, the ability to explore the effect of contextual variation onfundamental phenomena is facilitated by cross-national analysis. A number ofefforts are now underway to create data sets for different countries in order tofacilitate cross-national comparisons.
Eurostat
The Statistical Office of the European Communities, Eurostat, has stressedthe importance of SME data since the late 1980s (Benassi, Workshop). It isnow re-organising all statistics on enterprises in the European Union countries.Initial work, after World War II, assumed that a small number of large andmedium-sized industrial units played the major role in the economy. It wasrelatively inexpensive to gather data from a few thousand firms. The expansionand importance of economic sectors dominated by SMEs has required asubstantial change in objectives and data gathering methods, as well asincreased resources, since millions of production units now have to be covered.As of 1990, 14 million firms employed 92 million people in the EU-12.
Appropriate representations of the post-industrial economy reflect a needto gather data that will cover the scope and range of EU SMEs, accuratelyreflecting their diversity. This requires: an understanding of the coverage, orlack of coverage, in the various EU member States; procedures that canaccurately reflect the dynamic changes in the firm population and theireconomic focus; use of an appropriate unit of analysis (a set of productiveactivities with co-ordinated decision making); determining and harmonisingappropriate size categories; and a capacity to determine firm changes in size.

4343
In co-ordinating the reform of member State statistics on enterprises,Eurostat has promoted a comprehensive approach, including: harmonisation ofbasic concepts and of classification of activities and products; definition of theminimum data to be supplied at EU level; establishment of central registers ofenterprises; use of modern methods of data processing and communication;and maximum use of the administrative sources available in order to reduce, asmuch as possible, the statistical workload for businesses. This has involved:broad consultation with member States; the provision of standards for theoutcomes but flexibility in procedures within the member States; and, incollaboration with various member States, the development of pilot projects.Creation of useful SME data is one of these pilot projects.
Major changes that are in development for the entire EU with regards to allenterprise statistics include: standardisation of the economic sectorclassification (NACE, Rev. 1); stipulation that all countries must developcomprehensive central registers for all businesses; and specific core data to becollected from all businesses (with some variation across difference economicsectors). The SME project is a collaboration between the EU DirectorateGeneral XXIII and Eurostat, and involves the voluntary participation of nationalstatistical institutions in the member States. It involves standardising the dataproduced in tabular form for all countries, exploratory work on appropriateSME indicators (business demographic indicators, job changes, annual sales,value added, etc.). This work has already been the basis for a series of reportsdescribing enterprises in Europe, and data is shared with the OECD on a regularbasis.
OECD: the Industry Committee’s Ad Hoc Group of Experts on SME Statistics
In 1984, the OECD survey based on the Information System on IndustrialStatistics (ISIS) began collecting data by size of establishment, providing asignificant level of industry detail in manufacturing. In 1992, an Ad Hoc Groupof Experts on SME statistics was created to develop a statistical database onSMEs (by size of enterprise) in co-operation with Eurostat, in order to reducethe reporting requirements of Member countries (Schreyer and Chavoix-Mannato, Workshop) and to improve the international information on SMEs.Jointly collected OECD/Eurostat data by enterprise size is assembled with lesseconomic sector detail, but covers the entire private sector (manufacturing andservices).
Whereas industry-level data, disaggregated by firm or establishment size,is useful to describe and analyse, for example, the size distribution ofemployment or firms by industry, it is less suited to capture the dynamics ofemployment change.

4444
The analysis of the dynamics underlying job changes requires data atestablishment level and entails a number of methodological issues: source ofdata; definition of size classes; economic sectors covered; unit of analysis(establishment or enterprise); definition of births, discontinuance, and failure;full versus part-time jobs; and time interval for analysis. High qualitylongitudinal data can be very expensive, delaying development. A preliminarycomparison of studies covering four OECD countries (Canada, Sweden, theUnited Kingdom, the United States) indicated that gross job creation anddestruction were higher in smaller firms and, with one exception, net changeswere higher for smaller firms, although most authors were careful to stress thelimitations of their analysis and avoided direct policy conclusions.
A more complete analysis of the issue, utilising data from 11 OECDMember countries (Canada, Denmark, Finland, Germany, Italy, Japan,Netherlands, New Zealand, Sweden, the United Kingdom, the United States)was completed soon after the workshop (Schreyer, 1995). Sources of gross jobcreation and gross job destruction for the largest of the OECD Membercountries are presented in Table 6 (Annex A presents the detailed analysis).This presents businesses in three size categories: fewer than 100 employees,100-499 employees, and 500 or more employees. For each category andcountry, it shows the percentage distribution of annual job gains due to birthsand expansions and of annual job losses due to contractions and deaths. Thetable breaks down the sources of job volatility, not the change in total jobs: thetotal number of jobs may have increased, declined, or remained stable over theperiod. Table 6 shows that, on the whole, small enterprises have contributedmore to job gains than to job losses, implying that their share in total net jobcreation has increased.
However, in order to fully assess the role of SMEs in job creation, the netemployment gains of each size class must be expressed relative to the stock ofinitial employment in each size class. Annex A presents these net job creationrates. Despite significant differences in time periods, units of analysis andmethods of classifying firm size, many countries reveal the same pattern: netjob creation rates tend to be greater in smaller firms. One exception is Japan,which did not provide data on firms with fewer than 30 employees. As firms inthe 0-29 category represent a major source of jobs and job volatility in mostOECD Member countries, the results for Japan might change if these smallerbusinesses were included. The results provide evidence to support theconclusion that, for the periods examined, SMEs have provided adisproportionate share of gross and net job gains in OECD Member countries.

4545
Table 6. Job gains and job losses by firm size: selected G7 countriesPercentages
Canada Italy Japan Germany UnitedKingdom
UnitedStates
1978-92 1984-92 1987-92 1978-93 1985-91 1987-92
Job gains by sizeLess than 100 69 83 45 44 68 34100-499 13 13 36 32 13 41500+ 17 8 20 24 19 25Total 99 100 101 100 100 100Job losses by sizeLess than 100 60 76 51 36 64 28100-499 16 11 33 28 13 39500+ 23 13 17 36 23 34Total 99 100 100 100 100 100Net change in distributionLess than 100 9 7 -6 8 4 7100-499 -3 -2 3 4 0 2500+ -6 -5 3 -12 -4 -9Sum 0 0 0 0 0 0
Note: Some column sums do not equal 100 due to rounding errors.Source: Calculations based on Schreyer (1995).
OECD: the Directorate for Education, Employment, Labour and Social Affairs(DEELSA)
More comprehensive and internationally comparable data on job turnover(creation and disappearance of positions) and labour turnover (movement ofworkers into and out of jobs) is important in understanding the processes of jobcreation, labour turnover, and job stability (Grey, Workshop). Net job changeswithin firms and net job changes in an entire economy are always less thangross job reallocation. Disaggregation to provide measures of the variouscomponents requires data at the establishment or firm level. A precise portrayalrequires unambiguous definitions of firms and establishments, and their birthsand deaths.
Business registers provide a useful census of firms or establishments, andfacilitate longitudinal records for employment and their changes. For somepurposes, establishments are a preferred unit of analysis. Eurostat consideredthis the Local Unit (a geographically identified place where one or more personswork for the same enterprise). For other analysis the enterprise or firm is thepreferred unit of analysis. Eurostat emphasizes the operating enterprise, the

4646
smallest set of establishments producing goods and services withdecision-making autonomy, rather than the legal owning enterprise. Eurostatcriteria for determining if a unit has opened or closed are related to changes inownership, activity, workforce, products, or location. Understanding variationamong units in terms of job turnover requires additional data on annual sales;output; employment; capital stock; investment; and research and developmentactivities.
A review of data available across the G7 countries (and Denmark andSweden) indicates substantial variation. Most, but not all, countries can providebusiness registries for all economic sectors. Employment coverage also varies,with self-employment separated in some cases, while for other countries publicand private employment are combined for some economic sectors. There isdiversity among other variables and the capacity to produce longitudinal data.
The overview suggests that a number of definitional and measurementdifferences currently exist across the G7 countries. It is possible, however, todevelop more comparable establishment data sets within the constraints of theinformation available for the short term. The development of more similarsources, such as the use of business registers in all countries and, beyond this,the linking of census and survey data is clearly a longer-term project.
Among the range of definitional issues, differences in the way openingsand closings (births and deaths) of firms or establishments are defined hasreceived considerable attention (Grey [b], Workshop). This is especiallyrelevant to estimates of job creation – truly new job creation as opposed totransfers of existing jobs among different legal units. This may be as importantas the definition of unit of observation – establishments or firms.
Changes in administrative identification numbers have frequently beenused but this method is neither systematic across countries nor adequate formany purposes. Two strategies to address the problem have been: i) to developcomparable business registries across countries, as proposed by Eurostat; orii) to allow research teams to develop bilateral or trilateral comparisons amongcountries by working to modify the relevant data sets in each country.
A temporary solution, although less satisfactory than either of the long-term resolutions outlined above, can provide some immediate comparisons. Itis noted that four countries with some longitudinal data on firms orestablishments (Canada, Germany, Norway and the United States) and diversityin a number of measurement procedures or definitions, share substantialsimilarities: i) stable employment gains from openings over the economic

4747
cycle; ii) cyclical changes dominated by expansions and contractions;iii) closure rates that are unpredictable, although correlated with opening rates;and iv) new firm five-year survival rates of 40-60 per cent. As the data sourcescover practically the full range of possible sources, the results suggest thatdifferent types of screening methods do not affect the broad outlines of businessdynamics.
Commentary
A great deal of effort has been devoted to assembling harmonised data setsamong the Member countries of Eurostat and the OECD. This is clearlyexpensive, as it requires expansion to all businesses, establishments and firms,and it may take some time before both conceptual and operationalharmonisation of the data sets is achieved. The current resource constraintssuggest careful, joint consideration of which aspects of existing data sets shouldreceive priority attention (McMechan, Workshop). However, all thepreliminary studies indicate a substantial level of similarity in the basic patternswhen conceptual harmonisation is achieved, suggesting that even greatersimilarity will be present when comparability is also present at the operationallevel. The respective roles of SMEs and large firms in job growth, however,appear to differ over the business cycle. Data covering complete businesscycles, and not just the same calendar years, will be required for these moreprecise comparisons. The current results are promising and similarity mayimprove as data covering the entire business community and the full businesscycle become available for cross-national comparisons.
Both Eurostat and OECD have proposed the creation of business registersas the preferred strategy for creating accurate censuses of business entities.However, the mechanism for creating such registers is left to individualMember countries. Thus, a substantial possibility exists that new firms willenter these registries at different stages of the start-up process. Rather thanstandardise procedures for the creation of registries, which is likely to beimpracticable, it would be possible to calibrate the differences across countriesby implementing sample surveys with a uniform methodology in all OECDMember countries. Such a survey, developing random samples of firms ingestation, could provide information on the particular stage in the start-upprocess at which these new firms entered the national registry (Reynolds,1995a, 1995b). This would provide independent assessment of the effects ofdifferences in procedure on the differences found in cross national comparisons.

4848
Policy implications
There are a number of persistent findings regarding the sources of existingand new jobs:
• There is well established evidence from a variety of sources for almost allOECD Member countries to show that micro, small and medium-sizedfirms are a major source of non-government jobs and economic output.While large firms will always have a major role in economic life, theproportion of jobs and output provided by SMEs has increasedsubstantially since 1970.
• There is considerable evidence to suggest that micro, small, and medium-sized firms are a major source of new jobs. If data sets are developed toprovide broad coverage and monitor turbulence and volatility amongfirms and jobs, the analysis may indicate a greater contribution of smallfirms.
• The impact of new firms, most of which are small, appears to be of someimportance. Future data sets should make it possible to separate newfirms from established firms.
The significance of these findings, combined with the evidence that avigorous new, small firm sector may contribute to economic growth (reviewedin Section II above), fully justifies a more sustained effort to understand the roleof firms of all sizes in job creation. This analysis would be substantiallypromoted if it were possible to consider the effects of variations in culturalfactors and institutional arrangements among the OECD Member countries.This will be facilitated by the creation of harmonised data sets that can monitorthe job creation process in all OECD Member countries. Current efforts in thisdirection are quite promising.
IV. Innovation and New Firms
Assuming that small firms play an important role in advancing economicgrowth, and that turbulence and change in the economic system accompaniesthis growth, then it is reasonable to expect new and small firms to have animportant role in the development and spread of innovation. Adoption ofinnovation may, in turn, have major impacts on new and small firms. This leadsto an analysis of three issues: SMEs as sources of innovation; adoption ofinnovation by SMEs; and the extent to which innovation affects the growthtrajectory of new firms.

4949
Firm size and the production of innovation
There is increasing evidence that new or small firms play an important rolein the production of innovation. As discussed below, much of this evidence hasrecently been developed. A systematic study of an important sub-set of newsmall firms in France indicates the difficulty of developing high growthR&D-based new firms.
Perhaps the most important feature of research on the origins of innovation(Acs and Audretsch, Workshop) is a considerable shift in the understanding ofthe major sources of innovation. After World War II, it was widely assumedthat large, established corporations were the major sources of everything –exports, economic growth, jobs and innovation. Much research was actuallyconducted with only these types of organisations, such as comparing reportedR&D budgets among the Fortune 500. Large established organisations wereconsidered to have natural advantages favouring innovative activity.
Yet the research story is one of the advances in the measurement ofinnovation leading to a new conceptualisation of organisationally producedinnovations. Innovation, creativity or originality are among the most difficultconcepts to measure in social science. Research focusing on the amount ofresources devoted to research and development (R&D) have tended to show thatlarger organisations spend more money on R&D. Larger organisations are easyto locate and are more likely to create detailed financial statements (Acs andAudretsch, Workshop). However, when measures of output, such as patentsfiled or innovations in markets or economic sectors are monitored, a differentportrayal of new and small firms emerges. Firm size becomes less critical thanother issues. This is particularly true when sources of new industry innovationsare used as the critical variable. There are some industries where technologicalchange occurs much faster than the patent process, reducing the economicadvantage of holding a patent. In such industries, patents may become a poormeasure of innovation and in such competitive arenas, fast moving and flexiblesmall firms may have an advantage compared to large firms (Acs andAudretsch, Workshop).
This has led to a consideration of the advantages of smaller firms as asource of innovation, such as: i) a greater tolerance for higher risk initiatives;ii) a collegial organisational context that values ideas and originality; iii) acapacity to reap substantial rewards from market share in small, niche markets;iv) improved capacity for integrating complex sets of information andtechnologies to create a useful outcome; and v) greatly increased cohesion and

5050
a sense of collective purpose where all may profit directly from a successfulnew innovation (Acs and Audretsch, Workshop).
These benefits are so great that individuals or teams within establishedorganisations (businesses, research laboratories, or universities) may actuallyleave to create a new firm in order to gain these advantages, despite theoffsetting disadvantages of a smaller firm. In such cases the donor organisationmay be the source of the basic work, the smaller firm the context for developinga commercial product. Some recent work on the spillover effect suggests thatresearch universities may also be an important source of founders for suchinnovation-oriented small firms (Acs and Audretsch, Workshop).
There is substantial interest in many OECD Member countries inunderstanding the life cycle of new research and development firms. Aprogramme of research has been implemented in France to study firms foundedby academics and researchers (Mustar, Workshop). This has included twosurveys of new high-technology French firms initiated by academics, completedin 1988 and 1992 (Mustar, Workshop). In both cases two-thirds of the totalpopulation responded to a 12-page mailed questionnaire, providing samples ofabout 100 for both cohorts. About 40 per cent of all high-tech start-ups inFrance are represented in this academic based sample. A follow-up to the 1988sample was completed in 1994 to determine their disposition and success.
Although there was some shift in the economic sectors represented bythese high-tech new firms, the similarity between the 1988 and 1992 samples(both the size of the total new high-tech firm population and their basiccharacteristics) suggested that this is an ongoing feature of the French economyand not a response to major structural changes. By 1994 these 200 firms hadprovided a total of 3 500 jobs, substantially more that would have been expectedof 200 new French firms representing traditional economic sectors. Averageannual sales were about FF 5 million (US$1 million); 50 per cent exported outof France; substantial income was provided by both product sales and researchservices; and most were dependent upon less than five customers for themajority of their sales (Mustar, Workshop).
Most of these new firms used friends and family for equity financing, one-third had limited venture capital equity, and a few financial support from majorindustrial groups. All received substantial funding from a variety of publicsources: direct support from local authorities; French government innovationgrants; benefits from tax credits for R&D expenditures; research contractsfrom French or EU ministries; subsidised salaries for young scientists; grantsfrom their original institutions and local authorities; or subsidised space in

5151
incubators. This assistance continued long after start-up and was accompaniedby substantial advice, guidance and referrals to others by public officials(Mustar, Workshop).
The follow-up of the first cohort found that 84 per cent were, six yearslater, still in operation as independent businesses or had been incorporated intoanother firm. The most successful were firms, usually started by a researcherand administrator team, that developed a wide range of contacts and co-operative agreements with other firms, research institutions, customers,suppliers, etc. The least successful were one person start-ups that failed todevelop multiple contacts and severed relations with the original academicinstitution (Mustar, Workshop).
Given these results, it seems clear that the failure rate for these new high-tech French firms is very low, but there are also very few success stories. Theprojects are of long duration but achieve no spectacular successes. While theyreceive substantial assistance from public authorities, these firms also provide a“greater than average” contribution to French job growth (compared to typicalnew firms). The role of these firms must not be seen solely in terms of theircapacity to create jobs, for such firms also act a mediators, or go-betweens,between basic research and a host of other firms, often traditional, who are theircustomers. Given the substantial participation of public authorities in these newstart-ups, it is suggested that more sophisticated measures of achievement bedeveloped to ensure that public programmes are effective and efficient (Mustar,Workshop).
Governments, it is observed, encourage innovation with both general andspecific policies. Universal policies that promote education and a strongresearch community have a continuing general impact. Governments have alsoimplemented specific programmes designed to encourage innovation and R&Din firms with tax incentives (the United States recently narrowed the applicabletax credits to apply only to research and experimentation, R&E, rather than themore broadly defined research and development, R&D); subsidise start-upcapital and financial programmes; anti-trust reforms; creation of hightechnology incubators; as well as favoured treatment for small firms inawarding government procurement contracts. This latter method has beenfound to be much more widely used in the United States than in France or theUnited Kingdom and is considered particularly important for governmentcontracts for R&D itself (Mustar, Workshop). However, despite the wide rangeof programmes, the total amount of resources or assistance provided is oftenquite modest. The most relevant economic sectors are often overlooked, theseprogrammes may not respond to the problems of SMEs, and government

5252
programmes often favour those firms with the staff resources to complete thepaperwork, which tend to be the larger firms. The extent to which currentgovernment assistance for small new high-technology firms is effective acrossall OECD Member countries is unknown.
In conclusion, Acs and Audretsch (Workshop), state that:
“The new learning with respect to innovation andtechnological change casts considerable doubt onto theconventional wisdom regarding the source of innovativeactivity that is embedded in much of the contemporarypublic policy (which favours large firms). It is clear thatsmall firms as well as large enterprises play a key role in theprocess of technological change.”
In other words, unless government policy recognises the unique andimportant role of small firms, the aggregate level of innovation may be reduced.
Firm size and adopting innovation
A major recommendation of the OECD Jobs Study (1994a) focuses uponthe creation and diffusion of technical expertise. The background analysis(OECD, 1994b, Chapter 4) reviews the impact of technical change andinnovation on productivity, implicitly assuming that major benefits flow fromincremental improvements in existing firms. One analysis indicates that largerfirms are more likely to be utilising advanced manufacturing technology in sixMember countries (OECD, 1994b, Table 4.4).
The percentage of new firms emphasizing innovation was explored for theUnited States by considering all new US firms identified in 1977-78 in low andhigh innovation economic sectors (Kirchhoff, Workshop). This analysis wasconfined to the 99 per cent of new single site firms with less than100 employees at “birth” (when they entered the small business data set). Firminnovation was inferred from a sector classification, which reflected: i) averagefirm employment of scientists and engineers; and ii) typical firm expendituresfor research and development. Firms, based on their sector, were placed inthree categories: high innovation (n = 58 714); low innovation (n = 280 305);and other (n = 475 171). In other words, for this cohort of new firms, only 7 percent were considered to be in innovative sectors; over 90 per cent were in whatare considered as traditional sectors.

5353
Such analyses, which impute characteristics to a firm based on itseconomic sector, have the advantage of complete coverage of all new firms, butalso the disadvantage of failing to develop direct indicators of firm activity.Economic sectors are defined in terms of the nature of the final product orservice. Substantial innovation may occur in the processes or procedures usedto create a traditional final outcome. Conversely, many firms in innovativeindustries may be engaged in well established, routine activities that involvevery little innovation.
There is evidence that SMEs may be at a disadvantage in obtaining accessto new technology. A recent analysis of Japan suggests that sources of existingresearch and technological advances are not always available to manufacturingSMEs (Nishio, Workshop). Universities are few, faculty reluctant to pursuecommercial work, and existing liaisons are with large manufacturing firms.There are a small number of national research institutes, but access for SMEs islimited. Industrial Technology Centres are helpful for traditional manufacturingtopics, but have little expertise in high technology. Japanese manufacturingSMEs may find more assistance outside the country, assistance facilitated by thegrowth of Internet.
In 1981 Japanese manufacturing SMEs (firms with fewer than300 employees) could be divided into three categories: i) two-thirds were“subcontracting SMEs”, producing parts and sub-assemblies designed by theircustomers, larger manufacturing firms; ii) one-sixth were subcontracting buthad their own product design capabilities; and iii) one-sixth had their ownbrand name products and direct sales to customers. It is expected thatsubstantial changes may occur for the manufacturing SMEs that survive in thefuture; most of the changes will reflect an increasing capacity within the SMEsthemselves for technical, production and product designs. Futuremanufacturing SMEs may fall into one of three categories: i) manufacturerswith specialised and differentiated production technology (SDPT);ii) manufactures with product development capability (PDC); oriii) manufacturers with an R&D oriented capability (RDO). It is expected thatsubcontracting SMEs will become either SDPT or PDC manufacturing firms inthe future; those with current product development capacities will continue intheir current mode as PDC; while those with their own research staff andproduct lines will either continue in this mode, as RDO, or emphasize theirunique capacities as subcontractors to larger manufacturers (SDPT).
These transitions, all of which will be required in order to survive inJapan’s manufacturing sector, will involve a substantial increase in

5454
technological and design innovation within SMEs. However a substantialamount of time and specialised expertise is required to accomplish thesetransitions. Of particular concern is a strength in microelectronics (ME) and thedwindling supply of skilled older personnel. It is very difficult for SMEs toallocate the necessary resources and experienced workers to provide adequatetraining for new employees. Overall, Japanese manufacturing SMEs areimproving their technical sophistication and capabilities in order to remaincompetitive in Japan, but a number of problems remain to be resolved to enablethem to survive as partners in the manufacturing process (Nishio, Workshop).
The problem of SME access to research and development has also beenidentified as critical in other countries. Fundación Chile is a non profittechnology transfer organisation created in 1977 and endowed by InternationalTelephone and Telegraph and the Chilean government. It provides a number ofprogrammes designed to enhance the contributions of SMEs to economicgrowth. As a way of fulfilling SME requirements for new technology,Fundación Chile has implemented a new programme, the Red Cettec Project,developed with the assistance of the Steinbeis Foundation in Germany. Theproject is designed to provide SMEs and other firms with access to researchexpertise in Chilean universities. Special Transfer Centres are set up where aprofessor is the Director, leading a team of project managers. The Centres arelinked to a Central Unit, located at Fundación Chile, providing theadministrative and organisational support needed to ensure that applied researchand technology reach SMEs. To date, eleven Transfer Centres in five Chileancities with professors from different regional universities have been created. Aco-operative relationship with the German network sponsored by Steinbeis hasalso been developed. Early results from this new initiate are quite promising(Recart, Workshop).
In summary, it appears that most new and small firms are not at theforefront in the adoption of innovation, although many do incorporate the latesttechniques. This is one area where it would appear that linkages betweensources of innovation and firms are not “size neutral” and it is clear that largerfirms or established firms may have an advantage. Government assistance toimprove access of new or small firms to the latest innovations or research anddevelopment may be justified.
High growth new firms
It is often assumed that the relationship between innovation and growthshould be very high among new firms – innovative new firms will have fastgrowth, fast growing firms will be innovative. Several recent analyses relate to

5555
this issue. For example, among the research firms developed by Frenchacademics discussed above, there were very few dramatic successes but veryfew failures (Mustar, Workshop). The low rate of failure among these firmsmay reflect substantial subsidies from public funds, or a more conscientiouseffort to assemble data. It has been found that longitudinal studies of new firmsbased on high response-rate surveys have higher five-year survival rates, 75 to80 per cent, than when the analysis is based on administrative data sets – 50 percent (Kirchhoff, 1994, Chapter 8).
The analysis of all new firms entering the US economy in 1977-78,described above, developed evidence of the relationship between innovation andfirm performance (Kirchhoff, Workshop). Differences in survival in 1984, sixyears later, were small, with 37 per cent of new firms in both high and lowinnovation industries still in operation with the original owners and 39 per centof those in other industries still active. When firm growth was tricotomised forthe entire cohort of 312 804 surviving new firms, 16 per cent of those in highinnovation industries were found to be high growth, compared to 9 per cent ofthose in low innovation industries. Hence, those in innovative industries weremore likely to have high growth trajectories, but there was no relationship tosurvival.
Further, this cohort of new firms contributed 3.4 million, about 4 per cent,of the 85.4 million business jobs identified in 1984. The 7 per cent of firms inhigh innovation industries provided 12 per cent of jobs, compared to the 33 percent of firms in the low innovation industries that provided 28 per cent of thesejobs. The combination of high growth and a high innovation industry couldlead to dramatic results, for the 1 per cent of these firms that survived provided9 per cent of all the new jobs created by the cohort. However, the majority ofthe jobs (64 per cent) were provided by high growth firms in the low innovationand other industries.
It is clear that for this cohort, emerging at a period when major newindustries were developing in the United States, innovation was not required forhigh growth. High growth, however, was clearly critical for high levels of jobcreation.
A complementary analysis was completed in Canada (Baldwin,Workshop). The Canadian data set was used to identify firms with fewer than500 employees and under C$ 100 million in assets in 1984 and grew over thenext four years. A sample was drawn and interviews completed (69 per centresponse rate; n = 1 480) to gain information on their status, strategies andmanagement emphasis in 1989. The interviews provided information on the

5656
respondents’ judgement about factors affecting their success and comparisonswere made between growing SMEs that were more and less successful. Moresuccessful SMEs were more likely to have an R&D unit, had a greaterproportion of expenditures on R&D, and a greater R&D-to-sales ratio. Therewere few statistically significant differences in the other areas covered –management strategies and intensity of management emphasis. Competence inthese other areas may be considered a necessary condition for success, but notsufficient for winning. The highest levels of growth require both basicmanagerial competence and an emphasis on innovation. Innovation may be akey to success in small firms.
It was also found that the more successful higher growth Canadian firmswere more likely to appreciate government programmes. Winners may beselecting government programmes for assistance. This suggests thatgovernments should provide a range of programmes for potential winners,rather than try to select potential winners for government assistance (Baldwin,Workshop). Other OECD Member countries, some with budget constraints, areattempting to deal with this issue. The acceptability of this strategy – targetingassistance to potential winners – has yet to be determined.
Policy implications
The policy implications for these three different topics are different.Accepting the general societal benefits provided by research and development,it is very difficult to provide explicit guidance regarding all the details of theprocess. This is cogently summarised by a comment made during one of thediscussions:
“The recent work of technical historians and economists ofinnovation criticises the linear model. We now know thatinnovation is a collective effort, involving interaction amongmany actors. We used to live in a stable world in whicheveryone had a well-defined place: researchers, governmentauthorities, enterprises, consumers, and so forth. But wenow find ourselves in a hybrid and interdependent worldwhere actors’ roles and their means of action are becomingless clear. The relationship between business and publicresearch is developing, consumers are increasingly active inthe development of new products, and inter-firm co-operation is expanding. This means that the boundariesbetween enterprises and their environment have disappeared,just like the Berlin Wall. This is why I am somewhat

5757
hesitant when policy makers debate the scope of their actionon business environment. Today, government action shouldconcentrate more on the development of new networks.”
(Mustar, Workshop discussion)
Perhaps the world was never completely static, but most observers agreethat the pace of change, along with the size and scope of relevant networks, hasincreased in the past several decades.
Innovation emerges from a messy, complex process that involves multiple,complex networks of information exchange and the sharing of ideas andresources. Many large firms may be dependent upon SMEs as a source ofinnovations (Layne, Workshop). Creating structures to facilitate such opensystems is a major challenge for governments. This suggests that it may bedifficult to identify just where public policy may be effective.
It is increasingly clear that new and small firms play a major role in thedevelopment of innovation. This leads to two policy implications:
• Government programmes, support, and regulations associated with thedevelopment of innovation should ensure that new firms and the SMEsector have full and unencumbered access to resources and information.The size or age of a firm should not put them at a disadvantage.
• Serious consideration may be given to providing assistance to new firmsto ensure they have a reasonable opportunity to develop new products andservices for a test in the marketplace.
There is some evidence that SMEs, particularly those in manufacturing,may be at a disadvantage in access to innovation and relevant R&D assistance.One of the benefits to SMEs found in industrial districts, discussed above, maybe ease of access to highly relevant new innovations. This leads to thefollowing implication:
• Public policies or programmes may be developed to facilitate access ofnew and small firms to R&D.
The recent studies regarding the economic contributions of high growthnew firms are consistent with a large amount of established work (Storey,1994). High levels of job creation are provided by high growth firms. Mosthigh growth firms are not innovative in a technical sense, but may includemarketing innovations or cross-national alliances. Most high-tech firms are not

5858
high growth. Most new firm jobs are created by low innovation, low growthtraditional firms. The major policy question remains the same:
• Should special programmes be developed to assist high growth new firmsto reach their potential?
Development of efficient programmes to assist high growth new firms (orgazelles) continues to be complicated by a lack of clear criteria for selection.
“... For us policy makers it is interesting to have a gazellethat we can exhibit as a trophy. But as hunters we cannot seethem right away. So we also have to take an interest in theother animals.”
(Jeanneret, Workshop commentary)
Research on the growth trajectories of new firms is quite mixed. Because alarge number of factors are involved, in addition to adoption of innovation,large samples followed over a period of some years will be required. A numberof examples of such projects indicate that many of the technical issues havebeen resolved (Haltiwanger, Picot and Dupuy, Kirchhoff, Mustar, Baldwin,Workshop). A study of successive cohorts of new firms is now beingimplemented in France (Parent, Workshop). The importance of new firms, andparticularly high growth new firms, appears to justify the development of long-term studies to enhance understanding of firm survival and growth processes.
V. SMEs and Job Quality
There is considerable evidence to suggest that average wages and benefitsare greater in larger firms. If this pattern was as simple as a size comparison, anincrease in the proportion of small firm jobs would lower the averagecompensation per worker. However, the situation appears somewhat morecomplicated, for other factors affect worker compensation and other aspects ofwork may be enhanced in small firms. Further, there is some evidence of aconvergence in job quality among small and large firms. Given this pattern, andthe absence of evidence that small firms provide sub-standard jobs, the policyimplications associated with differences in job quality are not clear. Theseissues are elaborated below.
Firm size and job quality
There is substantial variation among advanced countries in the proportionof the workforce employed in SMEs (lowest in the United States; highest in the

5959
smaller European countries). While it is generally true that wages are higher inlarger firms, wage differentials also vary substantially across different countries(greatest in the United States and Japan; much less in Nordic countries orGermany). In addition, there are substantial differences within the SME sector(Pyke, Workshop). This is consistent with other country analyses (Sato,Wagner, McLaughlin, Chernew and Zellers, Workshop) and a number of earlierstudies (Brown et al., 1990; Loveman and Sengenberger, 1991; Storey, 1994;European Observatory for SMEs, 1993, 1994). Other aspects of workingconditions (pension provision, holiday entitlements, car allowances, sick pay,safety and health, working hours, security of employment) are generally foundto be better in larger firms. While the average differences by firm size arefound in all countries, there is also enormous variation within size classes,representing substantial sectoral and geographic diversity (Pyke, Workshop).
Analysis related to job tenure based on firm data is problematic. Counts offirm jobs over time may not capture job turbulence (creation and destruction)within the firm or changes in personnel in a continuing job. Further, simplecomparisons by size do not take into account differences in firm age. Among asample of manufacturing firms in Lower Saxony in Germany, there was nodifference in job tenure by size among firms of the same age (Wagner,Workshop). Further, somewhat different perspectives emerge when the analysisis based on the experience of workers, rather than the stability of job counts infirms. For example, the average job tenure for all those employed in the UnitedStates was 4.5 years in 1991 (U.S. Bureau of the Census, 1994, Table 644).This is less than the average duration of survival for a new firm in the UnitedStates or other OECD Member countries (OECD, 1994d, Table 3.10; Grey [b],Workshop), generally considered to be about five years. This would suggestthat once firms pass a minimum age, job tenure will be affect by other factors.The shorter job duration among small firms may reflect the fact that almost allnew firms are small.
Comparison of wages by firm size is similarly complicated. A review ofEuropean data found enormous diversity within size classes, related toeconomic sector and geographic location (Pyke, Workshop). In Italy, averagewages in some regions dominated by small firms were higher than for regionsdominated by large firms (Pyke, Workshop). When the basis for comparison isdata for workers, rather than firms, and other controls are introduced for avariety of factors (gender, experience, education, occupational category, etc.),the differences are reduced in Germany. The greatest differential in Germanyoccurs between small and medium-sized firms (Wagner, Workshop). It has

6060
been observed that half the minimum-wage jobs in the United States areprovided by large firms and half by small (Phillips, Workshop commentary).
While in most OECD Member countries central government takes theprimary responsibility for providing health care, the United States is a specialcase. In the United States, employer-provided health insurance is one of themost important fringe benefits offered to workers. Approximately 17 per centof the pre-retirement population are without health coverage; 85 per cent of thisgroup are working adults and their dependants. A disproportionate share of theworking uninsured are employees of small firms and their dependants, requiringmore careful analysis of their situation (McLaughlin, Chernew and Zellers,Workshop). Almost all (98 per cent) of firms with 100 or more employees or90 per cent of those with 25-99 workers offer health benefits. This is comparedto the small firms in a high quality sample, where 83 per cent of those with 10-25 workers, and 55 per cent of those with 2-9 workers provide health benefitplans. However, 32 per cent of all employees in the sample firms obtainedcoverage through another source, i.e. spouse’s employer plan, associations, etc.About 22 per cent of the employees of small firms have no health coveragebecause: i) their firm has no programme; ii) they chose not to participate (andsave their part of the premiums); or iii) they are ineligible for the healthbenefits (e.g. part-time worker, pre-existing health problems, etc.).
A number of measures have been proposed to increase health carecoverage in the United States. Reducing the scope of the insurance orprogrammes to reduce the cost of premiums for small businesses has not, todate, had major effects on the coverage of workers. Most small businessesfavour government legislation requiring the provision of insurance, although theinsurance companies do not. Efforts to provide subsidies to small businesses,including several social experiments where the cost has been subsidised, haveindicated that even massive subsidies would not achieve universal coverage.Government mandates requiring the provision of health insurance wouldprobably be effective; most small firms said they would try to increase prices tocompensate for the additional costs. While some employees may be better offunder such a system, there is small proportion for whom this job benefit iseither unwanted or duplicates the same benefit from another source(McLaughlin, Chernew and Zellers, Workshop).
Quite apart from actual work conditions and benefits is employee moraleand job satisfaction. The results of the relationship to firm size are mixed. Forexample, it has been found in the Netherlands that job satisfaction is a relativeconcept. Employees working in large-scale enterprises are less satisfied withtheir salaries than employees in small-scale enterprises, even though their pay is

6161
considerably higher (Vianen, Workshop commentary). Germany has a systemof formal mechanisms to provide for worker participation in firm decision-making through a system of Works Councils. These are less prevalent insmaller firms (Wagner, Workshop). Empirical evidence from the UnitedKingdom would suggest that SMEs do not provide workers with a moresatisfying work experience (Storey, 1994, pp. 186-189, although there is someevidence that those reporting self-employment (firm owners?) in the UnitedStates and the United Kingdom are more satisfied with their work life thanemployees (Blanchflower and Oswald, 1992).
A survey of 1 996 Japanese SME managers in 1993 found considerablepride and satisfaction (Sato, Workshop). SMEs are less formal and providegreater adaptability for the firm and flexibility for employees. An increasedfocus on personal/family goals and less on firm loyalty is developing amongworkers, many consider SMEs as a more appropriate context for personal self-realisation. Many SME managers had left large corporations, two-thirds wouldnot want their firm to become large and felt sorry for workers in big firms. Thishas been accompanied by a more collegial, participatory managementphilosophy in SMEs, with greater emphasis on manager-employee partnerships,responding to the individual needs of employees, developing consensus, etc.Many Japanese SME managers expect to be industry leaders, moving ahead ofthe large firms.
Evidence of convergence
In addition to the reduction in small-large firm differentials in pay andbenefits when other factors are considered, there is also very recent evidence,from at least two OECD Member countries, of convergence in work conditions.
In Japan, the differences in wages and working conditions between smalland large firms have been substantially reduced, though not eliminated, over thepast 40 years (Sato, Workshop). The National Labour Standards Law passed in1988 has begun to reduce the small-large firm differential in the average workweek, overtime work, provision of holidays, and implementation of a five-dayworkweek (providing two days off at the weekend). There has been, however,an increase in the use of part-time employees in SMEs. The future shortage oftrained workers as the ageing Japanese population stabilises (it is expected topeak in 2010) is leading to changes in orientation towards workers. Humanresources are now considered critical to the success of Japanese SMEs. Needfor higher quality workers has changed SMEs compensation schemes, withmore emphasis being placed on performance and provision of independence.

6262
A special effort was made to explore the skill-related characteristics of newhires in small and large firms in the United States over the 1990-91 period(Kochhar and Popkin, Workshop). By looking at the quality of new hires, itmay be possible to anticipate future movements in the quality of jobs in smalland large firms. The data were based on surveys of employees (from the USCurrent Population Survey) during the months of January, March, andApril 1991. Newly hired workers are defined as those with a job tenure of lessthan one year. As they may be filling new jobs or replacing other workers atexisting jobs, this is consistent with the concept of “gross job creation” ratherthan “net new jobs”.
While average job quality in large firms (those with 500 or moreemployees) is superior to that in small firms, small firms have made tremendousstrides in the recent past toward narrowing that gap. On average, establishedworkers in large firms are better paid, more educated, more likely to becomputer literate, and engaged more in information-processing activities thanroutine-production activities. However, for each of these dimensions, newlyhired workers in small and large firms were found to bear a strongerresemblance to each other than to the average worker in these firms. Amongnew hires, small firms account for 59 per cent of employment and an almostequal proportion – 55 per cent – of employment in the highest wage quartile.There is also an increase in hiring of college-educated workers by small firms.The analysis suggests that: i) job quality in small and large US firms may beconverging; ii) this convergence is most notable in wages; iii) small firms areupgrading the education level of their employees; and iv) further research isrequired to place these findings in proper historical context (Kochhar andPopkin, Workshop).
An inconsistency is apparent from the findings regarding lower trainingcosts per employee among SMEs. For SMEs to have the capacity to respond tochanging technologies and to readily incorporate changing management andwork practices would require that employees receive proper training and staywith the firms so that the training investment is justified. Yet the data indicatethat larger firms spend more on formal training, suggesting that the traininginvestment of SMEs may be informal and not captured in the data collectedfrom formal budget statements (Vianen, Workshop).
Policy implications
This review is consistent with the following conclusions:

6363
• While these analyses all make clear that workers in large established firmshave better pay and benefits than those in smaller firms, a more preciseanalysis presents a more complex portrayal and suggests acceptablejustifications for the differences (e.g. more experienced workers are paidmore, large firms employ more experienced workers).
• Recent evidence suggests that the differences in job quality related to firmsize are shrinking and there are substantial examples of small firmsproviding pay and benefits equal to or greater than large firms.
• None of these analyses have, however, indicated that the majority of jobsprovided by new and small firms in Member countries are sub-standard orunacceptable.
• If policies are adjusted to increase firm flexibility, or the capacity toadjust the labour force, more of the costs of providing for workertransition costs and minimum benefits during periods of employment maybe borne by the government. This could, other things being equal,increase the social costs associated with a flexible economic system.
There was, then, little evidence that an increase in the proportion of jobs insmall firms would have major impacts on future worker compensation. Thelack of systematic evidence that small firms provide sub-standard work settingssuggests that existing government surveillance procedures have been adequate.Any effort to increase surveillance of employees in SMEs which raises theirregulatory burden may reduce the capacity of new and small firms to contributeto overall economic growth (Wagner, Workshop).
VI. Conclusions and Policy Implications
Several conclusions have been developed in the preceding analysis:
• There is evidence that new and small firms have a causal role in economicgrowth, both as intervening mechanisms reflecting other basic changesand as an independent source of economic growth.
• There is preliminary evidence that the presence of firm and job turbulence(births and deaths) may be required for subsequent economic growth.
• There is substantial evidence that a majority of jobs in OECD Membercountries reside in small and medium-sized firms – and this is likely tocontinue. It is not clear if the proportion in new firms has increased.
• New and small firms are clearly a major source of new jobs (gross andnet).

6464
• Major contributions to innovation and new technology are provided bynew and small firms.
• There is some evidence that new and small firms are at a disadvantage inaccess to new innovation and new technology.
• A small proportion of high growth new firms may provide a majority ofnew firm jobs.
• Small firm jobs appear to provide lower pay and benefits than large firms,but the gap may be narrowing. There is no systematic evidence that smallfirm jobs are sub-standard.
The major policy implication of this analysis is related to a shift in theconception of the economic system. The assumption of the past was that thebusiness firms that make up the economic structure of OECD Member countriescould be considered as having a dual structure. A core of persistent firms thatformed an economic base and provided permanent jobs with the best pay andbenefits, attracting the most skilled and talented individuals. The jobsthemselves were seen as relatively permanent although occupants might change.Around this base was a periphery of small or temporary firms, acting in asubsidiary role to the core firms, providing temporary and less desirableemployment opportunities which attracted less skilled and less desirableworkers. If such a perspective were accurate, it would justify focusingeconomic policy and government resources on the core of the economic system– large established firms. Economic analysis and data sets would emphasizecore economic sectors and established firms, attempting to determine theallocation of resources and societal benefits from a relatively stable andsuccessful economic core. The data sets designed to monitor economic activityreflected this conception of the economic structure of OECD Member countries.
However, evidence is accumulating to suggest that this conception ofmodern economies is no longer accurate. Large, established businesses areclearly not the only source of economic activity and, perhaps, for some OECDMember countries, no longer the major source of economic growth. A range offirms – small, medium-sized and large in all economic sectors – are contributingto economic activity. It may be that the speed of economic change andadaptation require that a substantial proportion of economic activity be carriedout by temporary firms, firms with a life much shorter than the work career ofindividuals in the labour force – workers, managers, and entrepreneurs. Ifturbulence and change are required for an OECD Member country to maintaineconomic growth and be competitive in global markets, this suggests a numberof changes in the conceptualisation of the economic system.

6565
Such changes in conception and related policy implications would includethe following:
• Jobs should be seen as temporary linkages to the economy, individualsshould expect to occupy a series of jobs over their career.
• Firms would no longer be evaluated in terms of the “permanent” jobs theyprovide, but in terms of the “job years” created by an economic activity.(A firm providing 20 jobs for two years would be seen as equivalent toone providing four jobs for ten years or one that provided two jobs for20 years.)
• Training and skills would be seen as temporary, with the expectation ofconstant revision as new types of work emerged in the workplace.
• In order to encourage more innovative behaviour, training andfamiliarisation with entrepreneurship – in the sense of creation of newbusinesses – would be given a central role in all post-primary vocationaland occupational training programmes.
• Governments, expecting economic growth from a variety of sources –small, medium-sized and large existing firms as well as new firms –would improve the business environment and develop policies,programmes, and regulations that would not place any firm at adisadvantage due to age or size.
• If new firms are providing a greater proportion of jobs and economicoutput, there may be greater emphasis on assistance to start-ups.
• In order to reduce the costs of turbulence among business firms,governments themselves may adopt more responsibility for health andretirement benefits.
• Data systems designed to monitor economic activity, and particularlythose designed to identify basic changes in the economic structure, wouldbe organised to provide frequent and timely information about changesfrom firms (about jobs) and workers (about their labour force behaviour).Data would be collected and assessed at frequent intervals, at leastannually. The capacity for longitudinal analysis of both firms andworkforce behaviour would be developed, along with the potential – ifpossible – to cross-check patterns found in different data sets.

6666
The entrepreneurial engine
It is possible to consider the turbulence among firms in advanced marketeconomies as opportunities offsetting some of the social costs of change (Hall,Workshop). This constant churning among business firms may be seen as areflection of the “entrepreneurial engine”, a source of renewal for economicsystems. The “entrepreneurial engine” is the result of many new firms, eachfirm in a different stage of the entrepreneurial process. Each set of new firms,or birth cohort, can be considered in terms of their status in the process:initiation of start-ups, firm births, survival or growth, and, for most businesses,decline and deactivation. The resources released during the latter phases –funds, workers, entrepreneurial talent – may be redeployed to new firms,repeating the cycle.
Despite the appealing image portrayed by Schumpeter of entrepreneurshipdriven by new technology or innovations leading to new industries, it is clearthat the major source of this turbulence and churning is a natural turnoveramong existing firms in traditional industries with established products. It ispossible to develop crude estimates of the proportion of the population involvedin different stages and the cumulative impact of these processes on job creationand economic growth. For example, about one in 25 adults may be involved(along with one partner) in trying to start a new firm at any given time indeveloped economies: half may get the new firm going; among these newfirms, one-quarter may develop high growth trajectories (Reynolds, 1995b;Carter et al., 1995). These high growth new firms may, after five or six years,begin to produce a substantial number of jobs (Hall, Workshop).
The major policy implications of this new conceptualisation include thefollowing:
• Sustainable job creation depends upon the entrepreneurial engine, which,in turn, depends upon a relatively small group of high growth new firms.Policies which impede or disrupt the entrepreneurial engine will tend tolead to stagnation and structural unemployment.
• Net job creation via the entrepreneurial engine is quite complex. Itinvolves different cycles in different segments of the economy. Policythat is not oriented to the overall operation of the cycle may not beeffective.
• The entrepreneurial engine has significant potential in amelioratingstructural unemployment. This may require policies and programmes toincrease inputs to the entrepreneurial engine or increase its efficiency.

6767
• Increased globalisation of SMEs means that the entrepreneurial enginewill operate more across national borders.
• The entrepreneurial engine already plays an important role in the AsiaPacific region. This role may become much more global and important inthe next decades (Hall, Workshop).
The evidence that there has been a basic shift in the nature of economicgrowth in OECD Member countries is not conclusive. We do not, as yet, knowif the entrepreneurial engine will drive all aspects of their economies. A majorobstacle has been the absence of appropriate data. Established data sets weredesigned to monitor slow changes in a dual economy where most economicgrowth came from a small number of core industries dominated by a few largefirms. The absence of adequate data has hampered both recognition of basicchanges and the capacity to provide an adequate policy reaction. In the absenceof appropriate descriptive data, analysis and theory development by scholarsand analysts has been disparate and confusing.
There is a growing recognition of the importance of these shifts in the datarequired to monitor the newly emerging economy. Canada and Sweden haveclearly made major advances, and experts at Eurostat and OECD are developingstandards for creating data sets to facilitate cross-national comparisons (Picotand Dupuy; Davidsson et al.; Benassi; Schreyer and Chavoix-Mannato; Grey,Workshop). Rapid implementation of these changes will require theunderstanding and support of influential policy makers in OECD governments.
Access to the appropriate data is the key to a clear understanding ofmodern economic growth and the role played by small and large, new andestablished firms. Too much data will provide redundancy and greaterconfidence in the interpretations; too little data may prevent an adequateunderstanding of major changes. The cost of darkness is far greater than therisk of blindness from excessive light.

6868
Annex A
JOB CREATION RATES AND DISTRIBUTION OF GROSS JOBFLOWS
Percentages
Gross job creation1 Gross job losses2 Net jobcreation
% of initialemployment
Distributionby size class
% of initialemployment
Distributionby size class
% of initialemployment
G7 countriesCanada 1978-92Base year size allocation4
0-19 employees 26.7 48.0 -18.6 37.0 8.120-49 14.9 13.0 -14.6 14.0 0.350-99 13.0 8.0 -13.8 9.0 -0.7100-499 11.1 13.0 -11.9 16.0 -0.8500+ 5.9 17.0 -7.1 23.0 -1.2Total 13.4 100.0 -12.1 100.0 1.3
Average size allocation5
0-19 23.4 42.0 -20.2 40.0 3.320-49 15.9 14.0 -14.2 14.0 1.750-99 14.4 9.0 -13.0 9.0 1.4100-499 12.2 15.0 -11.2 15.0 1.0500+ 6.8 20.0 -6.6 22.0 0.1Total 13.4 100.0 -12.1 100.0 1.3
Germany 1978-93Base year size allocation4
1-19 employees 14.7 12.3 14.0 10.0 0.720-49 9.0 18.6 8.0 14.2 1.050-99 6.6 13.4 6.5 11.7 0.1100-249 5.5 18.7 5.3 15.6 0.2250-499 4.5 13.2 4.8 12.5 -0.3500-999 3.3 8.6 4.6 10.7 -1.31 000-2 499 2.7 7.0 4.9 10.9 -2.32 500-4 999 1.2 4.8 -3.65 000+ 1.7 8.2 2.5 14.3 -0.8Total 100.0 100.0

6969
Gross job creation1 Gross job losses2 Net jobcreation
% of initialemployment
Distributionby size class
% of initialemployment
Distributionby size class
% of initialemployment
Germany (continued)Average size allocation5
1-19 employees 12.1 10.1 15.6 11.2 -3.520-49 9.3 19.5 8.2 14.2 0.750-99 7.1 14.4 6.7 11.8 -0.1100-249 5.4 18.6 5.4 16.0 0.0250-499 4.4 13.0 4.8 12.5 -0.5500-999 3.4 8.9 4.5 10.4 -1.11 000-2 499 3.5 9.2 4.7 10.4 -1.22 500-4 999 1.3 4.3 -3.05 000+ 1.7 6.2 2.5 13.5 -0.9
Italy 1984-92Base year size allocation4
1-19 employees 65.4 56.220-99 17.5 20.0100-499 9.0 11.0500+ 7.8 12.8Total 100.0 100.0
Japan 1987-92Base year size allocation4
30-99 employees 45.5 50.9 1.2100-199 18.3 17.5 1.4200-499 17.4 15.0 0.2500-899 7.7 5.8 1.6900-1 499 4.7 3.2 1.61 500+ 6.5 7.6 0.3Total 100.0 100.0 1.2
United Kingdom 1985-91Base year size allocation4
1-19 employees 15.0 50.4 10.7 45.4 4.720-49 8.2 9.5 7.7 11.3 0.650-99 8.1 8.0 5.7 7.2 2.6100-499 7.4 12.7 5.7 12.8 1.7500 + 4.0 19.4 3.7 23.3 0.3Total 8.2 100.0 6.4 100.0 1.9

7070
Gross job creation1 Gross job losses2 Net jobcreation
% of initialemployment
Distributionby size class
% of initialemployment
Distributionby size class
% of initialemployment
United States 1973-88Average size allocation5
0-19 employees 18.7 10.7 23.3 11.8 -4.520-49 13.2 12.5 15.3 13.0 -2.150-99 12.2 14.0 13.5 13.8 -1.3100-249 9.6 19.5 10.7 19.5 -1.1250-499 7.7 13.6 8.7 13.6 -1.0500-999 7.0 10.4 7.6 10.1 -0.61 000-2 499 6.3 8.5 7.3 8.8 -1.02 500-4 999 6.1 4.7 7.5 5.1 -1.35 000+ 5.4 5.0 5.6 4.6 -0.2Total 100.0 100.0
United States 1987-92Base year size allocation4
30-99 employees 34.4 27.7 0.5100-199 19.8 17.8 -0.3200-499 21.1 21.0 -0.8500-899 9.3 9.8 -0.9900-1 499 5.0 6.2 -1.61 500+ 10.3 17.5 -2.8Total 100.0 100.0 -1.0
NonG7 countries
Denmark 1985-86Base year size allocation4
1-9 employees 30.3 40.7 18.6 33.2 11.710-49 15.5 30.8 11.5 30.3 4.050-99 13.2 9.2 11.9 11.0 1.3100-499 12.6 14.1 10.4 15.5 2.2500+ 7.6 5.2 11.0 10.0 -3.4Total 17.1 100.0 12.9 100.0 4.2
Denmark 1989-90Base year size allocation4
1-9 employees 25.1 40.7 21.4 33.3 3.710-49 12.5 31.9 14.5 35.3 -1.950-99 10.3 8.9 13.1 10.8 -2.7100-499 9.4 13.1 11.1 14.8 -1.7500+ 7.0 5.4 7.8 5.8 -0.8Total 13.9 100.0 14.5 100.0 -0.6

7171
Gross job creation1 Gross job losses2 Net jobcreation
% of initialemployment
Distributionby size class
% of initialemployment
Distributionby size class
% of initialemployment
Finland 1986-91Base year size allocation4
1-19 employees 52.7 38.420-99 24.7 26.9100-499 17.3 23.9500+ 5.3 10.8Total 100.0 100.0
New Zealand 1987-92Base year size allocation4
1-19 employees 55.6 41.820-99 26.2 30.4100-499 13.8 18.5500+ 4.4 9.3Total 100.0 100.0
Netherlands 1979-91Average size allocation5
10-99 employees 12.9 11.2 0.6100+ 4.6 6.1 -1.4
Sweden 1985-89Base year size allocation4
Simples 5.2 45.4 4.2 42.4 1.1Tops 2.5 6.6 2.5 7.8 0.0Branches 3.0 48.0 2.7 49.8 0.3Total 3.7 100.0 3.2 100.0 0.6
1. Gross job creation = employment gains from business openings and expansions.2. Gross job losses = employment losses from business closures and contractions.3. For most countries, gross and net job flows are measured on an annual basis. For any two
years, gross job flow rates are measured as a percentage of the employment in the first year.The percentage reported in the table corresponds to the mean of these annual gross or net jobflow rate. No annual measurements were available for Japan, Sweden, the United Kingodm orthe United States (1987-92). In these cases, annualised gross or net job flow rates are reported.
4. Base-year size allocation: the employment gains or losses of a firm or establishment betweenyears are allocated to the size class to which the firm or establishment belonged in the initialyear.
5. Average size allocation: the allocation of a firm or an establishment to a particular size class isdetermined by the average size of the firm between two or more periods. Accordingly,employment gains or losses are allocated. Average size allocation reduces the regression-to-the mean bias.
Source: Schreyer (1996).

7272
Annex B
WORKSHOP PARTICIPANTS
Session 1: Welcome and Introductions
Mr. Hans-Peter Gassmann, Head of Industry Division, Directorate forScience, Technology and Industry, OECD, France
The Honourable Gere Glover, Chief Counsel, Office of Advocacy,U.S. Small Business Administration, United States
Mr. Philip Karp, Programme Manager, Investment Promotion AgencyServices, Multilateral Investment Guarantee Agency (MIGA),The World Bank Group, United States
Dr. Jeffrey H. King, Programme Officer for Competitiveness andHuman Resources, The German Marshall Fund of the UnitedStates
Mr. Guido Bertucci, Director, Department for the DevelopmentSupport and Management Services, United Nations
Session 2: Background Issues and Policy Options
Chair: Mrs. Marie-Florence Estimé, Secretary of the OECD Working Party on SMEs, Industry Division, Directorate for Science, Technology and Industry, OECD
Speakers:
Mr. Ian Donald, Chairman, OECD Working Party on SMEs andDirector General, Entrepreneurship and Small Business Office,Industry Canada, Canada
Dr. Paul Reynolds, Paul T. Babson Chair in Entrepreneurial Studies,Babson College, United States

7373
Session 3: SMEs and Job Creation
Chair: The Honourable Jere Glover, Chief Counsel, Office of Advocacy, U.S. Small Business Administration, United States
Speakers:
Dr. John C. Haltiwanger, Department of Economics, University ofMaryland, United States
Dr. Garnett Picot, Director, Business and Labour Market Analysis,Statistics Canada, Canada
Mrs. Marie-Christine Parent, Business Statistics Directorate, INSEE,France
Technical Discussant: Ms. Catherine Armington, Consultant to the U.S. Department of Labor, United States
Discussants:
Mr. Robert Anderson, Small Firms & Business Link Division,Department of Trade and Industry, United Kingdom
Ms. Irene Brunskill, Economic Advisor, Department of Trade andIndustry, United Kingdom
Ms. Susanne Kasten, Division of Small and Medium EnterprisePolicy, Federal Ministry of Economics, Germany
Session 4: SMEs: Technology, Productivity and Innovation
Chair: Mr. Donald Layne, Senior Vice President, Corporate Affairs,Federal Business Development, Bank of Canada
Speakers:
Professor Zoltan J. Acs, Center for International Business EducationResearch, University of Maryland, United States
Professor Harukazu Nishio, Applied Research Institute Incorporated,Tokyo, Japan
Ms. Maria Olivia Recart, Fundacion Chile, EMPRETEC Programme,Department for Development, Support and ManagementServices, United Nations
Dr. John R. Baldwin, Director, Micro-Economic Analysis Division,Statistics Canada, Canada

7474
Discussants:
Dr. Johan van der Tuin, Head of Unit Business Climate, Ministry ofEconomic Affairs, The Hague, The Netherlands
Mr. John Ryan, First Assistant Secretary, Industry Policy Division,Department of Industry, Science and Technology, Australia
Session 5: SMEs: Competition, Change and Economic Growth
Chair: Professor David J. Storey, Director, Centre for Small and Medium-Sized Enterprises, Warwick Business School, United Kingdom
Speakers:
Mr. Sergio Arzeni, Head of Division, Co-operative Action Programmeon Local Economic and Employment Development, OECD
Professor Roy Thurick, Economics Faculty, Erasmus UniversityRotterdam and EIM Small Business Research and Consultancy,The Netherlands
Professor Per Davidsson, Department of Business Administration andEconomics, Jonkoping International Business School,Jonkoping University, Sweden
Dr. Frank Nolan, Chief Economist, Statistics New ZealandMr. Eduardo Tarrago, EMPRETEC Programme, Department for
Development Support and Management Services, UnitedNations
Discussants:
Mr. Jean-Luc Vo Van Qui, Sous-Directeur du DéveloppementIndustriel et Technologique Regional, Ministère de l’Industrie,France
Mr. Carlos Tenreiro, Head of Sector, Unité Information desEntreprises, European Commission, DG XXIII, Brussels,Belgium

7575
Session 6: SMEs: New Industries and High Growth New Firms
Chair: Mr. Hans Peter Gassmann, Head of Industry Division, Directorate for Science, Technology and Industry, OECD
Speakers:
Professor Chris Hall, Associate Professor, University of TechnologySydney, Australia
Dr. Fred Tarpley, Chief Economist, U.S. Small BusinessAdministration, United States (Presenting an analysis preparedby Dr. Bruce Kirchhoff, New Jersey Institute of Technology,United States.)
Dr. Philippe Mustar, Centre de Sociologie de l’Innovation, EcoleNational Supérieure des Mines, Paris, France
Dr. K. Mark Weaver, University of Alabama and Past President,International Council for Small Business (ICSB), United States
Discussants:
Mr. Olavi Änkö, Director General, Ministry of Trade and Industry,Finland
Mr. P. Jeanneret, Chef Suppléant, Division Arts et Métiers, OfficeFédéral de l’Industrie, des Arts et Métiers du Travail,Switzerland
Session 7: SMEs: Work Organisation and Job Quality
Chair: Professor Joop Vianen, Director, EIM Small Business Research andConsultancy, The Netherlands
Speakers:
Mr. Frank Pyke, International Labour Organisation, SwitzerlandProfessor Yoshio Sato, Keio University and Advisor to Japan Small
Business Research Institute, JapanProfessor Doctor Joachim Wagner, Institute for Volkwirtschaftslehre,
Universitat of Luneburg, GermanyDr. Michael Chernew, Department of Health Services Management
and Policy, University of Michigan, United StatesDr. Rakesh Kochhar and Joel Popkin, Joel Popkin and Associates,
United States

7676
Discussants:
Mr. Giordano A. Chiaruttini, Deputy Assistant Administrator, Officeof International Trade, U.S. Small Business Administration,United States
Mr. Michael Horrigan, Bureau of Labor Statistics, Department ofLabor, United States
Session 8: Monitoring SMEs and Contributions: Data Requirements
Chair: Ms. Janice McMechan, Industrial Organization and Finance Division, Statistics Canada
Speakers:
Mr. Paul Schreyer, Economic Analysis and Statistics Division,Directorate for Science, Technology, and Industry, OECD
Mrs. Michèle Chavoix-Mannato, Economic Analysis and StatisticsDivision, Directorate for Science, Technology, and Industry,OECD
Mrs. Marie-Paule Benassi, Eurostat, European Commission,Luxembourg
Mr. Bruce Phillips, Director, Office of Economic Research, U.S.Small Business Administration, United States
Mr. Alex Grey, Central Analysis Division, Directorate for Education,Employment, Labor & Social Affairs (DEELSA), OECD
Discussants:
Mr. Lars Häggmark, Deputy Assistant, Under-Secretary, Ministry ofIndustry and Commerce, Sweden
Ms. Catherine Armington, Consultant to the United States Departmentof Labor, United States
Dr. Lewis Alexander, Chief Economist, United States Department ofCommerce, United States

7777
Session 9: Overview and Policy Implications
Chair: Dr. Luc Soete, Director, Maastricht Economic Research Institute onInnovation and Technology
Speakers:
Dr. Robert Berney, Chief Economic Advisor, U.S. Small BusinessAdministration, United States
Ms. Angela Capati-Carusso, Economic Affairs Officer, Division ofPublic Administration and Development Management,Department for Development Support and ManagementServices, United Nations
Mr. Marcello Marin, President, Istituto per la Promozione Industrale(IPI), Italy
Mr. Rolf Egil Tønnessen, Advisory, Ministry of Industry and Energy,Norway
Mr. Jamie Andrez, Vice President, Instituto de Apoia as Pequenas eMedias Empresas e as Investimento (IAPMEI), Portugal
Dr. Paul Reynolds, Paul T. Babson Chair in Entrepreneurial Studies,Babson College, United States

7878
Annex C
PAPERS DISTRIBUTED AT THE WORKSHOP
Acs, Zoltan J. and David B. Audretsch, “Technology, Productivity, andInnovation”.
Armington, Catherine, “Measuring Job Creation in Small and Medium-SizedEnterprises: Sources of Controversy and Confusion”.
Arzeni, Sergio, “International Seminar on Local Systems of Small Firms andJob Creation: Background Paper”.
Baldwin, John, “Innovation: The Key to Success in Small Firms”.Benassi, Marie Paule, “Compiling Statistical Information on Small and
Medium-Sized Enterprises: Practical and Methodological Problems,European Union Answers”.
Davidsson, Per, Leif Lindmark, and Christer Olofsson, “Smallness, Newness,and Regional Development in Sweden”.
Grey, Alex [a], “A Comparative View of Sources, Definitions and Methods ofData Collection on Job Creation and Loss”.
Grey, Alex [b], “When is ‘New’ New? Possibilities to Consider in AssessingOpening and Closing Establishments and Firms”.
Hall, Chris, “The Entrepreneurial Engine”.Haltiwanger, John, “Small Business and Job Creation in the United States:
What Do We Know?”Kirchhoff, Bruce A., “Growth Contributions of Highly Innovative Small
Firms”.McLaughlin, Catherine, Michael Chernew, and Wendy Zellers, “Small Business
and Health Insurance: An American Dilemma”.Mustar, Philippe, “The Creation of Enterprises by Researchers: Conditions for
Growth and the Role of Public Authorities”.Nishio, Harukazu, “Evolving Japanese Small and Medium Scale Manufacturers:
Production Technology vs. Product Technology-Oriented Approach”.Nolan, Frank, “Small Business Growth in New Zealand: 1990-1994”.Parent, Marie-Christine, “French SMEs: Trends in Employment 1985-1995”.Phillips, Bruce, “Small Business Data in the Twenty-First Century”.Picot, Garnett and Richard Dupuy, “Job Creation by Size Class: Recent
Evidence from Canada”.

7979
Popkin, Joel and Rakesh Kochhar, “The Characteristics of New Hires in Smalland Large Firms in the U.S.: 1990-1991”.
Pyke, Frank, “Comparing Small and Large Firms in Europe: Prospects forIncomes and Working Conditions”.
Recart, Maria Olivia, “SMEs: Job Creation and Technology Transfer.Fundacion Chile’s Experience”.
Sato, Yoshio, “Work Organization and Job Quality of SMEs in Japan”.Schreyer, Paul and Michèle Chavoix-Mannato, “Quantitative Information on
SMEs: OECD Approach, Data Collection and Examples of Analysis”.Tarrago, Eduardo, “SMEs and Employment Generation: Analysing an
Experience in the Southern Cone – Uruguay”.Thurick, Roy, “Small Firms, Large Firms and Economic Growth”.Wagner, Joachim, “Firm Size and Job Quality: Evidence from Germany”.Weaver, Mark, Pat H. Dickson and Leslie Davies, “SME-based Strategic
Alliances: Marriages of Necessity, Convenience or True Love?”

8080
REFERENCES
Acs, Zoltan J. and David B. Audretsch (1990), Innovation and Small Firms, TheMIT Press, Cambridge, MA.
Armington, Catherine and Marjorie Odle (1982), “Small Business – How ManyJobs?”, The Brookings Review (Winter), Vol. 1, No. 2, pp. 14-17.
Audretsch, D.B. and M. Fritsch (1992), “Market Dynamics and RegionalDevelopment in the Federal Republic of Germany”, Discussion PaperFS IV 92-6,Wissenschaftszentrum Berlin (WZB), Berlin, Germany.
Beale, Jeremy (1995), “Illustrative Policy Issues and Recommendations – NewGrowth Industries: Multimedia Services”, OECD STI/STCP internalmemorandum, 14 February 1995.
Berney, Robert and Bruce Phillips (1995), “Small Business and Job Creation –An Update”, draft manuscript, Office of Advocacy, U.S. Small BusinessAdministration, Washington, DC.
Birch, Dave (1979), The Job Generation Process, Massachusetts Institute ofTechnology: Programme on Neighbourhood and Regional Change,Cambridge, MA.
Blanchflower, David G. and Andrew J. Oswald (1992), “Entrepreneurship,Happiness, and Supernormal Returns: Evidence from Britain and theUS”, National Bureau of Economic Research Working Paper No. 4228,Cambridge, MA.
Brown, Charles, James Hamilton, James Medoff (1990), Employers Large andSmall, Harvard University Press, Cambridge, MA.
Carter, Nancy M., William B. Gartner and Paul D. Reynolds (1995), ExploringStart-Up Event Sequences, Babson-Kauffman FoundationEntrepreneurship Research Conference, London Business School,London.

8181
Davidsson, Per, Leif Lindmark and C. Olofsson (1994), “New Firm Formationand Regional Development in Sweden”, Regional Studies, Vol. 28, No. 4,pp. 395-410.
Davis, Steven J. (1990), Size Distribution Statistics from County BusinessPattern Data, Graduate School of Business, University of Chicago,Chicago, unpublished report.
Davis, Steven J., John Haltiwanger, and Scott Schuh (1993), “Small Businessand Job Creation: Dissecting the Myth and Reassessing the Facts”,National Bureau of Economic Research, Inc. Working Paper No. 4492,Cambridge, MA.
Duncan, Joseph W. and Douglas P. Handler (1994), “The Misunderstood Roleof Small Business”, Business Economics, Vol. 29, No. 3,. pp. 7-12.
The European Observatory for SMEs (1993), First Annual Report, EIM SmallBusiness Research and Consultancy, Zoetermeer, The Netherlands.
The European Observatory for SMEs (1994), Second Annual Report, EIM SmallBusiness Research and Consultancy, Zoetermeer, The Netherlands.
The European Observatory for SMEs (1995), Third Annual Report, EIM SmallBusiness Research and Consultancy, Zoetermeer, The Netherlands.
Harrison, Bennett (1994), Lean and Mean: The Changing Landscape ofCorporate Power in the Age of Flexibility, Basic Books, New York.
Kirchhoff, Bruce A. (1994), Entrepreneurship and Dynamic Capitalism,Praeger, Westport, CT.
Konings, Jozef (1995), “Gross Job Flows and the Evolution of Size in UKEstablishments”, Small Business Economics, No. 7, pp. 213-220.
Loveman, Gary and Werner Sengenberger (1991), “The Re-emergence ofSmall-Scale Production”, Small Business Economics,Vol. 3 No. 1,pp. 1-37.
OECD (1991), “Statistical Data on Small and Medium Enterprises”, IndustryCommittee on Industrial Statistics, Working Party No. 9, internalmemorandum.
OECD (1993), Small and Medium-Sized Enterprises: Technology andCompetitiveness, Paris.
OECD (1994a), The OECD Jobs Study: Facts, Analysis, Strategies, Paris.
OECD (1994b), The OECD Jobs Study: Evidence and Explanations. Part I:Labour Market Trends and Underlying Forces of Change, Paris.

8282
OECD (1994c), The OECD Jobs Study: Evidence and Explanations. Part II:The Adjustment Potential of the Labour Force, Paris.
OECD (1994d), Employment Outlook: July 1994, Paris.
OECD (1996), Globalisation of Economic Activities and the Development ofSMEs, Paris (forthcoming).
Reynolds, Paul D. (1994), “Autonomous Firm Dynamics and Economic Growthin the United States, 1986-1990”, Regional Studies, Vol. 28, No. 4,pp. 429-442.
Reynolds, Paul D. (1995a), “National Study of US Business Start-Ups:Background and Progress Report”, Conference on Dynamics ofEmployment and Industrial Evolution, University of Mannheim,Mannheim, Germany.
Reynolds, Paul D. (1995b), “Who Starts New Firms? – Linear Additive versusInteraction Based Models”, Babson College-Kauffman FoundationEntrepreneurship Research Conference, London Business School,London.
Reynolds, Paul D. and Wilbur R. Maki (1991), Regional Strategies AffectingBusiness Growth, Final Report to the Rural Poverty and ResourcesProgramme, The Ford Foundation, Department of Sociology,Minneapolis, MN.
Reynolds, Paul D. and David J. Storey (1993), “Regional CharacteristicsAffecting Small Business Formation. A Cross-national Comparison, ILENotebook No. 18, Local Initiatives for Employment Creation Programme,OECD, Paris.
Schreyer, Paul (1996), “SMEs and Employment Creation: Overview ofSelected Quantitative Studies in OECD Member Countries”, STI WorkingPapers 1996/4, Paris.
Schulman, Staffan (1994), Address to the Parliamentary Assembly of theCouncil of Europe, Strasbourg, France, Thursday, 6 October,SG/PRESS(94)66.
Storey, David. J. (1994), Understanding the Small Business Sector, Routledge,London.
Thurik, Roy (1994), “Small Firms, Entrepreneurship and Economic Growth”,F. de Vries Lecture, Erasmus University, Rotterdam, The Netherlands.
U.S. Bureau of the Census (1994), Statistical Abstract of the United States:1994, U.S. Government Printing Office, Washington, DC.

8383
U.S. Small Business Administration (1993), The State of Small Business: AReport of the President, U.S. Government Printing Office, Washington,DC.
U.S. Small Business Administration, Office of Advocacy (1994a), Handbook ofSmall Business Data: 1994 Edition, U.S. Government Printing Office,Washington, DC.
U.S. Small Business Administration, Office of Advocacy (1994b), “New DataShow Smallest Firms are Nation’s Greatest Job Creators”, News Release94-17-ADVO, 30 September.
WORKSHOP MATERIAL
Glover, Jere, Chair Summary of Session 3: SMEs and Job Creation.
Layne, Donald, Chair Summary of Session 4: SMEs: Technology, Productivityand Innovation.
McMechan, Janice, Chair Summary of Session 8: Tracking SMEs andContributions: Data Requirements.
Soete, Luc, Chair Summary of Session 9: Overview and Policy Implications.
Storey, David J., Chair Summary of Session 5: SMEs: Competition, Changeand Economic Growth.
Vianen, Joop, Chair Summary of Session 7: SMEs: Work Organisation andJob Quality.