smeasurements of dynamic friction zbetween … · smeasurements of dynamic friction zbetween rock...
TRANSCRIPT

DNA 4161F
SMEASUREMENTS OF DYNAMIC FRICTIONZBETWEEN ROCK AND STEEL
< Systems, Science and Software
- P.O. Box 1620t< La Jolla: California 92038
25 October 1976
Final Report
CONTRACT No. DNA 001-75-C-0183
APPROVED FOR PUBLIC RELEASE;
I DISTRIBUTION UNLIMITED.
THIS WORK SPONSORED BY THE DEFENSE NUCLEAR AGENCYUNDER RDT&E RMSS CODE 8344076464 Y99QAXS804806 H2590D. c
> Prepared for
C_:- Director
DEFENSE NUCLEAR AGENCY•_ Washington, D. C. 20305
C ,

Destroy this report when it is no longer
needed. Do not return to sender.
,.. .N . '

________ N(;LASS 11:11:1)SEUIC.L SSIFICATi0N OF THIS PAc;E 01Rhen, fl. I..,~)Ii~)Is~crO~
9 REPORT DOCUMENTATION PAGE BEFIORE COMI'I1 I'T'ING FORM
I R'P---TR2 -GOVT ACCESSION No 3 -ECIPIFIJT' CATAOG NuMBER
4 ~! L E(nodSobfffe)/ YPDA' PT A PERIOD 0OdERI-O
( IliASJRI-iMIiNTS OF I)YNAMIC TRJCTIOJ Yepocnal y7pZtIBETWEEN ROCK AND 5'fEL. ,. T RU M ECR
46 SSS-R-77-30467 AUTHOR[-C~I~"P *"
/9 E. S. Gaffney~DNA 1-75-C
9 PERFORMING ORGANIZATION NAME AND ADDRESS ,,10 PROGRAM ELLE:N~T PPOJE' TASK(
Systems, Science and Software ARA8WR V-fUDPP.O. Box 1620 NIVBD.-Sbt askLa Jolla, California 92038 Y99QAXSU&48_l 6
I I CONTROLLING OFFICE NAME AND ADDRESS 12R
D)ire cto r (/ )s2 c~~&-Defense Nuclear Agency D ctZ6
Washington, I).C. 20305___________4 MONITORING AGENCY NAME 6 ADDRESS(if dillet, Ir-n Controlling Office') 15 SECURITY C M 041A41get
UNC LASSI1FI ED15. DECLASSIFICATION DOANGRADING
SCHEDULE
16 DISTRIBUTION STATEMENT (of tisI Report,
0Approved for public release; distribution unlimited.
I DISTRIBUTION STATEMENT (of the ei.bsfat~d entered in Block 20, if differe.nt fro, Re.port)
I8 SUPPLEMENTARY NOTES
This work sponsored by the Defense Nuclear Agency under RIM~ERMSS Code 1344076464 Y99QAXSBO4806 H2590D.
19 KEY WORDS (C.,,,!,n.,e oil 'ever,.. lide. d neremsary rind idenify hi, block ounhbr,
Dynamic Friction Earth PenetratorsInternal Friction Friction at High Speed!hysical Prop-rtics o: Rocks and Soils
,ZD ABSTRACT 14.Croo lon -r ...rse sidfe It nece~i-ry iid I dentify by block ,,oher)
' Instrumentation has been developed for measuring frictionalforces at high velocities between rock samples and the outer rimof a rotating steel wheel. The instrumentation has been used todetermine sliding friction values for volcanic tuff, wet and drysandstone, limestone, grout, bronz.e and teflon.~ Friction in all
these materials was found to obey the law T .. Cwer
DID 1JA N1m 1473 EDITION OF I NOV 051 1SOBSOLETE UCASFE
SECURITY CLASSiFiC ATION OyT-41S PAz3E 117-n., De ot.'cf
1*f~ a ~ jif

[NCLASS I Fl 11)SECURITY CLASSIFICATION OF THIS PAGE(4han Data FIneered)
20. ABSTRACT (Continued)
is the sliding velocity, a is the normal stress, r is the tan-gential stress and p and are parameters dependent on thematerial sliding on the steel. For all rocks and rock-likematerials studied, was found to have a value of 2 GPa-m/s.The standard deviation of the difference between observed valuesand values calculated from this expression is 1.5 MPa, or 19%for all five rocks combined. Bronze and teflon were found toobey a similar relation with different values of , 6.6 GPa.m/sand 0.6 GPa.m/s, respectively. For the limited sample avail-able, appears to be related to the thermal conductivity. Forthe five rocks, p is decreased by the presence of volatilec ,)2onents such as H20 and CO2 .
Attempts to measure friction values for soil in the test deviceused for this program were unsuccessful due to insufficientcohesion in the soils. A friction rule for sail is suggestedbased on extrapolation of rock behavior and static frictionmeasurements.
UNCLASSIFIEDSECURITY CLASSII CATION OF THIS PAGE(Whn flat ll-tterd)
TABLE OF CONTENTS
SECTION PAGE
1. INTRODUCTION ------------------- 5
Ii. TEST EQUIPMENT AND INSTRUMENTATTON - -6
III. RESULTS---------------------6
IV. DISCUSSION--------------- ------ 14
4.1 A General Friction Law ----------- 14
4.2 Significance of the Factor --- 27
4.3 Variability of p----------------------38
4.4 Extrapolation Of T ------------ 41
V. SUMMARY AND RECOMMENDATIONS ---------- 44
REFERENCES--------------------46
CIA
LIST OF ILLUSTRATIONS
FIGbRE PAGE
2.1 Test appara.us for rock-on steel
friction measurements 7
2.2 Typical raw data rpcords.----------- 8
3.1 Frictional data for TTR tuffsliding on steel --- ----------- 18
3.2 Frictional data for sandstonesliding on steel ---- ---------- 19
3.3 Frictional data for Solenhofenlimestone ----------------- 20
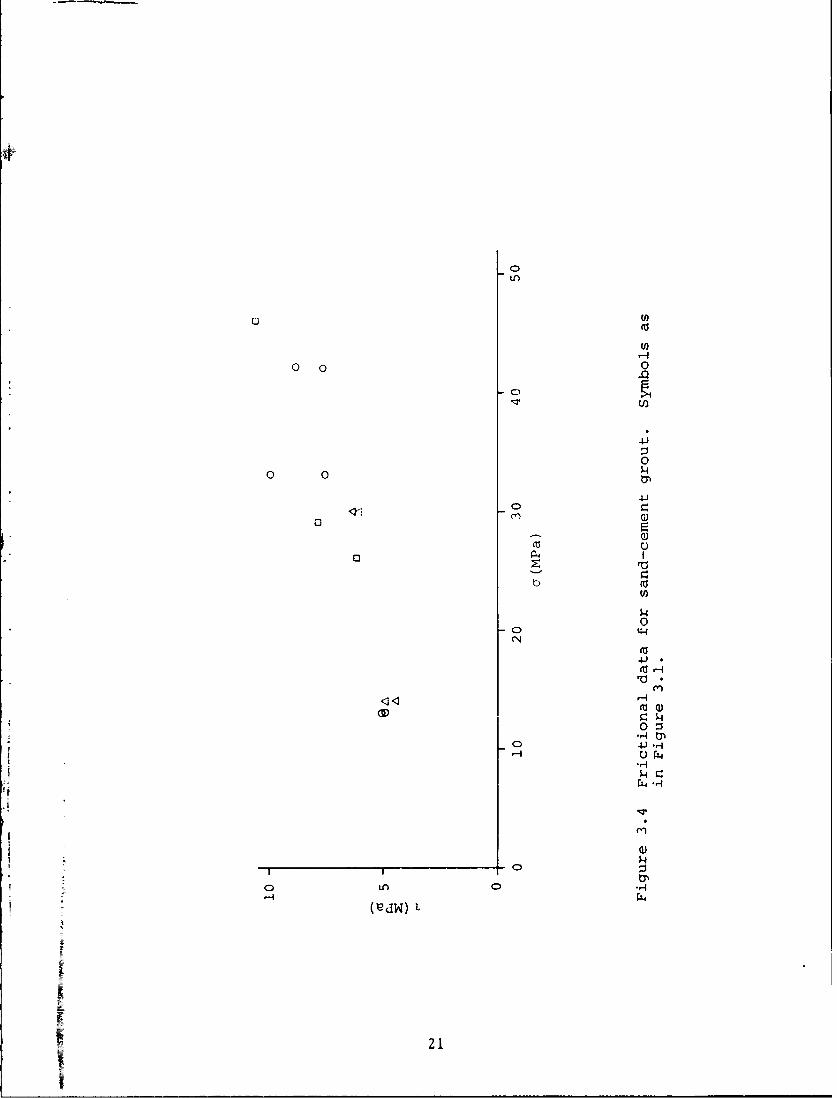
3.4 Firctional da.a for sand-cement grout - - 21
3.5 Frictional data for 660 bronze ------ 22
3.6 Frictional data for teflon- -------- 23
4.1 Frictional data for welded tuffrecast in terms of o--f ---------- 25
4.2 Frictlon data for dry sandstonerecast in terms of --ef f ---------- 32
4.3 Friction data for wet sandstonerecast in terms of a eff- ---------- 33
4.4 Friction data for limestonerecast in terms of 34ff--4
4.5 ;Friction data for sand-cementgrout recast in terms of aeff 35
4.6 Friction data for bronze
recast in terms of a eff ---------- 36
4.7 Friction data for teflonrecast in terms of -eff----- ---- 37
4.8 Behavior of coefficient of frictionof a low melting-point metalsliding on steel at high velocities 43
2

iLIST OF TABLES
TABLE PAGE
3.1 Description of materials tested ------ 9
3.2 Raw friction data for weldedtuff sliding on steel i- - - - - - - - -- 1
3.3 Raw friction data for drysandstone sliding on steel -------- ii
3.4 Raw friction data for wetsandstone sliding on steel -------- 12
3.5 Raw friction data forlimestoie sliding on steel - - - - - ---- 13
3.6 Raw friction data for sand-cement grout sliding on steel --------- 15
3.7 Raw friction data forbronze sliding on steel ---------- 16
3.8 Raw friction data forteflon sliding on steel ---------- 17
4.1 Frictional properties of rocksand other materiels studied -------- 26
4.2 Friction data recast in the formaeff = U exp(-ca/), Tcalc To + 1 f - 28
4.3 Sliding friction and internalfriction for rocks and grout 39
3
--W

I. INTRODUCTION
In recent years the Defense Nuclear Agency (DNA) has
,3onsored research concerning the loading and response of pro-
jectiles during earth penetration as part of its Earth Pene-
trating Weapons Technology Program. These studies nave been
designed to increase our understanding of the process of pene-
tration of earth materials by high velocity projactiles. This
work has included numerical computer modeling of the pene-
tration process, experimentaI. simulation of penetration, and
experimental investigation of phenomenology related to
penetration. One of the phenomena considered to be important
in proper simulation or modeling of the "enetration process
is the friction that exists between the high velocity steel
penetrator and the rock or soil material that i.t is penetrating.
Very little previous work has been done to determine friction
coefficients between rock and steel at velocities in excess of
5 m/s and high normal stresses. As a consequence, Systems,
Science and Software (S3 ) has undertaken an experimental
inve-tigation for DNA, of frictional forces between rock and
steel at high sliding velocity (up to 30 m/s) and high normal
stress ;.
An existing rotary :sco.eter, develcped fir DNA under
a previous contract, was modifie, to measure frictional stresses.
The details of t!,is device and its 'nstrumentation have been(1)reported in a previous report ( . However, for convenience,
a brief description of the instrumentation and its operation
is given in Section 3.I. In Section III of this report the data
that has been obtained on five rocks and two other materials
is Presented. Secti-.n IV discusses the results and their
implications for earth penetrating vehicles.
I gP QJL -
t 5

Ii. TEST EQUIPMENT AN) INSTRUMENTATION
We have modified a rotary viscometer (developed for DNA
under contract DNA001-74-C-0077) to permit measurement of
friction between rock samples an-3 a flywheel of low carbon (1020)
steel. The arrangement is shown schematically in Figure 2.1.
The wheel is set rotating with no load on the wheel. When the
wheel has reached the desired rotational speed two rock sam-
ples are pressed onto opposite radii of the flywheel for about
200 msec. This load duration was chosen so that the load could
reach a steady value and so tat the sample would be sliding on
a fresh surface for the lowest initial velocities used (10 m/s).
The normal and tangential loads are measured during this event.
Data from all four load cells are recorded on an oscilloscope.
The rotational velocity is measured by a photodetector which
looks at a pattern attached to the axis of the flywheel. This
pattern repeats ten times per revolution. The test interval
ranged from a halF to one and a half revolutions. The photo-
detector output is also recorded on an oscilloscope. Figure 2.2
shows a typical set of raw data. Data presented in this report
are taken from the first 50 msrc of the recorded traces so that
they refer to a fresh steel surface. After each test the wheel
was resurfaced without lubrication using a coru... m grinder.
III. RESULTS
S 3 has used the instrumentation described above to
measure frictional properties of five rocks, bronze and teflon
sliding on steel at velocities between 10 and 30 m/s. The
materials studied are described in Table 3.1. Data, in the form
of sliding velocity (c), normal stress* (a) and tangential
stress (T), are shown in Table 3.2 for tuff from the Tonopah
Test Range (TTR); in Table 3.3 for dry Dakota sandstone; in
Table 3.4 for -.et Dakota sandstone; in Table 3.5 for Solenhofen
These are average stresses, i.e., total force sample area.
6

U) 4-)
0 W E
U)
4
44
E- -)
0:v 0
U I4
0
04-4
Cl)
4
a-4 al
U) 4-'U)
01E-40 H
F-I u
U0
Pi4 H 44

(a) Sample J/11 N H UMME M
Normal Load2 V/div - 35.6 kN/div ,rumMhIEEEEELower TraceTangential Load1 V/div 17.8 kN/div
50 ms/div N/(iIm m m ml
(b) Sample N/7 .flmEEE hUpper Trace WIMMMMmNormal Load2 V/div 35.6 kN/div H E MLower Trace di MEIATangential Load1 V/div = 17.8 kN/div
50 ms/div ___
(c) Velocity
Tachometer Output1 cycle = 1/10 revSweep Rate = 50 ms/div
Figure 2.2 Typical raw data records. CO = 10 m/s; normalload, 6.7 MPa.
8
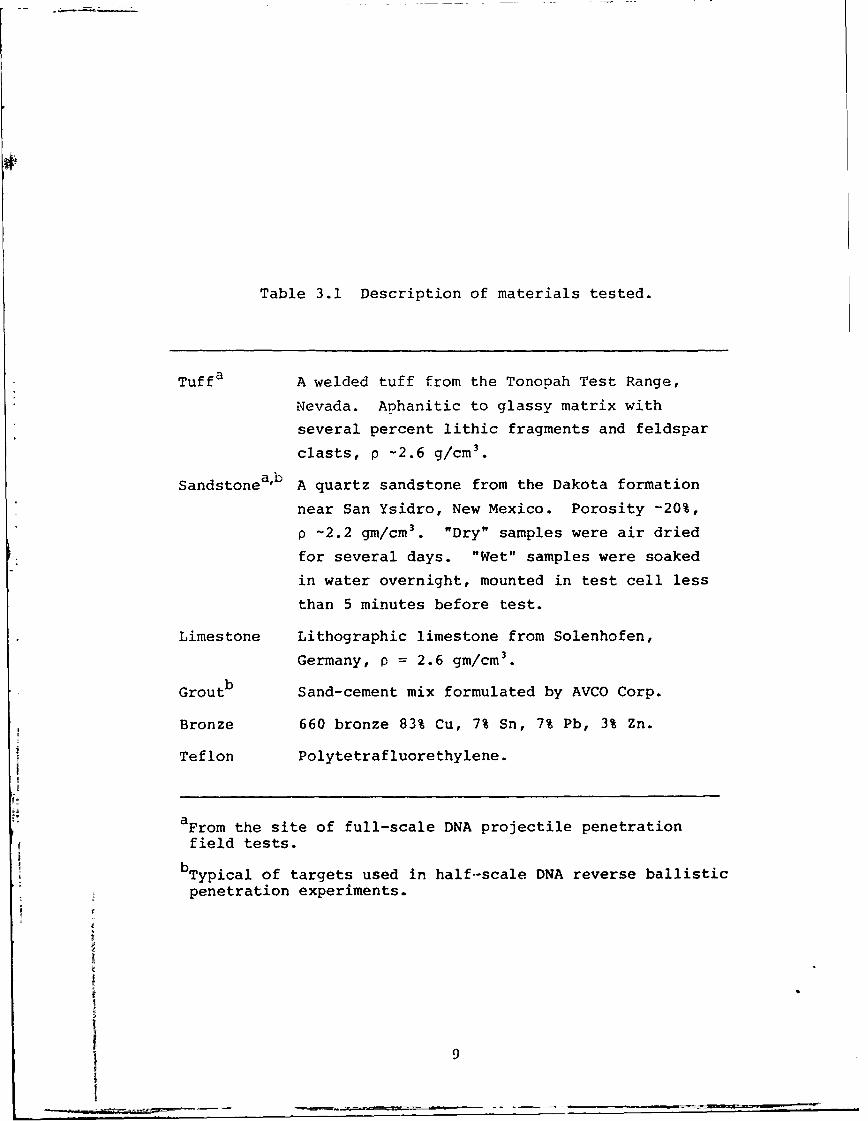
Table 3.1 Description of materials tested.
Tuffa A welded tuff from the Tonopah Test Range,
Nevada. Aphanitic to glassy matrix with
several percent lithic fragments and feldspar
clasts, p -2.6 g/cm 3.
Sandstone 'b A quartz sandstone from the Dakota formation
near San Ysidro, New Mexico. Porosity -20%,
p -2.2 gm/cm 3. "Dry" samples were air dried
for several days. "Wet" samples were soaked
in water overnight, mounted in test cell less
than 5 minutes before test.
Limestone Lithographic limestone from Solenhofen,
Germany, p = 2.6 gm/cm3.
Groutb Sand-cement mix formulated by AVCO Corp.
Bronze 660 bronze 83% Cu, 7% Sn, 7% Pb, 3% Zn.
Teflon Polytetrafluorethylene.
aFrom the site of full-scale DNA projectile penetration
field tests.
bTypical of targets used in half-scale DNA reverse ballistic
penetration experiments.
9

Table 3.2 Raw friction data for welded tuffsliding on steel.
Test c a TNo. (ni/S) (MPa) (MPa)
75F10 10 12.5 7.2
13.4 7.5
75F15 10 11.2 4.8
75F18 10 30.0 13.2
75F22 10 66.3 26.569.5 24.3
75F11 20 13.4 5.613.4 5.4
75F14 20 11.6 4.48.5 3.1
75F17 20 49.8 13.945.7 14.6
75F21 20 65.4 17.064.1 16.0
75F12 30 14.3 5.714.3 6.0
75F13 30 16.1 8.116.6 6.0
75F16 30 45.2 13.143.9 12.3
75F19 30 33.9 8 .7
75F20 30 55.1 12.7
52.0 12.0
76F47 30 107.0 11.4
10

Table 3.3 Raw friction data for dry sandstonesliding on steel.
Test c G -No. (m/s) (MPa) (MPa)
76F0l 11 13 4.65.6
76F04 10 23 5.88.5
76F07 12 47 14.117.4
76F02 20 15 4.84.2
76F05 23 29 9.66.6
76F08 20 59 8.97.1
76F03 32 15 6.
76F06 32 22 7.G6.6
76F09 32 46 10.111.5

Table 3.4 Raw friction data for wet sandstonesliding on steel.
Test c G TNo. (m/s) (MPa) (MPa)
76F22 10 14.3 3.8
10 13.7 6.1
76F24 10 15.7 4.7
76F27 9.7 34.5 14.39.7 40.6 13.7
76F20 20 17.2 3.0
76F25 20 21.9 5.720 25.1 5.9
76F28 19 61.1 10.9
76F21 31 18.3 4.031 16.7 3.3
76F26 31 30.5 5.3
76F29 30 51.7 10.0
12

Table 3.5 Raw friction data for limestonesliding on steel.
Solenhofen limestone
Test c G T
No. (m/s) (MPa) (MPa)
76F48 29.3 13.4 1.515.7 1.1
76F50 29.3 38.5 4.637.6 3.6
76F52 29.4 43.9 3.047.0 2'.5
76F49 14.8 36.6 4.642.3 3.8
76F51 14.8 76.9 7.481.4 5.3
13
.. .. .. . . .

limestone; in Table 3.6 for sand-cement grout; in Table 3.7
for 660 bronze; and in Table 3.8 for teflon (polytetrafluor-
ethylene). The data are also presented graphically in Figures
3.1 through 3.6, respectively. Some of the data on tuff and
dry sandstone have been reported previously (1 ).
Attempts to measure the frictional properties of two
soils, Buckshot clay and clay from White Sands missile range,
proved unsuccessful due to the very low strength of the soils.
Specimens of all the soil and all the rock materials except
Solenhofen limestone were supplied by Waterways Experiment
Station (WES). The limestone was provided by Dr. Karl Schuler
of Sandia Laboratories and machined by WES.
IV. DISCUSSION
4.1 A General Friction Law
In the earlier report ( , we demonstrated that all of
the frictional data on TTR tuff obtained for normal stresses
below 70 MPa could be explained with a linear dependence of T
on a with the friction coefficient v decreasing as the sliding
velocity increased. During the last year's contract effort,
one additional measurement was made with TTR tuff sliding on
steel at a velocity of 30 m/s and a normal stress of over 100
MPa. The results of this experiment did not follow the same
relations as the lower stress tests. As a result we must find
a new relation between the tangential stress T, and the normal
stress a.
Such a relation was suggested by D. K. Butler of the
WES (2 ). Butler suggested a friction law of the form
= T + Va ea/*(i)
where T and a* are constants with units of stress.
14
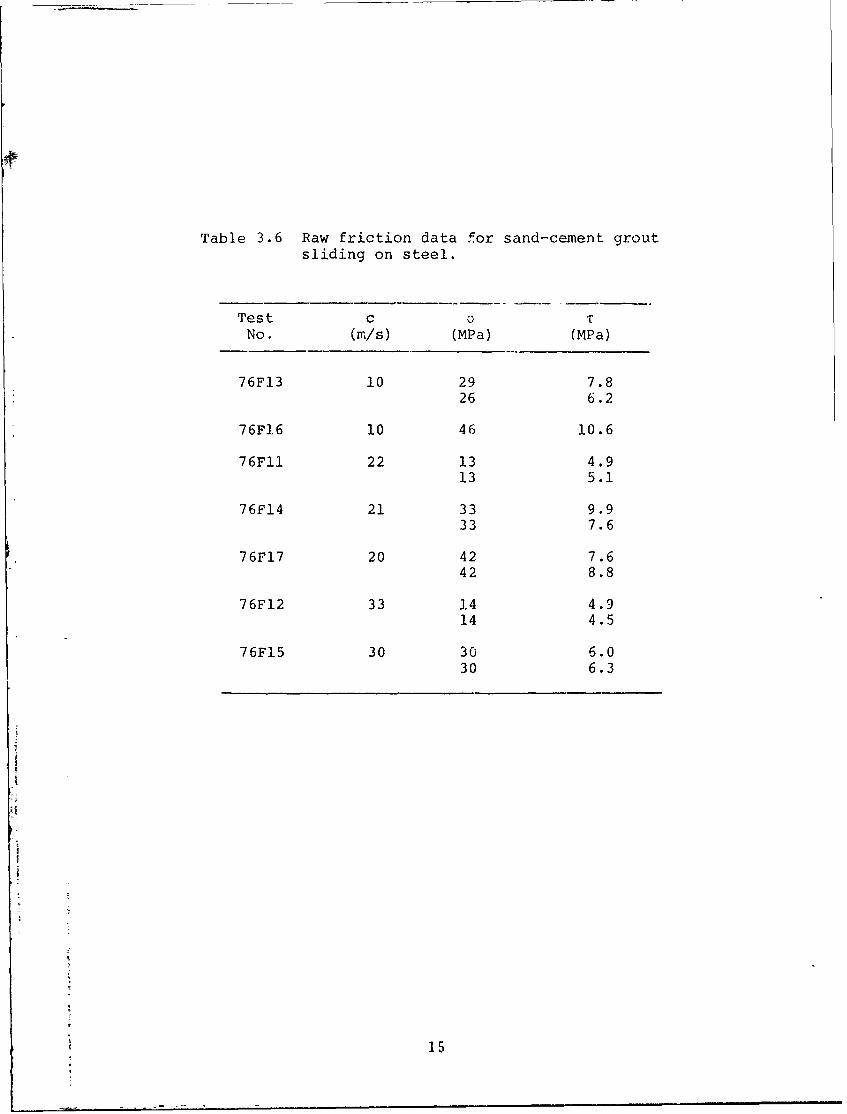
Table 3.6 Raw friction data f~or sand-cemnent groutsliding on steel.
Test c0No. (rn/s) (MPa) (MPa)
76F13 10 29 7.8
26 6.2
76F16 10 46 10.6
76F11 22 13 4.913 5.1
76F14 21 33 9.933 7.6
76F17 20 42 7.642 8.8
76F12 33 14 4.914 4.5
76F15 30 30 6.030 6.3

Table 3.7 Raw friction data for bronzesliding on steel.
Test c a 'No. (M/s) (MPa) (MPa)
76F37 20 35.1 4.2
76F38 20 34.0 4.1
76F39 20 44.5 4.5
76F40 20 41.0 5.3
76F41 20 45.7 6.5
76F42 20 296.0 14.8
16

T"able 3.8 Raw friction data for teflon sliding on steel.
Test c ar T
No. (M/s) (MPa) (MPa)
76F43 20 13.9 1.7
76F44 20 23.6 1.9
76F45 20 36.3 2.1
76F46 20 44.2 2.1
17

4-)
0
(154-)
-r4
r4)U) U)
IN-I
'0
f4o 4-
CD)
C)~ 2-'iCN CN
0 00

0u00
U
4~ 1 )
QU)
00
CUU0 cfl
4-) )
-40
En ( U)
44 Old C
00
0 0 04-).
ro (d
12) -4-)C)
304
(n (1) U) 0 0
.1 >
Ll C)
A, rq r-
19

00
00
-4-)Ln o
o.
0
00C:l)
00
-)
0
(a)4-)
C)no0
0
- .-1
0 0U
(rdU)
200
o 0,-
00
0 .4
-o 'U)
.,4 e
(4.) ),.
200
00
0 Ci0
U)
o a 0
4)
0
4 .)
00
0rL "I
(U U4
0 21

00
CDLn
C),
-r-0
L~
Q) -4
kn C0
22-

12
U4J
00 0p
-4-
234-

Attempts to apply this relationship to the data obtained on
TTR tuff worked quite well for any given sliding speed.
However, it was found that the value of a* best suited to
each sliding velocity varied proportional to the sliding
velocity. A zero value for T fit the data well. Therefore,
we have empirically modified the relationship and used the
general form
= pa e- cO / (2)
where o is the normal stress, c the sliding velocity, T the
tangential stress and v and are material-dependent parameters.
Application of Equation (2) to the data results in
reduction of data from all sliding velocities to a single
linear relation
S= eff (3)
where aeff = oe For a value of C equal to 2.0 GPa m/s,
the recast data for TTR tuff are shown in Figure 4.1. A straight
line of slope 0.5 has been drawn through the data. The stan-
dard deviation of the differences between the observed values
of T and those indicated for the linear dependence is 1.04 MPa.
Encouraged by these results, we attempted to apply the
analysis to other materials. Values of p and found to give
good fits to the data are shown in Table 4.1. Also shown is
the standard deviation of the difference between observed
tangential forces and those calculated using Equation (2)
and the values of Table 4.1. The values of all parameters
were chosen by inspection and are not the result of a least
squares or similar curve-fitting procedure. Furthermore, the
value F used for all rocks and rock-like materials was chosen
to be the same as that used for TTR tuff. Although this
choice is somewhat arbitrary, changing from 2.0 to 1.5
GPa.m/s does not have a significant effect on the standard
deviation of the difference between calculated and observed
24

0
25
2S=2.1 NPa
20
/00
15 -/
100
0
0 0
0 10 20 30 40 50
(if (MPa)
Figure 4.1 Frictional data for welded tuff recast in termsof a eff* Symbols as in Figure 3.1.
25

Table 4.1 Frictional properties of rocks andother materials studied.
ROCK is(GPa'm/s) (MPa)
Tuff .50 2.0 1.04
Sandstone (Dry) .39 2.0 2.33
Sandstone (Wet) .34 2.0 1.83
Limestone .14 2.0 0.88
Grout .34 2.0 1,17
Bronze .13 6.6 0.80
Teflon .20 0.6 0.13
s= Standard deviation of Tcalc T.
26

values of T. However, it does result in a marked change in
the P which must be used to best fit the observed data. The
linearized data for all materials studied are presented in
Ta' .e 4.2 and shown graphically in Figures 4.2 through 4.7.
It was found that data for bronze and teflon could not
be fit with a value of F of 2 GPa-m/s. For teflon a lower
value of 0.6 GPa-m/s was required to obtain a reasonable fit
to the observed data. For bronze a much higher value of
6.6 GPa'm/s was used. With these values of , good fits to
all of the observed data were obtained.
4.2 Significance of the Factor
The factor F used in the exponential relationship to
convert from observed normal stress, a, to effective normal
stress, aeff' has the units of pressure times velocity.
Alternatively, it may be expressed in terms of energy per
unit area per unit time, or power per unit area. This dimen-
sionality of suggests that it should be related to the
power dissipation at the sliding interface.
Although accurate values of thermal conductivity are
not available for any of the materials studied, we can esti-
mate conductivities based on literature values. Taking
values of 6 x 10', 6 x i0- 3 and 0.45 (cal/cm2-sec)/(deg/cm)
for the teflon, a "typical" rock, and bronze, respectively,
we find that the valies of F (0.6, 2 and 6.6 GPa.m/s, respectively)
increase with the thermal conductivity of the sample. It is
exactly what we would expect if were indeed a power per unit
area lost at the sliding surface and if the loss were controlled
by thermal conductivity into the sample. In fact, energy pro-
duced at the interface is lost both to the sample and to the
wheel, and to the ai- through ablation. Since conductivity of
steel is much greater than that of ro(.k, essentially all con-
= ductive heat must be lost to steel. Heat is also lost by abla-
tion, which is probably the greatest heat sink. Thus, the rela-
tion of r to thermal conductivity may not be meaningful.
27

Table 4.2 Friction data recast in the form
Geff = a exp(-co/C), "calc = p' eff
Test c a Geff T Tcalc MaterialNo. (m/s) (MPa) (MPa) (MPa) (MPa)
75F10 10 12.5 11.7 7.2 5.9
13.4 12.5 7.5 6.2
75F15 10 11.2 10.6 4.8 5.3
75F18 10 30.0 25.8 13.2 12.9
75F22 10 66.3 47.6 26.5 23.869.5 49.1 24.3 24.6
75F11 20 13.4 11.7 5.6 5.913.4 11.7 5.4 5.9
75F14 20 11.6 10.3 4.4 5.18.5 7.8 3.1 3.9 Tuff
75F17 20 49.8 30.3 13.9 15.1 245.7 28.9 14.6 14.4 = 2.0 GPa.m/s
75F21 20 65.4 34.0 17.0 17.0 i = 0.50
64.1 33.8 16.0 16.9
75F12 30 14.3 11.5 5.7 5.814.3 11.5 6.0 5.8
75F13 30 16.1 12.6 8.1 6.316.6 12.9 6.0 6.4
75F16 30 45.2 22.9 13.1 11.443.9 22.7 12.3 11.3
75F19 30 33.9 20.4 8.7 10.2
75F20 30 55.1 24.1 12.7 12.052.0 23.8 12.0 11.9
76F47 30 107.0 21.5 11.4 10.8
28

Table 4.2 (continued)
Test c U Ceff I Tcalc MaterialNo. (m/s) (MPa) (MPa) (MPa) (M-Pa)
76F22 10 14.3 13.3 3.8 4.5
10 13.7 12.8 4.4 6.1
76F24 10 15.7 14.5 4.7 4.9
70F27 9.i 34.5 29.2 14.3 9.99.7 40.6 33.3 13.7 11.3
76F20 20 17.2 14.5 3.0 4.9 Wet Sandstone
76F25 20 21.9 17.6 5.7 6.0 2.0 GPa'm/s20 25.1 19.5 5.9 6.6
J = 0.3476F28 19 61.1 34.2 10.9 11.6
76F21 31 18.3 13.8 4.0 4.7
31 16.7 12.9 3.3 4.4
76F26 31 30.5 19.0 5.3 6.5
76F29 30 51.7 23.8 10.0 8.1
76F0I 11 13 12.1 4.6 4.711 13 12.1 5.6 4.7
76F04 10 23 20.5 5.8 8.010 23 20.5 8.5 8.0
76F07 12 47 35.5 14.1 13.812 47 35.5 17.4 13.8
76F02 20 15 12.9 4.8 5.0 Dry Sandstone20 15 12.9 4.2 5.0
~=2.0 GPa rn/s76F05 23 29 20.8 9.6 8.1
23 29 20.8 6.6 8.1 p = 0.39
76F08 20 59 32.7 8.9 12.820 59 32.7 7.1 12.8
76F03 32 15 11.8 6.3 4.6
76F06 32 22 15.5 7.0 6.032 22 15.5 6.6 6.0
76F09 32 46 22.0 10.1 8.632 46 22.0 31.5 8.6
2 ~

Table 4.2 (continued)
Test c a aeff T TcalcNo. (m/s) (MPa) (MPa) (MPa) (MPa) Material
76F48 29.3 13.4 11.0 1.5 1.515.7 12.5 1.1 1.8
76F50 29.3 38.5 21.9 4.6 3.1 Limestone37.6 21.7 3.6 3.0
76F52 29.4 43.9 23.0 3.0 3.2 = 2.0 GPa-m/s
47.0 23.6 2.5 3.3 0.14
76F49 14.8 36.6 27.9 4.6 3.9
42.3 30.9 3.8 4.3
76F51 14.8 76.9 43.5 7.4 6.1
81.4 44.6 5.3 6.2
76F13 10 29 25.1 7.8 8.5
26 22.8 6.2 7.8
76F16 10 46 36.5 10.6 12.4
76FII 22 13 11.3 4.9 3.8
13 11. 5.1 3.8 Grout
76F14 21 33 23.3 9.9 7.933 23.3 7.6 7.9 = 2.0 GPam/s
76F17 20 42 27.6 7.6 9.4 = 0.34
42 27.6 8.8 9.4
76F12 33 14 11.1 4.9 3.8
14 11.1 4.5 3.8
76F15 30 30 19.1 6.0 6.5
30 19.1 6.3 6.5
30

Table 4.2 (continued)
Test c C eff T TcalcNo. (ni/s) (MPa) (MPa) (MPa) (l4Pa) Material
76F37 20 35.1 31.6 4.2 4.1
76P38 20 34.0 30.7 4.1 4.0 Bronze
76F39 20 44.5 38.9 4.5 5.1 =6.6 GPa it./s
76F40 20 41.0 36.2 5.3 4.7ii=0.13
76F41 20 45.7 39.8 6.5 5.2
76F42 20 296.0 121.0 14.8 15.7
76F43 20 13.9 8.7 1.7 1.7 Teflon
76F44 20 23.6 10.7 1.9 211 /F, = 0.6 GPa in/s
76F45 20 36.3 10.8 2.1 2.1 p= 0.20
76F46 20 44.2 10.1 2.1 2.0)
31

0
(,n
cin
4
04-)
II UEA(Nc
04 0
0 00a0 -- 1
0
I-
322

Lfl
4-4
410
4.)
-<r-
04-
U)
444
4
v) 0 ~ 4-4 i
4-) -
0) U
r1. f
0 (n
4
* 44
H-
330

4-4
En 4
0U) I 4)
0
0 I1
U)
0 L*4-Jr--
0 L4U)
0 0
CD
00-~- 0*.
o 30

00
'.0
(N)
4-
0 M
0
Cl a)4'
w 41
00
a,.
C4, ru c
(U
FOw
0 I CL4
35

0 H4
0 4
4-)
4IJ
4)
NN
14-4 0'4-4 S-i
ci)4
00Loc
.4- or
'0 E
I In
-1 H
(PdN) I
36

0
2S -2s = 0.26 MPa
2
0 I I
0 5 10 150 (MPa)eff
Figure 4.7 Friction data for teflon recast interms of eff" Symbols as inFigure 3.1
37

The dependence of frictional behavior on the thermal
conductivity of a small sample sliding on a large, high ther-
mal conductivity wbeel is not as would be expected from the
analysis of Jaeger (3 ). Jaeger's analysis indicates that
the temoerature at the sliding surface, and therefore, presuma-
bly the energy dissipation, for high sliding velocities will
be virtually independent of the thermal conductivity of the
small sliding sample, especially if the sample has a lower
thermal conductivity than does the substrate. We have no
explanation for the disparity between Jaeger's analysis and
our results except that perhaps the mathematical model of
Jaeger is too simplified to apply to the present results.
4.3 Variability of p
Ve see from Table 4.1 a wide variation in the slope of
T with aeff" Values cf P as low as 0.13 (for bronze) and as
high as 0.50 (for tuff) are seen.
In an investigation of static friction between soils
and steel under low normal stresses, Potyondy (4 ) found that
the ratio of the measured friction to the tangent of the angle
of internal fric-ion range' from 0.39 to 0.93. Since T/a
in Equation (2) approaches P at low velocity and low normal
stresses, it is appropriate to compare the present results
with his. The angle of friction has been determined for
four of the materials included in the present study. The
values of tan are compared with those of p in Table 4.3.
The range of p/tan a seen in the present study is comparable
to that of Potyondy (4 ). More extensive work on a compre-
hensive suite of rocks would be necessary to determine the
presence of a systematic relation between V/tan and other
material properties.
For the rocks and rock-like materials, we notice that
those with a high percentage of potentially volatile material
38

Table 4.3 Sliding friction and internal frictionfor rocks and grout. is the angle ofinternal friction determined from theMohr envelope for ultimate strength atlow confining pressilre.
Material tan I. /tan Reference
TTR Tuff 0.58 0.50 0.86 (5)
Dakota Sandstone 0.53 0.39 0.74 (6)
Solenhofen Limestone 0.43 0.14 0.33 (7)
AVCO Grout 0.70 0.34 0.49 (8)
39

such as limestone, sand-cement grout and wet sandstone, have
lower values of i than do the dry rocks with no volatile
components. This suggests that friction in wet or carbona-
ceous rocks is strongly affected by vapor formation. In the
case of water-bearing rocks, the vapor is water vapor pro-
duced either by heating interstial water or by dehydrating
hydrous minerals. in the case of limestone the volatile
material must be CO2 produced by thermal breakdown of CaCO 3.
It is, of course, dangerous to extrapolate the results
for a small suite of rocks to the general case of all rocks.
However, in view of the expense of obtaining such data, we
feel that it is incumbent upon us at least to speculate. If
we extrapolate these results to other rock types, we would
anticipate that all carbonaceous rocks would have relatively
low friction coefficients and that limestones might have
lower coefficients than dolomites since higher temperatures
are required to drive CO2 out of dolomites than out of lime-
stones. In the case of water-bearing rocks or porous rocks
we would expect that any porous rock in a wet condition,
whether saturated or unsaturated, would show appreciably
lower coefficients for friction than the same rock in a dry
condition. The number of rocks that we have looked at in the
present study is insufficient to draw any conclusions as to the
relative effectiveness of interstial water or bound water on
frictional behavior of rocks.
Almost all soils contain appreciable amounts of water,
as both bound water and interstial water. Because of this
fact we would expect that low values of p would be associated
with soils. Furthermore, their low strength suggests that T
must be negligible for soils. In the absence of any direct
data we would suggest a friction law for soils of the form
T = k tan4 a e-ca/ 6 0 0 MPa.m/s (3)
40

where k is the ratio j/tan4 suggested by Potyondy for that
type of soil. In this form we have used a low value of
because of the low thermal conductivity of many soils.
4.4 Extrapolation of T
In order to apply the present results to penetration
problems of interest, we must extrapolate the data taken for
sliding velocities of no more than 30 m/s at normal stresses
below 100 MPa into the range of sliding velocities up to sev-
eral 100 m/s and normal stresses in excess of 1 GPa. Such an
extrapolation of two orders of magnitude or more in the product
cc is clearly fraught with danger. As discussed below, we
anticipate that the extrapolation will be valid. However,
there are some results from previous investigations of metal-
on-metal sliding friction at high velocities which indicate
that there may be an increase in friction coefficients as we
proceed to higher sliding velocities or higher normal stresses
than included in the present investigation. These results are
discussed by Bowden and Taber (9 ).
In summary, it is found that for high melting point
metals, sliding on other metals, the coefficient of friction
drops monotonically as sliding velocity is increased for a
given normal force. However, for low melting point metals,
the coefficient of friction first drops and then climbs once
again to values near the zero-velocity value; in some cases it
is noted that at even higher velocities the coefficient of
friction once again begins to drop to very low values.
This phenomenon is explained by a change in the basic
nature of the surface upon which the sliding occurs. At low
velocities, where only moderate amounts of heat are generated
at the sliding surface, all sliding occurs on small asperities
on the surface. In other words, only a very small portion of
the surfaces are actually in contact. As the sliding velocity
41

increases, the temperature of these contact points increases
and very rapidly exceeds the melting point of the material.
As the velocity increases further, the temperature of the molten
material in the small contact areas increases, reducing the
viscosity and thereby reducing the effective friction. However,
if the sliding velocity continues to increase, eventually the
area of contact begins to increase so that the energy loss in the
small molten areas becomes very great. At some point the in-
crease in area is more important than the increase in frictional
energy. Thus, there is a larger area at lower temperature with
a high viscosity and therefore a higher tangential force.
Finally, after the entire gross sample area is molten, further
increases in velocity increase the contact temperature and decrease
the friction. This behavior is shown schematically in Figure 4.8.
The present results which show a maximum in tangential
force with increasing speed at a given normal stress, might be
supposed to lie in either the left-hand or right-hand portion
where T decreases as cc increases. Observations of sample sur-
faces and of the steel wheel surface after tests indicate that
the entire contact area is covered with a thin layer of molten
steel. This observation leads us to conclude that it is likely
that coefficients of friction will continue to decrease as
sliding speeds and normal stresses are increased. However,
this conclusion is supported only by subjective observation of
samples after a test, and not by objective or numerical data.
42

'-
a))
~4
0
r4J 0
r . .,-0
(1) (0 0.
a) 004* .
41)
rX404-)
rz 4 44 -qC
(})04- )
4-)
r --1)0-y
41
a) .- 10 11
44 (a to
(U 4-)
443
04-I lt" C-l
o. '-; Cd. .4
a)h
Cd4-,-I
WrkU )

V. SUMMARY AND RECOMMENDATIONS
We have made measurements of frictional effects of
several materials sliding on a dry steel wheel. Materials
studied were welded TTR tuff, wet and dry Dakota sandstone,
Solenhofen limestone, sand-cement grout, bronze and teflon.
Sliding velocities were between 9.7 m/sec and 33 m/sec.
Average normal stresses ranged from 8.5 MPa to 296 MPa.
The frictional behavior of all these materials can be
expressed as T = a e , where T is the tangential stress,
a is the normal stress, c is the sliding velocity and p and
i are properties of the material. is the same for all the
rocks and the grout (2 GPa-m/s) but is higher for bronze
(6.6 GPa'ra/s) and lower for teflon (0.6 GPa'm/s). The value of
may be proportional to the thermal conductivity of the
sample. Its units of energy flux sugg-st that it is related to
the rate at which energy is lost from the sliding surface.
P is 0.50 to 0.39 for the dry, anhydrous rocks. It aDpears to
be decreased by the presence of pore water, bound water or
carbonate. (it is only 0.14 in limestone.)
Based on this data, it is tentatively proposed that
friction between soil and steel might follow the relation
T = Ktan a e- ca/( 6 0 0 MPa-m/s). However, caution is suggested
in using this relation since no measurements on soil were made.
Caution is also required in attempting to extrapolate
this relation to velocities of hundreds of meters per second.
Metal on metal friction can exhibit wide excursions in ji at
speeds of that magnitude.
Based on this work we recommend the following work to
validate the above relation for cases of interest to penetrator
technology.
44

1. Measurements should be made with rocks at high
sliding velocities (in excess of 100 m/s) and at higher normal
stresses (above 100 MPa).
2. Measurements should be made with soils and with an
extensive suite of rocks to determine if v/tan4 can be related
to other material properties.
3. Measurements with high initial temperatures should
be undertaken. These measurements would be useful in quanti-
Fying the importance of melting in decreasing sliding friction.
4. Because of the asymmetry of these tests and of the
penetration event, measurements should be made of steel sliding
on rock.
5. Apparatus to make the above measurements at high
velocities does not yet exist, hence, such an apparatus should
be developed. All the recommended measurements could be accom-
plished in a rocket sled test program. By comparing the pre-
sent results to the results of the recommended work, the sled
program could probably be accomplished in 15 to 20 runs.
Alternatively, special friction machines could be developed to
make the measurements.
4S

REFERENCES
1. E. S. Gaffney, 1975, "Rock/steel dynamic frictionmeasurements," Systems, Science and Software FinalReport No. SSS-R-75-2686 under Contract No.DNA001-75-C-0183 tDRAFT).
2. P. Hadala, letter to M. H. Wagner dated 1 March 1976.
3. J. C. Jaeger, 1942, "Moving sources of heat and thetemperature at sliding contacts," Roy. Soc. N. So.Wales, J. and Proc. 76, 203-224.
4. J. G. Potyondy, 1961, "Skin friction between varioussoils and construction materials," Geotechnique 11,339-353.
5. S. W. Butters, et al, 1976, "Field, laboratory and modelingstudies of Mount Helen welded tuff for earth penetratortest evaluation," August 1976, Terra Tek, Salt Lake City,Utah.
6. D. K. Butler, et al, 1976, "Constitutive property investi-gations in support of full scale penetration tests:Report 1, Dakota sandstone, San Ysidro, N.M.," April 1976,(DRAFT) Technical Report, USAEWES, Vicksburg, MS.
7. J. Handin, 1966, "Strength and ductility," Ch. 11 inS. P. Clark, Jr. (ed.) Handbook of Physical Constants.Geol. Soc. Am. Memoir 97, pp. 223--290.
8. D. K. Butler, 1975, letter report from WES to Maj. T.Stong (DNA) dated 16 December 1975.
9. F. P. Bowden and D. Tabor, 1964, The Friction andLubrication of Solids, Part II, Clarendon Press, Oxford.
46

DISTRIBUTION LIST
DEPARTMENT OF DEFENSE DEPARTMENT OF THE ARMY (Continued)
Director Commande rDefense Advanced Rsch. Proj. Agency Frankford Arsenal
ATTN: Technical Library ATTN: L. Baldini
Director Project ManagerDefense Civil Preparedness Agency ATTN: E. J. Linddsey
ATTN: Admin. OfficerCommander
Defense Documentation Center Harry Diamond Laboratories12 Cv ATTN: TC ATTN: DRXDO-RBH, James H. Gwaltney
ATTN: DRXDO-NPDirector
ADefense Intelligence Agency CommanderATTN: DI-7E Picatinny ArsenalATTN: DB-4C, Edward O'Farrell ATTN: Ray MoesnerATTN: Charles A. Fowler ATTN: B. Shulman (DR-DAR-L-C-FA)ATTN: Technical Library ATTN: SMUPA-A--
aATTN: DT-2, Wpns. Sys. Div. ATTN: Marty MargolinATTN: Jerry Pental
Di rector ATTN: SMIJPA-AD-D-A-7Defense Nuclear Agency ATTN: SMUPA-AD-D-M
ATTN: SPAS ATTN: Paul HarrisATTN: STSI Archives ATTN: Ernie ZimpoATTN: DDST ATTN: Technical Library
3 Cy ATTN: STTL, Tech. Library ATTN: P. Angelloti5 Cy ATTN: SPSS
CommanderDir. of Defense Rsch. Engineering Redstone Scientific Information Ctr.
jATTN: S&SS(OS) ATTN: Chief, Documents
Commander CommanderField Command, DNA U.S. Army Armament Command
ATTN: FCPR ATTN: Tech. Library
Director DirectorInterservice Nuclear Weapons School U.S. Army Ballistic Research Labs.
ATTN: Document Control ATTN: G. RoeckerATTN: A. Ricchiazzi
Director ATTN: J. H. Keefer, DRDAR-BLEJoint Strat. Tgt. Planning Staff, JCS ATTN: DRXBR-X
ATTN: STINFO Library ATTN: G. GrabarekATTN: DRXBR-TB
Chief ATTN: J. WV. ApgarLivermore Division, FC, DNA 2 Cy ATTN: Tech. Lib., Edward Baicy
ATT~ FPRLCommander and DirectorDEPARTMENT OF THE ARMY U.S. Army Cold Region Res. Engr. Lab.I ATTN: G. SwinzowDep. Chief of Staff for Rsch. Dev. &I Acq.
ATTN: DAMA(CS), IMAJ A. Gleim CommanderATTN: Technical Library U1.S. Army Comb. Arms Combat Dev. Acty.ATTN: DAMA-CSM-N, LTC G. Ogden ATTN: LTC G. Steger
ATTN: LTC PullenChief of EngineerS
Z Cy ATTN: DAEN-MC-D C~neit2 Cy ATTN: DAEN-RDM U.S. Army Engineer CenterDep. Chief of Staff for Ops. & Plans
ATTN: Technical Library Division EngineerATTN: Dir. of Chem. & Nuc. Ops. U.S. Army Engineer Div., Huntsville
ChiefATTN: HNDED-SR
Engineer Strategic Studies GroupATTN: DAEN-FES
47

DEPARTMENT OF THE ARMY (Continued) DEPARTMENT OF TIlE NAVY (Continued)
Division Engineer Chief of Naval ResearchU.S. Army Engineer Div., Missouri Rvr. ATTN: Technical Library
ATTN: iech. LibraryOfficer- In-Charge
Commandant Civil Engineering LaboratoryU.S. Army Engineer School ATTN: R. J. Odello
ATTN: ATSE-TEA-AD ATTN: Technical LibraryATTN: ATSE-CTD-CS
Commandant of the Marine CorpsDirector ATTN: POMU.S. Army Engr. Waterways Exper. Sta.
ATTN: ). K. Butler Commanding GeneralATTN: Behzad Rohani Development Center
ATTN: Guy Jackson ATTN: CAPT HartneadyATTN: William Flathau ATTN: LTC GapenskiATTN: John N. StrangeATTN: P. Hadala CommanderATTN: Leo Ingram Naval Air Systems CommandATTN: Tech. Library ATTN: F. Marquardt
Commander Commanding OfficerU.S. Army Mat. & Mechanics Rsch. Ctr. Naval Explobive Ord. Disposal Fac.
ATTN: Tech. Library ATTN: Code 504, Jim Petrousky
Commander CommanderU.S. Army Materiel Dev. & Readiness Cmd. Naval Facilities Engineering Command
ATTN: Tech. Library ATTN: Technical Library
Director Superintendent (Code 1424)U.S. Army Materiel Sys. Analysis Acty. Naval Postgraduate School
ATTN: Joseph Sperazza ATTN, Code 2124, Tech. Rpts.Librarian
CommanderU.S. Army Missile Command Director
ATTN: W. Jann Naval Research LaboratoryATTN: F. Fleming AMTN: Code 2600, Tech. Lib.ATTN: J. Hogan
CommanderCommander Naval Sea Systems CommandU.S. Army Mobility Equip. R D D Ctr. ATTN: ORD-033
ATTN: STSFB-XS ATTN: SEA-9931GATTN: STSFB-MWATTN: Tech. Library Commander
Naval Surface Weapons CenterCommander ATTN: M. KleinermanU.S. Army Nuclear Agency ATTN: Code WASO, Navy Nuc. Prgms.
ATTN: Tech. Library Off.ATTN: Doc. Con. ATTN: WX21, Tech. Lib.
Commander CommanderU.S. Army Training and Doctrine Cond. Naval Surface Weapons Center
ATTN: LTC Auveduti, COL Eager Dahlgren LaboratoryATTN: LTC J. Foss ATTN: Technical Library
Commandant CommanderU.S. Army War College Naval Weapons Center
ATTN: Library ATTN: Carl AustinATTN: Code 533, Tech. Lib.
U.S. Army Mat. Comd. Proj. Mngr. for Nuc.Munitions Commanding Officer
ATTN: DRCPM-NUC Naval Weapons Evaluation Facility3 ATTN: Tech. Lib.DEPARTMENT OF THE NAVY
DirectorChief of Naval Operations Strategic Si:tems Project Office
ATTN: OP 982, LTC Dubac ATTN; NSP-43, Tech. Lib.ATTN: OP 982, LCDR SmithATTN: Code 604C3, Robert PiacesiATTN: OP 982, CAPT Toole
48
DEPARTMENT OF THE NAVY (Continued) ENERGY RESEARCHI & DEVELOPMENT ADMINISTRATION(Continued)
DirectorOffice of Naval Research Sandia LaboratoriesBranch Office Livermore Laboratory
ATTN, E. if. Weinburg ATTN: Doc. Con. for Tech. Lii'
DEPARTMENT OF Till; AIR FORCE Sandia LaboratoriesATTN: Doc. Con. for 3141 Sandia Rpt.
A* Armament Laboratory, AFSC Coll.ATTN: Masey Valentine ATTN: Hoc. Con. for Walter Herrmann
3 Cv ATTN: John Collins, AFATL/DLYV ATTN: Doc. Con. for W. AltsmeirerATTN: Hoc. Con. for John Colp
AF Institute of Technology, Au ATTN: Doc. Con. for John KeizurATTN: Library ArIT, Bldg. 640, Area B ATTN: Doc. Con. for William Caudle
ATTN: Doc. Con. for William PattersonAF Weapons Laboratory, AFSC
ATTN: SUL U.S. Energy Rsch. Dev. Admin.Albuquerque Operations Office
Headquarters ATTN: Doc. Con, for Tech. Lib.Air Force Systems Command
ATTN: Technical Library U.S. Energy Rsch. & Dev. Admin.Division of Headquarters Services
2 Commander ATTN: Doc. Con. for Class.Tech. Lib.Armament Development Test Center
ATTN: Tech. Library U.S. Energy Rsch. & Dev. Admin.Nevada Operations Office
Assistant Secretary of the Air Force ATTN: Hoc. Con. for Tech. Lib.Research and Development
ATTN: Col R. E. Steere OTHER GOVERNMENT SERVICES
Deputy Chief of Staff NASAResearch and Development Ames Research Center
ATTN: Col J. L. Gilbert ATTN: Robert W. Jackson
Commander Office of Nuclear Reactor RegulationForeign Technology Division, AFSC Nuclear Regulatory Commission
ATTN: NICD Library ATTN: Robert HeinemanATTN: Lawrence Shao
H~q. (SAF/IN1- ATTN: INATA DEPARTMENT OF DEFENSE CONTRACTORS
Hq. USAF/RD Aerospace CorporationATTN: RDPM ATTN: Tech. Info. Services
Oklahoma State University Agbabian AssociateqFld. Off. for Wpns. Effectivensss ATTN: M. Agbablan
ATTN: Edward Jackett31 Applied Theory, Inc.Commander 2 Cy ATTN: John G. TrulioRome Air Development Center, AFSC
ATTN: EMTLD, Doc. Library Avco Research & Systems GroupI ATTN: David HendersonSAMSO/RS ATTN: Res. Lib. A830, Rm. 7201
ATTN: RSS ATTN: Pat Grady
ENERGY RESEARCH AND DEVELOPMENT ADMINISTRATION Battelle Memorial InstituteATTN: Technical Library
Division of Military ApplicationATTN: Doc. Control for Test Office The BDM CorporationATTN: Technical Library
University of California
Lawrence Livermore Laboratory The Boeing CompanyATTN: Jerry Goudreau ATTN: Aerospace LibraryATTN: Tech. Info. Dept. L-3ATTN: Mark Wilkins, L-504 California Research & Technology, Inc.
ATTN: Ken KreyenhagenLos Alamos Scientific Laboratory ATTN: Technical Library
ATTN: Doc. Con. for Tom DowlerATTN: Doc. Con. for Reports Lib. Civil/Nuclear Systems Corp.
ATTN: Robe t Crawford
49 i

t
DEPARTMENT OF DEFENSE CONTRACTORS (Continued) DEPARTMENT OF DEFENSE CONTRACTORS (Continued)
EG&G, Inc. R & D AssociatesAlbuquerque Division ATTN: Paul Rausch
ATTN: Technical Library ATTN: Henry CooperATTN: J. G. Lewis
Engineering Societies Library ATTN: Harold L. BrodeATTN: Ann Mott ATTN: Arlen Fields
ATTN: William B. Wright, Jr.General Dynamics Corp. ATTN: Technical LibraryPomona Division ATTN: Cyrus P. Knowles
ATTN: Keith Anderson
The Rand CorporatiorGeneral Electric Company ATTN: Tet-nnical LibraryTEMPO-Center for Advanced Studies
ATTN: DASIAC Science Applications, Inc.ATTN: Technical Library
Georgia Institute of Technology
ATTN: S. V. Hanagud Stanford Research InstituteATTN: L. W. Rehfield ATTN: George R. Abrahamson
Honeywell, Incorporated Systems, Science and Software, Inc.Defense Systems Division ATTN: Technical Library
ATTN: T. N. Helvig ATTN: Robert SedgewickATTN: E. S. Gaffney
Institute for Defense AnalysesATTN: IDA Librarian, Ruth S. Smith Terra Tek, Inc.
ATTN: Technical LibraryKaman AviDyneDivision of Kaman Sciences Corp. TRN Systems Group
ATTN: Technical Library ATTN: Tech. Info. Center/S-1930a Si r ATTN: Peter K. Dai, RI/2170
Kaman Sciences Corp.
ATTN: Library TRW Systems GroupATTN: E. Y. Wong, 527/712
Lockheed Missiles & Space Co., Inc.ATTN: Technical Library weidlinger Assoc. Consulting EngineersATTN: M. Culp ATTN: Melvin L. Baron
ATTN: J. M. McCormickLockheed Missiles & Space Co., Inc.
ATTN: Tech. Info. Ctr. D/Coll. Weidlinger Assoc. Consulting EngineersATTN: J. Isenberg
Martin Marietta AerospaceOrlando Division General Electric Co.
ATTN: Al Cowen ATTN: L. P. SudTeaATTN, M. AnthonyATTN: H. McQuaig Communications Satellite Corp.
i CATTN: Jim Petrouskyj i Merritt Cases, Inc.ATTN: Technical LibraryATTN: J. L. Merritt
University of New MexicoDept. of Campus Security and Police
ATTN: G. E. Triandafalidis
New ark, Nathan M.Consulting Engineering ServicesUniversity of Illinois
ATTN: Nathan H. Newmark
Pacifica TechnologyATTN: R. BjorkATTN: G. Kent
Physics International Co.ATTN: Dec. Con. for Dennis Orphal
- ATTN: Doc. Con. for Tech. Lib.ATTN: Doc. Con. for Larry A. BehrmannATTN: Doc. Con. for Charles Godfrey
5o