sme competitiveness in · pdf filesme competitiveness in ghana iv oce-16-27.e the itc...
TRANSCRIPT

SME COMPETITIVENESS IN GHANA
ALLIANCES FOR ACTION
In collaboration with


SME COMPETITIVENESS IN GHANA
ALLIANCES FOR ACTION
2016

SME COMPETITIVENESS IN GHANA
ii OCE-16-27.E
Abstract for trade information services
ID= 43214 2016 C-16 288 SME
International Trade Centre (ITC)SME Competitiveness in Ghana: Alliances for ActionGeneva: ITC, 2016. xii, 47 pages Doc. No. OCE-16-27.E
Country report, the first of a series of publications assessing SMEs Competitiveness; based on a business survey conducted in Ghana in 2016, it analyses survey findings and compares them to other sources on SME Competitiveness and strengths and weaknesses related to the immediate and national business environment in Ghana; covers manufacturing and agriculture sectors in Tema, Kumasi, and the Greater Accra Region; provides policy interventions based on the survey findings; presents results of an in depth analysis of the internal production system for a small sample of enterprises in the agro-processing sector; presents an action plan achieved through ITC Alliances for Action methodology and coordination among local partners as a result of this analysis; and includes bibliographic references (pp.45-47).
Descriptors: Ghana, SMEs, Competitiveness, Global Value Chains, Trade Policy.
For further information on this technical paper, contact Valentina Rollo ([email protected]) and Alliances for Action ([email protected]).
English
Suggested Citation: International Trade Centre (2016). SME Competitiveness in Ghana: Alliances for Action. ITC, Geneva.
The International Trade Centre (ITC) is the joint agency of the World Trade Organization and the United Nations.
ITC, Palais des Nations, 1211 Geneva 10, Switzerland (www.intracen.org)
Digital image on the cover: © Shutterstock
© International Trade Centre 2016
ITC encourages the reprinting and translation of its publications to achieve wider dissemination. Short extracts of this technical paper may be freely reproduced, with due acknowledgement of the source. Permission should be requested for more extensive reproduction or translation. A copy of the reprinted or translated material should be sent to ITC.

SME COMPETITIVENESS IN GHANA
OCE-16-27.E iii
Foreword
This joint report of the International Trade Centre (ITC) and the Association of Ghana Industries (AGI) comes at a critical time. Many countries are facing challenges brought about by a weakened global economy: stagnant demand, persistent unemployment, increasing requirements for exports and financial vulnerability have all played their part in creating a deep sense of unease on where future sources of growth will come from.
This uncertain global outlook affects many actors throughout different value chains, but some groups are more affected than others; small and medium-sized enterprises (SMEs) are particularly susceptible to these increased pressures. This report intends to provide public and private stakeholders in Ghana and abroad with data and analysis necessary to steer Ghanaian SMEs successfully through challenging times.
SMEs are critical economic drivers in most countries. This is no different in Ghana, where more than 85% of enterprises are SMEs. Yet, recent studies suggest that the vast majority of SMEs fail to be competitive, to survive or to grow. Local, national and international institutions can help; they facilitate access to international markets and value chains through technical capacity building and knowledge sharing, ensuring that the resulting growth is both sustainable and inclusive. This joint report provides practical guidance on how to do this.
The Ghanaian government and relevant support institutions have started to implement strategies to enable sustainable and inclusive growth through different measures, including: the national export strategy, which focuses on non-traditional export diversification; the yam sector strategy, which created a roadmap for risk diversification strategies; the Made-in-Ghana campaign, that spurred local content development by making part of procurement conditions to supply locally; and the Ghana Shared Growth and Development Agenda (GSGDA II), which has a strategy to leverage the country’s natural resources by providing incentives for linking industry to the agriculture sector, hence promoting value addition. However, there is more to be done, and this joint report provides practical guidance on how to pursue this.
ITC is the only United Nations development agency fully dedicated to supporting the internationalization of SMEs. To deliver on the mandate of helping SMEs to join international markets, ITC developed the SME Competitiveness Survey, and has launched data collection exercises in several countries. These efforts aim to assess the key elements that affect the competitiveness of SMEs – their capacity to connect, compete and change.
The Association of Ghana Industries is one of the leading voices of the Ghanaian private sector, representing over 1,200 businesses and raising awareness about private-sector constraints through advocacy, capacity building and knowledge-sharing initiatives.
Together, ITC and AGI have launched the first large-scale deployment of the SME Competitiveness Survey. The survey effort also benefited from broad-based support from multiple partners, including: the Federation of Associations of Ghanaian Exporters (FAGE); the Ministry of Food and Agriculture of the Republic of Ghana; the Ministry of Trade and Industry of the Republic of Ghana; the Ghana National Chamber of Commerce; the Ghana Root Crops and Tubers Exporters Union (GROCTEU) and the Ghana Export Promotion Authority (GEPA).
First findings of the Ghanaian SME Competitiveness Survey were featured prominently in ITC’s SME Competitiveness Outlook 2016. In addition, the detailed analysis of findings in this report will flow into further stakeholder discussions in Ghana with the aim of developing measures aimed at further strengthening SME competitiveness.

SME COMPETITIVENESS IN GHANA
iv OCE-16-27.E
The ITC Competitiveness Grid, used in this report, shows that enterprise performance depends not only on firm competitiveness but also on external factors linked to the immediate business environment and national environment. This confirms that no enterprise or institution can tackle all constraints on their own. Efforts to strengthen SME competitiveness in Ghana have to be part of an aligned and coordinated strategy at the industry level, with a strong role for relevant support institutions. Under the lead of AGI and ITC, an ‘Alliance for Action’ has been created that provides the multi-stakeholder platform necessary to transform data and analysis into action.
Under this Alliance for Action, groups composed of private and public sector institutions have started to work on generating activities and linkages to support SME innovation, competitiveness and inclusive growth. They are doing so by considering what role local, national and international institutions and policies can play to allow Ghanaian SMEs to maximize the benefits of trade and participation in international value chains.
We believe that this report can provide an evidence-based starting point to guide sector-specific associations and government agencies in the design and implementation of support policies targeting SMEs competitiveness.
In a dynamic and integrated world, the availability of up-to-date information on SME competitiveness and its drivers is crucial for sector associations and government agencies to foster SME integration in global markets and inclusive growth. For this reason, AGI and the ITC plan to conduct the SME Competitiveness Survey on a regular basis to help monitor changes.
Seth Twum-AkwaboahChief Executive OfficerAssociation of Ghana Industries
Marion JansenChief EconomistInternational Trade Centre

SME COMPETITIVENESS IN GHANA
OCE-16-27.E v
Acknowledgements
The International Trade Centre (ITC) and the Association of Ghana Industries (AGI) express their deepest gratitude to the enterprises that agreed to be interviewed on the issue of competitiveness.
This report was prepared by Francesco Beggiato, John Defor, Tommaso Ferretti, Marion Jansen, Hernan Manson, Valentina Rollo, Sabrina Herzog de Souza Lima, Seth Twum-Akwaboah, and Jasmeer Virdee.
Further thanks go to Andrew Silva for his statistical contributions.
We thank all stakeholders for their support. In particular, our thanks go to the Ministry of Food and Agriculture, Ministry of Trade and Industry, the Federation of Associations of Ghanaian Exporters, the Ghana Export Promotion Authority, the Ghana Root Crops and Tubers Exporters Union and the Ghana National Chamber of Commerce.
ITC would also like to thank Natalie Domeisen and Evelyn Seltier of ITC, who oversaw the editing,production and quality control; Cheryl Rosebush, who carried out copy editing and Kristina Golubic, Serge Adeagbo and Franco Iacovino of ITC, who provided graphic and printing support.

SME COMPETITIVENESS IN GHANA
vi OCE-16-27.E
Contents
Foreword iii Acknowledgements v Abbreviations viii Executive Summary ix Thought Leadership: AGI’s view on Ghanaian SMEs xi Chapter 1 Economic overview of Ghana 1 1. The Ghanaian economy 1 2. Private sector business environment 3 3. Policy priorities 4 Chapter 2 SME Competitiveness Survey in Ghana 7 1. SME competitiveness framework and survey 7 2. The origins of the project 8 3. Understanding the survey sample 10 4. The SME competitiveness grid in Ghana 14 5. Strength of competitive advantage 17 6. Access and reliability of electricity supply 18 7. Raising finance 19 8. Quality requirements 20 9. ICT and advertising requirements 22 10. SME strengthening strategies in Ghana 24 Chapter 3 Alliances for Action: Enterprise competitiveness assessment on
agri-processing enterprises 29 1. Alliances for Action 29 2. Alliances for Action: Implementation approach 29 3. Implementation in Ghana 30 4. Enterprise assessment 31 Chapter 4 Conclusion and way forward 41 Annex I SME competitiveness data 43 References 45

SME COMPETITIVENESS IN GHANA
OCE-16-27.E vii
Tables, Figures and Boxes
Table 1: Key Ghanaian national statistics 1Table 2: Ghana’s export value and revealed comparative advantage 2Table 3: Selected sample features by firm size 10Table 4: Gender and youth employment 11Table 5: The SME Competitiveness Grid for Ghana 15Table 6: Quality certificate holders 21Table 7: Major certifications and standards 22Table 8: AGI efforts to strengthen SMEs 25Table 9: MOFA efforts to strengthen SMEs 26Table 10: GEPA efforts to strengthen SMEs 27Table 11: FAGE efforts to strengthen SMEs 28Table 12: Enterprise assessment parameters 32Table 13: Firm capability indicator scores 43Table 14: Immediate business environment indicator scores 43Table 15: National environment indicator scores 44
Figure 1: Export growth decomposition (2010–2015) 3Figure 2: Map of Ghana 10Figure 3: Legal status of firms 12Figure 4: Women in top management 12Figure 5: Sales exports and firms that export 13Figure 6: Export dynamics 14Figure 7: Firm capabilities in Ghana 16Figure 8: Immediate business environment in Ghana 16Figure 9: National environment in Ghana 17Figure 10: Strength of competitive advantage 18Figure 11: Access to reliable electricity supply 19Figure 12: Prevalence of ICT use 23Figure 13: Advertising and promotion 24Figure 14: Overall performance by enterprise 33Figure 15: Gender diversity 37Figure 16: Sources of finance 38Figure 17: Linkages and connectivity 39
Box 1. AGI Business Barometer 4Box 2. The SME Competitiveness Survey process 9

SME COMPETITIVENESS IN GHANA
viii OCE-16-27.E
Abbreviations
Unless otherwise specified, all references to dollars ($) are to United States dollars, and all references to tons are to metric tons.
AfDB African Development BankAGI Association of Ghana IndustriesB2B Business to businessBoP Balance of PaymentsGDP Gross domestic productGEPA Ghana Export Promotion AuthorityGHS Ghanaian Cedi (currency)GROCTEU Ghana Root Crops and Tubers Exporters UnionGSA Ghana Standards AuthorityGSGDA II Ghana Shared Growth and Development AgendaGVC Global value chainsFAGE Federation of Associations of Ghanaian ExportersFDI Foreign direct investmentHACCP Hazard analysis and critical control pointsICT Information and communications technologyIMF International Monetary FundISO International Organization for StandardizationITC International Trade CentreITU International Telecommunication UnionMOFA Ministry of Food and AgricultureMOTI Ministry of Trade and IndustryOECD Organisation for Economic Co-operation and DevelopmentRCA Revealed comparative advantage indexSDGs Sustainable Development Goals of the United NationsSME Small and medium-sized enterpriseSMECS SME Competitiveness SurveyUNCTAD United Nations Conference on Trade and DevelopmentUNDP United Nations Development ProgrammeWTO World Trade Organization
SME COMPETITIVENESS IN GHANA
OCE-16-27.E ix
Executive Summary
Small and medium-sized enterprises (SMEs) are the backbone of the Ghanaian economy – they represent about 85% of businesses, largely within the private sector, and contribute about 70% of Ghana’s gross domestic product (GDP). In terms of formal sector employment, they account for just over half of all full-time employment, with the percentage likely much higher in the informal sector.
Ghana’s policy priorities are economic diversification, social inclusion, and macro-economic stability. With employment still heavily concentrated in agriculture and the informal sector, and exports concentrated in gold, cocoa, and oil, the government is looking to diversify its economy. One way of doing it would be to invest its oil and gas resources to support value-added, diversified agricultural exports, and ensure thatmanufacturing is a larger part of GDP and more competitive internationally.
SMEs in Ghana would be a critical beneficiary of these policies. They are an integral part of the Ghanaian economy, and they tend to employ vulnerable groups, including women, youth and low-skilled workers. AsSMEs often operate in labour intensive, low valued-added sectors, wages tend to be low. Actions to boostSME competitiveness through capacity building or national policies (such as the national export strategy or the yam sector strategy) can help increase productivity, raising wages and standards of living.
The SME Competitiveness Survey in Ghana
This report presents the results of the first national deployment of the SME Competitiveness Survey, carried out in 2016 on 200 agricultural and manufacturing firms, in order to understand the strengths and weaknesses of Ghanaian firms, as well as business environment factors holding back growth.
The survey was carried out by the International Trade Centre and the Association of Ghana Industries(AGI), with the support of six trade-related institutions: the Ministry of Trade and Industry (MOTI), the Ghana Export Promotion Authority (GEPA), the Federation of Associations of Ghanaian Exporters, the Ministry of Food and Agriculture (MOFA), the Ghana National Chamber of Commerce, and the Ghana Root Crops and Tubers Exporters Union.
These organizations form ITC’s Alliances for Action initiative in Ghana. Since 2014, Alliances for Action has been bringing together the key public, private, local and national stakeholders in networks to pursue common goals and implement development policies in a coordinated manner.
The survey provides the stakeholders with vital research and insights that can ultimately help SMEs in Ghana become more competitive.
Survey results
The survey drew out the need to address challenges that keep Ghanaian SMEs from being competitive in regional and global markets:
Lack of unique products. Firms reported to be mostly engaged in the production of ‘common and easily copied’ products, and considered themselves to be ‘one of many similar suppliers’. This combination implies that the strength of Ghanaian firms’ competitive advantage is low, which makes them particularly susceptible to market volatility.
Insufficient electricity access. Firms were asked to rate their access to services in their immediate business environment, including reliable electricity, transport, and water. Access to reliable electricity performed the worst. Medium-sized firms reported scores approximately twice as low as small firms, suggesting that access to electricity is a bottleneck for these firms to grow into large enterprises.
High interest rates. The survey assessed a firm’s ability to access finance. Nearly all of the surveyed firms who applied for a loan were granted one. This finding fits with Ghana’s relatively high ‘getting credit’score by the World Bank, which measures legal rights, credit information availability and other national

SME COMPETITIVENESS IN GHANA
x OCE-16-27.E
factors. The result could also reflect a recent trend among Ghanaian SMEs to apply to micro-finance institutions, because application and approval processes are easier than with traditional banks.
Overall access to finance was rated poorly, which seems to be at odds with the previous finding. Further investigation reveals that high interest rates were the primary reason for the low rating. Survey resultssuggest that many firms were deterred from applying for financing because they believed the interest rate would be unaffordable, leaving only the firms who could afford these high rates to apply for credit.
Internationally recognized certification. Approximately 90% of all firms reported adhering to an official domestic certificate or standard. This percentage drops to around half for those adhering to an internationally recognized certificate or standard. As expected, firms who export were much more likely to hold such certificates; interestingly, they were also more likely to hold voluntary certificates. This may reflect the fact that in many of today’s international value chains, compliance with voluntary standards is imposed by a lead firm.
ICT access. Ghana was one of the first African nations to have established widespread Internet infrastructure. Despite this, the country ranks 109th on the information and communications technology (ICT) development index of the International Telecommunication Union (ITU). The most striking ICT-related finding of the survey is the large gap in connectivity between SMEs. These results are consistent with the regional findings presented in ITC’s 2015 SME Competitiveness Outlook, which show that the largest gap between SMEs and large firms in sub-Saharan Africa was also in ICT connectivity.
Advertising. Only 30% of small firms engaged in any type of advertising in the last fiscal year, compared to 76% of medium-sized firms, potentially limiting the growth of their client base. Medium-sized firms are also more likely to attend both domestic and foreign trade fairs and to use Internet advertising. Interestingly, exporters are far more likely to use the Internet to promote their products than non-exporters, supporting the notion that business websites play a role in helping firms to export.
Mapping what institutions do to strengthen SMEs
The Alliances for Action network in Ghana discussed preliminary survey results in August 2016. The outcome of this meeting (see the last part of Chapter 2) was a mapping exercise of the activities that the partner institutions currently undertake to boost SME competitiveness. The exercise helped the institutions to understand what is being done and what still is needed to strengthen SME competitiveness in Ghana.
Enterprise assessments: Agri-food processing
Enterprise assessments among a sample of agri-food processing firms were carried out as a complement to the survey, which covered a wide range of enterprises in different sectors. This intermediary sector between commodities producers and markets is particularly crucial for value-added products made in Ghana.
The enterprise assessment (see Chapter 3) methodology is unique to Alliances for Action. It providesdetails on SME performance by evaluating the internal production systems.
The way forward
The results in this report have been validated by stakeholders and other interested parties in Ghana. The next steps involve partner institutions developing action plans, and implementing policies to help alleviate constraints identified in the survey.
SME COMPETITIVENESS IN GHANA
OCE-16-27.E xi
Seth Twum-AkwaboahChief Executive Officer Association of Ghana Industries
Thought Leadership: AGI’s view on Ghanaian SMEs
The Association of Ghana Industries (AGI) speaks for more than 1,200 businesses in Ghana. As the leading voice of the private sector, AGI has instigated reforms and led policy initiatives in the interest of our small and medium-sized enterprises (SMEs). Currently, SMEs constitute about 85% of all businesses in Ghana, yet they are saddled with a myriad of challenges that stifle their growth. This joint ITC-AGI report will help Ghana gain a better understanding of the hurdles that restrain the growth and competitiveness of SMEs in Ghana.
SMEs worldwide face market pressures and must be able to compete if they are to survive in the long term. Available statistics indicate that the vast majority of SMEs fail, underlining the need for local, national and international institutions to help increase the survival rate of start-ups by facilitating product capacity development and enabling local trade relations. SMEs penetrate global markets by exporting through clusters, joining global value chains (GVCs), and exporting directly or indirectly. In that sense, SMEs need to exploit opportunities offered by clusters and GVCs, which represent opportunities to penetrate markets and learn through diffusion of information and knowledge.
Enterprise performance depends on internal factors as much as external ones. Of particular interest are three elements: the type of horizontal and vertical linkages with other enterprises; the enabling environment and governance rules for support institutions; and national and regional policies (including investment, regulations, facilitation and socio-economic development) and the macro-economic context.
Sector and SME competitiveness starts with enterprises and the way in which their relations and partnerships are organized. In most developing and emerging economies, SMEs face market volatilities, uncertainty in the policy and regulatory environment, lack of information on options for diversifying markets and products, as well as fragmented social structures and institutional support networks. Firms remain competitive and create higher value by acquiring skills, capabilities and functions, among others. Initiatives in Ghana have significantly improved the way SMEs operate, and AGI expects some of these programmes to last long enough to create positive change.
The key drivers for sector and value chain development include:
GVC, clusters and SME competitiveness. The growth of trade between large groups and within GVCs has increased dramatically over recent decades, accounting for up to 80% of global trade. More and more international organizations are using GVCs as a tool for structuring development interventions.Innovation, which is a key driver of economic growth and a significant enabler for SMEs in least developed countries to better integrate into GVCs.

SME COMPETITIVENESS IN GHANA
xii OCE-16-27.E
Public-private partnerships and governance. As the multilateral organization mandated to work with SMEs, ITC is itself regarded as a cornerstone of the emerging international architecture of SME competitiveness.
ITC and AGI are working together to highlight the important role that successful SMEs and economic competitiveness can play in promoting sustainable development and growth. Economic development, social inclusion and environmental sustainability are three interconnected pillars, and no one pillar can be addressed by only one institution.
Work carried out through the SME Competitiveness Survey and the Alliances for Action approach aims to provide data so that multi-stakeholder groups can decide how best to target support and activities. Such activities involve the private and public sectors and include investment and research. They can bolster competitiveness based on the following questions:
What type of linkages best support SME innovation and competitiveness?If developing country SMEs are to maximize the benefits of trade and participation in GVCs through upgrading, what is the role of support institutions and policies?How does the interaction between multinational company subsidiaries and local support institutions and innovation systems help or hinder the upgrading of SMEs in emerging markets?Based on empirical examples, what do we know about the role of the market, government and local support institutions in ensuring conducive processes, governance and support structures for SME competitiveness and in maximizing the benefits of participation in value chains?What is the scope of action and opportunities for international organizations involved in trade-related technical assistance?Given their mandates, how can ITC and AGI better support SMEs in Ghana to take advantage of the benefits of linking to value chains, institutions and clusters?
AGI is of the view that when implementing sector development interventions, it will be necessary to consider:
Learning as a collective process;Practical ways in which policy and interventions draw on available knowledge and are linked to decision-making;Facilitation of networks that support and enable innovation and SME upgrading;Trade facilitation and policies. Facilitation implies more than reducing domestic trade costs. This requires mechanisms to set the policies and regulations implemented by various governmental and technical agencies.Importance of networks and linkages between companies and with institutions.
AGI welcomes ITC’s increasing engagement and facilitation in multi-stakeholder partnerships and processes at the global, regional, and national levels through the Alliances for Action initiative as well as sector development strategies that enable SMEs to reach their full potential.

SME COMPETITIVENESS IN GHANA
OCE-16-27.E 1
Chapter 1 Economic overview of Ghana
1. The Ghanaian economy
In order to understand the challenges and opportunities facing SMEs in Ghana, it is important to understand the national economic environment in which they operate. In 2014, Ghana was West Africa’s second largest economy after Nigeria, and the tenth largest in all of Africa.1 This is due to strong democratic institutions, rich natural resources, a highly-rated business climate and good governance, which together have attracted foreign investors and allowed strong, inclusive economic growth.2 In 2015, gross domestic product (GDP) was close to $40 billion – a 3.9% increase from the previous year. With a population of 27.4 million inhabitants in 2015 (see Table 1), Ghana has managed to reduce poverty and improve social indicators better than its regional peers, and now has the status of a lower-middle income country. Medium-term growth prospects for Ghana are supported by its newly-created energy sector, and rising production which is hoped will assure and stabilize the provision of energy to the country’s economic activities.3
Table 1: Key Ghanaian national statistics
Country Profile 1990 2000 2015Total population (in millions) 14.6 18.8 27.41GDP (current $, in billions) 5.89 4.98 37.86GDP growth (annual %) 3.3 3.7 3.9Inflation, GDP deflator (annual %) 31.2 27.2 18.8Agriculture, value added (% of GDP) 45 39 21Industry, value added (% of GDP) 17 28 26Services, value added (% of GDP) 38 32 53Exports of goods and services (% of GDP) 17 49 44Imports of goods and services (% of GDP) 26 67 55Foreign direct investment, net inflows (BoP, current $ in millions) 15 166 3,192Source: World Development Indicators database (accessed October 2016).
Ghana’s current account deficit has historically been high due to excessive gross domestic investment over national savings. In 2015, the country’s account deficit decreased as a share of GDP, despite low levels of gold and cocoa production.4 The current account deficit has been largely financed by substantial foreign direct investment (FDI) inflows (8% of GDP per annum since 2010).5 This is consistent with Ghana being ranked as the seventh largest recipient of FDI in Africa, and the third largest in sub-Saharan Africa in 2010,6 with most of the FDI flowing to the developing oil and gas industries. It has proven more challenging to attract private investors into agriculture, agri-food industries and other manufacturing sectors.
Ghana’s economy is driven by the services sector, which in 2015 contributed to 53% of GDP, compared to 32% in 2000. Services are followed by the industry and agriculture sectors, which contributed 26% and 21% respectively to GDP in 2015, marking a decline from 28% and 39% in 2000. Growth in 2015 has been
1 Oxford Business Group (2014). The Report: Ghana. Available at:. https://books.google.ch/books?id=TwjUCwAAQBAJ.2 WTO (2014) Trade Policy Review - Ghana3 IMF (2014) Article IV.4 IMF (2016) Article IV, Third Review.5 WTO (2014) Trade Policy Review – Ghana.6 UNCTAD's World Investment Report (2011).
SME COMPETITIVENESS IN GHANA
2 OCE-16-27.E
supported by strong non-oil activity. The robust growth of the services sector has been the result of good performance in the trade, and information and communications sectors. Adverse weather conditions have caused a slowdown in agricultural growth, especially cocoa production.7 Nevertheless, Ghana remains an important exporter of agricultural products – it is the world's second largest cocoa producer, after Côte d'Ivoire. Ghana is also Africa's second largest producer of gold, petroleum, and other minerals.8
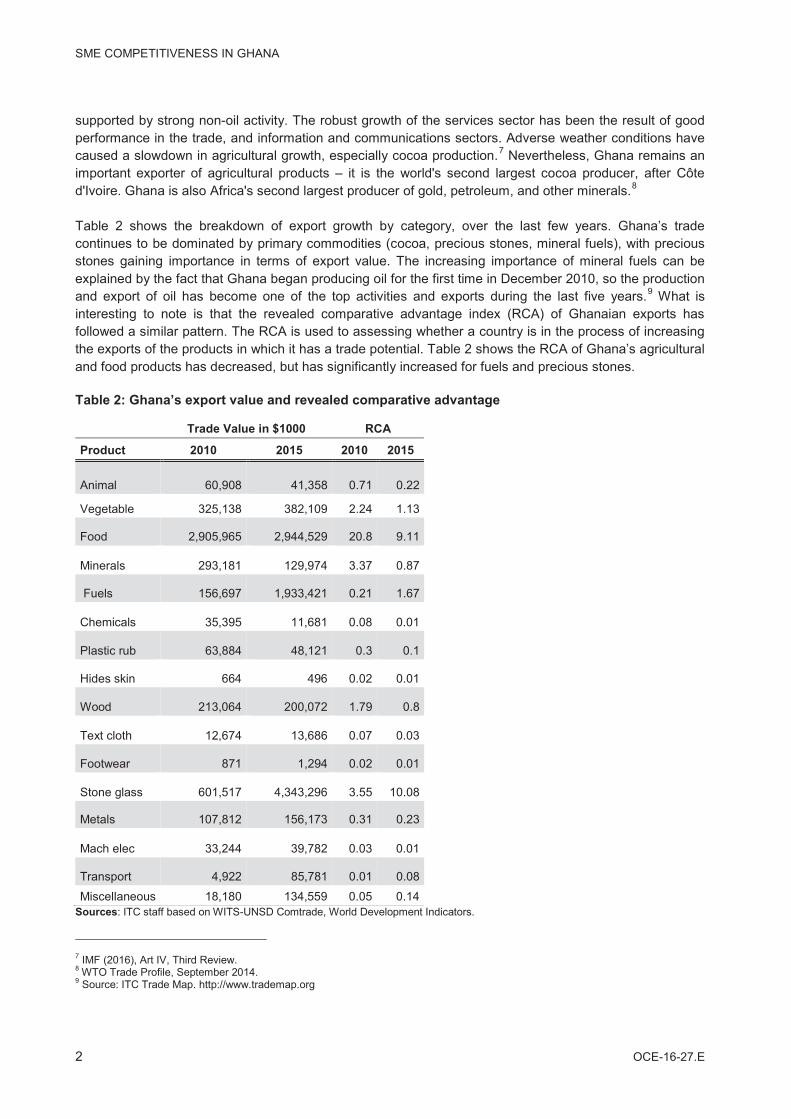
Table 2 shows the breakdown of export growth by category, over the last few years. Ghana’s trade continues to be dominated by primary commodities (cocoa, precious stones, mineral fuels), with precious stones gaining importance in terms of export value. The increasing importance of mineral fuels can beexplained by the fact that Ghana began producing oil for the first time in December 2010, so the production and export of oil has become one of the top activities and exports during the last five years.9 What is interesting to note is that the revealed comparative advantage index (RCA) of Ghanaian exports has followed a similar pattern. The RCA is used to assessing whether a country is in the process of increasing the exports of the products in which it has a trade potential. Table 2 shows the RCA of Ghana’s agriculturaland food products has decreased, but has significantly increased for fuels and precious stones.
Table 2: Ghana’s export value and revealed comparative advantage
Trade Value in $1000 RCA
Product 2010 2015 2010 2015
Animal 60,908 41,358 0.71 0.22
Vegetable 325,138 382,109 2.24 1.13
Food 2,905,965 2,944,529 20.8 9.11
Minerals 293,181 129,974 3.37 0.87
Fuels 156,697 1,933,421 0.21 1.67
Chemicals 35,395 11,681 0.08 0.01
Plastic rub 63,884 48,121 0.3 0.1
Hides skin 664 496 0.02 0.01
Wood 213,064 200,072 1.79 0.8
Text cloth 12,674 13,686 0.07 0.03
Footwear 871 1,294 0.02 0.01
Stone glass 601,517 4,343,296 3.55 10.08
Metals 107,812 156,173 0.31 0.23
Mach elec 33,244 39,782 0.03 0.01
Transport 4,922 85,781 0.01 0.08
Miscellaneous 18,180 134,559 0.05 0.14Sources: ITC staff based on WITS-UNSD Comtrade, World Development Indicators.
7 IMF (2016), Art IV, Third Review.8 WTO Trade Profile, September 2014. 9 Source: ITC Trade Map. http://www.trademap.org

SME COMPETITIVENESS IN GHANA
OCE-16-27.E 3
Figure 1 plots the decomposition of Ghana’s export growth from 2010 to 2015. It shows that the increase in agricultural product exports originates from a small net increase in the export of existing products to oldmarkets, as well as from a small increase in the export of existing products to markets previously served by other old products. The overall increase in exports of industrial goods is very small, and can be attributed mainly to increases in the intensive margins as well as to the introduction of new products in old markets.The biggest increase in the extensive margins of trade is in petroleum. This is because petroleum was not exported before 2010. Consequently, most of the increase in exports of petroleum products is due to anincrease of new products to old markets.
Figure 1: Export growth decomposition (2010–2015): the margins of trade
Note: The decomposition of export growth sum to 100 by sector.Sources: ITC staff based on WITS-UNSD Comtrade, World Development Indicators.
2. Private sector business environment The private sector in Ghana is dominated by enterprises in the informal sector, with approximately 90% of the companies employing less than 20 people. The private sector is the main employer, and the primary generator of exports.10
Good governance has led to a good business environment, which continues to improve and recently received high ratings. For example, Ghana over-performed in the World Bank’s governance and business indicators compared to the country’s peers and regional benchmarks.11 This is despite the decline ofGhana’s Doing Business score in 2016, reflected in the ranking dropping from 112 to 114.12 More specifically, Ghana ranked above the sub-Saharan average in terms of ‘time to export’, ‘cost to export’, “cost to import” and ‘border compliance’. This is probably influenced by the implementation of the National Single Window Project, in September 2015, which reduced the time and cost of customs clearance by
10 Source: African Development Bank, Ghana Country Strategy Paper 2012-2016.11 IMF (2014) Article IV.12 World Bank (2016). Doing Business Report.
-80
-60
-40
-20
0
20
40
60
80
100
120
Net change of oldproducts in old
markets
Disappearance ofold products in
old markets
Increase of newproducts in new
markets
Increase of newproducts in old
markets
Increase of oldproducts in new
markets
Old products tomarkets
previously servedby other old
products
Intensive margins Extensive margins
Dec
ompo
sitio
n of
exp
ort g
row
th (%
)
Agriculture Industrial Petroleum

SME COMPETITIVENESS IN GHANA
4 OCE-16-27.E
putting all the customs operations under the Ghana Revenue Authority. However, Ghana still ranks below the regional average in ‘trading across borders’.
Despite Ghana’s good rankings in the Doing Business report, companies still face a number of important constraints to growth, most importantly in terms of access to credit and reliable power supply. Both constraints are regularly mentioned by businesses, especially small and medium-sized, labour-intensiveenterprises.13 The cost of borrowing remains prohibitive, even though the country has tried to improve access of SMEs to private credit by passing laws to improve the legal rights of borrowers and lenders, andto make transactions more secure.14
The cost of doing business increased significantly due to power rationing, higher prices for utilities and the continued depreciation of the domestic currency (40% in 2014, and 20% in 2015). This situation is explained by the slowdown of the annual growth of the Economic Activity Index that the Central Bank of Ghana assessed at 16% in 2015, compared to 19.5% in 2014. The AGI Business Barometer indicator (seeBox 1) has highlighted that the main issues affecting enterprises in 2015 were exchange rate volatility, inadequate power supply, a multiplicity of taxes, and access and cost of credit. Despite this, the AGI barometer registered 20% growth in economic activity.15
3. Policy priorities
The government’s agenda has highlighted three main policy priorities: economic diversification, social inclusion, and macro-economic stability. Shifting public expenditure from current to capital spending would
13 IMF (2014) Article IV.14 WTO (2014) Trade Policy Review – Ghana.15 AfDB (2016) Ghana, African Economic Outlook 2016 (AfDB, OECD, UNDP).
Box 1. AGI Business BarometerSME Competitiveness in Ghana: Alliances for Action is aligned with AGI’s national flagship report on SMEs entitled, AGI Business Barometer. This quarterly survey measures the level of confidence of the Ghanaian business environment and predicts short-term business trends in areas of major economic activity.
The AGI Business Barometer has been in place since 2006 and it started as an annual business climate survey. In 2009, AGI saw the need to have a quarterly version, given the fact that throughout the year, the challenges faced by these businesses are affected in different ways by local and global politics, trading systems and the economic environment.
This 10-year project is currently available to more than 1,000 businesses in Ghana, in addition to government institutions such as the Central Bank of Ghana, ministries, departments and agencies, among others. The survey covers all 10 regions of Ghana, and highlights the critical issues that are affecting businesses throughout the year.
Inputs are based on the perceptions of businesses themselves, and the results are indicative of the challenges within the economy, which need to be addressed for an enabling business environment and competitiveness. AGI’s barometer separates the most pressing issues facing Ghanaian businesses by sector, region, employment, size of business and export situation.
In this manner, businesses and policymakers can better understand current constraints faced by Ghanaian businesses in the short term, and debate the issues affecting the economy in the longer term. The results also inform AGI on what are the most pressing constraints faced by their constituents and allows AGI to prioritize their advocacy focus areas.
Source: AGI Business Barometer Report. Available from: http://agighana.org/agi-business-barometer-report.html.

SME COMPETITIVENESS IN GHANA
OCE-16-27.E 5
allow Ghana’s newly created oil and gas resources to be channelled into productive investment, as mandated in the Petroleum Revenue Management Act. This would favour economic diversification.
In fact, employment is still heavily concentrated in agriculture and the informal sector, and the Ghanaian exports remain concentrated in three commodities (gold, cocoa, and oil). This high dependence on a few volatile sectors makes the economy subject to potentially heavy terms-of-trade shocks. Investing capital from oil and gas resources in both the manufacturing sector and higher-value agricultural sector is a priority for the country. However, this strategy will work only if the country also invests significant resources in improving infrastructure, most importantly improving electricity supply and make financing affordable by reducing the government’s borrowing needs.16
An example of policies aimed at adding value to agriculture is found in the National Export Strategy through its focus on non-traditional exports. The public-private platform created in the Yam Sector Strategyembodies such a strategy. Yam is a product largely produced and culturally important in the national context. More generally, the agro-business sector, which recently suffered a contraction due to the forestry and logging sub-sector crisis, is being looked at as a strategic tool for the growth of the national economy, thanks to products such as yam, cassava, plantains, pineapple, mango and sheanut, among others.
In terms of manufactured products, at the centre of Ghana’s industrial policy is the promotion of an accelerated and sustainable industrial development within a liberalized and global economic environment. The main long-term objectives are: increasing industry share of GDP to 37% by 2020, making Ghanaian manufactured goods competitive in the domestic and international markets, and maximizing the use of local raw materials in the industry.17
16 Ibid.17 Industrial Sector Policies, Long term objectives, MOTI, 2014.


SME COMPETITIVENESS IN GHANA
OCE-16-27.E 7
Chapter 2 SME Competitiveness Survey in Ghana
1. SME competitiveness framework and survey
As part of its on-going analysis of SME competitiveness, ITC has launched the collection of data on the enterprise competitiveness in several countries. In 2015, ITC piloted its SME Competitiveness Survey on asmall scale in Bangladesh, Kenya, Myanmar and Uganda before scaling up the survey in Ghana in 2016.This survey assesses the key elements that affect the competitiveness of SMEs – their capacity to connect, compete and change.
ITC classifies the determinants of firm competitiveness according to how they affect competitiveness (three pillars), and according to where in the economy they intervene (three levels). The three pillars and levels of competitiveness combine to form the SME Competitiveness Grid. While it was designed to focus on SME competitiveness, it is independent of scale and can also serve to assess the competitiveness of larger firms.
The main motivation for developing the SME Competitiveness Grid is to bridge a gap in existing composite indicators that focus on macro-economic determinants of competitiveness rather than local or micro-economic determinants. The importance of macro-economic determinants is, however, fully recognized and reflected in the competitiveness grid. ITC’s SME Competitiveness Outlook 2015 provides a more detailed description of the SME Competitiveness Grid and the methodology behind it.18
The SME Competitiveness Grid
The three pillars of competitiveness are: compete, connect and change. These pillars reflect traditional static and dynamic notions of competitiveness. They also emphasize the importance of connectivity for competitiveness in modern economies.
Capacity to compete: The first pillar centres on present operations of firms and their efficiency in terms of cost, time, quality and quantity. This concept also extends to the immediate business and national environment. Capacity to compete refers to the static dimension of competitiveness. Examples of determinants include: use of internationally recognized quality certificates (firm capability); access to technical infrastructure (immediate business environment); and low tariffs (macro-environment).
Capacity to connect: The second pillar centres on gathering and exploiting information and knowledge. At the firm level, this refers to efforts to gather information flowing into the firm (e.g. consumer profiles, preferences and demand), and efforts to facilitate information flows from the firm (e.g. marketing and advertising). At the immediate business environment level, this includes links to sector associations, chambers of commerce and other Trade and Investment Support Institutions (TISIs). At the national level, capacity to connect is predominantly about the availability of ICT infrastructure. While capacity to connect is not strictly a time-sensitive phenomenon, information gathering and exploitation are so central to current and future competitiveness that they act as an essential link between the two pillars of static competitiveness and dynamic competitiveness.
18 International Trade Centre (2015). SME Competitiveness Outlook: Connect, compete and change for inclusive growth.

SME COMPETITIVENESS IN GHANA
8 OCE-16-27.E
Capacity to change: The third pillar centres on the capacity of a firm to execute change in response to, or in anticipation of, dynamic market forces, and to innovate through investments in human, intellectual and financial capital. It incorporates the dynamic dimension of competitiveness.External factors change very rapidly; the only certainty is uncertainty. In this context, adaptation and resilience define competitiveness. Industry phases, breakthrough or disruptive innovations, increased competition and exchange-rate fluctuations are all events that require strategy adaptations. Thus, capacity to change incorporates the performance of firms on accessing finance, and investing in human capital, innovation and intellectual property protection. At the business or macro-economic level, the environment’s ability to deliver these resources to firms is measured.
The three levels of the economy are: firm capabilities, the immediate business environment and the national environment. These levels are in line with those identified in related work on competitiveness, but put an explicit focus on internal firm capabilities and the external local or sectoral environment of firms (i.e. the immediate business environment).
Firm capabilities: This level assesses whether firms have the capabilities to manage resources under their control. Thus, this competitiveness level contains indicators to gauge whether or not firms follow best practices. For example, does the firm have a bank account, use e-mails in day-to-day operations, or have high capacity utilisation?
The immediate business environment: This level delivers the resources and competencies that help to shape whether or not firms are competitive. This level covers factors that are external to the firm but still within its micro-environment. Access to power, access to a skilled workforce or the vicinity of a relevant cluster of economic activities are examples of immediate business environment indicators.
The national environment: The third level is the national environment. National factors are important, as they establish the fundamentals for the functioning of markets. Government action in particular determines whether or not firm activities are facilitated. This level encompasses all structural factors that exist at the national level, such as policies on entrepreneurship and ease of doing business, trade-related policies, governance, infrastructure and resource endowments.
2. The origins of the project
In 2015, Ghana was identified as a pilot country for ITC’s SME Competitiveness Survey. During the first phase of the pilot, and in the context of Alliances for Action work, ITC explored interest from the private sector for such a survey, as well as cooperation opportunities with national bodies, including TISIs, ministries, government agencies, research institutions and industrial organizations. ITC organized multi-stakeholder meetings, presented the proposed methodology and gathered feedback on how to use this type of survey, and align it with national policies and private sector priorities.

SME COMPETITIVENESS IN GHANA
OCE-16-27.E 9
As a result of this initial actions, stakeholders nominated the AGI as the lead Ghanaian institution for the initiative. Other institutions took supporting roles, with the agreement that they would use the findings for their strategic planning and sector support policies. These institutions included GEPA, MOTI, MOFA, FAGE, the GROCTEU, and the Ghana National Chamber of Commerce.
Consequently, ITC and AGI embarked on a joint effort to deploy the pilot version of the SME Competitiveness Survey in Ghana under the overall sponsorship of MOTI and private sector associations. Several meetings were held to validate and adapt the questionnaire and the selected sub-sectors, and a first field test with 40 enterprises allowed ITC and AGI to finalize the questionnaire.
The pilot survey was conducted on a sample (selected through stratified random sampling) totalling 200 agriculture and manufacturing companies, including member firms from partner institutions, based predominantly in the Greater Accra region, Tema, Brong Ahafo and Kumasi (see Figure 2). The Ghana Export Promotion Authority, the Federation of Associations of Ghanaian Exporters and the Ghana National Chamber of Commerce assisted in the selection of sectors and firms. AGI administered the survey and ITC analysed the results.
Results of the analysis were presented to, and discussed with, national support institutions in August 2016, and received formal validation in October 2016 during a high-level event hosted by AGI with a panel of experts from MOTI as well as FAGE. The discussion aimed at translating the findings of the report into aplan for action, in order to address the constraints identified by the survey and eventually enable SME development in Ghana.
Box 2. The SME Competitiveness Survey process
In 2015, activities to initiate the SME Competitiveness Survey included:
Participatory screening of partners and institutionsExpression of interest by partnersSelection of partners and signature of memorandum of understandingParticipatory validation of approach and adaptation of surveySample selection
In 2016, activities to implement and finalize the SME Competitiveness Survey included:
Administration of surveyAnalysis of data from surveyValidation of results with partners and definition of policy implications in August 2016Implementation support: through Enterprise competitiveness assessments for SMELaunch of advanced draft of the report in October 2016Implementation support: Assessments of Trade Support Institutions

SME COMPETITIVENESS IN GHANA
10 OCE-16-27.E
Figure 2: Map of Ghana
Source: Available from http://ghanamap.facts.co/ghanamapof/ghanamap.php.
3. Understanding the survey sampleThe SME Competitiveness Survey gathered data from the following 200 randomly selected firms: 124 firms with less than 19 employees; 72 firms with 20-99 employees; and four firms with more than 100 employees (see Table 3).
Approximately one third of those surveyed were exporters. However, only 29% of small firms were exporters compared with 44% of medium-sized firms, confirming that larger firms tend to be the ones engaged in international markets. More than 73% of surveyed firms were in manufacturing, with this sector accounting for a greater share as firm size increased: 64% of small firms compared with 89% for medium-sized firms in manufacturing. With regard to age, the most common firm age category was 10-14 years, but most firms (more than 80%) were less than 19 years of age in all the size and sector categories. In agriculture, 64% of firms had been in operation for at least ten years, compared to 54% in the manufacturing sector.
Given the low number of large firms, the statistics and analysis presented in this report are often restricted to SMEs. Before proceeding further, it is important to note that the results from this survey are based on a relatively small sample of firms selected from the membership of all partner institutions, and thus extrapolating the findings to the Ghanaian economy as a whole should be done with care.
Table 3: Selected sample features by firm size
Firm-size Definition (# of employees) Total Exporters Manufacturing Agriculture
Small Equal to or less than 19 124 36 79 45
Medium Between 20 and 99 72 32 64 8
Large Equal to or more than 100 4 0 4 0
All 200 68 147 53Source: ITC calculations based on SME Competitiveness data collected by AGI.

SME COMPETITIVENESS IN GHANA
OCE-16-27.E 11
Composition of firm employees
Firms were asked a number of questions on the makeup of their staff. Adding the total number of staff reported by each firm, the data show that 71% of employees work full-time and 29% work part-time (see Table 4).19 Men in the sample are far more likely to be employed than women, consistent with national statistics reporting that 60% of persons engaged are males, while females constitute the rest. The largest share of males (74%) in the survey sample work in the agriculture sector, followed by the industry sector (64%), and the services sector (59%).20 Interestingly, in the sample, the probability of being a full orpart-time worker is similarly high for both men and women.
Looking at the employment statistics by firm size, an interesting pattern emerges. Small-sized firms are far more likely to hire part-time workers than medium-sized firms; about 45% of staff in small-sized firms are part-time workers, whereas only 21% are part-time in medium-sized firms. The higher proportion of small firms engaged in agriculture offers a partial explanation for this finding, but even after controlling for sector the difference remains. The reasons for this are unclear, but it may be due to several factors, including the difficulty to employ staff on a full-time basis as a result of resources constraints, and the intermittent nature of incoming production orders.
Part-time employment is often temporary in nature, while full-time employment is more often linked to permanent positions. National statistics from 2015 indicate that approximately 80% of persons engaged were permanent employees, in all firm size classifications, except those engaging five-nine persons, where permanent engagement decreases to about 75%. This reflects the fact that in Ghana, it is common for businesses to hire employees to perform day-to-day tasks, since hiring full-time employees is a large commitment, while hiring temporary workers is advantageous due to lower pay and reduced benefits compared to permanent employment.21
Table 4: Gender and youth employment
Overall Full-time Part-timeAll employees 100% 71% 29%Men 68% 72% 28%Women 32% 68% 32%Young (<35) 66% 68% 32%Manufacturing
79%75% 25%
Agriculture21%
55% 45%
Source: ITC calculations based on SME Competitiveness data collected by AGI
Prevalence of sole/domestic ownership
The majority of firms in the survey are a sole proprietorship, and this fact is even more pronounced for small firms (see Figure 3). In addition, the data show that small firms tend to be mostly owned by private domestic individuals or bodies (92%); this drops to 79% for medium-sized firms. Medium-sized firms have higher rates of private foreign ownership, averaging 9.2% in the sample (the other category being government or state ownership); this falls to 5.1% for small firms. Most firms report being legally registered
19 144 of the 200 firms surveyed answered all the employment questions. Adding the total number of part and full time workers gives 4073. 20 Ghana Statistical Service (2015), National Employment Report, p. ix21 Ibid, p.x and p.28

SME COMPETITIVENESS IN GHANA
12 OCE-16-27.E
with the relevant local authority; all medium-sized firms report being registered, while 86% of small firms do.
Figure 3: Legal status of firms
Source: ITC calculations based on SME Competitiveness data collected by AGI.
Women in top management
Women own about 38% of the SMEs in the survey sample (38.7% for small, 38.0% for medium). Nearly 30% of small firms report having a female top manager; this drops to 24% in medium-sized firms (see Figure 4). One of the categories with the highest representation of women in top management positions is exporters, indicating that good performers (exporters) might discriminate less on the gender of their managers.
Figure 4: Women in top management
Source: ITC calculations based on SME Competitiveness data collected by AGI.
19%
51%
13%
14%
1% 3%
ShareholdingSole proprietorshipPartnershipLimited PartnershipNo legal statusOther
26%
37%
21%
37%
25%
30% 28%24%
0%5%
10%15%20%25%30%35%40%
% o
f firm
s w
here
the
top
man
ager
is a
wom
en

SME COMPETITIVENESS IN GHANA
OCE-16-27.E 13
Sales and exports
Small firms report an average annual revenue of $26,000 (GHS 102,000), which increases to $1,022,000 (GHS 4,037,000) for medium-sized firms. The distribution of sales varies by exporting status, size and sector, but overall it is clear that domestic sales are the main source of income (see Figure 5).
Among firms that reported exporting in the last year, 28% of sales come from direct exports, but just over40% of sales come from a combination of direct exports and indirect exports (the latter being sales to traders or companies that in turn export the good). Small-sized firms obtain the overwhelming majority oftheir sales from domestic customers, and although medium-sized firms generate more sales from exports, the increase is small. Agricultural firms in the sample derive 19% of sales from exports; much higher than manufacturing (7%). This is consistent with the lack of (and need for) economic diversification highlighted in Chapter 1, and the efforts of the government to increasing industry share of GDP by both making Ghanaian manufactured goods competitive in the domestic and international markets, and maximising the use of local raw materials in the industry.
Thirty-four percent of all firms in the sample reported exporting in the previous year. This share goes downfor small-sized enterprises, however 45% of agricultural firms are engaged in exporting. It is not possible toassess if firms have been exporting for a long time and continuously, so no inferences could be madeabout survival rate and continuity of exports. However, it was observed that among exporters, nearly twice as many actively seek foreign clients (42 firms), as opposed to waiting for foreign clients to approach them (23 firms). This ratio is consistent across firm sizes and sectors, and is an indication that taking initiative is an important component of reaching the export status.
Figure 5: Sales exports and firms that export
Source: ITC calculations based on SME Competitiveness data collected by AGI.
0%
10%
20%
30%
40%
50%
60%
70%
80%
90%
100%
0%
10%
20%
30%
40%
50%
60%
70%
80%
90%
100%
% o
f firm
s who
exp
orte
d
in th
e la
st y
ear
Dist
ribut
ion
of sa
les
Domestic salesIndirect exportsExport sales% firms who exported in last year

SME COMPETITIVENESS IN GHANA
14 OCE-16-27.E
Export dynamics
Data on export dynamics show that medium-sized firms export more quickly than small firms: more than80% of medium-sized firms that end up exporting do so within the first four years of their inception, while only 40% of small firms do so (see Figure 6). It is important to consider that firms can change size over time, which might skew the statistics. For instance, over the period of four years, a small firm may transition into a medium-sized firm, and only then start exporting. With this caveat in mind, Figure 6 can be interpreted as medium-sized firms exporting more quickly, knowing that it is possible that small firms quickly growing into exporters could have become medium-sized.
Either way, the data suggest that the first years after the establishment of a business are critical to the chances of start-ups evolving into exporters. Support services aimed at helping every aspect of this transition, from informing entrepreneurs of international opportunities, to helping business with packaging and labelling, will likely help increase the overall fraction of business engaged in trade.
Figure 6: Export dynamics
Note: The legend indicates the number of years a firm has taken to export.Source: ITC calculations based on SME Competitiveness data collected by AGI.
4. The SME competitiveness grid in Ghana
A high-level overview of survey results is shown in Table 5 as a filled-in version of the SME Competitiveness Grid. It shows that Ghanaian firms do best at the level of firm capabilities, with scoresranging from 60 to 70 (out of 100) across the three pillars of competitiveness. Firm capability and immediate business scores are calculated using SME Competitiveness Survey data. Answers to questions are ranked, enabling averages to be calculated for each question. Questions are grouped into indicators, and the final score presented is a simple average of these indicators. National environment scores are calculated using a different methodology, explained in the 2016 SME Competitiveness Outlook. In brief,
0% 20% 40% 60% 80% 100%
All
Manufacturing
Agriculture
Small
Medium
Percent of firms 0-4 5-9 10-14

SME COMPETITIVENESS IN GHANA
OCE-16-27.E 15
included indicators are normalized using a 108-country data set, and then averaged according to which pillar they are in. High national environment scores imply good performance at the international level.
Ghana performs worst at the national environment level, with particularly low scores in capacity to compete. The immediate business environment attains scores somewhere between firm capabilities and the national environment. Competitiveness scores fall as levels move from firm capabilities to the national environment. Although national environment indicators use a different dataset compared to the other two levels of competitiveness, this initial analysis shows that the greatest competitiveness gains to be made lie at the national level.
Table 5: The SME Competitiveness Grid for Ghana
Pillars
Compete Connect Change
Leve
ls
Firm capabilities 63.9 68.0 69.1
Immediate business environment
44.4 53.1 57.3
National environment 38.9 53.5 44.4
Note: High scores are better and are out of 100. National environment scores are taken from the 2016 SME Competitiveness Outlook. Scores are therefore normalized using a 108-country data set.Source: ITC calculations based on SME Competitiveness data collected by AGI
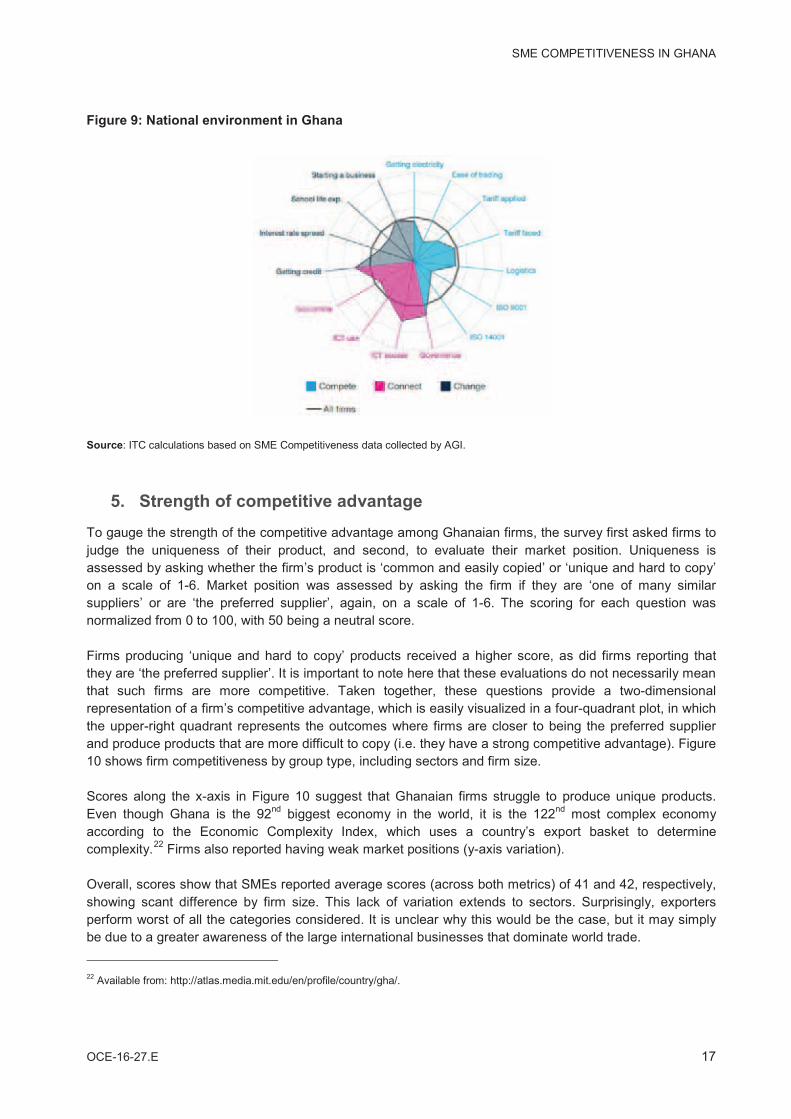
Figures 7, 8 and 9 break down results presented in the SME Competitiveness Grid (Table 5) by firm size and by indicator. For firm capabilities, which captures whether firms follow best practices, small and medium-sized firms attained scores of 63.2 and 78.3, respectively. These are decent scores, and reflect the fact that Ghanaian businesses have many of the features associated with competitiveness. The better rating achieved by medium-sized firms is not surprising, as larger firms tend to exhibit many more of the features normally associated with competitiveness (for example, having a business website).
For the immediate business environment, which captures how firms rate their local business milieu, small and medium-sized firms reported in virtually the same way (51.3 for small firms versus 51.1 for medium-sized firms). This suggests that small and medium-sized firms find their environments equally challenging. Low scores for the national environment reflects difficulties in getting electricity, ease of trading, applied tariffs, and the prevalence of certificates of the International Organization for Standardization (ISO). These are mainly areas for the government to improve.

SME COMPETITIVENESS IN GHANA
16 OCE-16-27.E
Figure 7: Firm capabilities in Ghana
Source: ITC calculations based on SME Competitiveness data collected by AGI.
Figure 8: Immediate business environment in Ghana
Source: ITC calculations based on SME Competitiveness data collected by AGI.
SME COMPETITIVENESS IN GHANA
OCE-16-27.E 17
Figure 9: National environment in Ghana
Source: ITC calculations based on SME Competitiveness data collected by AGI.
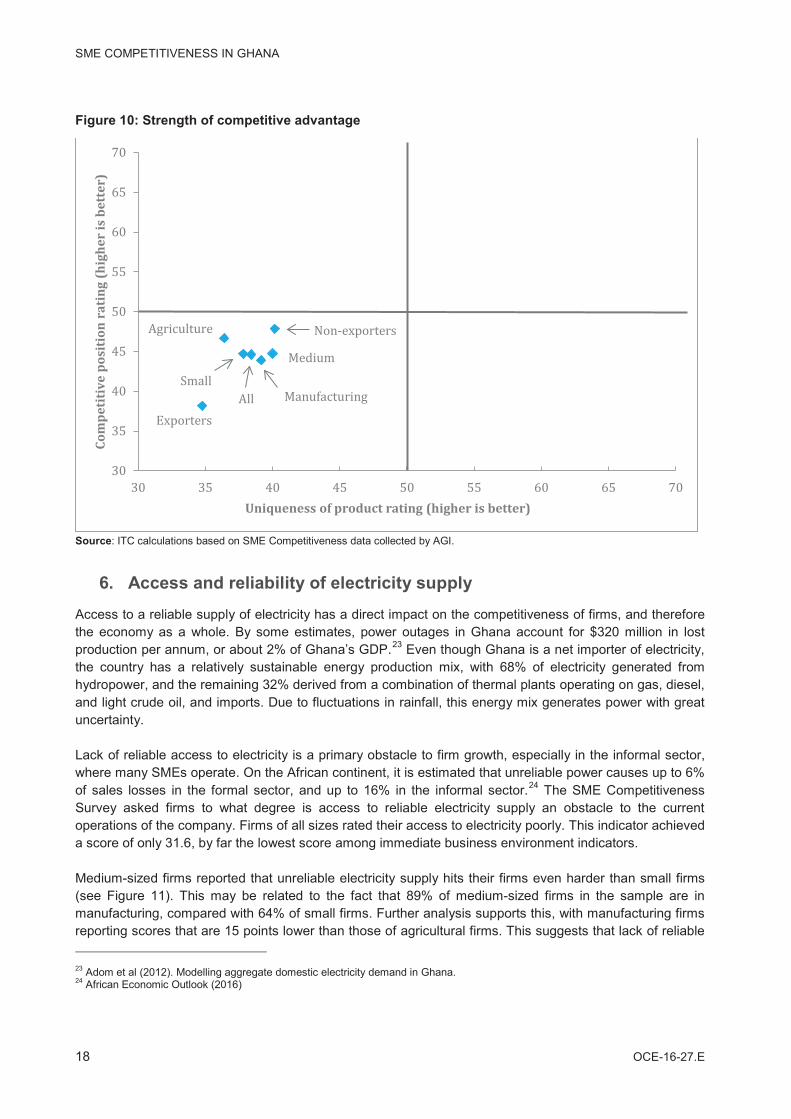
5. Strength of competitive advantageTo gauge the strength of the competitive advantage among Ghanaian firms, the survey first asked firms to judge the uniqueness of their product, and second, to evaluate their market position. Uniqueness is assessed by asking whether the firm’s product is ‘common and easily copied’ or ‘unique and hard to copy’on a scale of 1-6. Market position was assessed by asking the firm if they are ‘one of many similar suppliers’ or are ‘the preferred supplier’, again, on a scale of 1-6. The scoring for each question wasnormalized from 0 to 100, with 50 being a neutral score.
Firms producing ‘unique and hard to copy’ products received a higher score, as did firms reporting that they are ‘the preferred supplier’. It is important to note here that these evaluations do not necessarily mean that such firms are more competitive. Taken together, these questions provide a two-dimensional representation of a firm’s competitive advantage, which is easily visualized in a four-quadrant plot, in which the upper-right quadrant represents the outcomes where firms are closer to being the preferred supplierand produce products that are more difficult to copy (i.e. they have a strong competitive advantage). Figure 10 shows firm competitiveness by group type, including sectors and firm size.
Scores along the x-axis in Figure 10 suggest that Ghanaian firms struggle to produce unique products.Even though Ghana is the 92nd biggest economy in the world, it is the 122nd most complex economy according to the Economic Complexity Index, which uses a country’s export basket to determine complexity.22 Firms also reported having weak market positions (y-axis variation).
Overall, scores show that SMEs reported average scores (across both metrics) of 41 and 42, respectively, showing scant difference by firm size. This lack of variation extends to sectors. Surprisingly, exporters perform worst of all the categories considered. It is unclear why this would be the case, but it may simply be due to a greater awareness of the large international businesses that dominate world trade.
22 Available from: http://atlas.media.mit.edu/en/profile/country/gha/.
SME COMPETITIVENESS IN GHANA
18 OCE-16-27.E
Figure 10: Strength of competitive advantage
Source: ITC calculations based on SME Competitiveness data collected by AGI.
6. Access and reliability of electricity supply
Access to a reliable supply of electricity has a direct impact on the competitiveness of firms, and therefore the economy as a whole. By some estimates, power outages in Ghana account for $320 million in lost production per annum, or about 2% of Ghana’s GDP.23 Even though Ghana is a net importer of electricity, the country has a relatively sustainable energy production mix, with 68% of electricity generated from hydropower, and the remaining 32% derived from a combination of thermal plants operating on gas, diesel, and light crude oil, and imports. Due to fluctuations in rainfall, this energy mix generates power with great uncertainty.
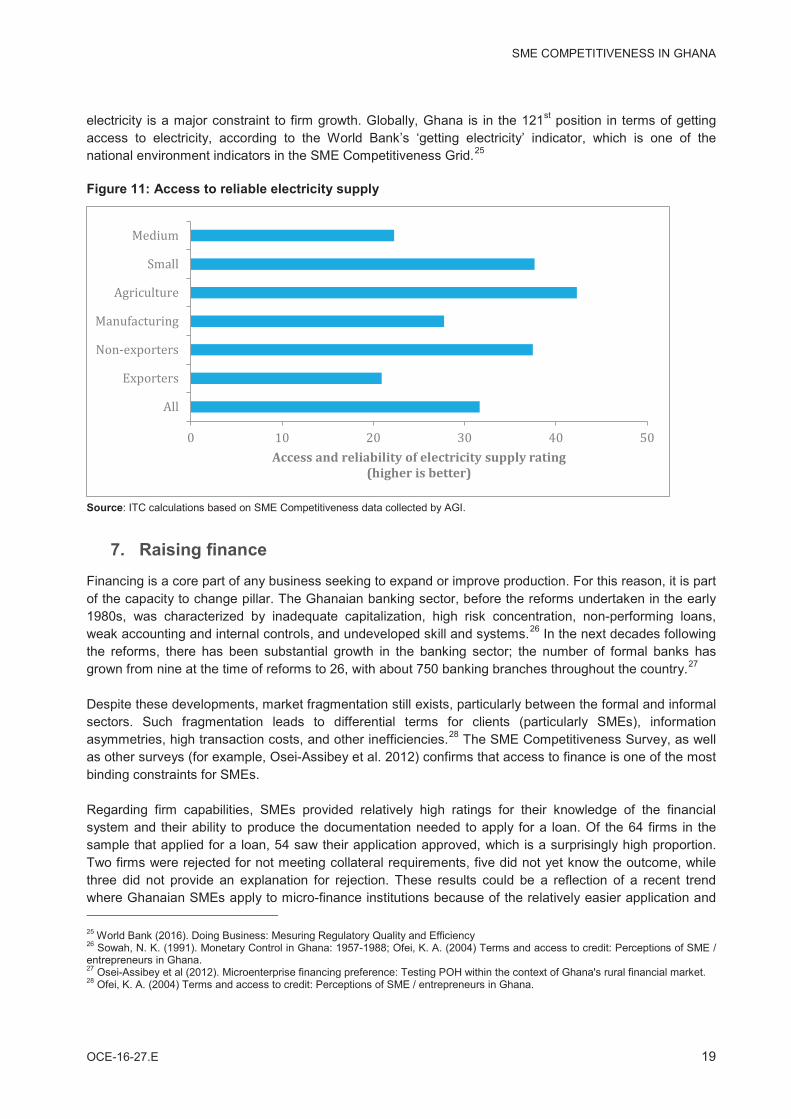
Lack of reliable access to electricity is a primary obstacle to firm growth, especially in the informal sector, where many SMEs operate. On the African continent, it is estimated that unreliable power causes up to 6% of sales losses in the formal sector, and up to 16% in the informal sector.24 The SME Competitiveness Survey asked firms to what degree is access to reliable electricity supply an obstacle to the current operations of the company. Firms of all sizes rated their access to electricity poorly. This indicator achieveda score of only 31.6, by far the lowest score among immediate business environment indicators.
Medium-sized firms reported that unreliable electricity supply hits their firms even harder than small firms(see Figure 11). This may be related to the fact that 89% of medium-sized firms in the sample are in manufacturing, compared with 64% of small firms. Further analysis supports this, with manufacturing firms reporting scores that are 15 points lower than those of agricultural firms. This suggests that lack of reliable
23 Adom et al (2012). Modelling aggregate domestic electricity demand in Ghana.24 African Economic Outlook (2016)
All Exporters Non-exporters
Manufacturing Agriculture
Small Medium
303540455055606570
30 35 40 45 50 55 60 65 70
Com
peti
tive
pos
itio
n ra
ting
(hig
her
is b
ette
r)
Uniqueness of product rating (higher is better)
SME COMPETITIVENESS IN GHANA
OCE-16-27.E 19
electricity is a major constraint to firm growth. Globally, Ghana is in the 121st position in terms of getting access to electricity, according to the World Bank’s ‘getting electricity’ indicator, which is one of the national environment indicators in the SME Competitiveness Grid.25
Figure 11: Access to reliable electricity supply
Source: ITC calculations based on SME Competitiveness data collected by AGI.
7. Raising financeFinancing is a core part of any business seeking to expand or improve production. For this reason, it is part of the capacity to change pillar. The Ghanaian banking sector, before the reforms undertaken in the early 1980s, was characterized by inadequate capitalization, high risk concentration, non-performing loans, weak accounting and internal controls, and undeveloped skill and systems.26 In the next decades followingthe reforms, there has been substantial growth in the banking sector; the number of formal banks has grown from nine at the time of reforms to 26, with about 750 banking branches throughout the country.27
Despite these developments, market fragmentation still exists, particularly between the formal and informal sectors. Such fragmentation leads to differential terms for clients (particularly SMEs), information asymmetries, high transaction costs, and other inefficiencies.28 The SME Competitiveness Survey, as well as other surveys (for example, Osei-Assibey et al. 2012) confirms that access to finance is one of the most binding constraints for SMEs.
Regarding firm capabilities, SMEs provided relatively high ratings for their knowledge of the financial system and their ability to produce the documentation needed to apply for a loan. Of the 64 firms in the sample that applied for a loan, 54 saw their application approved, which is a surprisingly high proportion. Two firms were rejected for not meeting collateral requirements, five did not yet know the outcome, while three did not provide an explanation for rejection. These results could be a reflection of a recent trend where Ghanaian SMEs apply to micro-finance institutions because of the relatively easier application and
25 World Bank (2016). Doing Business: Mesuring Regulatory Quality and Efficiency26 Sowah, N. K. (1991). Monetary Control in Ghana: 1957-1988; Ofei, K. A. (2004) Terms and access to credit: Perceptions of SME /entrepreneurs in Ghana.27 Osei-Assibey et al (2012). Microenterprise financing preference: Testing POH within the context of Ghana's rural financial market.28 Ofei, K. A. (2004) Terms and access to credit: Perceptions of SME / entrepreneurs in Ghana.
0 10 20 30 40 50AllExportersNon-exportersManufacturingAgricultureSmallMedium
Access and reliability of electricity supply rating (higher is better)

SME COMPETITIVENESS IN GHANA
20 OCE-16-27.E
approval process in comparison to traditional banks. Of the 54 approved firms, most reported havingsufficient knowledge of the financial system (score of 78), while nearly all of them had sufficient documentation for the application process (score of 96).
Positive results at the firm level regarding knowledge of the financial system contrast greatly with ratings at the immediate business environment level. Here, the survey asked firms, ‘to what degree is access to finance an obstacle to the current operations of this company’. Small and medium-sized firms reportedscores of 35 and 44.6 respectively, despite the high rate of firms receiving a loan when applying. Of the 54 firms approved for a loan, a score of 46 was reported for this question, only a few points higher than the sample average.
However, of the 126 firms that did not explicitly apply for a loan, only 39 said this was because they had ‘no need for a loan’. Firms that did not apply for a loan but wanted one, stated as the most common reason that ‘interest rates were not favourable’. This may suggest these firms were aware of the interest rates they would likely be offered and decided not to apply. The second most commonly cited reason was that the loan was not needed, and the third most commonly cited reasons was that application procedures were too complex.
The low score at the immediate business environment level for access to finance is consistent with a high number of firms who did not try to apply for a loan, even if they indicated interest in doing so, and eventhough the 54 firms in the sample that had received a loan rated access to finance poorly. These results are consistent with evidence on how firms overcome problems accessing finance through other sources. The World Bank enterprise survey data collected in 2013 suggests that the proportion of investments financed internally (for example, by friends and family) is 80% and 75% for small and medium-sized firms, respectively.29
Nevertheless, Ghana rates well at the national level with a ‘getting credit’ score of 66. This indicates that the country performs well in strength of legal rights, availability of credit information for banks and credit registry coverage. How does one make sense of the mixed results at the firm level, the poor results at the immediate business environment level, and the relatively good results at the national environment level?The picture that emerges is one in which firms report having a good understanding of the financial system, but nevertheless says they can’t access the financing they need. This is not due to inadequacies at the national level, but rather to the high interest rates charged on loans. The 2014 Economic Health Check on Ghana states that, ‘high interest rates… have begun to weaken private sector activity’.30
The three-level approach taken by ITC’s SME Competitiveness Survey helps to determine the precise reason why SMEs face difficulties in financing new investments. It ensures that three perspectives are brought to understand the source of any competitiveness related problem. This greatly helps in the design of future policy solutions.
8. Quality requirementsThe quality requirements indicator is based on whether a firm’s main product holds an official domestic certificate, an internationally-recognized quality certificate or a voluntary certificate. The sample as a whole attained a fairly good score of 62 (see Table 6). Results show that more than 85% of the surveyed SMEs
29 World Bank (2013) Ghana Country Profile30 International Monetary Fund (2014). IMF Survey: High Twin Deficits Pose Risks to Ghana’s Growth Outlook.

SME COMPETITIVENESS IN GHANA
OCE-16-27.E 21
hold an official domestic certificate (in both sectors), 51% hold an internationally-recognized quality certificate, and 45% hold a voluntary certificate.
As expected, exporters are far more likely to hold an internationally-recognized quality certificate (84%) compared with non-exporters (33%). The differences by sector are small but show that a higher share of agricultural firms hold internationally-recognized quality certificates (64%), compared to manufacturingfirms (46%). Far more medium-sized firms hold an internationally-recognized quality certificate (46% for small firms versus 60% for medium-sized firms). This trend remains even if exporters are removed from the sample. Forty-three percent of medium-sized firms not currently engaged in exporting nevertheless hold such a certificate, compared to only 29% of small firms.
With regard to voluntary certificates, the share of firms holding them is close to 45% with similar results for firms in agriculture and manufacturing. However, exporters and medium-sized firms are much more likely to hold such certificates, compared to non-exporters and small firms. This may reflect the fact that in many of today’s international value chains, compliance with voluntary standards is imposed by the lead firm. Since exporters are more likely to be linked to international value chains, and many of the buyers require suppliers to adhere to their internal standards, exporters are subjected more to these certificates. Similarly,for medium-sized firms, exporters are also more likely to have the resources to comply with these standards.
Table 6: Quality certificate holders
Official domestic certificate/standard?
(% yes)
Internationally recognized
certificate/standard? (% yes)
Voluntary certificate/standard?
(% yes)
Average of all categories
All 90% 51% 45% 62%
Exporters 99% 84% 63% 82%
Non-exporters 86% 33% 35% 51%
Manufacturing 88% 46% 43% 59%
Agriculture 96% 64% 49% 70%
Small 86% 46% 40% 57%
Medium 97% 60% 53% 70%
Source: ITC calculations based on SME Competitiveness data collected by AGI.
The survey also asked firms to identify which certificates or standards they adhered to. The results, summarized in Table 7, show that the Ghana Standards Authority (GSA) accounts for almost 50% of the certificates or standards adhered to by firms in the sample.31 The GSA has published more than 2,145 standards, although it does not make a strict difference between voluntary standards and technical regulations.32 Certificates or standards from Ghana’s Food and Drugs Authority rank second, and account for a quarter of the responses. Interestingly, GlobalG.A.P., the only private authority to feature in the list, ranks fourth (8% of responses), ahead of Ghana’s Export Promotion Authority, the Narcotic Control Board and the Traditional Medicine Practice Council.
31 Note, each certificate is counted individually. Firms we asked to report the 3 most important certificates they adhered to.32 Ghana Standards Authority (2016). GSA Standards Work Programme Bulletin.

SME COMPETITIVENESS IN GHANA
22 OCE-16-27.E
Table 7: Major certifications and standards
Certification Authority Percentage (%)
Ghana Standards Authority 47.7
Food and Drugs Authority Ghana 25.0
MOFA 9.7
GlobalG.A.P. (SGS Ghana Ltd.) 8.0
Other 4.0
GEPA 2.3
Narcotic Control Board 1.7
Traditional Medicine Practice Council 1.7
Source: ITC calculations based on SME Competitiveness data collected by AGI
At the national level, Ghana performs poorly on the number of ISO certificates issued per million people, with an average score of just 26. The fact that the survey sample was restricted to the Accra region may explain the difference in scores at the firm level versus the national environment, as firms close to the capital are likely to be more internationally minded. Another possible explanation is that few Ghanaian firms hold more than one internationally-recognized quality certificate compared to international averages. This would account for the low score observed at the national level.
9. ICT and advertising requirements
Ghana was one of the first African nations to establish widespread Internet infrastructure.33 This was possible thanks to the liberalisation of the telecommunication industry in the 1990’s, and the efforts of the Ghanaian government to build a knowledge-based economy. The National Information and Communication Technology for Accelerated Development policy was introduced in 2003 with the objective of engineering an ICT-led socioeconomic development process.34
Despite these institutional efforts, large connectivity gaps remain, as shown by poor national environment scores. Ghana ranks 109 on ITU’s ICT Development Index.35 Although mobile subscriptions are extremely high, few households report having access to the Internet and even fewer people have fixed broadband subscriptions. The ICT survey results, presented in Figure 12, reflect these findings well.
The most striking finding is the large gap in connectivity between small and medium-sized enterprises,amounting to a 34-point difference across all four sub-indicators. The only sub-indicator for which a gap does not exist is in use of mobile phones. The same pattern is found among exporters and non-exporters, with the gap amounting to a 19-point difference. These results are consistent with the finding presented in the 2015 SME Competitiveness Outlook, which showed that the largest gap between SMEs and large firms in sub-Saharan Africa was also in ICT competences.36
33 Dholakia et al (2014). Global diffusion of the internet.34 Boateng et al (2011). Advancing E-commerce Beyond Readiness in a Developing Country: Experiences of Ghanaian Firms.35 International Telecommunications Union (2016). Measuring the information Society.36 International Trade Centre (2015). SME Competitiveness Outlook: Connect, Compete and Change for Inclusive Growth.

SME COMPETITIVENESS IN GHANA
OCE-16-27.E 23
The sub-indicator with the lowest average score for all firms was ‘having a website’. Only 43% of the firms in the sample had business websites. Leveraging the advantages of the Internet is a crucial feature of today’s competitive landscape. For SMEs, having a business website through which they can market, sell or simply provide up-to-date contact information, can bring enormous advantages in terms of diversifying their client base.
Figure 12: Prevalence of ICT use
Source: ITC calculations based on SME Competitiveness data collected by AGI.
A firm which has efficient and technologically-advanced production processes, but does not have the abilityto attract customers and sell its products will go out of business. Marketing strategies represent one of the key functional ways that SMEs have to enhance performance. Strategic marketing practices are proven to have a significant impact on firm performance, in terms of growth in revenue, improved efficiency, wider connection with customers and ability to compete fairly with larger firms.37 A study based on survey data from Ghanaian SMEs confirms that strategic marketing helps to enhance the development of new productsand services for existing markets.38
In the SME Competitiveness Survey sample, only 47% of firms engaged in any type of advertising in the last year; the figure drops to 30% for small firms, but is fairly high, at 76%, for medium-sized firms.Medium-sized firms are also more likely to attend both domestic and foreign trade fairs. The use of Internetadvertising is more common among bigger firms, which is not surprising given that larger firms are more likely to have a business website. However, if one selects firms that already have a business website, the difference between small and medium sized firms disappears; 82% of small firms versus 85% of medium-size firms engaged in Internet advertising. In addition, the high fraction of firms that decide to invest resources in promoting their websites seems to suggest that those firms value their websites highly.
37 Johne and Davies, 2002: Folan et. al., 2007; Franco-Santos et. al.,2007; David,et.al., 2013.38 Dzisi and Ofosu, 2014.
0 10 20 30 40 50 60 70 80 90 100Use mobile phones
Use emailHas broadband
Has website
% answering yes
MediumSmallNon-exportersExporters

SME COMPETITIVENESS IN GHANA
24 OCE-16-27.E
Exporters out-perform non-exporters on all the advertising and promotion sub-indicators, except in the use of special offers. However, the differences here are relatively minor. Interestingly, exporters are far more likely to use the Internet to promote their products than non-exporters, supporting the notion that business websites play a role in helping firms to export.
This is consistent with Dzisi and Ofosu’s research (2014), showing that SMEs in Ghana mostly usetraditional forms of marketing – mainly television and radio, newspapers and magazines, banners and billboards and branded paraphernalia – while only few of them use modern technology to advertize their products and services. Interestingly, social media (e.g. Facebook) seems to be the most used marketing platform, compared to corporate websites and emails, confirming the low share of firms using a website as per Figure 12. SMEs use social media because it is interactive, user-friendly and cheaper compared tocreating and managing a corporate website.
Figure 13: Advertising and promotion
: ITC calculations based on SME Competitiveness data collected by AGI.
10. SME strengthening strategies in Ghana
Supporting institutions involved in the implementation of the SME Competitiveness Survey in Ghana came together to discuss the preliminary results in August of 2016 (see Table 3). In this meeting, the preliminary results of the survey were validated. Agreement was also achieved on the need for institutions to map their current efforts to strengthen SME competitiveness in line with the structure of the ITC Competitiveness concept, grid, and related pillars and themes. The results of this effort are presented in Tables 8 to 11. This meeting aimed to highlight the ongoing activities of each support institution and identify what is missing and needs to be done to strengthen SME competitiveness in Ghana.
As shown in Tables 8 to 11, Ghanaian SMEs can count on different levels of support through the AGI,MOFA, GEPA, FAGE, the Ghana Chamber of Commerce and Industry, ITC and others. Each support institutions in this exercise had a capacity-building programme on matters related to internal firm
0% 20% 40% 60% 80% 100%
Advertised in the last year
Made special offers
Uses Internet for promotion
Attended trade fairs athome
Attended trade fairs abroad
% answering yes
Medium Small Non-exporters Exporters

SME COMPETITIVENESS IN GHANA
OCE-16-27.E 25
capabilities, such as quantity and cost requirements on record keeping, accounting and business planning. However, more efforts need to be made to strengthen SMEs immediate business and national environment, including reducing the percentage of time spent on government regulation, and clearing exports and imports from customs. Relevant support institutions need to discuss how to increase support in these areas in an integrated way, in order to leverage knowledge, costs and creating a unified vision for Ghanaian SME development.
Table 8: AGI efforts to strengthen SMEs
Compete
Quantity & cost requirements Time requirements Certification & standards Competitors
AGI offers capacity-buildingprogrammes on record keeping and procurement practices.
AGI offers capacity-building programmes onlean management operations.
AGI offers capacity-building programmes on certification compliance and certification of origin. This is done with inputs from the GSA and Environmental Protection Agency on what standards are expected of industry players and help themintegrate into global value chains.
AGI holds sector meetings to discuss the future of different industry sectors,where each stakeholder can share experiences and learn from other industry players.
Connect
ICT requirements Linkages withcustomers Linkages with businesses Linkages with
institutions
AGI holds sector meetings to discuss the future of the different industry sectors, where trends and ICT uses are discussed.
AGI holds sector meetings to discuss the future of the different industry sectors, where each stakeholder can share experiences and learn from other industry players.
AGI creates platforms to facilitatebusiness-to-business (B2B)commerce and networking
AGI holds business luncheons where officials from different institutionsare invited to speak with members. AGI also participates in policy-making discussions when a relevant policy that affects industry is being developed.
Change
Finance requirements Skills requirements Intellectual property requirements
Occasionally, AGI holds meetings with banks and provides access to information for available financing schemes to its member SMEs. AGI is also in the process of setting up an industrial development fund for its members.
AGI has training programmes to ensure increased human capital in avariety of industry sectors and participates in the deployment of the International Labour OrganizationSCORE Programme.
AGI occasionally holds meetings with Ghana's Registrar General, responsible for business registration, including patents and trademarks.AGI participates in the programmefrom the MOTI for sharing information about intellectual property rights.
AGI is supporting industry development by: directly providing capacity-building programmes to its members; creating linkages with institutions and businesses on various dimensions that affect SME competitiveness; and sharing relevant information on financing schemes and intellectual property rights. In addition, through its engagement in Alliances for Action, AGI contributes to SME development by working

SME COMPETITIVENESS IN GHANA
26 OCE-16-27.E
collectively with other national institutions to develop further business linkages and capacity-building programmes.
Table 9: MOFA efforts to strengthen SMEs
Compete
Quantity & cost requirements Time requirements Certification & standards Competitors
The Agribusiness Unit, within the ministry, is tackling this element at the producer and SME level through capacity-building programmes on: book keeping and accounting; 5s; production management; business plans;value chains; and environmental safeguards.
The Agribusiness Unit, within the ministry, is tackling this element at the producer and SME level through capacity building programmes on: book keeping and accounting; raw material sourcing; 5s; production management; business plans; value chains; andenvironmental safeguards.
MOFA offers capacity-building programmes onGlobalG.A.P. andother certifications.
The Plant Protection & Regulatory Directorate of the ministry is involved in standards creation, with theinputs of other relevant government agencies, such as the GSA and the Environmental Protection Agency.
MOFA holds Joint Sector Review meetings every year to deliberate on events that took place during the year under review within the sector, and also allows stakeholders to share their experiences and chart the way forward.
Connect
ICT requirements Linkages with customers Linkages withbusinesses
Linkages withinstitutions
The ministry, under the West Africa Agricultural Productivity Programme, currently has an ICT-based platform called ’e-agriculture’that is fostering the effective and efficient dissemination of agriculture-related information among industry players. It looks at the delivery of agriculturalinformation and knowledge services such as market prices, extension services, technology, policies, programmes and projects using the Internet and related technologies.
A mandate of the Agribusiness Unit of MOFA is to serve as an information hub for prospective investors. Contact is also made with customers through exhibitions to showcase the services that the ministry offers to its customers.
MOFA offers capacity-building programmes on marketing to SMEs.
MOFA, through the Agribusiness Unit,provides training support to SMEsand through this creates linkages between businesses.
MOFA, by virtue of being the lead agency for food and agriculture, has linkages with several other institutions.
Change
Finance requirements Skills requirements Intellectual property requirements
MOFA has several training programmes for its human resources to build their capacities in various disciplines requires for the development of the sector.

SME COMPETITIVENESS IN GHANA
OCE-16-27.E 27
The Agribusiness Unit of MOFA is supporting SME development in the agri-business sector through various activities that affect the three pillars of competitiveness. This is being done through capacity-building programmes, promoting business linkages and ensuring access to information. Participation in the Alliances for Action initiative is also allowing the Agri-business Unit to develop further support activities foragri-businesses in Ghana.
Table 10: GEPA efforts to strengthen SMEs
Compete
Quantity & cost requirements Time requirements Certification & standards Competitors
GEPA supports SMEs in the export sector through the Ghana Export School, which trainscompany staff on costing and pricing.
GEPA supports SMEs in the export sector through the Ghana Export School, which trains company staff on time management in the export marketing course.
GEPA supports this element through the Ghana Export School, where staff from the Ghana Standards Authority,Plant Protection and Regulatory Services Directorate, Food and Drugs Authority, Environmental Protection Agency, and the Timber Industry Development Division are invited to train SMEs on certifications and quality issues.
GEPA holds product association meetings to share information on the performance of competitorsand to recommend possible strategies to compete effectively.
Connect
ICT requirements Linkages withcustomers Linkages with businesses Linkages with institutions
GEPA has created a website for SMEs to access trade information relevant to exporters.
GEPA organizes trade fairs and exhibitions forSMEs to meet potential customers, importers,and wholesalers abroad.
GEPA has platforms for match-making and B2B meetings for SME exporters and potential clients.
GEPA organizes the Exporters Forum, which brings together public institutions and SMEs so they can share ideas and discuss the challenges faced by SME exporters.
Change
Finance requirements Skills requirements Intellectual property requirements
GEPA organizes export financing training programmes for SMEs with banks and other financial institutions viathe Ghana Export School.
GEPA uses the Ghana Export School to build the capacities of SMEs by enhancing their skills. Experts are engaged to train SMEs in specific skills such as crafting and weaving.
GEPA liaises with MOTI on intellectual property requirements for SMEs.
GEPA supports SME development primarily through the services of the Ghana Export School. It also encourages information sharing and knowledge exchange through matchmaking events between businesses and meetings between public and private sector stakeholders. In order to further develop its role in promoting exports, GEPA has been collectively working with other national institutions for the development of Ghanaian SMEs and can play an active role in developing capacity-building programmes for Ghanaian exporters, particularly on compliance to international standards.

SME COMPETITIVENESS IN GHANA
28 OCE-16-27.E
Table 11: FAGE efforts to strengthen SMEs
Compete
Quantity & cost requirements Time requirements Certification & standards Competitors
At the SME level, FAGE uses capacity-building programmes that entail record keeping, lean management operation, market segmentation, pricing, pricing policy, team-building leading to group marketing.
Capacity-building programmes are developed as captured in FAGE'S strategic plan, and on time management in production and procurement practices
FAGE does advocacy around the adoption of certification in agriculture production and manufacturing processes. Additionally, FAGEfacilitates the training of various farmer-based groups in selected private standards, including GlobalG.A.P, hazard analysis and critical control points (HACCP), fair trade and organic.
FAGE includes all value chain actors in our trainings to stress the need for collaboration even among competitors.
Connect
ICT requirements Linkages with customers Linkages with businesses
Linkages with institutions
FAGE includes ICT training in its capacity-building interventions. Also, ICT platforms are made available to members who participate in FAGE-organized fairs such as Fruit Logistica.
FAGE acts as a linkage between the market and members. Also, the Fruit Logistica fair in Berlin is used as a platform for meeting customers and making new ones.
FAGE provides platforms for B2B at fairs and roundtables, including theMango Roundtable. FAGE members participate in B2B programmes organised by development partners for visiting businesses.
Various roundtables and the National Horticultural Task force brings together all actors in the horticulture industry.
Change
Finance requirements Skills requirements Intellectual property requirements
FAGE has supported an advocacy programme for long-term funding for export production activities,which was funded by the Business Sector AdvocacyChallenge Fund.
FAGE has a structured training programme developed for skills training in the export sector.
FAGE has yet to develop any programme to deal with intellectual property requirements. However, it will seek the necessary support from the relevant agencies should the need arise.
FAGE implements a variety of capacity-building programmes, as well information sharing and knowledge diffusion exercises to ensure SME development at different levels of the value chain, ranging from producers to agro-processors and exporters. The organization has also helped to catalyse sector development of the yam sector through its value chain development approach. Through its participation in the Alliances for Action initiative, FAGE can further support the development of exporters by collectively working with other national institutions in developing further business linkages and capacity building programmes for enabling the development of Ghanaian SMEs.

SME COMPETITIVENESS IN GHANA
OCE-16-27.E 29
Chapter 3 Alliances for Action: Enterprise competitivenessassessment on agro-processing enterprises
1. Alliances for Action
The pressing challenge in a dynamic and interconnected globalized economy is to devise effective trade mechanisms that can be locally owned, sustainable and can be scaled to a sufficient level in order to impact the livelihoods of those who are most in need. At the international level, the United Nations Sustainable Development Goals (SDGs) present a unique opportunity to show how trade and SME development are linked to the achievement of all 17 SDGs. They identify trade as a means of implementation to achieve sustainable economic, social and environmental development.
However, action at the international level is not enough. This is why ITC is increasingly engaged in multi-stakeholder partnerships and processes at regional and national levels.39 These activities are responding to the need for more inclusive and effective approaches to addressing complex sustainable development challenges. With a specific and unique mandate to work with SMEs in developing and transitional economies, a wide-array of partnership approaches, including bi-lateral, multi-stakeholder, and public-private are proving fundamental to the achievement of SME’s mission, goals and objectives.
In this context, ITC’s Alliances for Action is a multistakeholder initiative that is working with a growing list of countries to create new networks of private and public actors with the aim of promoting SME competitiveness. The various value chain stakeholders involved in Alliances for Action can includeproducers, agri-food processors, traders and support institutions that work together and form market-led partnerships that enhance value chain integration, technical support, policy alignment and local institutional capacity building.
Alliances for Action allows for an improved enabling environment and commercially-led partnerships between value chain operators, and consequently allows for improved competitiveness of both SMEs and smallholders involved in the selected value chains. Alliances for Action focuses on bridging the sustainability gaps faced by value chain operators, at the local, national and international level, in a participatory manner, while ensuring: collective action for problem solving; market and product diversification; and inclusive participation in trade. The process results in adapted, locally-owned solutions and partnership systems for value chain operators, from farmers to end buyers. A cornerstone for Alliances for Action is the requirement of investment and contribution by all participating stakeholders, including in-kind as well contribution to the funding of operational costs and support activities.
2. Alliances for Action: Implementation approachAlliances for Action uses a four-pillar implementation approach to enhance the competitiveness of various value-chain levels for sustainable development.
Pillar 1: Action-oriented global, regional and local value chain analysis. In the global value chain (GVC) analysis, global industry structures and market trends are assessed with detailed mapping of the national value chain and local economic clusters. The analysis eventually results in action-oriented recommendations, aimed at providing the foundation for the other Alliances for Action activities.
39 Manson et al, 2015.

SME COMPETITIVENESS IN GHANA
30 OCE-16-27.E
Pillar 2: Public-private Alliances for Action. The establishment of public-private alliances at the national and territorial levels provides leading platforms to prioritize and put into action the findings and recommendations of the GVC analysis. The main objective of public-private alliances is to leverage the power and capabilities of lead enterprises, farmer communities, investors and policy to impact change and transformation in the entire industry.
Pillar 3: Technical capacity building. The strategy of the Alliances focuses on: providing technical assistance and stimulating private investment, improving value chain governance, and promoting network collaboration in the value chain. Technical activities are implemented through territorial alliances and targeted at producers, processors and support institutions to build local capacity along the value chain. These activities also strive to help overcome common value chain and human development issues, such as income diversification (for instance, producing a combination of cash crops and food crops), women’s empowerment, climate-smart agriculture, limited innovative capacities, limited access to inputs and services including finance, efficient production processes, and disruptions in supply. Activities in this pillar also look at how to attractessential investment and co-financing options to support sector development.
Pillar 4: Value chain monitoring, evaluation and communication systems. The monitoring and evaluation system is based on a participatory mechanism that clarifies what to measure, who measures it, how it is measured, how to report and how to use this information for decision-making and documentation of learning. Alliances for Action ensures scalability and additionality through a ring approach. This approach actively involves farmers and extension officers of local institutions and builds their technical capacity to replicate the layers of support offered to them by the Alliances for Action network. The baseline of any Alliances for Action project is established through a farmer, trader and processor characterization exercise. The characterization is a measurement tool developed to understand, monitor and adapt the Alliances for Action methodology to the reality of the beneficiary, in this case farmers, traders and processors. Relevant support institutions are also monitored through a performance gap analysis and receive special technical assistance based on the findings of this analysis.
3. Implementation in Ghana
Alliances for Action in Ghana is promoting combinations of traditional cash or export crops such as cocoa with major food crops such as yam and other associated crops. Five ministries, as well as several support institutions and sector associations are participating as part of the support system established. Local and international private sector and value chain operators for yam and cocoa are at the core of Ghana’s Alliances for Action network.
At present, the initiative has held several stakeholder workshops to share constraints, discuss solutions and build a vision for the development of the cocoa, yam and associated crops sector. The combination between the production of cocoa, yam and associated crops was instituted for risk diversification and to solve farmers’ cash flow constraints. The Alliances for Action initiative was established in the cocoa-producing region of Brong Ahafo, where farmers harvest cocoa once a year, and consequently depend on the income generated at that time of the year. Hence, yam and associated crop demonstration plots were established to introduce new product options for the farmers to sell and consume, in order to address their cash flow constraints and food security needs. The public-private partnerships in Ghana’s Alliances for Action network started through the creation of the Yam Development Council, a public-private national alliance set-up with the objective of implementing a sector strategy for the development of the yam sector.
Local alliances have been set-up through the engagement of farmers and local traders. To date, the Alliances for Action initiative has established 15 demonstration farms with the production of yam and

SME COMPETITIVENESS IN GHANA
OCE-16-27.E 31
associated crops (i.e. other food crops the farmer was interested in producing, such as cassava and plantains) in the traditional cocoa producing areas of Kukuom and Sankore. Each of the 15 lead farmers is linked to a second tier totalling approximately 400 farmers, and in the long-term scale-up plan of the projectto a third tier of up to 6,000 farmers. More than 400 farmers were given trainings on topics ranging from gender economic empowerment to farm management techniques (including record keeping, sustainable land preparation, quality seed selection, and weed control) and dynamic agro-forestry. In addition, farmer unions, traders, exporters, as well as public and private support service providers are linked to these farmers and form part of their market, sustainability and support system.
At the processor level of the value chain, the Alliances for Action approach and its partners haveimplemented a systematic methodology to assess the strengths and weaknesses of enterprises. This approach consisted in assessing different operational areas within agro-processing firms. Additionally, these firms participated in a lean manufacturing training programme that addresses each of the gaps identified. In this manner, Alliances for Action takes an integrative approach that enables producers andprocessors to enhance competitiveness, and links these value chain stakeholders to markets.
Moreover, Alliances for Action is an evidence-based methodology. Data about the different value chain stages are collected and analysed on a systematic basis in order to capture findings and features useful to better understand the overall context and needs of stakeholders. This micro-level analysis is a method to provide inputs for policymaking and operative functions. Data analysis is not only a useful tool to support the operational framework, but it also provides insights on how to scale-up development projects and better understand the issues related to beneficiaries in the long term.
4. Enterprise assessmentEnterprise assessment parameters
The enterprise assessment is an integral activity of the Alliances for Action initiative. It follows the SME Competitiveness Survey by undertaking a deeper assessment of the SME internal production and processing systems in order to assess compliance with specific performance parameters at the level of operational and management practices. This assessment of operational and management gaps isperformed at the producer, trader and processor level, and it is adapted to the needs of each value chain. Assessment results in SME identify issues in order to implement commonly agreed to corrective actions. It is designed to be a self-sustained SME support service that is offered by AGI to its members.
In the current Alliances for Action framework in Ghana, the enterprise assessment has been applied to six companies at the processor level. Following an assessment visit to companies by AGI and ITC, strengths and weaknesses of enterprises in different operational areas were scored. Each area (defined as ‘competitiveness parameters’) contributes to the overall business performance and competitiveness of theenterprise. These areas can be evaluated by assessing a number of sub-indicators. The parameters used to examine each enterprise and their relevance are described in Table 12.
Indicators are assessed by assigning a mark to each of the 14 areas. An overall result is then given to the whole indicator for each enterprise.40
The Alliances for Action enterprise assessment is linked to the SME Competitiveness survey. Once the SMECS has provided its diagnostic of firm level and immediate environment strengths and weaknesses, the enterprise assessment takes an in-depth look at internal operational drivers that affect the efficiency of
40 Scoring: 5 = Excellent (100%); 4 = Good (80%); 3 = Satisfactory (60%); 2 = Improvements required (40%); 1 = Unacceptable(20%); N.A.= not available/not applicable (0%).

SME COMPETITIVENESS IN GHANA
32 OCE-16-27.E
a firm. The assessment also sets corrective actions, measures and targets for the SME while establishing a monitoring mechanism for the companies that are part of the exercise.
Table 12: Enterprise assessment parameters
Internal competitiveness parameters Variables considered
1 Raw material controlRaw materials specifications; inspection of incoming raw material; control of pesticide residue and heavy metals; in-bound transportation; storage conditions of raw materials and packaging; traceability; temperature control; and vendor assurance systems.
2 Factory premises
General condition of building, floors, walls, ceiling, equipment and technology, and lighting. Also, the cleanliness of equipment, floors, walls and warehouses (finished goods, raw materials and chemicals); and the presence of workplace information including workplace markings; 5S; and error prevention.
3 Processing
Availability of production process flow chart, critical control points, choice of equipment, condition of equipment, instructions and standard operating procedures, process records, metal detectors, magnets, sieving and straining processes, other equipment to remove foreign material, temperature treatment facilities, and equipment maintenance program.
4 Performance indicators
Use of indicators to track processing time, inventory levels, balanced work content, productivity, cost and sales.
5 Employee involvement Involvement of employees in taking responsibility of standard development; training of employees; required qualifications of employees.
6 Hygiene/cleaning/worker health
Cleaning procedures/schedule, cleaning methodology, use of chemicals, existence of allergens policy, presences of allergens in supply chain/factory/warehouse, prevention of cross contamination of allergens, hygiene policy and training, availability of hand wash facilities, use of uniforms including hairnets, jewellery, if smoking is allowed on the premises, presence of changing facilities, bathrooms, and whether employees have excessive overtime hours.
7 Environment Environmental management system or standards, lighting conditions, waste and water management, emissions.
8 Pest control The use of a pest control contractor, level of service provided, insectocutors with UV light, use of bait/traps.
9Inventory analysis,storage and transportation
Whether there is a laboratory present for microbiological analysis, whether analysis is possible, use of illegal food dyes, inventory storage and out-bound logistics.
10 Quality assurance
Product specifications, complaint handling, recall procedure, corrective actions, documentation, responsibilities assigned, HACCP, ISO, or other quality certificates, use of coding/labelling, traceability (including batch size, blocking of products, vendor assurance system).
11 Management capabilities
Middle management fluency in English; willingness to cooperate; level of understanding of customers’ desires; entrepreneurial mind-set and willingness to invest; process confirmation; regular communication; control system; whether they were seen as an example in the industry.
12 Gender diversity Ratio between males and females.
13 Financial mechanisms How the operation is funded.
14 Linkages & connectivity
Membership to associations, participation in national and international trade and industry trade fairs; contact with other buyers and suppliers; and the nature of information received from such contact.

SME COMPETITIVENESS IN GHANA
OCE-16-27.E 33
Enterprise assessment results
Out of the 200 SMEs that where part of the SMECS in Ghana, AGI selected six companies in the agro-processing sector willing to review their performance and to adopt corrective actions when necessary. AGI and ITC visited these companies and conducted an evaluation followed by in-factory training and capacity building. Five out of six are food processing enterprises, mainly producing fruit juices, dry leaves for infusion and cereal-based products. One enterprise produces beauty and hygiene products. Figure 14 suggests the selected enterprises have approximately the same level of competitiveness by each parameter. The results suggest that the issues affecting competitiveness are common among the selected enterprises. The overall result is further broken down by parameter.
Figure 14: Overall performance by enterprise
Source: ITC staff based on data collected from Enterprise Assessments done in August 2016.
Raw Materials
The quality control assurance of raw materials is an important part of the production process in agro-processing industries. Raw material control refers to systematic control over purchasing, storing and consumption of raw materials, so as to maintain a regular and timely supply of inputs, and at the same time, avoid overstocking. All raw materials need to be checked to establish their conformity with specifications. This process includes: selection of raw material; characterisation of the raw material; and defining the property profile of raw materials. Control over materials is of the utmost importance for smooth and uninterrupted functioning of process operations. Identification of non-conforming materials can improve operational performance and save valuable time. Quality control is important to produce higher quality products and to increase profitability. Instituting an effective quality control and inspection of raw materials upon receipt, and record keeping systems to scale and improve this system can improve enterprise performance.
In the enterprise sample, the assessment of raw materials control registered an average level of 55%, with a range between 53% and 56%. All the enterprises were assessed at close to a satisfactory level with need of improvements. Among the issues recorded, the most common problem was the lack of a proper control on pesticide residue and heavy metals. Traceability of raw materials (not always recorded) and bad storage conditions of raw materials are two other issues that require improvement.
30%50%70%
Perf
orm
ance
leve
l
E1 E2 E3 E4 E5 E6
E1 = Enterprise 1
SME COMPETITIVENESS IN GHANA
34 OCE-16-27.E
Factory premises
The competitiveness driver measures the conditions of the enterprise’s factory premises. The state and design of the premises have a direct impact on productivity and efficiency. Poorly constructed and maintained working premises negatively impacts production and may also pose safety hazards to staff. For example, there can be a high risk of injury if floors are poorly maintained, slippery and water logged. The use of natural lighting is encouraged as a way to minimize energy use which is a cost control mechanism.
The average quality of enterprises’ factory premises was evaluated at 49%, with a range between 41% and 53%. In general premises condition was poor, with most enterprises needing to improve barriers and walls. Housekeeping needs to be improved, according to the 5 Sigma toolset. Equipment is dated, and needs to be better cleaned and maintained. Furthermore, almost all the enterprises do not present an error prevention procedure, which leads to a loss of efficiency and productivity.
Processing
This assessment focused primarily on evaluating the operational level of enterprise competitiveness. The operational level includes the effectiveness of scheduling techniques, incoming stock level, work in progress and finished goods in transit. Operations and processing is at the heart of agro-process industries and weaknesses in this area have a direct bearing on the quality of output, which consequently undermines the profitability of enterprises. The following variables were used as proxies to assess operations and processing efficiency and effectiveness: availability of production process flow charts;critical control points; the choice of processing equipment used; the condition of equipment; the visible presence of production process instructions; the use of metal detectors and magnets; sieving and straining or other equipment to remove foreign material; the use of heat treatment facilities; and the existence of a maintenance program for processing equipment.
With an average level of 45%, processing efficiency and effectiveness is the weakest point registered by this assessment. The range is between 40% and 49%, with all the enterprises far from the satisfactory level and most in need of vast improvements. Not a single enterprise in the sample has a maintenance programme for its equipment, nor a documented flow chart of the production process. Half of them do not record processes at all, highlighting a lack of organization. None of the enterprises are equipped with ametal detector and magnet. Most of the enterprises do not have Critical Control Points procedures or, if they are present, they strongly need improvements. Another area that requires improvements is the cooling process that has been assessed as too slow in some enterprises.
Performance indicators
Performance indicators are used to estimate and strengthen enterprise success in line with overall business goals. Performance measurement provides vital information on immediate business performance. In today’s competitive environment, it is highly important for owners to have real-time data concerning the health of the enterprise. Small business owners should measure and track key performance indicators that are crucial to the success of the enterprise. Performance measurement is indispensable for managing the state of the system and taking the appropriate actions for maintaining a company’s competitiveness. These indicators provide vital decision-making information, and when used well, tracking performance indicators can become an important part of an enterprise’s strategy.
Measurement and tracking of business performance is a weakness of the enterprises assessed, the average level registered was 46%. Only sales information is recorded, and only a few enterprises collect data about costs. None of the firms surveyed keep records on processing time, inventory levels, balance work content and productivity. This needs improvements in order to properly assess the state of the productive system and taking suitable actions to increase company’s competitiveness.

SME COMPETITIVENESS IN GHANA
OCE-16-27.E 35
Employee involvement
Employee involvement exists in enterprises that intentionally establish work cultures, systems and processes to encourage and make use of employee input and feedback. Involving employees more in decision making has become increasingly common as enterprises see the benefit in keeping employees at all levels actively engaged in core activities. Employee training can increase motivation and morale and contribute to increased efficiencies in processes. Training also increases employee capacity to adopt new technologies and methods which can result in improved operational performance and financial gains. All the enterprises were assessed with a level of 53%. They have a satisfactory involvement of employees in training and qualification, but improvements are needed to involve employees in standard development.
Health, safety and labour conditions
Safety in the workplace is an important measure to reduce the likelihood of accidents and injuries. Illness, accidents and injuries result in business losses and a drain in profits. Cleanliness means efficiency.Keeping a clean manufacturing environment not only saves time and money, but also protects the health and well-being of employees by preventing injuries. Among all the indicators, this one registered the best results for the enterprises assessed. The average level was 55% with single levels up to 60%. The main common issue was related to the contamination of allergens and associated policies, prevention and controls. Some enterprises also need to make improvements to changing rooms.
Environment
A sustainable production system leads to sustainable competitiveness. Customers are often concerned about the environmental impact of the products they buy and consume. Waste management, emissions and water management are the most sensitive areas. Certifications attesting to proper environmental system management increase the competitiveness of an enterprise. Environment indicators present a satisfactory average level of 54% among the surveyed enterprises. Indicators on the enterprise’s impact on the external environment were almost satisfied. It is worth noting that agro-processing enterprises, mainly if they have their own farm, can use waste as feed, manure or compost. All the enterprises assessed do nothave an environmental management system or standards.
Pest control
In agro-processing environments, quality pest control is essential. A pest infestation can put products and enterprise reputation at risk. Pest management in processing environments is also very sensitive, and special precautions must be taken to keep pest control treatments from threatening food safety. Pest management is a process, not a one-time event and ideally pest control programs should be effective and fully documented. Implementation of effective pest control programs is often apart of export requirements for regional and international markets.
On this indicator, enterprises scored an average almost acceptable score around 50%, with a range from 40% up to 60%. Assessed enterprises have different level of service, ranging from a six-months regular service to annual general controls. Fumigation is generally used, usually with a frequency of three times per year. Only half of the enterprises have installed baits and traps, while the totality of the sample has not installed insectocutors with UV lights.
Inventory analysis, storage and transportation
Overseeing and forecasting the management and movement of stock is important in business competitiveness. Excessive stock creates additional business costs, while insufficient stock levels to meet
SME COMPETITIVENESS IN GHANA
36 OCE-16-27.E
customer demand results in lost sales. The organization of storage and transportation activities plays an important role in the distribution of products, and if not managed well, can lower productivity and raise business costs.
A relatively good level of storage and transportation system was assessed in the sample surveyed. Five out of six enterprises got an overall level of 57%, thus only one enterprise was far from a satisfactory level. Almost all of the enterprises plan regular laboratory and microbiological analysis. However, most of the storage systems need to be improved, reorganized and/or relocated.
Quality assurance
Small and medium-sized agro-processing businesses all over the world increasingly have to consider the production of good quality products as essential to their competitive survival. Consumers and buyers are becoming more aware of the importance of safe, high-quality products. The customer defines the quality criteria needed in a product, and to meet this standard, enterprises should put in place a quality control system to ensure that the product meets these criteria on a regular basis.
Quality control involves inspection of raw materials to ensure that no poor-quality ingredients are used, undertaking checks during different stages of processing, and inspection of the final product to ensure thatno poor-quality products are sent to the consumer. Quality assurance systems go beyond just controlling,and take a much wider view of what is involved in satisfying customers' needs. These systems focus on the prevention of problems, since resolving problems once they have occurred is expensive and quality cannot be inspected into a product. A quality assurance approach includes the whole production and distribution system, from the suppliers of important raw materials, through the internal business management to the customer. Quality testing is important in ensuring the quality of production with respect to market demands and requirements.
The average level of enterprises’ commitment to quality assurance was assessed around 52%, with a range between 48% and 55%. None of the enterprises has a HACCP or ISO certification, but three of them have a compliant certification. Among the most common issues, almost all the companies need a system for blocking products and a larger and/or better organized batch. Furthermore, lack of documentation and weak clearness in responsibilities impact negatively the quality assurance of products in the surveyed firms.
Management
Efficiency and effectiveness in enterprise performance depends on the capability of management to organize, control, implement and review the operational process. Deficiencies in process management, information handling, work tasks and workplace design and motivation have negative implications for enterprise performance. The assessment of management capability in this survey attempted to identify skills gaps in the vision and overall entrepreneurial drive of the owners/managing directors. The other critical dimension was management’s knowledge of processing operations related to key performance indicators, and measures that have been put in place to address challenges such as managing raw material shortages, training staff, and ensuring staff have the core technical skills for production of quality products.
With an average level of 54% evaluated and a range between 51% and 60%, the capabilities of management are one of the strengths of the assessed enterprises. This means firms have the competencies to face issues and improve weaker business areas. This result is strongly supported by a

SME COMPETITIVENESS IN GHANA
OCE-16-27.E 37
good willingness to cooperate and by a supportive and proactive work environment. Improvements are mainly needed in control systems and in best practice procedures.
Gender diversity
Employees are central to many business operations and make an important contribution to enterprise performance. Recent research now suggests that gender diverse work teams can improve the assortment of knowledge and skills within the enterprise, which can have a positive impact on operational effectiveness. The totality of full-time workers in the survey sample is composed of 56% women and 44% men (see Figure 15). Four out of six enterprises have more female employees than male. However, whenpart-time employees are factored in, the figure is different – 60% men and 40% women – since most of them are men.
Figure 15: Gender diversity
Source: ITC staff based on data collected from Enterprise Assessments done in August 2016.
Financial mechanism
Finance is essential to assist the formation of new businesses, and allows businesses to take advantage of opportunities to grow, employ local workers and in turn support other businesses. The strategic use of financial instruments, such as loans and investments, is crucial to the competitiveness of every business. The sources of finance that individual enterprises can access play a significant role in their ability to grow business competitiveness. Among the six enterprises in the sample, the main source of funds was their own financing, with half of them also relying on bank loans (Figure 16).
0%20%40%60%80%
100%
E1 E2 E3 E4 E5 E6
MaleFemale

SME COMPETITIVENESS IN GHANA
38 OCE-16-27.E
Figure 16: Sources of finance
Source: ITC staff based on data collected from Enterprise Assessments done in August 2016.
Linkages and connectivity
Market linkages refer to the relationships enterprises have with external markets, including with other enterprises, suppliers, and producers. Connectivity related to how enterprises engage with other actorsalong the value chain at the industry, national and international level, to open up new business opportunities, access market information and learn from other market players.
Stronger market linkages and connectivity can lead to more opportunities to access trade-related information and business opportunities that can improve overall enterprise competitiveness. All the enterprises assessed in the survey are well connected to markets and other actors, through national and international fairs and belonging to associations and institutions (see Figure 17). A good network can positively affect enterprise competitiveness if it is linked to good performance in the other indicators.Indeed, connectivity can both strengthen and enhance the performance of the whole business.
100%
50%
0% 0%
Own finance Bank finance Buyer finance Other
SMEs
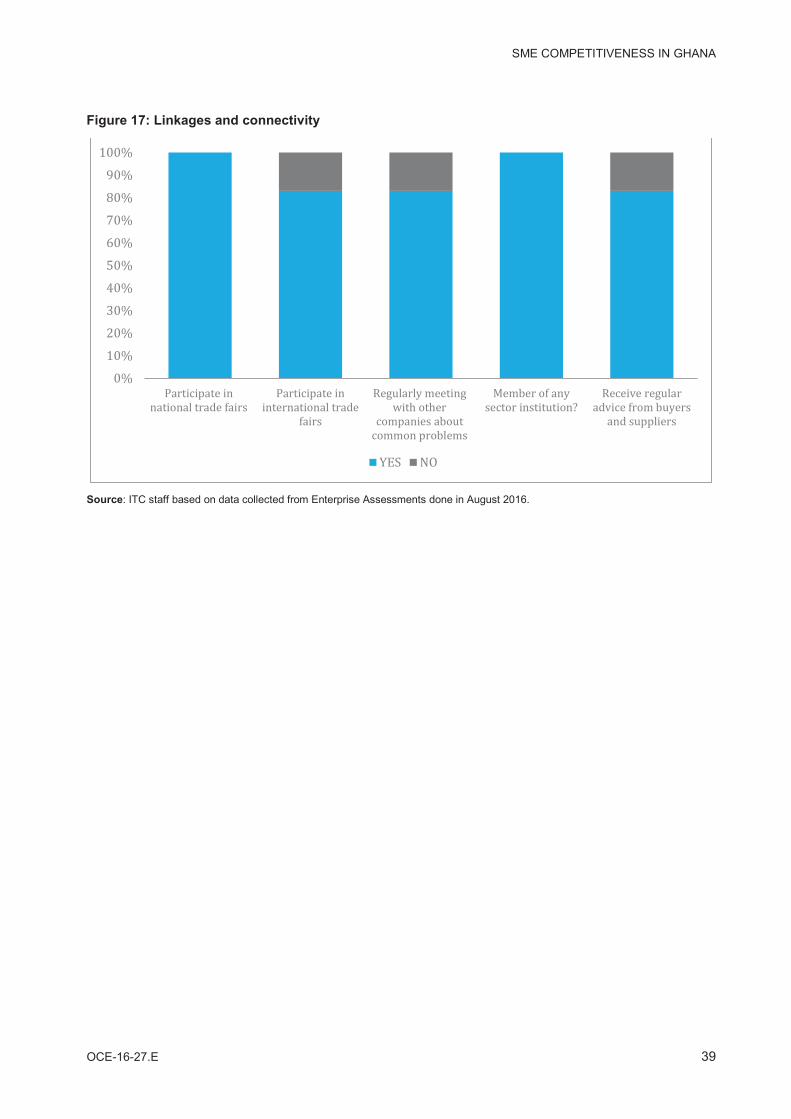
SME COMPETITIVENESS IN GHANA
OCE-16-27.E 39
Figure 17: Linkages and connectivity
Source: ITC staff based on data collected from Enterprise Assessments done in August 2016.
0%10%20%30%40%50%60%70%80%90%100%
Participate innational trade fairs Participate ininternational tradefairs Regularly meetingwith othercompanies aboutcommon problemsMember of anysector institution? Receive regularadvice from buyersand suppliers
YES NO


SME COMPETITIVENESS IN GHANA
OCE-16-27.E 41
Chapter 4 Conclusion and way forward
This report presents the results of the first large-scale deployment of ITC’s SME Competitiveness Survey(SMECS), which was carried out in 2016 under the auspices of Alliances for Action in Ghana. AGI was nominated as the lead Ghanaian institution for implementation and data collection. Six other institutions took supporting roles, namely: MOFA, MOTI, GEPA, FAGE, GNCC and GROCTEU.
The survey was carried out on 200 agricultural and manufacturing firms, with the aim of understanding not only the internal strengths and weakness of Ghanaian firms, but also external business environment factors holding back growth.
The SME Competitiveness Survey results show that:
Ghanaian firms struggle to produce unique, high value-added products, and they don’t consider themselves to be leaders in their chosen production specialization;
Lack of a reliable electricity supply is a major constraint to firm growth, hitting medium-sized firms twice as hard as small firms possibly because the latter’s electricity requirements are not as high as the larger firms who make use of more mechanized equipment;
Ghanaian firms report that they have a good understanding of the financial system but access to finance is an obstacle, with high interest rates cited as a top reason for this;
Only half of Ghanaian firms in the sample reported adhering to an internationally-recognized certificate or standard. Exporters were much more likely to hold both internationally-recognized certificates and, interestingly, voluntary certificates;
The biggest gap between small and medium-sized firms is in ICT requirements. This gap is driven by the lack of a business website, and use of emails, especially among small firms;
Only 30% of small firms engaged in any type of advertising in the last fiscal year, compared to 76% of medium sized firms, potentially limiting the growth of their client base.
The Alliances for Action framework is one of the ways ITC, AGI, and other partner institutions are using to collectively address some of the constraints found in the SME Competitiveness Survey, along with current efforts that each institution has in place to address these issues.
A second method for assessing the competitiveness of firms is the Enterprise Assessment on Agro-processing Enterprises, which performs an internal production process assessment on a small number of firms, and is designed to be replicated by AGI as a service to its members. This tool assesses not only the competitiveness of selected firms, but also their role within value chains, with the ultimate objective of improving the competitiveness of enterprises through the delivery of effective and practical in-factory trainings that seek to resolve production and processing issues.
To address how each support institution can tackle the constraints found in the SME Competitiveness Survey and associated efforts, the report outlines the current efforts partner institutions are making to strengthen SME competitiveness. This exercise helps institutions understand what else needs to be done to strengthen SME competitiveness in Ghana, and to exchange information and liaise on complimentary activities.
SME COMPETITIVENESS IN GHANA
42 OCE-16-27.E
There are many constraints to SME growth, and there are several directions local, national and international organizations can take to help boost competitiveness. However, the likelihood of developing effective programs and policies only increases if partner institutions align themselves to a common vision, based on the bottlenecks identified by primary data. This report can serve as an input to achieve that ultimate goal.
In order to ensure that national support institutions work together to enable SME development in Ghana,Alliances for Action represents an opportunity to formalize sector-based public-private platforms wherefirms can share issues, offer solutions and establish a common vision for the development of enterprises in Ghana. Additionally, the approach strengthens the institutions involved in the process so that they can improve their support services in response to SME Competitiveness Survey results and replicate the interventions in a sustainable manner.

SME COMPETITIVENESS IN GHANA
OCE-16-27.E 43
Annex I SME competitiveness data
This annex lists the data in the SME competitiveness grid by indicator. Data presented in Tables 13, 14and 15 are split by the levels of competitiveness.
Table 12: Firm capability indicator scores
Pillar Indicator Small-sized firms
Medium-sized firms All firms
Compete
Strength of competitive advantage
41.3 42.4 41.5
Cost and quantity requirements 66.7 75.7 70.4
Quality requirements 57.4 69.9 62.1Time requirements 70.8 72.4 71.3Efficiency of daily operations 64.0 82.2 71.0
Connect
Advertising and promotion 43.4 74.3 55.3
Marketing research 66.9 75.7 70.4Awareness of competitors 77.4 82.2 78.8
ICT competence 54.5 88.8 67.5
Change
Strategy design 72.0 82.2 76.1Capability to raise financing 80.0 89.0 83.3
Skills training 62.6 80.9 69.2Innovation and intellectual property 43.1 66.4 52.2
Table 13: Immediate business environment indicator scores
Pillar Indicator Small-sized firms
Medium-sized firms All firms
Compete
Access and reliability of electricity supply 37.7 22.3 31.6
Access and reliability of transportation networks 51.7 41.4 48.6
Access and reliability of water supply 56.9 43.8 53.0
Connect
Access and reliability of communications connection
60.2 50.4 57.1
Strength of public networks and relationships
39.0 58.1 46.9
Strength of private networks and 49.3 65.0 55.4

SME COMPETITIVENESS IN GHANA
44 OCE-16-27.E
relationships
Change
Access to finance 35.0 44.6 39.6Access to an educated workforce 73.0 67.1 71.0
Access to research networks 58.7 67.0 61.4
Table 14: National environment indicator scores
Pillar Indicator National score
Compete
Getting electricity 45.2 Ease of trading 24.0 Tariff applied 34.9 Tariff faced 47.5 Logistics performance index 46.4
ISO 9001 21.7 ISO 14001 29.9
Connect
Governance 61.6 ICT access 67.5 ICT use 49.1 Gov. online index 43.9
Change
Getting credit 66.1 Interest rate spread 41.0 School life expectancy 37.8 Starting a business 49.9
Note: Indicators’ definition can be found in SME Competitiveness Outlook (2016).

SME COMPETITIVENESS IN GHANA
OCE-16-27.E 45
References
Adom, P. K., Bekoe, W., & Sesi, K. K. A. (2012). Modelling aggregate domestic electricity demand in Ghana: An autoregressive distributed lag bounds cointegration approach. Energy Policy, 42, 530–537.AfDB/OECD/UNDP. (2016). African Economic Outlook 2016: Sustainable Cities and Structural Transformation. Paris: OECD Publishing; http://dx.doi.org/10.1787/aeo-2016-en
African Development Bank (2012), Ghana Country Strategy Paper 2012-2016. Available fromhttp://www.afdb.org/fileadmin/uploads/afdb/Documents/Project-and-Operations/Ghana%20-%20CSP%202012%20-%202016.pdf. Accessed 13 October 2016.
African Development Bank (2016), African Economic Outlook. Available fromhttp://www.afdb.org/fileadmin/uploads/afdb/Documents/Publications/AEO_2016_Report_Full_English.pdf.Accessed 13 October 2016.
Boateng, R., Molla, A., Heeks, R., & Hinson, R. (2011). Advancing E-commerce Beyond Readiness in a Developing Economy: Experiences of Ghanaian Firms. Journal of Electronic Commerce in Organizations,9(1), 1–16.
David, C. M., Neeraj, A., Derek, K., John, W., Michael, R., Ruba, B., Julio, B. (2013). Lessons on Technology and Growth from Small-Business Leaders. UK: The Boston Consulting Group.
Dholakia, N., Dholakia, R. R., & Kshetri, N. (2004). Global diffusion of the internet. The Internet Encyclopedia.
Dzisi, S., & Ofosu, D. (2014). Marketing Strategies and the Performance of SMEs in Ghana. European Journal of Business and Management, 6(5), 2014.
Folan, P., Browne, J., & Jagdev, H. (2007). Performance: Its Meaning and Content for Today’s Business Research. Elsevier:Performance Measurement Special Issue, 58(7), 605–620.
Franco-Santos, M., Kennerley, M. M., Pietro, M., Veronica, M., Steve, M., Bernard, G., & Dina, N. A. (2007). Towards A Definition of a Business Performance Measurement System. International Journal of Operations & Production Management, 27(I8), 784–801.
Ghana Standards Authority, GSA Standards Work Programme Bulletin. Available fromhttp://www.gsa.gov.gh/wp-content/uploads/2016/02/GHANA-STANDARDS-AUTHORITY-WORK-PROGRAMME-20161.pdf. Accessed 13 October 2016.
Ghana Statistical Service (2015), National Employment Report, Available at: www.statsghana.gov.gh/docfiles/IBES_Questionnaires/IBES%201%20reports/NATIONAL%20EMPLOYMENT%20REPORT_FINAL%20%2024-5-16.pdf
International Monetary Fund (2014). IMF Survey : High Twin Deficits Pose Risks to Ghana’s Growth Outlook. Available from http://www.imf.org/external/pubs/ft/survey/so/2014/car050714a.htm. Accessed 13 October 2016.
International Monetary Fund (2014). IMF: Article IV. Available from http://www.imf.org/external/pubs/ft/scr/2014/cr14129.pdf. Accessed 13 October 2016.

SME COMPETITIVENESS IN GHANA
46 OCE-16-27.E
International Monetary Fund (2016). IMF: Article IV, Third Review. Available from http://www.imf.org/external/pubs/ft/scr/2016/cr16321.pdf. Accessed 13 October 2016.
International Telecommunications Union. (2016). Measuring the information Society.
International Trade Centre (2015). SME Competitiveness Outlook: Connect, compete and change for inclusive growth. Geneva. ISBN 978-92-9137-428-1.
International Trade Centre (2015). SME Competitiveness Outlook: Meeting the standards for trade.Geneva. ISBN 978-92-9137-441-0.
International Trade Centre (2016). Trade Map Database. Available fromhttp://www.trademap.org. Accessed 13 October 2016.
Johne, A., & Davies, R. (2002). Innovation in Medium-sized Oil Companies: How Marketing Adds Value. International Journal of Bank Marketing, 18(1).
Manson, Hernan, and Lopez-Montes, Antonio. “A multi-stakeholder governance framework for improved value chain support policies, food and nutrition security.” Workshop on Global Value Chains for Food and Nutrition Security, September 2014.
Ministry of Trade and Industry, Republic of Ghana. Ghana Industrial Policy.Available from http://moti.gov.gh/sites/default/files/content/documents/files/Industrial%20Policy.pdf.Accessed 13 October 2016.
Ofei, Kwadwo Ansah. "Terms and access to credit: Perceptions of SME/entrepreneurs in Ghana." International Conference on Ghana at the Half Century, July. Vol. 18. 2004.
Osei-Assibey, E., Bokpin, G. A., & Twerefou, D. K. (2012). Microenterprise financing preference: Testing POH within the context of Ghana’s rural financial market. Journal of Economic Studies (Glasgow, Scotland), 39(1), 84–105.
Oxford Business Group (2014). The Report: Ghana. Available fromhttps://books.google.ch/books?id=TwjUCwAAQBAJ. Accessed 13 October 2016.
Sowah, N. K. (1991), Monetary Control in Ghana: 1957-1988, ODI Working Paper, No. 45. London: Routledge.
United Nations Conference on Trade and development (2011): World Investment Report. Available fromhttp://unctad.org/en/PublicationsLibrary/wir2011_en.pdf. Accessed 13 October 2016.
World Bank (2013). Ghana Country Profile. Available from: http://www.enterprisesurveys.org/~/media/GIAWB/EnterpriseSurveys/Documents/Profiles/English/ghana-2013.pdf
World Bank (2016). Doing Business 2016: Measuring Regulatory Quality and Efficiency. Washington, DC: World Bank. DOI: http://dx.doi.org/10.1596/978-1-4648-0667-4. License: Creative Commons Attribution CCBY 3.0 IGO
World Trade Organization (2014). Trade Policy Review Ghana. WT/TPR/S/298

organization established to promote the responsible management of the world´s forests.
Printed by ITC Digital Printing Service on FSC paper, which is environmentally-friendly paper (without chlorine) using vegetable-based inks. The printed matter is recyclable.
A free pdf is available on ITC’s website at: www.intracen.org/publications

Street addressInternational Trade Centre54-56 Rue de Montbrillant1202 Geneva, Switzerland
P: +41 22 730 0111F: +41 22 733 4439E: [email protected]
Postal addressInternational Trade CentrePalais des Nations1211 Geneva 10, Switzerland
The International Trade Centre (ITC) is the joint agency of the World Trade Organization and the United Nations.