smbe 2015: rapid identification of phylogenetically informative data from next-gen sequencing
TRANSCRIPT

Rapid identification of phylogenetically informative
data from next-gen sequencing
Rachel Schwartz
The Biodesign Institute
Arizona State University
July 16, 2015

Big data for phylogenetics

Phylogenomics requires a lot of time and money

SISRS: Site Identification from Short Read Sequences

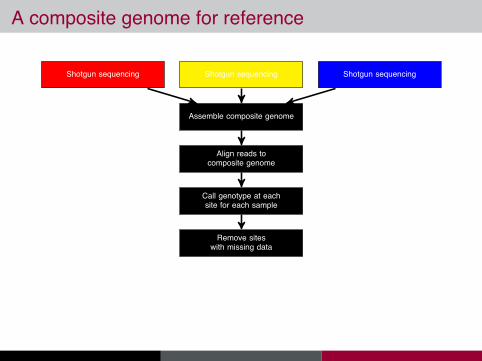
A composite genome for reference
Shotgun sequencingShotgun sequencing Shotgun sequencing
Assemble composite genome

A composite genome for reference

A composite genome for reference
Shotgun sequencingShotgun sequencing Shotgun sequencing
Assemble composite genome
Align reads tocomposite genome

A composite genome for reference
Shotgun sequencingShotgun sequencing Shotgun sequencing
Assemble composite genome
Align reads tocomposite genome
Call genotype at eachsite for each sample
A composite genome for reference
Shotgun sequencingShotgun sequencing Shotgun sequencing
Assemble composite genome
Align reads tocomposite genome
Call genotype at eachsite for each sample
Remove siteswith missing data

A composite genome for reference
Shotgun sequencingShotgun sequencing Shotgun sequencing
Assemble composite genome
Align reads tocomposite genome
Call genotype at eachsite for each sample
Remove siteswith missing data
Output alignment

Simulations
A
B
C
D
E
F
G
H
Ladder
trees
Equal branch length
A
B
C
D
E
F
G
H
Long deep branches
A
B
C
D
E
F
G
H
Short deep branches
A
B
C
D
E
F
G
H
Bala
nced tre
es
A
B
C
D
E
F
G
H
A
B
C
D
E
F
G
H

Simulation Results: 1 million bp genome
A
B
C
D
E
F
G
H
La
dd
er
tre
es
Equal branch length
A
B
C
D
E
F
G
H
Long deep branches
A
B
C
D
E
F
G
H
Short deep branches
A
B
C
D
E
F
G
H
Ba
lan
ce
d t
ree
s
A
B
C
D
E
F
G
H
A
B
C
D
E
F
G
H
Coverage
Nu
mb
er
of
co
rre
ct
ma
pp
able
site
s
1
10
100
1000
10000
100000
1 2 4 8 10 20 50
●
●
●
● ● ● ●
Slow genesFast genes
●
Schwartz et al. (2015) BMC Bioinformatics

Simulation Results: by depth
Coverage
Num
ber
of c
orre
ct m
appa
ble
site
s
1
10
100
1000
10000
100000
1 2 4 8 10 20 50
●
●
●
● ● ● ●
●
●
●●
● ●
A
B
C
D
E
F
G
H
La
dd
er
tre
es
Equal branch length
A
B
C
D
E
F
G
H
Long deep branches
A
B
C
D
E
F
G
H
Short deep branches
A
B
C
D
E
F
G
H
Ba
lan
ce
d t
ree
s
A
B
C
D
E
F
G
H
A
B
C
D
E
F
G
H© Depth 1
4 Depth 2
� Depth 3
N Depth 4
∗ Depth 5• Depth 6
Schwartz et al. (2015) BMC Bioinformatics
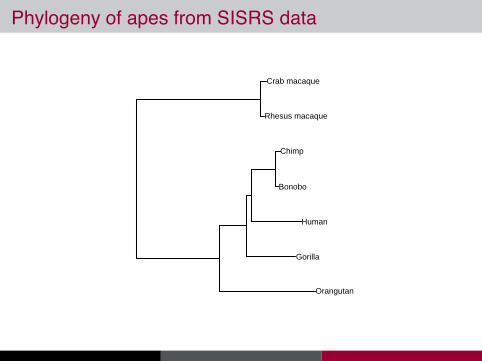
Phylogeny of apes from SISRS data
Bonobo
Human
Gorilla
Orangutan
Rhesus macaque
Crab macaque
Chimp

Phylogeny of mammals from SISRS data
treeshrew
horse
pig
cow
toothed whale
baleen whale
pangolin
dog
cat
bat
megabat
shrew
star nosed mole
aardvark
tenrec
elephant shrew
manatee
elephant
sloth
armadillo
opossum
wallaby
rabbit
pika
rat
mouse
colugo
lemur
human
macaque
100
90
100
91
61
100
100
100
100
100
86
51
100
100
100
100
100
100
100
100
72
100
100
100
100
100
100
Schwartz et al. (2015) BMC Bioinformatics

Phylogeny of mammals from SISRS data
colugo
sn mole
shrew
horse
pig
cow
baleenwhale
toothedwhale
pangolin
dog
cat
bat
megabat
aardvark
tenrec
e shrew
elephant
manatee
opossum
wallaby
sloth
armadillo
treeshrew
rat
mouse
rabbit
pika
lemur
human
macaque
100
60
100
100100
100
100
100
100
100
53
100
100100
100100
100
100
99
100100
75
100
100
100
100
treeshrew
horse
pig
cow
toothedwhale
baleenwhale
pangolin
dog
cat
bat
megabat
shrew
sn mole
aardvark
tenrec
e shrew
manatee
elephant
sloth
armadillo
opossum
wallaby
rabbit
pika
rat
mouse
colugo
lemur
human
macaque
100
90
100
9161
100
100
100
100
100
86
51
100
100100
100100
100
100
100
72
100
100100
100
100
100
lemur
colugo
bat
megabat
horse
pig
cow
toothedwhale
baleenwhale
pangolin
dog
cat
sn mole
shrew
manatee
elephant
tenrec
aardvark
e shrew
wallaby
opossum
armadillo
sloth
treeshrew
rabbit
pika
rat
mouse
human
macaque
100
100
6162
61
100
100
100
100
100
87
80
100
100100
100100
100
100
100
100100
92
100
100
100
100
Schwartz et al. (2015) BMC Bioinformatics

Phylogeny of mammals from SISRS data
OpossumWallabyaardvarkG
armadillo
baleenwhaleG
bat
cat
colugoG
cow
dog
elephant
eshrewG
horse
human
lemurmacaque
manateeG
megabatG
mouse
pangolinG
pig
pikarabbit
ratT
shrew
slothG
sn moleG
tenrecG
toothedwhale
treeshrew

Phylogenies of angiosperms from SISRS data
●
●
●●
●
●
●
●
● ●
●
●
●
●
●
●
●
●
●
●
●
●
●
●
●
●
●
●
●
●
●
●
●
●
●
●
●
●
●●
●
●
●
●
●
●
●
●
●
●
●
●
●
●
●
●
●
●
●
●
●
●
●
●
●
●
50
75
100
125
20 40 60Number of Gaps Allowed At A Site
Rob
inso
n−F
ould
s D
ista
nce
●
●
Distance
Nodes In Tree
Comparing Trees Generated With Varying Amounts of Missing Data
Adam Orr

SISRS rapidly identifies phylogenetically informativedata from next-gen sequencing reads
I Apes: 3 days
I Mammals: 7 days
I Leishmania: 12 hours
No reference genome is required.
Minimal assembly required (completely automated).
Results are comparable to slower, labor-intensive methods.

Divergence dating

Branch length estimationT5
T4
T2
T1
T8
T3
T6
T7
T9
T8
T4
T1
T2
T7
T6
T9
T5
T3
T9
T7
T6
T3
T8
T1
T2
T4
T5
T5
T4
T2
T1
T8
T3
T6
T7
T9
T8
T4
T1
T2
T7
T6
T9
T5
T3
T9
T7
T6
T3
T8
T1
T2
T4
T5
Tree height = 1
●
●●
●● ●
●●●
●●
●
●
●
●●●
●
●
●
●
●
●
●
●
●
●
●
●
●
●
●
●
●
●
●
●
●
●
●
●
●
●
●
●
●
●
●
●
●
●
●
●
●
●●
●
●
●
●
●
●
●●●
●
●
●●
●
●
●
●
●
●
●
●
●
●
●
●
●
●
●
●
●
●
●
●
●
●
●
●
●
●
●
●
●●
●
●●
0.0 0.2 0.4 0.6 0.8 1.0
0.0
0.2
0.4
0.6
0.8
1.0
Simulated branch length
Est
imat
ed b
ranc
h le
ngth

Branch length estimationT5
T4
T2
T1
T8
T3
T6
T7
T9
T8
T4
T1
T2
T7
T6
T9
T5
T3
T9
T7
T6
T3
T8
T1
T2
T4
T5
T5
T4
T2
T1
T8
T3
T6
T7
T9
T8
T4
T1
T2
T7
T6
T9
T5
T3
T9
T7
T6
T3
T8
T1
T2
T4
T5
Height = Sim height
●●●
●●●●●●●●
●
●●
●●●
●
●●●●
●
●
●
●●●
●
●●
●
●●
●
●
●
●
●
●
●
●
●
●
●
●
●
●
●
●
●
●
●●
●●●
●
●●
●
●
●●●
●
●
●●●●
●
●●●●●●●●●
●●
●●●
●
●
●
●
●
●
●
●
●
●
●
●●
●
●●
0.0 0.1 0.2 0.3 0.4 0.5 0.6
0.0
0.1
0.2
0.3
0.4
0.5
0.6
Simulated branch length
Est
imat
ed b
ranc
h le
ngth

Branch length estimation: most variable loci
●●●
●
●●●
●●●
●●●
●
●
●
●
0.0 0.1 0.2 0.3 0.4 0.5 0.6
0.0
0.1
0.2
0.3
0.4
0.5
0.6
Simulated branch length
Est
imat
ed b
ranc
h le
ngth
Slope / Cor / Max Brlen2.06 1 0.031.3 0.99 0.050.7 0.99 0.080.29 1 0.280.24 0.93 0.290.21 0.61 0.52

Branch length estimation: most conserved loci
●●●
●
●●●●●●●●●●●●●
0.0 0.1 0.2 0.3 0.4 0.5 0.6
0.0
0.1
0.2
0.3
0.4
0.5
0.6
Simulated branch length
Est
imat
ed b
ranc
h le
ngth
Slope / Cor / Max Brlen0.85 0.72 0.030.73 0.96 0.050.73 0.9 0.080.3 0.97 0.280.19 0.58 0.290.17 0.78 0.52

Conclusions
SISRS rapidly identifies data for phylogenetics fromnext-gen sequencing reads
Different (SISRS) data = alternative topologies
Use SISRS data to estimate branch lengths anddivergence dates accurately

Acknowledgements
Co-authors / Collaborators
I Reed Cartwright (ASU)
I Kelly Harkins (ASU and
UCSC)
I Anne Stone (ASU)
I Kael Dai (ASU)
I Adam Orr (ASU)
I Mike Miller (Villanova)
Funding
I NSF DBI-1356548
I NIH R01-GM101352-01A1
I NSF DDIG BCS-1232582
I ASU Startup Funds
SISRS is available athttps://github.com/rachelss/SISRS