smartquotes insurance research 2013
DESCRIPTION
Results of a survey of Irish consumers about drivers of insurance purchasing for Smartquotes. Further details here: http://www.smartquotes.ie/blog/TRANSCRIPT

Smartquotes Omnibus Research
A Presentation Prepared For smartquotes.ie
March 2013
By
MMCL/MG
S12-249

2
Research Methodology
Sample Profile
MAIN FINDINGS:
SECTION 1: Household Income
SECTION 2: Switching and Cancelation of Financial Products
SECTION 3: Household Charge
Table of Contents

3
A number of questions were placed on the Amárach Research March Omnibus to investigate trends in switching and cancellation of financial products. Additionally questions were also asked in relation to the Household charge which is being introduced in 2013. The omnibus survey is a syndicated survey whereby clients can include questions within the survey. A total sample of 1,018 was achieved with quotas set on gender, age, social class and region to achieve a sample aligned with national population. Due to the high proliferation of the internet among the Irish population, the Amárach Research omnibus is completed fully online. Interviewing fieldwork dates were March 15th – 22nd.
Research Methodology

4
Sample Profile
Male
Gender Age Social Class Region
% % % %
Female
15-24
35-44
45+
ABC1 F50+
C2DE F50-
Dublin
Rest of Leinster
Munster
Conn/ Ulster
25-34
(Base: All respondents - 1018)
55+

MAIN FINDINGS

SECTION 1: Household
Income

7
Household Financial Responsibility
Mainly
Responsible
Not
Responsible
Jointly
Responsible
Q: Are you responsible for managing the
finances of your household?
% €1 to €1000
€1001 to €2000
€2001 to €3000
€3001 to €4000
€4001 to €5000
€5001+
Don’t know
Refused
10
24
18
7
6
4
16
14
Q: What is your current monthly household
income after tax?
Responsibility of respondent in relation to managing finances
Current monthly household income after Tax
(Base: All respondents – 1018)
%
(Base: All responsible for
managing finances – 930)

8
Drop in Household Income before Unable to
Meet Bills
Monthly Household Income
After Tax Total
*€1-
1000
€1001
-2000
€2001
-3000
*€3001
-4000
*€4001
-5000 *€5001+
Don’t
know
Refuse
d
Base 930 92 227 167 65 58 37 151 138
€1 to €50 drop in monthly income 24% 54% 29% 14% 19% 3% 11% 26% 19%
€51 to €100 drop in monthly income 21% 23% 24% 22% 5% 15% 15% 22% 24%
€101 to €150 drop in monthly income 17% 14% 19% 19% 17% 13% 5% 20% 12%
€151 to €200 drop in monthly income 12% 5% 12% 13% 12% 17% 10% 12% 15%
€201 to €300 drop in monthly income 9% 3% 7% 13% 10% 12% 8% 8% 12%
€301+ drop in monthly income 17% 0% 10% 19% 37% 39% 50% 12% 17%
Q: By how much would your monthly household income after tax have to fall before you would be unable to meet your
normal bills?
* Denotes small base size.
9
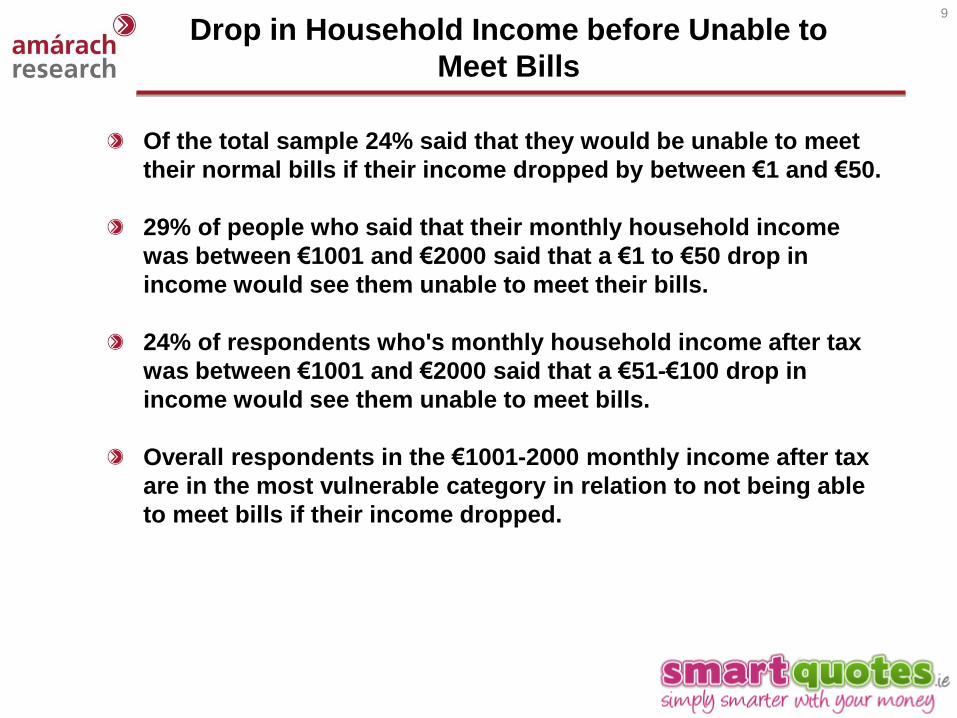
Of the total sample 24% said that they would be unable to meet
their normal bills if their income dropped by between €1 and €50.
29% of people who said that their monthly household income
was between €1001 and €2000 said that a €1 to €50 drop in
income would see them unable to meet their bills.
24% of respondents who's monthly household income after tax
was between €1001 and €2000 said that a €51-€100 drop in
income would see them unable to meet bills.
Overall respondents in the €1001-2000 monthly income after tax
are in the most vulnerable category in relation to not being able
to meet bills if their income dropped.
Drop in Household Income before Unable to
Meet Bills

SECTION 2:
Switching and Cancellation
of Financial Products

11
Financial Products – I
%
Car insurance
Home insurance
Health insurance
Life insurance
Mortgage protection
Pension contributions
Income protection
I hold no financial products
Q: Which of these financial products do you have?
(Base: All respondents – 1018)
% that have
cancelled
financial product
in past 12
months Car insurance 10% 10%
Home insurance 42% 7%
Health insurance 56% 19%
Life insurance 62% 9%
Mortgage protection 79% 3%
Pension contributions 82% 7%
Income protection 91% 5%
Products Held
(Base: Don’t have each financial
product)
Cancelled in past 12 months
Q: Have you cancelled any of these financial services in
the past 12 months?
% that do not have
financial product
mentioned

12
Financial Products – II
%
Car insurance
Home insurance
Health insurance
*Income protection
Life insurance
Mortgage protection
Pension
(Base: Those who held each
financial product - 894)
Switched Financial Products in past 12 months
%
Health insurance
Home insurance
Car insurance
Life insurance
Other
Downgrading of financial products
Q: Have you switched provider on any of these financial
services in the past 12 months ?
Q: Have you downgraded any of the following financial
policies in the past 12 months?
Other = mortgage protection, income protection and pension contributions
*Denotes small base
(Base: Those who held each
financial product - 894)

13
Why are Products being Cancelled? – I
%
No longer afford it
Other expenses were
more important
It was a product I
could do without
Bad experience with
provider
Q: Why did you cancel <insert financial product>?
(Base: All who cancelled
health insurance – 110)
Health Insurance
(Base: All who cancelled
pension contributions – 63)
(Base: All who cancelled life
insurance - 53)
Pension Contributions
Life Insurance
%
No longer afford it
Other expenses were
more important
Bad experience with
provider
It was a product I
could do without
%
No longer afford it
Other expenses were
more important
It was a product I
could do without
Bad experience with
provider

14
Why are Products being Cancelled? – II
%
No longer afford it
Other expenses were
more important
It was a product I
could do without
Bad experience with
provider
Q: Why did you cancel <insert financial product>?
(Base: All who cancelled
income protection – 45)
Income Protection
(Base: All who cancelled home
insurance – 27)*
(Base: All who cancelled
Mortgage Protection - 26)*
Home Insurance Mortgage Protection
%
No longer afford it
Other expenses were
more important
Bad experience with
provider
It was a product I
could do without
%
No longer afford it
Other expenses were
more important
It was a product I
could do without
Bad experience with
provider
* Denotes low base

15
Why are People Switching Financial Products – I
%
Saved money by doing so
Had bad experience with
previous provider
It was recommended to me
by a family member
Had other policies with the
company I switched to
(Base: All who switched car
insurance – 344)
Car Insurance
%
(Base: All who switched home
insurance in last 12 months – 165)
Home Insurance
Saved money by doing so
Had bad experience with
previous provider
It was recommended to me
by a family member
Had other policies with the
company I switched to
Q: Why did you switch provider on <insert financial product> in
the past 12 months?

16
Why are People Switching Financial Products – II
%
Saved money by doing so
It was recommended to me
by a family member
Had bad experience with
previous provider
Had other policies with the
company I switched to
(Base: All who switched health insurance
provider in last 12 months – 87)
Health Insurance
%
(Base: All who switched Life
insurance in last 12 months – 45)
Life Insurance
Saved money by doing so
It was recommended to me
by a family member
Had bad experience with
previous provider
Had other policies with the
company I switched to
Q: Why did you switch provider on <insert financial product> in
the past 12 months?
* Base too low for mortgage protection and income protection

17
Why are People are Downgrading Financial
Products – I
%
I could no longer afford that
particular policy
Other expenses were more
important
It is a product that is not that
important to me
(Base: All who downgraded health
insurance – 135)
Health Insurance
%
(Base: All who switched Life
insurance in last 12 months – 45)
Home Insurance
I could no longer afford that
particular policy
Other expenses were more
important
Our house value has fallen
It was a product that is not
that important to me
Q: Why did you downgrade <insert financial product> in the last 12 months?
18
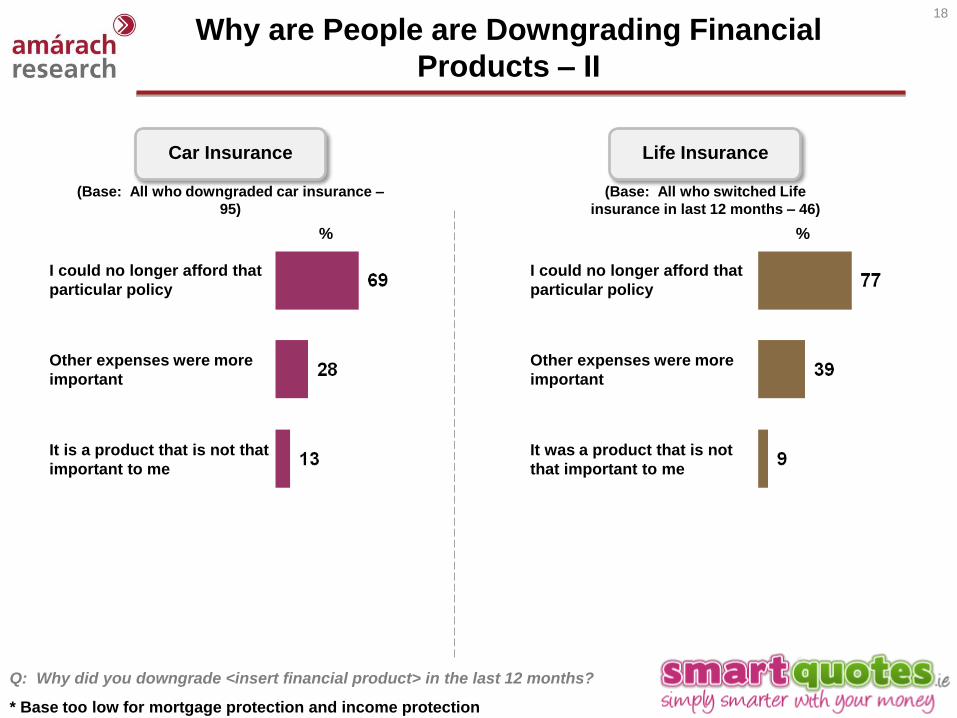
Why are People are Downgrading Financial
Products – II
%
I could no longer afford that
particular policy
Other expenses were more
important
It is a product that is not that
important to me
(Base: All who downgraded car insurance –
95)
Car Insurance
%
(Base: All who switched Life
insurance in last 12 months – 46)
Life Insurance
I could no longer afford that
particular policy
Other expenses were more
important
It was a product that is not
that important to me
Q: Why did you downgrade <insert financial product> in the last 12 months?
* Base too low for mortgage protection and income protection
19
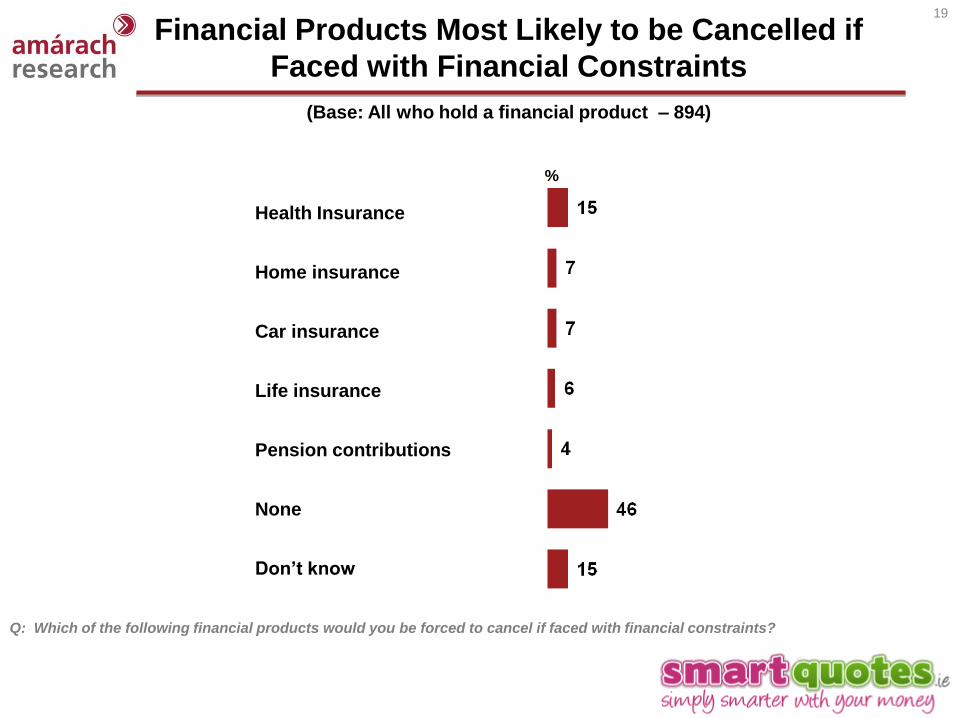
Financial Products Most Likely to be Cancelled if
Faced with Financial Constraints
%
Health Insurance
Home insurance
Car insurance
Life insurance
Pension contributions
None
Don’t know
Q: Which of the following financial products would you be forced to cancel if faced with financial constraints?
(Base: All who hold a financial product – 894)

SECTION 3: Household
Charge

21
Household Charge
Yes Don’t know
No
Q: Do you currently own the home that you
are living in?
%
€50-€100
€101-€200
€201-€300
€301-€400
€401-€500
€501-€1000
€101+
Don’t know
Owns
home
Q: How much do you think you will have to
pay in property tax in 2013?
Do you own your home?
Property tax
%
(Base: All respondents – 1018)
Own it
jointly
(Base: All who own home – 614)
