smartphone nano-colorimetry for on-demand lead detection
TRANSCRIPT
Smartphone nano-colorimetry for on-demand lead detection and quantitation in drinking water Hoang Nguyen,1 Yulung Sung,1 Kelly O’Shaughnessy,1 Xiaonan Shan,1 and Wei-Chuan Shih1-4,* 1Department of Electrical & Computer Engineering, 2Department of Biomedical Engineering, 3Program of Materials Science & Engineering, 4Department of Chemistry, University of Houston, 4800 Calhoun Rd, Houston TX 77204 *Corresponding author: [email protected]
ABSTRACT: Lead ions (Pb2+) contamination in drinking water, major source of lead poisoning to the general population, is typically detected by bulky and costly laboratory analytical instrument. A mobile analytical device for rapid Pb2+ sensing is a growing demand. Herein, we report smartphone nano-colorimetry (SNC) as a new technique to detect and quantify dissolved Pb2+ in drinking water. Specifically, we have employed a single-step sedimentation approach by mixing a controlled quantity of chromate ion (CrO42-) to react with Pb2+ containing solutions to form highly insoluble lead chromate (PbCrO4) nanoparticles as vivid yellow precipitates. This is followed by microscopic color detection and intensity quantitation at nanoscale level using dark-field smartphone microscopy. The sum of the intensity of yellow pixels bears a highly reproducible relationship with Pb2+ concentration between 1.37-175 ppb in deionized water, and 5-175 ppb in city tap water. On contrast to traditional colorimetric techniques analyzing bulk color changes, SNC achieves unparalleled sensitivity by combining nano-colorimetry with dark-field microscopy and mobilized the metal ions detection by integrating the detection into the smartphone microscope platform. SNC is rapid, low-cost, and has the potential to enable individual citizens to examine Pb2+ content in drinking water on-demand in virtually any environmental setting.
Lead exposure represents a serious health concern and has been linked to neurological disorders, particularly in children, and increases the risk to the fetus during pregnancy.[1, 2] Although lead-based products have been banned for residential uses in the United States since 1978, lead can still be found in various items such as water pipes, paints, ceramic and pottery glazing, canned foods, toys, cosmetics, and retail products to this day.[3-9] Most notably, lead contamination in municipal water sources has been of serious concern in the recent crisis in Flint, Michigan in 2014. [10] The EPA standard requires Pb2+ contaminations to be
below 15 ppb in drinking water, which can be detected using analytical methods such as atomic absorption spectroscopy, inductively coupled plasma, and anodic stripping voltammetry.[11-14] However, these methods involve costly instruments, labor-intensive sample collection and preparation, time-consuming processes and highly skilled personnel, leading to a significant lack of efficiency and an inadequate amount of testing performed. A daily-mobile, accurate and reproducible Pb2+ ion detection technique has the potential to improve water safety at the end-user level. Handheld devices for Pb2+ detection in water based on electrochemical methods are commercially available, but not widely adopted because of their high detection limit. Smartphones offer an attractive platform for analytical devices in areas such as diagnostics and environmental monitoring.[15, 16] Most of the analytical approaches on the smartphone are based on colorimetry and imaging of macroscopic features since smartphone cameras are an excellent color imaging sensor.[17-20] This type of “bulk” sampling approach fundamentally limits the detection sensitivity of smartphone colorimetry because
any observable color feature, when imaged, must be at least comparable to the size of a single pixel on the camera sensor or the imaging system’s diffraction limit, whichever is larger. For a standard smartphone, the camera is designed for imaging at a minimum distance of 5-10 cm, and the smallest imaging area equivalent to a single pixel is ~14 µm. However, the achievable resolution is ~80 µm according to standard resolution targets.[25] Digital zooming cannot improve physical resolution.[21] The uses of smartphone cameras can be further extended through the addition of attachable accessories. Recent innovations such as the lens attachment device and inkjet-printed lens “sticker” have effectively turned a smartphone camera into a pocket microscope. Operating in the dark-field imaging mode, we and others have shown that smartphone microscopes are capable of detecting nanoscale objects.[22-25] Amid the excitement surrounding smartphone microscopes, however, its microscopic imaging capability has not yet been exploited for the sensing and quantification of Pb2+ or other heavy metal ion contaminants in drinking water. To harness the highly sensitive detection capability of
our smartphone microscope, we report smartphone nano-colorimetry (SNC) as a mobile, low-cost and easy to use method to detect and quantify Pb2+ ions in water. Specifically, we have employed a single-step sedimentation approach by mixing a controlled quantity of chromate ions (CrO42-) with Pb2+ ion containing solutions to form lead chromate (PbCrO4) nanoparticles as vivid yellow precipitates, performed the color detection and intensity quantitation by dark-field smartphone microscope.

1. EXPERIMENTAL SECTION Chemicals. Potassium chromate (K2CrO4, 100 ppm)
stock solution was obtained by adding 1 g of K2CrO4 (Sigma-Aldrich, ACS reagent grade) in 10 ml of deionized (DI) water and stirred for 10 min. Ten aliquots of lead ion solutions, varying from 1.37 ppb to 175 ppb, were prepared by diluting lead nitrate (Pb(NO3)2, Sigma-Aldrich, ACS reagent grade) aqueous solution with DI water. Due to the harmful effect of inhaled or swallowed lead compounds to humans, protective equipment such as a face mask, rubber gloves, and lab coat has been used during chemical preparation to minimize the chance of exposure. Samples were prepared in a fume hood and stored in tightly closed containers prior to use. Dark-field smartphone microscope. To image the
sedimentation product, we have engineered a self-contained smartphone microscope that can operate in both fluorescence and dark-field imaging modes. Details of the design and implementation of our microscope have been open-sourced for DIY. The imaging performance has been fully characterized for various tasks. As shown in Figure 1a, an inexpensive smartphone (Lumina 640) with an 8 MP camera (f2.2 aperture; ¼” sensor) was used in conjunction with an inkjet-printed objective lens.23 3D-printed components shown in Figure 1a were employed to provide the required dark-field condition. Briefly, a LED-integrated slide holder for launching the illumination light directly into one side of a standard microscope glass slide. Due to total internal reflection, the LED illumination is confined within the glass slide when its surfaces are clean. The sediments on the glass slide, however, can evanescently couple light out of the slide. The out-going light can then be magnified by the inkjet-printed objective lens and imaged by the smartphone camera. In this way, the complexity of a typical dark field microscope set up is dramatically reduced. The camera settings were: white balance fixed at sunny to avoid color temperature variation; focus fixed to work at the closest distance, ISO fixed to a minimum of 64 to maximize SNR and color accuracy, and the shutter speed adjusted within the range of 1-4 seconds. In our experiments, typically at low lead concentration, the optimal exposure time was 4 seconds. Sample preparation. Five µl of Pb2+ solutions with
different concentrations from 1.37-175 ppb were added to a plastic centrifuge tube and mixed with an equal volume of K2CrO4 solution (100 ppm). The mixture was mixed thoroughly using a vortex mixer (SCILOGEX MX-F) for 30 s and an aliquot of 0.5 µl was then pipetted onto a Polydimethylsiloxane (PDMS) slab attached to a glass slide. After the sample naturally dried within 5-10 minutes, 0.5 µl of deionized (DI) water was pipetted onto the dry spot to rinse off the highly soluble K2CrO4 compound. The remaining yellow sediment on the PDMS/glass slide was imaged for analysis (Figure 1b).
Figure 1. a) Exploded diagram of the smartphone microscope. Focus with the smartphone microscope is achieved by rotating the sample stage to adjust the distance between the glass slide and the lens; b) Procedure for imaging PbCrO4 sediment in aqueous solution using dark field smartphone microscope.
Imaging technique. Four images were taken for analysis as shown in Figure 2a-d: The original PDMS/glass slide (background, Figure 2a), after the solution droplet was dropped (droplet, Figure 2b) for choosing region of interest (ROI) and removal of interferences, after the solution droplet completely dried (pre-rinse, Figure 2c) for comparison, and after rinsing the dried sample with additional DI water (post-rinse, Figure 2d). Since the sedimentation of PbCrO4 is confined inside the solution droplet, the analytical area is dictated by the size of the droplet. A ROI as. a ~800x800 μm2 square containing the entire droplet (Figure 2b) was selected. The rinsing step was performed to remove the highly soluble K2CrO4 with only the insoluble PbCrO4 left on the PDMS surface as shown in Figure 2c-d. To analyze Pb2+ concentration, the background image was subtracted from the post-rinse image (Figure 2e). The final image (Figure 2f) only contained the yellow PbCrO4 sediment for image processing.
2. RESULTS AND DISCUSSIONS
Lead ion detection and concentration determination in DI water. Following the procedures

described in the Experimental section, DI water samples spiked with various amount of Pb2+ ions have been measured by our dark field smartphone microscope as shown in Figure 1a. Briefly, light is launched and propagated inside a standard microscopic slide from an array of light emitting-diodes mounted on the side of the slide via total internal reflection (TIR). Propagating light can couple out of the slide surface when it in contact with targeted specimens, and be collected by the injected-printed PDMS lens attached on the smartphone camera for imaging.23 The results shown in Figure 3a suggests that the 15 ppb EPA standard for Pb2+ contaminant can be easily achieved. The microscopy imaging capability is essential since there is minute quantity of sediment for detection. As a comparison, PbCrO4 images were taken with the same smartphone camera without the inkjet-printed sticker lens, or the objective lens, as shown in Figure 3b. In that case, the smartphone needed to be placed at least 50 mm away from the sample, which was ineffective in collecting the scattered light from the sample. More importantly, the smartphone camera did not have the resolution to image the fine details from the region of interest (ROI) without the magnification provided by the objective lens. Therefore, without the microscopy imaging capability, the yellow color of PbCrO4 sediment was only detected at concentrations above 35000 ppb (Figure 1b). To validate that only PbCrO4 remained on the PDMS surface after rinsing, Raman spectroscopy was used to provide molecular fingerprints of sediments from the sample before and after rinsing. Figure 3c shows the Raman spectra of PbNO3, K2CrO4, PbCrO4, the pre-rinse sample, and the post-rinse sample.[26-28] Both signature Raman peaks of K2CrO4 and PbCrO4 appeared in the pre-rinsed spectrum. The intensity of PbCrO4 signature peaks was lower than those of K2CrO4 due to the excess amount of K2CrO4 used to completely convert Pb2+ to PbCrO4. The rinsing step effectively removed the highly soluble K2CrO4, as indicated by the disappearance of the K2CrO4 Raman peaks in the post-rinse spectrum.
Figure 2. a) Clean PDMS surface (background); b) after the solution droplet was dropped used to identify the ROI
(red square); c) after the sample solution dried (pre-rinse) for comparison; d) after rinsing off the excess sediments (post-rinse); e) Background subtracted image still contains several interferences due to the displacement of the sample stage and smartphone camera caused by sample pipetting and rising steps; f) ROI image only contains the yellow PbCrO4 sediment; all the scale bars are 200 μm. Green circles in e) highlight the remaining interferences after background subtraction.
Figure 3. a) PbCrO4 sediment imaged by dark-field smartphone microscope with Pb2+ concentration ranging from 1.375-350 ppb. The brightness and contrast of the PbCrO4 sediment images at Pb2+ concentration of 1.375-2.75 ppb was adjusted for display purpose; b) PbCrO4 sediment taken by the same smartphone without the objective lens. The yellow color of PbCrO4 can only be detected at a concentration above 35000 ppb. The images are highly blurred compared to the microscopy images; c) Raman spectra of PbNO3, K2CrO4, PbCrO4, pre-rinse sample and post-rinse sample. The Raman peaks intensity of pre-rinse and post-rinse samples was multiplied 10 times for display purpose. All scale bars are 200 μm.
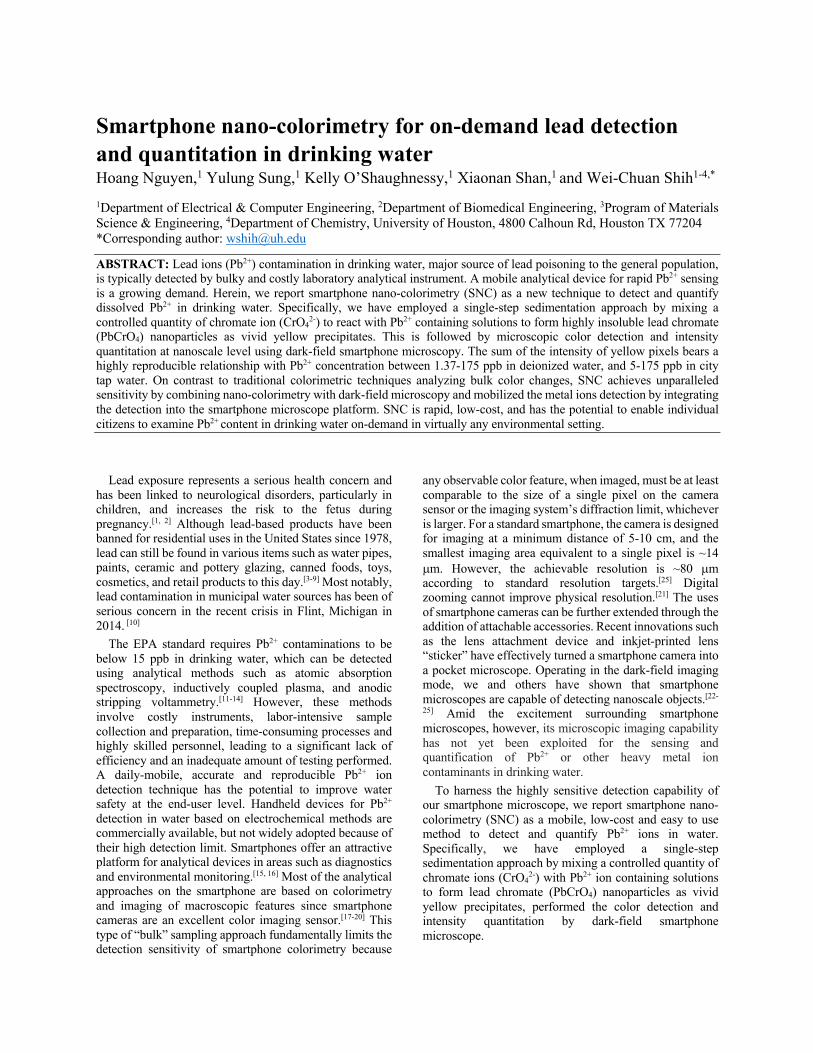
To assess the physical size of the detected sediment, we have compared the smartphone images with those obtained using scanning electron microscopy (SEM) in Figure 4.
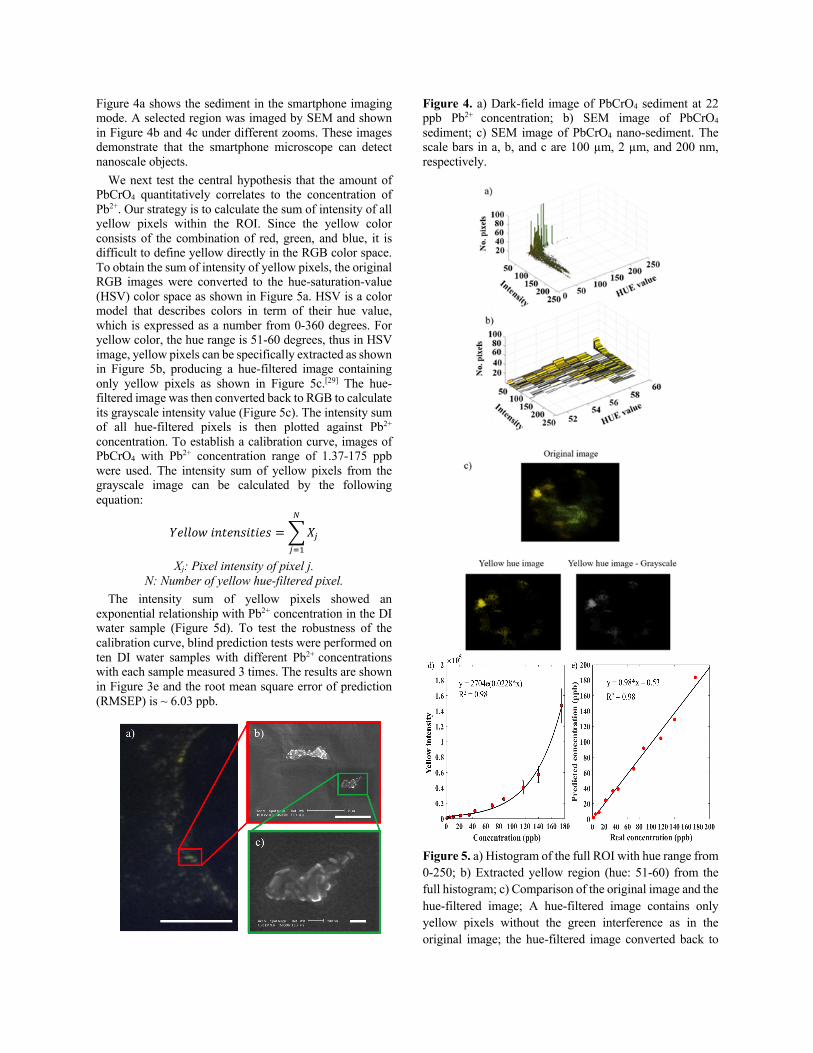
Figure 4a shows the sediment in the smartphone imaging mode. A selected region was imaged by SEM and shown in Figure 4b and 4c under different zooms. These images demonstrate that the smartphone microscope can detect nanoscale objects. We next test the central hypothesis that the amount of
PbCrO4 quantitatively correlates to the concentration of Pb2+. Our strategy is to calculate the sum of intensity of all yellow pixels within the ROI. Since the yellow color consists of the combination of red, green, and blue, it is difficult to define yellow directly in the RGB color space. To obtain the sum of intensity of yellow pixels, the original RGB images were converted to the hue-saturation-value (HSV) color space as shown in Figure 5a. HSV is a color model that describes colors in term of their hue value, which is expressed as a number from 0-360 degrees. For yellow color, the hue range is 51-60 degrees, thus in HSV image, yellow pixels can be specifically extracted as shown in Figure 5b, producing a hue-filtered image containing only yellow pixels as shown in Figure 5c.[29] The hue-filtered image was then converted back to RGB to calculate its grayscale intensity value (Figure 5c). The intensity sum of all hue-filtered pixels is then plotted against Pb2+ concentration. To establish a calibration curve, images of PbCrO4 with Pb2+ concentration range of 1.37-175 ppb were used. The intensity sum of yellow pixels from the grayscale image can be calculated by the following equation:
𝑌𝑒𝑙𝑙𝑜𝑤𝑖𝑛𝑡𝑒𝑛𝑠𝑖𝑡𝑖𝑒𝑠 =,𝑋.
/
.01
Xj: Pixel intensity of pixel j. N: Number of yellow hue-filtered pixel.
The intensity sum of yellow pixels showed an exponential relationship with Pb2+ concentration in the DI water sample (Figure 5d). To test the robustness of the calibration curve, blind prediction tests were performed on ten DI water samples with different Pb2+ concentrations with each sample measured 3 times. The results are shown in Figure 3e and the root mean square error of prediction (RMSEP) is ~ 6.03 ppb.
Figure 4. a) Dark-field image of PbCrO4 sediment at 22 ppb Pb2+ concentration; b) SEM image of PbCrO4 sediment; c) SEM image of PbCrO4 nano-sediment. The scale bars in a, b, and c are 100 µm, 2 µm, and 200 nm, respectively.
Figure 5. a) Histogram of the full ROI with hue range from 0-250; b) Extracted yellow region (hue: 51-60) from the full histogram; c) Comparison of the original image and the hue-filtered image; A hue-filtered image contains only yellow pixels without the green interference as in the original image; the hue-filtered image converted back to
gray scale for intensity sum; d) Calibration curve of yellow pixel intensity vs. Pb2+ concentration with each sample measured three times; e) Blind prediction test on ten DI water samples spiked with Pb2+.
Lead ion detection and concentration determination in tap water. Tap water samples were collected on the University of Houston campus. Each sample was spiked with Pb2+ following the same procedure for the DI water samples. The drinking water quality report in Harris County indicated that the total hardness of water (CaCO3 concentration) can be up to 114 ppm.[30] CO32- is known to react with Pb2+ to form PbCO3, which has lower solubility constant (ksp = 7.4x10⁻¹⁴) than PbCrO4 (ksp = 2.3x10⁻¹³), thus may cause significant interference at low Pb2+ concentration. Indeed, initial results showed the yellow sediment of PbCrO4 can only be observed at high concentration (> 10000 ppb) due to a bright background from PbCO3 as well as the sedimentation of mineral content in tap water sample. Consequently, it is necessary to remove CO32- from the tap water sample to improve the detection limit of SNC. To accomplish this, diluted nitric acid (~15 mM) is added to the tap water samples (1:10 v/v) to convert CO32- ions to CO2 gas through the following reaction:
Following the same sample preparation described in
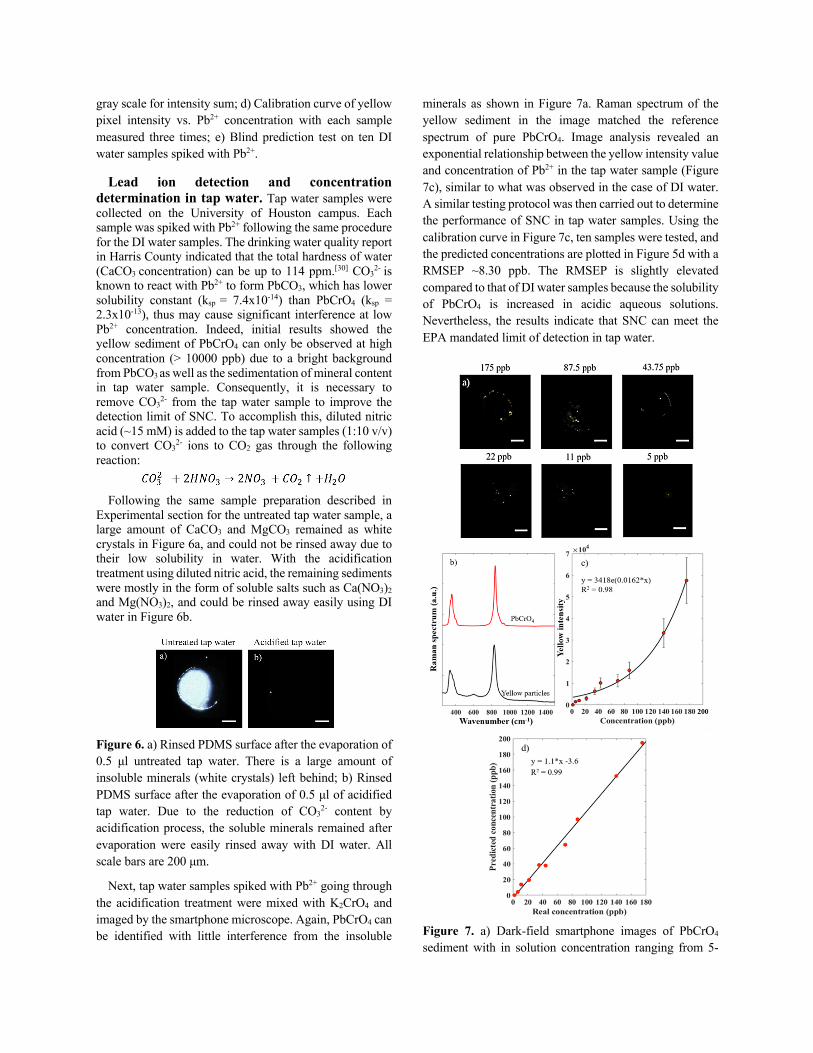
Experimental section for the untreated tap water sample, a large amount of CaCO3 and MgCO3 remained as white crystals in Figure 6a, and could not be rinsed away due to their low solubility in water. With the acidification treatment using diluted nitric acid, the remaining sediments were mostly in the form of soluble salts such as Ca(NO3)2 and Mg(NO3)2, and could be rinsed away easily using DI water in Figure 6b.
Figure 6. a) Rinsed PDMS surface after the evaporation of 0.5 μl untreated tap water. There is a large amount of insoluble minerals (white crystals) left behind; b) Rinsed PDMS surface after the evaporation of 0.5 μl of acidified tap water. Due to the reduction of CO32- content by acidification process, the soluble minerals remained after evaporation were easily rinsed away with DI water. All scale bars are 200 μm.
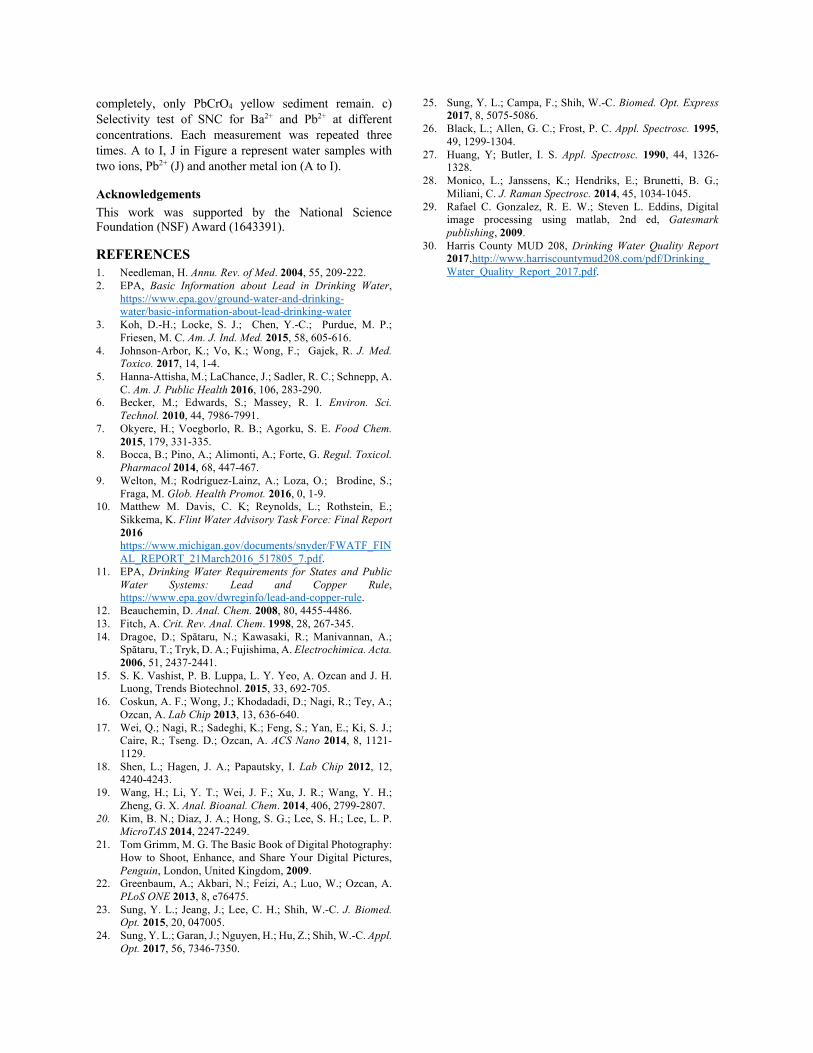
Next, tap water samples spiked with Pb2+ going through the acidification treatment were mixed with K2CrO4 and imaged by the smartphone microscope. Again, PbCrO4 can be identified with little interference from the insoluble
minerals as shown in Figure 7a. Raman spectrum of the yellow sediment in the image matched the reference spectrum of pure PbCrO4. Image analysis revealed an exponential relationship between the yellow intensity value and concentration of Pb2+ in the tap water sample (Figure 7c), similar to what was observed in the case of DI water. A similar testing protocol was then carried out to determine the performance of SNC in tap water samples. Using the calibration curve in Figure 7c, ten samples were tested, and the predicted concentrations are plotted in Figure 5d with a RMSEP ~8.30 ppb. The RMSEP is slightly elevated compared to that of DI water samples because the solubility of PbCrO4 is increased in acidic aqueous solutions. Nevertheless, the results indicate that SNC can meet the EPA mandated limit of detection in tap water.
Figure 7. a) Dark-field smartphone images of PbCrO4 sediment with in solution concentration ranging from 5-

175 ppb. The brightness and contrast of the PbCrO4 sediment images at Pb2+ concentration of 5 ppb was adjusted for display purpose; b) Raman spectrum of sediment match the reference spectrum of pure PbCrO4; c) Calibration curve of yellow pixel intensity vs. Pb2+ concentration in tap water samples with each sample measured three times. d) Blind prediction test on ten DI water samples spiked with Pb2+. All scale bars are 200 μm.
Selective detection of lead ions. To investigate how other metal ions could potentially interfere with lead quantification by SNC, we next perform a selectivity study involving 9 additional metal ions: Ni2+, Ca2+, Mn2+, Mg2+, Fe3+, Cu2+, Zn2+, Ba2+, and Ag+. First, pure solutions of these metal ions were prepared at 200 ppb and mixed with CrO42- ion following the same protocol described earlier. Next, 9 mixture solutions were prepared for each metal ion (200 ppb) with an equal concentration of Pb2+ (200 ppb). For the pure metal ion samples without Pb2+, yellow sediment was only observed from the Ba2+ sample after mixing with CrO42- as shown in Figure 8a (green bars). In contrast, with the presence of Pb2+ in solution, yellow sediments were observed in all mixture samples, and the intensity sum of yellow pixel was comparable with the control sample as shown in Figure 8a (yellow bars). These results are expected because most metal ions form water soluble products with CrO42- except for Cu2+, Ba2+, and Ag+. For Cu2+, the ksp of CuCrO4 is 3.6×10⁻⁶ mol2L-2 which is seven orders of magnitude higher than ksp of PbCrO4, thus CuCrO4 sediment cannot be formed at 200 ppb. The ksp of BaCrO4 and AgCrO4 are three orders and one order of magnitude higher than the ksp of PbCrO4, respectively. Therefore, at 200 ppb, Ba2+ and Ag+ can still react with CrO42- to form sediments. However, since the color of Ag2CrO4 is brown-red, it can be easily excluded by the HSV-filtering (Figure 8b). BaCrO4, on the other hand, has the same yellow color as PbCrO4, but the amount of BaCrO4 sediment formed at the 200 ppb was significantly less than that of the PbCrO4 sample. To further investigate the potential impact of Ba2+ cations on the detection selectivity of Pb2+, we performed a series of experiments with various Ba2+ and Pb2+ mixing ratios. As shown in Figure 8c, Ba2+ alone at 50 ppb did not produce any detectable sediment. Ba2+ alone at 100 ppb generated yellow intensity comparable to that generated by Pb2+ alone at 5 ppb. Consistent results were then obtained from three Pb2+/ Ba2+ mixture samples. These experimental results establish the high selectivity of SNC method for the detection of Pb2+ in water.
3. CONCLUSIONS In this paper, we report the detection and quantification
of lead ions in aqueous solutions through novel smartphone nano-colorimetry (SNC). We demonstrated that SNC can achieve the limit of detection set by the EPA for tap water. We further showed that SNC can quantify lead concentration within the range of 5-200 ppb. We have demonstrated the high selectivity of SNC against 9 metal ions. SNC is based on imaging micro- or nanoscale sediment of PbCrO4 using a dark-field smartphone microscope. The use of a smartphone microscope allows the entire device to be mobile and it can be quickly set up in any location for water quality testing. The time it takes from preparing the sample to final image processing is 10 minutes, which is quite reasonable for field applications.
Figure 8. a) Selectivity tests of SNC for different metal ion species (200 ppb). Each measurement was repeated three times. b) Top image: Yellow and brown-red sediments of PbCrO4 and Ag2CrO4 from sample contain both Pb2+ and Ag+ at 200 ppb; Bottom image: Red hue-filtered image showed that the sediment of Ag2CrO4 was removed
completely, only PbCrO4 yellow sediment remain. c) Selectivity test of SNC for Ba2+ and Pb2+ at different concentrations. Each measurement was repeated three times. A to I, J in Figure a represent water samples with two ions, Pb2+ (J) and another metal ion (A to I).
Acknowledgements This work was supported by the National Science Foundation (NSF) Award (1643391).
REFERENCES 1. Needleman, H. Annu. Rev. of Med. 2004, 55, 209-222. 2. EPA, Basic Information about Lead in Drinking Water,
https://www.epa.gov/ground-water-and-drinking-water/basic-information-about-lead-drinking-water
3. Koh, D.-H.; Locke, S. J.; Chen, Y.-C.; Purdue, M. P.; Friesen, M. C. Am. J. Ind. Med. 2015, 58, 605-616.
4. Johnson-Arbor, K.; Vo, K.; Wong, F.; Gajek, R. J. Med. Toxico. 2017, 14, 1-4.
5. Hanna-Attisha, M.; LaChance, J.; Sadler, R. C.; Schnepp, A. C. Am. J. Public Health 2016, 106, 283-290.
6. Becker, M.; Edwards, S.; Massey, R. I. Environ. Sci. Technol. 2010, 44, 7986-7991.
7. Okyere, H.; Voegborlo, R. B.; Agorku, S. E. Food Chem. 2015, 179, 331-335.
8. Bocca, B.; Pino, A.; Alimonti, A.; Forte, G. Regul. Toxicol. Pharmacol 2014, 68, 447-467.
9. Welton, M.; Rodriguez-Lainz, A.; Loza, O.; Brodine, S.; Fraga, M. Glob. Health Promot. 2016, 0, 1-9.
10. Matthew M. Davis, C. K; Reynolds, L.; Rothstein, E.; Sikkema, K. Flint Water Advisory Task Force: Final Report 2016 https://www.michigan.gov/documents/snyder/FWATF_FINAL_REPORT_21March2016_517805_7.pdf.
11. EPA, Drinking Water Requirements for States and Public Water Systems: Lead and Copper Rule, https://www.epa.gov/dwreginfo/lead-and-copper-rule.
12. Beauchemin, D. Anal. Chem. 2008, 80, 4455-4486. 13. Fitch, A. Crit. Rev. Anal. Chem. 1998, 28, 267-345. 14. Dragoe, D.; Spătaru, N.; Kawasaki, R.; Manivannan, A.;
Spătaru, T.; Tryk, D. A.; Fujishima, A. Electrochimica. Acta. 2006, 51, 2437-2441.
15. S. K. Vashist, P. B. Luppa, L. Y. Yeo, A. Ozcan and J. H. Luong, Trends Biotechnol. 2015, 33, 692-705.
16. Coskun, A. F.; Wong, J.; Khodadadi, D.; Nagi, R.; Tey, A.; Ozcan, A. Lab Chip 2013, 13, 636-640.
17. Wei, Q.; Nagi, R.; Sadeghi, K.; Feng, S.; Yan, E.; Ki, S. J.; Caire, R.; Tseng. D.; Ozcan, A. ACS Nano 2014, 8, 1121-1129.
18. Shen, L.; Hagen, J. A.; Papautsky, I. Lab Chip 2012, 12, 4240-4243.
19. Wang, H.; Li, Y. T.; Wei, J. F.; Xu, J. R.; Wang, Y. H.; Zheng, G. X. Anal. Bioanal. Chem. 2014, 406, 2799-2807.
20. Kim, B. N.; Diaz, J. A.; Hong, S. G.; Lee, S. H.; Lee, L. P. MicroTAS 2014, 2247-2249.
21. Tom Grimm, M. G. The Basic Book of Digital Photography: How to Shoot, Enhance, and Share Your Digital Pictures, Penguin, London, United Kingdom, 2009.
22. Greenbaum, A.; Akbari, N.; Feizi, A.; Luo, W.; Ozcan, A. PLoS ONE 2013, 8, e76475.
23. Sung, Y. L.; Jeang, J.; Lee, C. H.; Shih, W.-C. J. Biomed. Opt. 2015, 20, 047005.
24. Sung, Y. L.; Garan, J.; Nguyen, H.; Hu, Z.; Shih, W.-C. Appl. Opt. 2017, 56, 7346-7350.
25. Sung, Y. L.; Campa, F.; Shih, W.-C. Biomed. Opt. Express 2017, 8, 5075-5086.
26. Black, L.; Allen, G. C.; Frost, P. C. Appl. Spectrosc. 1995, 49, 1299-1304.
27. Huang, Y; Butler, I. S. Appl. Spectrosc. 1990, 44, 1326-1328.
28. Monico, L.; Janssens, K.; Hendriks, E.; Brunetti, B. G.; Miliani, C. J. Raman Spectrosc. 2014, 45, 1034-1045.
29. Rafael C. Gonzalez, R. E. W.; Steven L. Eddins, Digital image processing using matlab, 2nd ed, Gatesmark publishing, 2009.
30. Harris County MUD 208, Drinking Water Quality Report 2017,http://www.harriscountymud208.com/pdf/Drinking_Water_Quality_Report_2017.pdf.