smarter infrastructure: thoughts on big data and analytics · big data and analytics cloud...
TRANSCRIPT
RedBlook
Front cover
Smarter Infrastructure: Thoughts on Big Data and Analytics
A selection of posts published on the IBM Smarter Computing blog
IBM Smarter Computing bloggers team


Abstract
This IBM® Redblook publication is a collection of selected posts that are published on the IBM Smarter Computing (http://smartercomputingblog.com) blog. The Smarter Computing blog is the IBM official smarter computing or smarter infrastructure blog, contributed to by IBM specialists worldwide. Most of the authors have hands on experience implementing smarter computing solutions for various industries and on various IBM system platforms. The goal of the blog is to provide readers with a forum to discuss and debate the following smarter computing and smarter infrastructure topics:
� Big data and analytics� Cloud infrastructure� Data security� Enterprise systems� Power systems� Smarter storage� Software-Defined Environment� System optimization
This paper focuses on one aspect of a smarter infrastructure, which is big data and analytics.
After reading this book, you will have a good understanding of the following aspects of big data and the use of analytics in today’s business environment:
� Big data and the use of analytics on that data� Big data in real life solutions� Security of the data� How IBM systems are well suited for big data and analytics
Each of these topics is explained using one or more blogs posts published on the IBM Smarter Computing blog. Table 1 provides a complete list of the blog posts included in this publication.
Table 1 Smarter Computing blog posts that are featured in this publication
Title of the post Authored by Other great posts from these authors
“Big data and the use of analytics on that data” on page 4
“When does 00100011 change from data to #bigdata?” on page 4
Paul DiMarzio http://www.smartercomputingblog.com/author/paul-dimarzio/
© Copyright IBM Corp. 2015. All rights reserved. 1
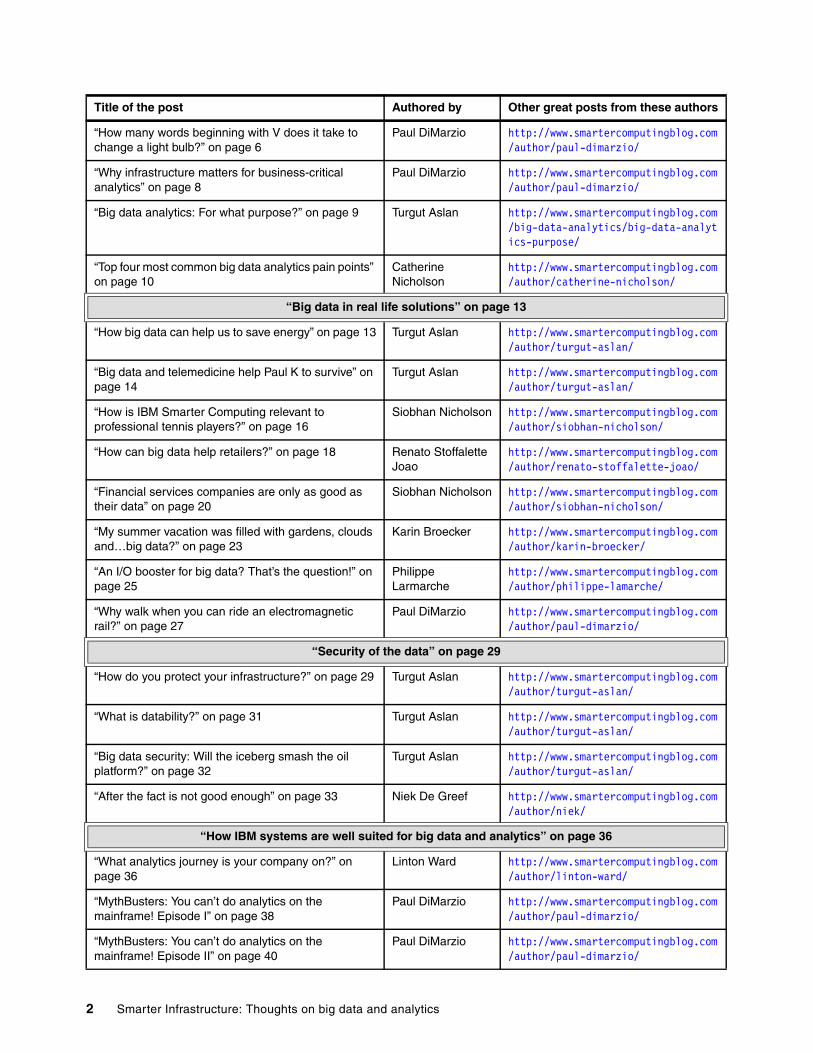
“How many words beginning with V does it take to change a light bulb?” on page 6
Paul DiMarzio http://www.smartercomputingblog.com/author/paul-dimarzio/
“Why infrastructure matters for business-critical analytics” on page 8
Paul DiMarzio http://www.smartercomputingblog.com/author/paul-dimarzio/
“Big data analytics: For what purpose?” on page 9 Turgut Aslan http://www.smartercomputingblog.com/big-data-analytics/big-data-analytics-purpose/
“Top four most common big data analytics pain points” on page 10
Catherine Nicholson
http://www.smartercomputingblog.com/author/catherine-nicholson/
“Big data in real life solutions” on page 13
“How big data can help us to save energy” on page 13 Turgut Aslan http://www.smartercomputingblog.com/author/turgut-aslan/
“Big data and telemedicine help Paul K to survive” on page 14
Turgut Aslan http://www.smartercomputingblog.com/author/turgut-aslan/
“How is IBM Smarter Computing relevant to professional tennis players?” on page 16
Siobhan Nicholson http://www.smartercomputingblog.com/author/siobhan-nicholson/
“How can big data help retailers?” on page 18 Renato Stoffalette Joao
http://www.smartercomputingblog.com/author/renato-stoffalette-joao/
“Financial services companies are only as good as their data” on page 20
Siobhan Nicholson http://www.smartercomputingblog.com/author/siobhan-nicholson/
“My summer vacation was filled with gardens, clouds and…big data?” on page 23
Karin Broecker http://www.smartercomputingblog.com/author/karin-broecker/
“An I/O booster for big data? That’s the question!” on page 25
Philippe Larmarche
http://www.smartercomputingblog.com/author/philippe-lamarche/
“Why walk when you can ride an electromagnetic rail?” on page 27
Paul DiMarzio http://www.smartercomputingblog.com/author/paul-dimarzio/
“Security of the data” on page 29
“How do you protect your infrastructure?” on page 29 Turgut Aslan http://www.smartercomputingblog.com/author/turgut-aslan/
“What is datability?” on page 31 Turgut Aslan http://www.smartercomputingblog.com/author/turgut-aslan/
“Big data security: Will the iceberg smash the oil platform?” on page 32
Turgut Aslan http://www.smartercomputingblog.com/author/turgut-aslan/
“After the fact is not good enough” on page 33 Niek De Greef http://www.smartercomputingblog.com/author/niek/
“How IBM systems are well suited for big data and analytics” on page 36
“What analytics journey is your company on?” on page 36
Linton Ward http://www.smartercomputingblog.com/author/linton-ward/
“MythBusters: You can’t do analytics on the mainframe! Episode I” on page 38
Paul DiMarzio http://www.smartercomputingblog.com/author/paul-dimarzio/
“MythBusters: You can’t do analytics on the mainframe! Episode II” on page 40
Paul DiMarzio http://www.smartercomputingblog.com/author/paul-dimarzio/
Title of the post Authored by Other great posts from these authors
2 Smarter Infrastructure: Thoughts on big data and analytics
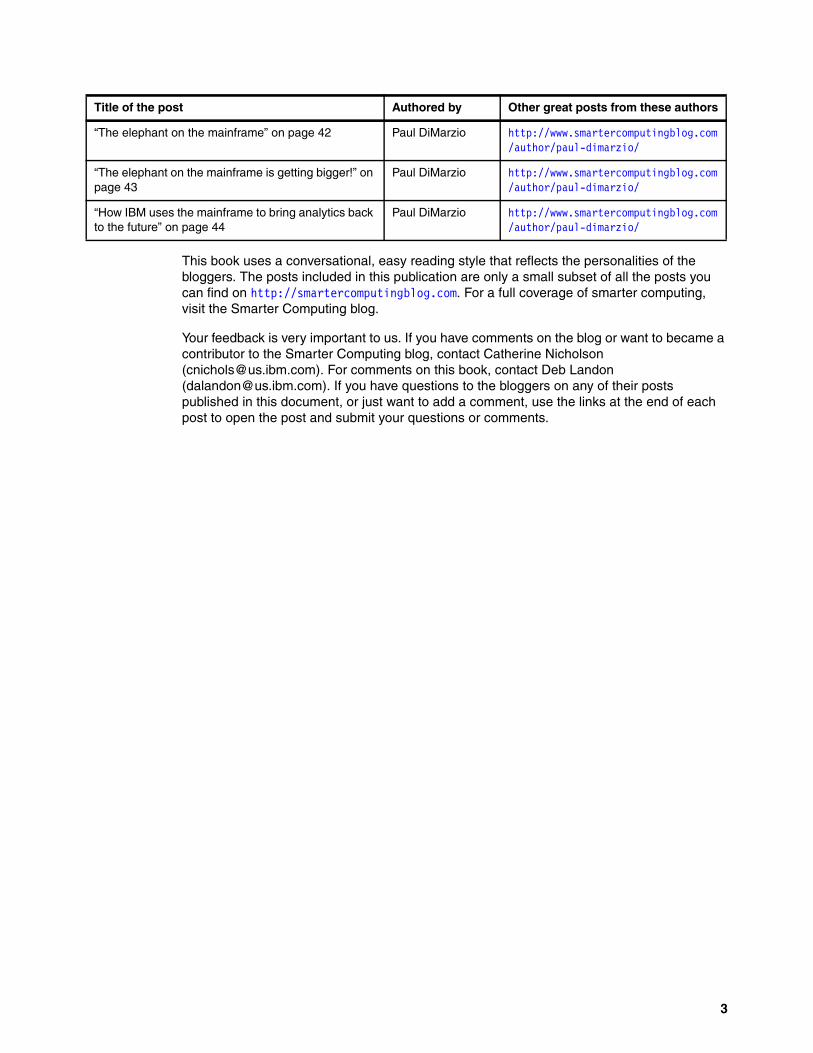
This book uses a conversational, easy reading style that reflects the personalities of the bloggers. The posts included in this publication are only a small subset of all the posts you can find on http://smartercomputingblog.com. For a full coverage of smarter computing, visit the Smarter Computing blog.
Your feedback is very important to us. If you have comments on the blog or want to became a contributor to the Smarter Computing blog, contact Catherine Nicholson ([email protected]). For comments on this book, contact Deb Landon ([email protected]). If you have questions to the bloggers on any of their posts published in this document, or just want to add a comment, use the links at the end of each post to open the post and submit your questions or comments.
“The elephant on the mainframe” on page 42 Paul DiMarzio http://www.smartercomputingblog.com/author/paul-dimarzio/
“The elephant on the mainframe is getting bigger!” on page 43
Paul DiMarzio http://www.smartercomputingblog.com/author/paul-dimarzio/
“How IBM uses the mainframe to bring analytics back to the future” on page 44
Paul DiMarzio http://www.smartercomputingblog.com/author/paul-dimarzio/
Title of the post Authored by Other great posts from these authors
3
Big data and the use of analytics on that data
We begin by discussing what big data is and the use of analytics on that data. Our bloggers have written several posts on this topic and how the use of data and analytics on those data is important in a smarter infrastucture for today’s business environment.
The following posts are included in this section:
� When does 00100011 change from data to #bigdata?� How many words beginning with V does it take to change a light bulb?� Why infrastructure matters for business-critical analytics� Big data analytics: For what purpose?� Top four most common big data analytics pain points
Let’s start with a post from Paul DiMarzio that talks about when did “data” become “big data”?
When does 00100011 change from data to #bigdata?
Unless you’ve chosen to live your life completely off the grid, Ted Kaczynski-style (the fact that you’re reading this blog entry negates that possibility!), someone, somewhere, is using big data technology to try and understand more about you.
It may be a retailer looking to give you a better customer experience (my colleague Renato Stoffalette Joao provides some good use cases in “How can big data help retailers?” on page 18); a campaign staff using what it knows about you and millions of your fellow citizens to craft a winning election strategy (check out the Obama campaign’s brilliant use of big data); or a government sifting through your records in the interest of public safety (as with the US National Security Agency’s recently disclosed PRISM program). I have little doubt that big data will drive unprecedented change in our lives, whether we like that change or not.
I just wish that someone had come up with a different name, because the term big data carries the implicit meaning that everything else is, well, something other than big (small data? little data?) and, consequently, less important.
According to the Unicode/UTF-8 standard, 00100011 is the binary representation of the hash symbol (#). The bit sequence 00100011 represents # no matter what technology you use to generate it, store it and process it. However, under some circumstances this string of bits is considered to be big data and under other circumstances it is not. There’s nothing in the encoding that makes the distinction, so just when does 00100011 change from just data to big data?
Google “What is big data?” and you will be presented with over two million explanations to ponder. Most definitions—including IBM’s—tend to define big data as a class of data that exhibits particular characteristics in the areas of volume, velocity, variety and veracity—“the four Vs”:
� Volume. So much data is being collected that we’re now starting to project the worldwide accumulation of digital data in terms of Zettabytes.
� Velocity. Data is being produced so quickly that we tend to think of it in terms of continuous streams as opposed to repositories of discrete events.
� Variety. Data is being recorded in a wide range of structured and unstructured formats such as transactions, sensor feeds, Tweets, email and video.
� Veracity. Not all of this data can be fully trusted for any number of reasons (sensor precision, unverified sources, ambiguous text and so on).
4 Smarter Infrastructure: Thoughts on big data and analytics
Why does this matter? Isn’t a # just a #?Traditional data processing technologies—querying a DBMS with SQL, for example—are considered to have limitations in the volume, velocity and variety of data that they can efficiently process. And they are designed to work with trusted data. When these limits are exceeded, different technologies may be required. The Hadoop MapReduce system for processing large data sets using parallel technologies often comes to mind when one thinks of big data.
But what, exactly, is the breaking point at which this technological shift occurs?
Unfortunately, there are no firm guidelines as to how big, how fast, how varied or how truthful data must be before it is classified as big data. I have a client who currently maintains records on 2.5 billion transactions in an active, online, fully accessible DB2® z/OS® database. Another just put in place the ability to perform accelerated ad-hoc querying and reporting against over a petabyte in mainframe warehouse capacity. A credit card processor manages a sustained rate of 750 authorizations per second with a 250-millisecond response time on their mainframe. I have many more such examples; by most measures, there is some serious big data being processed on the mainframe every day. But it’s not being processed by what are considered to be big data technologies.
Value – the fifth dimension?When characterizing data, I think that we need to explore one more “V” to complete the picture: value. If you wanted to know more about me and my habits, and you were able to hack my security credentials and gain access to my computer, you’d tap in to around 120 GB of digital images (yes, I take a lot of pictures!), a trove of data that is a clear candidate for big data analysis using parallel technologies.
You would also find an 80 MB file containing my Quicken personal finance data. This relatively small file of structured data contains records of all of my financial transactions dating back to 1995 (yes, I am also a very conservative record keeper!). I can’t think of anyone who would classify this as big data. Yet, you would learn far, far more about me by analyzing my Quicken data than you would by analyzing my pictures. The Quicken file—my core financial data, or “book of record”—has greater analysis value than my big data photographic files.
Making 00100011 work for you, whether it’s big or notFortunately, you’re not faced with an either-or decision when it comes to big data technology. I recommend to my mainframe clients that they first understand the questions they want answered, then identify the data that will be most valuable in answering those questions. Analytics processing should be positioned as close to that data as possible. It should come as no surprise that this high-value data is nearly always hosted on the mainframe. If you haven’t already done so, please check out my MythBuster blogs (see “MythBusters: You can’t do analytics on the mainframe! Episode I” on page 38 and “MythBusters: You can’t do analytics on the mainframe! Episode II” on page 40), for ideas on how deploy analytics into your existing mainframe environment.
Once your core analysis plan is set, look for other sources of data that can augment and enhance your results. This will very often include data that is best processed with MapReduce and stream technologies. In future blog posts I’ll discuss how to condense and connect big data insights into mainstream analytics processing.
Returning to my personal example, an analysis of my financial data would reveal that I travel a lot, and would provide the tangible details of every trip. But you wouldn’t know anything about the quality of my travel. Correlating an analysis of my photographs to my financial records would give a more complete view of what I did while traveling, and a further analysis of my Facebook and Twitter feeds would let you know how I felt about the experience. This core
5
analysis of my finances, augmented by a “big data” analysis of ancillary data, would provide a complete picture of my travel habits and position you to make offers that I would find appealing.
As long as the standards don’t change, the bit stream 00100011 will always represent the # symbol. Whether # signifies a big data Twitter hashtag or a not-big data customer purchase order, learning how to match the characteristics of the data to the characteristics of your systems is key to successfully turning that data into actionable insights.
Paul now continues with another blog post that further discusses and defines what big data is.
How many words beginning with V does it take to change a light bulb?
I don’t know—that would be a rather silly joke! But since I have your attention, how about we explore the question I really had in mind: how many words beginning with V does it take to describe the characteristics of data?
Recently I wrote a blog post (see “When does 00100011 change from data to #bigdata?” on page 4) that discussed big data and its role in enterprise analytics. I used IBM’s definition of big data as a class of data that exhibits particular characteristics in the areas of volume, velocity, variety and veracity. I went on to propose that we should also be examining a fifth dimension, value, to help us completely understand how to most effectively use that data to drive business insights.
Well, it turns out I had the right idea but was only scratching at the surface of the issue!
Shortly after I submitted my blog for publication, I tuned in to a joint IBM-Gartner webcast on the topic of big data and the enterprise. I found it to be very well done and informative; you can watch the recording here:
http://event.on24.com/eventRegistration/EventLobbyServlet?target=lobby.jsp&eventid=614823&sessionid=1&partnerref=ibmcompages&key=4DC7C26A1408B3022C9BDEA0054F376F&eventuserid=84128561
In this webcast, Gartner analyst Donald Feinberg shared his view of what big data means for organizations, the impact it can have on businesses and the role of the mainframe in realizing this potential. As I did in my post, he also made it clear that you have to look beyond the characteristics that make data “big” to determine how best to mine that data for insights. Whereas I expanded the characteristics of data to include a fifth dimension, Feinberg noted that to fully describe data requires no less than twelve dimensions spread across four categories!
Originally posted at: http://www.smartercomputingblog.com/big-data-analytics/00100011-data-bigdata/
6 Smarter Infrastructure: Thoughts on big data and analytics
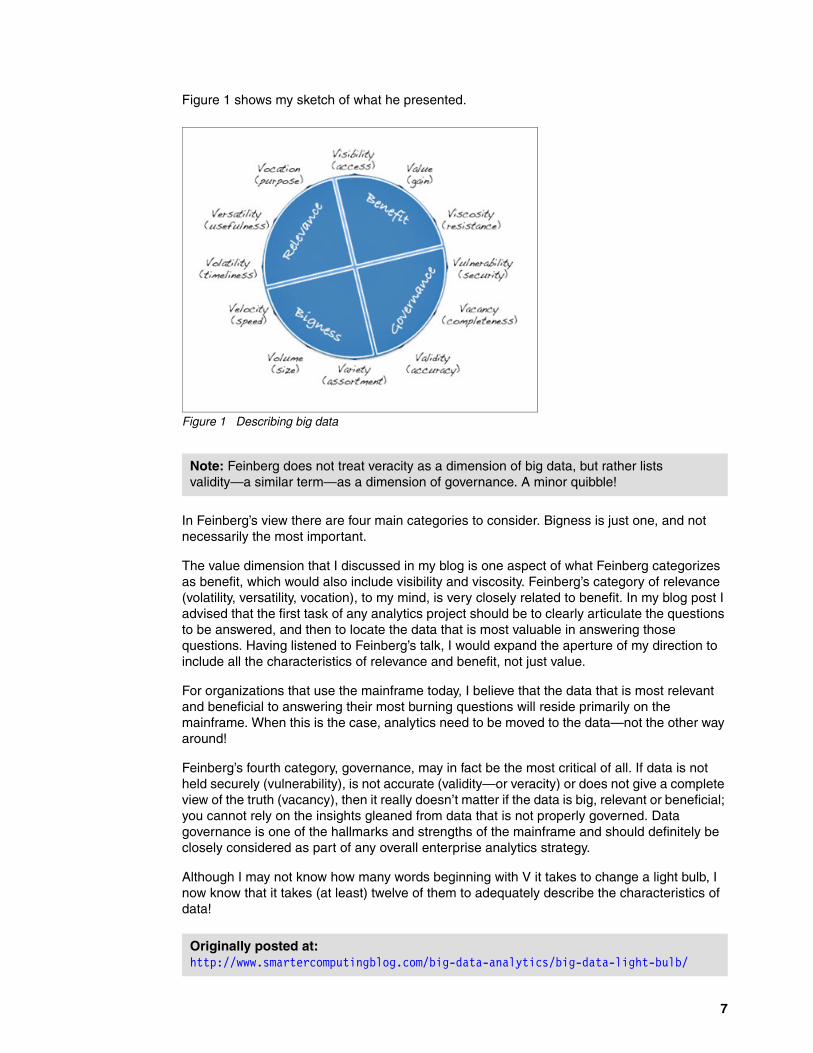
Figure 1 shows my sketch of what he presented.
Figure 1 Describing big data
In Feinberg’s view there are four main categories to consider. Bigness is just one, and not necessarily the most important.
The value dimension that I discussed in my blog is one aspect of what Feinberg categorizes as benefit, which would also include visibility and viscosity. Feinberg’s category of relevance (volatility, versatility, vocation), to my mind, is very closely related to benefit. In my blog post I advised that the first task of any analytics project should be to clearly articulate the questions to be answered, and then to locate the data that is most valuable in answering those questions. Having listened to Feinberg’s talk, I would expand the aperture of my direction to include all the characteristics of relevance and benefit, not just value.
For organizations that use the mainframe today, I believe that the data that is most relevant and beneficial to answering their most burning questions will reside primarily on the mainframe. When this is the case, analytics need to be moved to the data—not the other way around!
Feinberg’s fourth category, governance, may in fact be the most critical of all. If data is not held securely (vulnerability), is not accurate (validity—or veracity) or does not give a complete view of the truth (vacancy), then it really doesn’t matter if the data is big, relevant or beneficial; you cannot rely on the insights gleaned from data that is not properly governed. Data governance is one of the hallmarks and strengths of the mainframe and should definitely be closely considered as part of any overall enterprise analytics strategy.
Although I may not know how many words beginning with V it takes to change a light bulb, I now know that it takes (at least) twelve of them to adequately describe the characteristics of data!
Note: Feinberg does not treat veracity as a dimension of big data, but rather lists validity—a similar term—as a dimension of governance. A minor quibble!
Originally posted at: http://www.smartercomputingblog.com/big-data-analytics/big-data-light-bulb/
7
In this next post, Paul explains why infrastructure matters in today’s business environment when trying to use analytics to improve business decisions on both structured and unstructured data. Also, as you read Paul’s posts throughout this document, you will see that he is specifically focused on how the mainframe and IBM System z® has a role to play in this environment.
Why infrastructure matters for business-critical analytics
Go to any session at any analytics conference today and it’s almost certain that the presenter will start by tossing around statistics like “90 percent of the world’s data was created in the last two years,” or “the information base of the world doubles every 11 hours.” Then they’ll tell you that 80 percent of all that data is unstructured and measured in zettabytes.
The spin is clearly skewed toward what the industry has come to call “big data,” and it might seem like the mainframe doesn’t have a role to play in this space. Nothing could be further from the truth.
To understand what that role is, you have to do some research into what’s on the minds of people actually trying to use analytics to improve business decisions.
In 2012 IBM ran a survey that asked respondents what kinds of data they were interested in analyzing using big data technologies. The number one response, by far, was transactional data—at 72 percent. Gartner Group’s 2013 big data survey (if you’re a Gartner client you can access the results at the following web site) asked the same question and got the same answer—transactional data, at 70 percent. In both surveys, unstructured data—like emails and data from social media sources—got about half as many responses.
https://www.gartner.com/doc/2589121
So even though the world is awash in unstructured data, it’s the transactional data that decision makers are focused on right now. And since the mainframe holds the vast majority of that data, it has a real role to play.
There are lots of reasons why transactions are being cited as the top data source for analysis. The one that I think best illustrates the role of the mainframe is the move toward real-time analytics. Our last IBM CIO study found companies that were using real-time analytics were 33 percent more likely to outperform their peers. Why? It’s because they’re focused on improving operational decisions—those decisions that are made hundreds of thousands to millions of times a day.
Decisions like determining if a payment request is likely to be fraudulent, or if free shipping should be applied to a particular order, or what offer will appeal to a customer at risk of switching to a competitor. These kinds of decisions require extremely low latency and extremely high quality data—meaning that the analytics must be placed as close to the operational data as possible. And that operational data is usually on IBM System z.
To support real-time analytics we’ve delivered the ability to drive SPSS® predictive scoring analytics directly into the IBM DB2 database on the mainframe. We’ve moved the analytics to the data. To my knowledge, no other operational database can support predictive analytics in this fashion.
We’re currently working with an insurance client that handles close to a million claims a day as a batch process overnight. They’ve wanted to use real-time predictive analytics to refine their ability to detect fraud pre-payment, but their batch window is too tight to tolerate any distributed processing. Our initial work with them on some sample data shows we can perform this predictive analytics directly on the mainframe with virtually no increase in
8 Smarter Infrastructure: Thoughts on big data and analytics
pathlength. The client is very encouraged that this technology can help them avoid millions of dollars a year in payment of fraudulent claims.
In part 2 of this blog post, Paul broadens the aperture beyond real-time analytics and examines other use cases that make the mainframe the ideal infrastructure for business-critical analytics. You can read part two of this blog post on the Smarter Computing blog at:
http://www.smartercomputingblog.com/system-z/critical-business-analytics/
In this next blog post, Turgut Aslan discusses just how much data is being collected every second and how do you decide what is really important out of all those data being collected.
Big data analytics: For what purpose?
There’s a lot of talk these days about big data analytics and their importance for business. But let’s step back and think for a moment. What does this mean for a business decider?
Putting a sensor everywhereBeing able to collect big data basically means that sensors are being put everywhere, and many objects are now joining the Internet of Things (IoT). All the data that is collected is measured and encrypted through the Internet to a processor and analyzed according to various algorithms. Storage of raw or processed data may also be considered, depending on the volume and infrastructure investments someone wants to make. The sensors can be any hardware devices or software that are capable of measuring one or more values to be displayed or reported somewhere.
Data sourcesSensors can be used in a company in cameras in entry areas, card readers at doors and smoke detectors on the ceiling. Values like electricity, water or network bandwidth consumption can also be measured.
Theoretically, there is no limit to the data collected; however, the number of sensors, amount of network bandwidth to transfer collected data, storage capacity and computing power (CPU) to make meaningful and human-interpretable results of the collected big data put some practical boundaries on how much data you can get. It’s obvious that big data processing and analysis need investments in infrastructure; otherwise they won’t work.
Effective filteringSetting aside the current hype about big data, I have to wonder if the big data phenomenon is really something new. Take the human body as an example, with sensors such as eyes, nose, ears, skin, tongue and a “central processing unit,” the brain. How does it process the information pouring in every second from the natural sensors a human has?
The key here is the effective filtering of what is important from what is not. Hearing a rustling sound in the ancient forest meant that our ancestors had to run immediately so that they wouldn’t become food for wild animals. Or they had to shoot their spear in the right moment to hunt down their next meal. That portion of information out of the huge amount of available data was what was crucial for survival.
Originally posted at: http://www.smartercomputingblog.com/system-z/business-critical-analytics/
9
Exponentially growing dataMore and more sensors, devices and data are being put online now. The growth of digitized data sets our current time apart from the past, when information that was available was typically offline. In the IoT age, more data is online; therefore we have the big data phenomenon. It is a good assumption that the volume of big data will increase significantly over the coming years. Without effective filtering mechanisms and the ability to relate the data to other relevant information, we won’t get the full picture. Here data analytics comes into play.
Security and privacy considerationsOur thinking about big data and analytics should include several security and privacy considerations as well. A few examples are as follows:
� Devices that were initially not designed to become a part of the IoT are now getting online. Special considerations about user IDs and passwords, encryption and regular software updates—to give some examples—now have to be made for washing machines, refrigerators and toasters.
� Putting a sensor everywhere may not be appropriate and could even be forbidden by applicable laws. A recording camera with a face-detection system identifying a person and comparing it with entries in a police database to prevent criminal action may be appropriate in sensitive public areas such as airports. It is not appropriate, however, in private rooms!
� Filtering of the data is a necessity to address exploding data volumes. This is similar to the way a person might close his or her eyes and stop to listen closely; we essentially turn off some sensors in order to focus on what really matters in cases of high stress. Collecting and limiting data for a particular purpose may be not only a technical requirement but also a requirement of privacy protection laws in some countries.
Business deciders’ painToday’s challenge to C-level managers is often the huge buzz of information received every minute from numerous sources. Do they get the right piece of information out of the big data at the right time, the information that is crucial for their survival as a company?
Have you ever thought about which raw data needs to be collected and analyzed to fit your business purpose so you can make informed decisions?
In the following post, Catherine Nicholson covers the top four most common big data analytic pain points and how businesses can overcome these challenges.
Top four most common big data analytics pain points
Big data is huge—both in terms of actual volume and business importance. Despite it being so vital, only 38 percent of organizations are prepared to deal with the onslaught of big data.
Why? Today’s data comes in many different forms and from many different sources. More importantly, unless it’s available and accessible to those who need it and unless you can quickly gain insights, big data analytics isn’t very useful.
Originally posted at: http://www.smartercomputingblog.com/big-data-analytics/big-data-analytics-purpose/
10 Smarter Infrastructure: Thoughts on big data and analytics
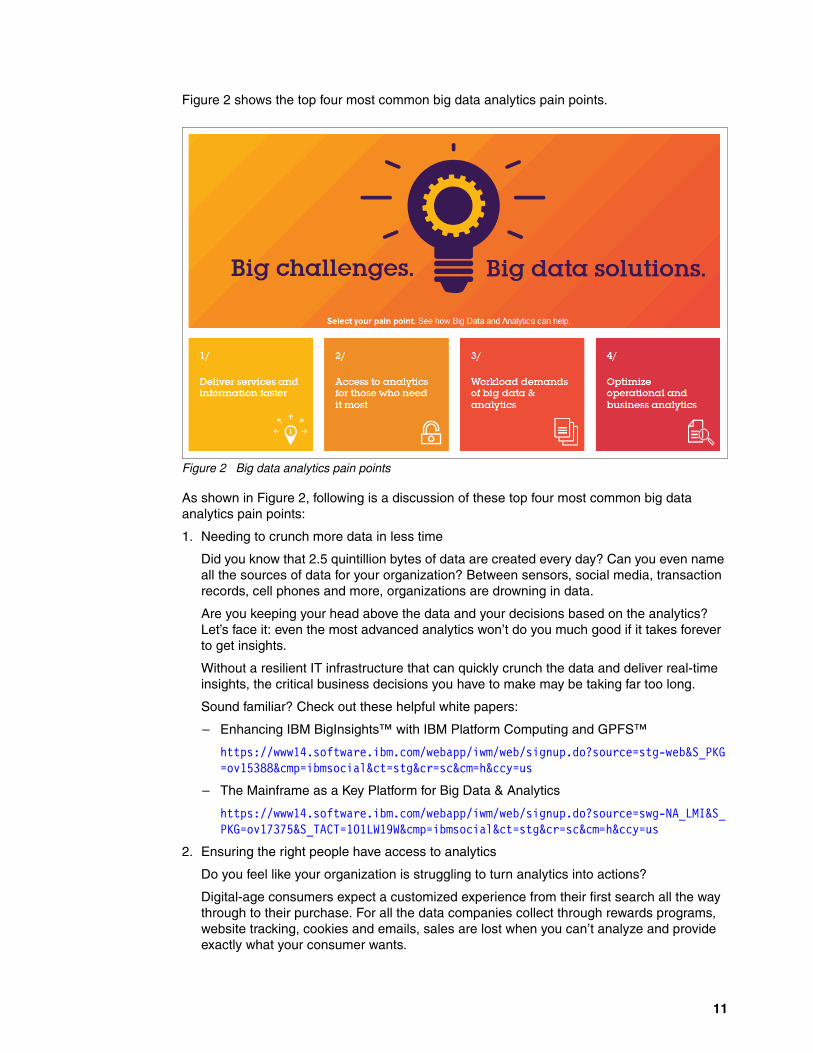
Figure 2 shows the top four most common big data analytics pain points.
Figure 2 Big data analytics pain points
As shown in Figure 2, following is a discussion of these top four most common big data analytics pain points:
1. Needing to crunch more data in less time
Did you know that 2.5 quintillion bytes of data are created every day? Can you even name all the sources of data for your organization? Between sensors, social media, transaction records, cell phones and more, organizations are drowning in data.
Are you keeping your head above the data and your decisions based on the analytics? Let’s face it: even the most advanced analytics won’t do you much good if it takes forever to get insights.
Without a resilient IT infrastructure that can quickly crunch the data and deliver real-time insights, the critical business decisions you have to make may be taking far too long.
Sound familiar? Check out these helpful white papers:
– Enhancing IBM BigInsights™ with IBM Platform Computing and GPFS™
https://www14.software.ibm.com/webapp/iwm/web/signup.do?source=stg-web&S_PKG=ov15388&cmp=ibmsocial&ct=stg&cr=sc&cm=h&ccy=us
– The Mainframe as a Key Platform for Big Data & Analytics
https://www14.software.ibm.com/webapp/iwm/web/signup.do?source=swg-NA_LMI&S_PKG=ov17375&S_TACT=101LW19W&cmp=ibmsocial&ct=stg&cr=sc&cm=h&ccy=us
2. Ensuring the right people have access to analytics
Do you feel like your organization is struggling to turn analytics into actions?
Digital-age consumers expect a customized experience from their first search all the way through to their purchase. For all the data companies collect through rewards programs, website tracking, cookies and emails, sales are lost when you can’t analyze and provide exactly what your consumer wants.
11
If the right people don’t have access to the right tools, it doesn’t matter how many mountains of customer data you have.
If this sounds like your pain point, you may find this white paper helpful:
– Optimizing Data Management through efficient storage infrastructure
https://www14.software.ibm.com/webapp/iwm/web/signup.do?source=stg-web&S_PKG=ov24155&S_CMP=web-ibm-st-_-ws-storagehp&cmp=ibmsocial&ct=stg&cr=sc&cm=h&ccy=us
3. Effectively handling data quality and performance
Everyone has worked on that project before—the one that’s so big and old that it just keeps growing with no real ability to track performance targets. It becomes a vicious cycle where decisions are made without insights and insights are hidden from years and years of work.
Imagine trying to track demand, profit, loss and more without any reliable or consistent data. Sounds next to impossible, right? Right.
Now imagine an infrastructure that aligns with your business goals and delivers actionable, real-time business insights that you can trust. Sounds a lot better, doesn’t it?
Is your organization dealing with this? This eBook is for you:
– Next-Generation In-Memory Performance
https://www14.software.ibm.com/webapp/iwm/web/signup.do?source=sw-infomgt&S_PKG=ov20419&cmp=ibmsocial&ct=stg&cr=sc&cm=h&ccy=us
4. Needing big data solutions that scale to fit your business
Feel like all of your data’s potential is just locked away and waiting to be realized? Regardless of where data lives, it doesn’t do much good if it doesn’t have the right infrastructure supporting it.
The key is shared, secured access and ensuring availability to your data. To get the right insights into the right hands at the right time, you must have a flexible, scalable infrastructure that can reliably integrate front-end systems with back-end systems—and keep your business up and running.
If this sounds like your pain point, you may find this white paper helpful:
– IBM DB2 on IBM Power Systems™ – How it compares
https://www14.software.ibm.com/webapp/iwm/web/signup.do?source=stg-web&S_PKG=ov23143&cmp=ibmsocial&ct=stg&cr=sc&cm=h&ccy=us
For more information, visit the IBM big data case studies website:
http://www-03.ibm.com/systems/infrastructure/us/en/big-data-case-studies/index.html?cmp=ibmsocial&ct=stg&cr=sc&cm=h&ccy=us
Originally posted at: http://www.smartercomputingblog.com/big-data-analytics/big-data-analytics-pain-points/
12 Smarter Infrastructure: Thoughts on big data and analytics
Big data in real life solutions
In this section, we look at how big data can be used in real life solutions.
The following posts are included in this section:
� How big data can help us to save energy� Big data and telemedicine help Paul K to survive� How is IBM Smarter Computing relevant to professional tennis players?� How can big data help retailers?� Financial services companies are only as good as their data� My summer vacation was filled with gardens, clouds and…big data?� An I/O booster for big data? That’s the question!� Why walk when you can ride an electromagnetic rail?
We begin with the following post, where Turgut Aslan expains how big data analytics can help to save energy.
How big data can help us to save energy
Often I continue watering the plants in my garden even when it rains, and my neighbors ask me why I’m doing it. My answer is that if the soil is dry because it hasn’t rained for days—or even weeks—then it isn’t wrong to give my plants additional water.
This is true, but the more fundamental answer is that rain water has already been collected in a rain barrel and is available. Any spillover rain water will go unused directly into the sewage system (or what we call in Germany the canalization).
Similarly, I choose sunny and partly windy weather to start the washing machine at home. The self-evident reason here is that I can dry my clean clothes outside in the sun and wind instead of using the drying machine, which will save energy and costs.
The more fundamental reason, however, is that solar panels and wind energy parks are producing a lot of electricity at those times as well, which enables us to consume the additional energy when it is available.
The challenge of energy storageOne of the major challenges in the area of renewable energy production such as solar and wind energy is storing the overproduction. Battery technology is not advanced enough and is too expensive to store large amounts of electricity. Other solutions exist, such as pumped-storage hydroelectricity, which involves pumping water into lakes at a higher elevation level for storage. These options have their pros and cons, such as the amount of space consumed by the artificial lake.
Since energy storage is expensive and alternative approaches are not always publicly accepted, we need to find more intelligent ways to consume the energy when it is available.
Big data, analytics and cloud can helpLet’s consider the following example:
We have a hot summer day in which the sun is shining and a medium or strong wind is blowing, like in the coastal areas of many countries. The solar panels and the wind wheels are producing regenerative energy all day, and electricity is also being produced by barrier lake plants. It is a Sunday, so many large production companies are closed and machines are idle.
13
In this example, having an information system display that would encourage private consumers to consume more regenerative energy when it is available would help. The motivation for private citizens to increase their electricity consumption at this time would be the lower price per kilowatt of electricity over regular weekdays. It would make practical sense for consumers to use their washing machines or recharge their electro-car batteries at this time, if possible.
The data from several hundred regenerative energy power plants and several hundred thousand private solar energy producers would be collected automatically and analyzed instantly in a central data center throughout the year. Similarly, the energy consumption figures would be collected and analyzed without interruption. The result could be shown on an online chart that’s accessible on the Internet and on TV, similar to the ones in a stock exchange.
As a result of this big data analysis, additional traditional power plants such as coal fueling and atomic plants could get online or offline as needed, to guarantee the basic electricity need. In parallel, both industrial and private consumer electricity consumption behavior could be influenced by the availability of additional regenerative power.
Innovation inspires change in the energy industry and private sectorThe idea to privately produce your own energy is not new, but technological progress has made it more effective and affordable. We can see the impact in large economies like Germany where renewable energy production can reach up to 40 percent of the daily consumption. In 2013, the overall regenerative electric energy production was 23.4 percent in Germany.
The usage of big data and analytics can help us to load-balance our energy production and needs better. Traditional power plants have to find their new role in this changing and smarter world.
Are you thinking of ways to reduce your energy or water consumption? Have you considered alternative ways to use them more effectively to help save money and the limited resources we have on earth?
Turgut now discusses how the use of big data and analytics in healthcare with the additional challenges of healthcare data security.
Big data and telemedicine help Paul K to survive
Medical and telecommunication technologies are advancing rapidly and bringing new opportunities for business and for improving quality of life. These changes raise questions about big data, data security and the privacy of sensitive personal information. Emerging issues like secure telecommunication, big data storage and analytics bring added complexity in comparison to traditional solutions. In this post we’ll consider a fictional scenario to illustrate the new opportunities and challenges of handling health data securely.
Paul K. is a fictitious person in his 40s suffering from congenital heart disease, high blood pressure and diabetes. The technology described in this post is partly fictitious too, but some components of it may be available today. Health services provided through remote assistance using the latest technology are called telemedicine, an emerging new business branch.
Originally posted at: http://www.smartercomputingblog.com/big-data-analytics/big-data-save-energy/
14 Smarter Infrastructure: Thoughts on big data and analytics
Paul K. wears a tiny smart device that collects important health parameters like heart rate, blood pressure, blood sugar level and body temperature. All this collected data is transmitted through a local health card to the central server of a hospital. The health card and server both contain Paul’s important data, including health history, and automatically monitor and record all essential parameters.
In an emergency like a heart attack, an alarm is generated on the local device and the central server. Paul’s attached device can infuse medicine, sugar or insulin into his veins according to his health data, and this immediate medical intervention helps him to survive until an ambulance can reach him. On its way the ambulance receives the relevant medical data, and the best route to the patient’s location is calculated according to traffic data. Every second counts!
When the ambulance reaches the patient its server reads the data on his health card and transmits all local first aid activities to the central server. The next hospital with free capacity is determined automatically and the central health server calculates the best medical treatment.
Questions about securing health dataThe example of Paul K. could be analogous to other emergency situations in difficult-to-reach areas or even in outer space. Medical technologies bring legal issues, technological challenges, ethical considerations and cost aspects to our attention. In this blog post the focus is on IT security and data privacy. If we make Paul’s medical data digitally available and automatically add new health data to this, questions arise, such as, where and how is this sensitive personal information (SPI) stored? Who has access to it? How is it transmitted, and to whom? Is it available anytime? If Paul’s health data is compared to that of other patients, how is the privacy of all involved parties ensured?
Addressing data privacy and security challengesThe first challenge is to make all existing medical data digitally available in a machine-readable and processable format. In the example of Paul K., having records of both his personal and family health histories could be useful.
Once a patient’s old and new health data is available, the next challenge is to encrypt this data (and possibly anonymize it). Storing all data in a central server may be an effective way to approach this challenge. Even better from a security point of view would be to divide data according to useful categories and host them on various servers.
A third challenge involves role-based access to data. Nurses, doctors or financial officers would each have different levels of access to encrypted data according to typical tasks they needed to perform. To better protect the data, stricter passwords may be applied, like biometric authorization tools, and SPI data may be more strongly encrypted. Finally, in a role-based access model patients should have access to all of their own medical data.
Today’s sensor and telecommunication technology allow for new innovations in telemedicine. These technologies, combined with big data storage and analytics, can help patients like Paul K. when hospitals and medical professionals are not immediately available. On a smarter planet, mobile communication and healthcare technologies will significantly improve the probability for humans to survive severe accidents, as well as aid in the regular treatment of diseases. Our challenge is to ensure that as these technologies advance, the health data and sensitive personal information of patients like Paul K. remain private and secure.
Originally posted at: http://www.smartercomputingblog.com/big-data-analytics/telemedicine-data-privacy/
15
In this next post, Siobhan Nicholson discusses how IBM at Wimbledon provides insights and valuable information for tennis players and coaches so they can achieve an even more professional approach to their career than previously possible.
How is IBM Smarter Computing relevant to professional tennis players?
I started my working life as a professional tennis player, where information on my form and, probably more important, my opponent’s form were part and parcel of my match preparation. The techniques I used to gain such valuable information included:
� Assessing my strengths – based on my style of play, the location of the match, the weather, the court surface and how my body felt.
� Assessing my opponent’s game – based on my memory of playing her previously, her recent results, knowledge of certain playing styles she struggled to compete against, talking to other players and coaches about her style and watching her matches. If I was not able to gain any of this information, my last resort was to assess her game during the five minute warm-up.
� Having a match plan – a tactical approach to the match based on the information I had gathered. I used the predetermined information to form the approach I was planning on undertaking during my match (and always having a plan B as well!).
This approach helped me achieve a relatively successful three-year professional career, including three $10,000 singles and four $10,000 doubles tournament victories, runner-up in $25,000 singles and doubles tournaments along with several semifinal appearances in $10,000 and $25,000 tournaments. I qualified for the 1992 Olympic Games in doubles and played in the qualifying tournament for Wimbledon in both singles and doubles. My highest rankings were 259 in singles and 309 in doubles.
Roll the clock forward 20 years and consider how things have now improved in relation to providing valuable information to enable tennis players to just focus on hitting the ball.
By using IBM Smarter Computing, especially with regard to being data ready, IBM at Wimbledon now provides insights and valuable information for tennis players and coaches so they can achieve an even more professional approach to their career than previously possible.
A real-life example of this is IBM’s SlamTracker®, which I discuss in the following video:
http://wimbledoninsights.com/ibm-wimbledon/slamtracker-explained/
SlamTracker uses IBM predictive analytics technology (known as SPSS) to predict what a player needs to do in order to improve their chances of winning their match. Prior to every match, eight years’ worth of Grand Slam data is analyzed (approximately 41 million data points) to find patterns or trends in a player’s game against their particular opponent (or a player with similar style if the players have not competed against each other previously). The resulting output gives three performance indicators (keys to the match) that, if delivered during the match, dramatically increase the likelihood of the player winning the match.
During the match, SlamTracker provides visual representation of what is happening point by point, including any momentum shift relating to the three keys. SlamTracker effectively collates the pre-match analytics with the real-time point by point match statistics to determine real-time predictive analytics on a player’s chances of winning their match.
16 Smarter Infrastructure: Thoughts on big data and analytics

Example keys to the match include:
� Keeping first serve percentage less than or more than x percent.� Winning fewer than or more than x percent of points by opponent-forced error.
This analysis is only available to players and coaches just prior to, during and after each match, but imagine how powerful this information would be to a player and coach the day before or the morning of their match as input to their match tactics. A player would not only know what they had to do but also what to stop their opponent from doing in order to increase their chances of winning the match. This would enable a player to have informed strategy decisions based on previously captured and analyzed data, which is such a powerful tool for a coach and player both during the tournament and as an aid for areas to work on after the tournament.
Figure 3 shows a screen shot of the IBM SlamTracker application.
Figure 3 IBM’s SlamTracker application
This is all fantastic, but how is this relevant to my clients? Sports can prove to be a powerful metaphor for business. In the consumer products industry, the ability to make informed decisions based on pre-captured analyzed data about a client’s business could prove to be very powerful. Being able to predict what sequence of events is required to maximize a client’s chance of increased revenue and market share is also extremely applicable.
For example, a UK consumer products drinks company’s valuable insights could be based on a sequence of events as follows: if the temperature is greater than 22?C (71.6?F), plus a shop stocking their product(s) is within 500 m of a park, plus a shop stocking their product(s) is near a university, the resulting impact equates to a maximum of 26 percent increase in sales. Show me a customer that would not be interested in this kind of data! So my question to my clients now is, “Why wouldn’t you be interested in analytics that can help you make more informed and therefore better business decisions?”
For more information on IBM SlamTracker in action during Wimbledon, see the following website:
http://www.wimbledon.com/en_GB/slamtracker/index.html
17

For further insight into technology solutions from IBM at Wimbledon, see the Wimbledon Insights website:
http://wimbledoninsights.com/ibm-wimbledon/
Next, Renato Stoffalette Joao discusses the use of big data analytics in the retail industry.
How can big data help retailers?
Over the past few years, retailers have changed the way they do business and continue to evolve as customers find new ways of shopping.
With the growing popularity of online shopping and mobile commerce, customers are using more channels than ever before to search for products, compare prices, make purchases and provide feedback about the products they are interested in or have bought.
Social media has become one of the key channels for these kind of activities, and it is now being used to help consumers find product recommendations, voice complaints, search for product offers and engage in ongoing discussions with their favorite brands.
As you can imagine, massive amounts of data are collected and stored as a result of all of these online interactions.
In IT, the term big data refers to the massive amounts of data collected over time that are difficult to analyze using conventional tools. The data collected by a company can come from different sources and can vary in nature. All this data requires innovative forms of information processing to help organizations gain enhanced insight and make better business decisions.
Retailers in general have access to a huge amount of information about their customers, but they don’t know how to get value out of it because it is usually sitting in its most raw form in a semi-structured or unstructured format. Sometimes they don’t even know whether it is all worth keeping because they don’t have the expertise to extract valuable information from that data.
On a smarter planet, the need to analyze large volumes of data, find patterns and drive insights becomes very critical if a company wants to increase its efficiency and remain competitive. For these purposes we’ll need systems that are optimized to deal with vast amounts of data and complex analytic processing.
The concept of big data is well applied in today’s increasingly data-driven world, and big data has become a critical top-line business issue that retailers must tackle in order to remain competitive.
Following are some simple situations that can be explored using a big data strategy to add business value to a company:
� Increase the precision of specific customer segments by analyzing their transactions and shopping behavior patterns across retail channels.
� Gain knowledge and enrich the understanding of customers by integrating data from online transactions and data from social media channels.
� Optimize the customer’s interactions by knowing one’s location and delivering relevant real-time offers based on that location.
Originally posted at: http://www.smartercomputingblog.com/big-data-analytics/tennis-analytics-slamtracker/
18 Smarter Infrastructure: Thoughts on big data and analytics
� Predict customer shopping behavior and offer relevant, enticing products to influence customers.
Big data solutions are ideal for analyzing data from a wide variety of sources, and retailers can use these solutions in many different scenarios, such as comparing the volume of website traffic for a given advertised product to the number of sales of that product.
Effectively analyzing a large volume of customer data opens new opportunities for retailers to gain a deeper and more complete understanding of each customer.
IBM’s big data platform offers a unique opportunity to extract insight from an immense volume of data at a fast velocity.
As part of the IBM Smarter Computing strategy, IBM offers a complete portfolio to help clients design, develop and execute big data strategy to enhance and complement existing systems and processes. Namely some of the solutions include:
� InfoSphere® Streams – which enable continuous analysis of massive volumes of streaming data with sub-millisecond response times to take actions in near real time.
http://www-01.ibm.com/software/data/infosphere/stream-computing/?ce=ISM0213&ct=sc&cmp=ibmsocial&cm=h&cr=crossbrand&ccy=us
� InfoSphere BigInsights – an enterprise-ready Apache Hadoop-based solution for managing and analyzing massive volumes of structured and unstructured data.
http://www-01.ibm.com/software/data/infosphere/biginsights/?ce=ISM0213&ct=sc&cmp=ibmsocial&cm=h&cr=crossbrand&ccy=us
� InfoSphere Data Explorer – software for discovery and navigation that provides near real-time access and fusion of big data with rich and varied data from enterprise applications for greater insight.
http://www-03.ibm.com/software/products/en/dataexplorer/?ce=ISM0213&ct=sc&cmp=ibmsocial&cm=h&cr=crossbrand&ccy=us
� IBM PureData™ System for Analytics – simplifies and optimizes performance of data services for analytic applications, enabling very complex algorithms to run in minutes.
http://www-01.ibm.com/software/data/puredata/analytics/index.html
� IBM InfoSphere Warehouse – provides a comprehensive data warehouse platform that delivers access to structured and unstructured information in near real time.
http://www-01.ibm.com/software/data/db2/warehouse-editions/
� IBM Smart Analytics System – provides a comprehensive portfolio of data management, hardware, software and service capabilities that modularly delivers a wide assortment of business-changing analytics.
http://www-01.ibm.com/software/data/infosphere/smart-analytics-system/?ce=ISM0213&ct=sc&cmp=ibmsocial&cm=h&cr=crossbrand&ccy=us
� InfoSphere Master Data Management – creates trusted views of your master data for improving your applications and business processes.
http://www-01.ibm.com/software/data/master-data-management/?ce=ISM0213&ct=sc&cmp=ibmsocial&cm=h&cr=crossbrand&ccy=us
� InfoSphere Information Server – understand, cleanse, transform and deliver trusted information to critical business initiatives, integrating big data into the rest of IT systems.
http://www-01.ibm.com/software/data/integration/info_server/?ce=ISM0213&ct=sc&cmp=ibmsocial&cm=h&cr=crossbrand&ccy=us
19
The strategies involved in big data aren’t just for big businesses. Smaller companies can also benefit. Big data does not necessarily mean really big, but simply data that cannot be managed or analyzed by other traditional technologies.
The retail industry is just one of the endless number of fields that can use big data to increase efficiency and improve results.
In the following post, Siobhan interviews Jeff Calusinski on smarter computing from a financial services perspective. Jeff is an IBM Distinguished Engineer focused on social business and mobile strategies in the finance industry.
Financial services companies are only as good as their data
I recently interviewed Jeff Calusinski on smarter computing from a financial services perspective.
Jeff is an IBM Distinguished Engineer focused on social business and mobile strategies in the finance industry. He is also the client technical advisor to the USAA and is starting to spend more time around the use of Watson™ in financial services.
What is your point of view on smarter computing, specifically in the financial services industry? That is, how is smarter computing relevant to your industry, and what are the key applicable solution areas?
I think there are at least two solutions in my cross-hairs right now.
The first is information on demand (IOD), and it is a point of view we have had in the finance sector for years that financial services do not create consumable or durable goods. They actually have virtual goods—that is, data.
A financial services company is only as good as their data, and their ability to react and provide service is really driven by the appropriate use of the resources in that data. Historically, financial services have tried to leverage this, but it has been from a transactional standpoint. Their core systems are all driven by transactional data, which is traditionally very structured data. They have created warehouses and applied analytics to this data, and it is important for them to get as much insight [as possible] around it to make better decisions. It is essential for financial services companies to continue to evolve and not make mistakes.
One argument for the rationale as to why you would need IOD stems from what happened in the US in 2006 and 2007 with the financial crisis. All the data needed was there; it was just that they were not looking at it properly. This is because they did not have the right tools or did not use that data purposefully enough to understand.
Structured data isn’t new. Financial services companies have techniques and processes in place to leverage it to glean as much insight [as possible]. For clients in this space to move forward, real-time and predictive analytics are critical.
The fundamental problem is that more and more of the data that they are starting to deal with is unstructured, which isn’t necessarily the case in other industries.
Financial services companies are trying to see where data influences the user, as well as social network sentiments, interactions, feedback from the web, call logs and voice
Originally posted at: http://www.smartercomputingblog.com/big-data-analytics/big-data-retailers/
20 Smarter Infrastructure: Thoughts on big data and analytics

transcripts. This type of data is becoming a viable source of information that just was not available in the past. In order to be smart, our clients in financial services need to start to investigate this unstructured data. Things like BigInsights and technologies like Hadoop are emerging, but our clients cannot scale to leverage that technology and make it usable by either the individual in the organization or the consumer.
I think that this is where Watson comes in. Our smarter computing and smarter infrastructure are really driven by those who can leverage real-time analytics, as well as structured and unstructured data, to have a meaningful outcome. I believe that Watson will help facilitate that and enable knowing the individual scenarios better. Also smarter are those who can start to leverage real-time analytics on that structured data and those who can do this will move things to the next level.
The second area for financial services is around this notion of continuous availability. Because data is so critical and these systems have always been online, a lot of the clients have looked at a highly-available environment. We have now gotten to a point where more and more of the overall infrastructure in the data center needs to be continuously available. We cannot afford an outage, and I believe that mobile has been a big driver toward that.
I also believe the use of the data is really important because when we make data real time it has an influence on the user experience and how to make business decisions. Therefore the data becomes critical and must always be available, and I need it in both data centers as well as the transactional systems that support it. From a business contingency and recovery standpoint, those data centers need to be geographically dispersed.
So clients that are leveraging smarter infrastructure are wondering, How do I make my systems continuously available? It is an emerging need and one that IBM is in a great position to help address.
You have mentioned the relevance to the financial services sector around the smarter computing capabilities cloud-ready and data-ready, but how is the security-ready capability relevant to financial services, and why?
Security-ready is very relevant in the financial services industry, and usually security and compliance are grouped together. In the last two years, the number one cost or increase in spending for financial services has been around things related to security and compliance. Part of that is driven by regulatory requirements and is a reaction to the events that occurred in 2006 and 2007. If data and therefore security and compliance are part of your bloodline, then you do whatever you can to ensure that they are protected, and I think [that is] because of the ubiquitous nature in which people have now started to interact: mobile.
In our key financial institutions, the Denial of Service (DoS) initiated from “Anonymous” across the globe is a big concern. Therefore investing in security is as important as anything else, and it just happens to be in the forefront. It is like this: in order to keep the lights on, the company has to be investing in security. It becomes interesting in the convergence of security concepts and capabilities with analytics. That is the spot in financial services that makes it unique by creating the relationship between the security architecture and the way security and data are dealt with. For example, we can use an individual’s data to make a smarter decision about a security construct such as login, authorization of a certain piece of ancillary data or fraud detection. Fraud is a huge issue in financial services and so as you start to look at these adjacent, major principles or components of security, they are starting to be dependent on other data, which ties back into being data-ready.
It is quite apparent that smarter computing capabilities (cloud-ready, data-ready and security-ready) are extremely important in the financial services sector. Are there any specific examples of smarter computing solutions that demonstrate how it has benefitted a financial services business?
21

The early indications are that it is providing value. If we look at our smarter commerce stack as a part of our smarter computing initiatives, we have clients today that can leverage smarter commerce solutions that provide an experience for their users they could never provide before. They are leveraging IBM technology to do more than straight-through processing, things that were not applicable in the past.
For example, filing a claim and doing fraud detection in real time caused concern about false positives. The last thing you want to do is provide a false accusation, so the insurance companies would not spend much time focusing on having this capability but instead would take a loss. Those that were focused on the member experience or user experience realized they did not want to falsely accuse the member or the client of fraud. So if you want a great member experience and you want to be able to detect fraud, you have to be 100 percent sure that the fraud is fraud before you approach the individual.
In some cases, whether it is in banking or insurance, you let detected fraud go through because it did not hit a certain business threshold—for example, a pre-specified dollar amount. Through the use of IBM analytic tools, we now are able to be much more accurate in determining fraud, and part of that is because of the rich amount of data that the financial services companies have.
When we take things like analytics and case management and investigation, clients can wrap this all together to have a much better experience. These techniques can provide large savings for the client. Every dollar that we can more accurately associate with fraud goes to the bottom line.
This risk of fraud applies to all industries within financial services because the “goods” in this industry are just data, and therefore fraud is easier. It is hard to do fraud when you are creating washing machines because fraud is really not a concern to that type of manufacturer. But for financial services, because everything is virtual and electronic, fraud is a lot easier and you can be anywhere in the world doing fraudulent things.
Applying IBM solutions that encapsulate analytics, case management and investigation saves time, money and people, and it is captured very early in the process.
Smarter security is one of the feeders of information that provides this insight. We are now starting to look at mobile devices by using the context from the mobile device to also prevent the fraud, and as mobile becomes a first-order or a first-class citizen in all of our financial interactions we can start to tap into that and reduce fraud even more.
An example of this: I am at Starbucks in a small town in the middle of Nebraska using an electronic payment through my mobile phone. For an electronic payment, the bank might not want to request a user ID and password in Nebraska. But if I am on the south side of Chicago and I am buying a $5,000 TV, the bank might want to request a user ID and password and might even want to use biometrics facial recognition because it is a big transaction and something I had not done before.
Plus, I am in a high-risk area and I am buying an expensive item. The bank, as the financial services company, is going to want to change its security model, which then helps prevent the fraud. And if for some reason the fraud did get through, the bank still has the ability to go back to look at it later.
For financial services, because everything is virtual and electronic, fraud is a lot easier and you can be anywhere in the world doing fraudulent things.
22 Smarter Infrastructure: Thoughts on big data and analytics

Do you see any overlap in the financial services sector relating smarter computer solutions to other industries?
There is clearly an overlap around the data-ready smarter computing capability between the financial services sector and the retail sector. Historically financial services adopt things that happen in retail four years after retail introduces it. If we look at things like mobile, social, marketing and technology on the web, I believe part of this is because retail was forced to leverage web as a channel, and they needed a way to differentiate in a highly competitive environment. Therefore a lot of innovation occurred in the retail space. This started to change the consumer expectations, and therefore financial services started to adopt those same types of principles and technology.
I believe the four-year gap has shrunk considerably. I think it is closer to two years now. I do not have a definitive authoritative source, but it is my perception. So I think that what is occurring now in retail in the consumer space is more quickly becoming applicable in financial services.
I will give an example—the notion of campaign management using targeted marketing, knowing your customer and/or real-time analytics. The advancements we see in retail are becoming much more applicable in financial services.
I also think we are seeing more of a convergence of retail with financial services. From a smarter computing standpoint, I believe things like mobile, social and smarter commerce are things we see occurring in both spaces.
This concludes my interview with Jeff Calusinski on smarter computing in the world of financial services. Many thanks to Jeff for sharing his insight into how financial service companies are benefiting from implementing smarter computing solutions and identifying the overlap of smarter computing solutions with other industries. If you want to know more about Jeff’s point of view, follow him on Twitter @jdcalus.
Next up is Karin Broecker, who draws a correlation between her summer activities from both a personal and professional perspective. Karin talks about two important technologies: OpenStack and Hadoop.
My summer vacation was filled with gardens, clouds and…big data?
Summer is a time of vacations, sun and fun. That definitely is the case where I live in Minneapolis. Summer is a special season – and not just because it is short. It is short, but it is also packed to the gills with activities.
This summer was no different. Reflecting back on it, I’m amazed at all that I managed to fit into it: my first triathlon, planting and harvesting from the garden and camping on Lake Superior.
Originally posted at:
� Part 1 - Financial services companies are only as good as their data
http://www.smartercomputingblog.com/big-data-analytics/financial-services-data/
� Part 2 - Smarter security means better fraud detection in financial services
http://www.smartercomputingblog.com/big-data-analytics/financial-fraud-security/
23
None of that is really relevant here. But I did learn about two important technologies that are relevant here: OpenStack and Hadoop. I regularly find myself surrounded by smart, innovative folks. Early this summer, I asked a few of them to help expand my horizons in cloud and big data. They delivered.
Hadoop. I’m fascinated by big data, so imagine my surprise to find out that Hadoop is 10 years old. You read that right. It started with Doug Cutting and Mike Cafarella. The first iteration could only run across a handful of machines. And then Google came along and released the Google File System paper and subsequently the MapReduce paper. Yahoo was the moving force behind Hadoop for the next several years, investing heavily in getting it where it needed to go. Hadoop was an Apache open source project, so Yahoo wasn’t the only player. Google, IBM, the National Science Foundation and others also played a role in getting Hadoop enterprise ready. For a complete history on Hadoop click here.
Why is this important? Big data is everywhere these days. However, I talk to many clients that aren’t sure where to start or what they want to get out of big data. Understanding where Hadoop is these days might help too. A great place to look is IBM InfoSphere for BigInsights.
The InfoSphere BigInsights Quick Start Edition provides hands-on learning through tutorials designed to guide you through your Hadoop experience. No excuses. Get started today.
OpenStack. Management and control of resources in the cloud sparked several different paths for cloud computing standards – including OpenStack. OpenStack Software is a cloud operating system that controls pools of compute, networking and storage resources in a data center.
These resources are managed through a single dashboard that gives control to administrators while still allowing users to provision necessary resources. The community of technologists, developers and many others working on OpenStack is well over 10,000 strong. I’m amazed that so many people are committed to building open source software for private and public clouds.
Earlier this year, IBM announced its adoption of OpenStack as the foundation for its own private engagements and IBM SmartCloud® public cloud projects. IBM is no stranger to open source projects, so the reaction to the announcement was mixed.
Then IBM bought SoftLayer. SoftLayer is not currently an OpenStack-based service. Stay tuned as that story develops.
Why spend so much time learning about open source technology? It is often the basis for the latest innovations. It keeps Smarter Computing smart. Most of all, it helps me see the world from my clients’ eyes. These are the challenges they face. There are so many technologies popping up (almost as many as the weeds in my garden) and clients need to stay up to speed on how these will affect their business in the short term and long term.
We now switch gears from summer activities to Philippe Lamarche, who talks about how faster communication is key to getting quick answers in today’s business environment. He covers how I/O performance has become even more critical and how to improve I/O access and communication time to boost performance by using IBM FlashSystems.
Originally posted at: http://www.smartercomputingblog.com/big-data-analytics/gardens-clouds-big-data/
24 Smarter Infrastructure: Thoughts on big data and analytics

An I/O booster for big data? That’s the question!
The other day I heard an interesting story on the radio about the history of postal mail and how travel time has shortened considerably over the years. At the time of postal relays with horses, it commonly took several days or weeks to get a letter in Europe. And I’m not even talking about the more distant adventures in which packages or letters had to cross oceans. The boat was the only option then, and the time scale was quite different than what we experience with modern airplanes! It took weeks or months for people and goods to complete a trip.
The development of aircraft and a number of technical improvements have drastically changed the speed of these journeys. Let’s say that a parcel now takes about a day to reach its goal. This is not bad compared to the days, weeks and months of ancient times. Improvements in transportation technology as well as better organization and planning have helped a lot. Today travel time for communications, in particular, has sped up in an exponential way. Electronic messages are exchanged through our smartphones and the Internet in just seconds.
Many areas besides the postal sector benefit from these technical improvements and reduced time delays. For example, in the banking industry, modern credit cards have improved transaction security and the lead time to charge or debit the account. Saving time is crucial in our modern world, where time is money.
How do communication improvements relate to cloud and the internet?In the cloud and internet world, speed is key in order to get quick answers. So, as with postal traffic, smarter architecture requires fast communications. In the computer industry, these communications are named input/output (I/O). We need to feed the processors with data stored on disks as quickly as possible.
In the value chain of performance, the three most important parts are:
� The application code� The processor and memory� The I/O
The application code and the use of programs in general are the main factors affecting the overall performance. It is clear that changing and improving the code will have a greater effect than fine tuning the processor or I/O.
The processor and memory part are second priority after the code is stabilized. The correct behavior of the processor and memory heavily depends on the quality of ingested code and will be waiting on I/O requests (the famous I/O wait). Just like our parcel delivery, this waiting time will slow down the occupation time of the processor and the overall performance.
I/O time improvement with recent technologiesIn this era of big data, the amount of information has increased, so I/O has become even more critical.
The conventional units for measuring I/O are the millisecond (ms) and microsecond (µs), where 1 ms = 1,000 µs. Let’s assume that the processor needs about 100 µs for initiating the I/O request and that it takes about 100 µs for the interpretation when the storage array has sent the information back. We’ll also assume that the data are on an optimized storage area network (SAN) with optical fiber links, which is the required time to obtain this information stored on disk back to the processor (service time).
25
Classically we’d approximate that response times beyond 10 ms (10,000 µs) will be unacceptable to the application. In practice, a storage box with serial-attached SCSI (SAS) disks will provide access to records in the range of roughly 5 ms (5,000 µs).
We can summarize the magnitude of the time commonly observed in customer production as shown in Table 2.
Table 2 Magnitude of the time commonly observed in customer production
These elements are of course visible and measurable at:
� Infrastructure level, processor and disks (system administrator)� Application level (database administrator)
To reduce this time, I/O solid-state drive (SSD) flash drives have emerged, and I have already described in a previous blog the interesting usage of these devices in IBM hardware. In this case, fast SSD mixed with cheaper conventional SAS can increase the array performance through the use of an automated tiering device.
However, assuming that we put all the data on the SSD, we would be in the order of magnitude of 1 ms = 1,000 µs.
Thus this scenario would improve our table as shown in Table 3.
Table 3 Putting all the data on the SSD
This is very correct and sufficient in many cases, but what solution would change the order of magnitude? How do we build an I/O booster?
How do we get a breakthrough?Texas Memory Systems® (TMS) is a strong leader in the field of flash components. The recent acquisition of this company by IBM offers a new range of products, The IBM FlashSystem™ family:
http://www-03.ibm.com/systems/storage/flash/index.html?LNK=browse&ce=ISM0213&ct=sc&cmp=ibmsocial&cm=h&cr=crossbrand&ccy=us
These devices allow a service time of 200 µs, so here is our breakthrough!
Look at how this improves our table as shown in Table 4.
Table 4 Putting all the data on the IBM FlashSystem
I/O requests by CPU
Service time I/O processed by CPU
Total I/O time
Time (µs) SAS 100 5,000 100 5,200 µs
I/O requests by CPU
Service time I/O processed by CPU
Total I/O time
Improvement ratio
Time (µs) SAS 100 5,000 100 5,200 µs 1x
Time (µs) SSD 100 1,000 100 1,200 µs 5x
I/O requests by CPU
Service time I/O processed by CPU
Total I/O time
Improvement ratio
Time (µs) SAS 100 5,000 100 5,200 µs 1x
Time (µs) SSD 100 1,000 100 1,200 µs 5x
26 Smarter Infrastructure: Thoughts on big data and analytics

Recently with one of my clients, I positioned an IBM FlashSystem machine directly into production on an Oracle database and I was amazed! We found the same figures as shown in Table 4, which matched the numbers for FlashSystem!
For example, an I/O intensive process (99 percent of I/O wait) decreased from 4,000 seconds to 200 seconds, an improvement of 20x. Obviously I/O is “boosted” and the processors are more loaded, which significantly shortens your treatment time.
Besides the improvement in performance, the simplified implementation by inserting the device in the I/O patch is amazing. With mirroring techniques this may be transparent for critical applications. In our case we implemented it in only four hours.
Unlike with traditional storage devices, you don’t have to change your entire infrastructure by linking up with a manufacturer box. You keep your existing storage infrastructure, and advanced replication or copy functions continue to be performed by the existing bays.
IBM FlashSystem is an easily locatable 1U hardware in the data center, economical in terms of space, energy and price per gigabyte compared to SAS and SSD solutions.
ConclusionWe are at the beginning of the extensive use of this type of IBM FlashSystem. They can be easily combined within your current architectures to drastically reduce your response time, and they are more than complementary to the famous SSD solutions. This highly innovative approach fully meets cloud and smarter computing requirements.
Honey, I Shrunk the Kids is a movie. “Honey, I shrunk the I/O” is now a reality!
In this next post, Paul DiMarzio is back to talk about the IBM DB2 Analytics Accelerator.
Why walk when you can ride an electromagnetic rail?
If you’ve been following my Smarter Computing blogs, you know that I’m a huge advocate of running business analytics on System z. One of the most exciting technologies that we currently offer in this space is the IBM DB2 Analytics Accelerator, a Neteeza-based workload-optimized appliance that dramatically improves the ability to derive complex analytical insights from DB2 z/OS data.
How dramatically?Our marketing materials claim that the accelerator can run complex queries “up to 2,000x faster.” I know that this is accurate, as I recently reviewed a client’s data showing that the run
Time (µs)IBM FlashSystem
100 200 100 400 µs 20x
Originally posted at:
� Part 1:
http://www.smartercomputingblog.com/big-data-analytics/big-data-booster/
� Part 2:
http://www.smartercomputingblog.com/big-data-analytics/data-booster-flash/
I/O requests by CPU
Service time I/O processed by CPU
Total I/O time
Improvement ratio
27

time of one of their reports was reduced from just under three hours to six seconds using the accelerator—a measured improvement, in a production environment, of 1,908x. And this is pretty consistent with results that I’ve seen from other clients.
So, 1,908x sounds like a lot, right? I think so, but the statement “1,908x faster” doesn’t fully illustrate just how game-changing this appliance can be for organizations looking to turn data into insights. So I’ve decided to put on my creative hat, do a little Internet surfing and work up an analogy to share with you.
Let’s imagine that I run a business in my hometown and keep all my historical data at Grand Central Station in midtown Manhattan—roughly 70 miles away. A customer comes into my shop and wants to know about his past purchases. For some reason (I’m taking a little creative license here) I determine that I have no way of getting that information other than walking, so I ask my customer to take a seat, and I slip out the back door and begin my 140 mile round-trip trek to Grand Central.
Most humans walk at a rate of three to three-and-a-half miles per hour (mph). Assuming I am able to walk at this pace for a sustained period without stopping, I could be there and back in 40 hours. Of course, by that time my customer will have (understandably) left and taken his business elsewhere. In any event, let’s use this number of 40 hours | 2,400 minutes | 144,000 seconds as a baseline for this story. What would I have to do to improve this result by 1,908x?
As it turns out, Metro-North runs trains from my town right to Grand Central! These trains average 60 miles per hour with peak speeds of 80 miles per hour. Assuming I can get a train to run flat-out and make no stops, I would be able to make the round trip in 105 minutes. This is an improvement of 23x over my walking baseline. Good, but I need to do better.
One of the fastest passenger trains on the planet, the Shinkansen bullet train in Japan, can run at a peak speed of 200 miles per hour. Should Metro-North ever offer such service, and make no stops, I’d be able to make the trip in 42 minutes and show an improvement of 57x over the baseline. At this point it’s becoming obvious to me that conventional ground transportation will never get me to my goal of 1,908x.
Thinking out of the box, I turn my attention to firearms. Internet sources tell me that an average .45-caliber handgun can shoot a bullet at a speed of around 661 miles per hour. Even better, I find out that a Winchester .270 rifle shot can travel at 1,924 miles per hour—two and a half times the speed of sound! Assuming I had some preternatural ability to ride a Winchester shell to Grand Central and back, with no loss of velocity, of course, I’d make the trip in 262 seconds. Sounds impressive, right? Still, this improvement of 550x is not even close to the results that I’m after.
After a little more digging, I came across reports of a cool technology called the electromagnetic railgun. In one report, the US Navy announced the ability to fire a 40-pound projectile at 5,600 miles per hour using a railgun! Although I do weigh a bit more than the 40 pound projectile tested, assuming that someday I will be able to ride a railgun projectile to Grand Central and back at this speed I can get my travel time down to 90 seconds. Even this scenario only gets me to an improvement of 1,600x over my walking baseline—still 15 percent short of my goal.
I hope that by now you’re gaining an appreciation of how big a 1,908x improvement really is. In my analogy it represents the difference between walking and riding a railgun to a distant destination. Most people would view a sustained brisk walk of 140 miles to be impossible, and the technology to ride a railgun doesn’t exist.
In the real-life world of information management, it represents the difference between doing nothing and achieving business breakthroughs. There are many complex analytics-reporting projects sitting on the shelf because they are viewed as impossible to generate in a timely and
28 Smarter Infrastructure: Thoughts on big data and analytics
cost-effective manner; like the 140 mile walk, these projects are not attempted. Fortunately, the data management equivalent of railgun technology does exist; it’s called the IBM DB2 Analytics Accelerator, and it’s helping clients achieve truly dramatic results right now. Check out this video from Swiss Re describing how the accelerator is helping them manage their business.
I personally know the team that achieved the 1,908x improvement. They’ve told me that based on these results, the business units are beginning to reevaluate projects that had been previously killed. They’re riding the rail and reaping the rewards. So why are you still walking?
Security of the data
In this section, we look at another important aspect of big data, which is data security.
The following posts are included in this section:
� How do you protect your infrastructure?� What is datability?� Big data security: Will the iceberg smash the oil platform?� After the fact is not good enough
In this first data security post, Turgut Aslan talks about what IT infrastructures need to consider to protect themselves from many different types of cyber attacks.
How do you protect your infrastructure?
In ancient times, to conquer a castle attackers had to apply various strategies. This included shooting heavy cannonballs or rocks at the castle walls, using ladders to climb the walls and digging tunnels under the walls, among many other tactics.
The defense strategies used in response to these attacks were in preparation for each specific type of attack, such as creating larger and thicker castle walls, building a deep water channel around the castle and using natural barriers such as steep hills or huge rocks.
Today, although we no longer have to physically protect our castle walls, our businesses must carefully and constantly protect their IT infrastructures against many different types of cyber attacks.
In the 1980s and 1990s, when IT and the Internet became more frequently used both commercially and privately, security considerations and tools started to evolve as well. This was in response to the increasing number of attacks on IT infrastructure.
Tools were introduced to help defend against these different types of attacks including the following:
� Managing user IDs and passwords� Protecting against harmful code� Detecting and installing missing security patches on systems� Detecting and preventing intrusion attempts
Originally posted at: http://www.smartercomputingblog.com/big-data-analytics/db2-electromagnetic-rail/
29
� Checking system settings and recognizing unauthorized changes� Blocking access to networks
Cyber attack tacticsThese tools often responded to just one attack strategy. For example, someone knows a user ID and is trying to crack the password. Or someone is distributing harmful code in email attachments or in links of spam emails. The tools listed above are good in responding to such attacks.
But think about the following scenarios:
� Trying to log in to a server using a password only once a week� Forwarding only one email to a recipient and attaching a file with harmful code� Trying to enter a network using a different port once every few days� Checking once whether a security vulnerability on a system exists
If time is no issue and someone has enough criminal energy, there are millions of potential targets! It is not difficult to remain undetected, since each single activity is below a threshold that would trigger an alarm.
Big data analyticsOne important response to such sophisticated cyber attack tactics is big data analytics, in which you can draw a correlation from many single inconspicuous activities. The sum of a series of such activities or the correlation between them might very well indicate that a criminal act is going on.
We face technical limitations for responding to cyber attack tactics such as storage capacity and processing power, legal limitations due to privacy laws and other limitations such as limited personnel to review and interpret the results when the computer analysis is done. Stand-alone security tools without any correlation engines between them will have a difficult time detecting sophisticated cyber attacks.
One possible approach to detect cyber attacks is visual analytics. Often companies have many firewalls, and each of them has a high number of complex rules. This situation makes it hard for a network specialist to manage all the rules and what access rights they allow or deny in a given network. Here the near-real-time analysis and graphical visualization of the network traffic and the firewall rules would help a lot. There could be warnings in the case of unexpected patterns such as heavy traffic on some servers at night, which might indicate an attack since those servers are probably being used during regular working hours by the employees. Having a visualization of the firewall rules and correlating them to warn the network administrator in case of detected inconsistencies would help a lot as well. In recent years tools such as Visual Firewall and ClockMap were developed through scientific research at the university level to make big data in the networking area more human-readable.
How are you protecting your business and privately used servers, desktops and mobile devices?
Turgut now explains what the term “datability” means with regard to big data and security.
Originally posted at: http://www.smartercomputingblog.com/big-data-analytics/protect-infrastructure-security/
30 Smarter Infrastructure: Thoughts on big data and analytics

What is datability?
Datability is the synthesis of big data and security, accountability and reliability.
Today we have petabytes of data sent through networks that is filtered, analyzed and stored. The challenge is to make sense out of that data, to make it human readable and interpretable, helping humans to make the correct decisions at the right time. This is big data and analytics, and it is only one side of the coin. The other side of the coin is about security, accountability and reliability. When billions of messages, photos, documents and files are sent every day, who cares about security, availability, integrity and confidentiality? Who is accountable in the case of leakages, unauthorized access, modification, deletion of sensitive personal data or industry confidential data?
Big data: A new phenomenon?Big data has been here since the universe started to exist. When scientists today calculate models with billions of single stars forming a galaxy, where each of them has a mass, an age, a velocity, a chemical composition and so on, they are just reflecting what is happening with big data out there.
While scientific calculation and modelling may be abstract and far away in the case of the universe, it isn’t when it comes to the exact weather forecast for the area you live in. The scientists have a grid of several thousand measurement points with dozens of parameters measured every minute!
Similarly, the coordination of things such as traffic, goods trade and communication deals with big data. Those things happened in both ancient and modern ages. The difference of the past to today is that we have the capability to digitally collect, process and analyze big data, and this often in real time.
Security concerns exaggerated?Reports in the news about data leakages, industrial espionage, cyber-attacks and other IT-based criminal activities lead to concerns about IT offerings such as cloud. Because of existing threats, citizens demand greater IT security and protection within national borders. Stricter national laws are requested to protect privacy. Can this be the answer to the IT security threats?
It is not, in my view. Data security starts with the implementation of best practices, security processes, tools and awareness creation. National approaches like putting restrictions on the Internet or restricting data to national borders will not help to make data totally safe. Even if no one denies that the threats are real, ensuring data security and privacy is too complex to be addressed by simple, uncoordinated and stand-alone solutions. IT security is about finding a balance between data to be protected and the costs to protect it.
Recent affairs such as data leakages in some famous companies, successful cyber-attacks that have become publicly known and other IT-based criminal activity have led to high awareness and concern from large parts of the population, especially of the industrialized world, about IT security and data privacy. Some consumers hesitate more to use social media now, some consumers avoid US-based companies and some consumers start to rethink their habits in using the Internet overall. To overcome the skepticism of the professional and private consumers about cloud offerings, big data analytics and usage, and some social media is a huge challenge.
Let’s participate in this debate! What do you think? Have your habits in using social media and the Internet changed because of the recent IT security problems and data leakages? Are you satisfied with the datability of your service providers in your professional and private life?
31
In this next post, Turgut talks more about considerations for big data security.
Big data security: Will the iceberg smash the oil platform?
Climate change endangers the lives of millions of people. Its negative impacts, such as flooding in coastal areas, poor harvests in agriculture and decreasing habitat areas for animal life like polar bears, are becoming more and more visible today. But climate change, which is basically an increase of the measured worldwide mean temperature, brings some new opportunities to humankind as well. For example, the shipping passage on the northern coast of Canada and Russia opens for several months, helping to avoid transportation costs from Asia-Pacific to Europe. The meltdown of the ice shield of Greenland brings the possibility of drilling for rare earth metals like Scandium, Yttrium and Neodymium in some regions previously hardly reachable, and such resources are heavily needed in the computing and smart devices industry.
One effect, then, of the decreasing ice panzer (a very thick ice shield) of the northern polar region is the possibility of drilling for oil and gas: an extended period of two to three weeks of summer brings the opportunity to exploit oil for a longer time. No doubt, the oil industry in America and in countries like Russia or Norway is seeking for ways to increase its national income from those natural resources. The exploitation of oil in the northern polar region nevertheless remains a challenging task. Those firms running oil platforms have to take hard weather conditions like storms, heavy seas and large icebergs into account. In a worst case scenario, an iceberg could hit and damage an oil platform, making a huge impact on the life of humans and the environment.
This is the point where big data and analytics can help. Weather measurement stations at the ocean’s surface and observation by satellites in the earth’s orbit in various wavelengths can create a big enough local grid for precise weather forecasting as well as for determining the sizes and kinetics of icebergs. If the calculated trajectory of a huge iceberg shows it colliding with the oil platform location—and if a warning is given in an appropriate time—we can take precautions like moving the oil platform out of the way. There are numerous variables to track, including the measurement points defining the grid and the number of physical parameters collected for calculating the near-term local weather forecast and trajectories of icebergs constituting a potential threat for a given oil platform. Thus one may have petabytes of real-time data that needs to be transmitted, analyzed and brought into a form a human can read, understand and use to make informed decisions.
I use the example above, of an iceberg smashing an oil platform, to illustrate the creation and usage of big data. This idea can be extended to many diverse areas like stock exchange trading, exploration of outerspace, cancer treatment and fighting terrorism. While we can imagine the security issues related to big data in the case of icebergs and oil platforms, such concerns become more visible when we consider the manipulation possibilities in trading stocks or fighting terrorism. Just imagine a trader for metals getting the false information that large reserves in new copper fields were recently detected, which will probably decrease the worldwide copper price, affecting many industries processing copper. Or take the example of unmanned drones capturing images and other communication information in a hostile country and transmitting them to a central place. If a large number of images and other information is transmitted unencrypted it may be easily visible to the enemy as well, or even be open for manipulation.
Originally posted at: http://www.smartercomputingblog.com/big-data-analytics/what-is-datability/
32 Smarter Infrastructure: Thoughts on big data and analytics
Today, data is being collected from open sources like social media, by sensors like those in weather stations and airport scanners, or in other detectors like web cameras. Quite often a huge percentage of this data is unstructured. In some respect this means that additional effort is required to make sense of it and therefore it has a kind of built-in encryption. On the other hand there has already been a huge investment to create and collect the data, such as sending satellites into the earth’s orbit, sending out unmanned drones, setting up detectors and measurement stations and so on. If petabytes of data are being collected and need to be analyzed in near real time, any security consideration comes as an additional burden since encrypting and decrypting data consumes additional computing power and therefore increases the necessary investment into computing equipment while slowing down the real-time analysis capability. We could say the same for raw data storage, which would again increase the costs significantly for creating a very large and responsive storage capability.
Big data security is an emerging field for investigation and, in my eyes, a potential large future market. As we gain more access to big data flow and computing power any interested party can extract and manipulate data or take the appropriate actions. An expensive drone may just bomb mountains or empty houses without killing any terrorists; a stock exchange trader may sell all his copper options fearing a price decrease; or an iceberg may in fact smash the oil platform if security considerations are not made while collecting and processing big data. In each case, we need to seek a sound balance between the speed of data collection, processing in near real-time and data security.
In this final post of our discussion of big data security, Niek De Greef talks about the use of near-real-time analytics to help keep enterprise data secure.
After the fact is not good enough
A few months ago my debit card was skimmed (that is, copied illegally) at an airport in the US. While in transit from Amsterdam to North Carolina, I had withdrawn a sum of US dollars from my account at an ATM in the airport hall. A day and a half later my bank in the Netherlands called me and informed me they had blocked my debit card. They told me there were suspicious transactions on my debit card, and they didn’t want to give further details or reveal whether the villains had managed to take money from my account.
How did the bank find out? It probably saw that I had used the card almost simultaneously in North Carolina and at some other place, where I couldn’t possibly be at about the same time. But at what point would they have actually found suspicious behavior? What was the analytic and the data used to detect suspicious transactions? Could they have prevented possible malicious transactions?
The faster organizations can analyze the effect of business decisions or events, the bigger the advantage to the organization. If you can identify and prevent the fraudulent use of a credit or debit card at the moment a criminal executes a malicious transaction, this is clearly preferable to flagging a malicious event hours or days after the fact. Such an immediate detection allows you to deny this transaction and thus prevents the loss of money and image.
Numerous technologies are emerging to address the increasing need for a new category of near real-time analytics. Here I will examine one of these technologies that facilitates near real-time analytics in the domain of structured enterprise information.
Originally posted at: http://www.smartercomputingblog.com/big-data-analytics/big-data-security/
33
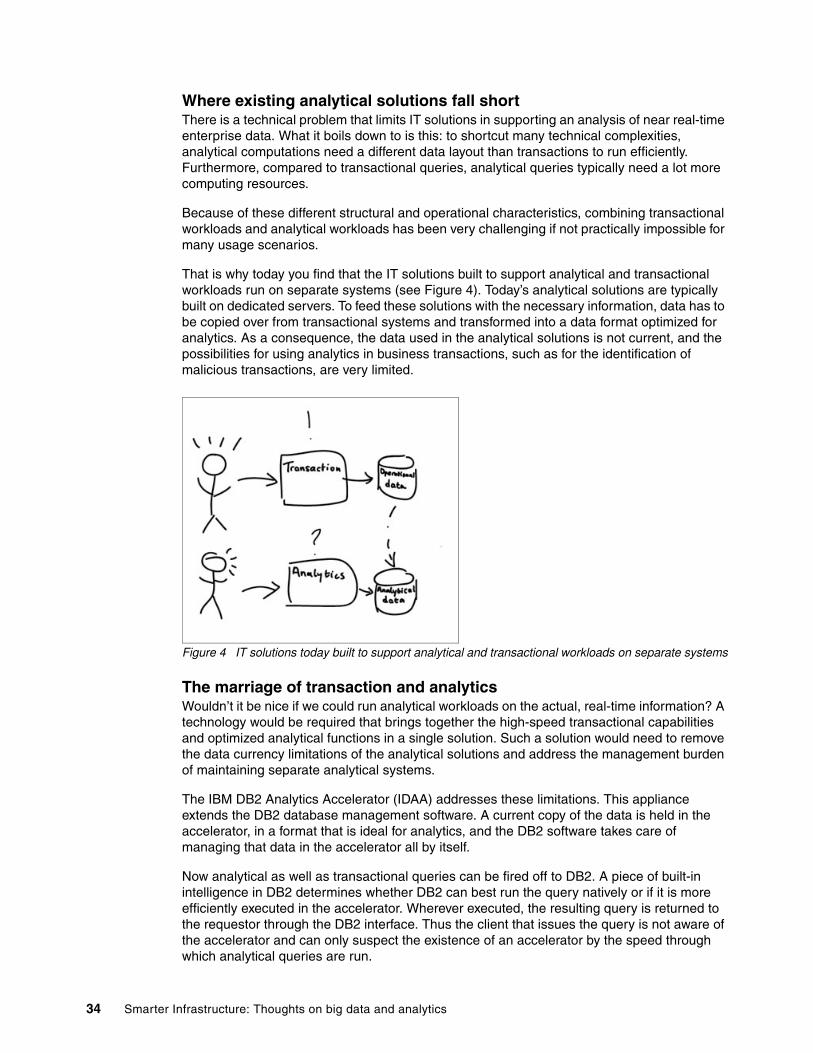
Where existing analytical solutions fall shortThere is a technical problem that limits IT solutions in supporting an analysis of near real-time enterprise data. What it boils down to is this: to shortcut many technical complexities, analytical computations need a different data layout than transactions to run efficiently. Furthermore, compared to transactional queries, analytical queries typically need a lot more computing resources.
Because of these different structural and operational characteristics, combining transactional workloads and analytical workloads has been very challenging if not practically impossible for many usage scenarios.
That is why today you find that the IT solutions built to support analytical and transactional workloads run on separate systems (see Figure 4). Today’s analytical solutions are typically built on dedicated servers. To feed these solutions with the necessary information, data has to be copied over from transactional systems and transformed into a data format optimized for analytics. As a consequence, the data used in the analytical solutions is not current, and the possibilities for using analytics in business transactions, such as for the identification of malicious transactions, are very limited.
Figure 4 IT solutions today built to support analytical and transactional workloads on separate systems
The marriage of transaction and analyticsWouldn’t it be nice if we could run analytical workloads on the actual, real-time information? A technology would be required that brings together the high-speed transactional capabilities and optimized analytical functions in a single solution. Such a solution would need to remove the data currency limitations of the analytical solutions and address the management burden of maintaining separate analytical systems.
The IBM DB2 Analytics Accelerator (IDAA) addresses these limitations. This appliance extends the DB2 database management software. A current copy of the data is held in the accelerator, in a format that is ideal for analytics, and the DB2 software takes care of managing that data in the accelerator all by itself.
Now analytical as well as transactional queries can be fired off to DB2. A piece of built-in intelligence in DB2 determines whether DB2 can best run the query natively or if it is more efficiently executed in the accelerator. Wherever executed, the resulting query is returned to the requestor through the DB2 interface. Thus the client that issues the query is not aware of the accelerator and can only suspect the existence of an accelerator by the speed through which analytical queries are run.
34 Smarter Infrastructure: Thoughts on big data and analytics
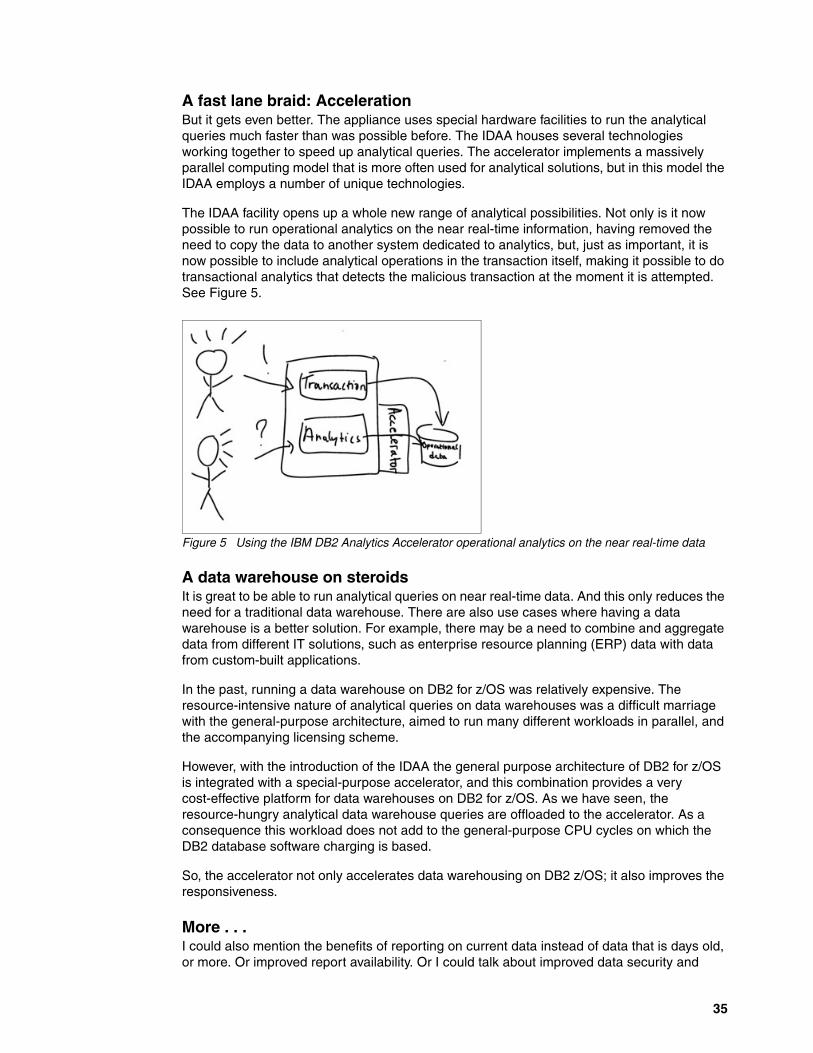
A fast lane braid: AccelerationBut it gets even better. The appliance uses special hardware facilities to run the analytical queries much faster than was possible before. The IDAA houses several technologies working together to speed up analytical queries. The accelerator implements a massively parallel computing model that is more often used for analytical solutions, but in this model the IDAA employs a number of unique technologies.
The IDAA facility opens up a whole new range of analytical possibilities. Not only is it now possible to run operational analytics on the near real-time information, having removed the need to copy the data to another system dedicated to analytics, but, just as important, it is now possible to include analytical operations in the transaction itself, making it possible to do transactional analytics that detects the malicious transaction at the moment it is attempted. See Figure 5.
Figure 5 Using the IBM DB2 Analytics Accelerator operational analytics on the near real-time data
A data warehouse on steroidsIt is great to be able to run analytical queries on near real-time data. And this only reduces the need for a traditional data warehouse. There are also use cases where having a data warehouse is a better solution. For example, there may be a need to combine and aggregate data from different IT solutions, such as enterprise resource planning (ERP) data with data from custom-built applications.
In the past, running a data warehouse on DB2 for z/OS was relatively expensive. The resource-intensive nature of analytical queries on data warehouses was a difficult marriage with the general-purpose architecture, aimed to run many different workloads in parallel, and the accompanying licensing scheme.
However, with the introduction of the IDAA the general purpose architecture of DB2 for z/OS is integrated with a special-purpose accelerator, and this combination provides a very cost-effective platform for data warehouses on DB2 for z/OS. As we have seen, the resource-hungry analytical data warehouse queries are offloaded to the accelerator. As a consequence this workload does not add to the general-purpose CPU cycles on which the DB2 database software charging is based.
So, the accelerator not only accelerates data warehousing on DB2 z/OS; it also improves the responsiveness.
More . . .I could also mention the benefits of reporting on current data instead of data that is days old, or more. Or improved report availability. Or I could talk about improved data security and
35
reduced risk of information leakage because data is managed in one place and not spread around.
Or I could discuss IT benefits like the avoidance of expensive extract, transform and load processes for filling business intelligence solutions. Or the improved system predictability and stability due to the reduced impact of long-running queries on transactional workloads. Or improved database administrator productivity because less tuning is required. Or about the storage savings you could make by archiving data with the high performance storage saver feature.
Maybe some other time.
The IBM DB2 Analytics Accelerator creates a hybrid platform for workload-optimized data workloads. As such it is an intriguing example of the hybrid nature of future enterprise systems.
How IBM systems are well suited for big data and analytics
In this final section, we describe how IBM systems are well suited to support big data and analytics solutions.
The following posts are included in this section:
� What analytics journey is your company on?� The elephant on the mainframe� The elephant on the mainframe is getting bigger!� MythBusters: You can’t do analytics on the mainframe! Episode I� MythBusters: You can’t do analytics on the mainframe! Episode II� How IBM uses the mainframe to bring analytics back to the future
The following post by Linton Ward describes how IBM Power Systems can be used to support organizations on their analytic journey. And, with the new IBM POWER8™ technology, your ability to harness big data just got a whole lot stronger.
What analytics journey is your company on?
Big data is the currently hyped term, but data alone is not sufficient to address business problems. The key question is really about what actionable business insight you can glean from data in order to make better decisions.
Infrastructure can improve time to results and business agility. The way you optimize your infrastructure for your business purposes depends on what types of questions you want to answer and what kind of data is required to support those decisions.
Bringing diverse types of data togetherBefore there was big data, no one thought they had little data. Improvements in technology are changing our view of what big means. More importantly, there are different attributes of data that matter: fast data, cold data, hot data, small data, big data, archive data, high velocity data and data that is accessed frequently. To effectively address a business need, you may need to include a variety of these different types of data.
Originally posted at: http://www.smartercomputingblog.com/big-data-analytics/real-time-analytics/
36 Smarter Infrastructure: Thoughts on big data and analytics
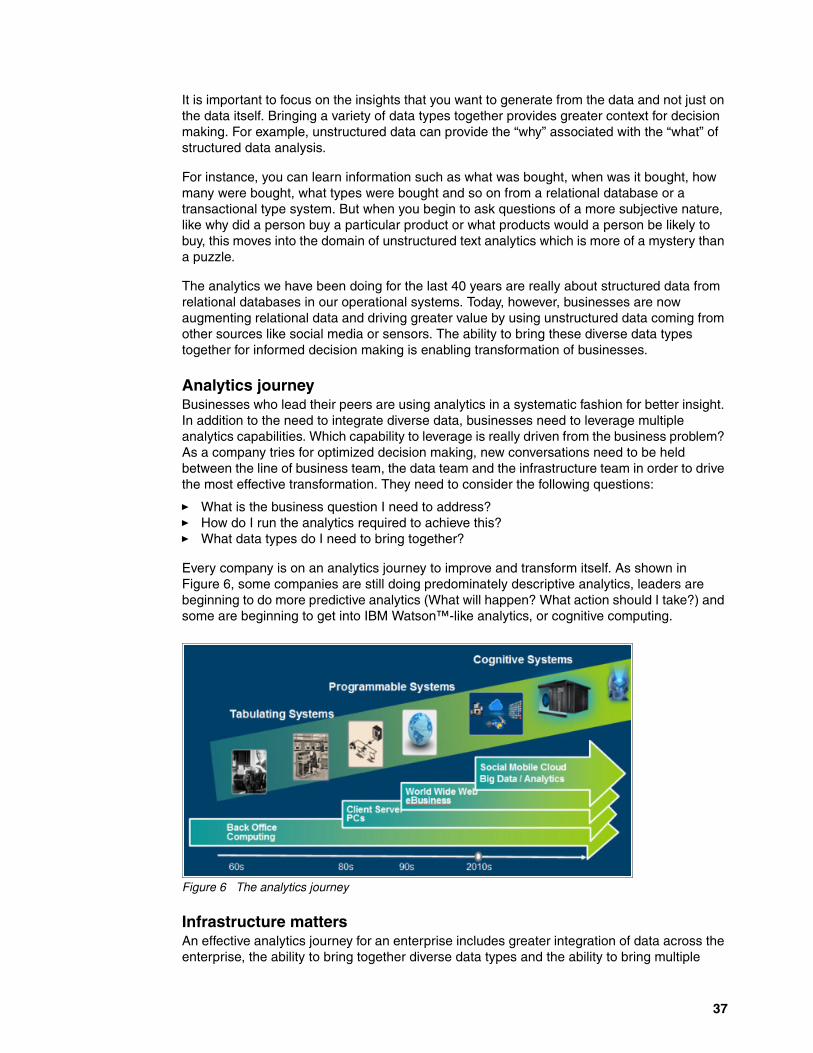
It is important to focus on the insights that you want to generate from the data and not just on the data itself. Bringing a variety of data types together provides greater context for decision making. For example, unstructured data can provide the “why” associated with the “what” of structured data analysis.
For instance, you can learn information such as what was bought, when was it bought, how many were bought, what types were bought and so on from a relational database or a transactional type system. But when you begin to ask questions of a more subjective nature, like why did a person buy a particular product or what products would a person be likely to buy, this moves into the domain of unstructured text analytics which is more of a mystery than a puzzle.
The analytics we have been doing for the last 40 years are really about structured data from relational databases in our operational systems. Today, however, businesses are now augmenting relational data and driving greater value by using unstructured data coming from other sources like social media or sensors. The ability to bring these diverse data types together for informed decision making is enabling transformation of businesses.
Analytics journeyBusinesses who lead their peers are using analytics in a systematic fashion for better insight. In addition to the need to integrate diverse data, businesses need to leverage multiple analytics capabilities. Which capability to leverage is really driven from the business problem? As a company tries for optimized decision making, new conversations need to be held between the line of business team, the data team and the infrastructure team in order to drive the most effective transformation. They need to consider the following questions:
� What is the business question I need to address?� How do I run the analytics required to achieve this?� What data types do I need to bring together?
Every company is on an analytics journey to improve and transform itself. As shown in Figure 6, some companies are still doing predominately descriptive analytics, leaders are beginning to do more predictive analytics (What will happen? What action should I take?) and some are beginning to get into IBM Watson™-like analytics, or cognitive computing.
Figure 6 The analytics journey
Infrastructure mattersAn effective analytics journey for an enterprise includes greater integration of data across the enterprise, the ability to bring together diverse data types and the ability to bring multiple
37
analytic capabilities together to process that data. These factors suggest that the right infrastructure can enable greater speed and business impact from big data and analytics projects.
IBM Power Systems are well suited to support organizations on their analytic journey. New Power Systems with the POWER8 processor are designed for data-centric computing with immense in-memory and IO-based computing capabilities. Data is growing exponentially and analytics are more important than ever. Power Systems analytics designs provide flexibility and choice for organizations of all sizes to turn massive volumes of raw data into actionable business insights to better understand their customer needs. Power Systems helps you to focus on the business impact delivered by IT.
And, with our new POWER8 technology, your ability to harness big data just got a whole lot stronger. With POWER8, you can deliver business reports 82 times faster, with four times the threads per core and memory bandwidth versus x86. With CAPI Flash Accelerators we offer 24:1 physical server consolidation for key-value stores, and with the IBM FlashSystem you can use 75 percent less storage for high input/output operations per second (IOPS) workloads.
For more details visit the Power Systems website:
http://www-03.ibm.com/systems/power/solutions/bigdata-analytics/index.html?cmp=ibmsocial&ct=stg&cr=sc&cm=h&ccy=us&ce=ISM0213&ct=sc&cmp=ibmsocial&cm=h&cr=crossbrand&ccy=us
or watch this video:
https://www.youtube.com/watch?v=Hpzc66bHavs
The choice you make in your IT infrastructure can make a big difference in not only just being able to easily and cost effectively deliver solutions today, but also as you look towards building a balanced and optimized infrastructure to carry your organization into the future.
In this next post, Paul DiMarzio discusses how the mainframe is also well suited to support organizations on their analytic journey. In this first part of a two part series, Paul talks about how business dynamics are forcing analytics deep into operational business processes.
MythBusters: You can’t do analytics on the mainframe! Episode I
I’ve always been a big fan of the American television show MythBusters – where scientific methods are used to prove or bust all sorts of myths and urban legends. One of the myths that I’d love to see Adam, Jamie and the team tackle is this: “you can’t do analytics on the mainframe.” While it probably wouldn’t make for a very entertaining show, this is one piece of conventional wisdom in serious need of debunking – so I guess I’m going to have to give it a go myself!
This is the sort of topic that is going to take multiple “episodes” to cover properly, so in this post I’ll begin by simply setting up the business dynamics that are forcing analytics deeply into
With POWER8, you can deliver business reports 82 times faster, with four times the threads per core and memory bandwidth versus x86.
Originally posted at: http://www.smartercomputingblog.com/big-data-analytics/data-analytics-journey/
38 Smarter Infrastructure: Thoughts on big data and analytics
operational business processes; I’ll save the actual myth busting for my next blog post, where I’ll take on the IT argument that mainframes and business analytics don’t mix.
From my point of view, the most exciting advancement in business technology is the use of analytics techniques to actually optimize the decision making process. One of my favorite thought leaders in this space is James Taylor, CEO of Decision Management Solutions. I highly recommend you read James’ book, Decision Management Systems: A Practical Guide to Using Business Rules and Predictive Analytics.
James has identified four broad areas where decision optimization can have a real impact on both top-line growth and bottom-line savings. Let’s take a quick look:
Managing riskCalculating risk is a huge concern in industries that issue credit (what is the likelihood that the applicant will miss a payment in the future?) or insure assets (what is the likelihood of a loss claim on this asset?). When risk analysis is deeply ingrained in your core business processes, you gain the competitive advantage of being able to differentiate risk at a very granular level and offer your clients more personalized pricing models.
Reducing fraudAny entity that processes a payment of any kind must be able to protect against fraudulent requests. It’s critical that fraud be detected before the payment is made, because recouping bad payments is both costly and difficult. Pre-payment fraud detection requires sophisticated analytic models that are tightly integrated with payment systems and capable of flagging problems without adversely effecting legitimate payments.
Targeting and retaining customersEvery customer interaction is both an opportunity to provide excellent service and a vehicle for improving business results. Deep knowledge of your customers, coupled with systems capable of optimizing huge numbers of micro-decisions, can lead to greater loyalty, more effective campaigns and increased spend.
Focusing limited resources where they will be most effectiveIf you have constrained physical and/or human resources at your disposal to solve complex logistical problems, optimizing the deployment of these resources is crucial to achieving business results, and a bad decision can be very costly and create satisfaction issues. Think of tasks such as managing cash flow (banking, insurance); ensuring public safety (government); managing airport resources and trucking schedules (travel and transportation); optimizing inventory (retail); and the like. Real-time analytics can help you make the right decisions and react to changing conditions that are outside of your control.
So what does any of this have to do with the mainframe?Each of these examples represents a class of business optimization opportunity that must be tied directly into the day-to-day execution of standard business processes; this is not the traditional view of performing analytics after the fact to enhance human decision-making. This is real-time analytics performed against live – not warehoused – data.
Where do you run your business operations, and where do you keep your operational data? If you are predominantly a mainframe shop, and the decisions that you want to optimize are based on the processes and data that are on the mainframe, doesn’t it make sense that it would be simpler, easier and more effective to bring the analytics to the data? Why would you not want to do analytics on the mainframe?
39
Oh yes, your IT people have told you that it’s not possible; that’s why. In true cliffhanger fashion I’m going to stop the program here, let you think a bit about how real-time, operational analytics can help you improve your business results and leave the actual myth busting to Episode II. Stay tuned!
In this second part of a two part series, Paul continues his description on how the mainframe is also well suited to support organizations on their analytic journey. In this post, Paul talks about how business decision optimization opportunities can only be realized by using real-time analytics.
MythBusters: You can’t do analytics on the mainframe! Episode II
Let’s face it: decades-old myths die hard. The team at MythBusters gets an hour to make their case; there’s no way I can completely bust this myth in a couple hundred–word blog. But I can introduce you to some new ways of thinking, and if you follow up on these threads I bet you’ll eventually declare this myth busted on your own.
In Episode I, I discussed business decision optimization opportunities that can only be realized by using real-time analytics. Unfortunately, most of today’s IT infrastructures are not ready to support real-time analytics because they were originally set up to support “offline” analytics: periodic reporting designed to inform human decision-making processes. Because analytics were not integral to operational business processes, operations and analytics developed as two very distinct IT lines—with operational data being copied and transferred to distributed systems for analytics processing.
This fragmentation of data and separation of processing architectures is an inhibitor to supporting analytics that automate time-sensitive decisions within real-time business processes. But don’t just take my word for it: I invite you to read a new report from Forrester Consulting that provides insights on analytics from over 200 executives in the financial services sector (you can also replay a webcast on this topic from Forrester’s Brian Hopkins).
The data from this report backs my view that most enterprises need to realign their IT so that they move from being an organization that supports operations and analytics to one that supports operational analytics. Here are five points to consider as you move forward.
Focus on the sourceAll decisions are derived from a variety of data, but one source will often dominate. The Forrester report indicates that executives are most focused on their transactional systems and expect these systems to drive more data growth than any other source (for example, social media, mobile and so on). If your source transactional systems are on the mainframe, doesn’t it make sense to begin your decision management journey there?
Location, location, locationData warehouses are necessary to bridge the gap between row-aligned operational data and the columnar format best suited for analytics. You probably wouldn’t site a physical warehouse in an unsafe area just to save money, so why risk exposing your critical data by sending it outside the mainframe for processing? Perhaps because companies like Teradata, Oracle, EMC, Sybase and others have built their businesses by telling you that it’s too expensive to use the mainframe for warehousing data. Maybe this was true once, but the cost
Originally posted at: http://www.smartercomputingblog.com/system-z/mythbusters-you-cant-do-analytics-on-the-mainframe-episode-i/
40 Smarter Infrastructure: Thoughts on big data and analytics
of operating a data warehouse on the mainframe is no longer prohibitive. Take a look at the IBM zEnterprise® Analytics System, a highly competitive offering that lets you keep your warehouse safe, secure and in close proximity to your source data.
And distributed analytics systems may not be as inexpensive as you think. The Forrester study found that 70 percent of the executives surveyed felt that separating transactional and analytic systems increased their costs, and 60 percent felt that sharing data across platforms is excessively expensive. As a small illustration, consider that an internal IBM study calculated the typical four-year cost just to transfer and house z/OS data on distributed systems for analysis at over eight million US dollars. House your warehouse right along with your source data; it’s affordable and it eliminates the expense and risk of moving data.
Keep it fresh!Predictive decisions require statistical modeling and scoring. In order for a score to be accurate, both the modeler and the scoring engine need access to the freshest data possible. In 2012, IBM introduced advances in IBM SPSS Modeler V15 and DB2 V10 for z/OS that allow scores to be calculated directly within the DB2 z/OS database (this brief article gives a good overview). In-transaction scoring is currently unique to the mainframe, and we have already baked this technology into anti-fraud solutions for several industries; check out our System z enterprise solutions page for more details.
Keep it simple!Since complex queries can bring an operational system to its knees, such queries are typically rejected, held for off-hours processing or moved to off-platform warehouses. Not only dos this inhibit business effectiveness; it also introduces significant costs and planning.
IBM’s Netezza® appliances can help accelerate queries. But the IBM DB2 Analytics Accelerator takes this technology one step further by deeply integrating it with DB2 z/OS, providing a single integrated system for processing both normal and complex queries safely and efficiently. It’s a simple, cost-effective way to integrate operations and analytics.
Consolidating your operational data, warehouse and query acceleration within the scope of the IBM System z gives you a unified foundation for decision management. It can also be cheaper than what you’re doing today; an internal study of a real customer environment showed that complex analytic queries performed against an IBM zEnterprise Analytics System, with the IBM DB2 Analytics Accelerator, measured 26x throughput and 33x price/performance improvements compared to their existing competitive environment.
Keep it fast!Many people believe that the RISC processor architecture is required for performing analytics. While this may be true for some forms of computation (think IBM Watson), the System z processor has evolved to the point where it can easily handle the sort of operational analytics required by decision-management systems.
At its announcement, the current-generation IBM zEnterprise EC12 featured the industry’s fastest chip: a six-core design with each core running at 5.5 GHz. That’s fast! This machine boasts 101 configurable cores, second-generation out of order execution design, multilevel branch prediction for complex workloads, large caches and a host of features designed specifically to facilitate operational analytics. The zEC12 has established itself as a premiere host for decision-management systems.
In this post I’ve just been able to scratch the surface in showing that yes, you can (and should!) do analytics on the mainframe. For more information and proof points, please check out the mainframe business analytics and data warehousing page.
41

As you can tell by now, Paul’s focus is on the mainframe and the IBM System z. He continues with the following post that discusses the Apache Hadoop project on the mainframe.
The elephant on the mainframe
Just about anyone who has an interest in big data is likely familiar with the cute little yellow elephant logo of the Apache Hadoop project. While attending the System z Information Management Boot Camp event in San Jose (a week of intensive training for IBMers and IBM Business Partners), I became convinced that the Hadoop elephant has a very legitimate—and differentiated—role to play on IBM System z. Even better—through one of these IBM Business Partners, the elephant is already on the mainframe!
In the interest of full disclosure, if you follow my blog posts you know that I’m not a fan of the term big data (see here and here) because it tends to narrow the scope of analytics to just the world of Hadoop MapReduce processing. That view hasn’t changed. However, there are strong use cases where using Hadoop to analyze data makes sense, and running Hadoop on System z can provide clients with a distinct advantage.
Last fall, when Gartner asked clients what sources of data they intended to analyze in their big data initiatives, an overwhelming 70 percent noted the need to analyze transactions.1 This is in line with my own views of where the analytics focus should be, and it is why we’re seeing strong interest in breakthrough mainframe technologies such as the IBM DB2 Analytics Accelerator for z/OS. However, it’s important to note that the next two responses, with strong results, were log data and machine or sensor data.
In addition to being the source of much (dare I say most?) transaction data, System z also holds significant volumes of log and machine data. Since this data is mainly unstructured or of variable structure, choosing to use Hadoop to gain insights from this data is a sound technological decision.
When I attended IBM’s Information on Demand® conference last year I had a brief lunchtime meeting with Yannick Barel, vice president of worldwide sales for a company called Veristorm (see my IODiary blog post). Yannick was also at Boot Camp last month, and we spent a lot more time talking about their solution, called VStorm Enterprise.
VStorm Enterprise consists of two capabilities, both of which run exclusively on Linux on IBM System z:
� VStorm Connect – a set of native data collectors that uses a graphical interface to facilitate the movement of z/OS data to HDFS (the Hadoop Distributed File System) files. Any required transformations (EBCDIC to ASCII code page conversations, for example) are handled automatically.
� zDoop – the industry’s first commercially supported Hadoop distribution for System z.
I got to see a demo of vStorm Enterprise from Yannick, and it is an impressive product indeed. Using panels and just clicking off boxes with VStorm Connect, Yannick populated a zDoop Linux on System z HDFS file with data from z/OS. Simple as that.
Originally posted at: http://www.smartercomputingblog.com/big-data-analytics/mythbusters-analytics-episode-ii/
1 Gartner research note: “Survey Analysis – Big Data Adoption in 2013 Shows Substance Behind the Hype,” September 12, 2013. Analyst(s): Lisa Kart, Nick Heudecker, Frank Buytendijk
42 Smarter Infrastructure: Thoughts on big data and analytics
So what’s the advantage of deploying Hadoop on System z, as opposed to some other platform?
I’ve discussed the use of Hadoop for log processing with several clients who have been hesitant to do so because of concerns over moving sensitive data to distributed systems. Having the HDFS remain on System z maintains mainframe security over the data and simplifies compliance with enterprise data governance controls. Keeping mainframe data on the mainframe is a critical requirement for many clients, and zDoop allows them to use Hadoop to process those logs without that data ever leaving the security zone of their mainframe box.
VStorm Enterprise is also proving to be quite efficient. Veristorm worked with IBM’s Poughkeepsie lab (my home base) to run a series of performance tests and demonstrated that their product could collect and process two billion records in two hours using the capacity of only two IFLs (IBM Integrated Facility for Linux: attractively priced mainframe processors for dedicated Linux environments).
And considering the legendary reliability of mainframe storage, I would venture to say that further efficiencies could be achieved by reducing the number of times files are replicated in a Hadoop cluster (a technique used to protect against disk and system failure in less reliable distributed systems; here’s a good tutorial).
All in all I was very impressed with the VStorm Enterprise product and look forward to continued work with Yannick and the rest of the Veristorm team in developing detailed use cases and cooperatively working with clients. Want to see VStorm Enterprise in action? Here’s a great video demonstration:
https://www.youtube.com/watch?v=OzY3YsGyTvc&feature=youtu.be
Do you have ideas for use cases that could benefit from Hadoop on System z?
Paul continues his description of Apache Hadoop on the mainframe with some announcements that were made on October 7, 2014.
The elephant on the mainframe is getting bigger!
Previously I had written a blog post about the value of Apache Hadoop on the mainframe (“The elephant on the mainframe” on page 42) and how our IBM Business Partner Veristorm had made Hadoop on the mainframe a solid reality. On October 7, 2014 I was very excited to be part of some new announcements in this space that were made at the IBM Enterprise2014 conference, and I figured that this was a good time for a quick blog update.
Before I get to the new Hadoop announcements, let me say a few things about the conference in general. This year’s Las Vegas event was huge, a complete (and quick, I’m told) sellout that filled the Venetian and Palazzo complex with IBM System z and IBM Power Systems enthusiasts. Mainframe analytics is my personal focus area, so it was great to see Ross Mauri, IBM general manager of System z, devote so much of his keynote address to the work we’re doing to integrate transactions and analytics. I also had the opportunity to speak on this topic at the System z technical track opening session. Lots of great sessions; lots of client face time!
Originally posted at: http://www.smartercomputingblog.com/big-data-analytics/the-elephant-on-the-mainframe/
43
Now, back to Hadoop. Beth Smith, IBM general manager for information management, dedicated her Executive Summit keynote to Hadoop and made several key announcements relative to System z.
First, IBM InfoSphere BigInsights 2.1.2 is now available for Linux on System z. BigInsights takes Hadoop to a whole new level for the enterprise. It is 100 percent open source Hadoop augmented with a rich set of optional features that add value without compromising standards. For business analysts more comfortable with Structured Query Language (SQL) syntax or a spreadsheet interface, or who need a more advanced environment for statistical programming like R, BigInsights delivers these capabilities and more—such as accelerators to simplify the extraction of insights from textual data, social media and log files. It really is a big advancement for exploratory analytics on the mainframe!
BigInsights was actually enabled for System z back in August, so the product is available now.
Having an advanced Hadoop distribution on the mainframe is just part of the story; it’s also necessary to have a secure, easy to use, fast and low cost mechanism for populating System z Hadoop clusters with System z data. In my previous blog post I wrote about Veristorm’s vStorm Connect product, advanced technology that integrates with native System z security mechanisms and exposes a simple interface for loading files into Hadoop. The second announcement, therefore, was a preview of IBM InfoSphere System z Connector for Hadoop, an upcoming new product that delivers this advanced Veristorm technology as part of the InfoSphere brand.
With these two announcements, you now have a complete, enterprise-class solution from IBM for using Hadoop to analyze mainframe data without ever having to move that data off platform!
We finish our description of how the mainframe is well suited to support big data analytics with the following post from Paul where he takes us on a trip back through time.
How IBM uses the mainframe to bring analytics back to the future
To conduct the background research for this blog post, I hopped into my DeLorean time machine (what, you don’t have one?), set the time circuits for 1976 and visited the IT shops of a few major enterprises.
1976Aside from getting the chance to relive the US Bicentennial celebration, I wanted to check out data centers before companies like Teradata and Oracle came on the scene, and before UNIX had made serious inroads into major corporations. As expected, IBM’s System/370 architecture was handling virtually all enterprise processing needs at this time. I saw big mainframes conduct online transactions all day, every day, and produce analytic reports all night. It was a very cohesive, consolidated and controlled environment.
1991Next, I moved forward 15 years to early 1991. Pausing briefly at a newsstand to check out the March issue of InfoWorld, in which editor Stewart Alsop famously predicted that the last mainframe would be unplugged on March 15, 1996, I reprised my data center tour.
Originally posted at: http://www.smartercomputingblog.com/system-z/mainframe-hadoop-elephant/
44 Smarter Infrastructure: Thoughts on big data and analytics

This time I encountered a completely different scene. Mainframes were still handling the bulk of the world’s transactional operations, but now many of them were surrounded by a variety of mid-tier and personal computing systems copying their data for offline analysis. In this era, I could see how one might jump to the conclusion that the mainframe might indeed eventually be overrun by this increasingly invasive species of computers.
2007Having enough fuel in the flux capacitor for one more jump before returning to present time, I stopped by an IBM customer conference in the fall of 2007—being careful to avoid contact with my 2007 self so I wouldn’t unintentionally erase my own future.
Not only did mainframes survive their predicted 1996 demise, but they were thriving despite the fact that the number of real and virtual distributed systems surrounding them had grown by orders of magnitude. IBM is no different from any large company, and it too had surrounded its mainframes with large numbers of distributed systems. And, like most large companies, it was facing the same challenges and costs in maintaining them.
I came back to this specific point in 2007 because it was the first time I heard of IBM’s ambitious plan to regain control of its data centers. The session I attended introduced our customers to Project Big Green, a plan to consolidate 3,900 stand-alone, distributed servers to just 30 System z Linux virtual images. I remember this session really catching my attention because the value proposition to IBM was significant.
If I had enough fuel for one more jump before returning, I would have come back to this conference a few years later to relive a very interesting talk by IBMer Larry Yarter, who discussed an outgrowth of Project Big Green called IBM Blue Insight™. The goal of Blue Insight was to shift all of IBM’s internal analytics processing from departmental servers to a centralized, software as a service (SaaS), private cloud model.
Present DayHaving returned from my research runs, I phoned Larry to find out how things had progressed over the three-plus years since I heard him talk about Blue Insight at that conference. The results are nothing short of spectacular.
Larry is now an IBM Senior Technical Staff Member and the Chief Architect at what has come to be known as the Business Analytics Center of Competence (BACC). The environment that Larry described to me had the consolidated feel of 1976 that IT organizations loved, but with the freedom and flexibility demanded by business units in 2013.
Back in 2009, when Blue Insights was initiated, IBM was supporting some 175,000 users on stand-alone clients and hundreds of highly underutilized Brio/Hyperion servers. The acquisition of Brio/Hyperion software by Oracle in 2007, plus IBM’s own acquisition of Cognos® that same year, meant that the company would be undergoing an inevitable and significant software shift. But rather than just converting everything from Brio to Cognos on the same inefficient server base, IBM decided to also transform its analytics capabilities to a centralized service based on a private cloud model. A private cloud deployed on System z Linux.
Now, in 2013, this model has been operational for several years. I wanted to know if this System z-based private cloud model was working, and I asked Larry for some tangible proof points. Here’s what he told me:
� Immediate payback. Initial savings to the company, simply from unplugging all those old Brio servers and replacing them with System z, has been figured to be in the range of $25 million over five years. These were hard savings: floor space, environmentals, networking gear, provider contracts and so on. Larry pointed out that $35–$50 million in “soft” savings
45
was also achieved by avoiding project-by-project analytics infrastructure costs that would have been required to accommodate new transformational investments.
� Cost avoidance. When Blue Insights first went live, Larry and his team were able to onboard a new project of 5,000 users in a couple of weeks for a cost of around $25,000. Today, a new project onboards in days for a cost of around $13,000. Compare this to a typical time of six to eight months and a cost of up to $250,000 to get the same project running on dedicated servers: we’re talking about providing the same capabilities at pennies on the dollar, and in a fraction of the time.
� Extreme virtualization. Today Blue Insights supports approximately 500 projects, comprising 200,000 named users, and drawing on 300–400 data sources. All on—get this—just two production instances of Cognos installed on System z Linux. And the main reason there are two instances, not one, is to keep internal and business partner users separated. It only takes around two dozen staff to support and operate the entire environment.
� Extreme insights. The analytics performed on these systems have generated hundreds of millions of dollars’ worth of insights for IBM. Over 3.3 million reports were run in 4Q2012, with a peak daily usage of 89,386 reports run on February 28th of last year.
I have far too many notes to fit into this brief blog post. I highly recommend that you check out a few videos describing the project called “IBM System z Blue Insights Buyers Journey”: Challenges (Part 1 of 2) and Solution (Part 2 of 2). You might also want to read this case study.
I asked Larry what the “next big thing” would be at Blue Insights. Larry described some really cool projects, such as integration of additional data and analytics services for “big” social data, but the one that really caught my attention was the planned introduction of analytics acceleration appliances.
Today, the majority of the hundreds of data sources being analyzed with Blue Insights resides on DB2 z/OS. So Larry and his team are in the process of installing some IBM DB2 Analytics Accelerators to deliver significant acceleration of those workloads. I’ve seen firsthand how Swiss Re and Aetna have benefitted from these appliances, and I was really excited to learn that IBM would be getting the same benefit! If you’re not familiar with the Analytics Accelerator, my colleague Niek de Greef published an excellent blog post on the topic.
Blue Insights supplies IBM’s analysts with the same flexibility and support for creative analysis as before, but at a fraction of the cost and with more IT responsiveness. This is done by creating a clear distinction between well-defined services (the infrastructure, software and service level provided by Blue Insights) and business solutions (the data and creative analysis provided by users).
And although there are some clear and tangible cost savings produced by running this private, service-based cloud on System z, that’s not actually the main reason why Blue Insights is based on the mainframe. As Larry says, “we chose System z because it provides the best platform for enterprise-scale analytics as a share-all private cloud.”
Back to the futureBack in the 1990s, analytics was not integral to business operations. It was ok—and in fact architecturally recommended—to copy all the data out to distributed systems and perform the analytics on a best-can-do basis. These days this is no longer a viable model; analytics is becoming integral to the day-to-day performance of an enterprise, and organizations are starting to realize that to be truly effective and differentiated they must demand the same service levels from their analytics systems that they do for their operational systems (I d
46 Smarter Infrastructure: Thoughts on big data and analytics
Traditional, expensive data warehousing philosophies that copy data out of mainframes to distributed systems in formats specifically suited to analysts’ needs are being challenged. The advent of analytics appliances and “in memory” techniques allow analytics to be performed closer to the source data, in its original format, in real time.
The mainframe is really the only platform equipped to deliver access to both real-time and historical information, on a single architecture, using a centralized suite of tools, while simultaneously managing both transactional and analytical processing of that data.
It’s 1976 all over again. But better!
How is your data center architected for analytics? Are you still following a 1990s distributed model? Are you having difficulty managing legions of stand-alone servers, as IBM was in 2007? If so, you may want to consider taking a trip back to the future and bringing that processing back to where the source data is—back to the mainframe.
Summary
This is the end of our big data and analytics journey for now. We have tried to cover some of the most important aspects of big data analytics in an easy-to-read format. We hope that this book will serve as a big data analytics primer for our readers.
Your feedback is very important for us. If you have comments on the blog or want to become a contributor, you can contact Catherine Nicholson at [email protected]. For your comments on this book, you can contact Deb Landon at [email protected].
If you have questions to our bloggers on any of their posts published in this book or want to add a comment, use the links at the end of each post to open the post and submit your question or comment.
We hope that you have enjoyed our bloggers and will join the conversation on the Smarter Computing Blog at:
http://smartercomputingblog.com
Other resources for more information
For more information on smarter computing you can visit the following websites:
� IBM big data case studies website
http://www-03.ibm.com/systems/infrastructure/us/en/big-data-case-studies/index.html?cmp=ibmsocial&ct=stg&cr=sc&cm=h&ccy=us
Originally posted at:
� How IBM uses the mainframe to bring analytics back to the future – Part 1
http://www.smartercomputingblog.com/system-z/mainframe-analytics-future/
� How IBM uses the mainframe to bring analytics back to the future – Part 2
http://www.smartercomputingblog.com/big-data-analytics/mainframe-analytics-insights/
47
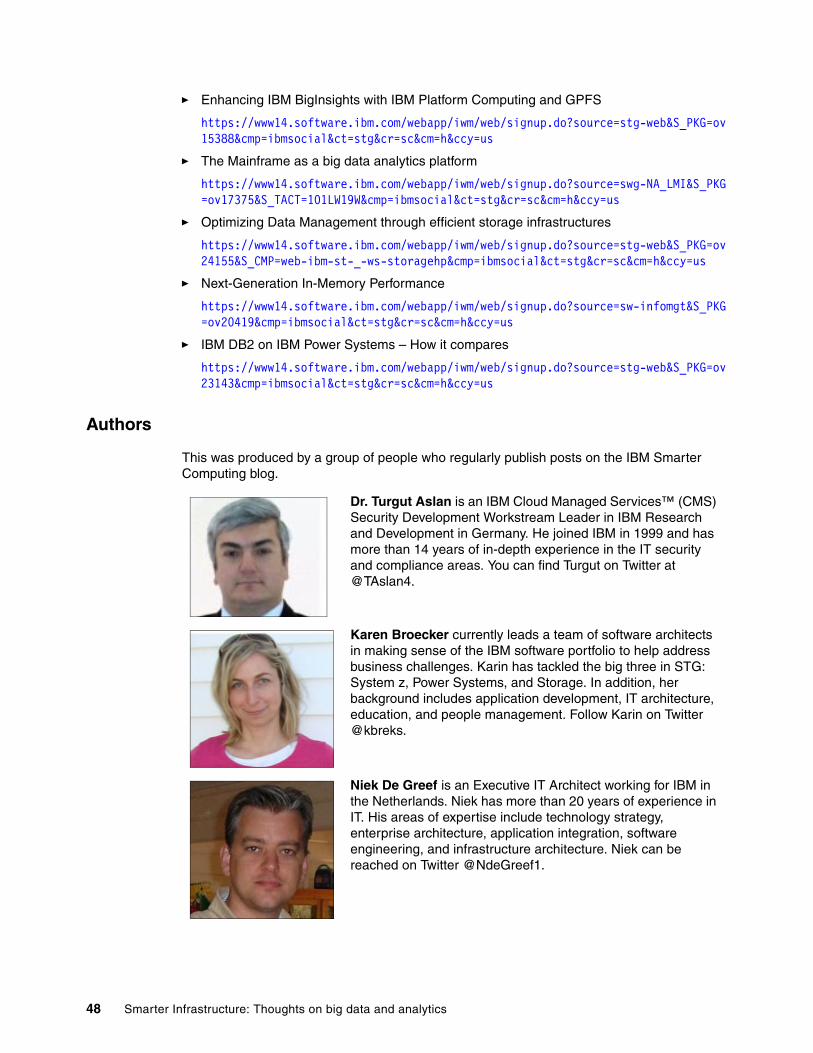
� Enhancing IBM BigInsights with IBM Platform Computing and GPFS
https://www14.software.ibm.com/webapp/iwm/web/signup.do?source=stg-web&S_PKG=ov15388&cmp=ibmsocial&ct=stg&cr=sc&cm=h&ccy=us
� The Mainframe as a big data analytics platform
https://www14.software.ibm.com/webapp/iwm/web/signup.do?source=swg-NA_LMI&S_PKG=ov17375&S_TACT=101LW19W&cmp=ibmsocial&ct=stg&cr=sc&cm=h&ccy=us
� Optimizing Data Management through efficient storage infrastructures
https://www14.software.ibm.com/webapp/iwm/web/signup.do?source=stg-web&S_PKG=ov24155&S_CMP=web-ibm-st-_-ws-storagehp&cmp=ibmsocial&ct=stg&cr=sc&cm=h&ccy=us
� Next-Generation In-Memory Performance
https://www14.software.ibm.com/webapp/iwm/web/signup.do?source=sw-infomgt&S_PKG=ov20419&cmp=ibmsocial&ct=stg&cr=sc&cm=h&ccy=us
� IBM DB2 on IBM Power Systems – How it compares
https://www14.software.ibm.com/webapp/iwm/web/signup.do?source=stg-web&S_PKG=ov23143&cmp=ibmsocial&ct=stg&cr=sc&cm=h&ccy=us
Authors
This was produced by a group of people who regularly publish posts on the IBM Smarter Computing blog.
Dr. Turgut Aslan is an IBM Cloud Managed Services™ (CMS) Security Development Workstream Leader in IBM Research and Development in Germany. He joined IBM in 1999 and has more than 14 years of in-depth experience in the IT security and compliance areas. You can find Turgut on Twitter at @TAslan4.
Karen Broecker currently leads a team of software architects in making sense of the IBM software portfolio to help address business challenges. Karin has tackled the big three in STG: System z, Power Systems, and Storage. In addition, her background includes application development, IT architecture, education, and people management. Follow Karin on Twitter @kbreks.
Niek De Greef is an Executive IT Architect working for IBM in the Netherlands. Niek has more than 20 years of experience in IT. His areas of expertise include technology strategy, enterprise architecture, application integration, software engineering, and infrastructure architecture. Niek can be reached on Twitter @NdeGreef1.
48 Smarter Infrastructure: Thoughts on big data and analytics

Paul DiMarzio has 30+ years experience with IBM, focused on bringing new and emerging technologies to the mainframe. He is currently responsible for developing and running IBM worldwide z Systems big data and analytics portfolio marketing strategy. You can reach Paul on Twitter @PaulD360.
Renato Stotfalette Joao is a Software Engineer at Linux Technology Center (LTC), IBM Brazil. His work in LTC consists of interactions with various open source Linux communities and development of extensions for Eclipse environment using the Java language. He holds a degree in Computer Science from Universidade Estadual Paulista (UNESP) and is working on a master's degree program from Universidade Federal do ABC (UFABC). You can find Renato on Twitter @renatosjoao.
Philippe Lamarche is an IBM Infrastructure Architect after a long career in the hardware division (STG), working with French industry customers and System Integrators. He has spent over 30 years at IBM in different technical positions. He is a Certified IT Specialist and Infrastructure Architect at the expert level. He is involved in key French Cloud and IBM PureFlex® projects, especially in the industry area. He runs Smarter Computing workshops in France and has participated in two Power AIX® related IBM Redbooks® projects. You can find Philippe on Twitter @philip7787.
Catherine Nicholson is a Social Business Manager for IBM Smarter Computing. Working from her professional experience in social media and content development, she believes in bringing a personality to brands to drive engagement and value. Connect with Catherine on Twitter @CatNickery.
Siobhan Nicholson currently works as a Client Technical Advisor for Consumer Product accounts within the UK. This includes building an understanding of her clients environments, identifying technical challenges, and using IBM technical resources for the benefit of her clients. Siobhan has worked at IBM for over 18 years in various technical roles. Most of her career has been working as an Application Architect across multiple industries delivering complex integration projects. You can find Siobhan on Twitter @SUN_Gator.
49
Now you can become a Smarter Computing contributor too!
Here’s an opportunity to spotlight your skills, grow your career, and become a blog author—all at the same time! You can contact Catherine Nicholson (Smarter Computing editor-in-chief at [email protected]) if you’d like to join the Smarter Computing bloggers team.
IBM Employees are subject to the Social Computing Guidelines and IBM’s Business Conduct Guidelines. IBM will, in its discretion, remove content which violates these Community Guidelines.
You can also join one of the social media residencies offered by ITSO Redbooks Team to learn more about blogging and how to use social media for business purposes. Refer to the residency announcement for prerequisites and eligibility requirements for these residencies. Find out more about the residency program, browse the residency index, and apply online at:
http://www.redbooks.ibm.com/Residents.nsf/ResIndex?OpenView&Start=1
Comments welcome
Your comments are important to us!
We want our blogs to be as helpful as possible. Send us your comments about this or other IBM Redbooks publications in one of the following ways:
� Use the online Contact us review Redbooks form found at:
ibm.com/redbooks
� Send your comments in an email to:
� Mail your comments to:
IBM Corporation, International Technical Support OrganizationDept. HYTD Mail Station P0992455 South RoadPoughkeepsie, NY 12601-5400
Stay connected to IBM Redbooks
� Find us on Facebook:
http://www.facebook.com/IBMRedbooks
Dr. Linton Ward is an IBM Distinguished Engineer in the IBM Systems and Technology Group where his current focus is on leadership analytics and big data on Power Systems. He has been actively engaged in leading hardware-software stack optimization and hardware design for numerous integrated offerings, including IBM PureSystems®. As a systems and solutions architect, Linton brings a unique combination of hardware insight, deep understanding of software needs, and client experience. He regularly meets with clients to help them understand the analytic space and determine the next steps in their analytic journey.
50 Smarter Infrastructure: Thoughts on big data and analytics

� Follow us on Twitter:
http://twitter.com/ibmredbooks
� Look for us on LinkedIn:
http://www.linkedin.com/groups?home=&gid=2130806
� Explore new Redbooks publications, residencies, and workshops with the IBM Redbooks weekly newsletter:
https://www.redbooks.ibm.com/Redbooks.nsf/subscribe?OpenForm
� Stay current on recent Redbooks publications with RSS Feeds:
http://www.redbooks.ibm.com/rss.html
51

52 Smarter Infrastructure: Thoughts on big data and analytics

Notices
This information was developed for products and services offered in the U.S.A.
IBM may not offer the products, services, or features discussed in this document in other countries. Consult your local IBM representative for information on the products and services currently available in your area. Any reference to an IBM product, program, or service is not intended to state or imply that only that IBM product, program, or service may be used. Any functionally equivalent product, program, or service that does not infringe any IBM intellectual property right may be used instead. However, it is the user's responsibility to evaluate and verify the operation of any non-IBM product, program, or service.
IBM may have patents or pending patent applications covering subject matter described in this document. The furnishing of this document does not grant you any license to these patents. You can send license inquiries, in writing, to: IBM Director of Licensing, IBM Corporation, North Castle Drive, Armonk, NY 10504-1785 U.S.A.
The following paragraph does not apply to the United Kingdom or any other country where such provisions are inconsistent with local law: INTERNATIONAL BUSINESS MACHINES CORPORATION PROVIDES THIS PUBLICATION "AS IS" WITHOUT WARRANTY OF ANY KIND, EITHER EXPRESS OR IMPLIED, INCLUDING, BUT NOT LIMITED TO, THE IMPLIED WARRANTIES OF NON-INFRINGEMENT, MERCHANTABILITY OR FITNESS FOR A PARTICULAR PURPOSE. Some states do not allow disclaimer of express or implied warranties in certain transactions, therefore, this statement may not apply to you.
This information could include technical inaccuracies or typographical errors. Changes are periodically made to the information herein; these changes will be incorporated in new editions of the publication. IBM may make improvements and/or changes in the product(s) and/or the program(s) described in this publication at any time without notice.
Any references in this information to non-IBM Web sites are provided for convenience only and do not in any manner serve as an endorsement of those Web sites. The materials at those Web sites are not part of the materials for this IBM product and use of those Web sites is at your own risk.
IBM may use or distribute any of the information you supply in any way it believes appropriate without incurring any obligation to you.
Any performance data contained herein was determined in a controlled environment. Therefore, the results obtained in other operating environments may vary significantly. Some measurements may have been made on development-level systems and there is no guarantee that these measurements will be the same on generally available systems. Furthermore, some measurements may have been estimated through extrapolation. Actual results may vary. Users of this document should verify the applicable data for their specific environment.
Information concerning non-IBM products was obtained from the suppliers of those products, their published announcements or other publicly available sources. IBM has not tested those products and cannot confirm the accuracy of performance, compatibility or any other claims related to non-IBM products. Questions on the capabilities of non-IBM products should be addressed to the suppliers of those products.
This information contains examples of data and reports used in daily business operations. To illustrate them as completely as possible, the examples include the names of individuals, companies, brands, and products. All of these names are fictitious and any similarity to the names and addresses used by an actual business enterprise is entirely coincidental.
COPYRIGHT LICENSE:
This information contains sample application programs in source language, which illustrate programming techniques on various operating platforms. You may copy, modify, and distribute these sample programs in any form without payment to IBM, for the purposes of developing, using, marketing or distributing application programs conforming to the application programming interface for the operating platform for which the sample programs are written. These examples have not been thoroughly tested under all conditions. IBM, therefore, cannot guarantee or imply reliability, serviceability, or function of these programs.
© Copyright IBM Corp. 2015. All rights reserved. 53
Trademarks
IBM, the IBM logo, and ibm.com are trademarks or registered trademarks of International Business Machines Corporation in the United States, other countries, or both. These and other IBM trademarked terms are marked on their first occurrence in this information with the appropriate symbol (® or ™), indicating US registered or common law trademarks owned by IBM at the time this information was published. Such trademarks may also be registered or common law trademarks in other countries. A current list of IBM trademarks is available on the Web at http://www.ibm.com/legal/copytrade.shtml
The following terms are trademarks of the International Business Machines Corporation in the United States, other countries, or both:
AIX®BigInsights™Cognos®DB2®FlashSystem™GPFS™IBM Cloud Managed Services™IBM FlashSystem™IBM PureData™IBM SmartCloud®
IBM Watson™IBM®Information on Demand®InfoSphere®Insight™Power Systems™POWER8™PureData™PureFlex®PureSystems®
Redbooks®Redbooks (logo) ®SlamTracker®SPSS®System z®Texas Memory Systems®Watson™z/OS®zEnterprise®
The following terms are trademarks of other companies:
Netezza, and N logo are trademarks or registered trademarks of IBM International Group B.V., an IBM Company.
Texas Memory Systems, and the Texas Memory Systems logo are trademarks or registered trademarks of Texas Memory Systems, an IBM Company.
Linux is a trademark of Linus Torvalds in the United States, other countries, or both.
Java, and all Java-based trademarks and logos are trademarks or registered trademarks of Oracle and/or its affiliates.
UNIX is a registered trademark of The Open Group in the United States and other countries.
Other company, product, or service names may be trademarks or service marks of others.
Redbooks®
54 Smarter Infrastructure: Thoughts On Big Data And Analytics