smarter balanced scores guidance for different users of ... · pdf filesmarter balanced scores...
TRANSCRIPT

Smarter Balanced Scores –
Guidance for Different Users
of ResultsPresented to National Conference on Student
Assessment
June 22, 2016
Deb Sigman, Deputy Director, Standards,
Assessment, and Accountability Services, WestEd
Tony Alpert, Executive Director, Smarter Balanced
Joe Willhoft, Smarter Balanced Technical Advisor

Topics for Discussion
1. Making Meaning of Vertical
Scale and Precision of Scores -
2. Encouraging a Balanced
Assessment
3. Maximizing Use of the Statewide
Summative Assessment Results

A Balanced Assessment System
Standards set
expectations on path to college and
career readiness
All students graduate college
and careerready
Teachers and schools have
information and tools to improve
teaching and learning
Interim assessments Flexible, open, used for
actionable feedback
Summative assessments benchmarked to college
and career readiness(Grades 3-8 and 11)
Digital Library: Formative assessment
tools and practicesfor teachers to improve
instruction

Smarter
Balanced
Vertical Scales

Two Things to Know About
Smarter Balanced
1. Smarter scores are reported on an across-grade “Vertical Scale”– Vertical Scales can help evaluate student
growth over time
– SB scores generally have a range of 2000-3000

Smarter Balanced ELA/Literacy(Field test results)

Smarter Balanced Mathematics(Field test results)
Two Things to Know About
Smarter Balanced #2
1. Smarter scores are reported on an across-grade “Vertical Scale”
2. Threshold (“cut”) scores are also on the Vertical Scale
– Helps in understanding of achievement levels
– Useful for goal-setting

Smarter Balanced English Language
Arts/Literacy Threshold (Cut) Scores
Grade Level 2 Level 3 Level 4
3 2367 2432 2490
4 2416 2473 2533
5 2442 2502 2582
6 2457 2531 2618
7 2479 2552 2649
8 2487 2567 2668
11 2493 2583 2682

Smarter Balanced Mathematics
Threshold (Cut) Scores
Grade Level 2 Level 3 Level 4
3 2381 2436 2501
4 2411 2485 2549
5 2455 2528 2579
6 2473 2552 2610
7 2484 2567 2635
8 2504 2586 2653
11 2543 2628 2718

English Language Arts/Literacy
Threshold Scale Scores
2300
2350
2400
2450
2500
2550
2600
2650
2700
2750
2800
3 4 5 6 7 8 9 10 11
Thre
sho
ld S
ca
le S
co
re
Grade
Level 4
Level 3
Level 2

Mathematics
Threshold Scale Scores
2300
2350
2400
2450
2500
2550
2600
2650
2700
2750
2800
3 4 5 6 7 8 9 10 11
Thre
sho
ld S
ca
le S
co
re
Grade
Level 4
Level 3
Level 2

Assessment Precision

User Tips for Standard Errors #1
1. For most tests, the standard error is about 1/3 of a standard deviation
– On a “Fixed Form” test, this is true for the middle of the distribution
– On an adaptive test, this is true for more students, esp. at the extremes

Smarter Balanced Means and s.d.’sfor ELA and Math (2014 Field Test data)
Subject Grade Mean (Std. Dev.) Low High
3 2401.9 (91.0) 2114 2623
4 2444.1 (95.4) 2131 2663
ELA 5 2481.6 (94.2) 2201 2701
6 2503.5 (94.8) 2210 2724
7 2518.0 (96.9) 2259 2744
8 2541.0 (96.8) 2288 2769
11 2554.3 (103.1) 2299 2795
3 2413.0 (77.5) 2189 2621
4 2458.8 (79.3) 2204 2659
MATH 5 2487.6 (86.2) 2219 2700
6 2507.0 (94.9) 2235 2749
7 2515.8 (106.0) 2250 2779
8 2528.9 (112.7) 2265 2802
11 2568.0 (125.0) 2280 2862
Scale Scores Observed Range

User Tips for Standard Errors #2
1. For most tests, the SEM is about 1/3 of a standard deviation
2. “Working estimate” of Smarter SEM is about 30 scale score points
– For a student, add and subtract about 30 points to get a range of “likely” scores
– So, a student with a score of 2550 would likely score between 2520-2580 if tested again

User Tips for Standard Errors #3
1. For most tests, the SEM is about 1/3 of a std.
deviation
2. A good working estimate of the SEM is about
30 scale score points
3. The “30-6-3-1 Rule”
– For 1 student, SEM is about 30 points
– For a “classroom” (~25), SEM is about 6 points
– For a “grade team” (~100) SEM is about 3 points
– For a “district” (>1,000) SEM is about 1 point

User Tips for Standard Errors #4
1. For most tests, the SEM is about 1/3 of a
std. deviation
2. A good working estimate of the SEM is
about 30 scale score points
3. The “30-6-3-1 Rule”
4. Smarter “Claim Scores” use the
SEM around the Level 2/3 Cut
Score as a “Borderline” category

Claim Scores
• Claim Scores (e.g., “Reading”) indicate
if student is:
– “Below Standard”
• Clearly below the Level 2/3 cut score;
– “Above Standard”
• Clearly above the Level 2/3 cut; or
– “At or Near Standard”
• Too close to call

Interim Assessments –
Use and Purpose

A Balanced Assessment System
21
Standards set
expectations on path to college and
career readiness
All students graduate college
and careerready
Teachers and schools have
information and tools to improve
teaching and learning
Interim assessments Flexible, open, used for
actionable feedback
Summative assessments benchmarked to college
and career readiness(Grades 3-8 and 11)
Digital Library: Formative assessment
tools and practicesfor teachers to improve
instruction

Smarter Balanced Interim
Assessments
22
• Items developed in the same manner as the
summative assessment
• 2 Flavors, Comprehensive and Blocks
• Include all the resources, supports and
embedded accommodations of the summative
(Braille, ASL, Full Spanish Translations)
• Assesses the same breadth and depth of
content
• Requires educator hand-scoring

Smarter Balanced Formative
Process
• Clarify intended learning
• Elicit evidence
• Interpret evidence
• Act on evidence

Implementation
• Assessment as the beginning of the formative process
– Baseline for growth analyses
– Identification of relative strengths
– Confirmation of other information elicited from the formative
process
• Assessment as an outcome evaluation of the process
– Enhance collection of evidence from the formative process
– Evaluate progress
– Identify students for whom additional information is needed

Reporting Interim Assessments
• Provides unique challenges for
reporting given that the purposes for
the assessments differ
• Differences in purposes may result in
differences in administration conditions
(administration dates, timed/untimed,
level of independence, resources and
supports available

Evaluation
• Analysis of Aggregate and Individual Student Growth data from interim assessments should be considered in the context of the original purpose for the administration.
• Smarter Balanced supports a code for districts to identify “standardized” and “non-standardized” interim assessments

Closing the Loop
• Item Mapping Project• Connecting the results of assessments to
the digital library through moderated teacher judgement
• Supports teacher professional judgement consistent with our theory of action
• Provide a look-up table for service providers to support Smarter Balanced members
• Small scale trial in June, pilot in August

Maximizing Use of the
Statewide Summative
Assessments

Past? – Not so Much
“Too often, testing is treated narrowly, rather than as a flexible tool to obtain information about important questions.”
U.S. Congress, Office of Technology Assessment, Testing in American Schools: Asking the Right Questions, OTA-SET-519 (Washington, DC: U.S. Government Printing Office, February 1992)

ESSA Core Ideas or Pillars of the Law --
Promotion of Educational Excellence and
Equity
Standards-Assessment
Disaggregation, Transparency, and Accountability
School Support and Interventions

ESSA Shift in Balance of Power
Federally-Defined State and Local
Pillars Autonomy

Opportunity to Move Forward or
Retreat?

Disconnect between Assessment
Purpose and Use of Data
• How can we close the assessment literacy gap
• How can we encourage appropriate and effective use of summative assessment results
• How can we manage expectations for different audiences

What is Missing – Connecting
Assessment to Improved Teaching and
Learning
• Moving from accountability
• States have more flexibility
• Finding the rightful place,
rightful use of summative
assessments

Making the Most of Scores in
an Instructional Planning Cycle
Summative Assessment

Results of a Statewide Summative Assessment Are
Like the Tip of the Iceberg – It Pays to Pay Attention

Making the Most of Summative Results
37
• Provide a general information/direction ad a
necessary story
• Provide an entry point into a collaborative, honest
conversation
• Rarely provide definitive answers, but raise many
questions allowing reflection on practice
• Not the whole story, but a necessary story
• Must dig deeper to determine cause – other
assessments, evidence to support possible
reasons for performance

• Missed opportunities if focus is strictly about increasing scores
• Comprehensive, complex, difficult process– Not a check list
– Not meant to be completed at a single staff meeting or a single PD event
• Collaborative process that requires– Honesty
– Willingness to commit the time
– Ability to handle ambiguity
Using Cycle of Inquiry to Focus on
Improving Teaching and Learning

Effectively Using the Statewide
Summative Assessment Results
Develop and use tools to manage the data
and expectations.
Develop and use tools effectively to reflect on
instructional practice and standards
implementation.
Develop and use evidence to inform practice
and improve teaching and learning.
39

Telling the Story with Assessment
Evidence• Communicating the message
– Message sent
– Message received
• Managing the message
– Emphasis
– Spotlight
– Focus
• Knowing the Audience
– Different audiences demand different information
explained in different ways

California ELA/Literacy Achievement
Disparities:Percentage of Students Meeting or Exceeding
Standards
0 20 40 60 80 100
Two or More
Black/Afr-Amer
American Indian
Asian
Filipino
Hispanic
Pacific Islander
White
SWD
SED
English Learners
All Students
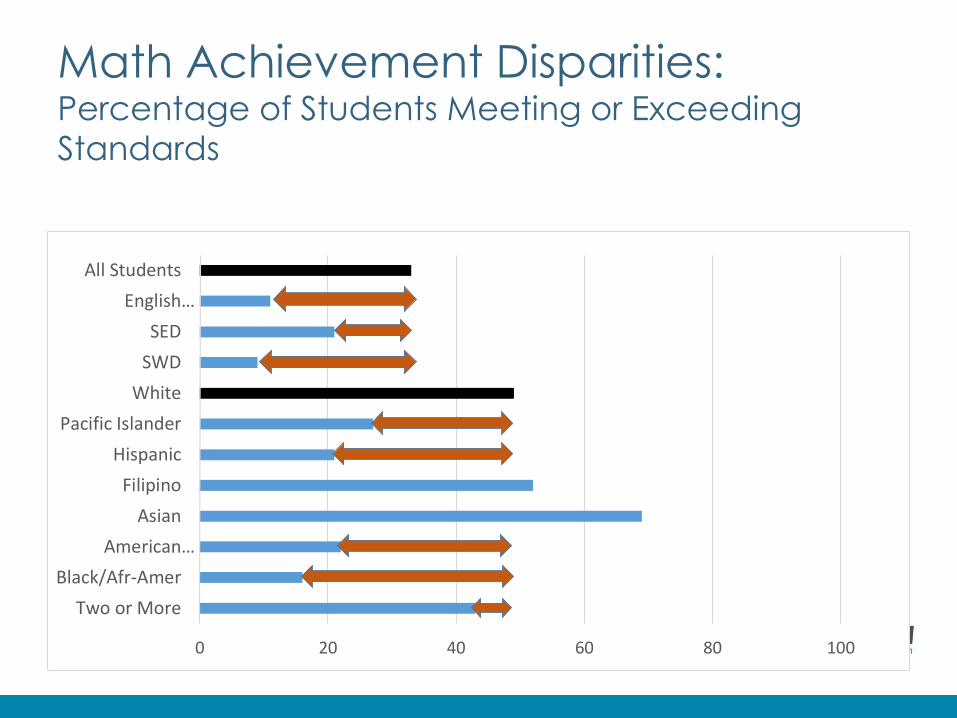
Math Achievement Disparities: Percentage of Students Meeting or Exceeding
Standards
0 20 40 60 80 100
Two or More
Black/Afr-Amer
American…
Asian
Filipino
Hispanic
Pacific Islander
White
SWD
SED
English…
All Students

Call to Action – Move Beyond the Scores
to Focus on Instructional Planning Cycle
43
• Data (scores) are necessary, but not
sufficient
• Engage in honest dialogue to increase
assessment literacy
• Reflect on what we can control─Policies and Procedures
─Practice
─Programs

Avoid
Unintended
Consequences
– Take
Advantage of
the Summative
Message• Be mindful
• Recognize when the
course needs to
change