smarter balanced preliminary performance levels - nwea · pdf filesmarter balanced preliminary...
TRANSCRIPT
Partnering to Help All Kids Learn® | NWEA.org | 503.624.1951 | 121 NW Everett St., Portland, OR 97209
Smarter Balanced Preliminary Performance Levels
Estimated MAP Scores Corresponding to the Preliminary Performance Levels of the Smarter Balanced Assessment Consortium (Smarter Balanced)
Recently, the Smarter Balanced Assessment Consortium (Smarter Balanced) released a document that established initial performance levels and the associated threshold scale scores for the Smarter Balanced assessment. The report included estimated percentages of students expected to perform at each of the four performance levels, reported by grade and test subject (e.g., English Language Arts or Mathematics), based on preliminary field testing of the Smarter Balanced assessment conducted during the spring of 2014.
These threshold scale scores and expected percentages represent a preliminary attempt at standard setting, and Smarter Balanced may revise them after the spring 2015 testing term. Nevertheless, they represent the best information currently available about the cut scores that will be used during the spring 2015 testing term of the Smarter Balanced test.
Using the information provided within the Smarter Balanced report about the percentages of students expected to perform at each level, Northwest Evaluation Association™ (NWEA™) conducted a series of analyses to examine what Measures of Academic Progress® (MAP®) interim assessment scores might be associated with these performance level categories.
This was not an empirical study in the manner of our normal scale linking studies, because the Smarter Balanced assessment has not yet been fully implemented. NWEA intends to work with its partner school districts to conduct such a study, examining the relationship between MAP performance and Smarter Balanced performance for individual students, once Smarter Balanced has been fully implemented within NWEA partner districts.
Partnering to Help All Kids Learn® | NWEA.org | 503.624.1951 | 121 NW Everett St., Portland, OR 97209
NWEA analyses focused on the percentages of students expected to perform within each of the Smarter Balanced performance levels. NWEA compared these percentages to our own nationally representative normative distributions in order to estimate the MAP scores that would produce similar percentages of students as those expected to fall within the Smarter Balanced performance level categories. The approach taken here is quite similar to the approach used in many prior linking studies, and can provide highly accurate estimates of cut scores.
This approach relies on the assumption that the population of students who completed Smarter Balanced field testing reasonably reflect the nationally representative NWEA norming population. Because the Smarter Balanced report included little information about the students who comprised the field test sample, other than the fact that they came from 21 states and the U.S. Virgin Islands, it is not known whether that sample was sculpted or weighted to resemble a nationally representative distribution of students. Consequently, NWEA does not know whether the percentages of students within each performance level reported by Smarter Balanced closely reflect the U.S. student population in general.
Nevertheless, this assumption provided a basis for estimating the MAP scores that correspond to the preliminary threshold scale scores reported by Smarter Balanced. These resulting cut scores fell precisely within a range consistent with other summative state tests currently in use that have defined proficiency standards around “college and career readiness.” These summative state tests formed the basis for the NWEA October 2014 Guidance Document for predicting student performance on both the Partnership for Assessment of Readiness for College and Careers (PARCC) and Smarter Balanced tests, now updated to serve states who aren’t using Smarter Balanced assessments.
To offer a comparison, figures 1 and 2 show how NWEA estimates for the initial Smarter Balanced cut scores for Level 3 in reading and math, respectively, compare to the proficiency standards currently in use within three states with Common Core-aligned summative tests: New York, Kentucky, and Illinois. In these figures, the proficiency standards are expressed as normative percentile ranks, which convey the relative difficulty of the standards. The Smarter Balanced standards fall within the middle of the range established by the other three tests.

Partnering to Help All Kids Learn® | NWEA.org | 503.624.1951 | 121 NW Everett St., Portland, OR 97209
Figure 1. “College and Career Ready” Proficiency Standards in Reading for Four Common Core-Aligned Summative Tests

Partnering to Help All Kids Learn® | NWEA.org | 503.624.1951 | 121 NW Everett St., Portland, OR 97209
Figure 2. “College and Career Ready” Proficiency Standards in Math for Four Common Core-Aligned Summative Tests

Partnering to Help All Kids Learn® | NWEA.org | 503.624.1951 | 121 NW Everett St., Portland, OR 97209
CUT SCORE AND PROBABILITY TABLESTable Sets 1 through 3 provide estimated MAP RIT cut scores associated with the initial Smarter Balanced performance level threshold scale scores and tables that provide estimates of performing at or above Performance Level 3 (i.e., “Proficient”), given an observed MAP RIT score. The tables show the estimated threshold RIT scores associated with each Smarter Balanced performance level for spring, winter, and fall testing seasons, respectively. These tables can be used to identify students who may need additional help to perform well on these tests.
Table Sets 4 through 6 show the estimated probability of a student receiving a Level 3 or higher on the Smarter Balanced assessment in spring, winter, or fall, respectively, based on that student’s observed RIT score and the estimated threshold cut scores reported in the prior table sets. These tables can be used to assist in identifying students who are not likely to pass Smarter Balanced assessments, thereby increasing the probability that intervention strategies will be planned and implemented. These tables can also be useful for identifying target RIT-score objectives likely to correspond to successful Level 3 performance on the Smarter Balanced assessment.
Table Set 1 – Estimated Fall MAP RIT Cut Scores Corresponding to the Smarter Balanced Assessment Consortium (Smarter Balanced) Performance Levels MATH – FALL SEASONCut Scores and Norm Percentiles for Each Performance Level
Grade Level 1 Level 2 Level 3 Level 4
Cut Score Cut Score Percentile Rank Cut Score Percentile
Rank Cut Score Percentile Rank
2* <172 172 32 181 61 193 88
3 <186 186 32 195 61 207 88
4 <195 195 27 208 63 218 87
5 <207 207 35 219 67 227 85
6 <213 213 35 226 67 236 86
7 <219 219 36 233 67 244 87
8 <225 225 38 238 68 249 87
9* <229 229 40 241 67 255 89
10* <229 229 40 242 67 257 89
11 <231 231 40 245 67 261 89
Partnering to Help All Kids Learn® | NWEA.org | 503.624.1951 | 121 NW Everett St., Portland, OR 97209
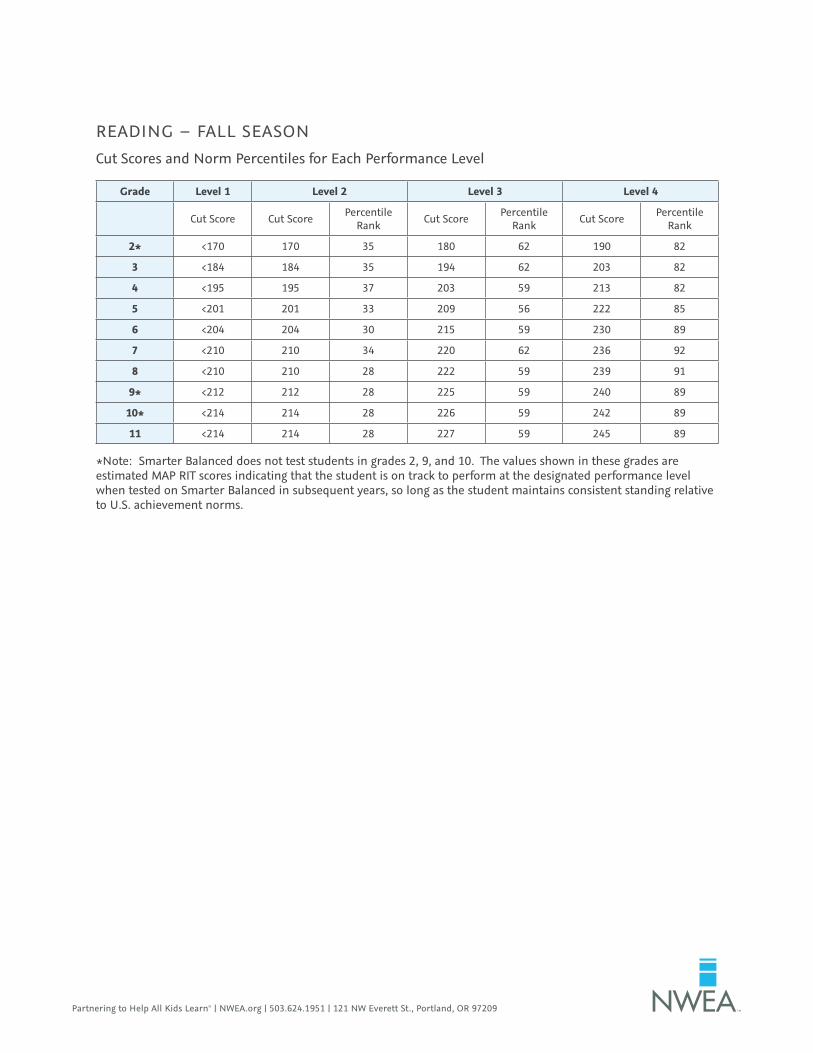
READING – FALL SEASONCut Scores and Norm Percentiles for Each Performance Level
Grade Level 1 Level 2 Level 3 Level 4
Cut Score Cut Score Percentile Rank Cut Score Percentile
Rank Cut Score Percentile Rank
2* <170 170 35 180 62 190 82
3 <184 184 35 194 62 203 82
4 <195 195 37 203 59 213 82
5 <201 201 33 209 56 222 85
6 <204 204 30 215 59 230 89
7 <210 210 34 220 62 236 92
8 <210 210 28 222 59 239 91
9* <212 212 28 225 59 240 89
10* <214 214 28 226 59 242 89
11 <214 214 28 227 59 245 89
*Note: Smarter Balanced does not test students in grades 2, 9, and 10. The values shown in these grades are estimated MAP RIT scores indicating that the student is on track to perform at the designated performance level when tested on Smarter Balanced in subsequent years, so long as the student maintains consistent standing relative to U.S. achievement norms.

Partnering to Help All Kids Learn® | NWEA.org | 503.624.1951 | 121 NW Everett St., Portland, OR 97209
Table Set 2 – Estimated Winter MAP RIT Cut Scores Corresponding to the Smarter Balanced Assessment Consortium (Smarter Balanced) Performance Levels MATH – WINTER SEASONCut Scores and Norm Percentiles for Each Performance Level
Grade Level 1 Level 2 Level 3 Level 4
Cut Score Cut Score Percentile Rank Cut Score Percentile
Rank Cut Score Percentile Rank
2* <179 179 32 189 61 200 88
3 <192 192 32 202 61 213 88
4 <200 200 27 213 63 224 87
5 <212 212 35 224 67 233 85
6 <217 217 35 229 67 239 86
7 <222 222 36 235 67 247 87
8 <227 227 38 241 68 252 87
9* <230 230 40 243 67 257 89
10* <230 230 40 244 67 258 89
11 <231 232 40 246 67 261 89
READING – WINTER SEASONCut Scores and Norm Percentiles for Each Performance Level
Grade Level 1 Level 2 Level 3 Level 4
Cut Score Cut Score Percentile Rank Cut Score Percentile
Rank Cut Score Percentile Rank
2* <178 178 35 188 62 197 82
3 <189 189 35 199 62 208 82
4 <198 198 37 206 59 216 82
5 <203 203 33 212 56 224 85
6 <206 206 30 217 59 232 89
7 <212 212 34 222 62 238 92
8 <212 212 28 224 59 241 91
9* <213 213 28 225 59 241 89
10* <214 214 28 227 59 242 89
11 <214 214 28 227 59 245 89
*Note: Smarter Balanced does not test students in grades 2, 9, and 10. The values shown in these grades are estimated MAP RIT scores indicating that the student is on track to perform at the designated performance level when tested on Smarter Balanced in subsequent years, so long as the student maintains consistent standing relative to U.S. achievement norms.

Partnering to Help All Kids Learn® | NWEA.org | 503.624.1951 | 121 NW Everett St., Portland, OR 97209
Table Set 3 – Estimated Spring MAP RIT Cut Scores Corresponding to the Smarter Balanced Assessment Consortium (Smarter Balanced) Performance Levels MATH – SPRING SEASONCut Scores and Norm Percentiles for Each Performance Level
Grade Level 1 Level 2 Level 3 Level 4
Cut Score Cut Score Percentile Rank Cut Score Percentile
Rank Cut Score Percentile Rank
2* <185 185 32 194 61 206 88
3 <197 197 32 206 61 218 88
4 <204 204 27 217 63 228 87
5 <215 215 35 227 67 236 85
6 <219 219 35 232 67 243 86
7 <224 224 36 238 67 250 87
8 <229 229 38 243 68 254 87
9* <231 231 40 244 67 259 89
10* <231 231 40 245 67 260 89
11 <233 233 40 247 67 263 89
READING – SPRING SEASONCut Scores and Norm Percentiles for Each Performance Level
GradeLevel 1 Level 2 Level 3 Level 4
Cut Score Cut Score Percentile Rank Cut Score Percentile
Rank Cut Score Percentile Rank
2* <184 184 35 194 62 203 82
3 <193 193 35 203 62 212 82
4 <202 202 37 210 59 219 82
5 <206 206 33 214 56 227 85
6 <208 208 30 219 59 234 89
7 <213 213 34 224 62 240 92
8 <213 213 28 225 59 242 91
9* <213 213 28 226 59 242 89
10* <214 214 28 227 59 244 89
11 <214 214 28 228 59 245 89
*Note: Smarter Balanced does not test students in grades 2, 9, and 10. The values shown in these grades are estimated MAP RIT scores indicating that the student is on track to perform at the designated performance level when tested on Smarter Balanced in subsequent years, so long as the student maintains consistent standing relative to U.S. achievement norms.

Partnering to Help All Kids Learn® | NWEA.org | 503.624.1951 | 121 NW Everett St., Portland, OR 97209
Table Set 4 – Estimated Probability Of Scoring At Level 3 Or Higher On The Smarter Balanced Test, Given A Student’s Observed MAP RIT Score In SpringMAP MATH TEST TAKEN IN SPRING
RIT Range 2 3 4 5 6 7 8 9 10 11
130 0% 0% 0% 0% 0% 0% 0% 0% 0% 0% *Note: This table provides the estimated probability of performing at Level 3 or higher on the Smarter Balanced Test, based on a MAP test score (RIT score) taken during the spring season. Example: if a fifth grade student scored 200 on a MAP test taken during the spring season, her/his estimated probability of achieving at least Level 3 is 8%.
Bold italics refer to grades in which the Smarter Balanced test is not taken. These values estimate the probabilities for the next year in which Smarter Balanced is taken, assuming that the student maintains her/his current relative standing over time.
135 0% 0% 0% 0% 0% 0% 0% 0% 0% 0%
140 1% 0% 0% 0% 0% 0% 0% 0% 0% 0%
145 1% 0% 0% 0% 0% 0% 0% 0% 0% 0%
150 1% 0% 0% 0% 0% 0% 0% 0% 0% 0%
155 2% 1% 0% 0% 0% 0% 0% 0% 0% 0%
160 4% 1% 0% 0% 0% 0% 0% 0% 0% 0%
165 6% 2% 1% 0% 0% 0% 0% 0% 0% 0%
170 10% 3% 1% 0% 0% 0% 0% 0% 0% 0%
175 16% 5% 2% 1% 0% 0% 0% 0% 0% 0%
180 23% 8% 3% 1% 1% 0% 0% 0% 0% 0%
185 33% 13% 5% 2% 1% 1% 0% 0% 0% 0%
190 45% 20% 8% 3% 2% 1% 1% 1% 1% 0%
195 57% 29% 12% 5% 3% 2% 1% 1% 1% 1%
200 69% 40% 18% 8% 5% 3% 2% 1% 1% 1%
205 78% 52% 27% 12% 8% 4% 3% 2% 2% 2%
210 86% 64% 38% 18% 12% 7% 4% 4% 4% 3%
215 91% 75% 50% 27% 18% 11% 7% 6% 6% 5%
220 94% 83% 62% 38% 27% 17% 11% 10% 9% 8%
225 96% 89% 73% 50% 38% 25% 17% 16% 14% 12%
230 98% 93% 82% 62% 50% 36% 25% 23% 22% 18%
235 99% 96% 88% 73% 62% 48% 36% 33% 31% 27%
240 99% 97% 92% 82% 73% 60% 48% 45% 43% 38%
245 99% 98% 95% 88% 82% 71% 60% 57% 55% 50%
250 100% 99% 97% 92% 88% 80% 71% 69% 67% 62%
255 100% 99% 98% 95% 92% 87% 80% 78% 77% 73%
260 100% 100% 99% 97% 95% 92% 87% 86% 84% 82%
265 100% 100% 99% 98% 97% 95% 92% 91% 90% 88%
270 100% 100% 100% 99% 98% 97% 95% 94% 94% 92%
275 100% 100% 100% 99% 99% 98% 97% 96% 96% 95%
280 100% 100% 100% 100% 99% 99% 98% 98% 98% 97%
285 100% 100% 100% 100% 100% 99% 99% 99% 99% 98%
290 100% 100% 100% 100% 100% 100% 99% 99% 99% 99%
295 100% 100% 100% 100% 100% 100% 100% 99% 99% 99%
300 100% 100% 100% 100% 100% 100% 100% 100% 100% 100%

Partnering to Help All Kids Learn® | NWEA.org | 503.624.1951 | 121 NW Everett St., Portland, OR 97209
MAP READING TEST TAKEN IN SPRINGEstimated Probability of Performing at Level 3 or Higher on Smarter Balanced Test
RIT Range 2 3 4 5 6 7 8 9 10 11
130 0% 0% 0% 0% 0% 0% 0% 0% 0% 0% *Note: This table provides the estimated probability of performing at Level 3 or higher on the Smarter Balanced Test, based on a MAP test score (RIT score) taken during the spring season. Example: if a fifth grade student scored 200 on a MAP test taken during the spring season, her/his estimated probability of achieving at least Level 3 is 23%.
Bold italics refer to grades in which the Smarter Balanced test is not taken. These values estimate the probabilities for the next year in which Smarter Balanced is taken, assuming that the student maintains her/his current relative standing over time.
135 0% 0% 0% 0% 0% 0% 0% 0% 0% 0%
140 1% 0% 0% 0% 0% 0% 0% 0% 0% 0%
145 1% 0% 0% 0% 0% 0% 0% 0% 0% 0%
150 1% 1% 0% 0% 0% 0% 0% 0% 0% 0%
155 2% 1% 1% 0% 0% 0% 0% 0% 0% 0%
160 4% 2% 1% 1% 0% 0% 0% 0% 0% 0%
165 6% 3% 1% 1% 1% 0% 0% 0% 0% 0%
170 10% 4% 2% 1% 1% 1% 1% 0% 0% 0%
175 16% 7% 4% 2% 1% 1% 1% 1% 1% 1%
180 23% 11% 6% 4% 2% 1% 1% 1% 1% 1%
185 33% 17% 9% 6% 4% 2% 2% 2% 2% 2%
190 45% 25% 14% 10% 6% 4% 4% 3% 3% 3%
195 57% 36% 22% 16% 10% 6% 6% 5% 5% 4%
200 69% 48% 31% 23% 16% 10% 9% 8% 8% 7%
205 78% 60% 43% 33% 23% 16% 14% 13% 12% 11%
210 86% 71% 55% 45% 33% 23% 22% 20% 18% 17%
215 91% 80% 67% 57% 45% 33% 31% 29% 27% 25%
220 94% 87% 77% 69% 57% 45% 43% 40% 38% 36%
225 96% 92% 84% 78% 69% 57% 55% 52% 50% 48%
230 98% 95% 90% 86% 78% 69% 67% 64% 62% 60%
235 99% 97% 94% 91% 86% 78% 77% 75% 73% 71%
240 99% 98% 96% 94% 91% 86% 84% 83% 82% 80%
245 99% 99% 98% 96% 94% 91% 90% 89% 88% 87%
250 100% 99% 99% 98% 96% 94% 94% 93% 92% 92%
255 100% 100% 99% 99% 98% 96% 96% 96% 95% 95%
260 100% 100% 99% 99% 99% 98% 98% 97% 97% 97%
265 100% 100% 100% 99% 99% 99% 99% 98% 98% 98%
270 100% 100% 100% 100% 99% 99% 99% 99% 99% 99%
275 100% 100% 100% 100% 100% 99% 99% 99% 99% 99%
280 100% 100% 100% 100% 100% 100% 100% 100% 100% 100%
285 100% 100% 100% 100% 100% 100% 100% 100% 100% 100%
290 100% 100% 100% 100% 100% 100% 100% 100% 100% 100%
295 100% 100% 100% 100% 100% 100% 100% 100% 100% 100%
300 100% 100% 100% 100% 100% 100% 100% 100% 100% 100%

Partnering to Help All Kids Learn® | NWEA.org | 503.624.1951 | 121 NW Everett St., Portland, OR 97209
Table Set 5 – Estimated Probability Of Scoring At Level 3 Or Higher On The Smarter Balanced Test, Given A Student’s Observed MAP RIT Score In WinterMAP MATH TEST TAKEN IN WINTEREstimated Probability of Performing at Level 3 or Higher on Smarter Balanced Test
RIT Range 2 3 4 5 6 7 8 9 10 11
130 0% 0% 0% 0% 0% 0% 0% 0% 0% 0% *Note: This table provides the estimated probability of performing at Level 3 or higher on the Smarter Balanced Test, based on a MAP test score (RIT score) taken during the winter season. Example: if a fifth grade student scored 200 on a MAP test taken during the winter season, her/his estimated probability of achieving at least Level 3 is 10%.
Bold italics refer to grades in which the Smarter Balanced test is not taken. These values estimate the probabilities for the next year in which Smarter Balanced is taken, assuming that the student maintains her/his current relative standing over time.
135 1% 0% 0% 0% 0% 0% 0% 0% 0% 0%
140 1% 0% 0% 0% 0% 0% 0% 0% 0% 0%
145 1% 0% 0% 0% 0% 0% 0% 0% 0% 0%
150 2% 1% 0% 0% 0% 0% 0% 0% 0% 0%
155 4% 1% 0% 0% 0% 0% 0% 0% 0% 0%
160 6% 2% 1% 0% 0% 0% 0% 0% 0% 0%
165 10% 3% 1% 0% 0% 0% 0% 0% 0% 0%
170 16% 5% 2% 1% 0% 0% 0% 0% 0% 0%
175 23% 8% 3% 1% 1% 0% 0% 0% 0% 0%
180 33% 12% 4% 1% 1% 1% 0% 0% 0% 0%
185 45% 18% 7% 2% 1% 1% 0% 0% 0% 0%
190 57% 27% 11% 4% 2% 1% 1% 1% 1% 0%
195 69% 38% 17% 6% 4% 2% 1% 1% 1% 1%
200 78% 50% 25% 10% 6% 4% 2% 2% 1% 1%
205 86% 62% 36% 16% 10% 6% 3% 3% 2% 2%
210 91% 73% 48% 23% 16% 9% 5% 4% 4% 3%
215 94% 82% 60% 33% 23% 14% 8% 7% 6% 5%
220 96% 88% 71% 45% 33% 22% 13% 11% 10% 8%
225 98% 92% 80% 57% 45% 31% 20% 17% 16% 13%
230 99% 95% 87% 69% 57% 43% 29% 25% 23% 20%
235 99% 97% 92% 78% 69% 55% 40% 36% 33% 29%
240 99% 98% 95% 86% 78% 67% 52% 48% 45% 40%
245 100% 99% 97% 91% 86% 77% 64% 60% 57% 52%
250 100% 99% 98% 94% 91% 84% 75% 71% 69% 64%
255 100% 100% 99% 96% 94% 90% 83% 80% 78% 75%
260 100% 100% 99% 98% 96% 94% 89% 87% 86% 83%
265 100% 100% 100% 99% 98% 96% 93% 92% 91% 89%
270 100% 100% 100% 99% 99% 98% 96% 95% 94% 93%
275 100% 100% 100% 99% 99% 99% 97% 97% 96% 96%
280 100% 100% 100% 100% 99% 99% 98% 98% 98% 97%
285 100% 100% 100% 100% 100% 99% 99% 99% 99% 98%
290 100% 100% 100% 100% 100% 100% 99% 99% 99% 99%
295 100% 100% 100% 100% 100% 100% 100% 100% 99% 99%
300 100% 100% 100% 100% 100% 100% 100% 100% 100% 100%
Partnering to Help All Kids Learn® | NWEA.org | 503.624.1951 | 121 NW Everett St., Portland, OR 97209
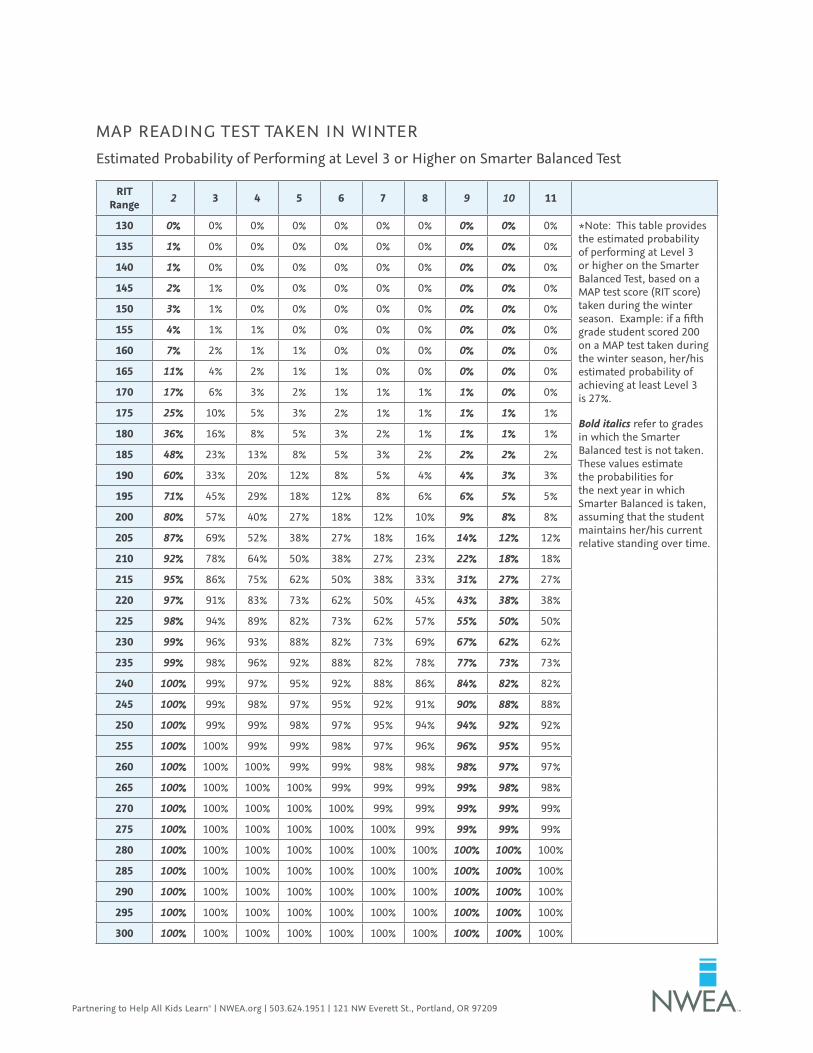
MAP READING TEST TAKEN IN WINTEREstimated Probability of Performing at Level 3 or Higher on Smarter Balanced Test
RIT Range 2 3 4 5 6 7 8 9 10 11
130 0% 0% 0% 0% 0% 0% 0% 0% 0% 0% *Note: This table provides the estimated probability of performing at Level 3 or higher on the Smarter Balanced Test, based on a MAP test score (RIT score) taken during the winter season. Example: if a fifth grade student scored 200 on a MAP test taken during the winter season, her/his estimated probability of achieving at least Level 3 is 27%.
Bold italics refer to grades in which the Smarter Balanced test is not taken. These values estimate the probabilities for the next year in which Smarter Balanced is taken, assuming that the student maintains her/his current relative standing over time.
135 1% 0% 0% 0% 0% 0% 0% 0% 0% 0%
140 1% 0% 0% 0% 0% 0% 0% 0% 0% 0%
145 2% 1% 0% 0% 0% 0% 0% 0% 0% 0%
150 3% 1% 0% 0% 0% 0% 0% 0% 0% 0%
155 4% 1% 1% 0% 0% 0% 0% 0% 0% 0%
160 7% 2% 1% 1% 0% 0% 0% 0% 0% 0%
165 11% 4% 2% 1% 1% 0% 0% 0% 0% 0%
170 17% 6% 3% 2% 1% 1% 1% 1% 0% 0%
175 25% 10% 5% 3% 2% 1% 1% 1% 1% 1%
180 36% 16% 8% 5% 3% 2% 1% 1% 1% 1%
185 48% 23% 13% 8% 5% 3% 2% 2% 2% 2%
190 60% 33% 20% 12% 8% 5% 4% 4% 3% 3%
195 71% 45% 29% 18% 12% 8% 6% 6% 5% 5%
200 80% 57% 40% 27% 18% 12% 10% 9% 8% 8%
205 87% 69% 52% 38% 27% 18% 16% 14% 12% 12%
210 92% 78% 64% 50% 38% 27% 23% 22% 18% 18%
215 95% 86% 75% 62% 50% 38% 33% 31% 27% 27%
220 97% 91% 83% 73% 62% 50% 45% 43% 38% 38%
225 98% 94% 89% 82% 73% 62% 57% 55% 50% 50%
230 99% 96% 93% 88% 82% 73% 69% 67% 62% 62%
235 99% 98% 96% 92% 88% 82% 78% 77% 73% 73%
240 100% 99% 97% 95% 92% 88% 86% 84% 82% 82%
245 100% 99% 98% 97% 95% 92% 91% 90% 88% 88%
250 100% 99% 99% 98% 97% 95% 94% 94% 92% 92%
255 100% 100% 99% 99% 98% 97% 96% 96% 95% 95%
260 100% 100% 100% 99% 99% 98% 98% 98% 97% 97%
265 100% 100% 100% 100% 99% 99% 99% 99% 98% 98%
270 100% 100% 100% 100% 100% 99% 99% 99% 99% 99%
275 100% 100% 100% 100% 100% 100% 99% 99% 99% 99%
280 100% 100% 100% 100% 100% 100% 100% 100% 100% 100%
285 100% 100% 100% 100% 100% 100% 100% 100% 100% 100%
290 100% 100% 100% 100% 100% 100% 100% 100% 100% 100%
295 100% 100% 100% 100% 100% 100% 100% 100% 100% 100%
300 100% 100% 100% 100% 100% 100% 100% 100% 100% 100%

Partnering to Help All Kids Learn® | NWEA.org | 503.624.1951 | 121 NW Everett St., Portland, OR 97209
Table Set 6 – Estimated Probability Of Scoring At Level 3 Or Higher On The Smarter Balanced Test, Given A Student’s Observed MAP RIT Score In FallMAP MATH TEST TAKEN IN FALLEstimated Probability of Performing at Level 3 or Higher on Smarter Balanced Test
RIT Range 2 3 4 5 6 7 8 9 10 11
130 1% 0% 0% 0% 0% 0% 0% 0% 0% 0% *Note: This table provides the estimated probability of performing at Level 3 or higher on the Smarter Balanced Test, based on a MAP test score (RIT score) taken during the fall season. Example: if a fifth grade student scored 200 on a MAP test taken during the fall season, her/his estimated probability of achieving at least Level 3 is 16%.
Bold italics refer to grades in which the Smarter Balanced test is not taken. These values estimate the probabilities for the next year in which Smarter Balanced is taken, assuming that the student maintains her/his current relative standing over time.
135 1% 0% 0% 0% 0% 0% 0% 0% 0% 0%
140 2% 1% 0% 0% 0% 0% 0% 0% 0% 0%
145 3% 1% 0% 0% 0% 0% 0% 0% 0% 0%
150 5% 1% 0% 0% 0% 0% 0% 0% 0% 0%
155 8% 2% 1% 0% 0% 0% 0% 0% 0% 0%
160 13% 4% 1% 0% 0% 0% 0% 0% 0% 0%
165 20% 6% 2% 1% 0% 0% 0% 0% 0% 0%
170 29% 9% 3% 1% 0% 0% 0% 0% 0% 0%
175 40% 14% 4% 1% 1% 0% 0% 0% 0% 0%
180 52% 22% 7% 2% 1% 1% 0% 0% 0% 0%
185 64% 31% 11% 4% 2% 1% 1% 0% 0% 0%
190 75% 43% 17% 6% 3% 2% 1% 1% 1% 1%
195 83% 55% 25% 10% 5% 3% 2% 1% 1% 1%
200 89% 67% 36% 16% 8% 4% 3% 2% 2% 1%
205 93% 77% 48% 23% 13% 7% 4% 3% 3% 2%
210 96% 84% 60% 33% 20% 11% 7% 5% 5% 4%
215 97% 90% 71% 45% 29% 17% 11% 8% 8% 6%
220 98% 94% 80% 57% 40% 25% 17% 13% 12% 9%
225 99% 96% 87% 69% 52% 36% 25% 20% 18% 14%
230 99% 98% 92% 78% 64% 48% 36% 29% 27% 22%
235 100% 99% 95% 86% 75% 60% 48% 40% 38% 31%
240 100% 99% 97% 91% 83% 71% 60% 52% 50% 43%
245 100% 99% 98% 94% 89% 80% 71% 64% 62% 55%
250 100% 100% 99% 96% 93% 87% 80% 75% 73% 67%
255 100% 100% 99% 98% 96% 92% 87% 83% 82% 77%
260 100% 100% 100% 99% 97% 95% 92% 89% 88% 84%
265 100% 100% 100% 99% 98% 97% 95% 93% 92% 90%
270 100% 100% 100% 99% 99% 98% 97% 96% 95% 94%
275 100% 100% 100% 100% 99% 99% 98% 97% 97% 96%
280 100% 100% 100% 100% 100% 99% 99% 98% 98% 98%
285 100% 100% 100% 100% 100% 100% 99% 99% 99% 99%
290 100% 100% 100% 100% 100% 100% 100% 99% 99% 99%
295 100% 100% 100% 100% 100% 100% 100% 100% 100% 99%
300 100% 100% 100% 100% 100% 100% 100% 100% 100% 100%

Partnering to Help All Kids Learn® | NWEA.org | 503.624.1951 | 121 NW Everett St., Portland, OR 97209
MAP READING TEST TAKEN IN FALLEstimated Probability of Performing at Level 3 or Higher on Smarter Balanced Test
RIT Range 2 3 4 5 6 7 8 9 10 11
130 1% 0% 0% 0% 0% 0% 0% 0% 0% 0% *Note: This table provides the estimated probability of performing at Level 3 or higher on the Smarter Balanced Test, based on a MAP test score (RIT score) taken during the fall season. Example: if a fifth grade student scored 200 on a MAP test taken during the fall season, her/his estimated probability of achieving at least Level 3 is 33%.
Bold italics refer to grades in which the Smarter Balanced test is not taken. These values estimate the probabilities for the next year in which Smarter Balanced is taken, assuming that the student maintains her/his current relative standing over time.
135 1% 0% 0% 0% 0% 0% 0% 0% 0% 0%
140 2% 1% 0% 0% 0% 0% 0% 0% 0% 0%
145 4% 1% 0% 0% 0% 0% 0% 0% 0% 0%
150 6% 1% 1% 0% 0% 0% 0% 0% 0% 0%
155 9% 2% 1% 1% 0% 0% 0% 0% 0% 0%
160 14% 4% 2% 1% 1% 0% 0% 0% 0% 0%
165 22% 6% 3% 1% 1% 1% 0% 0% 0% 0%
170 31% 10% 4% 2% 1% 1% 1% 1% 0% 0%
175 43% 16% 7% 4% 2% 1% 1% 1% 1% 1%
180 55% 23% 11% 6% 4% 2% 2% 1% 1% 1%
185 67% 33% 17% 10% 6% 4% 3% 2% 2% 2%
190 77% 45% 25% 16% 9% 6% 5% 4% 3% 3%
195 84% 57% 36% 23% 14% 9% 8% 6% 5% 5%
200 90% 69% 48% 33% 22% 14% 12% 9% 8% 8%
205 94% 78% 60% 45% 31% 22% 18% 14% 13% 12%
210 96% 86% 71% 57% 43% 31% 27% 22% 20% 18%
215 98% 91% 80% 69% 55% 43% 38% 31% 29% 27%
220 99% 94% 87% 78% 67% 55% 50% 43% 40% 38%
225 99% 96% 92% 86% 77% 67% 62% 55% 52% 50%
230 99% 98% 95% 91% 84% 77% 73% 67% 64% 62%
235 100% 99% 97% 94% 90% 84% 82% 77% 75% 73%
240 100% 99% 98% 96% 94% 90% 88% 84% 83% 82%
245 100% 99% 99% 98% 96% 94% 92% 90% 89% 88%
250 100% 100% 99% 99% 98% 96% 95% 94% 93% 92%
255 100% 100% 100% 99% 99% 98% 97% 96% 96% 95%
260 100% 100% 100% 99% 99% 99% 98% 98% 97% 97%
265 100% 100% 100% 100% 99% 99% 99% 99% 98% 98%
270 100% 100% 100% 100% 100% 99% 99% 99% 99% 99%
275 100% 100% 100% 100% 100% 100% 100% 99% 99% 99%
280 100% 100% 100% 100% 100% 100% 100% 100% 100% 100%
285 100% 100% 100% 100% 100% 100% 100% 100% 100% 100%
290 100% 100% 100% 100% 100% 100% 100% 100% 100% 100%
295 100% 100% 100% 100% 100% 100% 100% 100% 100% 100%
300 100% 100% 100% 100% 100% 100% 100% 100% 100% 100%

APPENDIX: LINKS USED IN THIS DOCUMENTSmarter Balanced States Approve Achievement Level Recommendations: http://www.smarterbalanced.org/news/smarter-balanced-states-approve-achievement-level-recommendations/
Alternate Methodologies for Estimating State Standards on a Widely-Used Computer Adaptive Test: https://www.nwea.org/resources/alternate-methodologies-estimating-state-standards-widely-used-computer-adaptive-test/
Proficiency Guidance from NWEA on New State Summative Assessments: www.nwea.org/resources/proficiency-guidance-on-new-state-summative-assessments-from-nwea
Partnering to Help All Kids Learn® | NWEA.org | 503.624.1951 | 121 NW Everett St., Portland, OR 97209
©Northwest Evaluation Association 2015. MAP and Measures of Academic Progress are registered trademarks and Northwest Evaluation Association and NWEA are trademarks of Northwest Evaluation Association in the U.S. and other countries. The names of other companies and their products mentioned in this paper are the trademarks of their respective owners.
January 2015