smart motorways programme - amazon web services
TRANSCRIPT

Smart Motorways Programme Productivity Research Report - M25 Schemes
Author/s: Andrew Moore, Wisam Hasan & Phil Ellis
Contributors: Skanka-Balfour Beatty JV (SBBJV): Liam Maguire, Chris Till, John McGinty, Jerry Clarke, Jim McNicholas, Kieren McGibbon, Tony
Kimbugwe
Carillion: Brian Griffiths, Steve Lee
Costain: Jarod Williams
BMJV: Kate Sellers

!
2
Contents 1. Executive Summary 2. The Authors
3. The Research Method 4. The M25 Schemes – A Brief Overview 5. Comparing Performance – M25 and Other Schemes 6. Production Thinking 7. The M25 Schemes (Section 2, 5a & 5b) – Production Outputs
and Lessons Learned 8. There is Room for Improvement
9. The Production Train Methodology 10. Proof of Concept – Application to Other Schemes 11. Summary of Findings 12. Recommendations - A Standard Approach and Development
Programme for Smart Motorways Projects

!
3
1. Executive Summary This report was commissioned to investigate the relatively high output rates delivered by the M25 Smart Motorway Schemes and to determine how these have been achieved.
Its purpose is to share best practice, learned through the process, with the wider Highways Agency (HA) community and to determine if lessons can be learned for further performance improvement.
Context:
The M25 scheme is producing more kilometres of Smart Motorway per week than any other scheme. We were able to determine this through the use of real output data that was available, allowing accurate investigation and analysis.
The report shows comparisons between the M25 output (km per week) and those of other projects currently being built or planned. It investigates and describes in detail the outputs achieved by the M25 team and touches on the enabling factors that have supported the relatively high levels of output. Finally, it will make recommendations for the development of a common process ‘production train’ for development and use across future Smart Motorway Schemes.
Summary of findings:
• The M25 scheme is building faster than other comparable schemes - between 9% and 67% faster on central reservations works, according to our analysis.
• Data, both quantitative and qualitative, suggests that the top level reasons for this higher output are that the Skanska Balfour Beatty Joint Venture (SBBJV) and their suppliers plan for higher outputs – 200 meters of linear output per day – and achieve this by deploying more resources over a longer time window. Importantly they also developed a parallel working strategy, bringing the NRTS testing and commissioning process within the civils programme.
• There are a number of enabling factors within the team that have supported faster output, these include: good working relationships between the design and HA teams and the maintenance organisation; a contractual agreement which encourages higher performance together with the experience of working together, with many of the team having worked together for some 10 years.
• There are however, other project teams close to achieving the M25 outputs, suggesting that outputs are replicable across other schemes regardless of the maturity of the partnership or the team’s experience of working together.

!
4
• Approach is a key factor – if other schemes planned to work in more locations, using more resources with increased working hours, they would also deliver faster.
• Analysis and review suggests that a common, more efficient approach to delivering Smart Motorway projects is achievable. Following our research, we propose a methodology entitled ‘Production Train’ that is designed to establish a quicker construction programme over shorter worksites, thereby improving the road user experience. This is as yet untested but we propose a series of trial projects to test this hypothesis.
Summary of recommendations:
• Use the M25 schemes as the current benchmark for all other similar schemes.
• Establish a system for collecting real output data for use when planning other schemes but also to further improve the construction process. When combined with improvement work studies, the ambition should be to plan using the highest average output rates.
• Transfer learning using the current hub system and/or its SMP replacement.
• Extend the range of benchmarking measures to include: safety, cost, quality, customer/stakeholder satisfaction and environmental impact.
• Use the CDF framework to create the right conditions and motivations to adopt, challenge and improve the Production Train approach.
• Standardise and seek to improve through Value Engineering, the design and construction methodology.
• The HA to develop a standard methodology and set of production output rates to be used for all future schemes (ie. adopt the intelligent client approach).
• Produce a handbook for Smart Motorways, outlining best practice and methods.
• Maintain project teams to improve the economies of learning.
• Create a more detailed analysis of verge works.
• Hold discussions with key suppliers on outputs and the potential for improvements in performance through process improvement.
• Establish KPIs as a standard process on all SMP motorways and support this with downtime data collection, analysis and problem solving as standard.

!
5
• Complete this research with a revisit to measure the output on Section 5B, which at the time of writing was well underway, this will also include slip form data to determine the efficacy of the ‘Volumetrics’ concrete process.
• Review ongoing downtime data on the cut and fill activity to identify improvements and show what is possible.
• Carry out work studies on all critical path activities and develop the best method for constructing Smart Motorway Projects.
It’s our view that the time is right to challenge the current way of thinking about highways construction as the industry is receptive to innovative ways of working, the client is in the process of change with a view to working differently in future and the new CDF contract can act as an enabler to improve working relationships. In order to deliver the full potential of Smart Motorways Construction, we need motivated people and organisations, standard designs, methods and a spirit of innovation.
2. The Authors Andrew Moore, Director at Rubicon Wigzell, has been researching the subject of production outputs and efficiencies in construction for the past 15 years. Andrew has been working with the M25 delivery teams since February 2013, in support of the HA Lean Deployment Programme. He has helped the team to deploy collaborative planning on the design process and in some construction activities and, as a result, he has a good understanding of the project and a good relationship with the team. Due to the relatively high outputs delivered by the team he was asked to carry out research to investigate how these were achieved. The results of this research will be used to further develop the thinking and performance of Smart Motorways and other Major Projects.
Phil Ellis of Mace has been working in the HA’s Delivery Hub for 3 years as Head of the Planning Function. Part of his work has focused on demystifying and optimising the development & construction processes of HA Major Projects (incl. Smart Motorways). He is also the Programme Manager for the Contingency Schemes and as such has been able to ensure priority and focus has been given to optimising the construction processes of specific schemes, as well as developing a standardised approach that can be utilised as best practice across the Smart Motorway Programme. He has been able to advocate and reinforce desired working behaviours and practices (including 24 hour working over 6 days, multiple daily shifts, minimising traffic management and disruption to the travelling public).

!
6
3. The Research Method To ensure an accurate and balanced assessment, we employed the following research methodology:
• a comparison of overall output rates between the M25 scheme and other schemes to determine whether the scheme is delivering faster.
• interviews with key M25 staff to understand the methodology deployed and the detail of how the project team manage the process.
• analysis of output data across M25 critical path activities to determine the systems capability and average outputs for planning purposes.
• a review of working patterns, hours/shifts worked and resources deployed. • work studies on two number critical path activities, both to understand the
process and to identify further areas for improvement. • lessons learned workshops across the following areas:
o Design o Construction o The scheme overall o Comparing outputs with 2 other schemes
Through this process a great deal of information was produced, the most relevant of which can be seen in the appendices to this report. All other information is available upon request.
Note: whilst this report was commissioned to review the outputs achieved by the M25 scheme overall, in terms of improvement recommendations, we have focused primarily on the central reservation works. This was mainly due to the fact that this area lends itself to a production line methodology. However we are working to identify similar improvement opportunities for the verge works e.g. the M25 team aligned the NRTS testing and commission process to the civils construction work.
There are also a number of Value Engineering opportunities being investigated that may benefit the schemes overall.

!
7
4. The M25 Schemes - A Brief Overview
The M25 is one of Europe's busiest motorways, handling around 200,000 vehicles every day, with key arterial routes serving Central London, the Home Counties and the A282 Dartford Crossing.
The Connect Plus Consortium - comprising Balfour Beatty, Skanska, Atkins and Egis Road Operation UK - has a 30 year Design, Build, Operate and Maintenance (DBFO) contract to manage and improve the capital's orbital motorway network on behalf of the Highways Agency (HA).
The M25 DBFO also includes the delivery of major improvement projects, such as the widening from three lanes to four between junctions 16-23 (Section 1), junctions 27-30 (Section 4) and refurbishing the Hatfield Tunnel (Section 6) to meet European standards. Collectively, these improvements works are referred to as the Initial Upgraded Sections (IUS) and were subcontracted to the main contractor Skanska Balfour Beatty.
Following the success of the IUS, the Skanska Balfour Beatty Joint Venture (SBBJV) is now responsible for the delivery of the Later Upgraded Sections (LUS) comprising:
Section 2 J5 to J7 – converting the existing hard shoulder into a permanent running lane including central reservation works, delivered as one section between November 2012 to April 2014 (20km or 1.25km per month).
Section 5 J23 to J27, delivered as two sections – converting the existing hard shoulder into a permanent running lane. Section 5a was delivered January 2013 to January 2014 (15km) and Section 5b from January 2014 to December 2014 (11km) with an output rate of 1.08km per month.

!
8
Project Planning Strategy:
The project team planned to achieve circa 200m of linear output per day over a 6-day working week. Allowing for emerging constraints and construction issues they hoped to achieve an average of 1km of linear output per week.
Note: linear output does not equal total motorway but includes the central reservation and two verges.
Below is a list of the key components that make up a Smart Motorway with quantities based on the Section 5a & b.
• Bulk Excavation: 200,000m3
• Gantries – super span: 13 (number)
• Gantries – single span: 5 (number)
• ADS gantries/MS4’s: 44 (number)
• A number of HADECS speed enforcement camera sites
• Wavetronics traffic monitoring sites: 50 (number)
• CCTV infrared night vision: 40 (number) and CCTV normal: 28 (number)
• LED temporary traffic management signs: 68 (number)
• Concrete barrier in central reserve: 24km
• Emergency refuge areas with telephones: 13 (number)
• Slot drain: 35km
• Pavement concrete: 20,000m3
• Surfacing: 46,000t
• Duct crossings: 78 (number)
• Comms & lighting ducting: 30km

!
9
5. Comparing Performance - M25 & Other Schemes Whilst it is clear that no project can be exactly the same, the Smart Motorway Projects are similar enough in scope to be able to make reasonable comparisons between them, in particular with regard to delivery durations.
To measure true ‘like for like’ performance, it is necessary to make comparisons across the range of key performance measures to ensure a balanced view (for example we may deliver quickly but suffer from quality issues). Typical key performance areas include: Safety, Quality, Cost, Delivery, Sustainability and Customer Satisfaction.
This report however, has been commissioned to look at production output only in order to identify and investigate the factors contributing to accelerated production. Our recommendations going forward would be to make a comparison across the other performance areas to give a more complete and balanced scoring mechanism.
Delivery performance comparisons will be determined using the formula below, which simply measures the number of kilometres of Smart Motorway built per week (measured across the whole project as an average, starting when the Traffic Management (TM) temporary safety barrier starts to go on and when it completely comes off).
This is measured as follows:
Length of motorway under construction (km)
Time to build in weeks
Comparing the M25 output performance with other similar schemes:
Smart Motorway Projects in their simplest form, can be described as Central Reservation Works and Verge Works. As not all schemes will do both under one project instruction, we have split these out and then offered an overall measure where appropriate. Similarly, as the schemes do not all have data covering the whole scheme, comparisons are made on the central reservation works only (highlighted in yellow).
= km per week

!
10
Table 1: Comparison of M25 output with other schemes
Scheme Length (KM) Central Res (KM per week)
Verge (KM per week)
Overall (KM per week)
Contact
M25 – Sec 5a 15 0.85 0.65 0.4 Liam Maguire
M25 – Sec 5b 11 0.73 0.52 0.3 Liam Maguire
Scheme A 9.54 0.21 No info – prog not agreed
No info – prog not agreed
Scheme B 30.1 0.72 0.55 0.39 Scheme C 18.5 n/a1 0.23 n/a Scheme D 7.9+2.3 0.432 Not in this
project scope Not in this
project scope
Note: Information supplied by the project teams. Nr of weeks measured from the installation of Temporary Safety Barrier to its removal – these milestones were chosen to measure planned construction time only and remove any added time due to mobilisation and or delays handing over. 1Could go faster but constrained by Ministerial Commitment & The Other Project. 2 This scheme is split into 2 phases – shown here is the typical Central Res works activity which is similar to those being constructed across the other schemes – differences in design, scope and construction of each scheme is covered later in the report.
On the basis of central reservation data, the table shows that the M25 schemes have delivered more output per week than other similar schemes. It should also be noted that Scheme B (an accelerated delivery scheme) has similar outputs to the M25. This perhaps demonstrates that, while qualitative research suggests that the M25 team’s experience in working together has been an enabling factor in designing an approach for accelerated delivery, the approach can be replicated with similar results across other schemes, regardless of the team’s experience.
What are the benefits of achieving shorter construction durations?
It is worth noting at this stage what the benefits of shorter construction durations are for the HA, the travelling public as well as for the contractor and suppliers. These include:
• better value for money: every 1% reduction in time on site equals a 1% reduction in the cost of prelim items linked to time, for example variable costs such as: traffic management, site accommodation, plant and equipment and project management staff.1
• improved efficiency: capital assets are utilised for longer periods of time which can result in improved profit margins for the contractor and their suppliers, for example temporary barrier, excavators and lorries etc.
• lower overall project costs through less inflationary pressures on shorter programmes.
• improved journey time reliability: the travelling public spends less time encountering speed restrictions through traffic management
• improved public perception: during their time travelling through traffic management, the public sees more activity in more locations and for longer periods of time – which is a good thing.
1 note: a rule of thumb is that prelims amount to 35-40% of total construction costs, however not all of these are variable costs fixed to time, some are sunk or fixed costs and, regardless of the speed of construction, will remain the same e.g. initial cost to erect the compound.

!
11
6. Production Thinking History shows us that relatively high outputs are achievable if the conditions are right. The Empire State Building was built in just 54 weeks and the conditions that led to this were that resources were freely available, the building design lent itself to a production line philosophy and the project team were motivated by a demanding and immovable end date. Importantly, the team also shared in the success of a quick delivery.
Similarly, the M1 J10-18 Luton to Crick section - constructed back in 1955 and requiring 55 miles of new motorway, 132 new bridges and 92 culverts - was built in just 19 months. The conditions that led to this were the deployment of many resources, standardisation of design, production line thinking and activity at multiple work fronts over the whole length of the project at the same time. As with the Empire State Building, the project team were motivated by a highly demanding programme, an immovable end date and a share in the success of a quick delivery.
We use the formula below to describe the key aspects of production thinking in construction and also to help us calculate the theoretical durations of projects. The formula can be used to describe how project durations are affected by changes in the various components that make up the project delivery process including:
• the quantity of work to be carried out on site (offsite production reduces the duration)
• the number of available resources (deployed at multiple worksites) • the capability of those resources (their output performance and efficiency) • available time (hours, shifts and days worked up to the maximum 24/7 working) • contingency (including local constraints, safety and environmental precautions)
quantity or volume of work carried out on site
The following two examples show the way in which changes in each of the key components can have a positive effect on durations.
10,000 linear meters of road box excavation
quantity of resources deployed
performance of resources
!
hours, shifts & days worked
!
contingency %
x x + = duration
!
1 gang
!
200m
per 8 hr!
8 hrs x 5 days
10%
!
x x + = 55 Days or 11
weeks
!
12
10,000 linear meters of road box excavation
The above formula can be used to calculate the duration of critical path activities on Smart Motorway Projects and if we begin to factor in performance improvement (not changed in the above example), then we will start to see significant improvements, not only in output, but also in the efficiency of resources and ultimately project costs.
The output of 200m of linear output per day referred to here is an average performance over the duration of the M25 scheme. However there were occasions when the output far exceeded this figure. On one occasion a gang achieved more than double this, at 420m of linear output in one shift.
This idea of ‘core systems capability’ (i.e. what is the maximum output possible if we can create the right conditions) leads us into Lean thinking territory and the theory of constraints. We will touch on this later in the report.
Faster construction relies on the deployment of more resources, operating at higher performance, working in more locations over longer periods of time. In order to achieve this and sustain it, we need to consider the following:
• Management of the constraints which affect production, including haulage, material deliveries, access points, design etc.
• Standardising our approach including design and methods. • Maintaining teams and building on the experience of delivering Smart Motorway
Projects – this is a programme management strategy. • Balancing the output rates across critical path activities and protecting the critical
path. • Learning to solve problems quickly and as a more integrated team. • Changing the nature of competing relationships through the deployment of better
contracts. • Changing our working patterns to allow for working in multiple shifts over 7 days
a week. • The client taking a more pragmatic approach to sharing risk.
2 gangs
!
200m
per 8 hrs!
8 hrs x
2 shifts x 7 days
10%
!
x x +
= 13.75 Days or 2 weeks
!
13
7. The M25 Schemes (Section 2, 5a & 5b) – Production Outputs and Lessons Learned
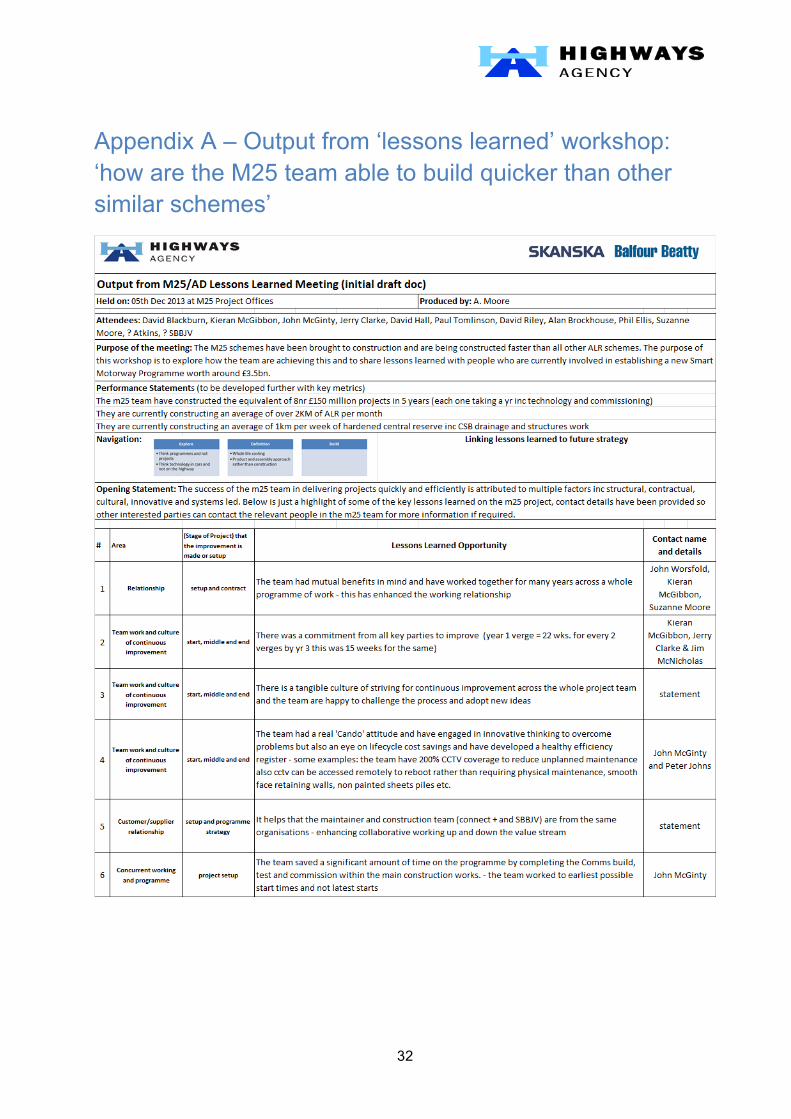
In December 2013 we held a ‘lessons learned’ workshop on the M25 to discuss the key elements/ingredients that supported the programme delivery. Below is a brief synopsis of what was discussed at the workshop, more detail can be seen in the full Lessons Learned Report in Appendix A.
• The team are experienced at this work and some have worked together for almost 10 years – the economies of learning were high.
• The type of contract and incentives created the right climate for performance improvement (M25 is a DBFO contract – Design, Build, Finance and Operate).
• The team used real output rates for their planning based on their own previous experience and established a daily target and rhythm of 200 linear metres.
• The team deployed multiple resources working over multiple shifts (including some nights) and worked weekends as standard.
• The team agreed a concurrent working strategy with the National Roads Telecommunications Services (NRTS) which enabled them to pull cables, test and commission in parallel with the main civils work.
• They had a good access strategy and control of works (openings every 300-500m in Varioguard and an effective workspace booking system).
• The KPI process, which measured daily output across critical path activities, was closely monitored and controlled.
• There were strong relationships within the wider project team, i.e. designers, consultants and the HA project team, which reduced ‘transaction costs’.
• There was a distinct culture of problem solving where the team would pull together to solve problems and not fall apart when problems arose.
Outputs achieved on the M25 schemes
The M25 team delivered improved programme output through two key areas:
• Programme level strategy • Detailed Planning Strategy
Programme Level Strategy: At the outset, project teams will determine their programme strategy. For example what direction do we build in, do we start in the verge or central reservation, do we build in multiple locations and to what degree can we overlap critical activities. The M25 team achieved a significant saving of circa 6 months on their programme by overlapping the NRTS testing and commissioning works with that of the civils programme. They believed that they were ‘delivering a technology scheme and

!
14
that the civils work was an enabler to deliver this’. This is a fundamental shift in thinking and as a result allows the team to rethink the overall process.
The diagram below demonstrates the savings that can be made in time by overlapping the technology and civils works in the verge. Here we can see that the team saved approximately 6 months on their programme. However there is much more to this process than simply overlapping activities as the team need to be cognisant of starting their works in the verge first. This can lead to various constraints in terms of design and possible delays in starting the project as well as some environmental considerations.
Detailed Planning Strategy: Earlier we identified the planning strategy deployed by the M25 team as 200m of linear output per day over a 6-day working week. Below is a summary of the actual output rates achieved covering most of the critical path activities.
The source of this information is the project KPI’s which were updated daily with actual output and in many cases described the number of shifts worked and quantity of resources deployed (an example of one of these can be seen in Appendix C).
The Average Daily Outputs are averaged out across both sections of the M25, in many cases they were similar on both schemes (which may indicate that the subcontractor performance is not the sole reason for higher overall outputs). The outputs include the use of multiple resources and multiple shifts and includes for non-productive days, for example due to weather, breakdown or general disruption. The table also includes the highest output achieved in a single day per activity, the last column gives extra detail where available.
Using averages in this way does not give a totally accurate representation, as it does not reflect the reality and the output variation involved in the daily delivery process. However, because of the amount of variation in the typical construction process, it is not possible to plan using historical data unless we use averages as a starting point. Project teams tend to manage the variation through buffer, delinked activities and a flexible workforce able to accelerate or decelerate as required. Whilst this is not ideal, nor Lean, it does allow the project teams to plan with some degree of certainty.
Note: The critical activities identified below do not include for any mobilisation works and start at the point the TM is put out. For example, prep work for hard shoulder running, lighting decommissioning and some surveys may be carried out before the TM starts.

!
15
Table 2: Central Reservation Works – Daily Outputs on Critical Activities
Critical(Activity(,(Central(Res(Works
Average(Daily(Output(
Highest(Daily(Output(Achieved
Shift(Patterns(Where(Known
Days(Worked(Per(Week
Notes(where(additional(information(was(availble
Install'TMLighting'Removal 22 42 ? 6Barrier'Removal 732.59 1600 ? 6Topsoil'Strip 277.37 600 ? 6
Road'Box'+'slot'drain'box 195 584 day 62'gangs'on'day'shift''(max'output'for'one'gang'='420'Linear'metres'(Lm)'in'1'day)'(avg'output'for'gang'1'='205.80'Lm'and'gang'2'162.60'Lm)
Capping' 179.65 555 ? 6
Slot'Drain'Prep 196 557 day 7mainly'1'gang'deployed'but'did'double'up'on'just'3'of'the'168'days'(avg'output'is'the'same)
Slot'Drain'Chambers 3.62 10 ? 6
Slot'Drain'Pour 170 265 night'and'day 5Q7
often'2'shifts'worked'and'with'one'gang'per'shift'(3'gangs'working'at'several'points'across'night'and'day'and'on'both'sides'of'the'carriageway)'Q'max'output'for'one'gang'='250'metres'Q'average'per'gang'nights'='88.62'Lm'Q'Average'per'gang'day'shift'='127.28'Lm.'PJ'Davis'(Slot'drain'supplier)'believes'the'improved'output'on'section'5a'was'due'to'the'fact'that'they'paved'over'manholes'and'then'dug'out'rather'than'working'around'existing'ones.'This'saved'approximately'1'hour'per'manhole'in'lost'production
NFD'(Narrow'Filter'Drain)
153 340 day 6
CSB'Plinth 154.64 560 ? 6
CSB 244 610 night'&'day 6often'2'shifts'worked'and'in'some'cases'an'extra'gang'were'deployed'(2'gangs'on'night'shifts)'max'output'for'one'gang'='293'metres'Q'average'per'gang'per'shift'='167''Lm
Wet'Lean'Concrete'Road'Base
232.66 585 ? 7
Pavement'Quality'Concrete
248 93Q672 day'shift 6Day'shifts'only'Q'between'1Q5'gangs'deployed'Q'max'output'for'one'gang'='465'Q'average'per'gang'211'Lm'per'day'on'main'works'or'62Lm'on'piecemeal'works
Surface'Course'(Blacktop)'sec'2'only
852.93 2000 night'&'day 5often'2'shifts'worked'and'with'one'gang'per'shift'Q'max'output'for'one'gang'='2000'metres'Q'average'per'gang'nights'='644'Lm'Q'Average'per'gang'day'shift'='1212
This'was'not'covered'in'the'KPI's'but'an'improvement'in'this'area'is'to'install'the'TM'down'both'carriageways'at'the'same'time'which'then'releases'the'next'work'activity'significantly'earlier'i.e.'2Q3'weeks'saving'depending'on'the'length'of'TM
Table 3: Verge Works - Daily Outputs on Critical Activities
Critical(Activity(,(Central(Res(Works
Average(Daily(Output(
Highest(Daily(Output(Achieved
Shift(Patterns(Where(Known
Days(Worked(Per(Week
Notes(where(additional(information(was(availble
Interruptor ? ? ? ?Install-TM ? ? ? ?Decommission ? ? ? ?Top-soil-strip ? ? ? ?Stage-1-cut 167.22 40=451 ? ?
Comms-ducting 173 520 day-shift 6Mainly-day-shifts-=-only-one-night-shift-in-the-whole-period-=-
between-1-&-3-gangs-but-mainly-one-gang-=-max-output-for-one-gang-=-520Lm-=-Avg-per-gang-per-shift=--173-Lm
Stage-1-fill 169.92 696 ?Cross-Ducts 1.43 1=2 ? ?Ducting 155.33 382 ? ?
Slot-Drain 156 446 night-&-day 6Mainly-2-gangs-working-night-and-day-shifts-alternating-across-Clock-Wise-and-Anti-Clock-Wise-carriageways-=-Average-output-per-gang-=-
108Lm-Max-output-in-one-shift-=-250Comms-cable- ? ? ? ?Gantry-piling 1 1 ? ?Slab-Replacements- 1.86 7.5 ? ?
Note: not all the above are measured in Linear Metres i.e. cut and fill is measured in M3 and cross carriageway ducts are per item.
Results
The information displayed in the tables above show the daily average outputs achieved across multiple activities on the critical path in both the verge and the central reservation works. Using these outputs the M25 team were able to achieve an overall output of km per week of:

!
16
0.85km per week in the central reservation
0.65km per week in the verge
The central reservation data clearly shows that the team were delivering close to the planned output of 200 linear meters per day (and in some cases more than this).
The chart here, shows that of the 13 critical activities measured, 6 achieved around 200m of linear output, 2 were well above this, 4 were slightly below the mark and 1 is not applicable as it is not measured in linear metres.
Whilst this chart shows that activities are slightly imbalanced (not considering the first and last activity – blacktop is only relevant to Section 2 and only in some cases), it must be appreciated that in construction terms this is a reasonably balanced plan, with little variation in the core activities (albeit these are averages and need to viewed as such). In this example, allowing the first activity to achieve high output does not cause issues with overall production as this will not delay the process. The last activity may cause delay as it will require a large batch of road to achieve its optimum output. This can lead to road users being frustrated by large swathes of motorway free of any visible work activity.
The chart demonstrates that a planned output of around 200m of linear output per day is achievable on the central reservation works for individual activities. However, for this to work effectively, the imbalances in outputs need to be controlled. For example, the CSB plinth team (154m/day) could quickly delay the CSB works (244m/day) unless:
• there is sufficient time buffer between them, for example each activity is a week apart
• the CSB plinth team works more shifts per day or more days per week • the CSB team work fewer shifts per day or fewer days per week • the management team are able to flex the resources, i.e. pull in more CSB plinth
resource when needed • the CSB plinth team are protected from downtime and the slip form process is
improved
The whole process can only go as fast as the slowest activity, so in this example we should focus our attention on speeding up the CSB plinth and protecting this super

!
17
critical activity. We will cover the findings from our Slip Form work study in the next section.
The M25 management team were able to flex their resources and the number of hours and days worked to accommodate the ebb and flow of output that is common to construction. This allowed them to maintain a relatively stable flow of construction activity. They also had good management systems in place that were joined up (see an example of this in the M25 planning process map in Appendix D) which included:
• using the KPI’s as early indicators of potential delay • weekly planning and coordination meetings with all suppliers • collaborative planning • workspace allocation • a novel bus tour every Monday morning to review progress as a team
Whilst a similar approach was adopted on the verge works, the balance of the work activity is less relevant as it’s a less linear/linked process and more akin to individual worksites (mini projects). However, these are still linked and in many cases must work in a sequential manner.
The key factors in achieving high overall output in the verge are:
• working in multiple locations with multiple resources over multiple shifts and days • ensuring that there are sufficient access and egress points to facilitate the above
working method • ensuring that there is flow (balanced line) between linked activities • using the same techniques described for the central reservation works in order to
flex the output capability of individual and critical activities, i.e. increase resource, work more shifts and more days etc.
• and, importantly, running the testing and commissioning of the technology in parallel with the main civils works (there is a case study available on the HA Knowledge Management Site to show how this was achieved).
!
18
8. There is room for Improvement. There are two focus areas for improvement at play here:
1. Strategic Improvement: Increase resources and the working window to optimise the daily output and do more work with more resource
2. Incremental Improvement: Improve the process or reduce downtime to optimise output - do more work with the same resource
The reality is there is room for both these improvement strategies, the first one is a strategic decision and can deliver immediate benefits as long as constraints are managed. The second is an ongoing and incremental improvement process.
The tables in the previous section focused on average output rates, however they also demonstrated that much higher output is achievable when the conditions are right. We describe this as the ‘core systems capability’ which is effectively determining what the system is capable of, if the right conditions can be created.
Core system capability is an important factor in identifying opportunity for improvement. Take, for example, the CSB team who averaged 167m of linear output per gang per day, with one gang achieving 293m in one day, which is 75% more than average. As the construction process is subject to relative instability, the chances of achieving this high output every day are limited. However with such a large opportunity, every incremental step towards this higher output would have significant benefits on the programme and, ultimately, the cost of construction projects.
Bear in mind that a minute lost on a critical path activity is a minute lost to the entire project. From this perspective, it should be the goal of the project team to continuously improve the process to raise the mean average by focusing on the constraints that limit the production output, in particular those that are within their control.
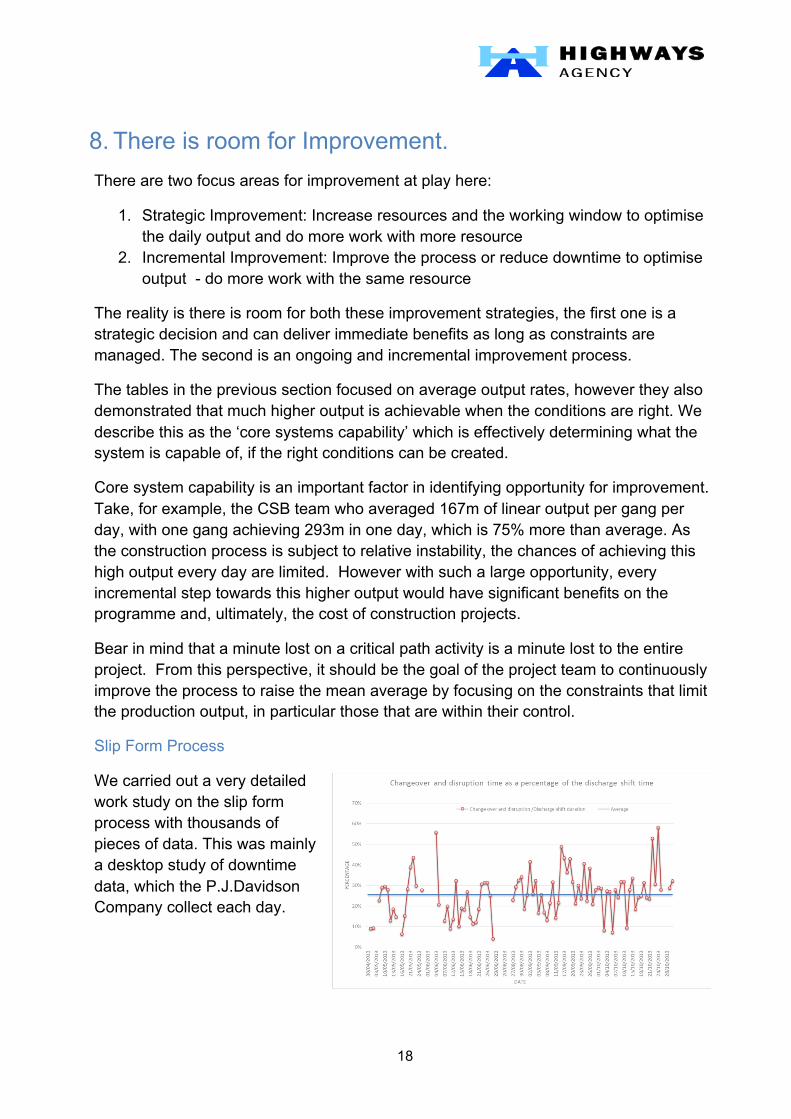
Slip Form Process
We carried out a very detailed work study on the slip form process with thousands of pieces of data. This was mainly a desktop study of downtime data, which the P.J.Davidson Company collect each day.

!
19
From our experience, this is some of the best quality data we have seen and were happy to use this for our analysis (it was also convenient as there was no planned work activity on site).
Mobilisation / Downtime / Changeover Time
The study showed that on average, the slip form machine is subject to approximately 26% of inactivity during the optimum working window, which is the first concrete discharge to the last. The study also showed that the average time for the first concrete discharge is 2.33hrs after the shift started. Therefore we can see a significant amount of idle time due to issues with the delivery and quality of materials. The table shows this and also demonstrates the huge amount of variation that exists in the process – on good days there could be as little as 4% downtime, on bad days it could be as much as 58%). We included the changeover from one concrete wagon to the next as downtime, as we felt that there is room for improvement in this area due to the amount of variation.
We also analysed the reasons for downtime, seen here, which shows the main issues are concrete quality (too wet, too dry or too much air) and waiting for concrete. The detail of this study can be seen in Appendix F. Without going into too much detail, we can report that the P.J. Davidson and SBBJV team are actively dealing with these constraints and this is mainly through the innovative use of a concrete delivery process called ‘Volumetrics’.
Volumetrics is a dry mix delivery system. It allows for fewer changeovers of the concrete wagons as it holds up to 11m3 (as opposed to 6m3) and it allows the team to be more in control of the concrete quality. We hope to report on the benefits of this system over the coming few months as the data becomes available on Section 5b.
Cut and Fill Process
The next workstudy we undertook was in the verge and involved the cut and fill activity. Unlike the slip-form process, we had little data but we could access the site to review the work in progress. This involved direct observation over two days and the installation of a data collection process and ongoing analysis over the past couple of months. This was designed to give a more accurate representation of the performance of the process – the full report can be seen in Appendix E.

!
20
To focus the work study we identified that the excavator is the main value element of the process. In other words, if the excavator is actively engaged in moving muck (picking up or dropping it), then the process is achieving its primary value-adding function.
The initial observation showed that the excavator suffered approximately 39% of planned and unplanned downtime due to waiting for plant, access, travel to site and setting up the machine, of which the main contributor to down time was waiting for plant (wagons).
Waiting for wagons can be split into two areas:
1. Waiting for a wagon to arrive at site (18% of the time)
2. Waiting for the changeover of lorries during the wagon fill cycle (13% of the time)
It was observed that on average a wagon will spend less than 7 minutes actively being loaded with muck, 5 minutes reversing into position from the site entrance and another 3 minutes exiting the site. This totals a 15 minutes cycle time per wagon, from the time it enters the site until it leaves. Further analysis has shown that the process can also suffer downtime from a ‘lack of information’ and ‘machine breakdown’ as shown above.
Understanding the process and, in particular, the constraints which prevent the process from operating, can help the project team deal with each of the constraints individually.

!
21
For example, the team has committed to:
• review the optimum number of support wagons to reduce the waiting time of the excavator
• review the changeover process to reduce the amount of lost time between one lorry being filled and the next one moving into position to be filled.
• reduce the time lost due to waiting for information through more detailed look-ahead planning
• review the daily/weekly maintenance regime on the excavator to prevent breakdown.
This improvement work will continue over the coming months after which time we anticipate being able to report positively on the improvements it has brought.
In summary
We can deliver project improvement quickly in terms of time and cost by simply increasing the resource and working over longer periods of time (where this is possible, as we need to consider environmental restrictions). We can also improve the efficiency of the process by using simple work study techniques and problem solving. The solution is not one or the other, but to adopt both on Smart Motorway Projects going forward.

!
22
9. Production Train Methodology During the writing of this report and in the course of various collaborative workshops, we became aware of an emerging process which we feel could be successfully applied as a standard approach for the delivery of Smart Motorway Projects going forward.
NB. this approach is a principle that has been developed by others during the writing of this report, this principle is independent of the M25 DBFO team strategy and seeks to achieve similar outputs but over shorter TM arrangements.
This approach, currently termed ‘Production Train’, seeks to deliver the same outputs proven by the M25 team but over a shorter traffic management geography. The benefits of this would primarily be for the road user, as it would mean less traffic management (TM) to drive through. However, it could potentially benefit the contractor, client and suppliers as well, as there would be less capital equipment tied up (temporary safety barrier) and less restriction due to network availability, i.e. the limits placed on the amount of carriageway under TM at any point in time.
The Production Train idea is currently limited to central reservation works but work is underway to apply this thinking to verge works.
Overview
The Production Train method has two broad benefits:
• optimisation of the construction of the central reservation works of a Smart Motorway Scheme by reducing the current construction timescale
• improvement of the TM strategy to: ! reduce the length of TM out on the network at any time whilst constructing the
central reservation works ! reduce the timescale that TM is required on the network with the road released
back to the road user as soon as possible. Central Reservation Works – Typical Activities Below is a list of the typical activities required to complete central reservation works. These activities have been divided into three categories:
• Critical Path Activities • Non-Critical Path Activities • Additional Scope Activities
Critical Path Activities These activities include Advanced Works & Main Works: Advanced Works

!
23
1. CCTV, SPECS, vehicle recovery – 1mth
Main Works
1. Install traffic management C/Res 2. Site clearance (barrier, columns and bases) 3. Excavation - bulk dig fill to earthworks profile 4. Carrier drainage* 5. Sub-base and capping 6. Drainage V – channel: sIip form (or slot drain) 7. Road base layers (blacktop or concrete dependant on width) 8. RCB /TWRCB: sIip form 9. Blacktop finishes 10. Remove traffic management Varioguard and narrow lanes 11. Handover into maintenance
*the central reservation will not have carrier drain along the entire length (possibly 15%-50%)
Non-Critical Path Activities There are a number of activities that are required as part of the central reservation works, but that can be carried out without impacting the critical path. Within the Production Train approach, whilst the TM is operational, time should be scheduled to complete these works:
1. Blisters 2. Cross carriageway ducts 3. Locate existing stats 4. Drainage chambers and connections
Additional Scope Activities Depending on the particular requirements or design of the scheme, there could be a number of additional activities within the central reservation works. These activities may or may not be on the critical path and, as such, appropriate programming of these activities will be required to understand the impact on the duration of the scheme:
1. Hard-shoulder strengthening (critical path activity) 2. Lighting removal (not critical path) 3. New lighting provision (carriageway – not critical path) 4. Structural repairs to existing structures (under/over bridges – piers, abutments,
edge beam protection) (possibly not critical) 5. New, replacement or modified structures (bridges, junctions) (criticality project
specific)

!
24
Methodology Principles: The Train Approach (Central Reservation Only) Below are some of the key principles to be considered when applying Production Train thinking: Productivity
• Each critical path activity has to produce a minimum output of 200 linear metres per day - regardless of volume, for example depth of dig.
• Achieving this balanced output will be done through increasing or decreasing the resources and shifts worked per day
• Improvement focus will likely be on slowest activities, for example excavation and drainage
Programming • In terms of programme planning, each critical path activity will have a ‘start-to-
start’ relationship with a 1-week lag between activities. • A 1-week lag in activities gives each critical path activity a clear working site of
1200m (200m of linear output per day x 6 days per week = 1200) • All activities start in the same location – at one end of the scheme – and progress
to the opposite/far end of the scheme. In essence, each activity follows the direction of the previous activity.
Working Practices • The site will operate full production for 6 working days in a 7 working day week • The 7th day is likely to be used to:
o prep for the following week o carry out any remedial work required o catch-up on any lost productivity within the week
• Access & egress points at 300/400m spacings (we need consider methods to close openings and/or safer working practices, i.e. work across opening only at night)
Productivity Rates and Scheme Duration As outlined above, by targeting a productivity rate of 200m of linear output per day for each critical path activity, the durations of main works can be calculated for any scheme length. If the scheme duration formula below is applied, the duration of any scheme can be calculated.
• Calculate productivity per critical path activity, per gang, per day (See table 2 – daily output rates)
• Scheme duration formula = ((Scheme Length/(200x6) + (10x1)) • Scheme duration v scheme Length – see table below

!
25
Scheme Duration Formula and Table showing Examples of Scheme Durations For the Main Works, using the formula below, we can calculate the theoretical durations of schemes using the Production Train outputs - dependent on their length. Using this will help us to establish a set of target measures for schemes going forward which are using the Production Train approach.
(Scheme Length) + (10CPx1WL) = Scheme Duration (200DP x6d) Key:
CP: No. of critical activities
WL: 1 week lag between critical path activities
d: days worked per week DP: Daily productivity (…of 200m per day)
Scheme Length (km)
Scheme Duration (weeks)
Scheme Length (km)
Scheme Duration (weeks)
8 16.67 20 26.67 10 18.33 22 28.33 12 20.00 24 30.00 14 21.67 26 31.67 16 23.33 28 33.33 18 25.00 30 35.00
Main Works: Scheme Durations Removal of TM – Direction of Travel Based on the methodology outlined above, all activities start at one end of the scheme, in the same location and follow each other (i.e. one ‘carriage in the train’ follows the other). This allows for the final completion of each section of the works progressively from one end of the scheme to the other.
As the works complete, for example progressively from left to right, the traffic management would be removed from the left end of the scheme and added to the right end of the scheme as work starts further down ‘the track’.
Using this method and being able to remove traffic management as work completes, prior to the completion of the overall scheme can reduce the overall traffic management on the network by up to 65%.
Note: a graphical representation for this can be seen in Appendix G
Example Programme: Overview & TM Durations for a 23km Scheme
• Advanced Works – 4wks (under night time temporary TM)

!
26
• Overall main programme for 23km scheme length = 28wks TM Layout (for Main Works) The traffic management is laid out in shorter lengths (for example 6km) and, as the scheme progresses, additional lengths are laid out further along the scheme: Using 6km as an example:
1. Layout TM in 6km lengths 2. Depending on the precise location (chainage) along the scheme, each 1.2km
section along the scheme has a maximum TM Duration of between 12 to 17wks
TM Removal (for Main Works) Depending on the scheduling of the non-critical path activities, traffic management could be removed frequently, in short lengths, to minimise the impact to road users:
1. Option 1:TM removed in 6km lengths to give a TM Duration of 16wks per section 2. Option 2: TM is removed in 1.2km lengths to give a variable TM duration of 11 to
17 weeks. TM Duration - by Chainage
The table below shows, by particular location (chainage), when TM is laid out and removed (by week).
Chainage
TM On (week no.)
TM Off (week no.)
TM Duration (weeks)
0-1200 1 12 12 1200-2400 1 13 13 2400-3600 1 14 14 3600-4800 1 15 15 4800-6000 1 16 16 6000-7200 5 17 13 7200-8400 5 18 14 8400-9600 5 19 15
9600-10800 5 20 16 10800-12000 5 21 17 12000-13200 11 22 12 13200-14400 11 23 13 14400-15600 11 24 14 15600-16800 11 25 15 16800-18000 11 26 16 18000-19200 16 27 12 19200-20400 16 28 13 20400-21600 16 29 14 21600-23000 16 30 15

!
27
The chart below shows the length of traffic management for each week of the scheme (i.e. from week 0 to week 30). It can easily be seen that the length of traffic management using a ‘rolling’ strategy is substantially less than the method of laying out traffic management over the whole length of the scheme, for the entire duration of the scheme. By combining the construction efficiency of utilising the ‘Train Methodology’ and ‘Rolling TM’, traffic management can be reduced by up to 65%.
Trial and Error: Whilst the above production strategy works in principle, there is still a lot of work to put this into practice, which will no doubt result in trial and some error. Indeed the finished article or best method, may in fact be different in many ways than the strategy described above. However in order to innovate, we need to be allowed to make mistakes (safely). To paraphrase Thomas Edison ‘in inventing the lighbulb I discovered a thousand ways how not to make a lightbulb.
Some areas to consider and or mitigate:
• Availability of TM resource required to make multiple visits to take off and put on TM in smaller quantities
• Road user behaviour may be affected by driving through TM that is less constant i.e. changes more often
0!
5!
10!
15!
20!
25!
0! 2! 4! 6! 8! 10! 12! 14! 16! 18! 20! 22! 24! 26! 28! 30!
Length!of!T
M!(k
m)!
Scheme!Week!No.!
TM!Length!!
TM!Length!2!Rolling!
TM!Length!2!Whole!Length!
!
28
10. Proof of Concept - Application to Other Schemes M5 J4a to 6 - M25
During the period this report was being compiled, we were asked to use the information we had gathered so-far to compare the outputs of a planned scheme (M5 J4a-6) with the outputs achieved by the M25 team. The aim was to identify potential areas for programme improvement. This was the first opportunity to test the concept of being able to apply outputs achieved on one scheme to another scheme of similar, but not identical, scope.
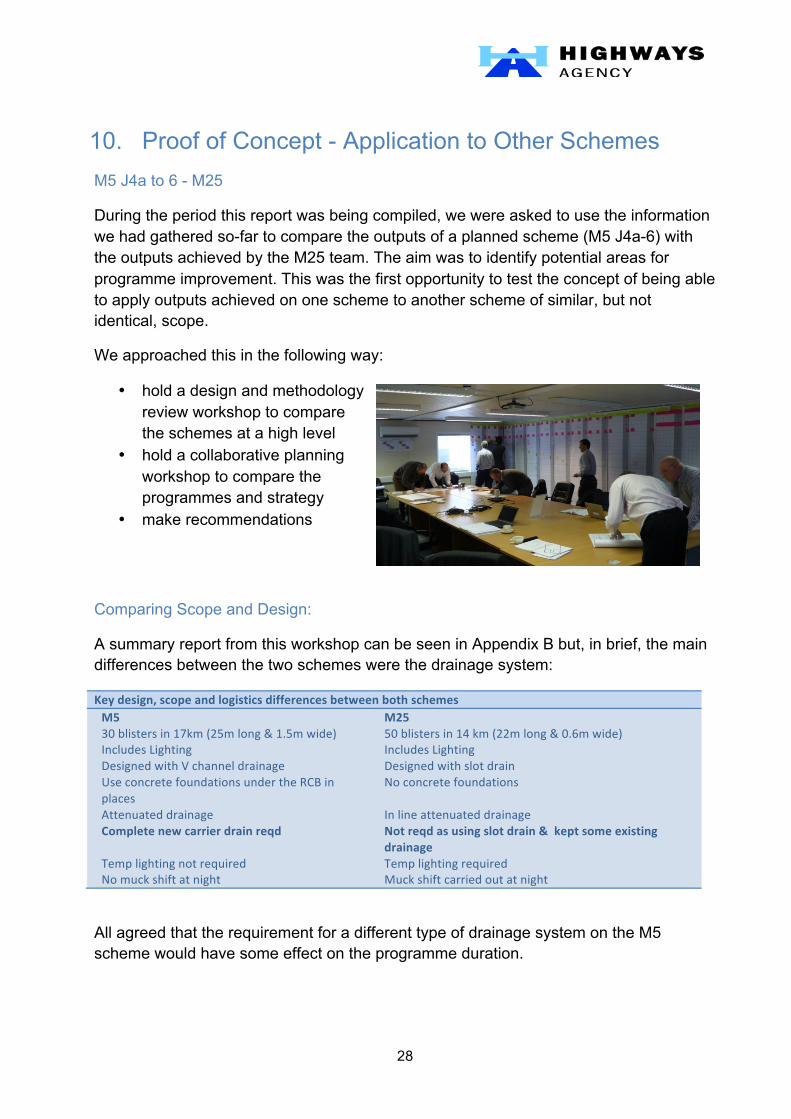
We approached this in the following way:
• hold a design and methodology review workshop to compare the schemes at a high level
• hold a collaborative planning workshop to compare the programmes and strategy
• make recommendations
Comparing Scope and Design:
A summary report from this workshop can be seen in Appendix B but, in brief, the main differences between the two schemes were the drainage system:
Key!design,!scope!and!logistics!differences!between!both!schemes!M5! M25!30!blisters!in!17km!(25m!long!&!1.5m!wide)! 50!blisters!in!14!km!(22m!long!&!0.6m!wide)!Includes!Lighting! Includes!Lighting!Designed!with!V!channel!drainage! Designed!with!slot!drain!Use!concrete!foundations!under!the!RCB!in!places!
No!concrete!foundations!
Attenuated!drainage!! In!line!attenuated!drainage!!Complete!new!carrier!drain!reqd! Not!reqd!as!using!slot!drain!&!!kept!some!existing!
drainage!Temp!lighting!not!required! Temp!lighting!required!No!muck!shift!at!night! Muck!shift!carried!out!at!night!
!
All agreed that the requirement for a different type of drainage system on the M5 scheme would have some effect on the programme duration.

!
29
Comparing Programmes across the two schemes
We held a collaborative planning workshop with the aim of reviewing the M5 programme to determine if improvements could be made using some of the lessons learned from the M25 projects. This workshop was held at the M25 offices and included the M5 project team, members of the Hub planning team and the M25 project team (including P.J. Davidson, slip-form supplier)
A lot of the detail discussed on the day demonstrated that the M5 project was subject to various constraints. However, it also demonstrated that there was an improvement opportunity of between 4-5 weeks through the adoption of some of the practices used on the M25. In brief these were:
• an increase the number of resources/work gangs in the traffic management • an increase the number of access points to facilitate the movement of site traffic
M1 J16-19 – M25
More recently we held another collaborative planning workshop with the M1 J16-19 team and the M25 team to carry out a similar exercise. The output from this workshop, is being compiled into a time location chart, which will be reviewed and released on completion. There were several areas of improvement that emerged on the day, demonstrating the benefits that can be gained through bringing different project teams together to share their collective experiences. The identified areas for improvement included:
• the reuse of as many MS3 sites as possible to mount MS4’s (69 site available) • carrying out surveys prior to the project starting especially in the early section to
avoid any potential delay in design later • putting zoneguard out in parallel (potentially saving 4 weeks on programme) • to challenge the current works info restriction of access points every 1.5 km • the removal of TM in stages to speed up the demob process • the use of existing cross carriageway ducts • the use of mobile laser scanning in order to improve the survey information • reviewing and seeking to reduce, where possible, the number of cross
carriageway pipes in the design • to construct the plinth base in concrete
Summary
Whilst the above exercise was limited by the timing of the workshops, which in this case were too late to make any significant changes, it did prove that there was opportunity to be had on both schemes by adopting some of the ideas from the M25. To capitalise on this process going forward and to gain useful benefit from lessons learned, this knowledge sharing process across schemes needs to be formalised and implemented.

!
30
11. Summary of Findings This report was commissioned to investigate the reasons why the M25 team seem to be able to produce more kilometres of Smart Motorway per week than any other scheme. Our initial finding was to show, through a comparison of the M25 with 4 other schemes, that this was an accurate observation and that in fact the M25 output is, in the case of some schemes, significantly higher.
Having shown that the M25 is producing more quickly, we then analysed the reasons why. Some of this analysis was quantitative, based on actual output data, and some was qualitative, based on people’s opinions gathered during ‘lessons learned’ workshops. Whilst the use of data is clearly important to prove a concept, we shouldn’t underestimate the value of qualitative data, especially in the construction environment where wisdom must sometimes prevail over sparse facts.
The analysis identified that faster delivery was achieved by the M25 team because they planned for 200m of linear output per day and - through the use of various techniques, experience, systems and relationships - delivered against this ambition.
This raised a question around the applicability of this learning to other schemes, as it is not always practical to compare on a ‘like for like’ basis, and as other project teams may not have the same enabling factors which helped the M25 team to deliver their planned output.
Whilst there is merit in this question, in practice the success of the M25 team was not so much in the content of their work but in their approach to it; if other schemes adopted a similar approach of working in more locations, using more resource and working longer hours they too would deliver more quickly. Indeed, when we compared the M25 with other projects it became apparent that there are other project teams who are already close to achieving the M25 outputs. This suggests that the outputs are replicable across other schemes, regardless of their maturity and experience.
As a result of the various discussions with the M25 team and the lessons learned over a number of workshops, we can show that a different and more efficient approach to delivering Smart Motorways is theoretically achievable. To this end, we have proposed a methodology entitled ‘Production Train’, which is currently untested but is based on factual data. We now collectively need a prevailing wind and a great deal of enthusiasm to deliver, learn and improve on this methodology.
The time is right to challenge the current way of thinking about highways construction as the industry is receptive to innovative ways of working, the client is in the process of change with a view to working differently in the future and the new CDF contract can act as an enabler to improve working relationships. In order to deliver the full potential of Smart Motorways Construction, we need motivated people and organisations, standard designs, methods and a spirit of improvement.

!
31
12. Recommendations:
• Use the M25 schemes as the current benchmark for all other similar schemes. • Transfer the learning using the current hub system and/or its SMP replacement. • Extend the range of measures for benchmarking beyond delivery and output to
include: o Safety o Cost o Quality o Customer / Stakeholder Satisfaction o Environmental impact
• Use the CDF framework to create the right conditions and motivations to adopt, challenge and improve the Production Train approach.
• Standardise elements of the product and seek to improve the design and the construction methodology, for example slot drain versus V channel.
• The HA to develop a standard methodology and set of production output rates to be used for all future schemes (the ‘intelligent client’ approach).
• Produce a handbook for Smart Motorways, outlining best practice and methods. • Maintain project teams to improve the economies of learning – a programme
approach to building multiple projects will help to facilitate this. • Create a more detailed analysis of verge works – where there are more
variations in work activity, unlinked activities etc. • Discuss outputs with key suppliers and the potential for improvements in
performance through process improvement. • Establish KPI’s as a standard process on all SMP motorways and support this
with downtime data collection, analysis and problem solving as standard. • Carry out another detailed analysis of the slip form data on Section 5B to
determine the efficacy of the ‘Volumetrics’ concrete process. • Review ongoing downtime data on the cut and fill activity to identify
improvements and show what is possible.
!
32
Appendix A – Output from ‘lessons learned’ workshop: ‘how are the M25 team able to build quicker than other similar schemes’

!
33
Appendix A continued…
!
34
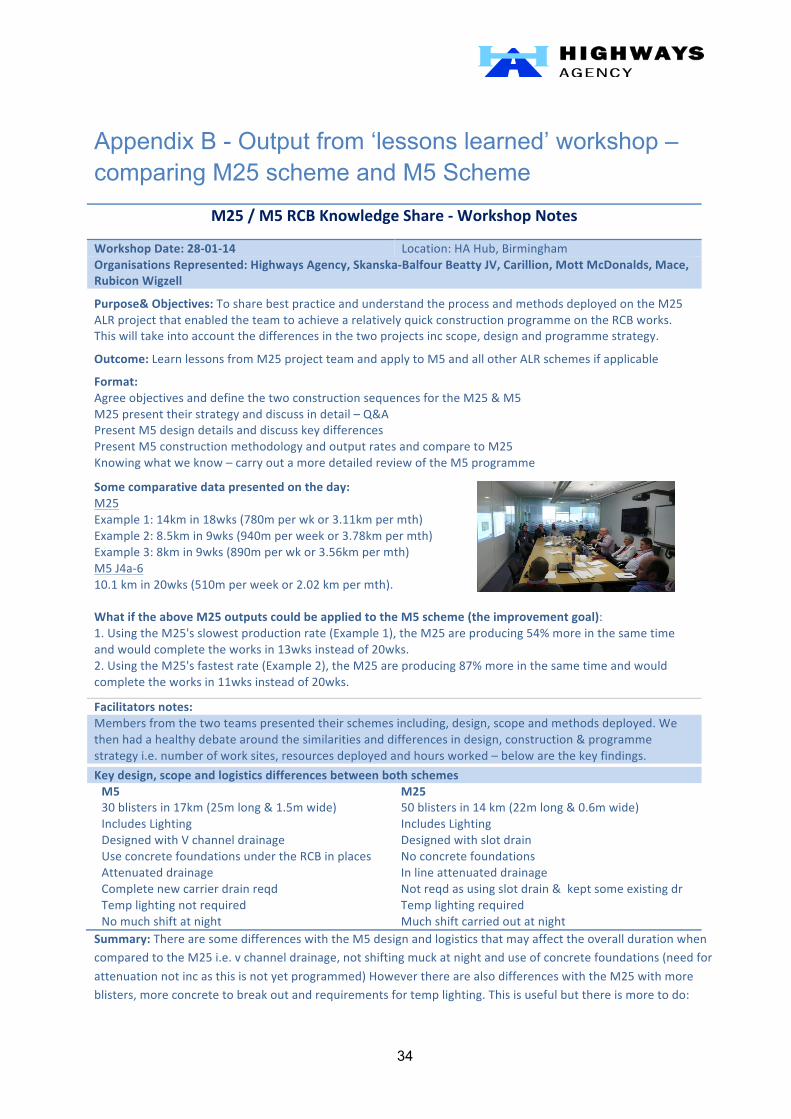
Appendix B - Output from ‘lessons learned’ workshop – comparing M25 scheme and M5 Scheme
M25!/!M5!RCB!Knowledge!Share!K!Workshop!Notes!!
Workshop!Date:!28K01K14!! Location:!HA!Hub,!Birmingham!Organisations!Represented:!Highways!Agency,!SkanskaKBalfour!Beatty!JV,!Carillion,!Mott!McDonalds,!Mace,!Rubicon!Wigzell!!
Purpose&!Objectives:!To!share!best!practice!and!understand!the!process!and!methods!deployed!on!the!M25!ALR!project!that!enabled!the!team!to!achieve!a!relatively!quick!construction!programme!on!the!RCB!works.!This!will!take!into!account!the!differences!in!the!two!projects!inc!scope,!design!and!programme!strategy.!!
Outcome:!Learn!lessons!from!M25!project!team!and!apply!to!M5!and!all!other!ALR!schemes!if!applicable!!
Format:!!Agree!objectives!and!define!the!two!construction!sequences!for!the!M25!&!M5!M25!present!their!strategy!and!discuss!in!detail!–!Q&A!Present!M5!design!details!and!discuss!key!differences!Present!M5!construction!methodology!and!output!rates!and!compare!to!M25!Knowing!what!we!know!–!carry!out!a!more!detailed!review!of!the!M5!programme!!
Some!comparative!data!presented!on!the!day:!M25!Example!1:!14km!in!18wks!(780m!per!wk!or!3.11km!per!mth)!Example!2:!8.5km!in!9wks!(940m!per!week!or!3.78km!per!mth)!Example!3:!8km!in!9wks!(890m!per!wk!or!3.56km!per!mth)!M5!J4a26!10.1!km!in!20wks!(510m!per!week!or!2.02!km!per!mth).!!What!if!the!above!M25!outputs!could!be!applied!to!the!M5!scheme!(the!improvement!goal):!1.!Using!the!M25's!slowest!production!rate!(Example!1),!the!M25!are!producing!54%!more!in!the!same!time!and!would!complete!the!works!in!13wks!instead!of!20wks.!2.!Using!the!M25's!fastest!rate!(Example!2),!the!M25!are!producing!87%!more!in!the!same!time!and!would!complete!the!works!in!11wks!instead!of!20wks.!!
Facilitators!notes:!Members!from!the!two!teams!presented!their!schemes!including,!design,!scope!and!methods!deployed.!We!then!had!a!healthy!debate!around!the!similarities!and!differences!in!design,!construction!&!programme!strategy!i.e.!number!of!work!sites,!resources!deployed!and!hours!worked!–!below!are!the!key!findings.!!
Key!design,!scope!and!logistics!differences!between!both!schemes!M5! M25!30!blisters!in!17km!(25m!long!&!1.5m!wide)! 50!blisters!in!14!km!(22m!long!&!0.6m!wide)!Includes!Lighting! Includes!Lighting!Designed!with!V!channel!drainage! Designed!with!slot!drain!Use!concrete!foundations!under!the!RCB!in!places! No!concrete!foundations!Attenuated!drainage!! In!line!attenuated!drainage!!Complete!new!carrier!drain!reqd! Not!reqd!as!using!slot!drain!&!!kept!some!existing!dr!Temp!lighting!not!required! Temp!lighting!required!No!much!shift!at!night! Much!shift!carried!out!at!night!
!
Summary:!There!are!some!differences!with!the!M5!design!and!logistics!that!may!affect!the!overall!duration!when!compared!to!the!M25!i.e.!v!channel!drainage,!not!shifting!muck!at!night!and!use!of!concrete!foundations!(need!for!attenuation!not!inc!as!this!is!not!yet!programmed)!However!there!are!also!differences!with!the!M25!with!more!blisters,!more!concrete!to!break!out!and!requirements!for!temp!lighting.!This!is!useful!but!there!is!more!to!do:!

!
35
Next!Steps:!Compare!the!Gantt!chart!&!time!location!of!both!schemes!in!detail!to!establish:!
• Detailed!sequencing!(how!activities!are!linked!together,!i.e.!the!degree!of!'start!to!finish'!activities!which!actually!could!be!overlapped).!
• Detailed!working!practices!(which!activities!are!actually!being!carried!out!at!night,!how!much!work!is!actually!being!carried!out!on!day!6)!
• Establish!the!list!of!constraints!inhibiting!production!(...!tip!opening!times,!location!of!batching!plants,!NDD!design!constraints...).!
• Review!the!contract!T&Cs!(...it!was!said!that!the!current!MM!Contract!does!not!'encourage'!speed!of!delivery).!

!
36
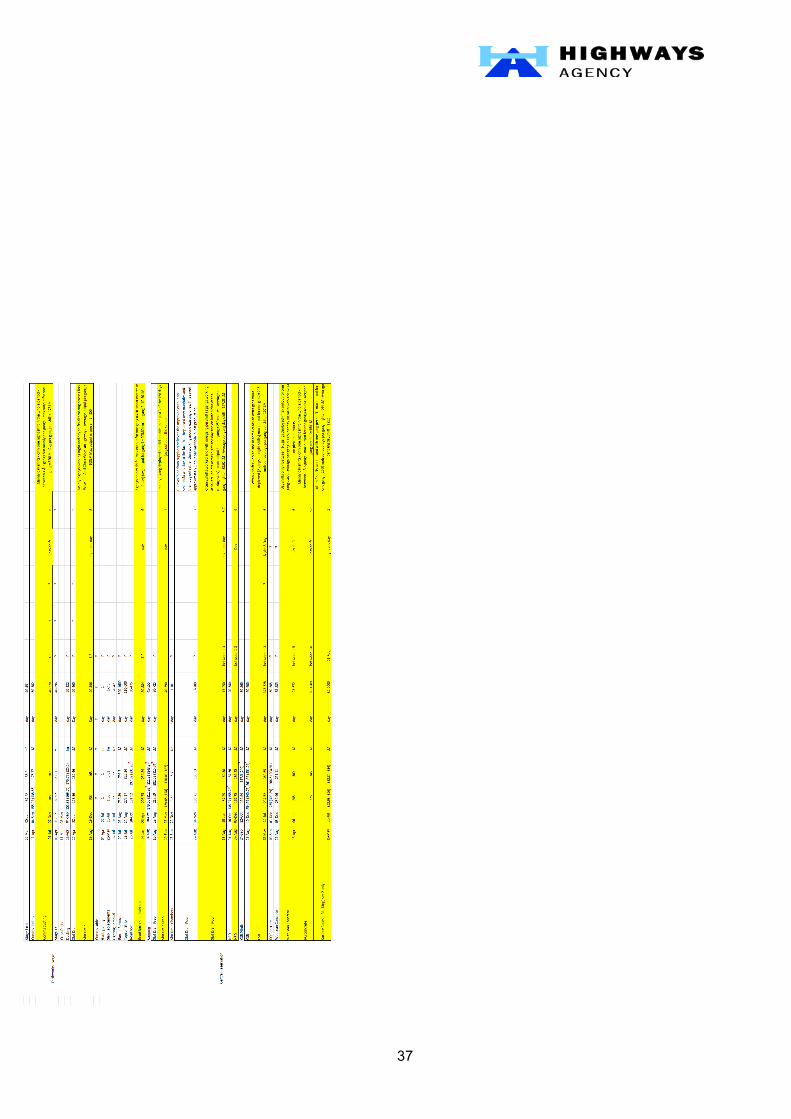
Appendix C - Individual Output Rates for activities used on the M25 scheme
!
37

!
38

!
39
Appendix C – Example of Project KPIs used on the M25 scheme

!
40

!
41

!
42
Appendix D – M25 planning and management process map

!
43
Appendix E - Improvement Work Study on the Cut and Fill Activity!
LEAN!IMPROVEMENT!SUMMARY!
!
!
Objective!• To! ensure! the! ‘Cut! and! Fill’! activity! is! delivered! safely,! effectively! and!
efficiently!in!terms!of!Time,!Quality,!Costs,!and!Customer!Satisfaction.!
How!we!did!it! !• We!applied!a!‘day!in!the!life!of!(DILO)’!technique!to!observe!measure!and!
analyse!the!performance!and!flow!of!the!process!with!the!aim!of!identifying!key!issues!and!potential!improvements.!!
Transferability!/!Use!on!other!schemes!!• This!set!of!techniques!can!be!applied!across!all!schemes!of!a!similar!scope!
and!of!any!size!project.!• Suppliers!can!learn!from!the!first!run!study!and!apply!across!all!schemes!

!
44
M25! Managed! Motorway!Improvement!Works!K!Junctions!23!to!27!‘Cut!and!Fill’!process!! !
!
!
!
!!
!
!
Knowledge!Transfer!Pack!(KTP)!!
!
Produced!by:!Wisam!Hasan!&!Andrew!Moore!(Rubicon!Wigzell!Ltd)!
!

!
45
Please!contact!the!HA!deployment!office!for!further!information!IMPORTANT!!
All! Knowledge! Transfer! Packs! received! by! the! HA! will! be! added! to! the! public! domain! area! of! Highways! Gov,!available! for!download!by!any! interested!parties!and! the!general!public.!Any!commercially! sensitive!or!personal!identifying!information!that!is!necessary!for!your!KTP!must!be!sent!to!the!HA!in!a!separate!appendix.!
If! in! doubt! about! whether! a! particular! piece! of! information! is! sensitive,! please! speak! to! one! of! the! HA! Lean!Technical!Managers!and!your!company!Data!Protection!Officer.!

DETAILED!REPORT!
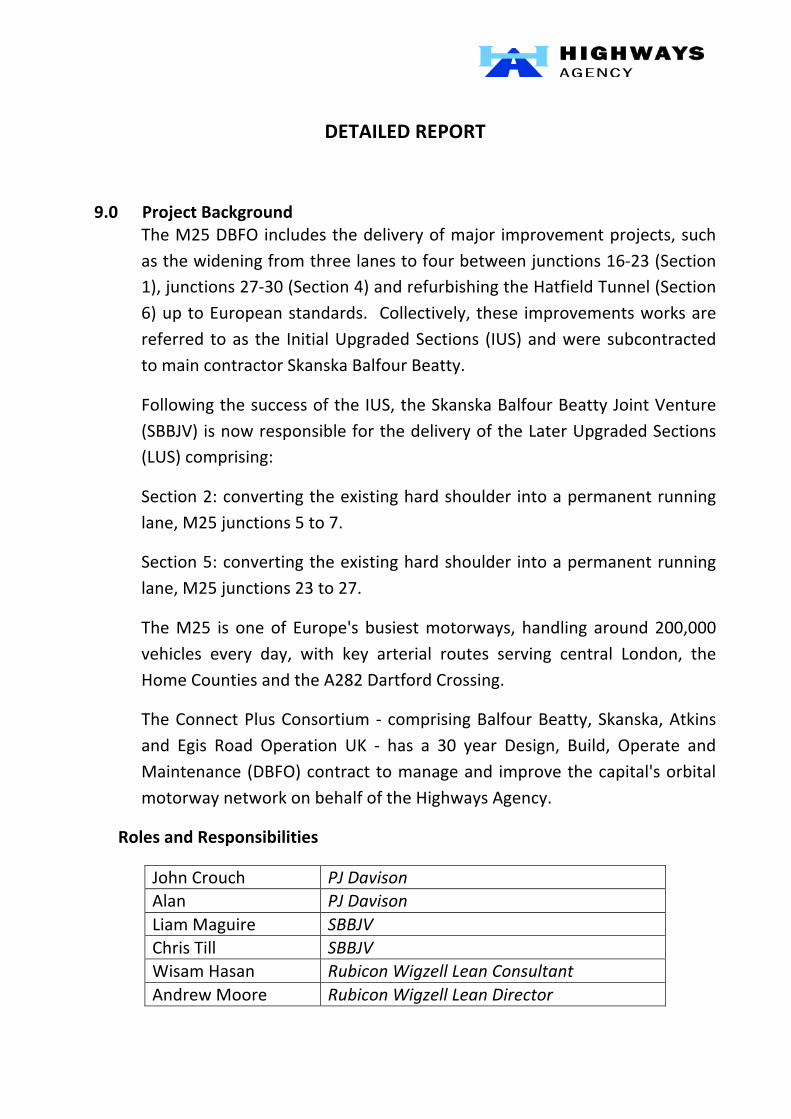
1.0 Project!Background!The!M25!DBFO!includes!the!delivery!of!major!improvement!projects,!such!as!the!widening!from!three!lanes!to!four!between!junctions!16223!(Section!1),!junctions!27230!(Section!4)!and!refurbishing!the!Hatfield!Tunnel!(Section!6)!up!to!European!standards.! ! Collectively,! these! improvement!works! are! referred! to! as! the! Initial!Upgraded! Sections! (IUS)! and! were! subcontracted! to! main! contractor! Skanska!Balfour!Beatty.!!
Following!the!success!of!the!IUS,!the!Skanska!Balfour!Beatty!Joint!Venture!(SBBJV)!is! now! responsible! for! the! delivery! of! the! Later! Upgraded! Sections! (LUS)!comprising:!
Section!2:!converting! the!existing!hard!shoulder! into!a!permanent! running! lane,!M25!junctions!5!to!7.!
Section!5:!converting! the!existing!hard!shoulder! into!a!permanent! running! lane,!M25!junctions!23!to!27.!
The!M25!is!one!of!Europe's!busiest!motorways,!handling!around!200,000!vehicles!every!day,!with!key!arterial!routes!serving!central!London,!the!Home!Counties!and!the!A282!Dartford!Crossing.!
The! Connect! Plus! Consortium! 2! comprising! Balfour! Beatty,! Skanska,! Atkins! and!Egis!Road!Operation!UK!2!has!a!30!year!Design,!Build,!Operate!and!Maintenance!(DBFO)!contract!to!manage!and! improve!the!capital's!orbital!motorway!network!on!behalf!of!the!Highways!Agency.!
Roles!and!Responsibilities!
Liam!Maguire! SBB#Planning#&#Productivity#Engineer#Verdun!Davies! SBB#Works#Manager#Tom!Cooney! Sub#Agent#Denis!Barlow! SBB#Site#Manager#Jim!Johnson! SBB#Foreman#Wisam!Hasan! Rubicon#Wigzell,#Lean#Consultant#Andrew!Moore! Rubicon#Wigzell,#Director#
!
!

!
2.0 Understanding!the!current!state!Historically! the! ‘Cut!and! fill!activity’!on! the!M25! improvement!project! isn’t!data!rich!and!unlike! the! ‘Slot!Drain’!activity! there!were!no!detailed!data!collected! to!help!understand!the!current!state.!!
To! get! around! this,! we! have! spent! a! full! day! shift! on! site! observing! the! ‘As2is’!process!as!well!as!collect!downtime!data!through!data!collection!techniques!
3.0 What!we!did!On!the!25th!of!Feb!a!Rubicon!Wigzell!consultant!accompanied!a!gang!of!workers!on!a!full!shift!to!observe!and!collect!the!data!needed!to!understand!the!current!state!and!to!be!used!as!a!baseline!for!any!improvement!initiatives!later.!
During!the!shift,!data!and!information!were!collected!on:!
• Delay!(Down)!times!and!causes!• Times!of!Wagons!activity!on!site.!• Process!flow!and!site!traffic!congestion.!• Good!practices.!
3.1!Down!time!
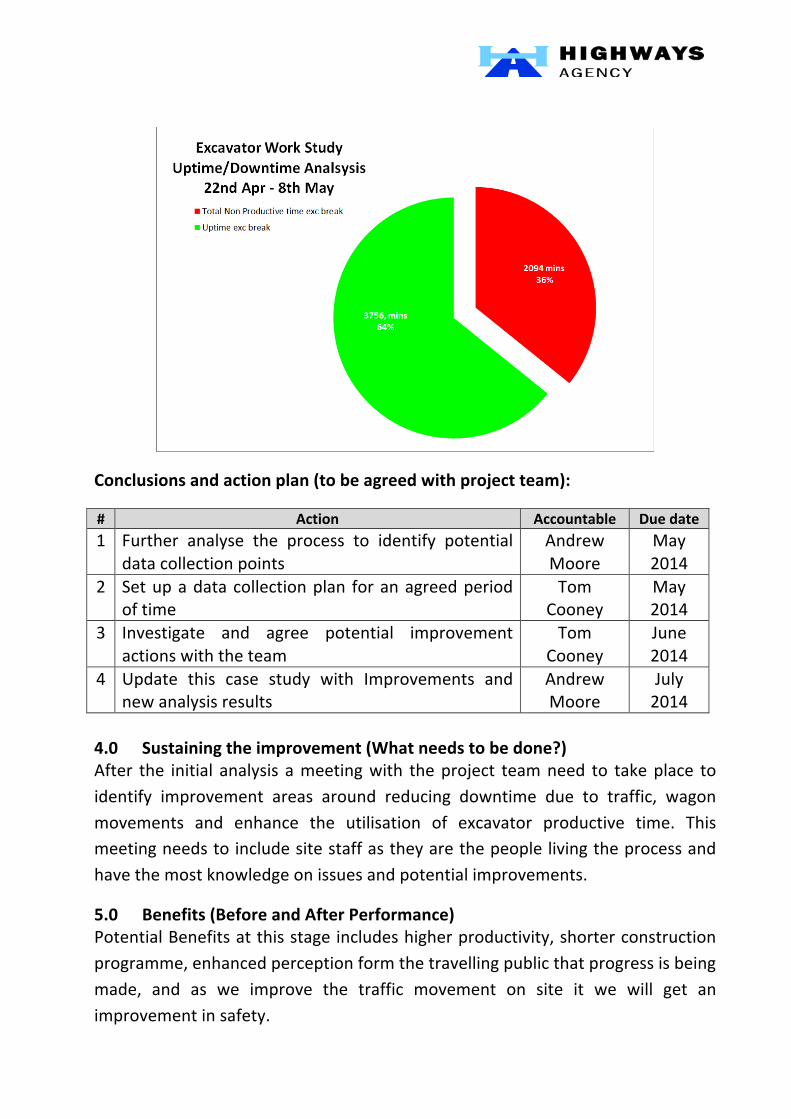
On!the!25th!Feb!observation! it!was!recorded!that!39%!of! the!shift! time!suffered!downtime! due! to! waiting! for! plant,! access,! travel! to! site! and! setting! up! the!machine,! of! which! the! main! contributor! to! down! time! was! waiting! for! plant!
(Wagons).!
!
!

!
3.2!Wagons!Activity!time!in!and!out.!
It!was!observed!that!on!average!a!wagon!will!spend!less!than!7!minutes!actively!being!loaded!with!muck,!this!is!the!value!added!time!as!the!excavator!is!engaged!in!moving!soil!which!is!the!‘value!statement’.!Non!Value!Added!Time!includes!an!average! of! 5! minutes! for! the! wagon! to! reverse! into! position! from! the! site!entrance!and!another!3!minutes!average!for!the!wagon!to!exit!the!site.!This!totals!a!15!minutes!cycle!time!per!wagon!from!the!time!it!enters!the!site!until!it!leaves.!
!
!
!
!
!
!
!
!
!
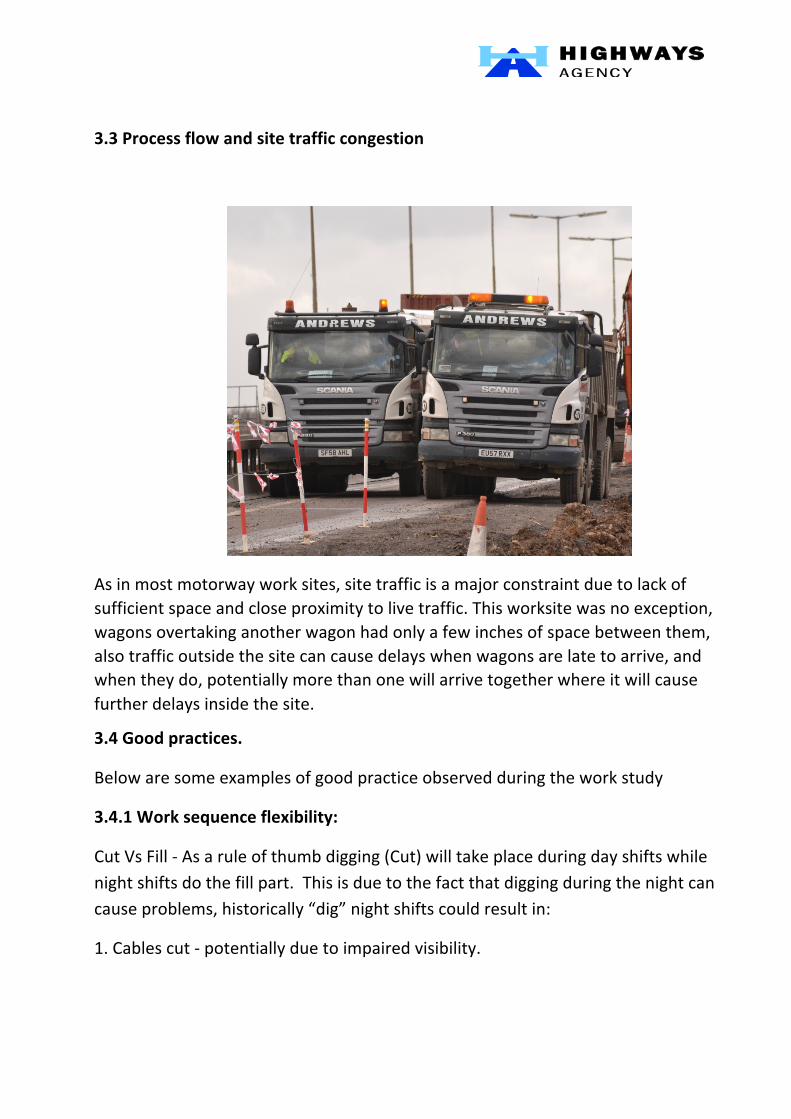
3.3!Process!flow!and!site!traffic!congestion!
!
!
As!in!most!motorway!work!sites,!site!traffic!is!a!major!constraint!due!to!lack!of!sufficient!space!and!close!proximity!to!live!traffic.!This!worksite!was!no!exception,!wagons!overtaking!another!wagon!had!only!a!few!inches!of!space!between!them,!also!traffic!outside!the!site!can!cause!delays!when!wagons!are!late!to!arrive,!and!when!they!do,!potentially!more!than!one!will!arrive!together!where!it!will!cause!further!delays!inside!the!site.!
3.4!Good!practices.!
Below!are!some!examples!of!good!practice!observed!during!the!work!study!
3.4.1!Work!sequence!flexibility:!
Cut!Vs!Fill!2!As!a!rule!of!thumb!digging!(Cut)!will!take!place!during!day!shifts!while!night!shifts!do!the!fill!part.!!This!is!due!to!the!fact!that!digging!during!the!night!can!cause!problems,!historically!“dig”!night!shifts!could!result!in:!
1.!Cables!cut!2!potentially!due!to!impaired!visibility.!

!
2.!and/or!Digging!more!than!required!which! in!turn!will! require!another!shift! to!re2fill! the!extra!dug!up!area.!Digging! requires! trimming! the!edges!of! the! trench!and!because!of!poor!visibility!this!won’t!be!possible.!
Despite! all! of! that,! if! the! weather! isn’t! at! its! best! ie! raining,! the! team! will! be!running!the!risk!of!the!trenches!being!filled!with!rain!water!and!this!is!when!the!work! sequence! can! be! changed! from! Cut! to! Fill! very! quickly! as! shown! in! the!Wagon!activity!duration!graph.!
3.4.2!Site!access:!
Although! it! is! not! the! standard,! similar!motorway! projects! specify! the! distance!between! site! access! points! at! 800! 2! 1000m! intervals.! At! this! project! the!earthworks! team! coordinate! constantly! with! the! traffic! management! team! to!optimise! the! location! and! the! intervals! of! the! site! access! point! to! minimise!wagons!reverse!time.!Currently! the! intervals!between!access!points! is!averaging!350m.!
3.4.2!Time!management:!
The!team!conduct!task!briefings!at!the!worksite!as!opposed!to!the!project!office,!this!helps!reduce!any!transportation!and!subsequent!non!value!adding!time.!
Summary:!
This! case! study! is! built! on!using!one! shift!worth!of!data! including!observations,!interviews!with!field!staff!and!management.!Any!conclusions!from!analysing!this!information!can!only!be! improved!by!collecting!and!analysing!more! longitudinal!data!over!a!longer!period!of!time.!This!will!highlight!and!identify!further!issues!to!be! rectified,! albeit! already! highlighting! a! potential! 39%! percent! of! programme!duration!improvement.!!
Update:! the! table! below! shows! downtime! data! collected! over! 223!week! period!and!supports!the!initial!figures!described!above.!
!
!
Conclusions!and!action!plan!(to!be!agreed!with!project!team):!
#! Action! Accountable! Due!date!1! Further! analyse! the! process! to! identify! potential!
data!collection!points!Andrew!Moore!
May!2014!
2! Set!up!a!data!collection!plan! for!an!agreed!period!of!time!
Tom!Cooney!
May!2014!
3! Investigate! and! agree! potential! improvement!actions!with!the!team!
Tom!Cooney!
June!2014!
4! Update! this! case! study! with! Improvements! and!new!analysis!results!
Andrew!Moore!
July!2014!
!4.0 Sustaining!the!improvement!(What!needs!to!be!done?)!After! the! initial! analysis! a!meeting!with! the!project! team!need! to! take!place! to!identify! improvement! areas! around! reducing! downtime! due! to! traffic,! wagon!movements! and! enhance! the! utilisation! of! excavator! productive! time.! This!meeting!needs!to!include!site!staff!as!they!are!the!people!living!the!process!and!have!the!most!knowledge!on!issues!and!potential!improvements.!
5.0 Benefits!(Before!and!After!Performance)!Potential!Benefits!at!this!stage!includes!higher!productivity,!shorter!construction!programme,!enhanced!perception!form!the!travelling!public!that!progress!is!being!made,! and! as! we! improve! the! traffic! movement! on! site! it! we! will! get! an!improvement!in!safety.!

!
6.0 Transferability!This!process!can!be!transferred!not!only!to!SMP!projects!but!also!any!HA!project!and!in!particular!those!that!require!cut!and!fill!but!also!any!excavation!work!such!as!the!road!box!excavation!in!the!central!reservation.!
7.0 Issues!and!Barriers!Failure! to! collect! good!data! and! respond! to! the! findings,! a! resistance! to! collect!data!potentially!for!fear!of!being!caught!out!(the!drivers!or!supervisors!may!feel!uncomfortable),! there! needs! to! be! an! incentive! to! improve! on! the! programme!and!not!just!meet!the!agreed!programme.!
8.0 Top!Learning!Points!The! process! suffers! large! amounts! of! waste! in! the! form! of! downtime! due! to!waiting!and!change!over!time!due!to!logistics.!

!
Appendix F – Improvement Work Studies on Slip Form Process
LEAN!IMPROVEMENT!SUMMARY!
!!
Objective!• To! ensure! the! ‘Slot! Drain’! activity! is! delivered! safely,! effectively! and!
efficiently!in!terms!of!Time,!Quality,!Costs,!and!Customer!Satisfaction.!
How!we!did!it! !We! analysed! historical! data! recorded! by! the! site! staff! to! understand! the!current! state!and!draw!conclusions!and!suggested!actions! to! improve! the!process!and!further!investigate!the!process!!
Transferability!/!Use!on!other!schemes!!• This!set!of!techniques!can!be!applied!across!all!schemes!of!a!similar!Scope,!
regardless!of!size.!!!
!
!
M25! Managed! Motorway!Improvement! Works! K!Junctions!23!to!27!‘Slot!Drain’!process!
!
!
!
!
!
!
Knowledge!Transfer!Pack!(KTP)!!
Produced!by:!Andrew!Moore!and!Wisam!Hasan!

!
Please!contact!the!HA!deployment!office!for!further!information!!
!
IMPORTANT!!
All! Knowledge! Transfer! Packs! received! by! the! HA! will! be! added! to! the! public! domain! area! of! Highways! Gov,!available! for!download!by!any! interested!parties!and! the!general!public.!Any!commercially! sensitive!or!personal!identifying!information!that!is!necessary!for!your!KTP!must!be!sent!to!the!HA!in!a!separate!appendix.!
!
If! in! doubt! about! whether! a! particular! piece! of! information! is! sensitive,! please! speak! to! one! of! the! HA! Lean!Technical!Managers!and!your!company!Data!Protection!Officer.!
KTP Template – June 2011 1
DETAILED!REPORT!
!
9.0 Project!Background!The!M25!DBFO!includes!the!delivery!of!major! improvement!projects,!such!as!the!widening!from!three!lanes!to!four!between!junctions!16223!(Section!1),!junctions!27230!(Section!4)!and!refurbishing!the!Hatfield!Tunnel!(Section!6)!up!to!European!standards.! !Collectively,! these! improvements!works!are!referred! to!as! the! Initial!Upgraded!Sections! (IUS)!and!were!subcontracted!to!main!contractor!Skanska!Balfour!Beatty.!!
Following!the!success!of!the!IUS,!the!Skanska!Balfour!Beatty!Joint!Venture!(SBBJV)!is!now!responsible!for!the!delivery!of!the!Later!Upgraded!Sections!(LUS)!comprising:!
Section!2:!converting!the!existing!hard!shoulder! into!a!permanent!running!lane,!M25!junctions!5!to!7.!
Section!5:!converting!the!existing!hard!shoulder! into!a!permanent!running!lane,!M25!junctions!23!to!27.!
The!M25! is! one!of! Europe's! busiest!motorways,! handling! around!200,000!vehicles! every! day,! with! key! arterial! routes! serving! central! London,! the!Home!Counties!and!the!A282!Dartford!Crossing.!
The!Connect!Plus!Consortium!2!comprising!Balfour!Beatty,!Skanska,!Atkins!and! Egis! Road! Operation! UK! 2! has! a! 30! year! Design,! Build,! Operate! and!Maintenance!(DBFO)!contract!to!manage!and! improve!the!capital's!orbital!motorway!network!on!behalf!of!the!Highways!Agency.!
Roles!and!Responsibilities!
John!Crouch! PJ#Davison##Alan!! PJ#Davison#Liam!Maguire! SBBJV#Chris!Till! SBBJV#Wisam!Hasan! Rubicon#Wigzell#Lean#Consultant#Andrew!Moore! Rubicon#Wigzell#Lean#Director#
!

!
KTP Template – June 2011 2
10.0 Understanding!the!current!state!To!improve!a!process!we!first!need!to!understand!the!current!state!process.!We!can!then!assess!the!performance!of!the!current!state!and!apply! lean!techniques!to!develop!an!improved!future!state.!!
On!construction!projects,! it!can!be!difficult!to!gather!good!data!to!check!for!the!performance! of! the! current! state! process.! Ideally! we! would! like! data! over! a!significant!period!of!time!to!ensure!we!have!sufficient!data!points!for!analysis.!We!would!then!support!this!analysis!with!onsite!observations.!!
Due! to! the! slot! drain! activities! position! on! the! programmes! critical! path! it!was!chosen! to! be! the! subject! of! this! study,! an! hour! delay! on! a! critical! path! activity!means!an!hour!delay!for!the!whole!project,!and!consequently!any!improvements!realised!on!this!activity!will!lead!to!improvements!to!the!whole!programme.!
In!this!case,!we!had!excellent!data!produced!by!both!SBBJV!on!daily!output!rates!but! also! P.J.! Davidson!who! complete! very! detailed! daily! operator! and!machine!allocation!sheets.!As!P.J.!Davidson!were!not!due!to!carry!out!construction!works!during!this!period,!we!relied!initially!on!the!data!only,!but!will!then!follow!this!up!with!onsite!observations!when!work!starts.!
11.0 What!we!did!!
11.1! What!to!Analyse!!There! were! two! sources! of! data! records! that! were! available;! the! daily! laying!statement! (Concrete)! forms! and! the! daily! labour,! plant! &! material! allocation!forms.!
The!laying!statement!had!detailed!data!on!individual!wagons!in!and!out!of!the!site!with! exact! times! and! statistics! of! the! concrete! deliveries! and! reasons! for! delay!and/or!rejections!of!concrete!after!inspections.!!
Whilst!the!labour!and!plant!allocation!forms!had!data!on!the!number!of!staff!on!site,!start!and!end!times!of!shifts!and!plant!used.!
Analysing! this! data! will! help! us! to! identify! down! time,! changeover! time,! the!volume!of!concrete!laid!and!other!issues!that!might!arise!during!the!construction!process.!

!
KTP Template – June 2011 3
11.2 The!Analysis!!
11.2.1 Late! start.One! of! the! earliest! observations! during! our! analysis!was! the!gap!between! the! shift! start! and! the! first! concrete!discharge,! the! graph!below! shows! that! it! can! be! an! average! of! 2:33! hours! per! day! and!anything!up! to! 7! hours! delay.! ! The!project!manager! indicated! that! this!was!expected!giving!the!circumstances!of!the!geographic!location!of!the!worksite.!
!
!
3.2.2 Productivity.! Since! the! first! concrete! discharge! showed! an! average! of!approximately!2!hours!delay,!then!this!would!skew!the!volume!per!hour!calculation!if!we!measured!the!time!from!the!start!to!the!end!of!the!shift.!Therefore,! the! graph! below! shows! both! volume! per! hour! measured!twice.!One!using!the!time!from!the!first!discharge!and!ends!with!the!last!(8.9!M3/hour)!whilst!the!second!measure!is!the!shift!start!and!end!times!and!shows!an!understandably!low!5.5!M3/hour.!
!

!
KTP Template – June 2011 4
!
3.2.3 Downtime.!During!the!shift!there!will!be!time!when!work!will!be!disrupted!for!many!reasons,!understanding!the!duration!of!disruption!and!those!reasons!will!help!reduce!the!downtime!which!in!turn!improves!productivity.!
The!period!of!time!between!a!wagon!leaving!the!site!and!the!next!one!entering!is!called!the!changeover!time.!The!graph!below!shows!the!changeover!time!per!shift!and!although!it!peaks!at!more!than!6!hours!per!shift!the!average!is!2:40!hours.!
!
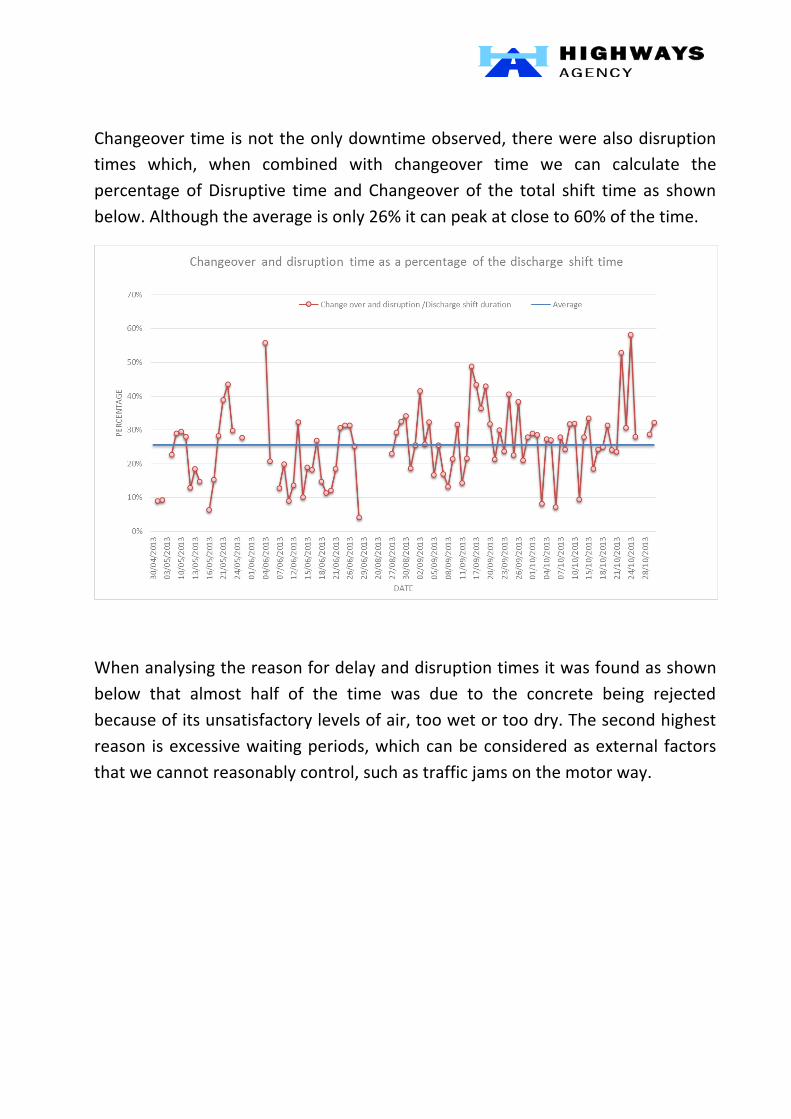
!
KTP Template – June 2011 5
Changeover!time!is!not!the!only!downtime!observed,!there!were!also!disruption!times! which,! when! combined! with! changeover! time! we! can! calculate! the!percentage! of!Disruptive! time! and!Changeover! of! the! total! shift! time! as! shown!below.!Although!the!average!is!only!26%!it!can!peak!at!close!to!60%!of!the!time.!
!
!
When!analysing!the!reason!for!delay!and!disruption!times!it!was!found!as!shown!below! that! almost! half! of! the! time! was! due! to! the! concrete! being! rejected!because!of!its!unsatisfactory!levels!of!air,!too!wet!or!too!dry.!The!second!highest!reason! is!excessive!waiting!periods,!which!can!be!considered!as!external! factors!that!we!cannot!reasonably!control,!such!as!traffic!jams!on!the!motor!way.!
!

!
KTP Template – June 2011 6
!
!
3.3 Conclusions!and!recommendations!!
• Disruption!and!down!time!are!non2value!added!periods!which!we!all!should!strive!to!eliminate!or!reduce!when!feasible.!These!periods!on!this!specific!project! might! look! within! acceptable! levels! from! one! point! of! view! yet!there!is!still!generous!room!for!improvement.!!!
• The! project! has! already! started! using! a! new! volumetric! concrete!method!that!will! reduce! the! rejection! rate! by!maintaining! the! quality! of! concrete!delivered!to!site!which!should!cut!the!disruption!time!significantly.! !Based!on! the! current!workload! it!was! suggested! that!we! collect! the! data! again!around!mid!Apr!2014!and!compare!the!performance!using!the!new!method!with!the!current!data!we!have.!
!• Another!suggestion!would!be!to!conduct!a!further!study!on!sequencing!the!
works!to!align!plans!to!move!the!paver!from!one!side!of!the!carriageway!to!another!as!this!activity!causes!significantly!long!periods!of!downtime.!
Summary:!
This!business!case!was!produced!based!on!data!analysis!and!interviews!with!the!project!team,!to!reach!any!improvement!conclusions!there!need!to!be!at!least!a!site!observation!and!collaborative!workshop!with!the!project!and!site!teams!to!run!through!the!findings!and!investigate!any!improvements,!this!is!especially!important!since!the!project!will!be!using!a!new!volumetric!method!for!installing!slot!drain.!

!
KTP Template – June 2011 7
4.0 Sustaining!the!improvement!(What!needs!to!be!done?)!!
Action!plan!(to!be!agreed!with!project!team):!
#! Action! Accountable! Due!date!1! Meet!with!project! team!to!agree!key! issues! in! the!
process!to!observed!onsite.!TBA! TBA!
2! Set!up!a!data!collection!plan!for!an!agreed!period.! TBA! TBA!3! Report! to! the! project! tem! with! new! findings! and!
agree!potential!improvement!actions.!TBA! TBA!
4! Update! this! case! study! with! Improvements! and!new!analysis!results!
TBA! TBA!
!
5.0 Benefits!(Before!and!After!Performance)!Consider!focusing!on!only!improving!the!late!start!and!downtime!periods,!which!equates! to! north! of! 5! hours,! the! room! for! improvement! is! very! high! and! can!significantly!improve!the!programme!delivery!cycle!time,!which!in!turn!will!lead!to!higher!productivity.!
6.0 Transferability!This!process!can!be!transferred!not!only!to!SMP!projects!but!also!any!HA!project!and!in!particular!those!that!require!cut!and!fill!but!also!any!excavation!work!such!as!the!road!box!excavation!in!the!central!reservation.!
7.0 Issues!and!Barriers!Although! the!documentation!provided! to! us! by! SBBJV!was! rich! in! details,! yet! it!lacked!the!consistency!required!for!statistical!significant!conclusions.!
8.0 Top!Learning!Points!Although! the! current! time! of! late! start! is! perceived! as! acceptable,! yet! it! is!significantly!high!by!all!standards!and!should!be!tackled!as!a!matter!of!urgency.!
!
!

!
KTP Template – June 2011 8
SUPPORTING!DOCUMENTS!–!EXAMPLE!OF!DAILY!LABOUR,!PLANT!&!MATERIAL!ALOCATION!FORM,!THE!DAILY!LAYING!STATEMENT!FORMS!AND!RAW!DATA!ANALYSIS!
!
!
!
!
! !

!
KTP Template – June 2011 9
!
!
!
!
!
Date start'of'shift finish'of'shift nr'of'operativestotal'hrs'worked First'Concrete'Discharge Last'Concrete'Discharge' Total'M3'discharged Changeover'time'between'pours Disruption'/'waiting Concrete'Discharge'duration M3'per'Discharge'duration'hourChange'over'and'disruption'/Discharge'shift'durationAverage Shift'durationM3'per'shift'hour1st'Discharge'delay30/04/2013 7:00 0:00 8 127.5 9:30 20:50 74 2.32 2.12 11:20 6.53 26% ######## 2:30 2:3301/05/2013 7:00 20:30 8 101.5 14:21 18:02 30 0.60 0.62 3:41 8.14 9% 26% 13:30 2.22 7:21 2:3302/05/2013 7:00 18:30 7 72.5 8:20 11:33 24 1.07 0.00 3:13 7.46 9% 26% 11:30 2.09 1:20 2:3303/05/2013 7:00 13:00 6 31 #N/A #N/A #N/A #N/A #N/A #N/A #N/A 26% 6:00 1:20 2:3308/05/2013 7:00 20:30 8 105 11:25 18:30 60 1.20 1.87 7:05 8.47 23% 26% 13:30 4.44 4:25 2:3309/05/2013 7:00 20:00 8 101 8:12 18:19 102 2.22 1.55 10:07 10.08 29% 26% 13:00 7.85 1:12 2:3310/05/2013 7:00 18:00 7 81 8:55 12:50 23 1.83 1.42 3:55 5.87 30% 26% 11:00 2.09 1:55 2:3311/05/2013 7:00 19:00 7 84 8:05 15:00 28 0.50 2.87 6:55 4.05 28% 26% 12:00 2.33 1:05 2:3312/05/2013 7:00 18:00 7 77 12:16 15:59 42 0.98 0.43 3:43 11.30 13% 26% 11:00 3.82 5:16 2:3313/05/2013 7:00 21:00 8 104 8:39 16:00 78 2.58 0.00 7:21 10.61 18% 26% 14:00 5.57 1:39 2:3314/05/2013 7:00 19:00 8 88 9:15 14:00 44 1.25 0.52 4:45 9.26 15% 26% 12:00 3.67 2:15 2:3315/05/2013 7:00 19:00 8 75 9:28 14:23 48 0.82 1.25 4:55 9.76 26% 12:00 4.00 2:28 2:3316/05/2013 7:00 20:00 8 84.5 9:37 13:19 38 0.83 0.00 3:42 10.27 6% 26% 13:00 2.92 2:37 2:3317/05/2013 6:30 22:30 8 102 9:30 16:46 72 1.67 0.78 7:16 9.91 15% 26% 16:00 4.50 3:00 2:3320/05/2013 7:00 22:00 8 94.5 9:30 16:08 46 0.87 3.37 6:38 6.93 28% 26% 15:00 3.07 2:30 2:3321/05/2013 6:30 21:00 8 106.5 7:51 18:40 72 1.13 4.50 10:49 6.66 39% 26% 14:30 4.97 1:21 2:3322/05/2013 6:30 19:30 8 97 8:40 16:08 36 4.92 0.73 7:28 4.82 43% 26% 13:00 2.77 2:10 2:3323/05/2013 6:30 20:30 8 105 9:20 18:10 102 3.38 0.78 8:50 11.55 30% 26% 14:00 7.29 2:50 2:3324/05/2013 6:30 15:00 8 48 #N/A #N/A #N/A #N/A #N/A #N/A #N/A 26% 8:30 #N/A 2:50 2:3330/05/2013 7:30 19:00 16 188 0:00 6:20 66 3.18 0.00 6:20 10.42 28% 26% 11:30 5.74 2:50 2:3331/05/2013 7:00 19:00 13 160 6:50 21:40 108 #N/A 0.00 14:50 7.28 26% 12:00 9.00 2:50 2:3301/06/2013 7:00 19:00 16 189 3:00 18:36 151.5 #N/A 0.00 #N/A #N/A 26% 12:00 12.63 2:50 2:3302/06/2013 7:00 19:00 15 180.5 6:26 18:39 203 #N/A 3.08 #N/A #N/A 26% 12:00 16.92 2:50 2:3303/06/2013 7:00 19:00 15 181 8:35 18:08 132 3.65 0.00 9:33 13.82 26% 12:00 11.00 1:35 2:3304/06/2013 7:00 18:30 14 171 9:30 17:04 105 4.25 2.17 16:52 6.23 56% 26% 11:30 9.13 2:30 2:3305/06/2013 18:30 7:30 7 85 20:15 4:49 56 2.33 0.37 8:33 6.55 21% 26% 12:59 4.31 1:45 2:3306/06/2013 18:30 7:30 7 85 #N/A #N/A #N/A #N/A #N/A #N/A #N/A 26% 12:59 #N/A 1:45 2:3307/06/2013 15:00 7:30 7 90.5 19:50 2:24 73.5 2.12 0.00 6:33 11.22 13% 26% 16:29 4.46 4:50 2:3310/06/2013 17:30 8:00 7 90.5 21:38 5:46 60 2.88 0.00 8:07 7.39 20% 26% 14:29 4.14 4:08 2:3311/06/2013 17:30 5:30 7 73 23:50 3:04 30 1.08 0.00 3:13 9.33 9% 26% 11:59 2.50 6:20 2:3312/06/2013 20:30 7:30 7 71 23:30 2:20 14 0.75 0.75 2:49 4.97 14% 26% 10:59 1.27 3:00 2:3313/06/2013 18:00 9:00 7 96 20:40 6:25 66 3.67 1.18 9:44 6.78 32% 26% 14:59 4.40 2:40 2:3314/06/2013 17:00 7:00 7 87.5 22:00 2:30 48 1.17 0.25 4:29 10.71 10% 26% 13:59 3.43 5:00 2:3315/06/2013 17:30 7:30 7 87 21:20 3:23 72 2.65 0.00 6:02 11.93 19% 26% 13:59 5.15 3:50 2:3316/06/2013 17:30 8:30 7 94 20:26 5:51 84 2.73 0.00 9:24 8.94 18% 26% 14:59 5.61 2:56 2:3317/06/2013 17:00 8:30 7 95 20:55 5:56 56 4.17 0.00 9:00 6.22 27% 26% 15:29 3.62 3:55 2:3318/06/2013 17:00 7:30 7 88 21:40 1:12 21 1.03 1.10 3:31 5.97 15% 26% 14:29 1.45 4:40 2:3319/06/2013 18:00 7:30 7 88 3:20 0:14 38 1.53 0.00 3:55 9.70 11% 26% 13:29 2.82 4:40 2:3320/06/2013 17:00 5:30 7 66 23:16 3:08 36 1.18 0.33 3:51 9.35 12% 26% 12:29 2.88 6:16 2:3321/06/2013 17:00 8:00 7 89 21:20 4:39 72 2.77 0.00 7:18 9.86 18% 26% 14:59 4.81 4:20 2:3324/06/2013 17:00 5:30 7 74 21:35 3:07 42 1.73 2.10 5:31 7.61 31% 26% 12:29 3.36 4:35 2:3325/06/2013 18:00 9:00 7 94 20:15 6:28 64 3.50 1.20 10:12 6.27 31% 26% 14:59 4.27 2:15 2:3326/06/2013 18:00 7:30 7 85.5 20:55 2:49 48 3.02 1.22 5:53 8.16 31% 26% 13:29 3.56 2:55 2:3327/06/2013 18:00 6:00 7 75 20:08 3:54 90 3.02 0.00 7:45 11.61 25% 26% 11:59 7.51 2:08 2:3328/06/2013 17:30 9:30 7 98 23:20 6:21 40 0.65 0.00 7:00 5.71 4% 26% 15:59 2.50 5:50 2:3329/06/2013 18:00 7:30 7 85.5 #N/A #N/A #N/A #N/A #N/A #N/A #N/A 26% 13:29 #N/A 5:50 2:3330/06/2013 9:00 10:30 2 16 #N/A #N/A #N/A #N/A #N/A #N/A #N/A 26% 1:30 #N/A 5:50 2:3319/08/2013 19:00 4:00 8 87 #N/A #N/A #N/A #N/A #N/A #N/A #N/A 26% 8:59 #N/A 5:50 2:3320/08/2013 10:00 18:00 8 64 #N/A #N/A #N/A #N/A #N/A #N/A #N/A 26% 8:00 #N/A 5:50 2:3321/08/2013 18:00 6:00 8 66 #N/A #N/A #N/A #N/A #N/A #N/A #N/A 26% 11:59 #N/A 5:50 2:3322/08/2013 19:00 3:00 8 77 #N/A #N/A #N/A #N/A #N/A #N/A #N/A 26% 7:59 #N/A 5:50 2:3327/08/2013 18:00 9:00 8 120 20:10 6:08 84 2.93 0.50 9:57 8.44 23% 26% 14:59 5.61 2:10 2:3328/08/2013 19:00 8:30 8 101 19:46 5:44 90 3.40 0.55 9:57 9.05 29% 26% 13:29 6.67 0:46 2:3329/08/2013 19:00 8:30 8 101 19:50 5:49 84 3.15 1.23 9:58 8.43 33% 26% 13:29 6.23 0:50 2:3330/08/2013 19:00 9:00 8 105 20:11 5:54 104 3.87 0.92 9:42 10.72 34% 26% 13:59 7.44 1:11 2:3331/08/2013 18:30 9:00 8 104 20:10 4:15 90 2.10 0.60 8:04 11.16 19% 26% 14:29 6.21 1:40 2:3301/09/2013 19:00 8:30 8 101 20:10 5:57 114 2.50 0.93 9:46 11.67 25% 26% 13:29 8.45 1:10 2:3302/09/2013 19:00 8:30 8 101 20:00 6:11 96 3.18 2.42 10:10 9.44 42% 26% 13:29 7.12 1:00 2:3303/09/2013 19:00 7:30 8 101 19:58 6:03 96 3.22 0.00 10:04 9.54 26% 26% 12:29 7.69 0:58 2:3304/09/2013 19:00 9:00 8 105 20:00 6:18 102 3.00 1.52 10:17 9.92 32% 26% 13:59 7.29 1:00 2:3305/09/2013 19:00 7:00 8 89 20:05 4:33 84 1.57 0.43 8:27 9.94 17% 26% 11:59 7.01 1:05 2:3306/09/2013 19:00 7:30 8 100.5 19:50 5:50 102 2.53 0.65 9:59 10.22 26% 26% 12:29 8.17 0:50 2:3307/09/2013 7:00 20:00 8 105 20:36 6:50 54 1.80 0.40 10:13 5.29 17% 26% 13:00 4.15 0:50 2:3308/09/2013 19:00 10:00 8 99 21:17 5:30 78 1.98 0.00 8:12 9.51 13% 26% 14:59 5.21 2:17 2:3309/09/2013 19:00 9:00 8 105 20:18 6:30 102 3.00 0.00 10:11 10.02 21% 26% 13:59 7.29 1:18 2:3310/09/2013 19:00 8:30 8 101 20:14 5:53 90 1.85 2.42 9:38 9.34 32% 26% 13:29 6.67 1:14 2:3311/09/2013 19:00 6:00 8 81 20:15 1:35 60 1.57 0.00 5:19 11.29 14% 26% 10:59 5.46 1:15 2:3312/09/2013 19:00 8:30 8 103 20:34 5:57 114 1.37 1.53 9:22 12.17 22% 26% 13:29 8.45 1:34 2:3316/09/2013 19:00 9:00 8 105 20:27 6:18 57 6.45 0.38 9:50 5.80 49% 26% 13:59 4.08 1:27 2:3317/09/2013 19:00 9:00 8 105 21:16 6:17 54 4.78 1.28 9:00 6.00 43% 26% 13:59 3.86 2:16 2:3318/09/2013 19:00 10:00 7 99 20:19 5:03 54 4.37 1.08 8:43 6.20 36% 26% 14:59 3.60 1:19 2:3319/09/2013 19:00 9:00 7 93 21:41 6:37 48 4.77 1.23 8:55 5.38 43% 26% 13:59 3.43 2:41 2:3320/09/2013 18:30 9:30 7 96.5 20:10 6:48 102 3.98 0.77 10:37 9.61 32% 26% 14:59 6.81 1:40 2:3321/09/2013 18:30 6:00 7 71.5 20:27 3:13 58 2.45 0.00 6:45 8.59 21% 26% 11:29 5.05 1:57 2:3322/09/2013 19:00 9:00 7 92.5 19:58 6:14 108 4.18 0.00 10:15 10.54 30% 26% 13:59 7.72 0:58 2:3323/09/2013 18:30 8:00 8 98 20:04 5:28 108 3.18 0.00 9:23 11.51 24% 26% 13:29 8.01 1:34 2:3324/09/2013 19:00 8:30 8 101 19:58 5:30 66 4.88 0.58 9:31 6.94 41% 26% 13:29 4.89 0:58 2:3325/09/2013 18:00 9:00 7 95 21:35 6:29 90 2.43 0.95 8:53 10.13 23% 26% 14:59 6.01 3:35 2:3326/09/2013 19:00 9:00 7 92 19:47 6:29 104 3.37 2.00 10:41 9.73 38% 26% 13:59 7.44 0:47 2:3327/09/2013 18:30 7:00 7 79 19:47 3:31 88 2.60 0.02 7:43 11.40 21% 26% 12:29 7.05 1:17 2:3330/09/2013 18:30 7:30 6 76 20:10 5:34 78 1.77 1.85 9:23 8.31 28% 26% 12:59 6.01 1:40 2:3301/10/2013 18:00 7:30 6 72 19:57 4:33 72 2.35 1.55 8:35 8.39 29% 26% 13:29 5.34 1:57 2:3302/10/2013 18:30 9:00 7 93 19:48 5:46 102 4.13 0.00 9:57 10.25 29% 26% 14:29 7.04 1:18 2:3303/10/2013 17:00 5:30 7 73.5 22:46 1:01 24 0.53 0.48 2:14 10.75 8% 26% 12:29 1.92 5:46 2:3304/10/2013 18:30 10:00 7 100 19:43 6:39 120 3.38 0.85 10:55 10.99 27% 26% 15:29 7.75 1:13 2:3305/10/2013 18:30 8:00 7 86 20:09 5:37 108 2.72 0.93 9:27 11.43 27% 26% 13:29 8.01 1:39 2:3306/10/2013 18:30 6:30 7 75.5 20:06 23:31 38 0.87 0.00 3:25 11.12 7% 26% 11:59 3.17 1:36 2:3307/10/2013 18:30 8:30 7 89.5 19:38 5:35 96 3.90 0.00 9:56 9.66 28% 26% 13:59 6.87 1:08 2:3308/10/2013 18:30 9:00 7 93 20:40 6:24 96 2.97 0.55 9:43 9.88 24% 26% 14:29 6.63 2:10 2:3309/10/2013 18:30 8:30 7 89.5 19:52 6:05 114 3.77 0.67 10:12 11.18 32% 26% 13:59 8.15 1:22 2:3310/10/2013 19:30 8:00 7 81.5 21:59 5:32 72 3.05 0.93 7:32 9.56 32% 26% 12:29 5.77 2:29 2:3311/10/2013 18:30 4:00 7 58 19:58 22:39 30 0.90 0.00 2:41 11.18 9% 26% 9:29 3.16 1:28 2:3314/10/2013 19:00 8:00 6 73.5 21:27 5:27 73 2.83 0.78 7:59 9.14 28% 26% 12:59 5.62 2:27 2:3315/10/2013 18:30 8:30 7 89.5 19:51 5:55 96 2.98 1.70 10:03 9.55 33% 26% 13:59 6.87 1:21 2:3316/10/2013 18:30 5:30 7 68.5 20:04 0:42 42 2.03 0.00 4:37 9.10 19% 26% 10:59 3.82 1:34 2:3317/10/2013 19:00 8:30 7 88.5 20:01 6:04 114 1.03 2.23 10:02 11.36 24% 26% 13:29 8.45 1:01 2:3318/10/2013 18:30 8:30 7 89.5 19:56 5:52 103.5 1.95 1.53 9:55 10.44 25% 26% 13:59 7.40 1:26 2:3319/10/2013 18:30 8:30 7 89.5 20:33 5:30 72 3.93 0.45 8:56 8.06 31% 26% 13:59 5.15 2:03 2:3320/10/2013 18:30 9:00 7 93 20:48 6:07 96 3.48 0.00 9:18 10.32 24% 26% 14:29 6.63 2:18 2:3321/10/2013 14:00 8:30 15 206.5 19:43 6:02 102 3.05 1.30 10:18 9.90 24% 26% 18:29 5.52 5:43 2:3322/10/2013 18:30 8:30 15 186.5 19:49 5:50 46 5.00 2.38 10:00 4.60 53% 26% 13:59 3.29 1:19 2:3323/10/2013 18:30 9:00 15 194 20:50 6:16 90 4.43 0.00 9:25 9.56 31% 26% 14:29 6.21 2:20 2:3324/10/2013 18:30 9:00 15 198 20:01 6:00 39 2.82 5.60 9:58 3.91 58% 26% 14:29 2.69 1:31 2:3325/10/2013 18:30 8:00 14 171 19:43 5:50 84 2.90 0.87 10:06 8.32 28% 26% 13:29 6.23 1:13 2:3326/10/2013 14:00 22:00 2 16 #N/A #N/A #N/A #N/A #N/A #N/A #N/A 26% 8:00 #N/A 1:13 2:3328/10/2013 18:30 9:00 15 190 #N/A #N/A #N/A #N/A #N/A #N/A #N/A 26% 14:29 #N/A 1:13 2:3329/10/2013 19:00 8:30 15 179 22:00 4:33 54 1.67 2.20 6:32 8.27 29% 26% 13:29 4.00 3:00 2:3330/10/2013 17:30 10:00 14 192.5 20:42 7:17 78 4.58 0.72 10:34 7.38 32% 26% 16:29 4.73 3:12 2:33
Daily'Labour,'Plant'and'Material'Allocation Laying'Statement
0.00
2.00
4.00
6.00
8.00
10.00
12.00
14.00
16.00
0:00
2:24
4:48
7:12
9:36
12:00
14:24
16:48
19:12
21:36
0:00
30/04/2013
03/05/2013
10/05/2013
13/05/2013
16/05/2013
21/05/2013
24/05/2013
01/06/2013
04/06/2013
07/06/2013
12/06/2013
15/06/2013
18/06/2013
21/06/2013
26/06/2013
29/06/2013
20/08/2013
27/08/2013
30/08/2013
02/09/2013
05/09/2013
08/09/2013
11/09/2013
17/09/2013
20/09/2013
23/09/2013
26/09/2013
01/10/2013
04/10/2013
07/10/2013
10/10/2013
15/10/2013
18/10/2013
21/10/2013
24/10/2013
28/10/2013
M3'PER'HO
UR
DURA
TION'FRO
M'1ST'TO'LAS
T'CO
NCR
ETE'DISCHA
RGE
DATE
Graph'showing' relation' between' actual' discharge' work'duration' (first'discharge' time'to'last)'with'M3'discharged' for'that'duration
Concrete'Discharge'duration M3'per'Discharge'duration'hour
0.00
1.00
2.00
3.00
4.00
5.00
6.00
7.00
30/04/2013
03/05/2013
10/05/2013
13/05/2013
16/05/2013
21/05/2013
24/05/2013
01/06/2013
04/06/2013
07/06/2013
12/06/2013
15/06/2013
18/06/2013
21/06/2013
26/06/2013
29/06/2013
20/08/2013
27/08/2013
30/08/2013
02/09/2013
05/09/2013
08/09/2013
11/09/2013
17/09/2013
20/09/2013
23/09/2013
26/09/2013
01/10/2013
04/10/2013
07/10/2013
10/10/2013
15/10/2013
18/10/2013
21/10/2013
24/10/2013
28/10/2013
DURA
TION'FRO
M'1ST'TO'LAS
T'CO
NCR
ETE'DISCHA
RGE
DATE
Total' changeover' time' in'hours'per' shift
Changeover'time'between'pours
0%
10%
20%
30%
40%
50%
60%
70%
30/04/2013
03/05/2013
10/05/2013
13/05/2013
16/05/2013
21/05/2013
24/05/2013
01/06/2013
04/06/2013
07/06/2013
12/06/2013
15/06/2013
18/06/2013
21/06/2013
26/06/2013
29/06/2013
20/08/2013
27/08/2013
30/08/2013
02/09/2013
05/09/2013
08/09/2013
11/09/2013
17/09/2013
20/09/2013
23/09/2013
26/09/2013
01/10/2013
04/10/2013
07/10/2013
10/10/2013
15/10/2013
18/10/2013
21/10/2013
24/10/2013
28/10/2013
PERC
ENTA
GE
DATE
Changeover' and'disruption' time'as'a'percentage' of'the'discharge' shift' time
Change'over'and'disruption'/Discharge'shift'duration Average
0.00
2.00
4.00
6.00
8.00
10.00
12.00
14.00
16.00
18.00
30/04/2013
03/05/2013
10/05/2013
13/05/2013
16/05/2013
21/05/2013
24/05/2013
01/06/2013
04/06/2013
07/06/2013
12/06/2013
15/06/2013
18/06/2013
21/06/2013
26/06/2013
29/06/2013
20/08/2013
27/08/2013
30/08/2013
02/09/2013
05/09/2013
08/09/2013
11/09/2013
17/09/2013
20/09/2013
23/09/2013
26/09/2013
01/10/2013
04/10/2013
07/10/2013
10/10/2013
15/10/2013
18/10/2013
21/10/2013
24/10/2013
28/10/2013
M3'PER'HO
UR
DATE
Concrete' M3'discharge' per'hour
M3'per'shift'hour M3'per'Discharge'duration'hour
0:00
1:12
2:24
3:36
4:48
6:00
7:12
8:24
30/04/2013
03/05/2013
10/05/2013
13/05/2013
16/05/2013
21/05/2013
24/05/2013
01/06/2013
04/06/2013
07/06/2013
12/06/2013
15/06/2013
18/06/2013
21/06/2013
26/06/2013
29/06/2013
20/08/2013
27/08/2013
30/08/2013
02/09/2013
05/09/2013
08/09/2013
11/09/2013
17/09/2013
20/09/2013
23/09/2013
26/09/2013
01/10/2013
04/10/2013
07/10/2013
10/10/2013
15/10/2013
18/10/2013
21/10/2013
24/10/2013
28/10/2013
DURA
TION'FRO
M'1ST'TO'LAS
T'CO
NCR
ETE'DISCHA
RGE
DATE
Delay' of'first'discharge' from'begining' of'shift1st'Discharge'delay
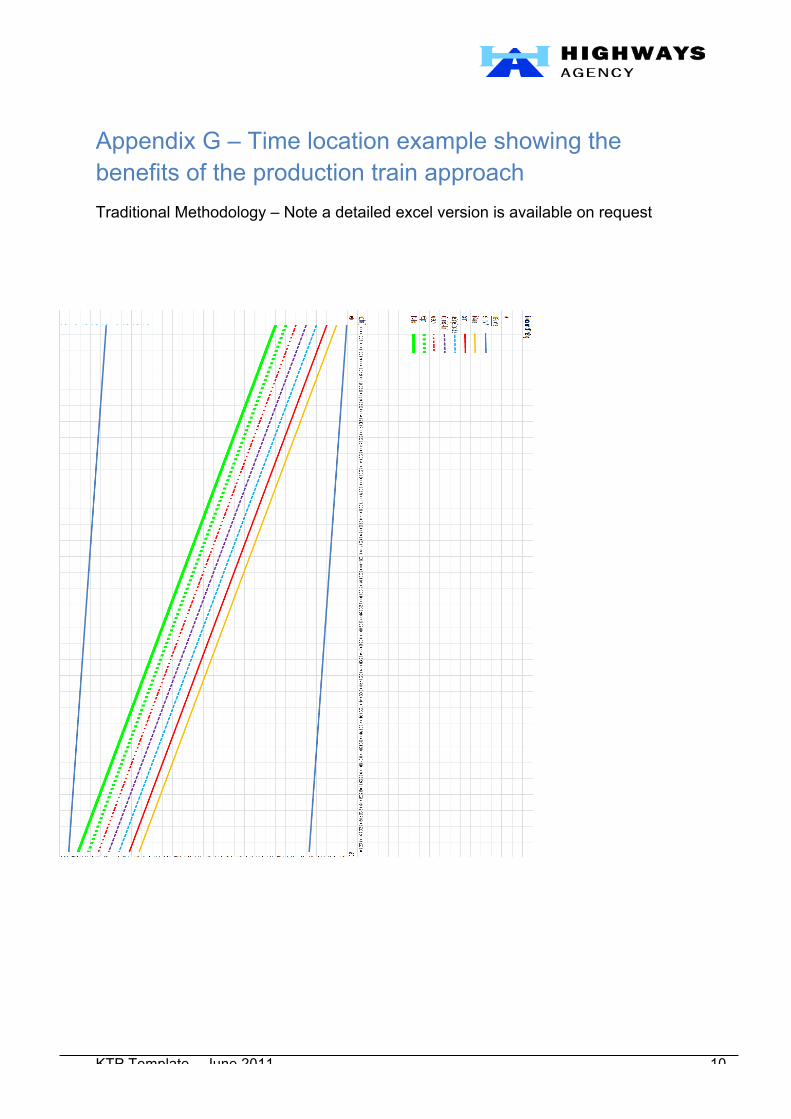
!
KTP Template – June 2011 10
Appendix G – Time location example showing the benefits of the production train approach Traditional Methodology – Note a detailed excel version is available on request

!
KTP Template – June 2011 11
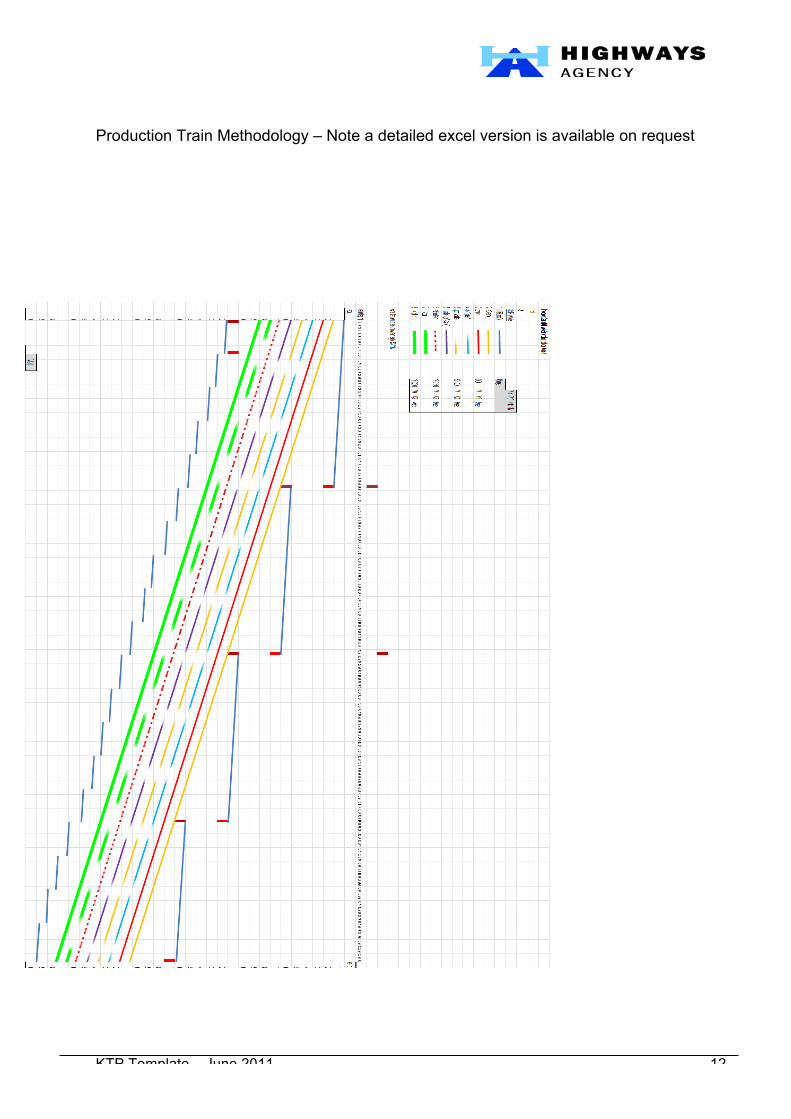
!
KTP Template – June 2011 12
Production Train Methodology – Note a detailed excel version is available on request