smart maintenance system for three-phase power · pdf filethe novel device is used for on-line...
TRANSCRIPT
Abstract—The main objective of this paper is the design and
development of the data storage and analysis method of a measurement system. The novel device is used for on-line fault monitoring of power transformers. The measured-data is captured from multi-sensors and stored in the server equipment database. Besides, these data is used for the prediction of the power transformer life consumption. The transformer life consumption is analyzed by using the Weibull distribution theorem. Various faults could occur in a transformer such as overload current, overheating, partial discharge and arcing, which can judge various fault-related conditions. According to the conventional way of the dissolved gas analysis, the fault is probably determined. As researcher knows, the IEC codes cannot determine the fault in many cases. Therefore, this paper presents a fuzzy logic tool that can be used to diagnosis multiple faults in a transformer and monitor the trend. It has been proved to be a very useful tool for transformer diagnosis and customer servicing.
Keywords—Smart maintenance system (SMS), power transformer, fault diagnosis, Weibull, fuzzy logic.
I. INTRODUCTION ecently, there is an increasing interest in the development and application with remote monitoring terminal unit and
power electronic techniques for power system such as power transformer and substation [1-3]. In order to promote effective management of the life-cycle costs of power system, an accurate prediction of time for minimization the risk of power system is important concerns. Therefore, this method can be reduced the risk disturbance for power systems. This is due to the power device duration a long operation without any remote sensor for monitoring fault condition. A high probability risk induced from power transformer is easily obtained [4-6].
Therefore, most of these research studies are involves the
component aging effects on transformer parts and catastrophic events due to the vagaries of nature. As author know, development and application of new equipment to predict the transformer operated-life with remote monitoring device is vary important. In insulation material with immersed liquid cooling approach, the main factors determines to the life of insulation are: a) rated current, b) load on the transformer, c) ambient temperature, d) oxygen content in oil, and e) moisture content. These researches have been used statistical approaches on test results for practical insulation life assessment [7]. In literature [8], it is described that accelerated life testing methods to assess the degradation of the insulation have been used for determining the effect of thermal loading. In recent years, improvements in condition-based monitoring techniques have been supported transformer life management in order to detect the progressive deterioration insulation of the material.
By using measurement results and estimation daily load profiles, are usually used to determine the transformer life consumption [9]. The measurement result is necessary to compare with assumption-acquired condition that the daily profile of transformer loading remains the same throughout its lifetime. Both of the operation or working time for power transformers is necessary obtained from the monitoring data to analyze the equipment life. In this paper, it is established that the way to capture data of fault condition is obtained, in order to use for supply an accuracy servicing time for power transformer. Consequently, a wireless communication device to transmit the fault signal collected from transformer was designed to exceed the limitations of diagnosis condition. Newly developed equipment is provided usefully measured-data of sensor and analysis method in addressing such advance customer service and transformer maintain. However, for captured-data analysis, most of concern issues are interest captured data in load operation or dissolved gas analysis for prediction the life consumption of transformer. As authors understand, according to the above-mentioned integration is seldom considered.
This paper is organized as follows. In Section 2, it is introduced a newly developed signal captured device of system architecture. In Section 3, the remote monitoring equipments to detect several types of sensor-captured data to judge operated fault condition of transformer is present. Also, it demonstrates through cases the use of the Weibull distribution probabilistic techniques in study case of operating in one month to determine
Smart maintenance system for three-phase power transformer via fuzzy logic approach
Bang-Fu Hsu, Yeong-Hwa Chang, Yi-Cheng Cheng, Sau-Lie Lie, Chen-Chin Lin, Chang-Hung Hsu*, Chia-Wen Chang, Wei-Shou Jan, and Chin-Hao Chou
R
Manuscript received March 2, 2011. Corresponding author: Mr. Chang-Hung Hsu* (e-mail:
[email protected], Tel.: + 886-3-4526111ext237; Fax: +886-3-4621110). C.-H. Hsu is with the department of electrical engineering, Chang Gung University and Fortune Electric (FE) Co. Ltd., all in Taiwan.
Dr. Bang-Fu Hsu is a president and project leader in FE, and Yi-Cheng Cheng, Sau-Lie Lie, Chen-Chin Lin, and Chin-Hao Chou are with Fortune Electric Company, all in Taiwan.
Dr. Yeong-Hwa Chang is with department of electrical engineering, Chang Gung University, Taiwan. He is a professor, and Mr. Chia-Wen and Chang,Wei-Shou Jan is Ph.D candidate, in department of electrical engineering,Chang Gung University, Taiwan.
INTERNATIONAL JOURNAL OF CIRCUITS, SYSTEMS AND SIGNAL PROCESSING
Issue 4, Volume 5, 2011 370

a consumed-life of power transformer. In Section 4, the transformer fault detected condition and diagnosis with fuzzy logic method, is presented. The discussion and analysis is proposal in Section 5. The conclusion is discussed in Section 6.
II. DESCRIPTION SENSOR SET-UP AND MONITORING SYSTEM For sensor component setting in transformer consideration, a
multi-sensor of different measurable signal source variable condition is displayed as Fig. 1. Therefore, development of a sensor technology must be adapted to the specific requirements of a general power transformer; this is due to transformer capacity depending on their age and condition. According to the worker experience of remote monitoring devices, the following general set-up of sensors, is proposed for the use at power transformer with 1000 kVA:
(1) PT100 for measurement of top oil temperature in tank
inside. (2) PT100 for measurement of ambient temperature in tank
outside. (3) Current transducer for measurement of load current. (4) Voltage transducer for measurement of voltage at
transformer tap of bushing sides. (5) Sensor for measurement of oil humidity, setup in device
insides. (6) Sensor for measurement of gas-in-oil content.
Newly developed devices with remote monitoring function;
the outputs of the above-mentioned sensors are acquired data signal into the server system via Internet transmission line. In general, the acquired-data line terminals device of the monitoring module is installed at the transformer. Within these data acquisition units the analogue signals are transferred to the digitized signal than transmission on-line signal via a field bus to the monitoring server. This device is necessary to develop a industrial-type proven technology. This is due to the monitoring device possible to monitor all transformers in one substation with a single system, which is extremely cost effective.
III. MULTI-SENSORS DEVELOPMENT AND INSTALLATION
A. Remote Monitoring Sensor and System Architecture This paper develops multi-sensor to measure physics
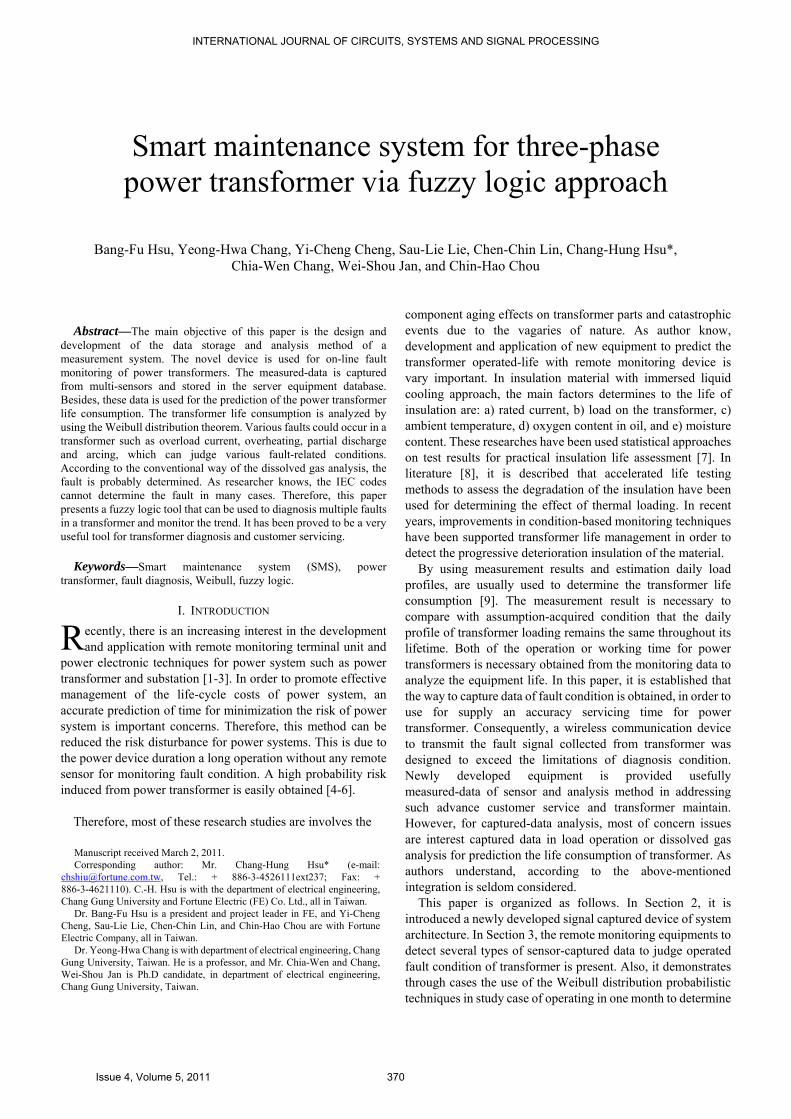
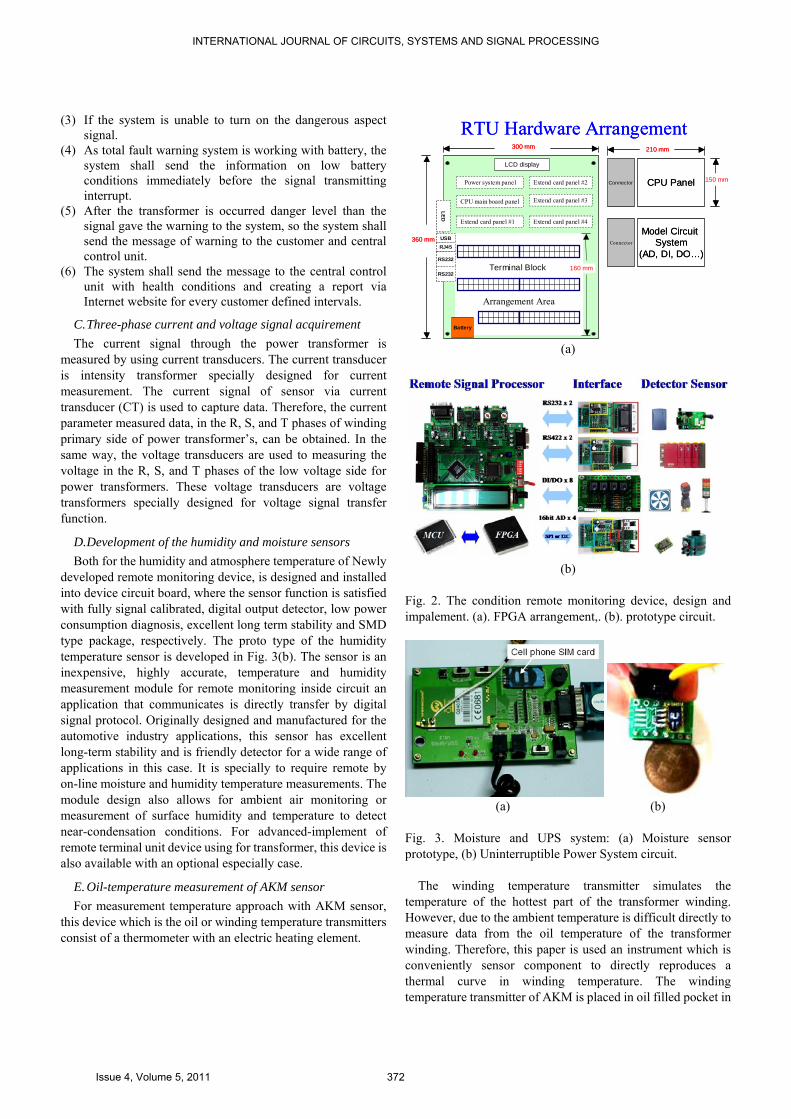
parameter of power transformer. In Fig. 1, it is shown sketch of power transformer, sensor design and installation. The remote monitoring device was performed via high-speed central process unit chip. In Fig. 2, it is displayed a condition remote monitoring device and sensor testing and implementation. Eight groups cover the basic signal receiver, analog input ports, and digital input ports and digital input ports, respectively, have been developed. An one SD memory card slot, a group of serial communication port, a group of TCP/IP communication port, a group of USB slots, a group of GSM/GPRS, 10x1 LED Lights (Display the load), 16x2 Text-Based display state LCD, input voltage of 100 to 240 V (50-60Hz, 1.5A, AC), and fault signal
buzzer, respectively, are obtained. Besides, a field-programmable gate array (FPGA) is
installed and used to be a CPU system. This is due to the FPGA has a good ability to update the functionality after shipping, partial re-configuration of the portion of the design and the low non-recurring engineering costs relative to an ASIC design. Therefore, it is offer advantages for many applications in industry. A field-programmable gate array is an integrated circuit designed to be configured by the customer or designer after manufacturing. In this paper, the data-acquisition card is used the Field Programmable Gate Array (FPGA) model, the system of phonotype equipment is shown in Fig. 2. The contribution of this research is the development of a real-time remote monitoring system.
As the need for data acquirement from sensor devices, including as current transducer, voltage transducer, oil temperature and moisture detector, data transmission rates to increase for analog to digital converters (ADC) and the associated FPGA unit has provided a solution to interface to the ADC and other parts of the system. So, manufacturers of ADC and FPGA chip have responded with faster, more capable devices at a lower cost. This allows the sensing of large area fields with a system capable of monitoring crop local environmental or physiological status; the data transmission and storage in the computer is made in real-time.
Insulation OilCore
Winding
Tank
Voltage and Current Detection Temperature, Moisture and Gas Detection
Insulation OilCore
Winding
Tank
Voltage and Current Detection Temperature, Moisture and Gas Detection
Fig. 1. Sketch of three-phase power transformer: sensor device and signal required method.
B. Signal process and warning mechanism The transformer warning system is to signal the dangerous situation when transformer occurred-fault condition under any sensor signal is exceeding the normal limits. This warning system controls the fault aspect signal of the information regarding danger is send by through GSM network to central control unit and other individuals, such as electric mail and server web pages. In Fig. 3(a), it is displayed an intelligent signal report system via GSM mobile phone. The warning system shall send the signal to central control unit and relevant customers during following conditions: (1) Whenever transformer fault condition under different
sensor acquired reaches danger or warning levels. (2) The signal connected between sensor and system is
disconnected.
INTERNATIONAL JOURNAL OF CIRCUITS, SYSTEMS AND SIGNAL PROCESSING
Issue 4, Volume 5, 2011 371
(3) If the system is unable to turn on the dangerous aspect signal.
(4) As total fault warning system is working with battery, the system shall send the information on low battery conditions immediately before the signal transmitting interrupt.
(5) After the transformer is occurred danger level than the signal gave the warning to the system, so the system shall send the message of warning to the customer and central control unit.
(6) The system shall send the message to the central control unit with health conditions and creating a report via Internet website for every customer defined intervals.
C. Three-phase current and voltage signal acquirement The current signal through the power transformer is
measured by using current transducers. The current transducer is intensity transformer specially designed for current measurement. The current signal of sensor via current transducer (CT) is used to capture data. Therefore, the current parameter measured data, in the R, S, and T phases of winding primary side of power transformer’s, can be obtained. In the same way, the voltage transducers are used to measuring the voltage in the R, S, and T phases of the low voltage side for power transformers. These voltage transducers are voltage transformers specially designed for voltage signal transfer function.
D. Development of the humidity and moisture sensors Both for the humidity and atmosphere temperature of Newly
developed remote monitoring device, is designed and installed into device circuit board, where the sensor function is satisfied with fully signal calibrated, digital output detector, low power consumption diagnosis, excellent long term stability and SMD type package, respectively. The proto type of the humidity temperature sensor is developed in Fig. 3(b). The sensor is an inexpensive, highly accurate, temperature and humidity measurement module for remote monitoring inside circuit an application that communicates is directly transfer by digital signal protocol. Originally designed and manufactured for the automotive industry applications, this sensor has excellent long-term stability and is friendly detector for a wide range of applications in this case. It is specially to require remote by on-line moisture and humidity temperature measurements. The module design also allows for ambient air monitoring or measurement of surface humidity and temperature to detect near-condensation conditions. For advanced-implement of remote terminal unit device using for transformer, this device is also available with an optional especially case.
E. Oil-temperature measurement of AKM sensor For measurement temperature approach with AKM sensor,
this device which is the oil or winding temperature transmitters consist of a thermometer with an electric heating element.
CPU PanelConnector
Model Circuit System
(AD, DI, DO…)Connector
150 mm
210 mm
LCD display
Terminal Block
Arrangement Area
300 mm
360 mmRJ45
RS232
RS232
USB
160 mm
Battery
LED
RTU Hardware Arrangement
Power system panel
CPU main board panel
Extend card panel #1
Extend card panel #2
Extend card panel #3
Extend card panel #4
(a)
(b)
Fig. 2. The condition remote monitoring device, design and impalement. (a). FPGA arrangement,. (b). prototype circuit.
(a) (b)
Fig. 3. Moisture and UPS system: (a) Moisture sensor prototype, (b) Uninterruptible Power System circuit.
The winding temperature transmitter simulates the temperature of the hottest part of the transformer winding. However, due to the ambient temperature is difficult directly to measure data from the oil temperature of the transformer winding. Therefore, this paper is used an instrument which is conveniently sensor component to directly reproduces a thermal curve in winding temperature. The winding temperature transmitter of AKM is placed in oil filled pocket in
INTERNATIONAL JOURNAL OF CIRCUITS, SYSTEMS AND SIGNAL PROCESSING
Issue 4, Volume 5, 2011 372

Invited paper for NAUN Journal (WSEAS Cambridge Conference, paper series no 460-463)
the transformer tank cover side. Therefore, the equipment of AKM sensor is mainly capture a signal data by a current proportional to the transformer loading. The temperature gradient of transformer oil temperature given by the heating element is proportional to the temperature increasing of the winding over the top oil temperature. This approach, the AKM sensor can simulates the temperature in the hottest part of the winding. Actually, AKM is directly captured hot spot temperature in upper tank. It is installed three PT100 sensors for temperature measurement. The reference of all these PT100 is satisfied with IEC60751 standard, and sensor of AKM have existed a temperature coefficient =0.00385055 1C . One is used for measuring the ambient temperature. And the other is used to measure the temperature of the refrigeration oil in the bottom and top parts of the power transformer, respectively. The proto type of AKM sensor is shown in Fig. 4.
AKM signal will transfer the analog data to dc current signals from 4 to 20 mA in SMS. Voltage signals are directly connected to inputs of the conditioning card, and current signals are previously translated from precision resistors. Consequently, the winding temperatures in top oil and bottom sides are measured by using AKM sensors.
(a) (b)
Fig. 4. Application of oil temperature of AKM sensor: (a) Oil temperature indicator, (b) Thermometers.
The temperature hot spot is calculated as below of follow description. The equations that model the hot spot temperature and the thermal aging acceleration factors from IEEE Std. C57.91-1995 are obtained [10]. The hot spot temperature is given
HTOAHS (1)
Detailed models for temperature measurement calculation
are given in [8]. The thermal aging acceleration factor is given by
27315000
38315000
HSeFAA (2)
where a value greater than 1 for winding, the hottest-spot temperatures greater than the reference temperature 110 °C and
less than 1 for temperatures below 110 °C. The equivalent life (in hours or days) at the reference temperature that will be consumed in a given time, this equation period for the given temperature cycle is the following:
nNn
nnAANn
EQA ttF
F
1
,1 (3)
where the equation (3) parameter is define in Table 1.
The simulated load and ambient profile are discussed below. This Section is now used in the transformer life calculation procedures. The calculation role is satisfied with IEEE standards. A revision of the loading guide for power transformers is currently in progress. It is noted that the traditional hot-spot temperature calculation uses a number of assumptions that are not completely correct. Therefore, it is necessary to consider different condition as below: Table 1. IEEE standard parameters define for temperature calculation.
A : Ambient temperature C
HS : Temperature of hot spot C
TO : Top oil temperature rise C
H : Winding temperature rise C
AAF : Thermal aging acceleration factor for insulation.
EQAF : Equivalent aging factor for the total time period.
n : Index of the time interval t. N : Total number of time intervals
NAAF , : Aging acceleration factor for the temperature, which exists during the time interval.
t : Time interval (in hours).
Oil temperature in the cooling duct is assumed to be the same as the top oil temperature.
The change in winding resistance with temperature is neglected.
The change in oil viscosity with temperature is neglected. The effect of tap position is neglected.
The variation of ambient temperature is assumed to have an
immediate effect on oil temperature. Moreover, experimental work has shown that at the onset of a sudden overload, oil inertia induces a rapid rise of oil temperature in the winding cooling ducts. The top oil temperature in the tank does not reflect this phenomenon. Therefore alternate sets of equations are being developed, taking into account all these factors. In addition, it is important evolution providing the disappearance of the guide on definition of transformer. This paper, it is defined that an especially phenomenon is called the thermal duplicate. In general, that was often used to provide default values for winding temperature rise at rated load.
INTERNATIONAL JOURNAL OF CIRCUITS, SYSTEMS AND SIGNAL PROCESSING
Issue 4, Volume 5, 2011 373

Invited paper for NAUN Journal (WSEAS Cambridge Conference, paper series no 460-463)
Volta
ge
Curr
ent
Oil
Tem
pera
ture
Monthly variation
Oil Temperature
Voltage
Current
Transformer outside temperature
Measuring Operation Duration, Weekend
26, July 30, July 3, August 7, August 11, August 15, August
Volta
ge
Curr
ent
Oil
Tem
pera
ture
Monthly variation
Oil Temperature
Voltage
Current
Transformer outside temperature
Measuring Operation Duration, Weekend
26, July 30, July 3, August 7, August 11, August 15, August
Fig. 5. The measurement of the monthly value of a daily captured-data via SMS device. This reference will not be available anymore to provide
support to the hot-spot temperature rise estimated by the manufacturer. This might reduce the credibility of transformer manufacturer in providing that critical thermal parameter. The captured signal data, current, voltage, and temperature, is shown in Fig. 5.
Besides, this section is mainly to discuss the life consumption by using the Weibull theorem. It is well known that the useful operating life for insulation as per the IEEE recommendation is around 180,000 hours (about 20.55 years). But the life consumption of insulation varies is different, this is due to varying operating conditions of the transformer are transfer in special case. This paper aims to capture the variation in along the usage time axis at a consumed life around one month (786.9 h). The end of life is therefore simulated from the usage time corresponding to 786.9 h of consumed life. The variations in the operating conditions of power transformer are reflected a simulated values of K factor. It will reflect result invalidations in the end-of-life values of power transformer.
In this case, a more refined curve-fitting exercise was carried out on the simulated results in one month using the Weibull distribution PDF function. The Weibull distribution most frequently provides the best fit for life data. Also, the sample size being used is sufficient to accurately discriminate between the Weibull and other distributions. It is indicated that a three-parameter of the Weibull distribution is the best fit for the end-of-life values of transformer and is characterized by a Beta ( ) of 22.017, Eta ( ) of about 786.9 h (i.e., one months). In order to understand the probabilistic nature factor and its statistical distribution, this paper is compute its expectation and variance.
Hot
-spo
t Tem
pera
ture
(°C
)
Monthly variation (a)
26, July 30, July 3, August 7, August 11, August 15, August0
500
1000
1500
2000
2500
3000
Date
Con
sum
ed L
ife V
alue
s (m
in)
(b)
Fig. 6. The measured results of consumed life values with IEEE Standard. (a). Hot sopt (b). Consumption.
INTERNATIONAL JOURNAL OF CIRCUITS, SYSTEMS AND SIGNAL PROCESSING
Issue 4, Volume 5, 2011 374

Invited paper for NAUN Journal (WSEAS Cambridge Conference, paper series no 460-463)
The measured results of transformer temperature of hot spot and life consumption of power transformer, is shown in Fig. 6. Assumptions (1) and (2) above allow us to conclude, using renewal theory approximations [11]
)ˆ(TE (4)
3
2
)ˆ(
TVar (5)
These expressions relate the statistical features duration
nearly one-month consumed life distribution to the statistical features of time (min) taken to reach design life. By using equations (4) and (5), the expected value of the time taken to consume design life of 786.9 h is around 32.17 year. According to above equations, the expected time taken to consume 85% of design life of insulation in our case study is given by
4.30017.22
921.78685.0)ˆ(
kTE years.
where the full simulation method is the ability to compute the mean time to reach a fraction k factor. For example, for transformer face to any possibility damaged condition is collected as follow, in this paper, the k factor is calculated as 0.85. Actually, the k factor is determined by transformer design, manufacturing, cost and environment impact, respectively. In Fig 8 is shown a life consumption diagram of the Weibull distribution method, sensor and SMS device installation. In Table 2 is defined k factor of power transformer in different design consideration, manufacturing and environment. Table 2. Possibilty of transformer life of K factor definition.
k values ( 54321 kkkkkk ) Parameter
Core with destroy factor ( 1k ), Silicon steel material (Bs 1.95 Tesla) and Fe-based amorphous alloy (Bs 1.56 Tesla)
0.98~0.99
Winding ( 2k ), construction with square-formed type and disk-formed type
0.97~0.98
Manufacturing factor ( 3k ), manufacturing engineering management
0.95~0.97
Transformer setup and environment impact factor ( 4k )
High risk areas, such as lighting impulse 0.88~0.9
Power load variation 0.9~0.92
Transformer design cost limitation ( 5k ), It means operation overload percentage
a) 110% L 1~1.2
b) 100% L 0.98~0.99
c) 90% L 0.9~0.95
Temperature (°C)
Perc
enta
ge (%
)
(a)
Perc
enta
ge (%
)
Moisture (g/m3 ) (b)
Fig. 7. The measured results of the percentage in power transformer. (a). Temperature range. (b). Moisture range.
700
750
800
00.1
0.2
0.30.4
0
1
2
3
4
x 10-7
x
The Weibull Distribution in 3D
Value of y
Prob
abili
ty D
ensi
ty
0
0.5
1
1.5
2
2.5
3
x 10-7
(a)
INTERNATIONAL JOURNAL OF CIRCUITS, SYSTEMS AND SIGNAL PROCESSING
Issue 4, Volume 5, 2011 375

Invited paper for NAUN Journal (WSEAS Cambridge Conference, paper series no 460-463)
Three-phase transformer with capacity 1000 kVA
Power Control Box
智慧維保系統Smart Maintenance System, SMS
Three-phase transformer with capacity 1000 kVA
Power Control Box
智慧維保系統Smart Maintenance System, SMS
(b)
Fig. 8. Power transformer life consumption. (a). Weibull distribution. (b) Sensors and SMS system installation.
F. Transformer fault diagnosis using dissolved gas-in-oil data In general, for transformer health diagnosis, it is well known
that development and implementation for fault diagnosis of power transformers temperature oil-gas release is through by dissolved gases analysis (DGA). This paper mainly proposed system approach, which is based on the combined use of some traditional criteria of the dissolved gas analysis used in standards and a fuzzy logic theorem. Consequently, the objective of the device is to provide the customer with a intelligent suggestion obtained from analysis not only of the traditional concepts consolidated in the technical literature, but also by using fuzzy logic method to reach a higher degree of reliability with respect to each measured physic parameter individually. In Fig. 9 is displayed DGA data through by SMS with Internet.
In literature [11], dissolved gas analysis has become a very popular analysis method for monitoring the hole-life of health of a transformer. As various faults conditions, it is well known that different gases are generated by several possible dangerous conditions. By taking samples of the mineral oil from transformer inside, it can be indicated that oil-gas release and content different dangerous factor is determined, and oil-gases are analyzed its concentration possible levels. In Table 3 is shown a key gas and their fault type for power transformer.
Condition remote monitoring device provides on-line communication and comprehensive maintenance contracts to all users. This device is to assist user in collecting physic parameter asset value and based on connectivity systems, the main key solutions are configured to gather data from the site and transfer it to the server system. In order to achieve to understand the transformer health condition, aforementioned concepts of the oil gas diagnosis to judge the transformer faults condition is presented. In Fig. 10 is shown example DGA fault diagnosis condition for power transformer. Besides, the various services are designed to evaluate, transformer maintain and estimate operational physics data using different sensor component to analyze system operation condition. To add value through the direct link, the DGA method in oil-gas operation and material life consumptive conditioning an
intelligent server system are developed to use proprietary fuzzy logic theorem to provide:
Remote monitoring assessment of power system
operation conditions and troubleshooting warning. Performance evaluation and comparison. Development a service suggestion for customer
consideration by using fuzzy logic approach. Remote monitoring and diagnostics is a service based on
data acquisition and direct connectivity systems to gather data from power transformers. This device with fuzzy logic theorem is mainly developed in this study.
The system is a highlighting potential or incipient failure using manufacturing experience rules.
It can easily to assist in power system trouble condition interrupt and linking the power equipment with the original equipment manufacturer to go for maintains system.
Fig. 9. The remote terminal unit data acquirement of oil-gas by using DGA meters.
Table 3. Key gas of the DGA method and their fault type for power transformer.
Key Gas Fault Type
Hydrogen (H2) Corona Carbon Monoxid and Carbon Dioxide (CO and CO2)
Cellulose insulation Breakdown
Methane and Ethane (CH4 and C2H6)
Low temperature Oil breakdown
Ethylene (C2H4) High temperature oil breakdown
Acetylene (C2H2) Arcing
INTERNATIONAL JOURNAL OF CIRCUITS, SYSTEMS AND SIGNAL PROCESSING
Issue 4, Volume 5, 2011 376

Invited paper for NAUN Journal (WSEAS Cambridge Conference, paper series no 460-463)
8
No Item
O2 CO2 CO H2 CH4 C2H6 C2H4 C2H2 TCG C2H2C2H4
C2H2C2H6
C2H4C2H6
2547 475 37.4 34.6 1.6 41.4 4 0 119.0 0.00 0.00 0.10◎
Warning I --- --- 300above
400above
100above
150above
10above
0.5above
500above
Warning IIFault
(1) Priority items C2H6 Form
Compositon Ratio 8 H2
1 2 H2 0.84 8 H2
C2H6 H2 C2H4 CH4 CH4 0.04 H2
C2H6 H2 C2H6 1.00
C2H6 H2 C2H4 0.10C2H6 H2 C2H2 ---
(1) CO value diagnosis ( CO ≧ 300 ppm, or CO2 / CO < 3 in insulatioin material ) [ CO = 37.4 < 300 ppm, 12.7 > 3 ] → [non-insulation](2) When diagnosis is partial discharge, ( C2H2 / CH4 > 1, and it could be judged LTC mixed in i
0 ppm, 0.000 < 1 ] → [LTC without mixed insulation ]
FortuneElectric Co.,Ltd.
Transformer Insulation Oil Gas DiagnosisReport
Customer FE
ID Project Case
Analysis Results Sampling ID
Specification 1000 kVA Sampling Date 2010/5/1
Any possible exceedthe limited dataError
level ( C2H2 higher 0.5 ) or ( C2H4 below 10, and TCG higher 500) ( C2H2 higher 5) or ( C2H4 below 100, and TCG higher 700)
1
Oil gasanalysisresults andcompositionratiocalculation("◎"symbol
Composition
ResultsLeading material
2
Gas-type ("■"symbolmeansreason)
Category:
ItemMain reason
3
High heating
Partial discharge
Little dischargeArcing discharge
Judge results Fault
3 Special gasdiagnosis
CO2 / CO =
[ C2H2 = C2H2 / CH4 =
00.5
11.5
H2CH4
C2H6
C2H4
C2H2
Note: Hydrogen (H2), Carbon Monoxid and Carbon Dioxide (CO and CO2), Methane and Ethane (CH4 and C2H6), Acetylene (C2H2), and Ethylene (C2H4). Fig. 10 Transformer measurement gas release andfault diagnosis
IV. TRANSFORMER HEALTH DIAGNOSIS AND ANALYSIS WITH FUZZY LOGIC
A. Built databases from multi input sensor 1). Current Monitoring Considering the current parameter detected technique, the
relationship between early researchers for parameter measurement capture in multiple healthy risk behaviors among the power transformers has been obtained. Though not part of the new diagnostic concepts, it is indicated that current parameter of sensor have been developed recently, remote monitoring the currents on the primary, secondary, and winding have been done for quite a while. Besides, remote monitoring of the current being drawn by the windings can also indicate. This is due to the disturbance condition might be a failure in these accessory units. For more information, monitoring these currents may often be an easier and cheaper alternative than thermograph sensor. It is only transferred by an analog signal of transducer device.
Basis this concept, it is important to monitor the appropriate functioning of the winding component. If the winding insulation conductor fail and not be detected and corrected, the increased oil temperature in the transformer will gradually increase the deterioration in the transformer insulation. Thus, this unstable parameter is gradually reduces the life of the transformer. Therefore, monitoring the currents on the primary and secondary of the windings is easily to indicate. If the windings are operated under unbalance three-phase alternative operation situation. It might induce a developing problem or occurring transformer failure.
2). Moisture Analysis As authors know, in order to detect the transformer life
consumption from oil-gas variation, it is understand a true fact that the presence of water is not healthy for using in power transformers. The nature material for water in the oil is indicated paper aging condition, if the cellulose insulation used in power transformers is known to produce water when it
degrades. Two kinds of material between water and oxygen in the
insulation oil further increase the rate, which the insulation will degrade. This means that water content a high concentration in the transformer oil not only indicates that the insulation has been degrading, but also it will degrade more quickly in the future due to increased presence of water in the oil. Water in the oil is also a classical sign condition that existing in the insulation oil deteriorating. When the transformer insulation oil is deteriorates the dielectric constant of the oil decreases. Therefore, reduction of the dielectric constant in power transformer oil can lead to a flashover and consequential failure impact on the life of power transformer.
3). Temperature Monitoring This paper presents a way to detect transformer temperature,
however, one of the simplest and most effective ways to monitor a transformer outside is measured by using temperature sensors (AKM). When the sensor displays abnormal temperature readings, it is almost always indicate some type of failure in a transformer.
For this reason, it has become common practice to monitor the transformer a few important temperature parameter, including hot spot temperature, tank, primary winding, secondary winding and bottom tank temperatures on the shell of a transformer. It is known that as a transformer begins increasing temperature, the winding insulation begins to deteriorate and the dielectric constant of the insulation oil begins to degrade.
4). Dissolved Gas Analysis For monitoring transformer operation in life loss, dissolved
gas analysis has become a very popular technique for monitoring the overall health of a transformer [12]. As various faults develop, it is known that different gases are generated. By taking samples of the insulation oil inside a transformer, therefore, there is one reason is necessary determined which gases are present and their concentration levels in power transformer.
The researcher in general work is indicated that the hydrocarbon gases with the fastest rate of evolution would be methane, ethane, ethylene, and acetylene. It was proved that there is a relationship between fault temperature and the composition of the gases dissolved in the oil. It can easy to monitor the transformer lift consumption; the researcher has been involved to make an auto-creation diagnosis criterion for the types and amounts of gases that are present to detect oil-gas variation. In Fig. 11, flowcharts of the intelligent transformer health diagnosis are arranged.
5). Manufacturing Experience System In order to understand the manufacturing experience system
(MES) built process, MES are considered and determined to facilitate tasks in the fields of accounting, signal process control, customer service, and fabricated productions etc. besides, there are few method to consider power system fault-condition and diagnosis in industry [13-15].
INTERNATIONAL JOURNAL OF CIRCUITS, SYSTEMS AND SIGNAL PROCESSING
Issue 4, Volume 5, 2011 377

Invited paper for NAUN Journal (WSEAS Cambridge Conference, paper series no 460-463)
9
CRM System Acquired Oil -Gas (ppm)and Transmitting Data
IdentifiedOutput
Output Rules
Uncertainties ParameterAnalysis
Fuzzy Theorem System
Input
Yes
No
CRM System Acquired Oil -Gas (ppm)and Transmitting Data
IdentifiedOutput
Output Rules
Uncertainties ParameterAnalysis
Fuzzy Theorem System
Input
Yes
No
Conditions Identification andData Process
Output
Transmitting Suggestion paperto the Customer
End
Conditions Identification andData Process
Output
Transmitting Suggestion paperto the Customer
End
CRM System Acquired Oil -Gas (ppm)and Transmitting Data
IdentifiedOutput
Output Rules
Uncertainties ParameterAnalysis
Fuzzy Theorem System
Input
Yes
No
CRM System Acquired Oil -Gas (ppm)and Transmitting Data
IdentifiedOutput
Output Rules
Uncertainties ParameterAnalysis
Fuzzy Theorem System
Input
Yes
No
Conditions Identification andData Process
Output
Transmitting Suggestion paperto the Customer
End
Conditions Identification andData Process
Output
Transmitting Suggestion paperto the Customer
End
Fig. 11 Flow chart of the intelligent transformer health diagnosis.
In general, the original problems are complex enough such that a simpler conventional algorithm is insufficient to provide the proper solution. This is due to the foundation of a successful MES depends on a series of technical procedures and development. Therefore, it is indicated that may be designed by certain technicians and related to the manufacturing. Consequently, MES do not typically provide a definitive response, but it can provide a probabilistic recommendation for system. The various physics parameters of multi-sensor are described not qualify as a manufacturing experience database. In order to create the manufacturing experience database, a series computer concept combine with IF/THEN statements must serve to connect the various sensor devices.
Therefore, the linguistic diagnosis methods of the fuzzy system are played a role expressed in IF-THEN form. The fuzzy logic rule is established the relationship between the consideration case of power transformer. In this case, it is used a three-phase immersed-type power transformer, there are three set of rules based on the phases, which is duplicated each other including voltage, current, moisture, temperature and oil-gas, etc. First, the proposed method involving on each set of rules is winding secondary voltage, for example, if the voltage increases than health value or fault type, than next step is considered as current. Sample of eight rules develop base on membership function for each phases controller is necessary established a role of fuzzy logic theorem. To build an experience role, for example, it is known that a rise in the acetylene concentration is indicated arcing occurring in the transformer. Arcing will also cause a rise in the top hot-spot oil temperature.
In order to validate the arcing hypothesis gas release, the temperature over probably reference measurement should also be confirmed. The final of monitoring power transformer is to prevent catastrophic failures, but also eliminate unnecessary maintenance. This paper, to build a manufacturing experience database, the proposed method is to prevent incorrect diagnosis by some unstable signals. Therefore, incorrect warning signals based on designed system can be validated using other measurements as well. This paper is to present an example of
intelligent fuzzy logic method incorporated into an experience database in order to detect transformer overheating and over load condition to predict transformer life consumption factor. In general, the description of judged-code is displayed as table 4.
According to the aforementioned statements, it can be easily observed that several sensor measurements signals to make a system diagnosis are utilized to confirm transformer health condition. The work of diagnosis device, first, the temperature sensor via AKM has been checked if there is any overheating. So, if there is an abnormal reading from hot-spot temperature in tank, the winding in current density should be checked by load operation and it should be happen the temperature heat up condition. If the transformer cooling systems of the fans are running, the ethylene, which indicates high temperature oil deterioration, than it can be checked to make sure the temperature level too high. If the ethylene level is above normal condition, the moisture in the top-oil of tank is checked. If transformer fault at any point, a sensor does not confirm the diagnosis of a previous sensor; the sensor should be checked and it doesn’t work normally. In this piecewise method, it is possible to deduce if a failure is occurring or if sensors are simply manufacturing. In many cases, all the sensor measurements may not be available. It is not necessary to have numerous sensors indicating the same information form power transformer.
Table 4. The SMS of power transformer via fuzzy rule IF (Hot-Spot Temperature Above Reference) > IEC code standard. THEN IF (Winding Secondary Rated Voltage) > Transformer designed
health value. THEN
IF (Winding Secondary Rated Current) > Transformer designed health value.
THEN IF (Ethylene Concentration) > IEC code standard. THEN
IF (Moisture Concentration) > IEC code standard. THEN
Transformer Overheating, Take 0ff-line to Service ELSE
Check DGA and Moisture Analyzer for Proper Functioning
ELSE Check Thermocouple Sensor
ELSE Check Current and Overload Condition
ELSE Check Voltage and Overload Condition ELSE Cooling System not Automated Operation in Transformer, Have Serviced ELSE
Transformers Operating Normally Consequently, for diagnosis procedure from transformer,
this chance of two different sensors failing at the same time and producing an incorrect warning signal is highly important. It should be noted that the sensor order to be used is dependent on
INTERNATIONAL JOURNAL OF CIRCUITS, SYSTEMS AND SIGNAL PROCESSING
Issue 4, Volume 5, 2011 378
Invited paper for NAUN Journal (WSEAS Cambridge Conference, paper series no 460-463)
10
the type of failure being detected. To detect an arcing failure condition, the ratio of acetylene to ethylene should probably be the predominant measurement. For each manufacturing experience database system that is created will consist of numerous set of IF/THEN logic procedure possibilities like the one given above. The design of each worker experience database system will be different depending on the sensor measurements available and the type of failures being detected. This paper proposed a key to a successful developing worker experience database system is to utilize all knowledge known about the diagnosis procedure system. Besides, this paper is to provide for checks in the system, so that the multi-sensor of measurement signals is used to diagnose the health of power transformer.
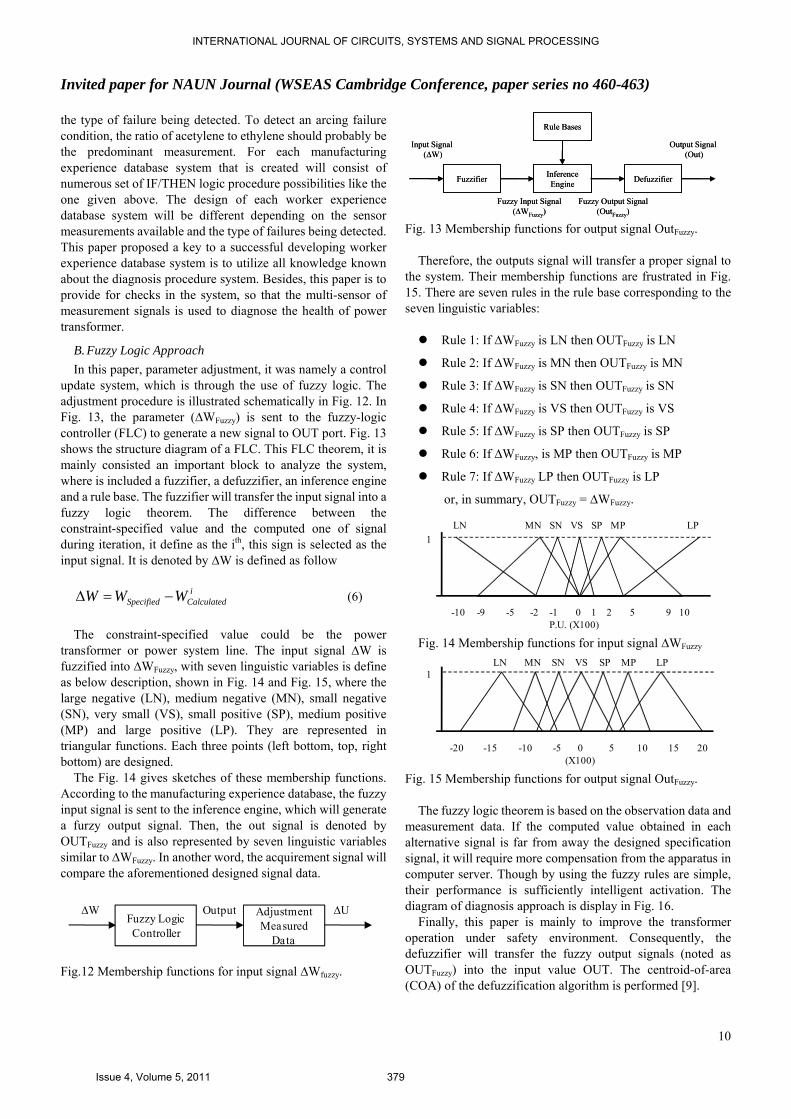
B. Fuzzy Logic Approach In this paper, parameter adjustment, it was namely a control
update system, which is through the use of fuzzy logic. The adjustment procedure is illustrated schematically in Fig. 12. In Fig. 13, the parameter (∆WFuzzy) is sent to the fuzzy-logic controller (FLC) to generate a new signal to OUT port. Fig. 13 shows the structure diagram of a FLC. This FLC theorem, it is mainly consisted an important block to analyze the system, where is included a fuzzifier, a defuzzifier, an inference engine and a rule base. The fuzzifier will transfer the input signal into a fuzzy logic theorem. The difference between the constraint-specified value and the computed one of signal during iteration, it define as the ith, this sign is selected as the input signal. It is denoted by ∆W is defined as follow
i
CalculatedSpecified WWW (6)
The constraint-specified value could be the power
transformer or power system line. The input signal ∆W is fuzzified into ∆WFuzzy, with seven linguistic variables is define as below description, shown in Fig. 14 and Fig. 15, where the large negative (LN), medium negative (MN), small negative (SN), very small (VS), small positive (SP), medium positive (MP) and large positive (LP). They are represented in triangular functions. Each three points (left bottom, top, right bottom) are designed.
The Fig. 14 gives sketches of these membership functions. According to the manufacturing experience database, the fuzzy input signal is sent to the inference engine, which will generate a furzy output signal. Then, the out signal is denoted by OUTFuzzy and is also represented by seven linguistic variables similar to ∆WFuzzy. In another word, the acquirement signal will compare the aforementioned designed signal data.
Fuzzy LogicController
AdjustmentMeasured
Data
∆W Output ∆U
Fig.12 Membership functions for input signal ∆Wfuzzy.
Fuzzifier InferenceEngine
Input Signal (∆W)
Defuzzifier
Rule Bases
Fuzzy Input Signal(∆WFuzzy)
Fuzzy Output Signal(OutFuzzy)
Output Signal (Out)
Fuzzifier InferenceEngine
Input Signal (∆W)
Defuzzifier
Rule Bases
Fuzzy Input Signal(∆WFuzzy)
Fuzzy Output Signal(OutFuzzy)
Output Signal (Out)
Fig. 13 Membership functions for output signal OutFuzzy.
Therefore, the outputs signal will transfer a proper signal to the system. Their membership functions are frustrated in Fig. 15. There are seven rules in the rule base corresponding to the seven linguistic variables:
Rule 1: If ∆WFuzzy is LN then OUTFuzzy is LN
Rule 2: If ∆WFuzzy is MN then OUTFuzzy is MN
Rule 3: If ∆WFuzzy is SN then OUTFuzzy is SN
Rule 4: If ∆WFuzzy is VS then OUTFuzzy is VS
Rule 5: If ∆WFuzzy is SP then OUTFuzzy is SP
Rule 6: If ∆WFuzzy, is MP then OUTFuzzy is MP
Rule 7: If ∆WFuzzy LP then OUTFuzzy is LP
or, in summary, OUTFuzzy = ∆WFuzzy.
LN MN SN VS SP MP LP
-10 -9 -5 -2 -1 0 1 2 5 9 10 P.U. (X100)
1
Fig. 14 Membership functions for input signal ∆WFuzzy
LN MN SN VS SP MP LP1
-20 -15 -10 -5 0 5 10 15 20(X100)
Fig. 15 Membership functions for output signal OutFuzzy. The fuzzy logic theorem is based on the observation data and
measurement data. If the computed value obtained in each alternative signal is far from away the designed specification signal, it will require more compensation from the apparatus in computer server. Though by using the fuzzy rules are simple, their performance is sufficiently intelligent activation. The diagram of diagnosis approach is display in Fig. 16.
Finally, this paper is mainly to improve the transformer operation under safety environment. Consequently, the defuzzifier will transfer the fuzzy output signals (noted as OUTFuzzy) into the input value OUT. The centroid-of-area (COA) of the defuzzification algorithm is performed [9].
INTERNATIONAL JOURNAL OF CIRCUITS, SYSTEMS AND SIGNAL PROCESSING
Issue 4, Volume 5, 2011 379

Invited paper for NAUN Journal (WSEAS Cambridge Conference, paper series no 460-463)
11
Fuzzy LogicController
ManufacturingExperimental
Database
No
Input / OutputMeasurement Data
Fault?
No
YesNo
Yes
ManufacturingExperimental
DatabaseFault?
Fault judgment and perform TransformerMaintenance Service
Safety Operation
In Construction Database, the Manufacturing Experience Data
Maybe need to be Rebuilt
Yes
Fig. 16 Block diagram of hybrid diagnostic approach
V. RESULT AND DISCUSSION In the previous proposed discussion, the fuzzy logic method
for creating a manufacturing experience database system from multi-sensor function was discussed already. There are many problems with simple case by using a worker experience system to diagnose the health of a transformer due to each types of failures condition for which experience database have not been established as well. There are also many failures that are only indicated by a particular sensor measurement. Therefore, it is hard to validate the manufacturing experience database system diagnosis with another sensor measurement. According to the before aforementioned development in sensor, an intelligent fuzzy logic system for transformer diagnostics was described.
This fuzzy logic theorem for fault diagnosis tool creates it’s establish such database rule to use simply input and output data. Therefore, this paper proposed method would need a database detailing different types of faults condition to provide a role for judging different diagnosis condition. There are always needing for manufacturing to advance establish the information to incorporate into its fuzzy diagnosis. In this case, the transformer is operated under a normal condition. By using the designed rule, the next loops to diagnosis have to judge oil gas release for protection the transformer health, shown in Fig. 10. The measured results of oil-gas of the DGA sensor have some problem. However, the winding current, voltage and moisture of detected signal are during safety region. However, these diagnosis results of detection signal of SMS device is not completely adapted all case. In order to confirm the health of transformer operated a good performance, the DGA procedure is necessary to perform in each case. According to the TCG gas detection results, the methane (CH4) and Ethane (C2H6) are displayed a low temperature and oil may be occurred breakdown condition. Therefore, the DGA measured result for transformer health can be confirmed.
VI. CONCLUSION This paper is successfully developed a smart maintenance
system for fault diagnosis and life consumption detector of power transformer. The IEEE standards were chosen because
of their ruggedness and reliability. The requirements of the remote terminal unit must fulfill the requirement condition. In general, it has to be installed inside a cabinet attached in power transformer. Therefore, under the open air, the main advantage of this system for the existing commercial case is open and easily reconfigurable for adapting to changes at the prediction models. This system, to develop multi-sensor including temperature measured sensor, current and voltage transducers, moisture sensor, and an automatically signal transmission GSM mobile, are obtained. Therefore, a commercial remote terminal unit installed in this application presents important advantage such as easily integration with distributed data-acquisition equipment from a lot of sensor date from transformers. For transformer life estimation, the measured result of temperature is used for compared with life consumption of power transformer with the Weibull distribution method. Besides, this paper is also discussed the fault diagnosis condition of transformer; it was proposed a method with fuzzy logic, where an expanding field of study is used for transformer and substation diagnostics. The diagnostic system and fault detection consideration database has been presented in this case. It can be altered and expanded to provide more valuable fault diagnosis information on the health of power transformer.
ACKNOWLEDGEMENT This paper is supported by the Ministry of Economic Affairs
Department (project number: 98-EC-17-A-31-I2-M004) and the Fortune Electric Company, all in Taiwan, R.O.C.
REFERENCE [1] C. L. Bak, K. E. Einarsdottir, and E. Andresson, et. al., “Overvoltage
protection of large power transformers a real-life study case,” IEEE Transaction on Power Delivery, vol. 23, no. 2, 2008, pp. 657-666.
[2] A. Wellington, A. S. D. José, and B. M. Wilmar, “ Exploiting the Vth behavior to design CMOS voltage references and temperature sensors,” International Journal of Circuits, Systems and Signal Processing (NAUN), vol. 3, no. 3, 2009, pp. 111-118.
[3] N. Balaji, K. Subba Rao, and M. Srinivasa Rao, “FPGA implementation of ternary pulse compression sequences with superior merit factors,” International Journal of Circuits, Systems and Signal Processing (NAUN), vol. 3, no. 2, 2009, pp. 47-54.
[4] V. Mijailovic, “Method for effects evaluation of some forms of power transformers preventive maintenance, Electric Power System Research,” vol. 78, no. 5, 2008, pp. 765-776.
[5] Neelam Mehala, Ratna Dahiya, “Condition monitoring methods failure identification and analysis for induction machines,” International Journal of Circuits, Systems and Signal Processing (NAUN), vol. 3, no. 1, 2009, pp. 10-17.
[6] K. S. Sandhu, and Dheeraj Joshi, “Estimation of control parameters of self-excited induction generator,” International Journal of Circuits, Systems and Signal Processing (NAUN), vol. 3, no. 1, 2009, pp. 38-45.
[7] J. Rivera, X. L. Mao, D. J. Tylavsky, “Improving reliability assessment of transformer thermal top-oil model parameters Estimated From Measured Data,” IEEE Transaction on Power Delivery, vol. 24, no. 1, 2009, pp. 169-176.
[8] L. Wenyuan, E. Vaahedi, and P. Choudhury, “Power system equipment aging,” IEEE Ene. Mag., vol. 4, no. 3, 2006, pp. 52-58.
[9] G. Swift, T. S. Molinski, R. Bray, et. al. , “A fundamental approach to transformer thermal modeling. II. field verification,” IEEE Transaction on Power Delivery, vol. 16, no. 2, 2001, pp. 176-180.
[10] IEEE Guide for Loading Mineral-Oil-Immersed Transformers. IEEE Standard C57.91-1995.
INTERNATIONAL JOURNAL OF CIRCUITS, SYSTEMS AND SIGNAL PROCESSING
Issue 4, Volume 5, 2011 380
Invited paper for NAUN Journal (WSEAS Cambridge Conference, paper series no 460-463)
12
[11] K. L. Lo,Y. J. Linand, and W. H. Siew, “Fuzzy-logic method for adjustment of variable parameters in load-flow calculation, IEE Proceedings Generation, Transmission and Distribution,” vol. 146, no. 3, 1999, pp. 276-282.
[12] R. Shoureshi, T. Norick, and R. Swartzendruber, “Intelligent transformer monitoring system utilizing neuro-fuzzy technique approach,” Intelligent Substation Final Project Report. PSERC Publication, 2004, pp. 4-26.
[13] R. C. Degeneff, R. Batruni, and M. A. Lebow, “Determining the effect of thermal loading on the remaining useful life of a power transformer from its impedance versus frequency characteristic,” IEEE Transaction on Power Delivery, vol. 11, no. 3, 1996, pp. 1385-1390.
[14] N. A. Muhamad, and S. A. M. Ali, “Simulation panel for condition monitoring of oil and dry transformer using Labview with fuzzy logic controller,” Word Academy Science Engineering Technology, vol. 20 2006, pp. 153-159.
[15] G. Gokmen, Y. Ozel, and N. Ekren, “Hall effect sensor and artificial neural networks application in current transformer,” International Journal of Circuits, Systems and Signal Processing (NAUN), vol. 2, no. 1, 2008, pp. 42-49.
INTERNATIONAL JOURNAL OF CIRCUITS, SYSTEMS AND SIGNAL PROCESSING
Issue 4, Volume 5, 2011 381