smart growth and low impact development - · pdf fileoverview • trends in development...
TRANSCRIPT

Smart Growth and Low Impact Development
Integrating into the Stormwater Management
Framework

Overview• Trends in Development
– Smart Growth
• Low Impact Development• EPA Expectations for MS4 Post-
Construction Programs

Trends in New DevelopmentSmart Growth

Trends in Development• Are we focused at the right level?

Trends in Development• Need to consider what is happening
at a broader scale – neighborhoods, cities, watersheds

Trends in Development
Current development trends are characterized by low-density housing, farmland conversion, and dependence on cars, which:•Consumes land at a faster rate•Transforms farmland•Separates houses from stores, businesses, and other land uses•Increases time spent in cars

It’s how and where we are growing that are driving our significantly increasing rate of land consumption, not domestic population growth.
Land Development and Population Growth in the US, 1982-2002

Development patterns• 80% of
residential development occurs on urban fringe or beyond
• 94% of that development on 1 acre or more
USDA Economic Research Service

OR
Low Density Higher Density
Which is Better for Water Quality on a Watershed Basis?

Program Planning at Various Scales
Need to expand the scale of current stormwater planning

EPA Research on Smart Growth & Water
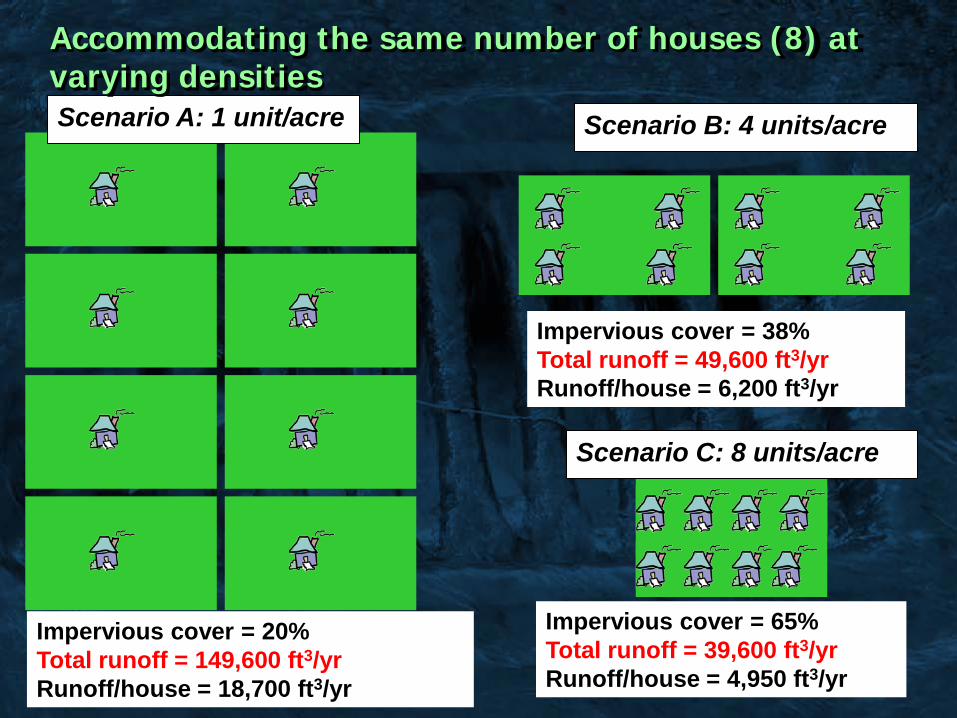
Scenario A: 1 unit/acre
Scenario B:4 units/acre
Scenario C:8 units/acre
Impervious cover = 20%Runoff/acre = 18,700 ft3/yrRunoff/unit = 18,700 ft3/yr
Impervious cover = 38%Runoff/acre = 24,800 ft3/yrRunoff/unit = 6,200 ft3/yr
Impervious cover = 65%Runoff/acre = 39,600 ft3/yrRunoff/unit = 4,950 ft3/yr
Scenario B: 4 units/acre
Impervious cover = 20%Total runoff = 149,600 ft3/yrRunoff/house = 18,700 ft3/yr
Impervious cover = 65%Total runoff = 39,600 ft3/yrRunoff/house = 4,950 ft3/yr
Scenario A: 1 unit/acre
Scenario C: 8 units/acre
Impervious cover = 38%Total runoff = 49,600 ft3/yrRunoff/house = 6,200 ft3/yr
Accommodating the same number of houses (8) at varying densities

And at the watershed level…Accommodating 10,000 units on a 10,000 acre watershed at different densities
The lower density scenario
creates more runoff and
consumes 2/3 more land than the
higher density scenario.

In 20 years, they have doubled their populations...
So by 2026, they might look like...

Smart Growth Principles • Mix land uses
• Take advantage of compact building design
• Create a range of housing opportunities and choices
• Create walkable neighborhoods
• Foster distinctive, attractive communities with a strong sense of place
• Preserve open space, farmland, natural beauty, and critical environmental areas

Smart Growth Principles (con’t)• Strengthen and direct
development towards existing communities
• Provide a variety of transportation choices
• Make development decisions predictable, fair, and cost-effective
• Encourage community and stakeholder collaboration in development decisions

Water Quality & Smart Growth• Density and
imperviousness are not equivalent
• Lawns do not equal undisturbed land, such as forests or meadows
• Low-density developments have more impervious infrastructure
• Growth is coming to the region—limiting density on a site doesn’t eliminate that growth

Which is Better for Water Quality on a Watershed Basis?
Housing like this….
…is, by design, served by retail and roads like this
Smart Growth Resources• Using Smart Growth Techniques as
Stormwater Best Management Practices – December 2005
• Protecting Water Resources with Higher-Density Development –January 2006
• Parking Spaces/Community Places, Finding the Balance through Smart Growth Solutions – January 2006www.epa.gov/smartgrowth

Low Impact Development

Good site design is critical to successful stormwater management

Site Design• Traditional stormwater management
that focuses on moving water off the landscape often exacerbates the stormwater problem
• Techniques that manage stormwater on-site and promote infiltration result in:– Pollution reduction– Volume reduction

Basic Premise of Low Impact Development
• Design site to minimize pollutant loadings and runoff volumes and velocities
• Use distributed small scale treatment systems
• Maximize infiltration/ground water recharge
• Reduce infrastructure costs• Protect ecosystem functions and
values


Minimize Development Impacts
• Reduce storm pipes, curbs and gutters
• Reduce building footprints• Preserve sensitive soils• Reduce road widths• Minimize grading• Limit lot disturbance • Reduce impervious surfaces

Design standards should encourage alternatives to curb and gutter where practical

Common LID Management Practices
Disconnectivity
Bioretention (Rain Gardens, Infiltration Trenches)
Permeable and Porous Pavements
Green Roofs
Soil Amendment
Open Swales
Rain Barrels

Disconnectivity

Open Swales

Bioretention
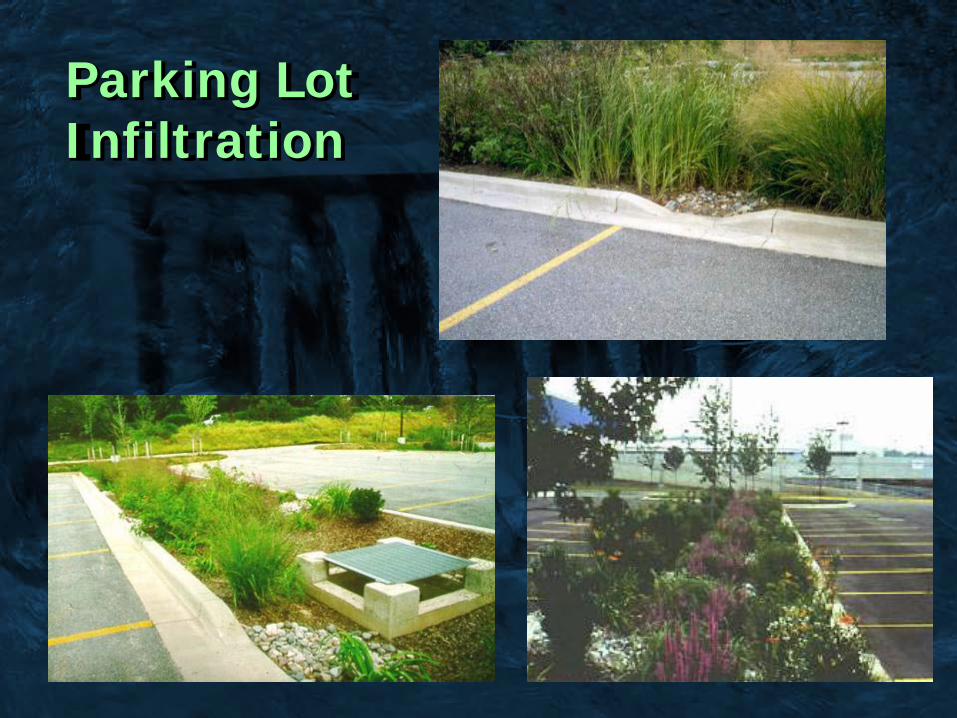
Parking LotInfiltration

Rain Gardens

Permeable and Porous Pavements

Green Roofs


Soil Amendment
Soils amended to a depth of 12 inches
Soil aeration

Other Local Ordinances• Modifying other local ordinances is
the key to successful implementation of LID and Smart Growth
• Look at:– Fire codes– Street codes– Building codes– Parking requirements– Etc.

Functional Landscape Design
Low ImpactConventional
Conventional

Construction Cost Comparison
Conventional Low ImpactGrading/Roads $569,698 $426,575
Storm Drains $225,721 $132,558
SWM Pond/Fees $260,858 $ 10,530
Bioretention/Micro — $175,000
Total $1,086,277 $744,663Unit Cost $14,679 $9,193
Lot Yield 74 81
Prince George’s County, Maryland

Post-ConstructionSmart GrowthLow Impact Development

Post-Construction Guidance
• Developing a comprehensive guide for Phase II communities
• Will include detailed guidance on program setup, creating an ordinance, sizing criteria, smart growth, low impact development, etc.
• Working with the Center for Watershed Protection to develop
• Publication late 2006

Post-Construction Guidance
Program Planning at Various Scales
Ordinance
Development Review Process
Inspection for Permanent Controls
Maintenance
Tracking, Monitoring &
Evaluation
Enforcement
Administration
Design Guidelines

EPA Expectations for MS4 Post-Construction Programs
• Five years after MS4 permit issued:• Post-construction ordinance in place
– Incorporates Low Impact Development BMPs– Includes detailed description of maintenance
responsibilities
• Post-construction manual– Includes design standards for LID BMPs
• Maintenance program fully operational– Municipal maintenance responsibilities– Homeowners, commercial, institutional
responsibilities– Inspect all BMPs using appropriate schedule– Training program on maintenance

EPA Expectations for MS4 Post-Construction Programs
Five years after MS4 permit issued:• Planning and zoning processes
incorporate Smart Growth concepts and acknowledge the importance of stormwater management
• Sustainable funding/budget mechanism in development (entire stormwater program)
Resources• EPA’s Green Infrastructure page
www.epa.gov/npdes/greeninfrastructure• Education and Outreach Materials
www.epa.gov/npdes/stormwatermonth• Training resources
www.epa.gov/npdes/trainingwww.epa.gov/owow/watershed/wacademy/
• Menu of BMPs www.epa.gov/npdes/menuofbmps• Smart Growth www.epa.gov/smartgrowth• Low Impact Development www.epa.gov/owow/lid
andCenter for Watershed Protection www.cwp.orgCWP’s Stormwater Manager’s Resource Center www.stormwatercenter.net
• MS4 Case Studies—approximately 20 www.epa.gov/npdes/casestudies

Contact InformationNikos SingelisEPA, Office of Wastewater Management1200 Pennsylvania Ave, NWWashington, DC [email protected]
Sign up for NPDES News – our email newsletter at www.epa.gov/npdes