smart grid top markets report grid top markets report ... global trade in transmission and...
TRANSCRIPT
Smart Grid Top Market Report, Update January 2017 – 1
U.S. Department of Commerce | International Trade Administration | Industry & Analysis
Smart Grid Top Markets Report – Update, January 2017
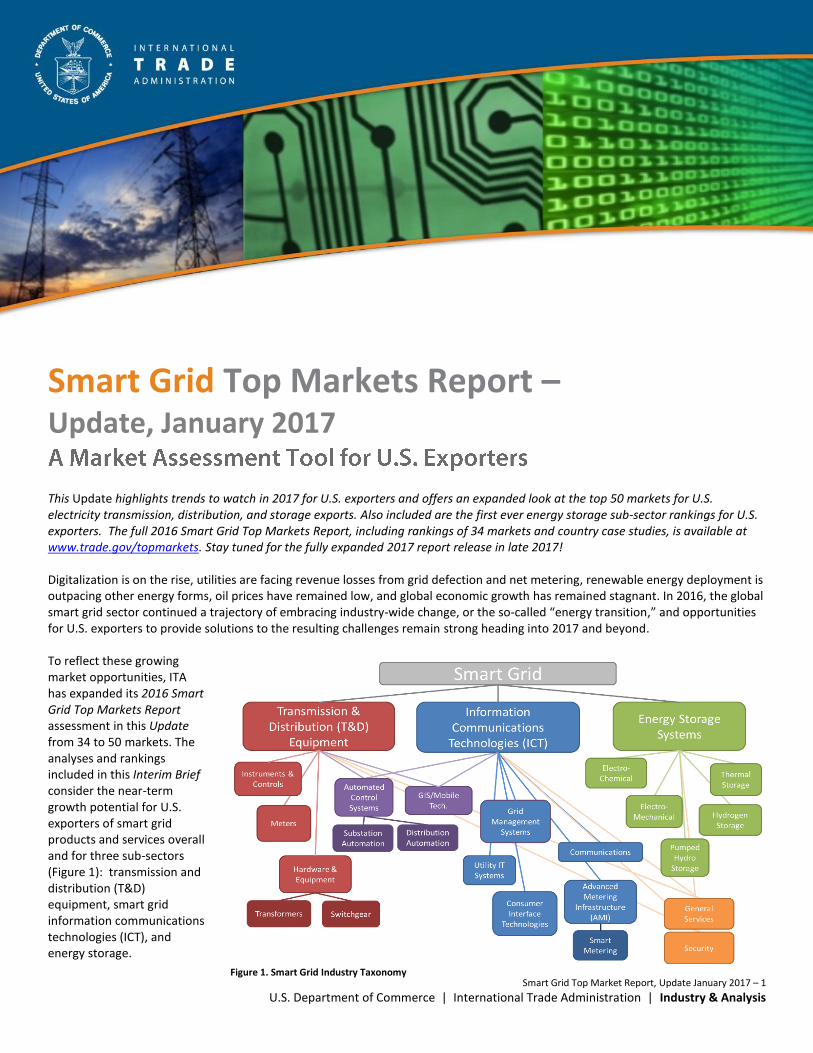
This Update highlights trends to watch in 2017 for U.S. exporters and offers an expanded look at the top 50 markets for U.S. electricity transmission, distribution, and storage exports. Also included are the first ever energy storage sub-sector rankings for U.S. exporters. The full 2016 Smart Grid Top Markets Report, including rankings of 34 markets and country case studies, is available at www.trade.gov/topmarkets. Stay tuned for the fully expanded 2017 report release in late 2017! Digitalization is on the rise, utilities are facing revenue losses from grid defection and net metering, renewable energy deployment is outpacing other energy forms, oil prices have remained low, and global economic growth has remained stagnant. In 2016, the global smart grid sector continued a trajectory of embracing industry-wide change, or the so-called “energy transition,” and opportunities for U.S. exporters to provide solutions to the resulting challenges remain strong heading into 2017 and beyond. To reflect these growing market opportunities, ITA has expanded its 2016 Smart Grid Top Markets Report assessment in this Update from 34 to 50 markets. The analyses and rankings included in this Interim Brief consider the near-term growth potential for U.S. exporters of smart grid products and services overall and for three sub-sectors (Figure 1): transmission and distribution (T&D) equipment, smart grid information communications technologies (ICT), and energy storage.
Figure 1. Smart Grid Industry Taxonomy
Smart Grid Top Market Report, Update January 2017 – 2
U.S. Department of Commerce | International Trade Administration | Industry & Analysis
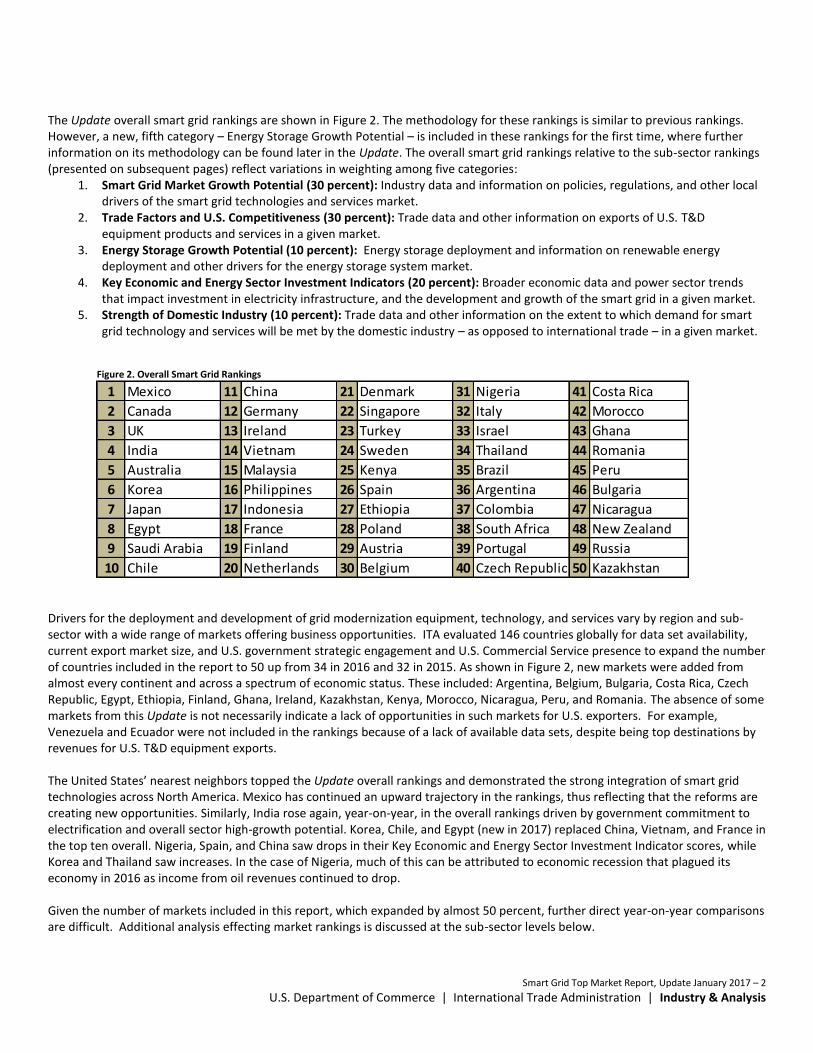
The Update overall smart grid rankings are shown in Figure 2. The methodology for these rankings is similar to previous rankings. However, a new, fifth category – Energy Storage Growth Potential – is included in these rankings for the first time, where further information on its methodology can be found later in the Update. The overall smart grid rankings relative to the sub-sector rankings (presented on subsequent pages) reflect variations in weighting among five categories:
1. Smart Grid Market Growth Potential (30 percent): Industry data and information on policies, regulations, and other local drivers of the smart grid technologies and services market.
2. Trade Factors and U.S. Competitiveness (30 percent): Trade data and other information on exports of U.S. T&D equipment products and services in a given market.
3. Energy Storage Growth Potential (10 percent): Energy storage deployment and information on renewable energy deployment and other drivers for the energy storage system market.
4. Key Economic and Energy Sector Investment Indicators (20 percent): Broader economic data and power sector trends that impact investment in electricity infrastructure, and the development and growth of the smart grid in a given market.
5. Strength of Domestic Industry (10 percent): Trade data and other information on the extent to which demand for smart grid technology and services will be met by the domestic industry – as opposed to international trade – in a given market.
Drivers for the deployment and development of grid modernization equipment, technology, and services vary by region and sub-sector with a wide range of markets offering business opportunities. ITA evaluated 146 countries globally for data set availability, current export market size, and U.S. government strategic engagement and U.S. Commercial Service presence to expand the number of countries included in the report to 50 up from 34 in 2016 and 32 in 2015. As shown in Figure 2, new markets were added from almost every continent and across a spectrum of economic status. These included: Argentina, Belgium, Bulgaria, Costa Rica, Czech Republic, Egypt, Ethiopia, Finland, Ghana, Ireland, Kazakhstan, Kenya, Morocco, Nicaragua, Peru, and Romania. The absence of some markets from this Update is not necessarily indicate a lack of opportunities in such markets for U.S. exporters. For example, Venezuela and Ecuador were not included in the rankings because of a lack of available data sets, despite being top destinations by revenues for U.S. T&D equipment exports. The United States’ nearest neighbors topped the Update overall rankings and demonstrated the strong integration of smart grid technologies across North America. Mexico has continued an upward trajectory in the rankings, thus reflecting that the reforms are creating new opportunities. Similarly, India rose again, year-on-year, in the overall rankings driven by government commitment to electrification and overall sector high-growth potential. Korea, Chile, and Egypt (new in 2017) replaced China, Vietnam, and France in the top ten overall. Nigeria, Spain, and China saw drops in their Key Economic and Energy Sector Investment Indicator scores, while Korea and Thailand saw increases. In the case of Nigeria, much of this can be attributed to economic recession that plagued its economy in 2016 as income from oil revenues continued to drop. Given the number of markets included in this report, which expanded by almost 50 percent, further direct year-on-year comparisons are difficult. Additional analysis effecting market rankings is discussed at the sub-sector levels below.
Figure 2. Overall Smart Grid Rankings
1 Mexico 11 China 21 Denmark 31 Nigeria 41 Costa Rica
2 Canada 12 Germany 22 Singapore 32 Italy 42 Morocco
3 UK 13 Ireland 23 Turkey 33 Israel 43 Ghana
4 India 14 Vietnam 24 Sweden 34 Thailand 44 Romania
5 Australia 15 Malaysia 25 Kenya 35 Brazil 45 Peru
6 Korea 16 Philippines 26 Spain 36 Argentina 46 Bulgaria
7 Japan 17 Indonesia 27 Ethiopia 37 Colombia 47 Nicaragua
8 Egypt 18 France 28 Poland 38 South Africa 48 New Zealand
9 Saudi Arabia 19 Finland 29 Austria 39 Portugal 49 Russia
10 Chile 20 Netherlands 30 Belgium 40 Czech Republic 50 Kazakhstan
Smart Grid Top Market Report, Update January 2017 – 3
U.S. Department of Commerce | International Trade Administration | Industry & Analysis
Transmission & Distribution Equipment Sub-Sector
Global trade in transmission and distribution (T&D) equipment has remained relatively stable over the last few years even as global electricity demand has incrementally increased amid stagnant global economic growth.
1 In the near-term, average global electricity
annual demand is expected to more than double from 1.3 percent per year in 2015 to 2.8 percent by 2020.2 This is expected to drive
approximately $5 trillion in investment in T&D infrastructure from 2015-2030.3
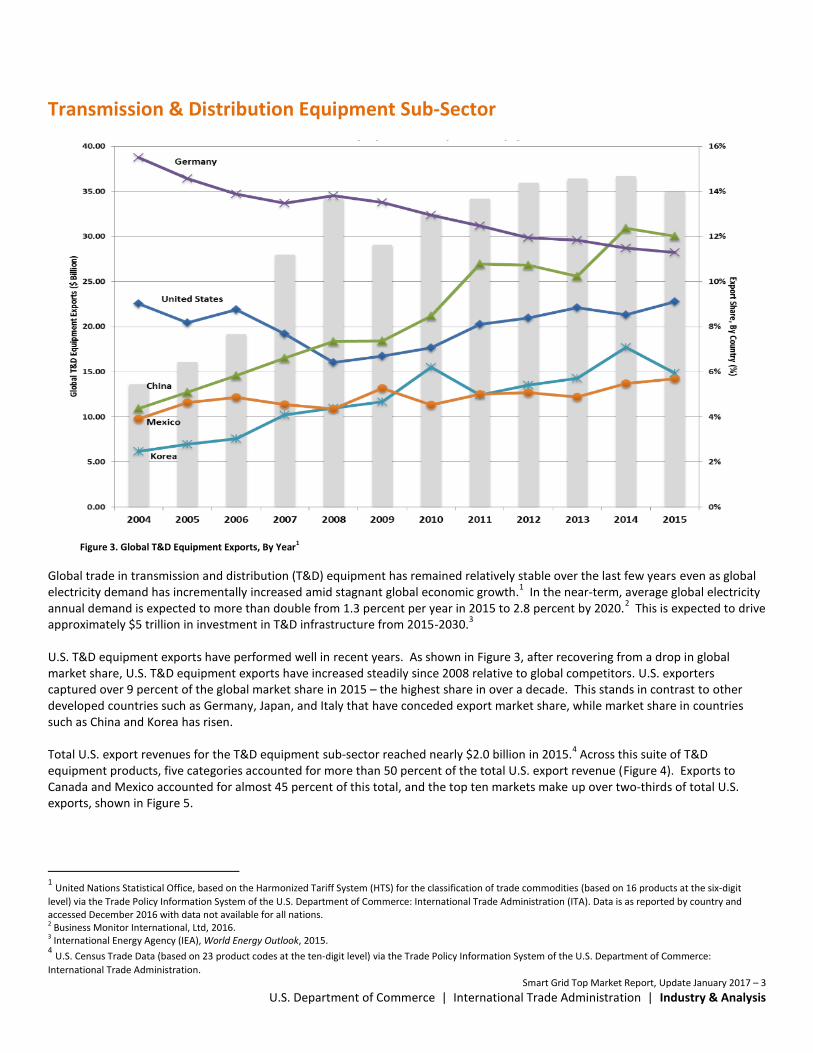
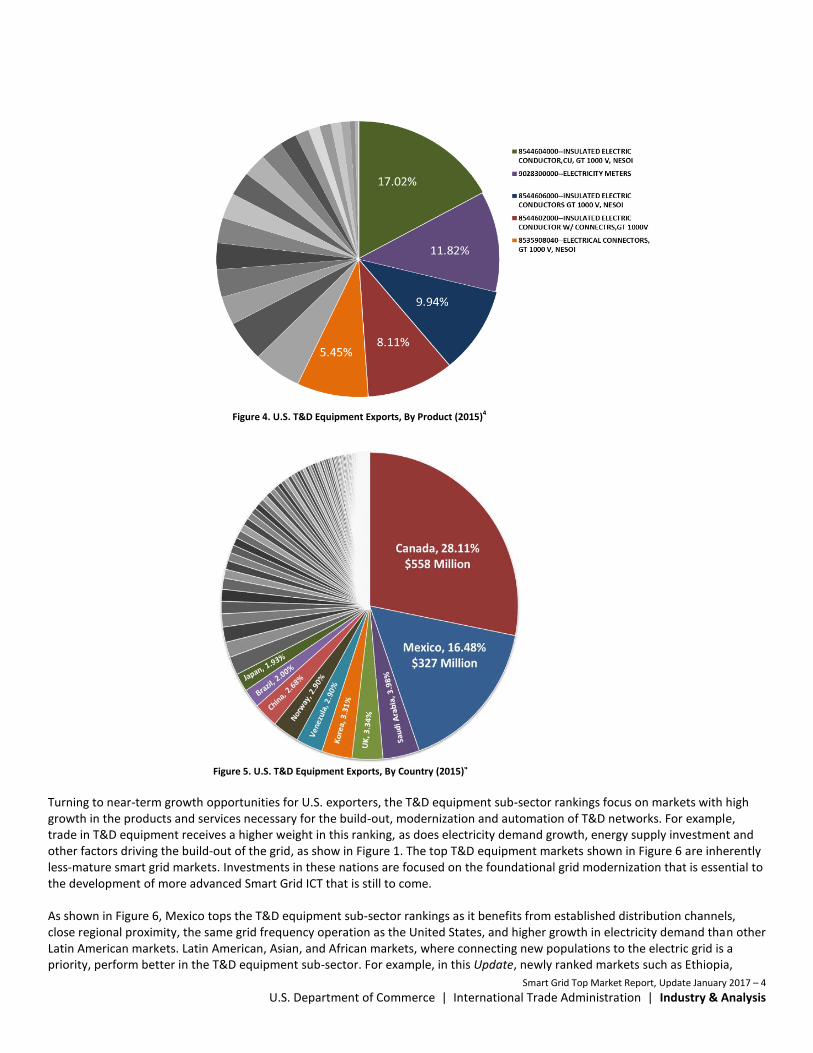
U.S. T&D equipment exports have performed well in recent years. As shown in Figure 3, after recovering from a drop in global market share, U.S. T&D equipment exports have increased steadily since 2008 relative to global competitors. U.S. exporters captured over 9 percent of the global market share in 2015 – the highest share in over a decade. This stands in contrast to other developed countries such as Germany, Japan, and Italy that have conceded export market share, while market share in countries such as China and Korea has risen. Total U.S. export revenues for the T&D equipment sub-sector reached nearly $2.0 billion in 2015.
4 Across this suite of T&D
equipment products, five categories accounted for more than 50 percent of the total U.S. export revenue (Figure 4). Exports to Canada and Mexico accounted for almost 45 percent of this total, and the top ten markets make up over two-thirds of total U.S. exports, shown in Figure 5.
1 United Nations Statistical Office, based on the Harmonized Tariff System (HTS) for the classification of trade commodities (based on 16 products at the six-digit
level) via the Trade Policy Information System of the U.S. Department of Commerce: International Trade Administration (ITA). Data is as reported by country and accessed December 2016 with data not available for all nations. 2 Business Monitor International, Ltd, 2016. 3 International Energy Agency (IEA), World Energy Outlook, 2015. 4 U.S. Census Trade Data (based on 23 product codes at the ten-digit level) via the Trade Policy Information System of the U.S. Department of Commerce:
International Trade Administration.
Figure 3. Global T&D Equipment Exports, By Year1
Smart Grid Top Market Report, Update January 2017 – 4
U.S. Department of Commerce | International Trade Administration | Industry & Analysis
Turning to near-term growth opportunities for U.S. exporters, the T&D equipment sub-sector rankings focus on markets with high growth in the products and services necessary for the build-out, modernization and automation of T&D networks. For example, trade in T&D equipment receives a higher weight in this ranking, as does electricity demand growth, energy supply investment and other factors driving the build-out of the grid, as show in Figure 1. The top T&D equipment markets shown in Figure 6 are inherently less-mature smart grid markets. Investments in these nations are focused on the foundational grid modernization that is essential to the development of more advanced Smart Grid ICT that is still to come. As shown in Figure 6, Mexico tops the T&D equipment sub-sector rankings as it benefits from established distribution channels, close regional proximity, the same grid frequency operation as the United States, and higher growth in electricity demand than other Latin American markets. Latin American, Asian, and African markets, where connecting new populations to the electric grid is a priority, perform better in the T&D equipment sub-sector. For example, in this Update, newly ranked markets such as Ethiopia,
Figure 5. U.S. T&D Equipment Exports, By Country (2015)4
Figure 4. U.S. T&D Equipment Exports, By Product (2015)4

Smart Grid Top Market Report, Update January 2017 – 5
U.S. Department of Commerce | International Trade Administration | Industry & Analysis
Kenya, and Egypt rounded out the top ten rankings, where all three markets are expected to see over 6.7 percent electricity demand growth annually.
2 Saudi Arabia saw a drop in rankings that can be attributed to a number of factors from local content requirements,
low operating revenues from low oil prices, increasing adoption of European electrical standards, and slowing electricity demand forecasts relative to other markets. For example, Saudi Arabia’s annual average electricity demand growth was 3.66 percent for 2018-2022 versus 7.4 percent for Vietnam, 7.1 percent for Indonesia, and 6.1 percent for India.
2 Similarly, Nigeria’s electricity
demand growth forecast was revised down and further contributes to its decrease in rankings relative to 2016. U.S. exporters of T&D equipment will face significant competition throughout Europe resulting in a limited outlook.
Smart Grid Information Communications Technologies Sub-Sector
Global growth for smart grid information communication technologies (ICT) is anticipated across the suite of technologies (Figure 1) that leverage automation and digitalization to enhance grid efficiencies. For example, by one account, over the last year, investment in the suite of “smart” technologies jumped almost 30 percent to over $41 billion in 2016.
5
Although the technologies and services included in global smart grid ICT varies, one enabling technology is the deployment of smart meters. In 2016, firms have quantified smart meter investment between $8.84 and $14.4 billion – some of the highest investment numbers to date.
6-7 It is anticipated that by 2020, more than 1 billion smart meters will be deployed.
8 This will drive upward
investment in the smart grid ICT sub-sector not only for meter hardware– a product that has become increasingly commoditized – and network communications platforms, but also for analytical, visualization, and customer engagement services and tools necessary to realize a return on meter investment. U.S. exporters will see significant market share of this growing sub-sector segment as U.S. developers of smart grid analytical tools for demand response and other applications are widely recognized as global leaders.
At the regional level, global drivers for smart grid ICT products and services deployment vary significantly by region and technology. Advanced smart grid technologies – such as remote meter reading, service outage management and isolation, and integrated volt/var control – have been shown to lead to direct economic benefits as high as $100 and indirect economic benefits of $50 per year per customer.
9 In addition to potential economic drivers, policies and regulations play a significant role in market development
and as such, are key factors contributing to the Smart Grid ICT rankings presented here.
5 Bloomberg New Energy Finance, Clean Energy Investment Factpack, 2016. 6 MarketsandMarkets, Smart Electric Meter Market by Communication Technology (RF, PLC, and Cellular), End-User (Residential, Commercial, Industrial), Phase (Single Phase and Three Phase) and by Region - Global Trends & Forecasts to 2021, July 2016. 7 Bloomberg New Energy Finance, Shift to base-cost renewables: 10 predictions for 2017, 19 January 2017. 8 Bloomberg New Energy Finance, Smart meter vendors shift direction from hardware to value added services, 30 November 2016.
9 Smart Grid Consumer Collaborative, Smart Grid Economic and Environment Benefits: A review and synthesis of research on smart grid benefits and costs, 2013.
Figure 6. T&D Equipment Sub-Sector Rankings
1 Mexico 11 Philippines 21 Ireland 31 France 41 South Africa
2 Ethiopia 12 Korea 22 Morocco 32 Kazakhstan 42 Finland
3 Kenya 13 Nicaragua 23 Colombia 33 Netherlands 43 Denmark
4 Vietnam 14 Chile 24 Thailand 34 Germany 44 Bulgaria
5 Egypt 15 Peru 25 Costa Rica 35 Czech Republic 45 Romania
6 India 16 Turkey 26 Ghana 36 Belgium 46 Portugal
7 Indonesia 17 China 27 Argentina 37 Austria 47 Sweden
8 Canada 18 Nigeria 28 UK 38 Israel 48 Italy
9 Malaysia 19 Australia 29 Poland 39 Spain 49 New Zealand
10 Saudi Arabia 20 Singapore 30 Japan 40 Brazil 50 Russia

Smart Grid Top Market Report, Update January 2017 – 6
U.S. Department of Commerce | International Trade Administration | Industry & Analysis
Methodology for this Update the Smart Grid ICT Sub-Sector rankings is consistent with weighing of years past, where available trade data for the Smart Grid ICT sub-sector is an acute problem and understanding U.S. competiveness in this sub-sector is largely dependent on qualitative data. Factors that were considered and subsequently scored are highlighted in Figure 7. For the third year in a row, Canada topped the Smart Grid ICT sub-sector rankings and was again joined by the United Kingdom, Australia, Japan, and France in the top ten markets (Figure 8). Positive signs of reform implementation in Mexico, aggressive carbon-neutral commitments by the Nordics, and passing of new energy legislation in Germany are all reflected in rising rankings for these markets. Drops in Chinese rankings were evident given announced localization policies that will affect the sector – including the passing of new cybersecurity regulations and the Made in China 2025 plan. Economic and political environments began to show signs of improvement in Brazil and are reflected in improved rankings. Less-mature smart grid markets, such as Saudi Arabia and Turkey, also rank well on account of high U.S. competitiveness, positive signs in the development of smart grid ICT pilots involving U.S. partners, and desires to leverage cutting-edge technology increase grid efficiencies. Sub-Saharan African markets fail to crack the top 30 rankings for Smart Grid ICT, not because these markets could not benefit from increased efficiencies afforded through deployment of advanced technologies, because electricity access and build-out of the infrastructure remain these countries’ primary focus.
Energy Storage Sub-Sector Improved technologies, more complex electricity market designs, and increased penetration of renewable energy is driving the deployment of energy storage solutions, offering both buyers and investors a stronger economic case for investment. The current total global installed capacity of energy storage reached over 110 GW with forecasts for annual capacity to be added every year on an increasing basis. For example, one forecast suggest as much as 4 GW of new installed capacity will be added in 2017 and will increase annually so that in 2025 alone approximately 41 GW of new capacity will be added.
10
10 Navigant Research
Figure 7. Smart Grid Market Growth Potential
10%
10%
10%
10%
10%10%
40%
Government Commitment
Energy Policy Drivers
Regulatory Drivers
Grid Investment & Electricity Market Acitivty
AdditionalSmart Grid Drivers
Regulatory DriversRegulatory Drivers
Buusiness Environment& U.S. Competitiveness
Smart Grid Market Growth Potential
Local Assessment of Smart Grid Market & U.S. Export Potential
Figure 8. Smart Grid ICT Sub-Sector Rankings
1 Canada 11 Netherlands 21 Singapore 31 South Africa 41 Bulgaria
2 UK 12 Denmark 22 Belgium 32 Indonesia 42 Russia
3 Mexico 13 Saudi Arabia 23 Vietnam 33 Portugal 43 New Zealand
4 Japan 14 India 24 Austria 34 Czech Republic 44 Morocco
5 Finland 15 China 25 Brazil 35 Thailand 45 Kenya
6 Australia 16 Korea 26 Egypt 36 Argentina 46 Ghana
7 Sweden 17 Malaysia 27 Italy 37 Colombia 47 Ethiopia
8 Germany 18 Spain 28 Poland 38 Nigeria 48 Peru
9 France 19 Chile 29 Israel 39 Romania 49 Kazakhstan
10 Ireland 20 Turkey 30 Philippines 40 Costa Rica 50 Nicaragua
Smart Grid ICT Rankings

Smart Grid Top Market Report, Update January 2017 – 7
U.S. Department of Commerce | International Trade Administration | Industry & Analysis
Focusing on non-pumped hydropower energy storage projects, in 2016, global deployment reached 1.6 GW and is expected to grow 16 fold by 2025.
11 In 2016 alone, over 700
MW of global energy storage projects were commissioned.12
This includes a variety of technology choices, but also reflects a growing preference for lithium-ion battery usage. For non-pumped hydro utility scale projects, 90 percent of the projects commissioned in 2016 leverage lithium-ion batteries.
12 This is largely being driven by cost decreases
and new economies of scale. Between 2007 and 2017 lithium-ion battery pack costs declined by roughly 60 percent
13 and are expected to drop another 20-27 percent
over the next two years for both utility and residential scale.
14
The diversity of technologies, scales, and power specifications of energy storage systems reflects the diversity of applications for said technology. As shown in Figure 1, mechanisms to store energy vary and can be segmented into five categories: electrochemical (e.g., lead-acid batteries, flow batteries, and lithium ion batteries), electromechanical (e.g., compressed air storage and flywheels), pumped-hydropower, hydrogen storage, and thermal storage (e.g., chilled water storage, and molten salts storage). These technologies have a few key features that inform their deployment for specific applications that can include load following, voltage support, T&D congestion relief, T&D infrastructure investment deferral, peak demand reductions, and frequency regulation. Three components that inform the choice of technology for a specific application include: • Speed the energy can be deployed, or discharge rate • Amount of power deployed (e.g. kilowatts) • Duration power can be sustained (seconds versus hours) Near-term economic deployment of energy storage products has been primarily focused on utility-scale. This includes ancillary services – such as frequency regulation, as seen in United States, Korea, and United Kingdom – driven in part due to existing net-metering policies that disincentive behind-the-meter storage deployment in grid-connected locations. Forecasts suggest that in the mid-term (5-7 year window) behind-the-meter energy storage (as coupled with solar photovoltaics) will be the dominant use case for storage as net-metering and other related policies are rolled back.
11 In the long term, creative and flexible deployments of
storage will be necessary to capture all of the unique and varying benefits – and potentially stack them – across all deployment scales. Global deployment of energy storage has largely been concentrated in a small number of markets. Over the coming decade, Japan, India, China, and Europe will join the United States to represent 71 percent of the global installed non-pumped hydro energy storage capacity.
11 When accounting for regional variances in deployment costs, over the next year (2017), it is anticipated that global
investment will reach almost $10 billion with deployment of storage technologies in the United States accounting for over 40 percent of the total investment (Figure 9).
10 This suggests U.S. vendors supplying goods and services to domestic projects have a
competitive advantage globally based on experience and potential economies of scale across a range of technologies. However, over the coming decade, the market for new energy storage capacity will shift outside U.S. borders. By 2025, forecasts suggest that the United States will be overtaken as the largest market for energy storage. As such, if U.S. firms do not begin to expand sales internationally now, the current U.S. competitive advantage may not be maintained as opportunities shift overseas.
11 Bloomberg New Energy Finance; Global Energy Storage Forecast, 2016-24, Part 1; 31 August 2016. 12 Bloomberg New Energy Finance, H2 2016 Global Energy Storage Market Outlook, 22 December 2016. 13 B. Nykvist and M. Nilsson, "Rapidly falling costs of battery packs for electric vehicles," Nature Climate Change, vol. 5, pp. 329-332, 2015. http://dx.doi.org/10.1038/nclimate2564. 14 U.S. Department of Energy, Office of Energy Efficiency and Renewable Energy, EV Everywhere Grand Challenge, January 2014. http://go.usa.gov/3Sn3B.
Figure 9. Forecasted Energy Storage Revenue, By Country (2017)10

Smart Grid Top Market Report, Update January 2017 – 8
U.S. Department of Commerce | International Trade Administration | Industry & Analysis
For U.S. exporters, it is important to note there is not yet one market – domestically, or internationally – that has the comprehensive suite of policy, regulatory, and business solutions for rapid deployment. There are discrete examples of policies, regulations, and business models that are fostering deployment across the globe, but finding the right combination remains a challenge. As such, much of the near term focus for U.S. exporters looking to tap global markets will be to build awareness, increase communication channels, and engage in best practice discussions globally to open up these emerging markets over the coming years Their focus should also be on engaging decision-makers to:
1. Create the enabling policy environment; 2. Create the enabling regulatory structure; and 3. Increase the knowledge of utilities to change procurement specifications to enable energy storage systems to compete with
other technologies. As such, pilot and demonstration projects will likely persist in the near-term to build regional confidence. Absent such investments, U.S. exporters will be challenged to initiate widespread deployment, despite the validity of their technologies. This Update includes the first-ever Energy Storage Sub-Sector rankings for U.S. exporters. As with the other sub-sector rankings in the Smart Grid Top Market Report, rankings reflect growth opportunities in the near-term, or the next 2-3 years. Recognizing the overlap of smart grid ICT drivers and T&D equipment trade, the energy storage sub-sector rankings reflect a weighing that incorporates all five categories, but differs from the overall rankings: Smart Grid Market Growth Potential (20%), Trade Factors and U.S. Competitiveness (10%), Energy Storage Growth Potential (40%), Key Economic and Energy Sector Investment Indicators (20%), and Strength of Domestic Industry (10%). The Energy Storage Growth Potential score is the sum of three normalized (0-100 point scale), weighted data sets (Figure 10).
1. Local Assessment of Energy Storage Market and U.S. Export Potential (25 percent): Qualitative local assessment of on-the-ground U.S. Commercial Service Specialist feedback from local utilities, policymakers, and regulators deployment of energy storage.
2. Renewable Energy Electricity Deployment Score (25 percent): The share of electricity generated by renewable energy (non-hydro) in the last year of available data (2012-2014).
15
3. Energy Storage Deployment Score (50 percent): Quantitative assessment of current installed capacity and number of projects drawing from three sources and ranked on a 10 point scale.
10,16-17
As shown in Figure 11, the United Kingdom, Canada, and Germany top the inaugural Energy Storage Sub-Sector rankings. However, each market has different drivers: frequency regulation in the United Kingdom, pumped-hydropower (partly to balance U.S. renewable energy) in Canada, and rooftop solar coupled with storage in Germany. Strong local competition and preferential policies in markets such as Japan, Korea, and China decrease opportunities for U.S. exporters, but still reflect large immediate markets as the number of projects (and project capacity) exceed those for other regions. The Nordics perform well given interest in advanced grid technologies, robust interest in carbon-neutrality, robust regional electricity market design, and strong electric vehicle deployment relative to other regions.
15 World Bank, World Bank Data Catalogue, accessed 27 December 2016. 16 U.S. Department of Energy, Energy Storage Exchange, http://www.energystorageexchange.org/. 17 Bloomberg New Energy Finance, Energy Smart Technologies Database, accessed 21 December 2016
Figure 10. Energy Storage Growth Score Factors

Smart Grid Top Market Report, Update January 2017 – 9
U.S. Department of Commerce | International Trade Administration | Industry & Analysis
Export opportunities will vary by market segment within the energy storage community (e.g., battery manufacturer, software provider, and integrator). For example, Korean and Japanese firms maintain strong market share in lithium battery manufacturing and U.S. exporters of similar technologies will face stiff competition globally – including bidding into projects that include other U.S. partners. Enabling policies and regulations for energy storage ownership will further segment market opportunities. Further long-term consideration of operation safety in variable climates, project lifetimes, need for recyclability of products (in the case of batteries), and other factors will affect how foreign utilities scope projects. Finally, in some markets utilities have the ability to deploy energy storage for T&D maintenance deferral.
What to Watch in 2017 Looking ahead, ITA will be watching a number of macro issues that could affect the overall outlook for global U.S. smart grid exports in 2017, including these five:
1. Implementation and formulation of new electricity market liberalization regulations in Mexico, Japan, and China 2. Decisions on the new European energy market design and Brexit vote implications 3. Availability of financing for distribution-level projects in India, Brazil, Nigeria, Ethiopia, and Ghana 4. Economic and political environmental changes in Brazil, Argentina, Nigeria, Colombia, Korea, and Russia 5. Data and manufacturing localization policies in China, Brazil, India, and Korea
At the sub-sector level a handful of targeted trends will likely shape the outlook for U.S. exporters:
T&D Equipment Sub-Sector: Persistence of high electricity demand forecasts in emerging markets; shifting global competitive landscape and new firms (e.g., Chinese firms) ability to capture market share in sub-Saharan Africa; and deployment of non-tariff trade barriers intended to increase market share for domestic firms, negatively effecting U.S. firms
Smart Grid ICT Sub-Sector: European countries ability to hit European Union smart meter targets; new business models favoring consumer choice and the energy as a service model; and focus on energy security and resiliency
Energy Storage Sub-Sector: Regulatory decisions on who can “own” energy storage assets in Europe; roll-back of net metering policies; proliferation of localization policies; and interest of U.S. firms to engage internationally, while competing aggressively domestically
The full 2016 Smart Grid Top Markets Report, including rankings of 34 markets and country case studies, is available at www.trade.gov/topmarkets. Stay tuned for the next fully expanded report release in late 2017! For questions or comments, please contact [email protected].
Figure 11. Energy Storage Sub-Sector Rankings
1 UK 11 Ireland 21 Singapore 31 Czech Republic 41 Nigeria
2 Canada 12 Chile 22 Austria 32 Vietnam 42 Costa Rica
3 Germany 13 Finland 23 Portugal 33 Israel 43 Bulgaria
4 Japan 14 Netherlands 24 Saudi Arabia 34 Brazil 44 Romania
5 Australia 15 France 25 Indonesia 35 Turkey 45 Morocco
6 Denmark 16 Egypt 26 Poland 36 New Zealand 46 Colombia
7 Korea 17 Sweden 27 Malaysia 37 Thailand 47 Ghana
8 China 18 Spain 28 Belgium 38 Russia 48 Nicaragua
9 Mexico 19 Philippines 29 Kenya 39 Argentina 49 Kazakhstan
10 India 20 Italy 30 South Africa 40 Ethiopia 50 Peru