smart energy - vs.inf.ethz.ch€¦ · ganesh ramanathan 06.05.2014 smart energy ubiquitous...
TRANSCRIPT

| |
Electricity usage and demand side management in households
Ganesh Ramanathan
06.05.2014
Smart Energy
Ubiquitous Computing Seminar FS2014

Topics
2
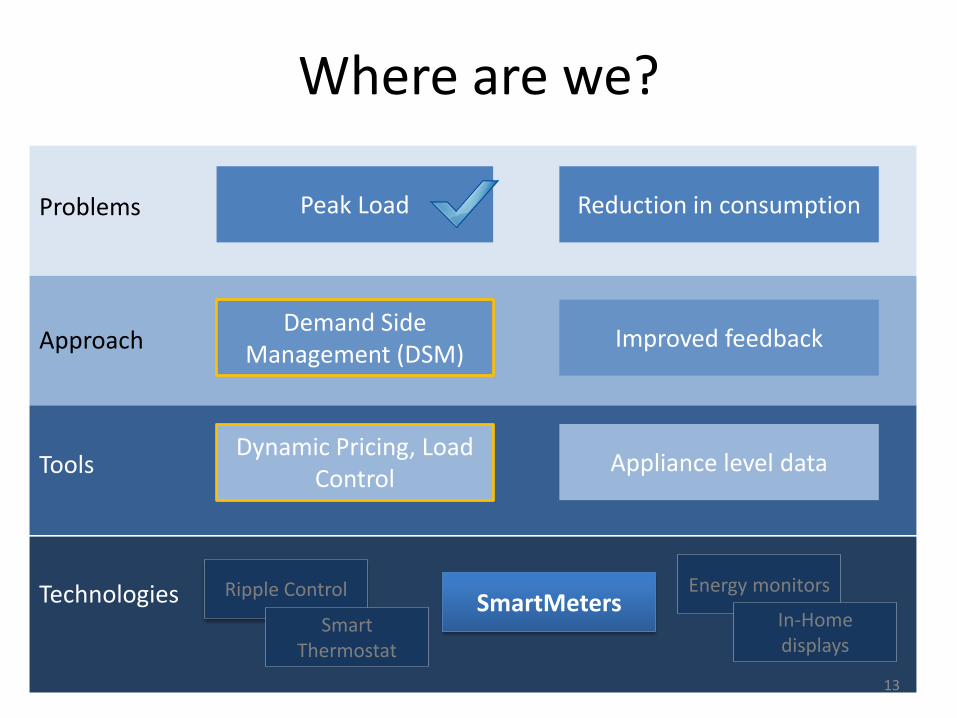
Peak Load Reduction in consumption Problems
Demand Side Management (DSM)
Improved feedback Approach
Dynamic Pricing, Load Control
Appliance level data Tools
SmartMeters Technologies Ripple Control Energy monitors
Smart Thermostat
In-Home displays

0. Energy statistics and overview of the grid
3

Energy Statistics
4 Source : Schweizerische Elektrizitätsstatistik 2012, BFE
Services
Transportation Residential
Agriculture, gardening
Manufacturing industry
Electrical Energy usage in Switzerland according to sector

Energy Statistics
5 Source : Schweizerische Elektrizitätsstatistik 2012, BFE
(incl. washing, drying, freezers..)
(incl. computers, mobiles, consumer electronics)
Water heating**
Space heating*
Stove
Lighting
Cooling, Ventilation
I & C and Entertainment
Others
Processes
Electrical Energy usage in Switzerland in residential sector
* Electricity only accounts for 8% of total energy used for space heating - rest comes from fossil fuels. ** Electricity accounts for 25% of total energy used for water heating.

Energy Statistics
6 Source : Schweizerische Elektrizitätsstatistik 2012, BFE
Industry
Aggriculture
Services
Transportation
Change in Electrical Energy usage in Switzerland over the last two decades
Residential sector has shown a significant rise in consumption – part of this has been attributed to population growth and partly to increase in per-head consumption.
Year
Ener
gy in
GW
h
Residential

7 Image source : www.Wikipedia.org
The Heterogeneous Grid

1. Peak Load
8

The Load Curve
9
00:00 06:00 12:00 18:00 00:00
Time of day
Load
The load curve as seen by the electricity supplier is a result of stochastic processes!

Peak Load
10 Source : Schweizerische Elektrizitätsstatistik 2012, BFE
Load curve for the year 2012 Lo
ad
Peak Load
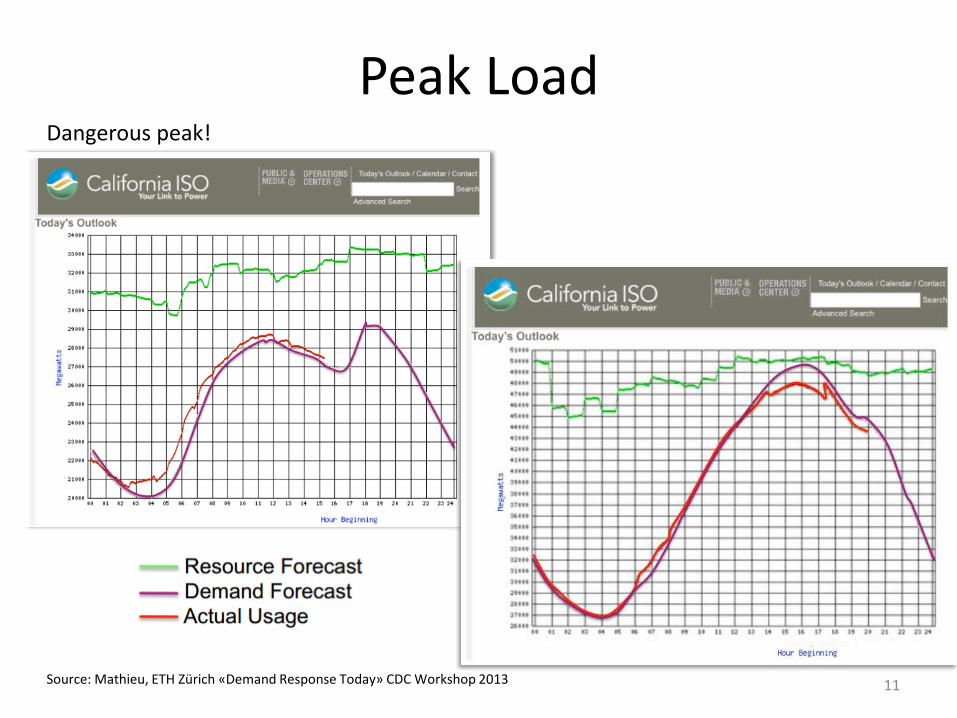
11 Source: Mathieu, ETH Zürich «Demand Response Today» CDC Workshop 2013
Dangerous peak!

Catering for Peak Load
12 Image source : www.Wikipedia.org
Generation capacity needs to be sized for peak-load. This results in redundant capacity (nearly 50% in the U.K., for example)
Distribution grid needs to be sized for peak-load. Also, makes energy economics sub-optimal.
Below optimum operation of the generator due to part capacity.
Where are we?
13
Peak Load Reduction in consumption Problems
Demand Side Management (DSM)
Improved feedback Approach
Dynamic Pricing, Load Control
Appliance level data Tools
SmartMeters Technologies Ripple Control Energy monitors
Smart Thermostat
In-Home displays

2. Demand-Side Management
14

15
Demand Side Management
Demand Response
On Event By Pricing
Reliability Economics
Direct Load Control Reserves
Critical Peak Pricing (CPP)
Time-of-Use (TOU)
Real Time Pricing (RTP)
Energy Efficiency
Adapted from “Demand Response Measurement & Verification”, AEIC, 2009

Demand Response
16 Adapted from “Demand Side Management: Demand Response, Intelligent Energy Systems, and Smart Loads”, IEEE TRANSACTIONS ON INDUSTRIAL INFORMATICS, VOL. 7, NO. 3, AUGUST 2011

Price Based Demand Response
17 Source: Strombeck et. Al “The potential of smart meter enabled programs to increase energy and systems efficiency: a mass pilot comparison”, ESMIG, 2011
Example: In Kanton Zug – Off-peak tariff = 10 Rp /kWh, Peak = 21 Rp / kWh
Effect of dynamic pricing on residential consumption

Automation to support Dynamic Pricing
18 Image sources: www.orangedove.com www.v-zug.ch www.janitza.com, www.rrtp.comed.com/live-prices/
Many newer household equipments like dishwasher or air-conditioners have the ability to program timed operations.
High end solutions use a logic controller to schedule the operation of pumps, heaters etc. based on pricing signals.
Real-time pricing is not so common in household. Some utilities have started offering it along with switching controllers for air-conditioning and e-car chargers.
https://rrtp.comed.com/live-prices/

Effect of automation on peak clipping
19 Source: Strombeck et. Al “The potential of smart meter enabled programs to increase energy and systems efficiency: a mass pilot comparison”, ESMIG, 2011

Direct Load Control
20
Ripple control (Rundsteuerung) Overlays audio frequency signal on supply Example : EWZ (Zürich) uses 375 and 1600 Hz with “Decabit” encoding (detailed information in www.rundsteuerung.de)
+ Simple, proven technology - No feedback - Limited granularity of control - Limited data content
Direct appliance control Limited to using ripple control, proprietary radio signals - Very limited technology options!
SmartThermostat Based on openADR specification (ecobee, Honeywell) for implementation in California. + Strong data exchange schema - Not a widely known or accepted standard
Image Source: www.wikipedia.org
Image Source: www.ecobee.com
Source: Landis & Gyr, Switzerland

Rebounds can be terrible!
21 From: Fuller et al “Modeling of GE Appliances in GridLAB-D:Peak Demand Reduction”, U.S Department of Energy, 2012
Automated Demand Response needs to be Smart! (Adaptive, collaborative, intelligent appliance level algorithms..)

Technology support for DSM
22
HAN
The Home Area Network (HAN) LAN, WiFi, Homeplug, Z-wave, openHAN, ZigBee..? Application protocol openADR, ZigBee SEP, ...? Application protocols need to model user needs and behaviour (like need for override)
Power Line Communication, GSM/GPRS
WAN
SmartThermostats
In-home displays (feedback)
Plug-in Electric Vehicles
Renewables
The Vision
The Problems
internet
Supplier
SmartAppliances

Challenges to Demand Side Management
23
1. Awareness – lack of feedback
2. Lack of usage data
3. Response Fatigue
4. Low potential savings
5. Implemenation cost
6. Lack of standards and interoperability
7. Behavioural issues
The role of DR in the international electricity arena remains rather small, with 2008 peak load reductions reaching an average of just 2.9% in European countries and around 5% in the U.S.*
*Kim, Scherbakova “Common failures of demand response” Energy, 2010 Elsevier

Where are we?
24
Peak Load Reduction in consumption Problems
Demand Side Management (DSM)
Improved feedback Approach
Dynamic Pricing, Load Control
Appliance level data Tools
SmartMeters Technologies Ripple Control Energy monitors
Smart Thermostat
In-Home displays

3. Achieving energy savings in homes
25

How do we achieve energy savings in households?
26
1. Use energy efficient appliances, curtail usage.
2. Provide feedback so that the user adopts energy-efficient behaviour

Energy usage feedback
27
Too less, too much, too late, too simple, too complex, irrelevant, abstract.. ..and rarely right!

Key findings about feedback
28
• provided frequently, as soon after the consumption behaviour as possible. (example: what if you oven told you how much energy was used in baking)
• customized to the household’s specific circumstances.
(example: south facing apartment?)
• provided relative to a meaningful standard of comparison.
(example: compare a family household with the like)
• with appliance-specific consumption breakdown (some studies).
Effective when it is..
From: Armel et al, “Is disaggregation the holy grail of energy efficiency? The case of electricity”, Energy Policy, 52, 2013. Neenan, “Residential Electricity Use Feedback: A Research Synthesis and Economic Framework”, EPRI, 2009 Wess et al, “Evaluating Mobile Phones as Energy Consumption Feedback Devices”, Mobiquitous, 2010

Energy savings – mixed results
29
From: «Ireland’s SmartMeter rollout trial», SEAI, 2011
From: Armel et al, “Is disaggregation the holy grail of energy efficiency? The case of electricity”, Energy Policy, 52, 2013.
SmartMeter deployment in the United States has not resulted in any noticeable reduction in consumption in households. (as of 2011 there were 37 million SmartMeters in operation)

Feedback – the more the better?
30 From: Armel et al, “Is disaggregation the holy grail of energy efficiency? The case of electricity”, Energy Policy, 52, 2013.
Appliance level data has proved to be the key in providing effective feedback.
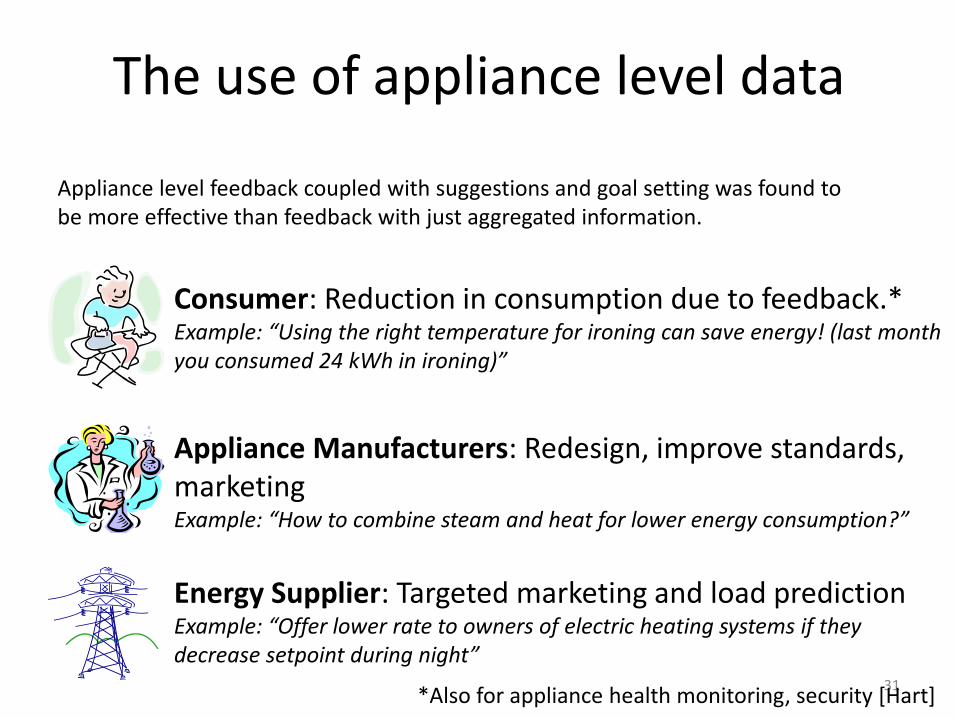
The use of appliance level data
31
Appliance level feedback coupled with suggestions and goal setting was found to be more effective than feedback with just aggregated information.
Consumer: Reduction in consumption due to feedback.* Example: “Using the right temperature for ironing can save energy! (last month you consumed 24 kWh in ironing)”
Appliance Manufacturers: Redesign, improve standards, marketing Example: “How to combine steam and heat for lower energy consumption?”
Energy Supplier: Targeted marketing and load prediction Example: “Offer lower rate to owners of electric heating systems if they decrease setpoint during night”
*Also for appliance health monitoring, security [Hart]

5. Getting appliance level energy data
32

How do we get appliance level data?
33
Intrusive : Measure at each appliance Non-Intrusive: Deduce from total load measurement

Intrusive Monitoring
34
Monitoring at the power outlet
SmartAppliances + The ideal place – the appliance knows its state best! - Hardly any manufacturers - Increased cost - Lack of standards
+ The only available option for end users - Expensive (for complete coverage of appliances) - Difficult to install on modular kitchen appliances - Not available for large currents - Proprietary communication protocols

Non-intrusive Monitoring
35
Most centralized meters provided by the electricity supplier are now some form of electronic devices with some communication interface (but slow) Gradually there is a move towards adopting a more capable hardware (SmartMeters)
Appliance usage can be deduced by observing changes in electromagnetic fields in the home environment.
Sensors around home (light, sound etc.) can be used to deduce behaviour and hence energy consumption.
+

Getting appliance-level data
36
Whole house consumption Something clever
Individual appliance data
Appliance «Signature» On / Off event information
Disaggregation
Non-intrusive appliance load monitoring

Disaggregation
37 Image source : Hart, G., 1992. Nonintrusive appliance load monitoring. Proceedings of the IEEE 80 (12), 1870–1891

Disaggregation
38 Adapted from : Hart, G., 1992. Nonintrusive appliance load monitoring. Proceedings of the IEEE 80 (12), 1870–1891
OFF ON
+1200 W
-1200 W
OFF ON
+250 W
-250 W
Defrost
+50 W
-300W
Low OFF
Med High
+50 W
+50 W
+50 W
-150 W
OFF Dry
+5200 W
-5200 W
Spin
+5000 W
-200W
-5000 W
Toaster Refrigerator
3-way Lamp Clothes dryer
Appliance States

Disaggregation
39
Image source : Hart, G., 1992. Nonintrusive appliance load monitoring. Proceedings of the IEEE 80 (12), 1870–1891 Weiss et. al 2012, Leveraging smart meter data to recognize home appliances. Proceedings of the IEEE International Conference on Pervasive Computing and Communications (PerCom 2012)
“Signature” Types
Steady-State Partly Transient
Power, Current.. Shape, size, duration..
Transient
Frequency spectrum

Disaggregation
40
Monitored parameters – how power vectors help

Disaggregation
41
Where to perform?
On the SmartMeter hardware + Reuse of hardware (processor, memory..) + Measurement data can be sampled in high frequency - Requires firmware to be updated (on existing meters) - Manufacturer specific solution
On a gateway device + Independent of meter manufacturer + Can be upgraded flexibly - Network interface bottleneck for measurement - Not all meters might have high-speed interface
On a Cloud Server + Higher computing power (for more clever algorithms) + Easy to upgrade - Transfer of measurement data over internet - Privacy issues
At the Utility (via WAN) + No internet connectivity required (no additional hardware) - Slow communication channel

Where are we?
42
Peak Load Reduction in consumption Problems
Demand Side Management (DSM)
Improved feedback Approach
Dynamic Pricing, Load Control
Appliance level data Tools
SmartMeters Technologies Ripple Control Energy monitors
Smart Thermostat
In-Home displays

SmartMeter as Gateway
43
Direct Load Control
Information Gateway
Dynamic Pricing
Billing data
Tell utility about participating appliances..
Feedback to consumer, tell utility
about loads..
Pass on information to HAN devices, give feedback to
utility
Customer HAN Supplier WAN
Disaggregation
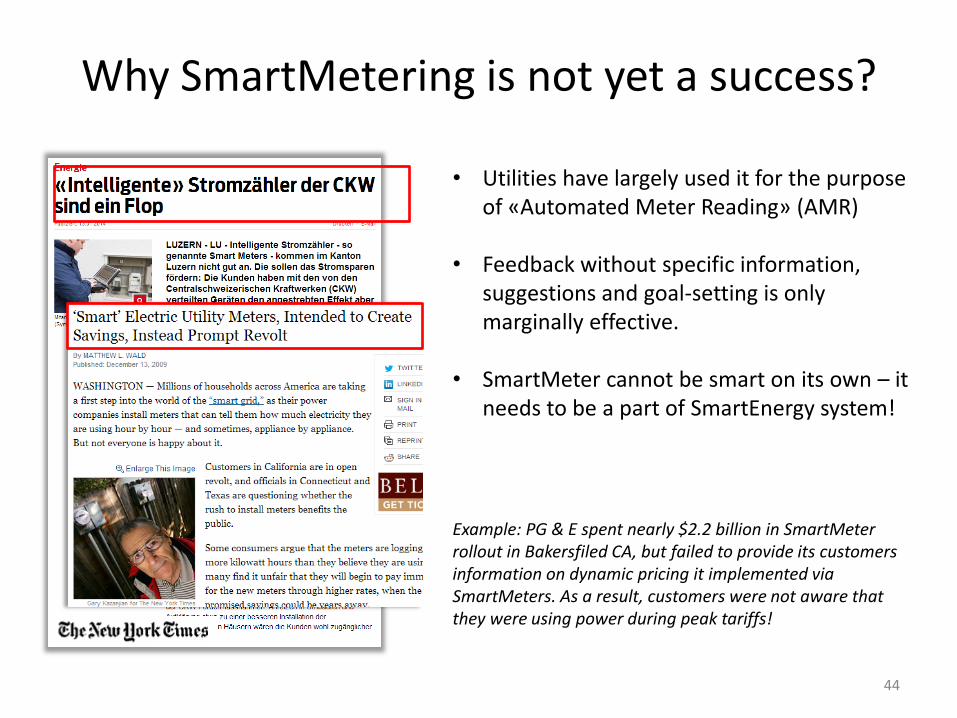
Why SmartMetering is not yet a success?
44
• Utilities have largely used it for the purpose of «Automated Meter Reading» (AMR)
• Feedback without specific information, suggestions and goal-setting is only marginally effective.
• SmartMeter cannot be smart on its own – it needs to be a part of SmartEnergy system!
Example: PG & E spent nearly $2.2 billion in SmartMeter rollout in Bakersfiled CA, but failed to provide its customers information on dynamic pricing it implemented via SmartMeters. As a result, customers were not aware that they were using power during peak tariffs!

Privacy Issues
45

Conclusion
46
Demand Side Management is an interesting mix of energy management and information technology. There is an exciting possibility to achieve energy savings in households by cleverly applying pervasive computing. Existing elements like SmartGrid, SmartMetering and SmartAppliance need to function coherently – which would then lead to the state of SmartEnergy.
If you liked this topic, you might also consider visiting http://www.vs.inf.ethz.ch/res/

We are done!
47
Household electricity consumption
Peak Load – why is it bad?
How utilities deal with it?
Demand Side Management
Technology support for Demand Response
(and the gaps )
How to achieve higher savings? (Appliance-level data)
Non-intrusive Load Monitoring (and Disaggregation)
(Need to know consumption behaviour)
SmartMeter

Backup: Everything Smart
48

Backup: Privacy Issues
49

50

Energy Statistics
51 Source : Schweizerische Elektrizitätsstatistik 2012, BFE
Water heating
Process heating
Lighting
Air-conditioning and Ventilation** Information, Communication and Entertainment
Space heating Others
Transport
Drives and processes*
Electrical Energy usage in Switzerland according to purpose
*Includes washing, drying, freezing, cooling, electrical tools, industrial manufacturing, water purification and agricultural equipment. **Includes cooling for data servers

Energy Statistics
52 Source : Schweizerische Elektrizitätsstatistik 2012, BFE
Wat
er h
eati
ng
Pro
cess
hea
tin
g
Ligh
tin
g
Co
olin
g, V
ent.
I&C
an
d E
nte
rtai
nm
ent
Spac
e h
eati
ng
Oth
ers
Tran
spo
rt
Pro
cess
es
Residential Services Industry Transportation
Electrical Energy usage in Switzerland according to purpose across sectors

53
Spaceheating
Waterheating
Cooking LightingAir-
conditioning
I,C & E Processes Others Total
% increase 19 0.5 5.7 -5.1 16.4 -2.1 13.4 77.8 13.9
-10
0
10
20
30
40
50
60
70
80
90%
incr
ease
in u
se
Change in household consumption between year 2000 - 2012
Energy Statistics

Backup
54
Energy source - households
Space heating
Water heating

Energy Statistics
55
Electrical Energy usage in the U.S.A in residential sector

Storage
56
Centralized Storage – Pumped Storage
Source : www.thehea.org

Storage
57
Centralized Storage – Compressed air
Source : www.eon.com

Storage
58
Centralized Storage - Batteries
Source : www.eon.com

Storage
59
Centralized Storage – Power-to-Gas
Source : EnBW AG – www.enbw.com
Renewables
Gas power plant
Electrolyser Feed station for
renewables
Hydrogen
Storage tanks
Natural Gas
Natural Gas
Methane produced by combining
Hydrogen and CO2
Households
Heating plant

Storage
60
Distributed Storage
Source : EnBW AG – www.enbw.com
Using Plug-in Electric Vehicles (PEVs) Battery (Li-ion) Storage (also coupled with solar generation)
+ Can be used to improve quality of supply - Expensive - Needs to have intelligent charging method and tariff plans

Storage
61 Source : EnBW AG – www.enbw.com
Sto
rage
eff
icie
ncy
(%
)
Large Intermediate End-user
PHS: Pumped hydraulic storage CAES: Compressed air energy storage A-CAES: Adiabtic compressed air storage ETES: Electro-thermal energy storage VRB: Vanadium redox battery SMES: Superconducting magnetic energy storage
Storage is not only expensive, but also inefficient

Redistributing the peak
62 Image source : www.Wikipedia.org
Encourage consumers to shift their usage – either by price incentive or direct load control (also with some incentive)

63
Residential Air Conditioning
Residential Miscellaneous
Distribution of load causes during the peak period

Demand Response
64 Adapted from “Demand Side Management: Demand Response, Intelligent Energy Systems, and Smart Loads”, IEEE TRANSACTIONS ON INDUSTRIAL INFORMATICS, VOL. 7, NO. 3, AUGUST 2011
Other uses
Helps reduce electricity price by having predictable transactions on the energy markets Helps integrate renewable resources like wind and solar power Improves the grid quality (reliability) Provides flexibility to the supplier

Backup
65

Savings Potential
66
From: Neenan, B.,Robinson,J.,2009.Residential Electricity use Feedback: A research Synthesis and Economic Framework

Influence of harmonics
67
-1,5
-1
-0,5
0
0,5
1
1,5
-0,5
0
0,5
+ -1
-0,5
0
0,5
1
I'=I1 +I5
IL1 I1
I5
Source: Power Systems Training, ABB Limited
Source: www.home-energy-monitoring.com

Backup
68

What exists - Meter to Utility
69
Image source: MOXA AG

Backup
70

Backup
71

Backup: Usage data
72 Source: Amphiro AG

Backup: Communication infrastructure for AMR
73
Image source: www.linuxgizmos.com
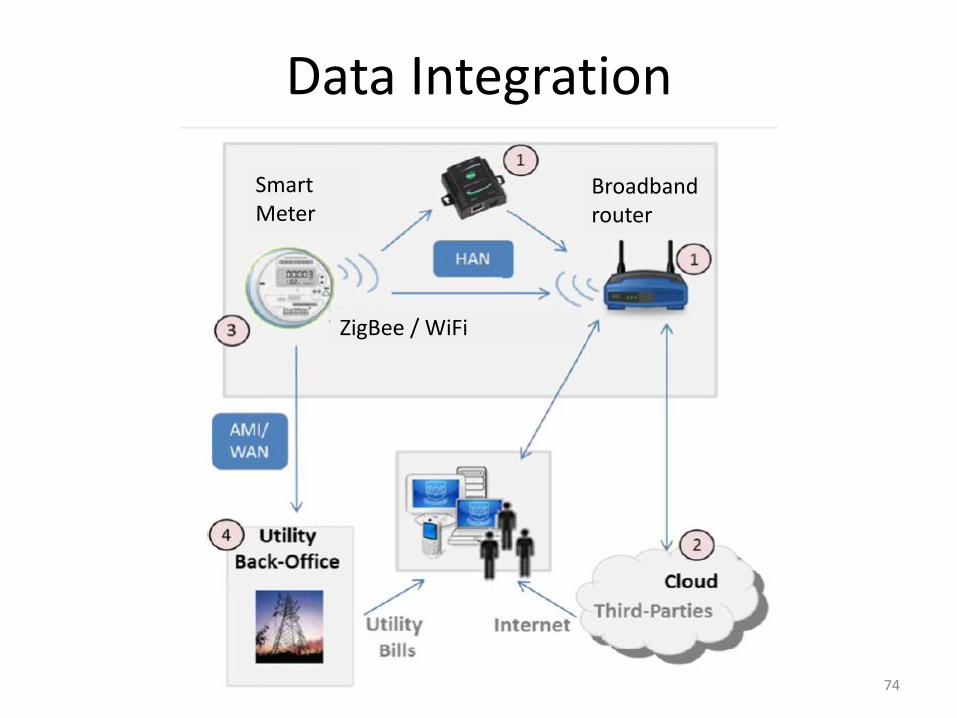
74
Smart Meter
ZigBee / WiFi
Broadband router
Data Integration

Meter to Utility via internet
75 Image source: www.neuhaus.de

Energy savings – types of feedback
76
From: Neenan, B.,Robinson,J.,2009.Residential Electricity use Feedback: A research Synthesis and Economic Framework

Disaggregation
77
Monitored parameters
Current + Voltage Real and Reactive Power Electromagnetic emissions Appliance states Power line harmonics Environmental data Behavioural data (context, opportunistic sensing)

Disaggregation
78
Frequency of measurement
Note: Improve the slide with better graphics, or move to backup!

Disaggregation
79 Image source : Hart, G., 1992. Nonintrusive appliance load monitoring. Proceedings of the IEEE 80 (12), 1870–1891
Frequency of measurement
Monitored parameters
Measurement resolution
Performance
Number of appliances detected Fraction of power explained Accuracy of power measured
Factors influencing the algorithm
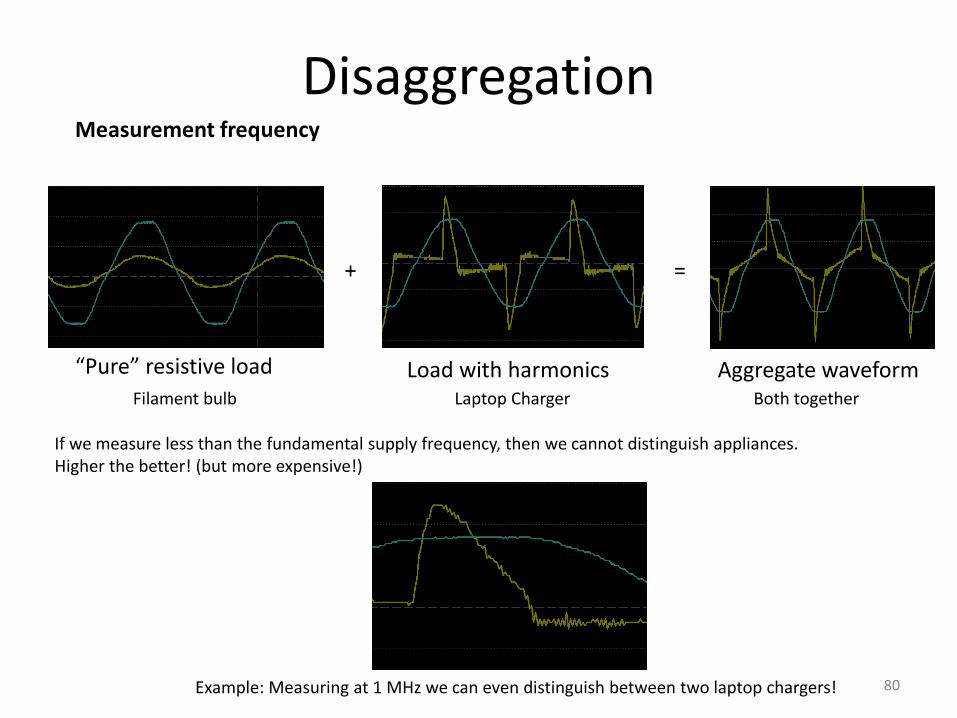
Disaggregation
80
Measurement frequency
“Pure” resistive load Load with harmonics Aggregate waveform Filament bulb Laptop Charger Both together
+ =
If we measure less than the fundamental supply frequency, then we cannot distinguish appliances. Higher the better! (but more expensive!)
Example: Measuring at 1 MHz we can even distinguish between two laptop chargers!

Disaggregation
81
Frequency of measurement – spectral analysis
Almost prohibitive cost of hardware, but high resolution data – can even distinguish between two CFL lamp of same type!

Disaggregation
82
Algorithms
• Recognizing state changes (clustering) and then matching it to a library content • Machine learing, sparse coding • Neural algorithm • ...

Disaggregation
83
Signature Training

SmartMeter
84

Backup: Energy 2050
85 Source : Energiespeicher für die Schweiz Endbericht, KEMA 2013

86
"There is nothing wrong with your thermostat. Do not attempt to adjust the temperature. We are controlling your power consumption. If we wish to make it hotter, we will turn off your air conditioner. If we wish to make it cooler, we will turn off your heater. For the next millennium, sit quietly and we will control your home temperature. We repeat, there is nothing wrong with your thermostat. You are about to participate in a great adventure. You are about to experience the awe and mystery which reaches from the inner mind to... SACRAMENTO!"*
[http://www.americanthinker.com/2008/01/who_will_control_your_thermost.html]
Direct Load Control (DLC) + user acceptance * 2008 update to California’s Building Standard (Title 24) required new homes and retrofitted homes to install programmable communicating thermostats (PCTs), which receive wireless signals allowing utilities to control temperature during grid emergencies Public outcry!
*Source: Mathieu, ETH Zürich «Demand Response Today» CDC Workshop 2013

87

The next 40 minutes...
88
Household electricity consumption
Peak Load – why is it bad?
How utilities deal with it?
Demand Side Management Energy Storage (and why its not sufficient)
Technology support for Demand Response
(and the gaps )
How to achieve higher savings? (Appliance-level data)
Non-intrusive Load Monitoring (and Disaggregation)
(Need to know consumption behaviour)
SmartMeter
1
2
3
4
5
6
7 8