smart cuts? public spending on children’s social care · 2014-09-09 · smart cuts? public...
TRANSCRIPT

Smart CutS?Public spending on children’s social care
A report produced by the Chartered Institute of Public Finance and Accountancy (CIPFA) for the National Society for the Prevention of Cruelty to Children (NSPCC)

© NSPCC 2011. You may use this publication for your own personal, non-commercial use and otherwise in accordance with the Copyright Designs and Patents Act 1988 only. No part of this publication may otherwise be copied or reproduced without prior written permission. NSPCC is a registered trade mark. All rights acknowledged and reserved. Whilst we have made every effort to ensure the accuracy of this publication, we cannot guarantee it and you should not rely on the contents of this publication.
Registered charity numbers 216401and SC037717.
About CIPFACIPFA is the professional body for people in public finance and champions high performance in public services. It has also collected and published data about local public services for over a century and is the leading independent source of information relating to the public sector.
About the NSPCCThe NSPCC is the UK’s leading charity specialising in child protection and the prevention of cruelty to children. The NSPCC aims to end child cruelty in the UK by seeking to influence legislation, policy, practice, attitudes and behaviours for the benefit of children and young people. This is achieved through a combination of service provision, campaigning, lobbying and public education.

ContentS
Preface 4
Key findings 5
Introduction 7
notes on the methodology and data 8
Chapter 1: Current levels of spending on children’s social care in england and Wales 11
Chapter 2: Breakdown of spending on children’s social care, 2009–10 15
Chapter 3: trends in spending patterns on children’s social care, 2001–11 20
Chapter 4: What does the future hold? 38
Conclusions 44
appendix 1: Local authority spending on children’s social care, 2010–11 and 2011–12 45
3

Preface
That children’s services are facing cuts in funding this year is hardly news. Yet surprisingly little is known about the extent and nature of the spending reductions currently being implemented across Britain. Most available evidence is based on snapshot surveys; much is anecdotal. But it suggests that decisions are being made very rapidly, in isolation and with almost no debate about the consequences.
The available evidence also tells us that children’s services have been hit disproportionately by spending cuts and that local authorities have had to face up to a wide range of responses – from freezing pay to closing services and everything in between.1 Cuts to children’s services of around 13% have been reported.2 The message from the front-line is that Councils are trying to avoid closing services for children wherever possible, especially in child protection where local authorities have statutory responsibilities to fulfil. As a result, cuts are inevitably falling on preventative services, universal services are being scaled back or targeted on the most vulnerable and ‘non-essential’ functions such as monitoring and quality assurance are particularly at risk.
In commissioning this report the NSPCC set out to achieve three things. First, we sought to put the current spending cuts into a wider context of the spending patterns of the last decade. It is worth remembering that, striking though today’s cuts are, they come on the back of a decade of steadily increasing investment in children’s social care. Will the current cuts take us back to the spending levels of a decade ago, or just back a few years? The evidence suggests that the latter is more likely.
We also set out to ask whether the spending patterns were uniform across local authorities in England and Wales. This report reminds us that while every local authority increased its spending on children’s services over the last decade and now faces a relative period of retrenchment, not every local authority has followed an identical path. Particularly striking is the divergence in the approach of local authorities in England and Wales in the coming year and the evidence that the cuts will be deepest among local authorities with the highest proportion of looked after children.
Finally we set out to ask where the cuts are likely to fall and what the implications might be. Rather than debate whether or not funding should be cut, we felt it more important to ask whether the right cuts are being made. In the context of rising demand for child protection services, local authorities face the monumental challenge of achieving more with less. How they rise to this challenge – rather than the absolute level of funding – will be the most important determinant of the effectiveness of our child protection system for years to come. In this context some of the evidence presented here makes for sober reading. Cutting away the services that prevent children from entering the child protection system may prove to be a false economy, with costly consequences for children and the state alike.
Andrew Flanagan, Chief Executive, NSPCC
1 Youth Services and Children’s centres worst hit as cuts average 13 per cent in one year, Children and Young People Now, 25 January 2011; Children’s Services achieve ‘fastest’ council cuts, Children and Young People Now, 7 July 2011.
2 ibid.
4

Key fIndIngS
Cutting fast and deep• Children’s social care spending3 in England is expected to be reduced by an average of 24%
in 2011–12 – this is significantly more than the overall real-terms reduction in local government spending of around 10%, and more than the budget reductions for most other local authority services. For example, adult social care spending was projected to fall in 2011–12 by less than 2%.
• The cuts are most apparent in English urban areas and those authorities that have a high proportion of looked after children. Seven councils plan to reduce this spending in 2011–12 compared with the previous year by over 40% and a further 38 plan to shrink their children’s social care budgets by over 30%.
• In contrast to England, a number of Welsh councils have actually increased their children’s social care budgets for 2011–12, and this spending is only projected to fall by 1.96% in Wales as a whole. This is partly because local government grants are set to fall by significantly more in England than in Wales over the next three years (27% rather than 7.1%). This suggests that Welsh councils will be able to spend much more on children’s social care than their English counterparts in the future.
• Services focused on prevention, such as Sure Start,4 are particularly vulnerable to cuts. This will further shift the balance of spending away from prevention; in 2010–11 broadly speaking three-quarters of all expenditure on children’s social care by English councils was on protection services, as opposed to prevention. In the aftermath of the Peter Connelly case spending on commissioning, social work, safety and child protection rose sharply, reversing a previous trend of convergence in the levels of spending on prevention and protection services.
on the back of a significant increase in spending• Spending on children’s social care rose steadily throughout the last decade, peaking in 2009–10
at £8.54 billion across England and Wales. This equates to just over £650 for each 0–19 year-old, compared with £357 in 2001–02.
• A large part of this increase can be attributed to the introduction of Sure Start funding in England. These grants are no longer ring-fenced and therefore spending on these services is more likely to fall over the Spending Review period.
• Projected spend on children’s social care for 2010–11 totalled £8.14bn (£620 per young person), but it was set to fall sharply to £6.28bn in 2011–12. This means that 2011–12 expenditure will equate to £478 for every 0–19 year-old, slightly below the level in 2005–06.
3 For the purposes of this report, ‘children’s social care’ incorporates the following services: young people’s services; youth justice; looked after children; fostering; young people’s safety; preventative services; child protection; family support services; adoption and guardianship; social care strategy; commissioning and social work; Sure Start (England), and; other children’s and families services. Note that this excludes education, the NHS, criminal justice system, police and fire services, and also services for asylum seekers.
4 Sure Start is an initiative in England. In Wales some services for young children are funded through the Cymorth and Flying Start initiatives but they have been excluded from our analysis as we were unable to obtain the relevant data.
5

the future• Cuts in future years are unlikely to be as deep as they have been in 2011–12 – otherwise councils
will soon be unable to deliver statutory services to young people, particularly if the number of looked after children continues to increase. Instead, authorities will need to make reductions in other areas to balance their budgets.
• Deep cuts to discretionary early intervention services may lead to a further increase in the numbers of children in need and looked after. The knock-on effect of this would be increasing demands on statutory protection services, which would force authorities to divert even more funding away from prevention. This could put additional young people at risk, increase the numbers of children who are in need or looked after, and result in further cuts to discretionary prevention budgets.
the implications• While cuts in spending are currently commonplace in all public services, the sheer pace of change
in spending on children’s social care in some local authorities is of concern. It is hard to imagine that mistakes won’t be made in the face of cuts of 40% to some children’s social care budgets.
• Cutting preventative services may prove costly if it is not done very carefully. If cuts to preventative services result in more children becoming in need, child protection costs could spiral.
• Local authorities can not continue as they are in the face of rising demand for child protection services and reduced resources. More effective interventions and smarter investment are both required.
6
Smart Cuts? Public spending on children’s social care

IntroduCtIon
The 2010 Spending Review set out how the Government intended to cut total public spending by 19% in real terms (a total of £81bn) between 2010–11 and 2014–15. This followed many years of significant growth in public expenditure: between 2004 and 2007 it grew by just over 4% per annum in real terms, whilst it increased by around 2% a year between 2007 and 2010.
Children’s social care services5 were a major beneficiary of these previous increases: between 2001–02 and 2009–10, English and Welsh councils’ spending on these services almost doubled in real terms – from £4.66 billion to £8.54 billion in 2010 prices. However, although the Spending Review promised that education budgets would not be cut as deeply as those of other services (spending on schools will essentially be frozen during the four-year period), central government grants to local authorities will be reduced by 28% in real terms. In addition, the vast majority of ‘ring-fences’, which specified that council grants must be spent on a particular service, have been removed. As a result, local authorities will have more freedom to decide how to allocate their resources – but a lot less money to spend overall. The net result is likely to be a significant drop in children’s social care spending over the coming years.
This report tracks the rise in spending on children’s social care over the last decade in England and Wales, highlights how it is predicted to fall in 2011–12, and projects how this downward trend might develop in future years. Finally, it estimates how spending reductions (particularly in early intervention) might affect the overall demand for and cost of children’s services over the medium term.
It is important to note that the report only analyses the actual and potential levels of spending on children’s social care (the inputs into the service), and makes no attempt to judge how outputs or outcomes have been or will be affected as a result. In short, we cannot be sure that cuts in spending will result in equivalent reductions in levels or quality or services, or exactly what the impact on children and families will be. However, the extent and pace of the proposed cuts will almost certainly have a major affect on the welfare of children and young people, as well as other public services and wider society.
5 For the purposes of this report, ‘children’s social care’ incorporates the following services: young people’s services; youth justice; looked after children; fostering; young people’s safety; preventative services; child protection; family support services; adoption and guardianship; social care strategy; commissioning and social work; Sure Start (England), and; other children’s and families services. Note that this excludes education, the NHS, criminal justice system, police and fire services, and also services for asylum seekers.
7

noteS on the methodoLogy and data
The analysis is based on spending data submitted by English and Welsh councils to the Department for Communities and Local Government and Welsh Assembly Government respectively. These submissions highlight how much money each authority spends against a series of budget headings that are set out in CIPFA’s Best Value Accounting Code of Practice (BVACOP) Service Expenditure Analysis.6
The figures for what was actually spent in 2010/11 and 2011/12 (the ‘outturn’ data) have not yet been published – nor approved by external auditors at the time of writing – and therefore our calculations for these years have used projected spending totals that local authorities included in their Revenue Account (RA) submissions. The 2011–12 RA returns have not been broken down into specific budget lines, and this detailed information is also not yet available for Welsh councils for 2010–11. Therefore, we have based our overall analysis on the total forecast spending for both of these years, although used the broken-down English figures for 2010–11 where applicable.
All spending quoted in the report is in 2010 prices, with figures re-calculated using the June RPI measure for each year.7 These RPI calculations are set out in Table 1.
Table 1: Retail price index, 2001–2011
Year 2001 2002 2003 2004 2005 2006 2007 2008 2009 2010 2011
RPI 1.8% 1.7% 2.9% 3% 2.8% 3.2% 4.3% 4% –0.5% 4.6% 5%8
Unsurprisingly, spending by local authorities varies considerably according to the size and characteristics of the population they serve. For the purposes of this report, and to identify how spending trends vary by type of authority, each authority has been placed into one of 15 comparator groups, which are detailed in Table 2.9 The English groupings are based on a tool on the Department for Education (DfE) website that can be found at http://www.education.gov.uk/rsgateway/DB/STA/t000712/index.shtml. The Welsh
6 Authorities may allocate different responsibilities to various service departments or have different budgetary systems, and therefore it could be the case that some of the spending data do not represent a true picture of the resources that are allocated to children’s social care. Nonetheless, this report is based on local authorities’ own official financial outturn data and estimates, rather than anecdotal information or non-binding survey responses.
7 The RPI (retail price index) measure of inflation is calculated on a monthly basis by the Office of National Statistics (ONS). The ONS identifies price rises in a “shopping basket” of over 650 goods and services, the contents and weightings of which are adjusted annually. RPI differs from the Consumer Price Index (CPI), in that includes housing costs such as Council Tax and mortgage rates.
8 Note that the 2010 Spending Review assumed an RPI figure for 2011 of 2.95%, and this figure is used occasionally in Chapter 4 when discussing future projections – where this is the case it has been clearly signposted. The 5% figure, which has been adopted for the vast majority of this report, looks to be more accurate at the time of writing (September 2011).
9 For the purposes of simplicity, we have used the pre-2009 local authority boundaries in England. Therefore figures relating to the new unitary councils of Central Bedfordshire and Bedford, and of Cheshire East and Cheshire West and Chester, have been incorporated into analyses of the former county councils of Bedfordshire and Cheshire respectively. Similarly, figures for the Isles of Scilly have been added to the total for Cornwall.
8

groupings are based on a tool developed by the Local Government Data Unit in Wales, which is available via http://www.dataunitwales.gov.uk/ComparableAuthorities.asp.10
These groups of councils were then ranked in order of the percentage of young people living in the area who were in the care of the local authority in 2010. This provides a proxy indicator for the likely workload of children’s social services departments. We have also named each group after the authority where the proportion of young people in care was closest to the average for the group. The groupings are set out in Table 2.
Table 2: Local authority comparator groups identified for the report
Group 1: IslingtonAverage number of looked after children per 1,000 young people: 8.27
Group B: NewcastleAverage number of looked after children per 1,000 young people: 8.02
Group C: TorfaenAverage number of looked after children per 1,000 young people: 7.64
CamdenHackneyIslingtonLambethLewishamManchesterNewhamSouthwarkTower HamletsWaltham Forest
GatesheadHaltonHartlepoolKingston-upon-HullKnowsleyLiverpoolMiddlesbroughNewcastle-upon-TyneSalfordSouth TynesideSt HelensSunderland
CaerphillyCarmarthenshireFlintshireGwyneddMerthyr TydfilNeath Port TalbotPowysRhondda Cynon TaffSwanseaTorfaenWrexham
Group D: CardiffAverage number of looked after children per 1,000 young people: 6.73
Group E: PeterboroughAverage number of looked after children per 1,000 young people: 6.68
Group F: WolverhamptonAverage number of looked after children per 1,000 young people: 6.68
Blaenau GwentBridgendCardiffCeredigionConwyDenbighshireIsle of AngleseyMonmouthshireNewportPembrokeshireVale of Glamorgan
Barking and DagenhamBoltonBradfordCoventryDerbyKirkleesNottinghamOldhamPeterboroughRochdaleTelford and WrekinWalsall
BirminghamBlackburn with DarwenCroydonEnfieldHarrowHillingdonHounslowLeicesterLutonSandwellSloughWolverhampton
10 The DfE model incorporates a weighted system of 25 different indicators that cover characteristics such as ethnicity, population density, the number of children eligible for free school meals and the prevalence of single parent families. The Welsh authorities were grouped according to their scores against a basket of five indicators: the number of pupils who gained 5 or more A*– C grades; the number of looked after children; the number of people on the child protection register; the level of child poverty (measured as the proportion of children in the population living in families claiming income support and income-based job seekers allowance); and teenage conception rates.
9
notes on the methodology and data

Group G: DoncasterAverage number of looked after children per 1,000 young people: 6.64
Group H: Portsmouth Average number of looked after children per 1,000 young people: 6.55
Group I: BrentAverage number of looked after children per 1,000 young people: 5.90
BarnsleyBlackpoolDoncasterDudleyIsle of WightNorth East LincolnshireRedcar and ClevelandRotherhamStoke-on-TrentTamesideTorbayWigan
Bath and North East SomersetBrighton and HoveBristolLeedsPlymouthPortsmouthReadingSheffieldSouthamptonSouthend-on-SeaYork
BarnetBrentCorporation of LondonEalingGreenwichHammersmith and FulhamHaringeyKensington and ChelseaRedbridgeWandsworthWestminster
Group J: WakefieldAverage number of looked after children per 1,000 young people: 4.94
Group K: EssexAverage number of looked after children per 1,000 young people: 4.38
Group L: HerefordshireAverage number of looked after children per 1,000 young people: 4.01
BuryCalderdaleDarlingtonDurhamLancashireNorth TynesideNorthumberlandNottinghamshireSeftonStockton-on-TeesWakefieldWirral
BedfordshireBexleyEssexHaveringKentMedwayMilton KeynesNorthamptonshireSolihullStockportThurrockTrafford
Cornwall CumbriaDerbyshireDevonHerefordshireLincolnshireNorfolkNorth LincolnshireSomersetStaffordshireSuffolk
Group M: PooleAverage number of looked after children per 1,000 young people: 3.89
Group N: East RidingAverage number of looked after children per 1,000 young people: 3.64
Group O: SuttonAverage number of looked after children per 1,000 young people: 3.25
BournemouthDorsetEast SussexGloucestershireHampshireNorth SomersetPooleShropshireSouth GloucestershireSwindonWest Sussex
BuckinghamshireCambridgeshireCheshireEast Riding of YorkshireLeicestershireNorth YorkshireRutlandWarringtonWarwickshireWest BerkshireWiltshireWorcestershire
Bracknell ForestBromleyHertfordshireKingston-upon-ThamesMertonOxfordshireRichmond-upon-ThamesSurreySuttonWindsor and MaidenheadWokingham
10
Smart Cuts? Public spending on children’s social care

ChaPter 1: Current LeveLS of SPendIng on ChILdren’S SoCIaL Care In engLand and WaLeS
This chapter looks at current levels of spending on children’s social care11 in England and Wales, focusing particularly on the comparator groups identified on pages 9 and 10.
In 2009–10, spending on children’s social care, including grants for Sure Start in England, peaked at £8.54 billion. This equated to just over £650 for each 0–19 year-old. Projected spend for 2010–11 totalled £8.14bn (£620 per young person), but it was then predicted to drop sharply to £6.28bn in 2011–12 – or £478 for every young person. This means spending on children’s social care in England is projected to fall by an average (mean) of 24% in 2011–12 (the median reduction is 22.8%), and will be at a level slightly below that of the 2005–06 financial year.
Table 3 shows how this compares with a selection of other local authority services (for England only), and highlights that only planning and development services face a larger percentage budget cut than children’s social care in 2011–12. Details of 2011–12 children’s social care spending projections for all authorities in England and Wales, along with the real-terms cuts these amount to since 2009–10, are available in the appendix.
Table 3: Projected spending cuts for 2011–12 across local authority services in England (2010 prices)
Projected spend 2010–11 (£m England)
Projected spend 2011–12(£m England)
Cut in spending(£m England)
Cut in spending(% England)
Education12 45,965 40,852 5,113 11.12
Adult social care 14,439 14,153 286 1.98
Police 12,165 11,248 917 7.54
Children’s social care 7,735 5,883 1,852 23.95
Environmental & regulatory services
5,505 5,067 437 7.95
Culture & leisure 3,391 2,906 485 14.31
Housing 2,736 2,211 525 19.19
Fire & rescue 2,284 2,113 171 7.47
Planning & development 2,057 1,328 729 35.45
Total 105,164 94,529 10,634 10.11
11 For the purposes of this report, ‘children’s social care’ incorporates the following services: young people’s services; youth justice; looked after children; fostering; young people’s safety; preventative services; child protection; family support services; adoption and guardianship; social care strategy; commissioning and social work; Sure Start, and; other children’s and families services. Note that this excludes education, the NHS, criminal justice system, police and fire services, and also services for asylum seekers.
12 Education spending covers spending on schools and also on local authority support services for schools.
11
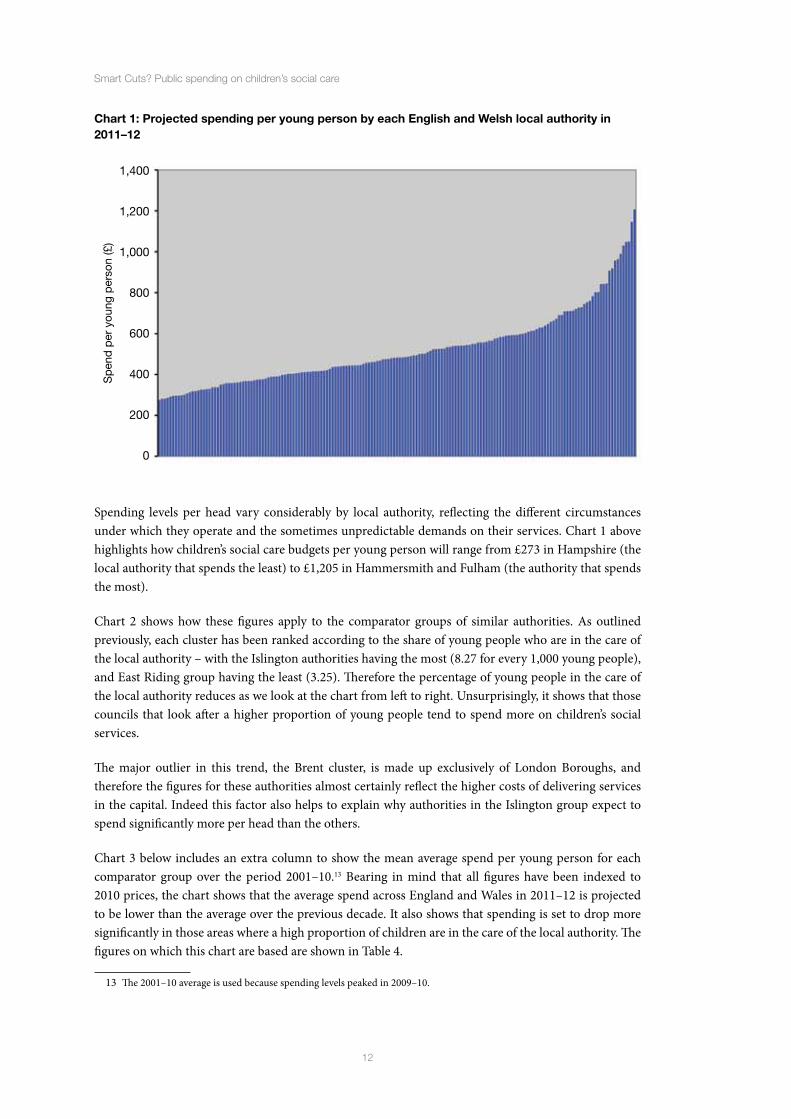
Chart 1: Projected spending per young person by each English and Welsh local authority in 2011–12
Spending levels per head vary considerably by local authority, reflecting the different circumstances under which they operate and the sometimes unpredictable demands on their services. Chart 1 above highlights how children’s social care budgets per young person will range from £273 in Hampshire (the local authority that spends the least) to £1,205 in Hammersmith and Fulham (the authority that spends the most).
Chart 2 shows how these figures apply to the comparator groups of similar authorities. As outlined previously, each cluster has been ranked according to the share of young people who are in the care of the local authority – with the Islington authorities having the most (8.27 for every 1,000 young people), and East Riding group having the least (3.25). Therefore the percentage of young people in the care of the local authority reduces as we look at the chart from left to right. Unsurprisingly, it shows that those councils that look after a higher proportion of young people tend to spend more on children’s social services.
The major outlier in this trend, the Brent cluster, is made up exclusively of London Boroughs, and therefore the figures for these authorities almost certainly reflect the higher costs of delivering services in the capital. Indeed this factor also helps to explain why authorities in the Islington group expect to spend significantly more per head than the others.
Chart 3 below includes an extra column to show the mean average spend per young person for each comparator group over the period 2001–10.13 Bearing in mind that all figures have been indexed to 2010 prices, the chart shows that the average spend across England and Wales in 2011–12 is projected to be lower than the average over the previous decade. It also shows that spending is set to drop more significantly in those areas where a high proportion of children are in the care of the local authority. The figures on which this chart are based are shown in Table 4.
13 The 2001–10 average is used because spending levels peaked in 2009–10.
Sp
end
per
you
ng p
erso
n (£
)
1,400
1,200
1,000
800
600
400
200
0
12
Smart Cuts? Public spending on children’s social care

Chart 3: Average spend between 2001–10 and projected for 2011–12 for each comparator group
Avera
ge
Isling
ton
Newca
stle
Torfa
en
Cardiff
Peter
borou
gh
Wolv
erha
mpto
n
Donca
ster
Portsm
outh
Brent
Wak
efield
Essex
Heref
ordsh
irePoo
le
East R
iding
Sutto
n
1,000
800
600
400
200
0
Average spend per young person across comparator group (£) 2001–10
Average spend per young person across comparator group (£) 2011–12
1,000
800
600
400
200
0
Newca
stle
Torfa
en
Cardiff
Peter
borou
gh
Wolv
erha
mpto
n
Donca
ster
Portsm
outh
Brent
Wak
efield
Essex
Heref
ordsh
irePoo
le
East R
iding
Sutto
n
Isling
ton
Avera
ge
Chart 2: Average projected spend in 2011–12 for each comparator group
Average spend per young person across comparator group (£) 2011–12
13
Chapter 1: Current levels of spending on children’s social care in England and Wales

Table 4: Percentage change in average spend across comparator groups, 2001–10 and 2011–12
Comparator group Average spend per young person across comparator group (£)
Average spend per young person across comparator group (£)
% increase in 2011–12 spending against 2001–10 average
2001–10 2011–12
Islington 896 1,037 –13.6
Newcastle 656 676 –3.1
Torfaen 593 530 11.7
Cardiff 499 537 –7.1
Peterborough 547 576 –4.9
Wolverhampton 530 587 –9.8
Doncaster 514 542 –5.1
Portsmouth 545 595 –8.3
Brent 768 784 –2.2
Wakefield 450 464 –2.9
Essex 424 408 3.9
Herefordshire 389 381 2.2
Poole 373 363 2.6
East Riding 348 336 3.7
Sutton 346 404 –14.2
England and Wales average 448 506 –11.4
As the chart and table show, in four of the five clusters where fewer that 4.5 in every 1,000 young people are looked after (the Essex, Herefordshire, Poole and East Riding groups), spending in 2011–12 will remain above the previous decade’s average. In contrast, in nine of the ten remaining areas (the Islington, Newcastle, Cardiff, Peterborough, Wolverhampton, Doncaster, Portsmouth, Brent and Wakefield groups), spending per head is set to be lower. Since the groups at this end of the spectrum spend significantly more on children’s services, overall expenditure across England and Wales is set to drop – from the 2001–10 average of £506 per young person to around £448 for every 0–19 year-old in 2011–12. Chapter four will discuss some of the implications of this in more detail.
14
Smart Cuts? Public spending on children’s social care

ChaPter 2: BreaKdoWn of SPendIng on ChILdren’S SoCIaL Care, 2009–10
This chapter sets out the latest detailed breakdown in spending for children’s social care. It sets out where money is spent and which local authorities focus their resources in particular ways. This can give us an appreciation of current demand for services and help to predict the effects of the cuts. The figures in this chapter relate to actual spend on children’s social care in England and Wales in 2009–10. Breakdown estimates for English authorities for 2010–11 are available (and we have used them where applicable, although they have not yet been subjected to external audit), but the corresponding Welsh data have not yet been published. Therefore we are not yet in a position to identify exactly which areas of expenditure have been most affected by the budget reductions highlighted in chapter two, although chapter four sets out a number of projections.
All authorities report their spending against a series of budget headings set out in CIPFA’s Best Value Accounting Code of Practice (BVACOP) Service Expenditure Analysis, and these data form the basis of this report. Over the last decade some of the definitions for these headings have changed, and new ones have emerged so that central government is kept informed of how money is being spent on specific activities.14 More detailed definitions for each heading are available on the Department for Education website.15
• Sure Start16 – the figure for this heading is the amount of Sure Start grant the authority received to spend on these services.
• Family support services – this includes direct payments, and spending on respite breaks for disabled children, home care, equipment and adaptations, substance misuse, teenage pregnancy and other family support services.
• Preventative services – this is made up of spending on early intervention initiatives for children aged 5–13 years.17
• Young people’s services – this covers positive activities for young people and youth work.
• Looked after children (LAC) – this incorporates residential care, secure accommodation, respite breaks for looked after disabled children, children placed with family and friends, advocacy and education services for LAC, and support services for young people leaving care. For the purposes of this report it excludes fostering and spending on asylum seekers.
• Fostering – this includes in-house and external provision, and the support provided for foster parents.
14 These data originate from local authorities and we have not sought to validate them or vouch for their robustness. However, the final spending figures for the years up to and including 2009–10 will have been subjected to external audit.
15 The 2009–10 guidance is available via http://media.education.gov.uk/assets/files/doc/b/budget%202009%2010%20to%202010%2011.doc, with budget headings for social care beginning on page 39.
16 Until 2011–12, English councils did not have to specify how much money they spent on Sure Start services, so we have used central government’s grant allocations as the basis for these calculations.
17 Prior to 2007–08 the Department of Health provided Children’s Fund partnerships (not local authorities) with a specific grant to deliver these services. This meant that councils did not have to account for the spending, so we have not been able to obtain this data and use them for analysis.
15

• Adoption and guardianship – this covers the costs of setting up and supporting an adoptive relationship and helping adopted children contact their natural parents. It excludes fostering and any social work costs related to adopted children.
• Child protection – this incorporates planned expenditure on carrying out the authority’s functions under the Children Act 1989 and under section 175 of the Education Act 2002 and other functions relating to child protection.
• Safety – this heading covers the expenditure associated with child death reviews and the local safeguarding children’s board.
• Commissioning and social work – this incorporates social workers’ direct costs for the care of children and the commissioning of services for them, field and hospital social work, children’s and adolescents’ mental health services, occupational therapy, and social work costs associated with child protection.
• Youth justice – this includes spending on secure institutions, youth offending teams and other youth justice services.
• Other children’s and families services – such as grants to other organisations that cannot be grouped under another heading, and spending on counselling and generic services that cannot be classified elsewhere.
• Strategy – this includes spending on the Children and Young People’s Plan, partnership costs and costs associated with operating a central commissioning unit for children’s and families’ services.
Chart 4 below shows the breakdown of total spend in 2009–10 under each of these headings. It shows that services for looked after children accounted for a large share of expenditure – spending on LAC and fostering services constituted 18% and 16% of the overall total respectively. As we might expect, commissioning and social work also takes up a large share (18%) of spending, along with Sure Start (16.5%). The amount of money that was available for Sure Start indicates that many authorities may reduce their budgets for these services in 2011–12 because the funding is no longer ring-fenced.
Chart 4: Breakdown of total spend in England and Wales in 2009–10 by budget heading
Young people’s servicesYouth justiceLACFosteringSafetyChild protectionPreventative servicesFamily support servicesAdoption and guardianshipOtherStrategyCommissioning and social workSure Start (England)
16
Smart Cuts? Public spending on children’s social care

Each of these headings was then categorised as ‘prevention’ or ‘protection’ spending, as set out in Table 5. Although in many cases these classifications are relatively crude (as some protection funded services will be engaged in preventative work and vice-versa), this nevertheless gives us an approximate indication of spending priorities. It shows that three-quarters of total spending in 2009–10 (74.7%) was on protection.18
Table 5: Categorisation of spending by prevention and protection
Prevention spending Protection spending
Young people’s servicesPreventative servicesFamily support servicesOther servicesStrategy
Youth justiceLooked after childrenFosteringSafetyChild protectionAdoption and guardianshipCommissioning and social work
Charts 5 and 6 show how this pattern applies to our Islington and Sutton comparator authority groupings. These charts use the 2010–11 estimates, as both groups contain only English authorities. Since the councils in the Islington group have the highest proportion of looked after children, and those in the Sutton cluster have the lowest, it might be expected that they would have different splits between spending on protection and prevention services – and between individual budget headings within those broad categories.
These charts show some differences – with authorities in the Islington cluster spending a greater proportion of their budgets on young people’s services and fostering, and the Sutton group spending a bigger share on family support services and commissioning and social work. However, when these headings are amalgamated into prevention and protection spending, there is very little difference between the groups. Indeed, 74% of spending in the Islington authorities was on protection with the remaining 26% being allocated to prevention services: the corresponding figures for the Sutton group are 73% and 27%. We might have expected those councils with fewer looked-after children (the Sutton cluster) to have spent a much greater proportion of their children’s social care budgets on preventative services, but this was certainly not the case in 2010–11.
Although this approximate ratio of 3:1 for protection and prevention expenditure is apparent in these comparator groups, and it mirrors the overall national average, there is variation between different authorities in their spending priorities. Haringey, for example, spends the highest proportion of its budget on protection services (86.8%), which is perhaps unsurprising considering legacy of Victoria Climbie and Peter Connelly. Indeed, most of the English authorities that spent a relatively high percentage of their budgets on protection in 2010–11 are urban boroughs – and a number of them have been the subject of high-profile cases in recent years. However, as Tables 6 and 7 show, similar authorities split their spending across prevention and protection services in significantly different ways. For example, Manchester spends 83.92% of its children’s social care budget on protection services, yet Tower Hamlets spends 43.7% on prevention – and both are in the Islington cluster of comparator authorities. Since
18 Note that for the purposes of this exercise, Sure Start grants were excluded, primarily because this spending is difficult to class as either protection or prevention.
17
Chapter 2: Breakdown of spending on children’s social care, 2009–10
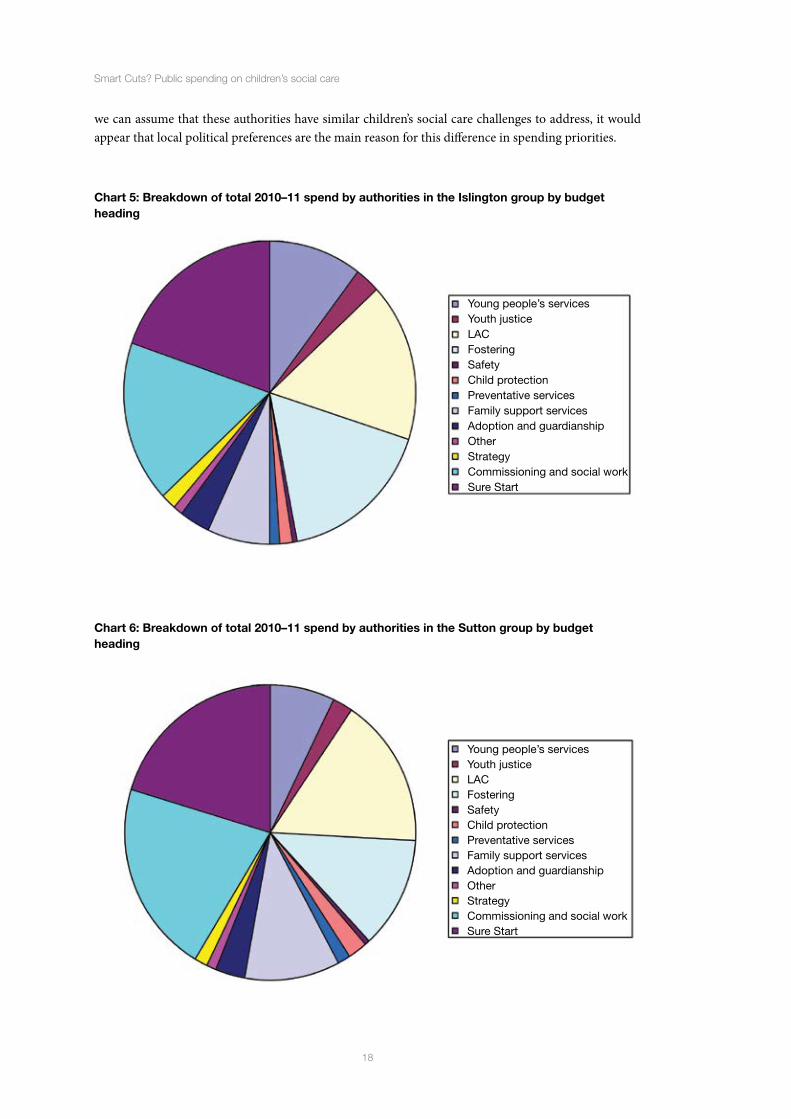
we can assume that these authorities have similar children’s social care challenges to address, it would appear that local political preferences are the main reason for this difference in spending priorities.
Chart 5: Breakdown of total 2010–11 spend by authorities in the Islington group by budget heading
Chart 6: Breakdown of total 2010–11 spend by authorities in the Sutton group by budget heading
Young people’s servicesYouth justiceLACFosteringSafetyChild protectionPreventative servicesFamily support servicesAdoption and guardianshipOtherStrategyCommissioning and social workSure Start
Young people’s servicesYouth justiceLACFosteringSafetyChild protectionPreventative servicesFamily support servicesAdoption and guardianshipOtherStrategyCommissioning and social workSure Start
18
Smart Cuts? Public spending on children’s social care

Table 6: Top ten authorities for percentage spend on protection services
Authority % spend on protection
Haringey 86.8
Wokingham 86.3
Croydon 86.2
Southend-on-Sea 84.9
Barking and Dagenham 84.2
Manchester 83.9
Doncaster 83.2
Telford and Wrekin 83.2
Bromley 82.2
Brighton and Hove 82.0
Table 7: Top ten authorities for percentage spend on prevention services
Authority % spend on prevention
Buckinghamshire 46.9
Halton 46.0
Worcestershire 45.6
Peterborough 45.1
Tower Hamlets 43.7
Derby 43.5
Harrow 42.8
Hackney 41.6
Kingston-upon-Thames 40.8
Corporation of London 40.8
19
Chapter 2: Breakdown of spending on children’s social care, 2009–10

ChaPter 3: trendS In SPendIng PatternS on ChILdren’S SoCIaL Care, 2001–11
trendS By ComParator grouP
The decade 2001–10 saw a steady rise in spending on children’s social care in England and Wales. By 2009–10, spending per young person was almost twice the level of 2001–02 (£652 compared to £357). In almost every authority across England and Wales,19 spending per young person increased during this period. Chart 8 overleaf shows how this increase was relatively steady over the decade, before falling away in 2010–11 and 2011–12. By assessing each of the comparator groups against the overall average, we find that this trend was replicated by most types of authority.
The exceptions are the two groups of Welsh authorities (Torfaen and Cardiff), which differ in several ways. Firstly, their projected spend for 2011–12 is not noticeably lower than for the previous year. This reflects the different spending review arrangements in England and Wales: the Welsh Assembly Government only cut local authority funding by 1.4% in cash terms in 2011–12, and is committed to reducing grants by ‘just’ 7.1% in real terms by 2014–15 – significantly less than the 27% that is planned for England. In addition, Sure Start funding for English councils is no longer ring-fenced, and therefore many authorities are likely to have re-allocated this money to other services. There have been different arrangements for funding services for young children in Wales (Cymorth and Flying Start). Chapter 4 discusses this finding in more detail.
In addition, closer analysis of the spending increase between 2001–02 and 2010–11 shows that some types of authority increased spending by a much larger percentage than others. For example, Chart 7 shows that spending per young person rose least as a percentage in the Islington, Brent and Cardiff clusters. The first two of these are made up almost exclusively of London Boroughs, whilst the Cardiff cluster consists of Welsh authorities. This finding apart, there appears to be no other clear explanation for the pattern: the urban authorities in the Doncaster group experienced the largest percentage increase, but they were followed by the East Riding cluster, in which shire counties predominate.
19 The only exception is the Corporation of London, where spending fell slightly over this period. See page 21 for more information on this outlier.
20
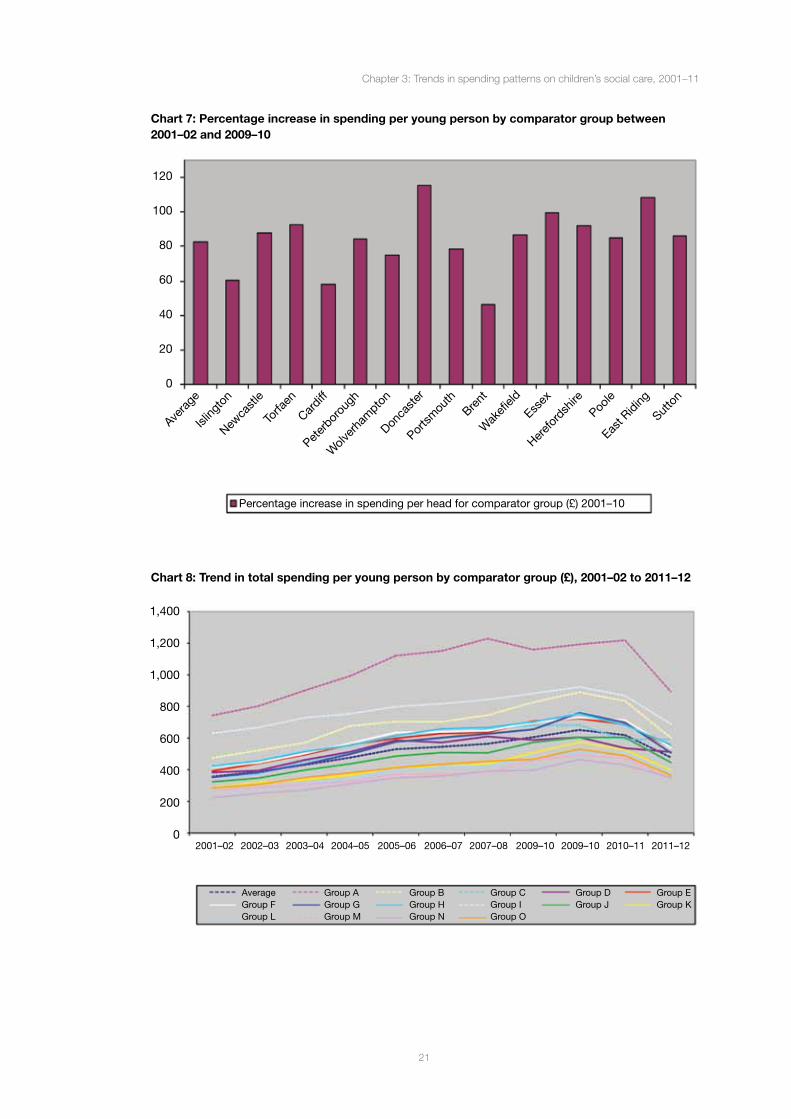
Chart 7: Percentage increase in spending per young person by comparator group between 2001–02 and 2009–10
Chart 8: Trend in total spending per young person by comparator group (£), 2001–02 to 2011–12
1,400
1,200
1,000
800
600
400
200
0 2001–02 2002–03 2003–04 2004–05 2005–06 2006–07 2007–08 2009–10 2009–10 2010–11 2011–12
Average Group A Group B Group C Group D Group E Group F Group G Group H Group I Group J Group K Group L Group M Group N Group O
Avera
ge
Isling
ton
Newca
stle
Torfa
en
Cardiff
Peter
borou
gh
Wolv
erha
mpto
n
Donca
ster
Portsm
outh
Brent
Wak
efield
Essex
Heref
ordsh
irePoo
le
East R
iding
Sutto
n
120
100
80
60
40
20
0
Percentage increase in spending per head for comparator group (£) 2001–10
21
Chapter 3: Trends in spending patterns on children’s social care, 2001–11

trend By LoCaL authorIty
The following charts show how spending increased in each authority across England and Wales, and compares them with the other councils in their group. They show that the vast majority of authorities have a similar pattern of steady growth from 2001–02 onwards, before falling away sharply in either 2010–11 or 2011–12. However, the rate of increase and drop does vary by individual authority and type of council. For example, many urban boroughs predict a more rapid drop in spending in 2011–12 (seven local authorities predict a fall of over 40 per cent), whereas some Welsh councils have actually increased their children’s social care budgets for the current year. The average (mean) drop across England and Wales combined is 22.86%, which represents a significant cut. This compares to real-terms reductions in total local authority spending of just over 10% in English unitary and upper-tier councils, and 4.3% in Wales – see Table 8 below:
Table 8: Planned reductions in total spending and children’s social care in England and Wales, 2011–12 (2010 prices)
2010–11 2011–12 Reduction, 2010–11 to 2011–12
% reduction, 2010–11 to 2011–12
Children’s social care spending (England)
£7.73bn £5.88bn £1.85bn 23.95%
Children’s social care spending per young person (England)
£623 £474 £149
Children’s social care spending (Wales)
£403m £395m £7.9m 1.96%
Children’s social care spending per young person (Wales)
£567 £556 £11
Total local authority spending (England)
£105.2bn £94.6bn £10.6bn 10.11%
Total local authority spending (Wales)
£7.55bn £7.22bn £327m 4.33%
However, the charts also show that budgets in lower-spending authorities (as well as Wales) have not fluctuated as much as in those English councils that spend more on children’s services. It may be the case that these lower-spending areas will be better placed to cope with the retrenchment that has now begun, as they will not have increased the size of their departments, or scope of their services, as much as others.
All authorities in the Islington group (see chart 9) increased their spending on children’s social care between 2001–02 and 2007–08, after which several (notably Southwark, Hackney and Manchester) began to cut back. The following three years saw some fluctuations in spending per head across the group, probably partly due to the fallout from the Peter Connelly case in 2009. However, all councils set budgets for 2011–12 that will entail a significant drop in spending. In Tower Hamlets, children’s social care budgets in 2011–12 will be just over half their 2010–11 size (£45m rather than £81.5m, figures that equate to £781 and £1,417 per young person respectively).
22
Smart Cuts? Public spending on children’s social care

Chart 9: Trend in overall annual spending per young person by authority (£, Islington group)
As chart 10 shows, spending in the Newcastle cluster increased less consistently than it did in the Islington group. In some authorities (notably Hull and South Tyneside) it fluctuated markedly, whereas Hartlepool and Liverpool saw a much steadier increase up to 2009–10. As was the case across most of the groups, every authority predicts a sharp fall for 2011–12. The drop is particularly marked in Halton (where spending per head is set to more than halve from £770 to £372) and Hull (where it will fall from £1,047 to £689). In the case of Halton, it may well be that most of these reductions will be made in prevention services, as it spent the second-highest percentage of its budget on these initiatives in 2011–12 (see Table 4).
Chart 10: Trend in overall annual spending per young person by authority (£, Newcastle group)
1,200
1,000
800
600
400
200
02001–02 2011–12
2001–02 2011–12
2,000
1,800
1,600
1,400
1,200
1,000
800
600
400
200
0
Gateshead Halton Hartlepool HullKnowsley LIverpool Middlesbrough NewcastleSalford South Tyneside St. Helens Sunderland
Camden Hackney Islington Lambeth LewishamManchester Newham Southwark Tower Hamlets Waltham Forest
23
Chapter 3: Trends in spending patterns on children’s social care, 2001–11

Chart 11: Trend in overall annual spending per young person by authority (£, Torfaen group)
Charts 11 and 12, which cover the Welsh authorities, tell a different story – the pattern appears much more uniform and steady than in many other groupings. Compared with the English authorities, most councils in the Torfaen group increased spending by slightly more between around 2003–04 and 2006–07, and in both cases the sharp increase appears to begin a year later than in England. In addition, there is not such a sharp fall predicted for 2011–12, with several authorities in this cluster actually expecting to spend more in the current financial year than the previous one (perhaps partly because many had already made deep cuts in 2010–11). As discussed earlier, this is most likely due to the Welsh authorities not being subjected to such major funding reductions as their English counterparts. Also, in April 2003 Sure Start Wales was amalgamated with the Children and Youth Partnership Fund and the childcare strategy to form a new fund: Cymorth. A further funding stream, Flying Start, was added in 2010/11. The changes being seen in relation to Sure Start funding in England are not mirrored in Wales.
On only three occasions does a single authority appear to have diverged very much from the overall trend: Ceredigion in 2007–08; Caerphilly in 2008–09; and Swansea in 2009–10. Monmouthshire spent markedly less per young person than every other Welsh authority throughout the decade.
Chart 13 shows a much more mixed picture, with Peterborough and Walsall in particular not following the overall pattern. Despite the fact that the group is made up of urban unitaries, metropolitan authorities and a London Borough (and it is therefore similar in this sense to the Newcastle cluster), the predicted drop in spending for 2011–12 is not as steep for most councils. Although Nottingham and particularly Barking and Dagenham will spend a lot less this year, Bolton has increased its budget for children’s services compared to 2010–11.
1,000
900
800
700
600
500
400
300
200
100
02001–02 2011–12
Caerphilly Carmarthenshire Flintshire GwyneddMerthyr Tydfil Neath Port Talbot Powys Rhondda Cynon TaffSwansea Torfaen Wrexham Wales average
24
Smart Cuts? Public spending on children’s social care

Chart 12: Trend in overall annual spending per young person by authority (£, Cardiff group)
Chart 13: Trend in overall annual spending per young person by authority (£, Peterborough group)
A first glance at Chart 14, which tracks the changes in the Wolverhampton cluster, suggests that the spending increase in these authorities has not been significant. However, the chart is skewed slightly by Slough’s spending figure for 2009–10, when spending per young person (at £1,306) was around double the amount spent in both 2008–09 and 2010–11 (£686 and £638 respectively). This anomaly distorts the y-axis to a certain extent, and therefore disguises the gentle upward slope that other authorities followed. Nonetheless, the figures for 2011–12 do not predict as sharp a drop in spending as is expected for other groups: Hillingdon is predicting the largest fall, from £629 to £395 per young person. Harrow expects to spend almost exactly the same this year as last, and Sandwell is actually predicting a small increase.
900
800
700
600
500
400
300
200
100
0
1,200
1,000
800
600
400
200
0
2001–02 2011–12
2001–02 2011–12
Blaenau Gwent Bridgend Cardiff CeredigionConwy Denbighshire Isle of Anglesey MonmouthshireNewport Pembrokeshire Vale of Glamorgan Wales average
Barking and Dagenham Bolton Bradford CoventryDerby Kirklees Nottingham OldhamPeterborough Rochdale Telford and Wrekin Walsall
25
Chapter 3: Trends in spending patterns on children’s social care, 2001–11

The Doncaster authorities are shown in chart 15. This is notable for the fact that spending per young person was very similar in each council. Only Blackpool and Stoke-on-Trent differ markedly from the other councils, with the other lines on the graph packed tightly together for most of the decade. This suggests that these authorities – largely urban unitaries and metropolitan councils – did not have to respond to any sudden developments within their areas, and were able to channel increases in central grants into children’s services budgets.
Chart 14: Trend in overall annual spending per young person by authority (£, Wolverhampton group)
Chart 15: Trend in overall annual spending per young person by authority (£, Doncaster group)
2001–02 2011–12
1,400
1,200
1,000
800
600
400
200
0
2001–02 2011–12
1,200
1,000
800
600
400
200
0
Birmingham Blackburn with Darwen Croydon EnfieldHarrow Hillingdon Hounslow LeicesterLuton Sandwelll Slough Wolverhampton
Barnsley Blackpool Doncaster DudleyIsle of Wight NE Lincolnshire Redcar and Cleveland RotherhamStoke-on-Trent Tameside Torbay Wigan
26
Smart Cuts? Public spending on children’s social care

Chart 16 shows the trends in the Portsmouth cluster. There is much greater variance between the authorities in this group, with the children’s social care budget of the lowest spender (York) being around half that of the highest (Brighton and Hove) throughout the period. Interestingly, this is the case for almost all of the eleven years analysed, which shows that both authorities increased – and then cut – spending by a similar percentage each year. Sheffield bucks the general trend somewhat: it starts from a comparatively low base but was the second-highest spender in the group by 2009–10. All authorities cut their children’s social care budgets in 2011–12, although reductions elsewhere in England are more severe. The steepest drop is from £759 to £589 per young person in Plymouth – this is less than most authorities in the Islington and Newcastle groups, for example.
Chart 16: Trend in overall annual spending per young person by authority (£, Portsmouth group)
Chart 17: Trend in overall annual spending per young person by authority (£, Brent group)
1,200
1,000
800
600
400
200
0
1,600
1,400
1,200
1,000
800
600
400
200
0
2001–02 2011–12
2001–02 2011–12
Bath and NE Somerset Brighton and Hove Bristol LeedsPlymouth Portsmouth Reading SheffieldSouthampton Southend-on-Sea York
Barnet Brent Ealing GreenwichHammersmith and Fulham Haringey Kensington and Chelsea RedbridgeWandsworth Westminster
27
Chapter 3: Trends in spending patterns on children’s social care, 2001–11

The Brent cluster contains the Corporation of London, which has been discounted for the purposes of this chapter.20 The other authorities feature in Chart 17, which is notable for the fact that spending in Haringey did not differ markedly from the overall pattern, in spite of the Victoria Climbie and Peter Connelly cases. As we identified in Table 5 however, the vast majority of Haringey’s spending is on protection services, and therefore the authority may have reacted by re-allocating its prevention budgets towards more urgent priorities. It is also interesting to note that Hammersmith and Fulham’s spending figure for 2010–11: at £1,864 per young person it represents a major spike compared with the previous and subsequent years. Even after cutting spending for 2011–12, this authority remains the highest-spending per young person in the current financial year. Otherwise the authorities in this group follow the overall pattern of a steady upward trend followed by a sudden dip in 2011–12.
Chart 18, which shows the spending for the Wakefield group, also has several data points that do not appear to fit with the trend. Most noticeable is the total for Stockton-on-Tees in 2009–10, when spending plummeted from £620 to £137 per young person. This is almost certainly to do with a change in the way the authority produced its accounts, as several of its budget lines reported zero spending for this year, and the 2010–11 figure reverts to the previous trend. We can therefore treat this single instance as unreliable and discount it from the overall trend.
North Tyneside was clearly the highest spender in this group between 2001–02 and 2007–08, but it then cut budgets whilst other authorities were still increasing theirs, meaning that many others caught it up by the end of the period. Interestingly, Nottinghamshire, Wirral and Wakefield all increased budgets significantly in 2010–11, at a time when other councils began to rein in spending: this may mean that all three authorities will have introduce even deeper cuts in future years to balance the books.
The authorities in the Essex group all began from a similar starting point, spending between £224 and £330 per young person on children’s social care in 2001–02 (see chart 19 overleaf). Within a few years it becomes clear that some (particularly Solihull and Milton Keynes) spend more than others, but by the end of the decade all of the councils (except for Solihull) are grouped closely together once more. It is also noticeable that most authorities in this group do not wait until 2011–12 before cutting expenditure: the majority make reductions in 2010–11 and three (Trafford, Stockport and Thurrock) began to rein in spending in 2009–10.
The Herefordshire group fits with the nationwide pattern, but the upward climb is not as steady for these councils as it is for many others (see chart 20). As with the Brent and Wakefield clusters, expenditure per young person in 2011–12 was budgeted to be broadly similar across the group, in spite of some significant differentiation in the middle of the previous decade.
20 Only around 1,000 young people live in the City, which is approximately one-tenth of the number of 0–19 year-olds in Rutland, the second-smallest authority. This means that the Corporation of London has significantly less scope for the kinds of economies of scale that would be possible at a larger organisation, and therefore has the potential to be a major outlier. Indeed average spending for the City between 2001–02 and 2009–10 was significantly higher than for any other authority in England and Wales. However, it was one of the two authorities that cut their children’s social care budgets by more than half in 2011–12.
28
Smart Cuts? Public spending on children’s social care
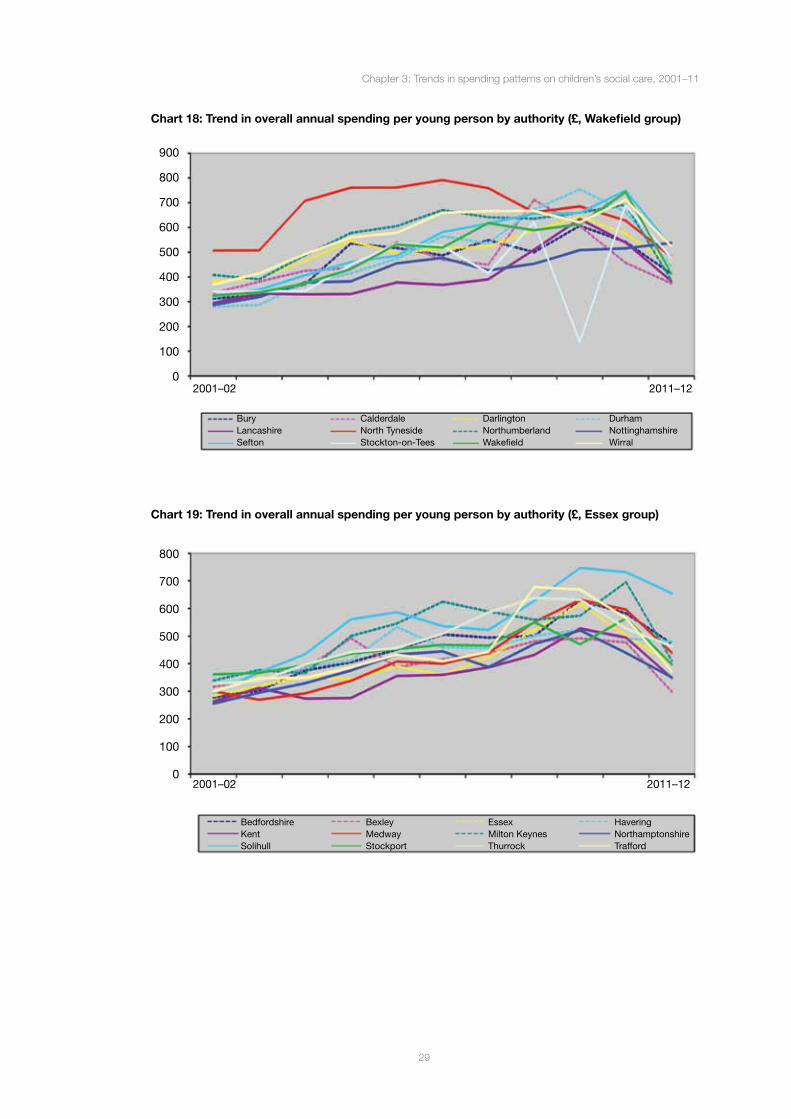
Chart 18: Trend in overall annual spending per young person by authority (£, Wakefield group)
Chart 19: Trend in overall annual spending per young person by authority (£, Essex group)
2001–02 2011–12
2001–02 2011–12
900
800
700
600
500
400
300
200
100
0
800
700
600
500
400
300
200
100
0
Bury Calderdale Darlington DurhamLancashire North Tyneside Northumberland NottinghamshireSefton Stockton-on-Tees Wakefield Wirral
Bedfordshire Bexley Essex HaveringKent Medway Milton Keynes NorthamptonshireSolihull Stockport Thurrock Trafford
29
Chapter 3: Trends in spending patterns on children’s social care, 2001–11

Chart 20: Trend in overall annual spending per young person by authority (£, Herefordshire group)
In the Poole group, Bournemouth is a clear outlier in terms of spending per head throughout the period of analysis (see chart 21 overleaf). Nevertheless, although it has spent much more than the comparator authorities, it experienced the now familiar rise and fall in expenditure over the last decade. This suggests that Bournemouth council may have taken a political decision to spend more per head in this area. Hampshire and South Gloucestershire are the two lowest spenders during the period of analysis, and they also follow this overall pattern.
The East Riding group contains the lowest-spending authorities, and therefore the y-axis in chart 25 accentuates the differences between councils much more than some of the other graphs. It shows there has been some fluctuation (with Buckinghamshire and Warrington both experiencing spikes in spending in 2009–10), but a number of councils have also kept spending relatively constant. For example, West Berkshire’s spending per 0–19 year-old only ranges from £325–£453 during the whole period.
The final set of authorities, the Sutton group, also spent comparatively little per young person over the last 10 years (see chart 23). This is in spite of the fact that it includes five London Boroughs (Merton, Bromley, Richmond and Kingston, in addition to Sutton), and the cost of employing staff and delivering services is much higher in the capital. Most of the authorities within the group follow the overall trend, although one notable outlier is Wokingham. Social care spending fell in this council in 2007–08, before increasingly sharply the following year, probably as a result of a critical Ofsted report into its child protection services.
2001–02 2011–12
700
600
500
400
300
200
100
0
Cornwall Cumbria Derbyshire DevonHerefordshire Lincolnshire Norfolk North LincolnshireSomerset Staffordshire Suffolk
30
Smart Cuts? Public spending on children’s social care

Chart 21: Trend in overall annual spending per young person by authority (£, Poole group)
Chart 22: Trend in overall annual spending per young person by authority (£, East Riding group)
900
800
700
600
500
400
300
200
100
0
600
500
400
300
200
100
0
2001–02 2011–12
2001–02 2011–12
Buckinghamshire Cambridgeshire Cheshire East RidingLeicestershire North Yorkshire Rutland WarringtonWarwickshire West Berkshire Wiltshire Worcestershire
Bournemouth Dorset East Sussex GloucestershireHampshire North Somerset Poole ShropshireSouth Gloucestershire Swindon West Sussex
31
Chapter 3: Trends in spending patterns on children’s social care, 2001–11

Chart 23: Trend in overall annual spending per young person by authority (£, Sutton group)
As these charts have demonstrated, the trend in total spending does vary to a certain extent across the comparator groups – particularly between English and Welsh councils. They also highlight how spending per head has changed for each individual authority over the last decade – identifying some organisations as clear outliers when compared to similar councils, even though the vast majority followed the same general pattern.
trend By Budget headIng
Chart 24 on page 34 shows the breakdown of total spending across England and Wales between 2001–02 and 2011–12 by budget heading.21 Unfortunately, the BVACOP budget headings changed significantly towards the end of the decade, which means that we do not have sufficient data to identify trends in spending for the various types of children’s social care expenditure. Nevertheless, the budget headings listed below applied throughout the analysis period and are therefore relatively straightforward to compare. The definitions for these headings were set out in chapter 2 on pages 10 and 11, and remained largely unchanged:22
• Family support services
• Young people’s services
• Looked after children
• Fostering
21 English councils have produced estimates for their 2010–11 spending broken down by these categories, but we do not yet have the comparable Welsh data figures, so have not included the breakdown for 2010–11 in this chart.
22 Until 2008–09, the ‘other’ budget heading included spend on central strategic functions, but definitions for each other line of spending did not change very much.
2001–02 2011–12
700
600
500
400
300
200
100
0
Bracknwll Forest Bromley Hertfordshire Kingston upon ThamesMerton Oxfordshire Richmond upon Thames SurreySutton Windsor and Maidenhead Wokingham
32
Smart Cuts? Public spending on children’s social care

• Adoption and guardianship
• Commissioning and social work
• Youth justice
• Other
The remaining BVACOP headings first appeared later in the analysis period. When deciding whether to allocate spending under these budgets, local authorities were either presented with new definitions that did not appear anywhere beforehand, or were asked to take out some items of spending from one broad heading and put it into a new one. For the purpose of this report we have identified these ‘new’ lines of spending and incorporated all bar one of them23 into the ‘older’ budget headings that fit them best (or, in the case of strategy spending, where they used to belong). These ‘new’ lines, together with their ‘old’ budget heading, are detailed in Table 9 below.
Table 9: ‘New’ BVACOP headings and their ‘old’ counterparts
New BVACOP heading Old BVACOP heading
StrategySafetyChild protection
OtherCommissioning and social workCommissioning and social work
Although this re-aggregation of data should be treated with caution, it nevertheless allows us to track lines of spending to identify which services have increased most – and therefore might be most vulnerable to cuts. Chart 24 shows how the average level of spend for each BVACOP heading across England and Wales changed over the decade. It highlights a number of interesting developments, such as:
• Funding for Sure Start (England) increased rapidly during the period. The grants did not even exist in 2001–02, but by 2009–10 they accounted for the third-highest category of spending. Since the funding is no longer ring-fenced and many of these services and facilities are not necessarily embedded deeply in the minds of local residents, authorities are likely to see it as an easy area to make savings
• Spending on commissioning, social work, safety and child protection rose sharply in 2009–10 (from £116 to £131 per young person), probably in response to the Peter Connelly case
• Spending on fostering, adoption, young people’s services and other services (including strategy) rose steadily during the period
• Spending on other services for looked after children dropped steeply in 2006–07 and has not returned even close to its peak of 2005–06. The reasons for this are unclear.
23 Since funding for preventative services was previously channelled directly to Children’s Services partnerships and does not fit neatly into any of the ‘old’ BVACOP headings, we have not aggregated this data. Neither have we tried to estimate previous levels of spend, as the totals reported for this line is extremely unpredictable and volatile in 2008–09 and 2009–10. Therefore all spending on preventative services prior to 2008–09 is not included in this report.
33
Chapter 3: Trends in spending patterns on children’s social care, 2001–11

Chart 24: Trend in breakdown of total spend per young person (£), 2001–02 to 2011–12
Charts 25 and 26 show the average levels of spending in the Islington and East Riding groups broken down into these headings.24 As the comparator groups of authorities that spent the most and least respectively over the course of the decade, they help to identify which services are more of a priority in high-spending areas.
These charts also highlight the fact that much of the increase in spending can be attributed to the introduction of Sure Start grants. However, the rise in demand for social work, youth justice and services for looked after children has led to some other budget lines (particularly family support services) becoming squeezed. Interestingly, although the average spend per young person in the Islington group is over three times as much as the East Riding cluster over these eleven years (£1,039 rather than £334), each budget line takes up a similar share of expenditure throughout the period. Therefore the pattern of expenditure is very similar, even though the overall amount spent is very different. The only major difference between the two groups is that the Islington authorities spent more on family support services than young people’s services; for the East Riding cluster this situation was reversed. This finding echoes charts 5 and 6 in chapter 2, which looked at the spending breakdown in the Islington and Sutton groups for 2009–10.
24 Since these groups consist solely of English councils, we have been able to break down the 2010–11 spending by budget heading.
700
600
500
400
300
200
100
0 2001–02 2002–03 2003–04 2004–05 2005–06 2006–07 2007–08 2009–10 2009–10 2010–11 2011–12
Projected total spend
Sure Start
Other
Adoption and guardianship
Youth justice
Preventative services
Family support services
Fostering
Safety
Child protection
Commissioning and social work
Strategy
Young people’s services
Other LAC
34
Smart Cuts? Public spending on children’s social care

Chart 25: Trend in breakdown of total spend per young person, 2001–02 to 2011–12 (£, Islington group)
Chart 26: Trend in breakdown of total spend per young person, 2001–02 to 2011–12 (£, East Riding group)
500
450
400
350
300
250
200
150
100
50
0
1,400
1,200
1,000
800
600
400
200
0
2001–02 2002–03 2003–04 2004–05 2005–06 2006–07 2007–08 2009–10 2009–10 2010–11 2011–12
2001–02 2002–03 2003–04 2004–05 2005–06 2006–07 2007–08 2009–10 2009–10 2010–11 2011–12
Projected total spend
Sure Start
Commissioning and social work
Strategy
Other
Adoption
Family support services
Projected total spend
Sure Start
Commissioning and social work
Strategy
Other
Adoption
Family support services
Preventative services
Child protection
Safety
Fostering
Other LAC
Youth justice
Young people’s services
Preventative services
Child protection
Safety
Fostering
Other LAC
Youth justice
Young people’s services
35
Chapter 3: Trends in spending patterns on children’s social care, 2001–11

Another notable feature of these charts is that spending on young people’s services was not projected to fall in 2010–11, even though there have been reports that spending on these services have recently been the focus of cuts.25 Although we do not have the detailed figures for 2011–12, the average spend on these services per 0–19 year-old rose in both groups in the previous financial year – from £89 to £126 for the Islington authorities and £33 to £37 in the East Riding cluster. This trend was mirrored across England, where the average spend per young person on these services increased from £44 to £51.
Charts 27 and 28 show how the Islington and East Riding groups allocated their spending according to our definitions of protection and prevention. Chart 27 highlights that protection and prevention spending appeared to be converging in the Islington group between 2005–06 and 2007–08, before diverging suddenly. This pattern – which is not particularly apparent in the East Riding authorities – suggests that some early intervention budget was re-directed towards protection services, probably in light of the Peter Connelly case. Councils in the Islington group have many more looked after children than those in the East Riding cluster, which suggests that they would have experienced a much greater increase in demand on their protection services following this trial and subsequent media brouhaha. The councils had to respond to this by re-allocating spending away from prevention services, regardless of the potential long-term impact this might have.
This finding is particularly interesting considering that the BVACOP budget heading for preventative services is only included from 2008–09 onwards. Prior to this year, money for these services was given directly to local partnerships (rather than local authorities) and we have therefore not been able to include it in the analysis. The Islington authorities spent around £14 and £12 per young person on these services in 2008–09 and 2009–10 respectively. If we were to take this out of the analysis (and therefore have a truer comparison of like-for-like expenditure before and after 2008–09), the drop in spending on prevention would be even more noticeable. Interestingly however, the figures for 2010–11 suggest that these two broad categories are beginning to converge once again, suggesting that authorities began to re-prioritise their spending once the furore around child protection services died down.
Another interesting finding from the 2010–11 data is that spending on protection services appears to be bearing the brunt of the reductions that began to take effect last year. This may be because many authorities have increased protection spending sharply in the last three years (particularly since the Peter Connelly case), and therefore managers feel that these budgets contain a certain degree of slack and will be able to cope with some initial reductions now that much of the “Baby P” furore has subsided. However, given that many protection services are statutory, it is highly unlikely that they will continue to shoulder most of the burden of cuts during the spending review period. This is particularly the case considering that the numbers of children subject to care applications is currently at record levels,26 and therefore demand for protection services is unlikely to fall.
25 Youth Services and Children’s centres worst hit as cuts average 13 per cent in one year, Children and Young People Now, 25 January 2011.
26 See www.cafcass.gov.uk/news/2011/cafcass_october_care_statistic.aspx
36
Smart Cuts? Public spending on children’s social care

Chart 27: Trends in average spending per young person on prevention and protection services (£, Islington group)
Chart 28: Trends in average spending per young person on prevention and protection services (£, East Riding group)
2001–02 2002–03 2003–04 2004–05 2005–06 2006–07 2007–08 2009–10 2009–10 2010–11
300
250
200
150
100
50
0
East Riding group – Prevention East Riding group – Protection
900
800
700
600
500
400
300
200
100
0 2001–02 2002–03 2003–04 2004–05 2005–06 2006–07 2007–08 2009–10 2009–10 2010–11
Islington group – Prevention Islington group – Protection
37
Chapter 3: Trends in spending patterns on children’s social care, 2001–11
ChaPter 4: What doeS the future hoLd?
This chapter tries to predict future levels of funding for children’s social care in the light of the 2010 Spending Review settlement. In particular, it highlights how lower levels of spending on early intervention and preventative services could mean that local authorities are less effective at providing early help to vulnerable children before they come to the attention of child protection services. It is possible that cuts in funding to preventative services could result in greater demand for child protection services, which are already under considerable pressure.
Real-terms cuts to children’s social care budgets in 2011–12 averaged 23.95% in England and 1.96% in Wales, compared to an average reduction in local authority spending of 10.11% and 4.33% respectively. For England, this equates to a cut of 2.37% in children’s social care spending for every 1% reduction in overall expenditure. In contrast, children’s social care budgets were only reduced by an average of 0.45% for every 1% drop in Welsh local government spending.
Since the Spending Review ‘front-loaded’ many of the cuts and required English councils to make drastic reductions in 2011–12, budgets in subsequent years are unlikely to be reduced quite as much. Although the Welsh local government settlement covers three rather than four years (spending is set to fall by 7.1% in real terms by 2013–14), the picture here is similar – more than half of the proposed cuts are scheduled to take place over the first twelve months. Table 10 highlights the funding settlements for English and Welsh councils, in 2010 prices.27 It is based on ministerial announcements and the Spending Review documentation, and highlights how the cuts will not be applied evenly over the period. For example, grants to English councils are being cut by £3.5 billion in 2011–12, whereas they will only be reduced by £808m in 2013–14.28
Of course cuts in grant funding will not automatically lead to cuts in funding for services. The Spending Review and Welsh Assembly Government announcement only set out how deep the cuts to local authority grant funding are set to be: however, overall local government expenditure will fall at a slower rate because other sources of authority income (such as Council Tax and money from fees and charges) will not be affected by decisions to reduce central grants. Although the Spending Review predicted that English council spending would fall by 14% over the four-year period, the 2011–12 figures suggest that it will be cut by more than this. As the tables show, total spending by English councils was forecast to drop by 10.11% this year, whilst funding was reduced by 12.45% – in Wales the corresponding figures are 4.33% and 5.68%. Therefore, Table 10 also sets out the possible percentage cuts in spending for the next three years, based on the funding settlements and using the same ratios of funding reductions to spending cuts that applied in 2011–12.29
27 See Welsh Local Government Minister Carl Sergeant’s announcement at http://wales.gov.uk/newsroom/localgovernment/2010/101123settlement/?lang=en&utm_source=http%3a%2f%2femail.cipfa.org.uk%2fcipfalz%2f&utm_medium=email&utm_campaign=480&utm_term=PIN+News+-+25+November+2010&utm_content=1 for more details on how Welsh councils will be affected, and the Spending Review report at www.hm-treasury.gov.uk/spend_index.htm for more information on funding projections for English councils.
28 It should be noted that the Spending Review relied on the Office of Budget Responsibility’s RPI estimates for the next five years. They were 4.4% for 2010, 2.95% for 2011, 2.575% for 2012, 2.75% for 2013 and 2.8% for 2014 and 2015. The OBR’s figure for 2011–12 is significantly lower than the 5% that we have used to re-calculate 2011–12 spending at 2010 prices and that also looks like a more accurate rate at the time of writing (September 2011).
29 These ratios of spending reductions to funding cuts are 10.11/12.45 = 0.812048 in England and 4.33/5.68 = 0.762324 in Wales.
38

Table 10: Projected percentage cuts in funding settlements and local authority budgets, 2011–12 to 2014–15
2010–11 2011–12 2012–13 2013–14 2014–15
Total funding for English local authorities (2010 prices)
£28.5bn £24.95bn £22.61bn £21.8bn £20bn
Cut in English local authority funding from previous year
12.45% 9.4% 3.58% 8.26%
Projected cuts in total English local authority spending
10.11% 7.63% 2.91% 6.71%
Total funding for Welsh local authorities (2010 prices)
£4.22bn £3.98bn £3.86bn £3.8bn
Cut in Welsh local authority funding from previous year
5.68% 2.89% 1.52%
Projected cuts in total Welsh local authority spending
4.33% 2.20% 1.16%
Using the figures for projected total spending cuts set out in Table 10, along with the figures for children’s social care expenditure in 2011–12, we can hypothecate how much could be reduced from budgets in future years if children’s social care budgets continue to bear the same proportion of spending cuts. In 2011–12, children’s services budgets were reduced by 23.95% in England, compared to just 1.96% in Wales. Therefore, for every 10.11% reduction in overall spending by English councils, children’s social care budgets were cut by 23.95% – a ratio of 2.368:1. The corresponding ratio in Wales is 0.453:1.
Table 11: Projected cuts to total and children’s social care spending if current patterns continue, 2011–12 to 2014–15 (2010 prices)
2010–11 2011–12 2012–13 2013–14 2014–15
Projected cuts in total English local government spending
10.11% 7.63% 2.91% 6.71%
Projected cuts in English children’s social care spending
23.95% 18.07% 6.89% 15.89%
Projected English children’s social care spending
£7.35bn £5.88bn £4.82bn £4.49bn £3.78bn
Projected English children’s social care spending per young person
£623 £474 £388 £361 £305
Projected cuts in total Welsh local government spending
4.33% 2.20% 1.16%
Projected cuts in Welsh children’s social care spending
1.96% 1% 0.53%
Projected Welsh children’s social care spending
£403m £395m £391m £390m
Projected Welsh children’s social care spending per young person
£567 £556 £551 £549
39
Chapter 4: What does the future hold?
Table 11 adopts these ratios to predict hypothetical future levels of children’s services spending, keeping the relevant rows from Table 8 for ease of reference. It suggests that, if this pattern continues, spending would fall back to just £305 per young person in England (lower than the level for 2001–02), compared to £549 in Wales.30 Although we can only base our assumptions on a single year of post-Spending Review projected budgets (and we only have headline figures, rather than a detailed breakdown of spend), it is very unlikely that cuts of this scale will occur.
Table 12 shows why this is the case, by identifying which of the budget lines31 we have analysed in this report are most vulnerable to cuts in 2011–12 and subsequent years. It takes the base year as 2009–10, as this was the high-point of overall expenditure, and the last year for which we have a detailed breakdown of spending in both England and Wales. It assumes that the numbers of children in need (CIN) and looked after children (LAC) will not fall in the next few years,32 and that authorities will prefer to cut spending on ‘back-office’ activities rather than ‘front-line’ services.
As the table shows, most of the vulnerable services are preventative; youth justice is the only protection service that is highly likely to be subjected to budget cuts – although these reductions will prove difficult to deliver in those areas affected by the recent riots. The table also highlights the fact that councils are almost certain to make significant cuts in Sure Start expenditure, as all of the other vulnerable services combined only account for around half of this budget. However, even if local authorities ceased providing all of these vulnerable services, they would only save a total of £1.58bn of the 2009–10 baseline spend – less than the £1.85bn reduction that has already been projected for 2011–12. The figure is also dwarfed by the projected savings in Table 11, which suggests that children’s social care budgets in 2014–15 would end up being less than half of the figure for 2011–12 if they continued to bear the same share of the cuts.
As a result, councils will need to look elsewhere for savings in the future, and cuts to children’s social care budgets in each of the next three years will probably not be as large in percentage terms as those planned for 2011–12. Budgets will no doubt be reduced between now and 2014–15 (and obviously from a much lower base than the 2009–10 peak), but most authorities are unlikely to continue making reductions of a similar scale to those we have seen this year. It may be the case that many authorities took advantage of the un-ringfencing of various children’s services grants for discretionary services to make relatively ‘easy’ spending reductions for the current financial year. Future decisions are unlikely to be quite so straightforward, as finance managers will have their work cut out identifying which other budgets can be reduced – but children’s services are unlikely to share similar share of the burden.
Nonetheless, reductions of the magnitude proposed for 2011–12 in a single financial year would have a huge impact on any service. They can only be achieved by major headcount reductions or significant changes to the scope and/or quality of services. Moreover, the speed at which these reforms are implemented could cause problems further down the line. Although the spending cuts may have left authorities with little choice but to make staff redundant, some managers come to may regret decisions that may have been made in haste and caused talented or experienced professionals to leave and staff morale to plummet.
30 This also assumes that the number of young people will remain constant, even though it has increased every year since 2005–06.
31 See page 10 of this report for an explanation of how these budget lines are defined.32 This means that the cost of providing statutory services to CIN and LAC can only reduce if the services become more
efficient or effective. Although these improvements may be achievable, they are unlikely to be sufficient. In addition, the number of children looked after has been rising for several years, which makes this an optimistic scenario.
40
Smart Cuts? Public spending on children’s social care

Table 12: Vulnerability of budget lines to spending cuts
Budget line Type of service
Vulnerability to cuts
Reason for vulnerability Total spending in England and Wales, 2009–10
% of overall spend
Sure StartPrevention and protection
High
Non-statutory and no longer ring-fenced. Accounts for a high share of overall spending in England, where cuts are deeper
£1.41bn 16.51
Preventative services
Prevention HighNon-statutory. Less ‘urgent’ and high-profile than protection services
£144m 1.68
Strategy Prevention HighFunds mostly ‘back-office’ activities rather than front-line social work
£135m 1.58
Youth Justice Protection High English council estimates for 2010–11 suggest cuts are already being made in this area
£438m5.14
Young people’s services
Prevention Medium
Non-statutory.However, English council estimates for 2010–11 suggest cuts are not yet being made in this area (see page 32)
£568m 6.6
Family support services
Prevention MediumSome services are statutory for CIN, but some are discretionary
£822m 9.63
Other services Prevention Medium
Grants to voluntary organisations are likely to be cutStatutory services that come under this heading are less vulnerable
£135m 1.58
Commissioning and social work
Protection MediumFront-line service, but in many cases delivered in excess of statutory requirements
£1.55bn 18.19
Looked after children
Protection LowThe number of LAC is unlikely to fall
£1.53bn 17.97
Fostering Protection LowThe number of LAC is unlikely to fall
£1.37bn 16.06
SafetyProtection
LowFunds statutory dutiesLow share of overall spending
£43m 0.5
Child protection
Protection LowFunds statutory duties
£113m 1.32
Adoption and guardianship
Protection Low
Councils want to increase the number of children adopted, as this is a cost-effective solution for LAC
£272m 3.19
41
Chapter 4: What does the future hold?

the PotentIaL KnoCK-on effeCtS of CutS to PreventatIve ServICeS
Another factor to consider when trying to predict how spending patterns might develop is the potential medium-term effect of a reduction in early intervention and other preventative spending. A number of independent and public bodies have identified how early intervention programmes that are targeted at children who may be on the threshold of being either officially ‘in need’ (CIN) or ‘looked after’ (LAC) by the local authority can prevent them from dropping into these categories – most notably the review undertaken by Graham Allen MP for the coalition government.33 If these interventions are successful, many young people benefit from improved welfare and quality of life, and also the overall cost to the public purse is reduced – because it is more expensive to deliver protection services than prevention initiatives.
The coalition Government has recognised the importance of early intervention, and has allocated English councils a total of £2.22 billion in 2011–12 and £2.31 billion in 2012–13 to fund these programmes.34 Although local authorities are not mandated to spend the money on specific initiatives, the Department for Education suggests that it should help to support Sure Start programmes and intensive interventions in families with multiple problems.
With this in mind, it is worth investigating how a reduction in prevention spending (as highlighted in Table 12) could increase the demand for protection services and the corresponding pressure for additional spending. There is no existing evidence that can answer this question with certainty. But we have used the best available evidence to estimate what the knock-on effects might be. Below we detail our calculations. Note that all the figures relate to December 2009 and to England only.
Step 1: the number of children on the threshold of the child protection system
There is no authoritative information about the number of children that receive early intervention before their difficulties reach the stage where statutory services are required by law to intervene. The number of children who are likely to be around the threshold of the child protection system was estimated to be 225,000 based on the midpoint between two calculations:
• The number of children who are referred to social services each year minus the number who are classified as being ‘in need’ (300,000)35
• The number of children in families identified as ‘at risk’ (150,000)36
33 See http://www.cabinetoffice.gov.uk/sites/default/files/resources/earlyintervention-smartinvestment.pdf34 http://www.education.gov.uk/childrenandyoungpeople/earlylearningandchildcare/delivery/funding/a0070357/eig-faqa#
faq235 The number of children who are referred to social services each year is estimated to be 423,000 (there were 547,000
referrals to children’s social care services in 2009, minus 124,000 repeat referrals within 12 months of a previous referral); the number of children becoming ‘in need’ annually is estimated to be 123,000.
36 The DfE calculated there to be 50,000 families at risk through its Think Family research. The average number of children per family is 3. The coalition has since talked about 120,000 problem families so this may be an underestimate.
42
Smart Cuts? Public spending on children’s social care
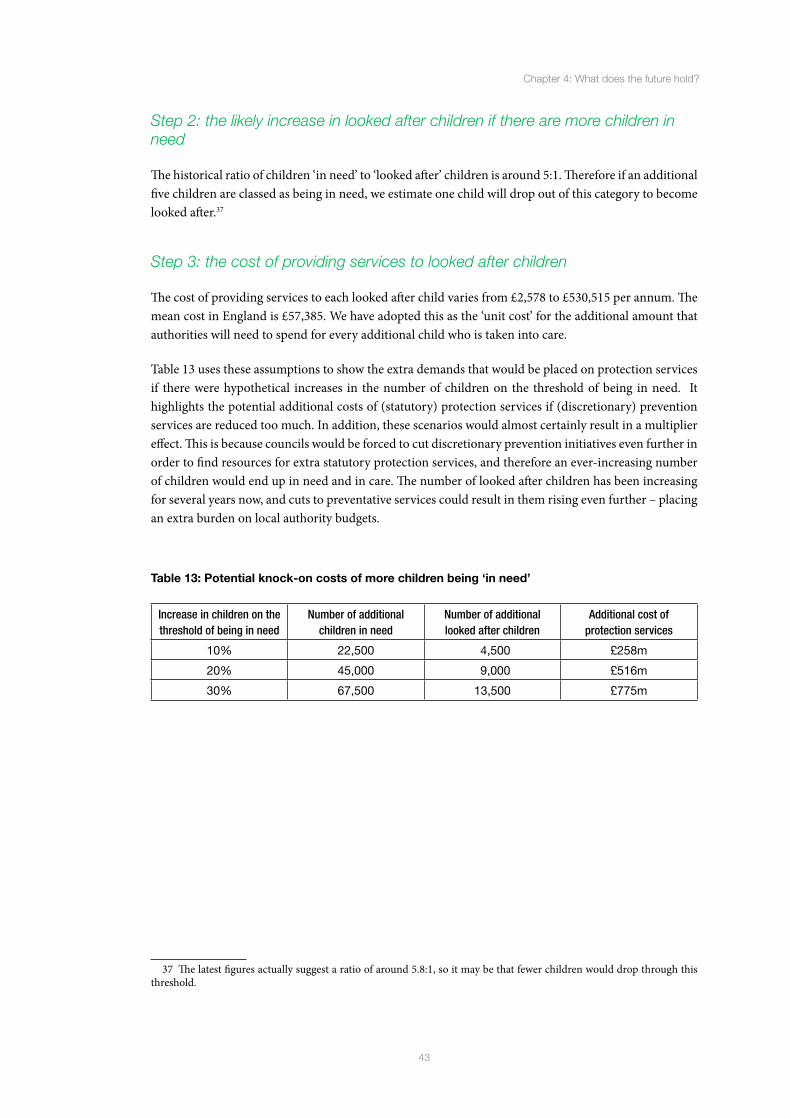
Step 2: the likely increase in looked after children if there are more children in need
The historical ratio of children ‘in need’ to ‘looked after’ children is around 5:1. Therefore if an additional five children are classed as being in need, we estimate one child will drop out of this category to become looked after.37
Step 3: the cost of providing services to looked after children
The cost of providing services to each looked after child varies from £2,578 to £530,515 per annum. The mean cost in England is £57,385. We have adopted this as the ‘unit cost’ for the additional amount that authorities will need to spend for every additional child who is taken into care.
Table 13 uses these assumptions to show the extra demands that would be placed on protection services if there were hypothetical increases in the number of children on the threshold of being in need. It highlights the potential additional costs of (statutory) protection services if (discretionary) prevention services are reduced too much. In addition, these scenarios would almost certainly result in a multiplier effect. This is because councils would be forced to cut discretionary prevention initiatives even further in order to find resources for extra statutory protection services, and therefore an ever-increasing number of children would end up in need and in care. The number of looked after children has been increasing for several years now, and cuts to preventative services could result in them rising even further – placing an extra burden on local authority budgets.
Table 13: Potential knock-on costs of more children being ‘in need’
Increase in children on the threshold of being in need
Number of additional children in need
Number of additional looked after children
Additional cost of protection services
10% 22,500 4,500 £258m
20% 45,000 9,000 £516m
30% 67,500 13,500 £775m
37 The latest figures actually suggest a ratio of around 5.8:1, so it may be that fewer children would drop through this threshold.
43
Chapter 4: What does the future hold?
ConCLuSIonS
This report has traced the rise in spending on children’s social care that occurred during the 2000s, and highlighted how this is now set to fall significantly over the next four years – alongside cuts in overall public expenditure. It has shown how the pattern of spending has varied by different types of authority, and between English and Welsh councils in particular.
It has also discussed how the spending reductions are likely to be applied within children’s social care. Prevention services appear to be especially vulnerable, but cuts will also need to be delivered in other areas in order to keep within 2011–12 budgets. Further cuts in children’s social care spending will no doubt take place over the rest of the Spending Review period, but they are unlikely to be as deep as those already planned for the current year.
Although spending reductions do not automatically translate into cuts in services or worsening outcomes for children, the scale of the challenge ahead suggests that some impact on children will be unavoidable. As such, the impact of these reductions on young people, their families and the wider community should not be underestimated. The sheer pace of change in spending on children’s social care in some local authorities is of concern. It is hard to imagine that mistakes will not be made in the face of cuts of 40% to some children’s social care budgets.
In particular, this report has shown that cutting preventative services may prove costly if it is not done very carefully. If cuts to preventative services result in more children becoming in need, child protection costs could spiral.
It is also worth remembering that this report has only considered the levels of spending on those children’s social services that are provided by local government. Reductions in other areas, such as the police, voluntary sector and education maintenance allowance, will also have a major impact on the welfare of many young people. As a result, there are likely to be additional demands placed on local authority services over the coming years that have not been covered in our analysis.
What is certain is that local authorities can not continue as they are, facing rising demand for children’s social care services with significantly reduced resources. This report puts into sharp relief the need for a relentless focus on finding more effective interventions to prevent abuse from occurring in the first place, and swiftly addressing abuse once it occurs. In an age of relative austerity, local authorities will only be better able to protect children if they find ways to allocate resources in a smarter way.
44

aP
Pe
nd
Ix 1
: Lo
Ca
L a
uth
or
Ity
SP
en
dIn
g o
n C
hIL
dr
en
’S S
oC
IaL
Ca
re
, 201
0–11
an
d 2
011–
1238
2010
–11
2011
–12
Auth
ority
nam
eTo
tal s
pend
(£
000,
201
0 pr
ices
)
Num
ber o
f 0–1
9 ye
ar-o
lds
Spen
d pe
r 0–1
9 ye
ar-o
ld (£
)To
tal s
pend
(£
000,
201
0 pr
ices
)
Num
ber o
f 0–1
9 ye
ar-o
lds
Spen
d pe
r 0–1
9 ye
ar-o
ld (£
)Sp
endi
ng c
ut
per y
oung
pe
rson
, 20
10/1
1–20
11/1
2 (£
)
% d
rop
in
spen
ding
20
10/1
1–
2011
/12
Bar
king
& D
agen
ham
45,2
7054
,300
834
28,4
4854
,300
524
310
37.1
6
Bar
net
50,5
8886
,100
588
37,4
4486
,100
435
153
25.9
8
Bar
nsle
y35
,257
54,2
0065
021
,690
54,2
0040
025
038
.48
Bat
h &
Nor
th E
ast
Som
erse
t20
,193
41,0
0049
313
,725
41,0
0033
515
832
.03
Bed
ford
shire
59,4
1010
2,00
058
248
,180
102,
000
472
110
18.9
0
Bex
ley
27,6
2957
,900
477
17,2
7657
,900
298
179
37.4
7
Birm
ingh
am21
9,68
528
8,80
076
115
6,33
428
8,80
054
121
928
.84
Bla
ckb
urn
with
Dar
wen
32,2
3042
,500
758
24,7
3342
,500
582
176
23.2
6
Bla
ckp
ool
31,0
2633
,000
940
26,4
2733
,000
801
139
14.8
2
Bol
ton
30,4
5869
,600
438
30,5
7069
,600
439
–2-0
.37
Bou
rnem
outh
28,1
4035
,100
802
20,3
8935
,100
581
221
27.5
4
Bra
ckne
ll Fo
rest
13,4
4029
,900
450
9,77
829
,900
327
122
27.2
4
Bra
dfo
rd88
,332
143,
400
616
79,3
9514
3,40
055
462
10.1
2
38 A
ll fig
ures
are
in 2
010
pric
es, c
alcu
late
d on
the
basis
of a
5%
RPI
rate
for 2
011.
Pop
ulat
ion
figur
es h
ave
been
roun
ded
up to
the
near
est 1
00, a
nd sp
end
per y
oung
per
son
has b
een
roun
ded
up to
the
near
est p
ound
. Pop
ulat
ion
estim
ates
for 2
011–
12 w
ere
not a
vaila
ble
at th
e tim
e of
writ
ing;
ther
efor
e w
e ha
ve u
sed
the
2010
–11
data
for b
oth
year
s.
45

2010
–11
2011
–12
Auth
ority
nam
eTo
tal s
pend
(£
000,
201
0 pr
ices
)
Num
ber o
f 0–1
9 ye
ar-o
lds
Spen
d pe
r 0–1
9 ye
ar-o
ld (£
)To
tal s
pend
(£
000,
201
0 pr
ices
)
Num
ber o
f 0–1
9 ye
ar-o
lds
Spen
d pe
r 0–1
9 ye
ar-o
ld (£
)Sp
endi
ng c
ut
per y
oung
pe
rson
, 20
10/1
1–20
11/1
2 (£
)
% d
rop
in
spen
ding
20
10/1
1–
2011
/12
Bre
nt51
,843
63,8
0081
337
,466
63,8
0058
722
527
.73
Brig
hton
& H
ove
51,2
2655
,100
930
46,2
4355
,100
839
909.
73
Bris
tol
68,4
9594
,200
727
51,0
1694
,200
542
186
25.5
2
Bro
mle
y35
,302
75,0
0047
126
,630
75,0
0035
511
624
.56
Buc
king
ham
shire
44,4
0112
6,70
035
040
,958
126,
700
323
277.
75
Bur
y25
,295
46,7
0054
219
,280
46,7
0041
312
923
.78
Cal
der
dal
e23
,092
50,5
0045
718
,889
50,5
0037
483
18.2
0
Cam
brid
gesh
ire66
,228
144,
300
459
59,6
5814
4,30
041
346
9.92
Cam
den
54,9
3846
,100
1,19
244
,326
46,1
0096
223
019
.32
Che
shire
68,9
8415
8,90
043
471
,427
158,
900
450
–15
–3.5
4
Cor
nwal
l (in
c Is
les
of S
cilly
)71
,426
117,
300
609
53,7
8011
7,30
045
815
024
.71
Cor
por
atio
n of
Lon
don
2,43
91,
200
2,03
21,
145
1,20
095
41,
078
53.0
5
Cov
entr
y59
,312
80,0
0074
148
,821
80,0
0061
013
117
.69
Cro
ydon
75,7
9389
,200
850
67,5
4289
,200
757
9210
.89
Cum
bria
53,7
2410
8,50
049
543
,402
108,
500
400
9519
.21
Dar
lingt
on13
,918
24,3
0057
311
,031
24,3
0045
411
920
.74
Der
by
44,4
8660
,400
737
34,5
9360
,400
573
164
22.2
4
Der
bys
hire
81,2
2617
4,40
046
662
,233
174,
400
357
109
23.3
8
Dev
on85
,886
162,
400
529
66,2
7516
2,40
040
812
122
.83
Don
cast
er48
,451
70,3
0068
944
,024
70,3
0062
663
9.14
46
Smart Cuts? Public spending on children’s social care

2010
–11
2011
–12
Auth
ority
nam
eTo
tal s
pend
(£
000,
201
0 pr
ices
)
Num
ber o
f 0–1
9 ye
ar-o
lds
Spen
d pe
r 0–1
9 ye
ar-o
ld (£
)To
tal s
pend
(£
000,
201
0 pr
ices
)
Num
ber o
f 0–1
9 ye
ar-o
lds
Spen
d pe
r 0–1
9 ye
ar-o
ld (£
)Sp
endi
ng c
ut
per y
oung
pe
rson
, 20
10/1
1–20
11/1
2 (£
)
% d
rop
in
spen
ding
20
10/1
1–
2011
/12
Dor
set
43,6
2889
,400
488
37,1
7389
,400
416
7214
.80
Dud
ley
47,7
9273
,100
654
36,4
8073
,100
499
155
23.6
7
Dur
ham
76,9
2411
6,10
066
351
,261
116,
100
442
221
33.3
6
Eal
ing
52,6
6974
,800
704
47,5
7274
,800
636
689.
68
Eas
t R
idin
g of
Yor
kshi
re35
,114
73,5
0047
823
,925
73,5
0032
615
231
.86
Eas
t S
usse
x62
,644
116,
000
540
50,6
0211
6,00
043
610
419
.22
Enfi
eld
48,0
8578
,800
610
32,2
3878
,800
409
201
32.9
6
Ess
ex16
6,92
933
2,60
050
213
3,33
733
2,60
040
110
120
.12
Gat
eshe
ad28
,087
43,4
0064
721
,661
43,4
0049
914
822
.88
Glo
uces
ters
hire
70,6
1013
9,10
050
845
,114
139,
100
324
183
36.1
1
Gre
enw
ich
67,3
4159
,700
1,12
847
,724
59,7
0079
932
929
.13
Hac
kney
74,7
2656
,800
1,31
652
,021
56,8
0091
640
030
.38
Hal
ton
23,5
5730
,600
770
11,3
7530
,600
372
398
51.7
1
Ham
mer
smith
& F
ulha
m43
,754
34,8
001,
257
41,9
2434
,800
1,20
553
4.18
Ham
psh
ire12
4,92
430
7,00
040
783
,816
307,
000
273
134
32.9
1
Har
inge
y61
,593
53,8
001,
145
55,3
1153
,800
1,02
811
710
.20
Har
row
25,5
5355
,600
460
24,5
3655
,600
441
183.
98
Har
tlep
ool
19,8
0722
,900
865
16,1
6222
,900
706
159
18.4
0
Hav
erin
g27
,836
56,7
0049
127
,254
56,7
0048
110
2.09
Her
efor
dsh
ire19
,911
39,3
0050
714
,357
39,3
0036
514
127
.89
47
Appendix 1

2010
–11
2011
–12
Auth
ority
nam
eTo
tal s
pend
(£
000,
201
0 pr
ices
)
Num
ber o
f 0–1
9 ye
ar-o
lds
Spen
d pe
r 0–1
9 ye
ar-o
ld (£
)To
tal s
pend
(£
000,
201
0 pr
ices
)
Num
ber o
f 0–1
9 ye
ar-o
lds
Spen
d pe
r 0–1
9 ye
ar-o
ld (£
)Sp
endi
ng c
ut
per y
oung
pe
rson
, 20
10/1
1–20
11/1
2 (£
)
% d
rop
in
spen
ding
20
10/1
1–
2011
/12
Her
tfor
dsh
ire14
5,36
327
5,50
052
811
4,37
627
5,50
041
511
221
.32
Hill
ingd
on43
,283
68,8
0062
927
,190
68,8
0039
523
437
.18
Hou
nslo
w42
,455
56,8
0074
731
,055
56,8
0054
720
126
.85
Isle
of W
ight
19,1
5129
,500
649
11,4
3729
,500
388
261
40.2
8
Islin
gton
65,9
7638
,600
1,70
944
,166
38,6
001,
144
565
33.0
6
Ken
sing
ton
& C
hels
ea37
,920
33,5
001,
132
30,3
2633
,500
905
227
20.0
3
Ken
t17
3,36
835
0,50
049
512
1,97
835
0,50
034
814
729
.64
Kin
gsto
n up
on H
ull
64,3
1261
,400
1,04
742
,289
61,4
0068
935
934
.24
Kin
gsto
n up
on T
ham
es23
,653
38,3
0061
816
,982
38,3
0044
317
428
.20
Kirk
lees
67,9
1310
5,60
064
348
,451
105,
600
459
184
28.6
6
Kno
wsl
ey30
,775
38,0
0081
017
,688
38,0
0046
534
442
.52
Lam
bet
h71
,075
59,4
001,
197
58,6
4459
,400
987
209
17.4
9
Lanc
ashi
re15
0,19
927
8,60
053
910
6,66
127
8,60
038
315
628
.99
Leed
s12
0,63
017
9,80
067
110
6,02
517
9,80
059
081
12.1
1
Leic
este
r63
,882
80,7
0079
245
,417
80,7
0056
322
928
.91
Leic
este
rshi
re50
,349
151,
500
332
43,7
2915
1,50
028
944
13.1
5
Lew
isha
m73
,808
65,2
001,
132
47,2
4465
,200
725
407
35.9
9
Linc
olns
hire
69,2
9115
7,70
043
946
,622
157,
700
296
144
32.7
2
Live
rpoo
l81
,923
100,
800
813
59,4
9910
0,80
059
022
227
.37
Luto
n36
,823
54,8
0067
224
,177
54,8
0044
123
134
.34
48
Smart Cuts? Public spending on children’s social care

2010
–11
2011
–12
Auth
ority
nam
eTo
tal s
pend
(£
000,
201
0 pr
ices
)
Num
ber o
f 0–1
9 ye
ar-o
lds
Spen
d pe
r 0–1
9 ye
ar-o
ld (£
)To
tal s
pend
(£
000,
201
0 pr
ices
)
Num
ber o
f 0–1
9 ye
ar-o
lds
Spen
d pe
r 0–1
9 ye
ar-o
ld (£
)Sp
endi
ng c
ut
per y
oung
pe
rson
, 20
10/1
1–20
11/1
2 (£
)
% d
rop
in
spen
ding
20
10/1
1–
2011
/12
Man
ches
ter
127,
216
117,
200
1,08
512
2,76
511
7,20
01,
047
383.
50
Med
way
39,3
3866
,000
596
29,0
0966
,000
440
157
26.2
6
Mer
ton
26,0
6146
,700
558
19,5
5246
,700
419
139
24.9
8
Mid
dle
sbro
ugh
32,1
0236
,000
892
21,8
0336
,000
606
286
32.0
8
Milt
on K
eyne
s44
,660
64,2
0069
626
,320
64,2
0041
028
641
.07
New
cast
le u
pon
Tyn
e53
,858
64,6
0083
454
,397
64,6
0084
2–8
–1.0
0
New
ham
80,4
9372
,800
1,10
650
,050
72,8
0068
741
837
.82
Nor
folk
108,
603
183,
600
592
87,9
4018
3,60
047
911
319
.03
Nor
th E
ast
Linc
olns
hire
30,9
4838
,600
802
21,1
0438
,600
547
255
31.8
1
Nor
th L
inco
lnsh
ire22
,775
38,0
0059
916
,635
38,0
0043
816
226
.96
Nor
th S
omer
set
22,0
2047
,800
461
17,0
1147
,800
356
105
22.7
5
Nor
th T
ynes
ide
27,8
6144
,400
627
21,3
6244
,400
481
146
23.3
3
Nor
th Y
orks
hire
66,5
0913
4,90
049
339
,653
134,
900
294
199
40.3
8
Nor
tham
pto
nshi
re75
,258
171,
400
439
60,0
5817
1,40
035
089
20.2
0
Nor
thum
ber
land
46,4
8667
,200
692
25,9
7167
,200
386
305
44.1
3
Not
tingh
am67
,854
71,3
0095
247
,786
71,3
0067
028
129
.58
Not
tingh
amsh
ire91
,692
177,
900
515
95,6
9517
7,90
053
8–2
3–4
.37
Old
ham
39,9
4460
,700
658
25,7
3660
,700
424
234
35.5
7
Oxf
ord
shire
58,3
5215
8,10
036
944
,168
158,
100
279
9024
.31
Pet
erb
orou
gh29
,007
44,8
0064
733
,615
44,8
0075
0–1
03–1
5.89
49
Appendix 1

2010
–11
2011
–12
Auth
ority
nam
eTo
tal s
pend
(£
000,
201
0 pr
ices
)
Num
ber o
f 0–1
9 ye
ar-o
lds
Spen
d pe
r 0–1
9 ye
ar-o
ld (£
)To
tal s
pend
(£
000,
201
0 pr
ices
)
Num
ber o
f 0–1
9 ye
ar-o
lds
Spen
d pe
r 0–1
9 ye
ar-o
ld (£
)Sp
endi
ng c
ut
per y
oung
pe
rson
, 20
10/1
1–20
11/1
2 (£
)
% d
rop
in
spen
ding
20
10/1
1–
2011
/12
Ply
mou
th44
,644
58,8
0075
934
,623
58,8
0058
917
022
.45
Poo
le16
,861
32,1
0052
511
,743
32,1
0036
615
930
.35
Por
tsm
outh
29,4
9346
,700
632
24,8
2746
,700
532
100
15.8
2
Rea
din
g22
,628
35,3
0064
120
,856
35,3
0059
150
7.83
Red
brid
ge34
,196
72,2
0047
424
,228
72,2
0033
613
829
.15
Red
car
& C
leve
land
16,2
2632
,000
507
15,1
5332
,000
474
346.
61
Ric
hmon
d u
pon
Tha
mes
20,4
0845
,300
451
16,3
2845
,300
360
9019
.99
Roc
hdal
e37
,892
54,9
0069
026
,772
54,9
0048
820
329
.35
Rot
herh
am39
,229
62,1
0063
226
,902
62,1
0043
319
831
.42
Rut
land
4,43
710
,600
419
3,10
310
,600
293
126
30.0
7
Sal
ford
52,8
9453
,700
985
38,0
9553
,700
709
276
27.9
8
San
dw
ell
46,3
5277
,400
599
49,8
1777
,400
644
–45
–7.4
8
Sef
ton
46,5
0762
,100
749
32,3
5462
,100
521
228
30.4
3
She
ffiel
d83
,647
126,
500
661
68,1
2312
6,50
053
912
318
.56
Shr
opsh
ire25
,250
67,3
0037
522
,573
67,3
0033
540
10.6
0
Slo
ugh
22,0
9434
,600
639
17,2
2434
,600
498
141
22.0
4
Sol
ihul
l36
,715
50,2
0073
132
,861
50,2
0065
577
10.5
0
Som
erse
t52
,557
122,
900
428
38,7
3212
2,90
031
511
226
.31
Sou
th G
louc
este
rshi
re27
,038
63,3
0042
717
,922
63,3
0028
314
433
.72
Sou
th T
ynes
ide
29,6
3434
,300
864
21,2
4034
,300
619
245
28.3
2
50
Smart Cuts? Public spending on children’s social care

2010
–11
2011
–12
Auth
ority
nam
eTo
tal s
pend
(£
000,
201
0 pr
ices
)
Num
ber o
f 0–1
9 ye
ar-o
lds
Spen
d pe
r 0–1
9 ye
ar-o
ld (£
)To
tal s
pend
(£
000,
201
0 pr
ices
)
Num
ber o
f 0–1
9 ye
ar-o
lds
Spen
d pe
r 0–1
9 ye
ar-o
ld (£
)Sp
endi
ng c
ut
per y
oung
pe
rson
, 20
10/1
1–20
11/1
2 (£
)
% d
rop
in
spen
ding
20
10/1
1–
2011
/12
Sou
tham
pto
n38
,834
53,2
0073
030
,585
53,2
0057
515
521
.24
Sou
then
d-o
n-S
ea26
,854
39,3
0068
321
,731
39,3
0055
313
019
.08
Sou
thw
ark
88,1
9661
,700
1,42
964
,524
61,7
001,
046
384
26.8
4
St
Hel
ens
31,8
1542
,500
749
21,8
0142
,500
513
236
31.4
8
Sta
fford
shire
98,3
2818
9,40
051
967
,822
189,
400
358
161
31.0
2
Sto
ckp
ort
37,6
2966
,700
564
26,4
6266
,700
397
167
29.6
8
Sto
ckto
n-on
-Tee
s32
,837
47,6
0069
022
,715
47,6
0047
721
330
.82
Sto
ke-o
n-Tr
ent
49,5
3958
,500
847
31,3
6658
,500
536
311
36.6
8
Suf
folk
75,4
1216
6,20
045
466
,989
166,
200
403
5111
.17
Sun
der
land
46,1
6364
,300
718
30,8
9564
,300
480
237
33.0
7
Sur
rey
140,
809
272,
900
516
99,9
2527
2,90
036
615
029
.04
Sut
ton
25,2
9448
,100
526
19,7
2248
,100
410
116
22.0
3
Sw
ind
on28
,293
49,0
0057
718
,075
49,0
0036
920
936
.12
Tam
esid
e34
,010
53,9
0063
120
,866
53,9
0038
724
438
.65
Telfo
rd &
Wre
kin
27,6
4942
,200
655
23,4
9342
,200
557
9915
.03
Thur
rock
21,7
8641
,300
528
19,1
1841
,300
463
6512
.25
Torb
ay22
,415
28,7
0078
117
,223
28,7
0060
018
123
.17
Tow
er H
amle
ts81
,489
57,5
001,
417
44,8
8757
,500
781
637
44.9
2
Traf
ford
30,2
0653
,500
565
19,9
2653
,500
372
192
34.0
3
Wak
efiel
d56
,784
76,4
0074
331
,524
76,4
0041
333
144
.48
51
Appendix 1
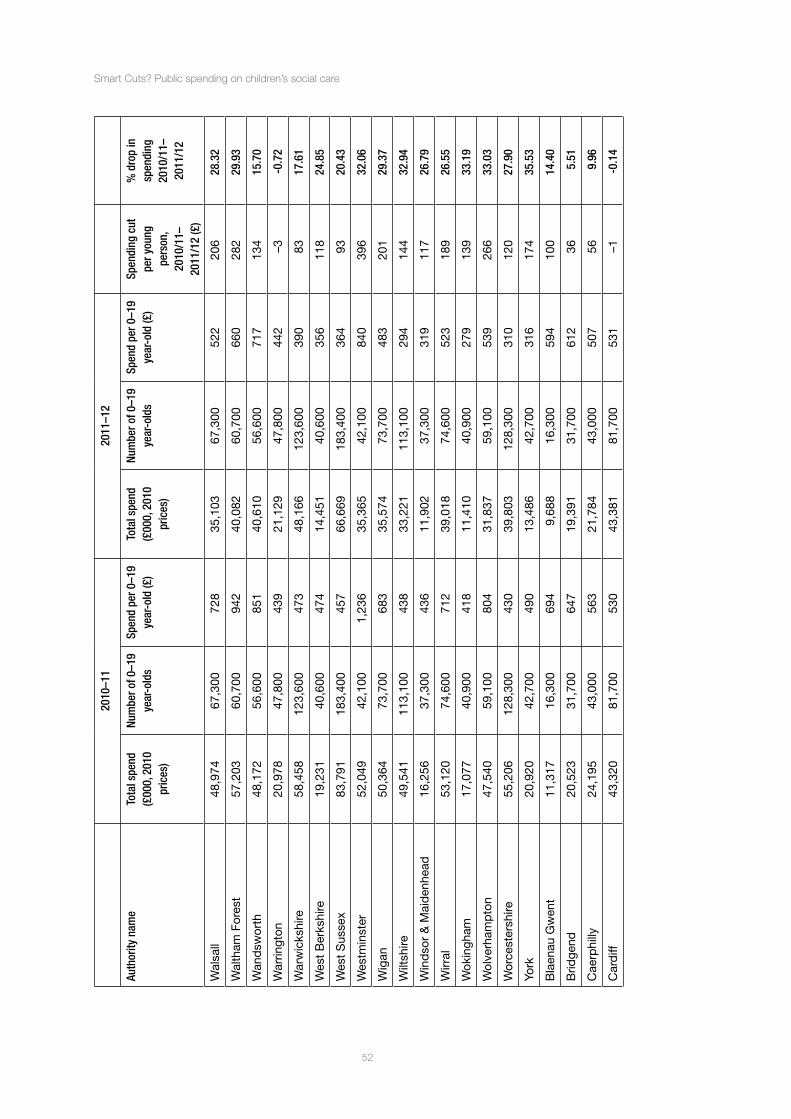
2010
–11
2011
–12
Auth
ority
nam
eTo
tal s
pend
(£
000,
201
0 pr
ices
)
Num
ber o
f 0–1
9 ye
ar-o
lds
Spen
d pe
r 0–1
9 ye
ar-o
ld (£
)To
tal s
pend
(£
000,
201
0 pr
ices
)
Num
ber o
f 0–1
9 ye
ar-o
lds
Spen
d pe
r 0–1
9 ye
ar-o
ld (£
)Sp
endi
ng c
ut
per y
oung
pe
rson
, 20
10/1
1–20
11/1
2 (£
)
% d
rop
in
spen
ding
20
10/1
1–
2011
/12
Wal
sall
48,9
7467
,300
728
35,1
0367
,300
522
206
28.3
2
Wal
tham
For
est
57,2
0360
,700
942
40,0
8260
,700
660
282
29.9
3
Wan
dsw
orth
48,1
7256
,600
851
40,6
1056
,600
717
134
15.7
0
War
ringt
on20
,978
47,8
0043
921
,129
47,8
0044
2–3
-0.7
2
War
wic
kshi
re58
,458
123,
600
473
48,1
6612
3,60
039
083
17.6
1
Wes
t B
erks
hire
19,2
3140
,600
474
14,4
5140
,600
356
118
24.8
5
Wes
t S
usse
x83
,791
183,
400
457
66,6
6918
3,40
036
493
20.4
3
Wes
tmin
ster
52,0
4942
,100
1,23
635
,365
42,1
0084
039
632
.06
Wig
an50
,364
73,7
0068
335
,574
73,7
0048
320
129
.37
Wilt
shire
49,5
4111
3,10
043
833
,221
113,
100
294
144
32.9
4
Win
dso
r &
Mai
den
head
16,2
5637
,300
436
11,9
0237
,300
319
117
26.7
9
Wirr
al53
,120
74,6
0071
239
,018
74,6
0052
318
926
.55
Wok
ingh
am17
,077
40,9
0041
811
,410
40,9
0027
913
933
.19
Wol
verh
amp
ton
47,5
4059
,100
804
31,8
3759
,100
539
266
33.0
3
Wor
cest
ersh
ire55
,206
128,
300
430
39,8
0312
8,30
031
012
027
.90
York
20,9
2042
,700
490
13,4
8642
,700
316
174
35.5
3
Bla
enau
Gw
ent
11,3
1716
,300
694
9,68
816
,300
594
100
14.4
0
Brid
gend
20,5
2331
,700
647
19,3
9131
,700
612
365.
51
Cae
rphi
lly24
,195
43,0
0056
321
,784
43,0
0050
756
9.96
Car
diff
43,3
2081
,700
530
43,3
8181
,700
531
–1-0
.14
52
Smart Cuts? Public spending on children’s social care

2010
–11
2011
–12
Auth
ority
nam
eTo
tal s
pend
(£
000,
201
0 pr
ices
)
Num
ber o
f 0–1
9 ye
ar-o
lds
Spen
d pe
r 0–1
9 ye
ar-o
ld (£
)To
tal s
pend
(£
000,
201
0 pr
ices
)
Num
ber o
f 0–1
9 ye
ar-o
lds
Spen
d pe
r 0–1
9 ye
ar-o
ld (£
)Sp
endi
ng c
ut
per y
oung
pe
rson
, 20
10/1
1–20
11/1
2 (£
)
% d
rop
in
spen
ding
20
10/1
1–
2011
/12
Car
mar
then
shire
18,5
4441
,400
448
18,8
8041
,400
456
–8–1
.81
Cer
edig
ion
8,09
316
,900
479
8,18
416
,900
484
–5–1
.13
Con
wy
13,5
8224
,400
557
13,1
1924
,400
538
193.
41
Den
big
hshi
re12
,077
22,3
0054
211
,641
22,3
0052
220
3.61
Flin
tshi
re15
,506
35,4
0043
814
,347
35,4
0040
533
7.48
Gw
yned
d15
,850
28,1
0056
415
,566
28,1
0055
410
1.79
Isle
of A
ngle
sey
7,55
815
,700
481
5,92
015
,700
377
104
21.6
8
Mer
thyr
Tyd
fil9,
420
13,6
0069
310
,091
13,6
0074
2–4
9–7
.12
Mon
mou
thsh
ire7,
630
20,6
0037
06,
289
20,6
0030
565
17.5
8
Nea
th P
ort
Talb
ot21
,954
31,7
0069
322
,418
31,7
0070
7–1
5–2
.11
New
por
t21
,019
36,7
0057
320
,653
36,7
0056
310
1.74
Pem
bro
kesh
ire14
,251
27,7
0051
413
,587
27,7
0049
124
4.66
Pow
ys18
,703
29,1
0064
317
,367
29,1
0059
746
7.14
Rho
ndd
a C
ynon
Taf
f39
,211
56,6
0069
341
,096
56,6
0072
6–3
3–4
.81
Sw
anse
a36
,152
53,1
0068
137
,508
53,1
0070
6–2
6–3
.75
Torf
aen
13,6
9522
,000
623
13,8
0322
,000
627
–5-0
.79
Vale
of G
lam
orga
n14
,958
30,8
0048
614
,533
30,8
0047
214
2.84
Wre
xham
14,9
5931
,300
478
15,3
7331
,300
491
–13
–2.7
7
53
Appendix 1

2010
–11
2011
–12
Auth
ority
nam
eTo
tal s
pend
(£
000,
201
0 pr
ices
)
Num
ber o
f 0–1
9 ye
ar-o
lds
Spen
d pe
r 0–1
9 ye
ar-o
ld (£
)To
tal s
pend
(£
000,
201
0 pr
ices
)
Num
ber o
f 0–1
9 ye
ar-o
lds
Spen
d pe
r 0–1
9 ye
ar-o
ld (£
)Sp
endi
ng c
ut
per y
oung
pe
rson
, 20
10/1
1–20
11/1
2 (£
)
% d
rop
in
spen
ding
20
10/1
1–
2011
/12
Tota
l Eng
land
7,73
4,70
912
,419
,300
623
5,88
2,50
312
,419
,300
474
149.
1423
.95
Tota
l Wal
es40
2,51
671
0,10
056
739
4,61
971
0,10
055
611
.12
1.96
Tota
ls (E
ngla
nd a
nd W
ales
)8,
137,
226
13,1
29,4
0062
06,
277,
121
13,1
29,4
0047
814
1.67
22.8
6
54
Smart Cuts? Public spending on children’s social care

